Study of Morpho-Geometric Variables to Improve the Diagnosis in Keratoconus with Mild Visual Limitation

 ,
,  , ,
, ,
Abstract
:1. Introduction
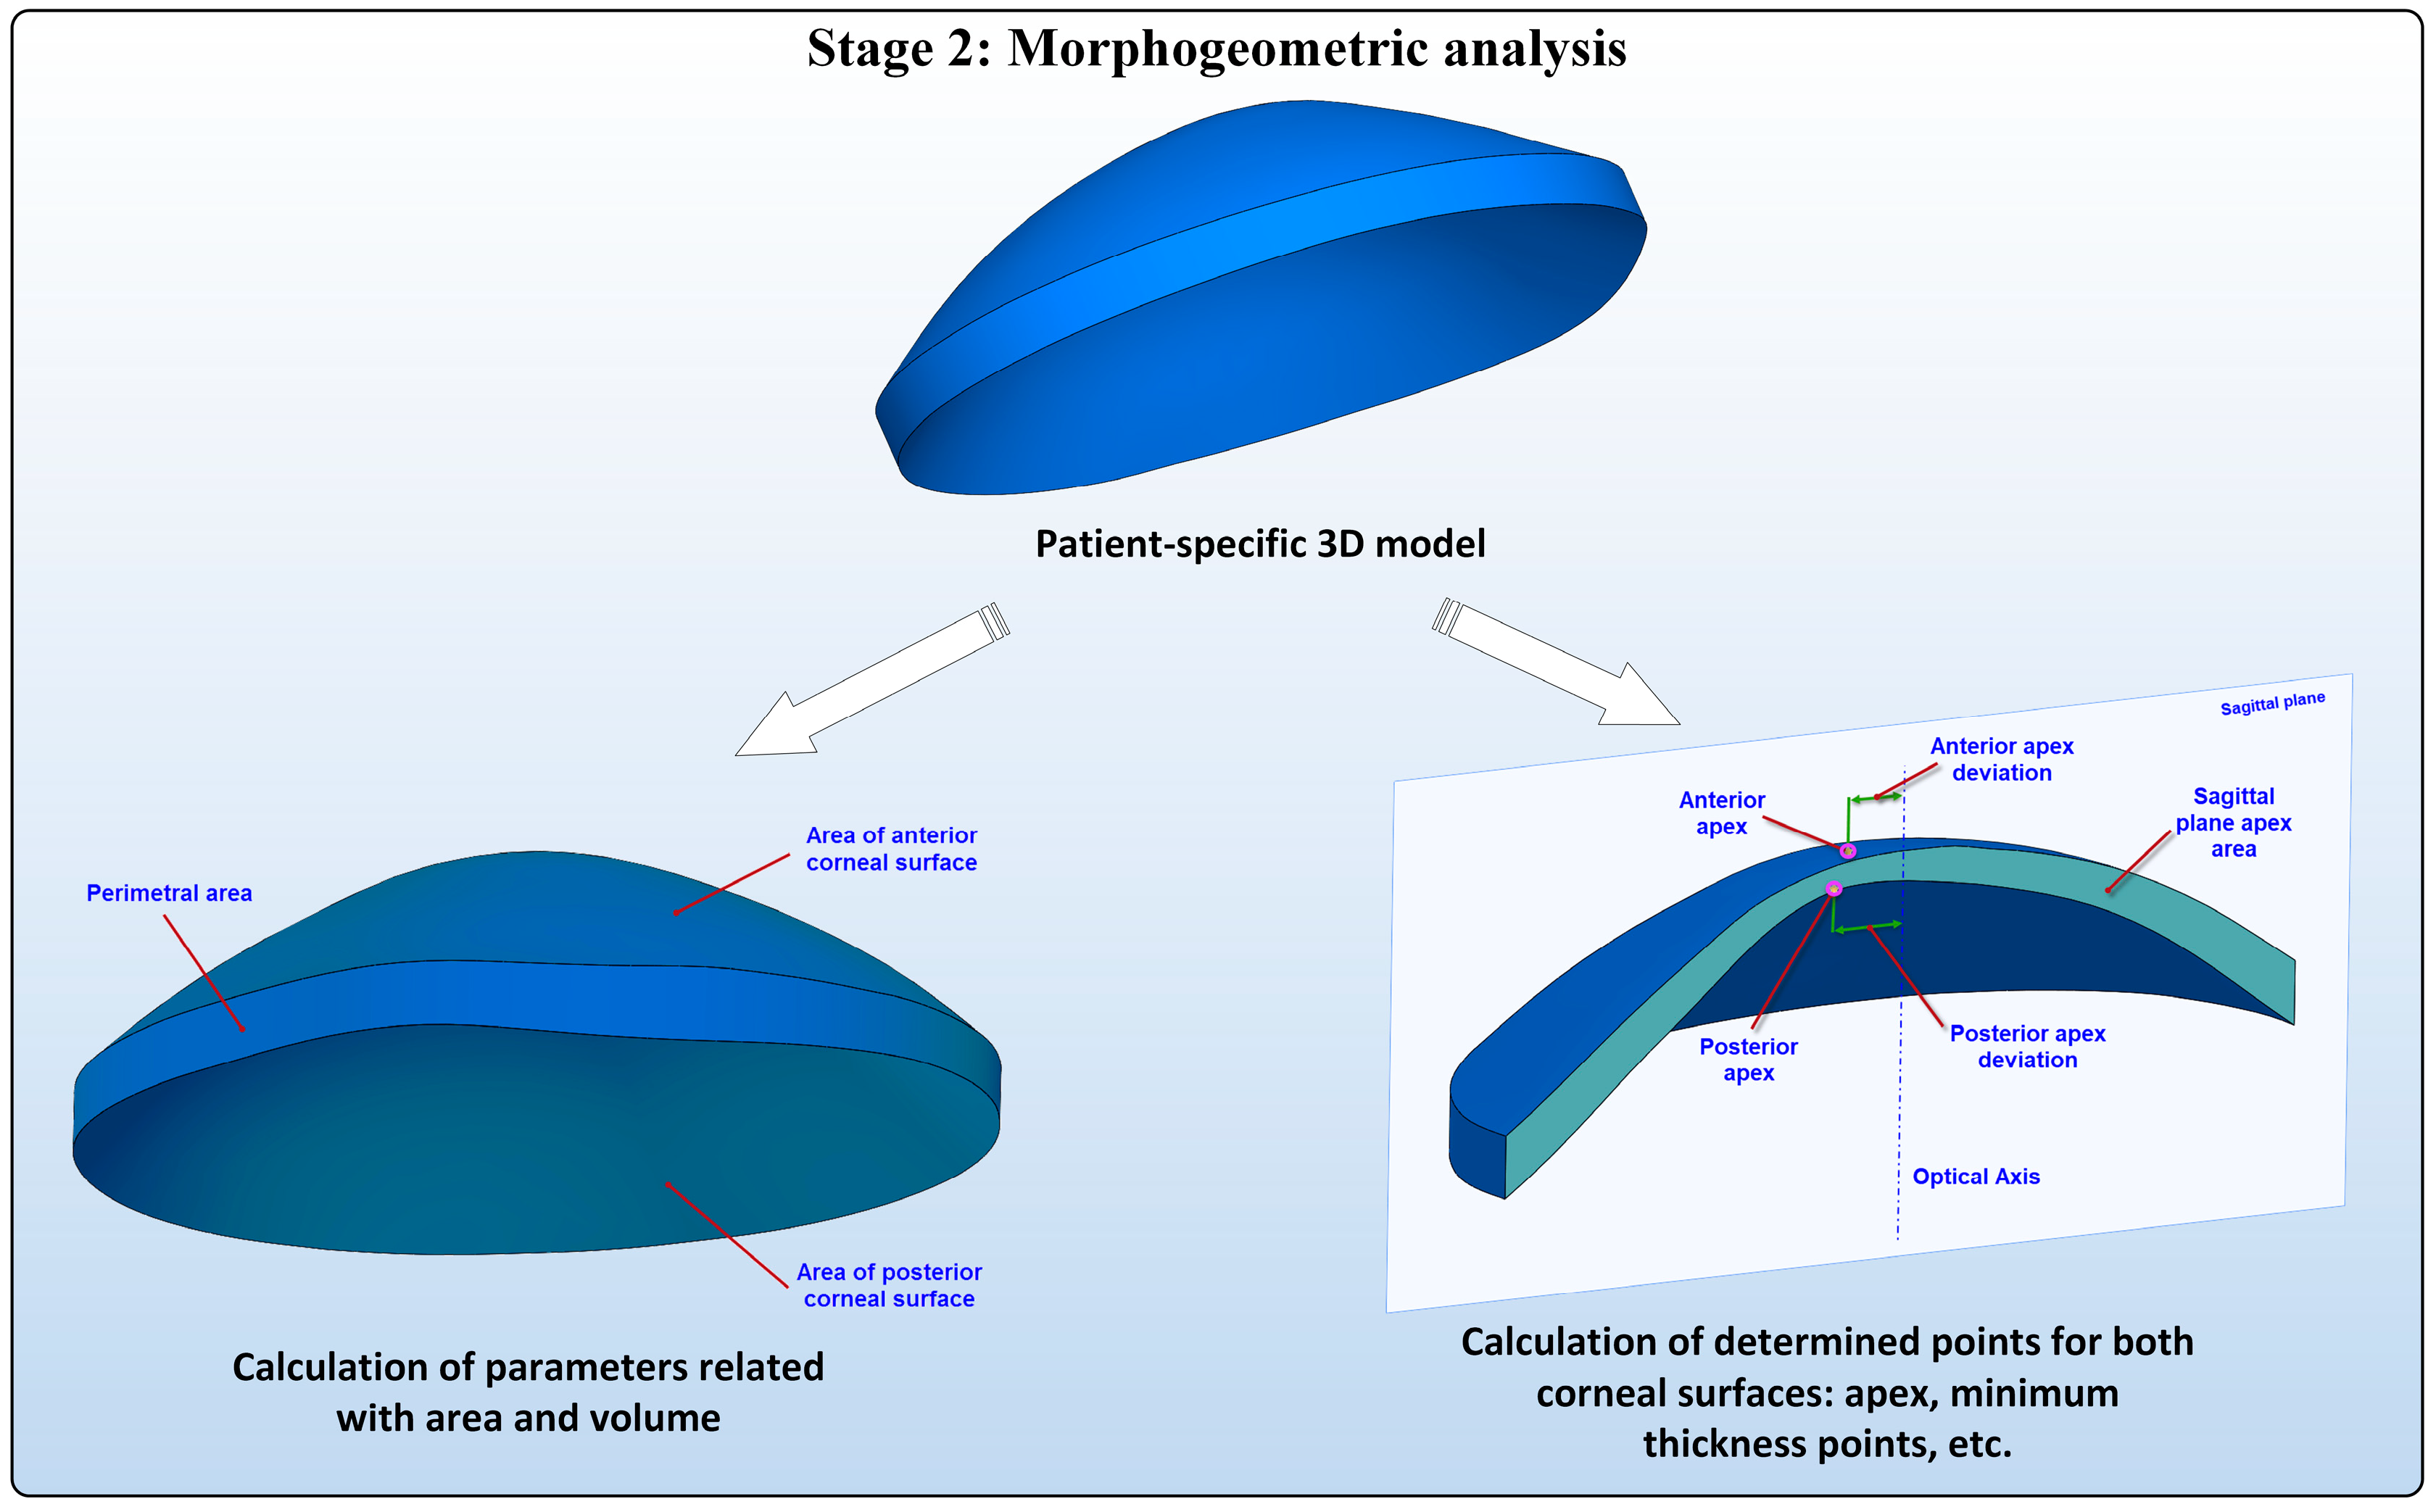
- a geometric decompensation or progressive distortion of the corneal curvature from a singular point denominated the corneal apex.
- a decompensation of the spatial profile of pachymetry, which is described as an annular increase/decrease of its thickness from a singular point called the minimum thickness point.
2. Patients and Methods
2.1. Patients
2.2. Ophthalmological Examination
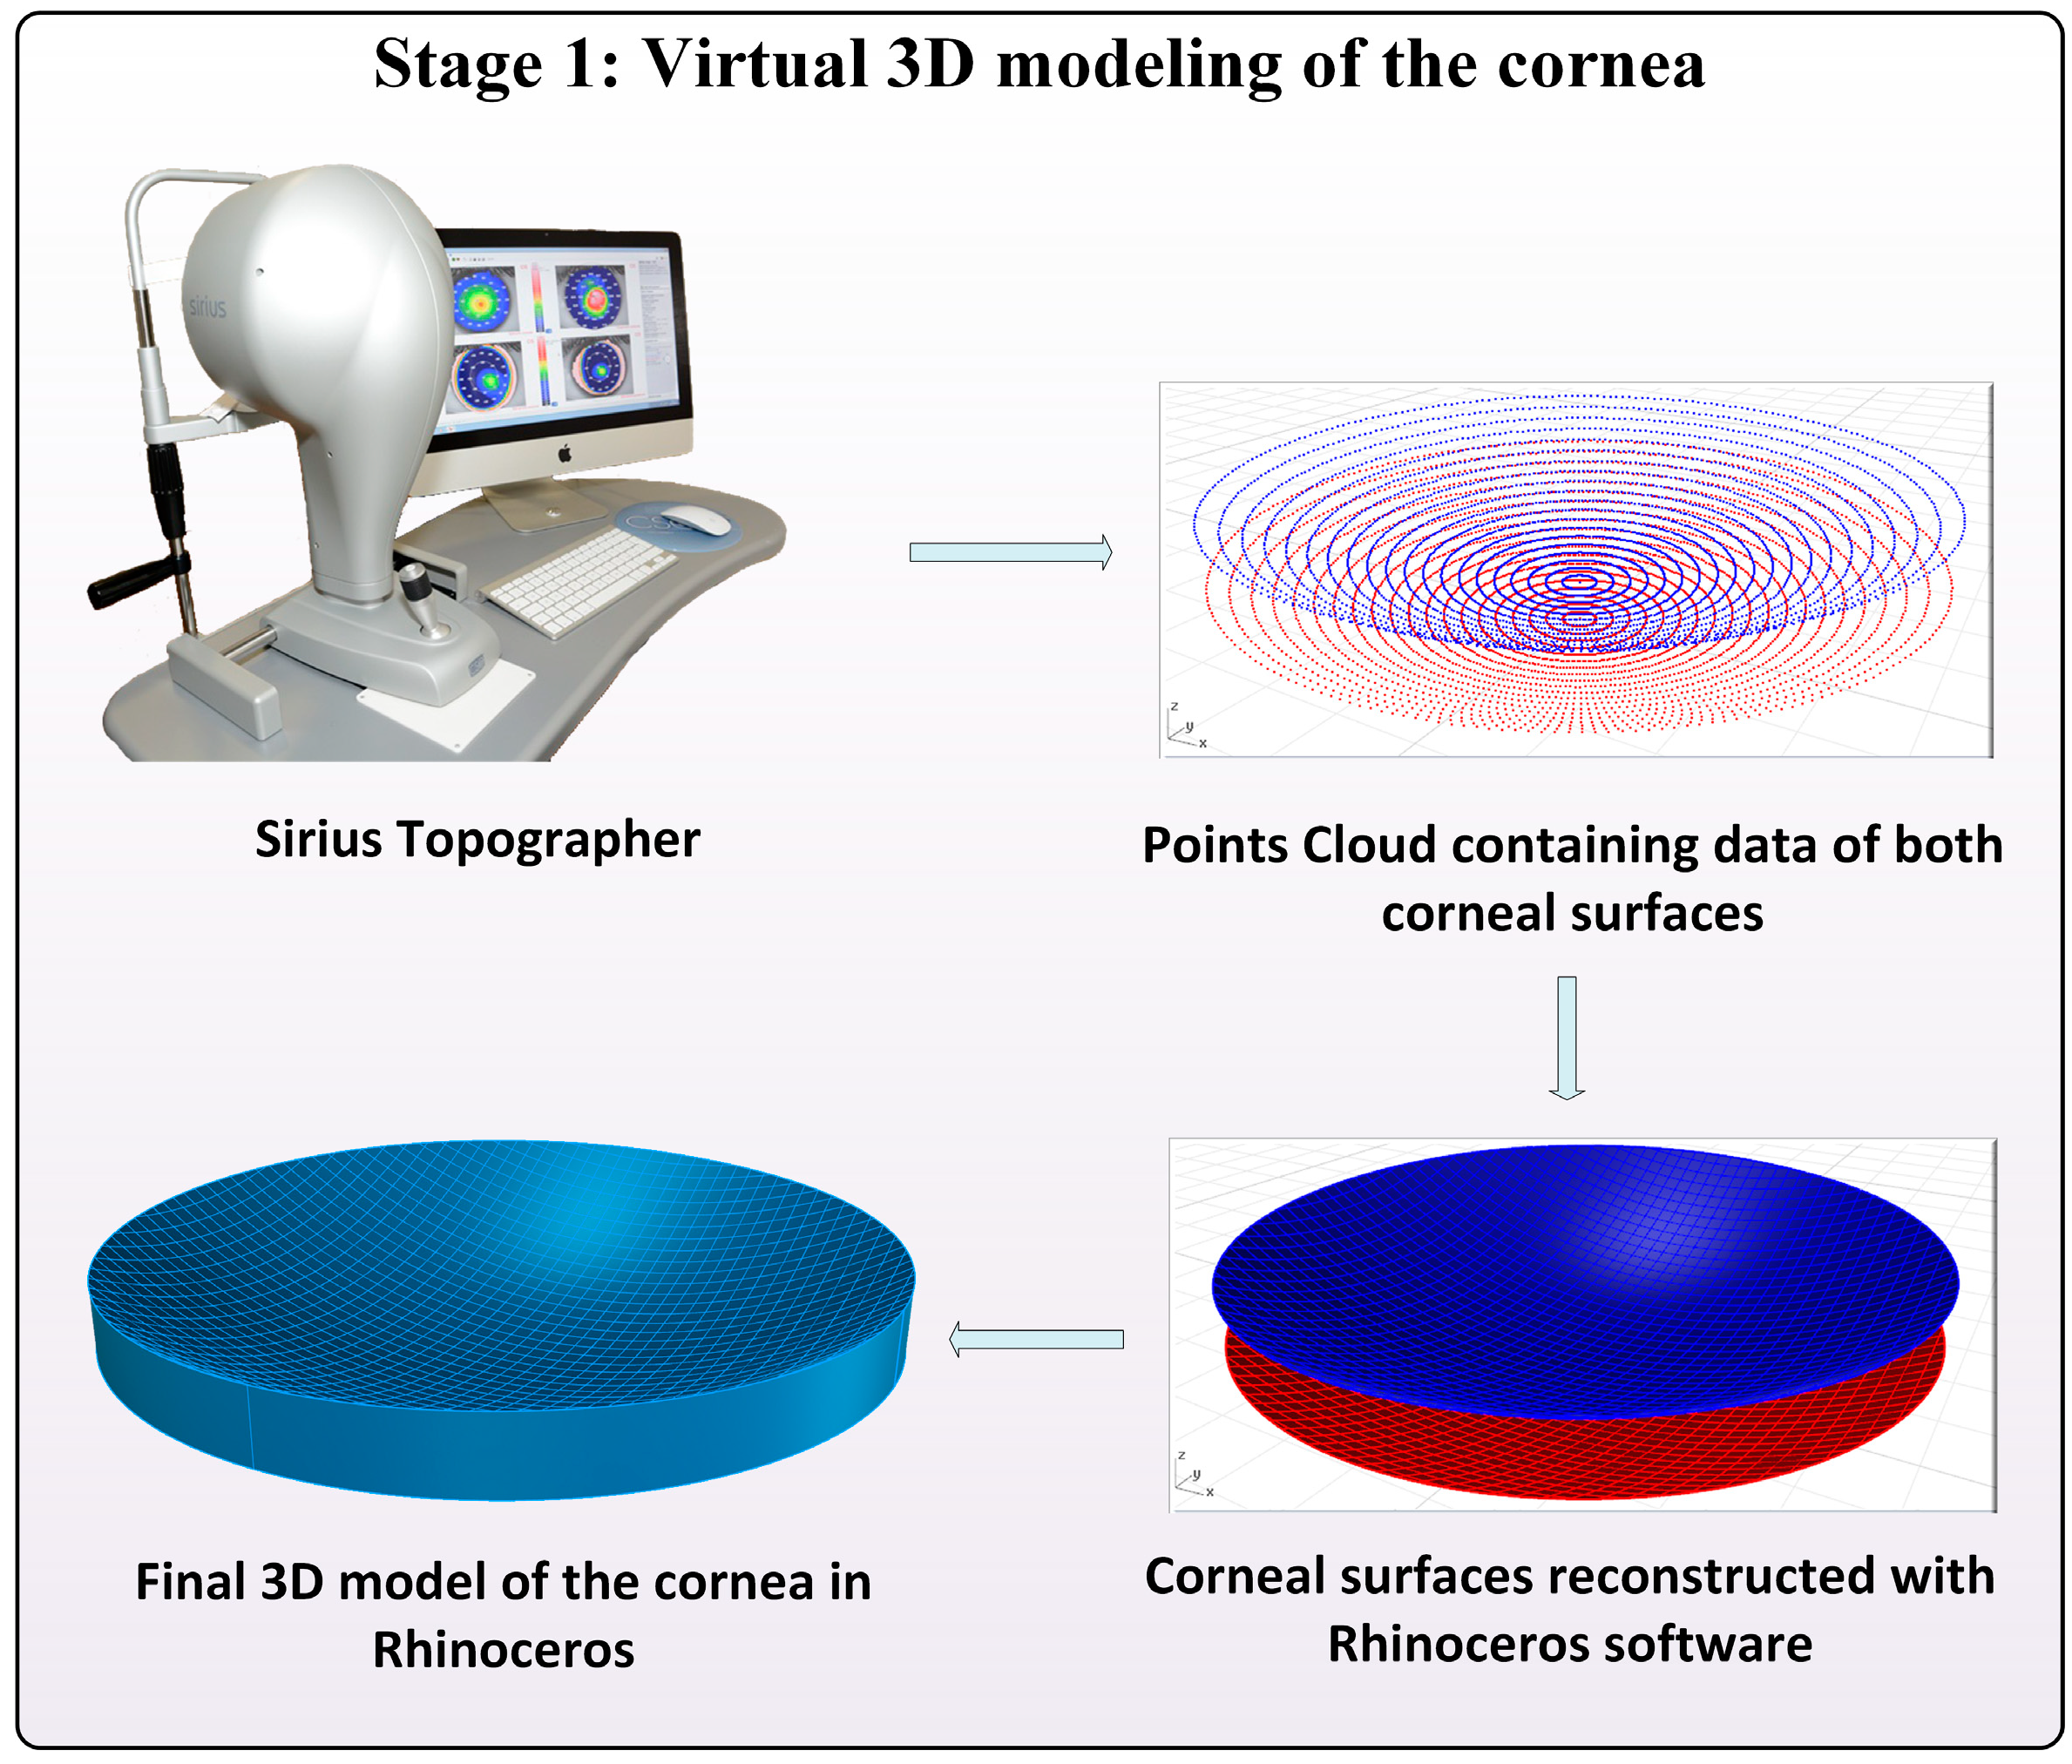
2.3. Morpho-Geometric Reconstruction of the Cornea
2.3.1. Acquisition of the Point Clouds
2.3.2. Geometric Reconstruction of Corneal Surfaces
2.3.3. Generation of the Solid Model of the Cornea
2.4. Characterization of the Cornea
2.5. Statistical Analysis
3. Results
4. Discussion
Author Contributions
Funding
Conflicts of Interest
References
- DelMonte, D.W.; Kim, T. Anatomy and physiology of the cornea. J. Cataract Refract. Surg. 2011, 37, 588–598. [Google Scholar] [CrossRef] [PubMed]
- Tong, J.; Bhimji, S.S. Anatomy, Head, Face, Eye, Muscles, Orbicularis Oculi; StatPearls Publishing LLC.: Treasure Island, FL, USA, 2018. [Google Scholar]
- Maharana, P.K.; Dubey, A.; Jhanji, V.; Sharma, N.; Das, S.; Vajpayee, R.B. Management of advanced corneal ectasias. Br. J. Ophthalmol. 2016, 100, 34–40. [Google Scholar] [CrossRef] [PubMed]
- Li, X.; Yang, H.; Rabinowitz, Y.S. Keratoconus: Classification scheme based on videokeratography and clinical signs. J. Cataract Refract. Surg. 2009, 35, 1597–1603. [Google Scholar] [CrossRef] [PubMed] [Green Version]
- Roberts, C.J.; Dupps, W.J., Jr. Biomechanics of corneal ectasia and biomechanical treatments. J. Cataract. Refract. Surg. 2014, 40, 991–998. [Google Scholar] [CrossRef] [PubMed] [Green Version]
- Duncan, J.K.; Belin, M.W.; Borgstrom, M. Assessing progression of keratoconus: Novel tomographic determinants. Eye Vis. 2016, 3, 6. [Google Scholar] [CrossRef] [PubMed]
- Rabinowitz, Y.S. Keratoconus. Surv. Ophthalmol. 1998, 42, 297–319. [Google Scholar] [CrossRef]
- Alió, J.L.; Vega-Estrada, A.; Sanz-Díez, P.; Peña-García, P.; Durán-García, M.L.; Maldonado, M. Keratoconus management guidelines. Int. J. Keratoconus Ectatic Corneal Dis. 2015, 4, 1–39. [Google Scholar] [CrossRef]
- Pinero, D.P.; Nieto, J.C.; Lopez-Miguel, A. Characterization of corneal structure in keratoconus. J. Cataract Refract. Surg. 2012, 38, 2167–2183. [Google Scholar] [CrossRef] [PubMed] [Green Version]
- Arbelaez, M.C.; Versaci, F.; Vestri, G.; Barboni, P.; Savini, G. Use of a support vector machine for keratoconus and subclinical keratoconus detection by topographic and tomographic data. Ophthalmology 2012, 119, 2231–2238. [Google Scholar] [CrossRef] [PubMed]
- Alio, J.L.; Pinero, D.P.; Aleson, A.; Teus, M.A.; Barraquer, R.I.; Murta, J.; Maldonado, M.J.; Castro de Luna, G.; Gutierrez, R.; Villa, C.; et al. Keratoconus-integrated characterization considering anterior corneal aberrations, internal astigmatism, and corneal biomechanics. J. Cataract Refract. Surg. 2011, 37, 552–568. [Google Scholar] [CrossRef] [PubMed]
- Cavas-Martinez, F.; Fernandez-Pacheco, D.G.; De la Cruz-Sanchez, E.; Nieto Martinez, J.; Fernandez Canavate, F.J.; Vega-Estrada, A.; Plaza-Puche, A.B.; Alio, J.L. Geometrical custom modeling of human cornea in vivo and its use for the diagnosis of corneal ectasia. PLoS ONE 2014, 9, e110249. [Google Scholar] [CrossRef] [PubMed]
- Ramos-Lopez, D.; Martinez-Finkelshtein, A.; Castro-Luna, G.M.; Pinero, D.; Alio, J.L. Placido-based indices of corneal irregularity. Optom. Vis. Sci. 2011, 88, 1220–1231. [Google Scholar] [CrossRef] [PubMed]
- Piegl, L.; Tiller, W. The Nurbs Book; Government Printing Office: New York, NY, USA, 1997. [Google Scholar]
- Cazon-Martin, A.; Matey-Muñoz, L.; Rodriguez-Ferradas, M.; Morer-Camo, P.; Gonzalez-Zuazo, I. Direct digital manufacturing for sports and medical sciences: Three practical cases. Dyna 2015, 90, 621–627. [Google Scholar]
- Chakroun, F.; Colombo, V.; Lie Sam Foek, D.; Gallo, L.M.; Feilzer, A.; Ozcan, M. Displacement of teeth without and with bonded fixed orthodontic retainers: 3d analysis using triangular target frames and optoelectronic motion tracking device. J. Mech. Behav. Biomed. Mater. 2018, 85, 175–180. [Google Scholar] [CrossRef] [PubMed]
- Minatel, L.; Verri, F.R.; Kudo, G.A.H.; de Faria Almeida, D.A.; de Souza Batista, V.E.; Lemos, C.A.A.; Pellizzer, E.P.; Santiago, J.F.J. Effect of different types of prosthetic platforms on stress-distribution in dental implant-supported prostheses. Mater. Sci. Eng. C Mater. Biol. Appl. 2017, 71, 35–42. [Google Scholar] [CrossRef] [PubMed]
- Xu, F.; Morganti, S.; Zakerzadeh, R.; Kamensky, D.; Auricchio, F.; Reali, A.; Hughes, T.J.R.; Sacks, M.S.; Hsu, M.C. A framework for designing patient-specific bioprosthetic heart valves using immersogeometric fluid-structure interaction analysis. Int. J. Numer. Methods Biomed. Eng. 2018, 34, e2938. [Google Scholar] [CrossRef] [PubMed]
- Robins, M.; Solomon, J.; Samei, E. Can a 3d task transfer function accurately represent the signal transfer properties of low-contrast lesions in non-linear CT systems? In Medical Imaging 2018: Physics of Medical Imaging; SPIE: Houston, TX, USA, 2018; p. 9. [Google Scholar]
- Lanchares, E.; Del Buey, M.A.; Cristobal, J.A.; Calvo, B.; Ascaso, F.J.; Malve, M. Computational simulation of scleral buckling surgery for rhegmatogenous retinal detachment: On the effect of the band size on the myopization. J. Ophthalmol. 2016, 2016, 3578617. [Google Scholar] [CrossRef] [PubMed]
- Cavas-Martínez, F.; Bataille, L.; Fernández-Pacheco, D.G.; Cañavate, F.J.F.; Alio, J.L. Keratoconus detection based on a new corneal volumetric analysis. Sci. Rep. 2017, 7, 15837. [Google Scholar] [CrossRef] [PubMed]
- Giovanzana, S.; Kasprzak, H.T.; Pałucki, B.; Ţălu, Ş. Non-rotational aspherical models of the human optical system. J. Mod. Opt. 2013, 60, 1898–1904. [Google Scholar] [CrossRef]
- Xie, W. Recent advances in laser in situ keratomileusis-associated dry eye. Clin. Exp. Optom. 2016, 99, 107–112. [Google Scholar] [CrossRef] [PubMed]
- Anderson, K.; El-Sheikh, A.; Newson, T. Application of structural analysis to the mechanical behaviour of the cornea. J. R. Soc. Interface 2004, 1, 3–15. [Google Scholar] [CrossRef] [PubMed] [Green Version]
- Gefen, A.; Shalom, R.; Elad, D.; Mandel, Y. Biomechanical analysis of the keratoconic cornea. J. Mech. Behav. Biomed. Mater. 2009, 2, 224–236. [Google Scholar] [CrossRef] [PubMed]
- Cavas-Martínez, F.; Bataille, L.; Fernández-Pacheco, D.G.; Cañavate, F.J.F.; Alió, J.L. A new approach to keratoconus detection based on corneal morphogeometric analysis. PLoS ONE 2017, 12, e0184569. [Google Scholar] [CrossRef] [PubMed]
- Carvalho, L.A.; Prado, M.; Cunha, R.H.; Costa Neto, A.; Paranhos, A., Jr.; Schor, P.; Chamon, W. Keratoconus prediction using a finite element model of the cornea with local biomechanical properties. Arq. Bras. Oftalmol. 2009, 72, 139–145. [Google Scholar] [CrossRef] [PubMed] [Green Version]
- Pandolfi, A.; Manganiello, F. A model for the human cornea: Constitutive formulation and numerical analysis. Biomech. Model. Mechanobiol. 2006, 5, 237–246. [Google Scholar] [CrossRef] [PubMed]
- Sinha Roy, A.; Dupps, W.J., Jr. Patient-specific computational modeling of keratoconus progression and differential responses to collagen cross-linking. Investig. Opthalmol. Vis. Sci. 2011, 52, 9174–9187. [Google Scholar] [CrossRef] [PubMed]
- Klyce, S.D.; Karon, M.D.; Smolek, M.K. Advantages and disadvantages of the zernike expansion for representing wave aberration of the normal and aberrated eye. J. Refract. Surg. 2004, 20, S537–S541. [Google Scholar] [PubMed]
- Smolek, M.K.; Klyce, S.D. Goodness-of-prediction of zernike polynomial fitting to corneal surfaces. J. Cataract Refract. Surg. 2005, 31, 2350–2355. [Google Scholar] [CrossRef] [PubMed]
- Iskander, D.R.; Collins, M.J.; Davis, B. Optimal modeling of corneal surfaces with zernike polynomials. IEEE Trans. Biomed. Eng. 2001, 48, 87–95. [Google Scholar] [CrossRef] [PubMed] [Green Version]
- Kamiya, K.; Shimizu, K.; Igarashi, A.; Miyake, T. Assessment of anterior, posterior, and total central corneal astigmatism in eyes with keratoconus. Am. J. Ophthalmol. 2015, 160, 851–857. [Google Scholar] [CrossRef] [PubMed]
- Belin, M.W.; Kim, J.T.; Zloty, P.; Ambrosio, R.J. Simplified nomenclature for describing keratoconu. Int. J. Keratoconus Ectatic Corneal Dis. 2012, 1, 31–35. [Google Scholar] [CrossRef]
- Hernandez-Camarena, J.C.; Chirinos-Saldana, P.; Navas, A.; Ramirez-Miranda, A.; de la Mota, A.; Jimenez-Corona, A.; Graue-Hernindez, E.O. Repeatability, reproducibility, and agreement between three different scheimpflug systems in measuring corneal and anterior segment biometry. J. Refract. Surg. 2014, 30, 616–621. [Google Scholar] [CrossRef] [PubMed]
- Tomidokoro, A.; Oshika, T.; Amano, S.; Higaki, S.; Maeda, N.; Miyata, K. Changes in anterior and posterior corneal curvatures in keratoconus. Ophthalmology 2000, 107, 1328–1332. [Google Scholar] [CrossRef]
- Bayraktar Bilen, N.; Hepsen, I.F.; Arce, C.G. Correlation between visual function and refractive, topographic, pachymetric and aberrometric data in eyes with keratoconus. Int. J. Ophthalmol. 2016, 9, 1127–1133. [Google Scholar] [PubMed]
- Montalban, R.; Alio, J.L.; Javaloy, J.; Pinero, D.P. Correlation of anterior and posterior corneal shape in keratoconus. Cornea 2013, 32, 916–921. [Google Scholar] [CrossRef] [PubMed]
- Lopes, B.T.; Ramos, I.C.; Faria-Correia, F.; Luz, A.; de Freitas Valbon, B.; Belin, M.W.; Ambrósio, R.J. Correlation of topometric and tomographic indices with visual acuity in patients with keratoconus. Int. J. Keratoconus Ectatic Corneal Dis. 2012, 1, 167–172. [Google Scholar] [CrossRef]
- Piñero, D.P.; Alió, J.L.; Aleson, A.; Escaf Vergara, M.; Miranda, M. Corneal volume, pachymetry, and correlation of anterior and posterior corneal shape in subclinical and different stages of clinical keratoconus. J. Cataract Refract. Surg. 2010, 36, 814–825. [Google Scholar] [CrossRef] [PubMed]
- Prakash, G.; Suhail, M.; Srivastava, D. Predictive analysis between topographic, pachymetric and wavefront parameters in keratoconus, suspects and normal eyes: Creating unified equations to evaluate keratoconus. Curr. Eye Res. 2016, 41, 334–342. [Google Scholar] [CrossRef] [PubMed]
- Mannion, L.S.; Tromans, C.; O’Donnell, C. Reduction in corneal volume with severity of keratoconus. Curr. Eye Res. 2011, 36, 522–527. [Google Scholar] [CrossRef] [PubMed]


| Morpho-Geometric Variable | Acronym | Description |
|---|---|---|
| Corneal volume (mm3) | CV | Volume defined by the solid model generated |
| Anterior/Posterior corneal surface area (mm2) | Aant/Apost | Area of the exterior/interior surface |
| Corneal surface area (mm2) | Atot | Total area defined by the solid model generated |
| Posterior sagittal plane apex area (mm2) | Apostapex | Area of the cornea within the sagittal plane passing through the optical axis and the apex of the posterior corneal surface |
| Anterior/Posterior apex deviation (mm) | Dantapex/Dpostapex | Distance from the optical axis to the apex of the anterior/posterior corneal surfaces |
| Sagittal plane area at minimum thickness point (mm2) | Apostmct | Area of the cornea within the sagittal plane passing through the optical axis and the minimum thickness point of the posterior corneal surface |
| Anterior/Posterior minimum thickness point deviation (mm) | Dantmct/Dpostmct | Distance in the XY plane from the optical axis to the minimum thickness points of the anterior/posterior corneal surfaces |
| Center of mass X, Y, Z (mm) | CMx/CMy/CMz | Center of mass coordinates X, Y, Z of the solid |
| Measurement | Normal Group n = 122 | Keratoconus Group with Mild Visual Limitation n = 80 | |
|---|---|---|---|
| Mean (SD) Median (Range) | Mean (SD) Median (Range) | p Value | |
| CV (mm3) | 25.70 (1.49) 25.70 (22.99 to 29.50) | 23.60 (2.28) 23.31 (16.95 to 27.74) | <0.001 |
| Aant (mm2) | 43.08 (0.14) 43.08 (43.06 to 43.11) | 43.39 (0.35) 43.26 (42.85 to 44.36) | <0.001 |
| Apost (mm2) | 44.24 (0.27) 44.25 (44.19 to 44.28) | 44.70 (0.56) 44.57 (43.64 to 46.36) | <0.001 |
| Atot (mm2) | 103.87 (1.14) 103.78 (100.73 to 106.01) | 103.61 (1.62) 103.70 (99.97 to 106.51) | 0.205 |
| Apostapex (mm²) | 4.31 (0.25) 4.30 (4.27 to 4.36) | 3.91 (0.37) 3.82 (3.00 to 4.66) | <0.001 |
| Apostmct (mm2) | 4.30 (0.25) 4.29 (4.26 to 4.35) | 3.89 (0.39) 3.81 (3.80 to 3.98) | <0.001 |
| Dantapex (mm) | 0.00 (0.00) 0.00 (0.00 to 0.00) | 0.01 (0.02) 0.00 (0.00 to 0.07) | <0.001 |
| Dpostapex (mm) | 0.06 (0.02) 0.06 (0.06 to 0.07) | 0.19 (0.10) 0.18 (0.02 to 0.45) | <0.001 |
| CMx (mm) | 0.02 (0.04) 0.03 (0.02 to 0.04) | 0.01 (0.05) 0.02 (−0.09 to 0.12) | 0.073 |
| CMy (mm) | 0.03 (0.01) 0.03 (0.00 to 0.08) | 0.02 (0.04) 0.02 (−0.09 to 0.28) | <0.001 |
| CMz (mm) | 0.77 (0.02) 0.77 (0.76 to 0.78) | 0.78 (0.04) 0.78 (0.71 to 0.90) | 0.006 |
| Dantmct (mm) | 0.84 (0.23) 0.83 (0.80 to 0.88) | 1.11 (0.48) 1.05 (0.33 to 3.11) | < 0.001 |
| Dpostmct (mm) | 0.77 (0.21) 0.76 (0.73 to 0.81) | 1.04 (0.45) 0.99 (0.28 to 2.94) | <0.001 |
| Keratoconus Group with Mild Visual Limitation (n = 80) | ||
|---|---|---|
| Measurement Correlation | Correlation Coefficient | p Value |
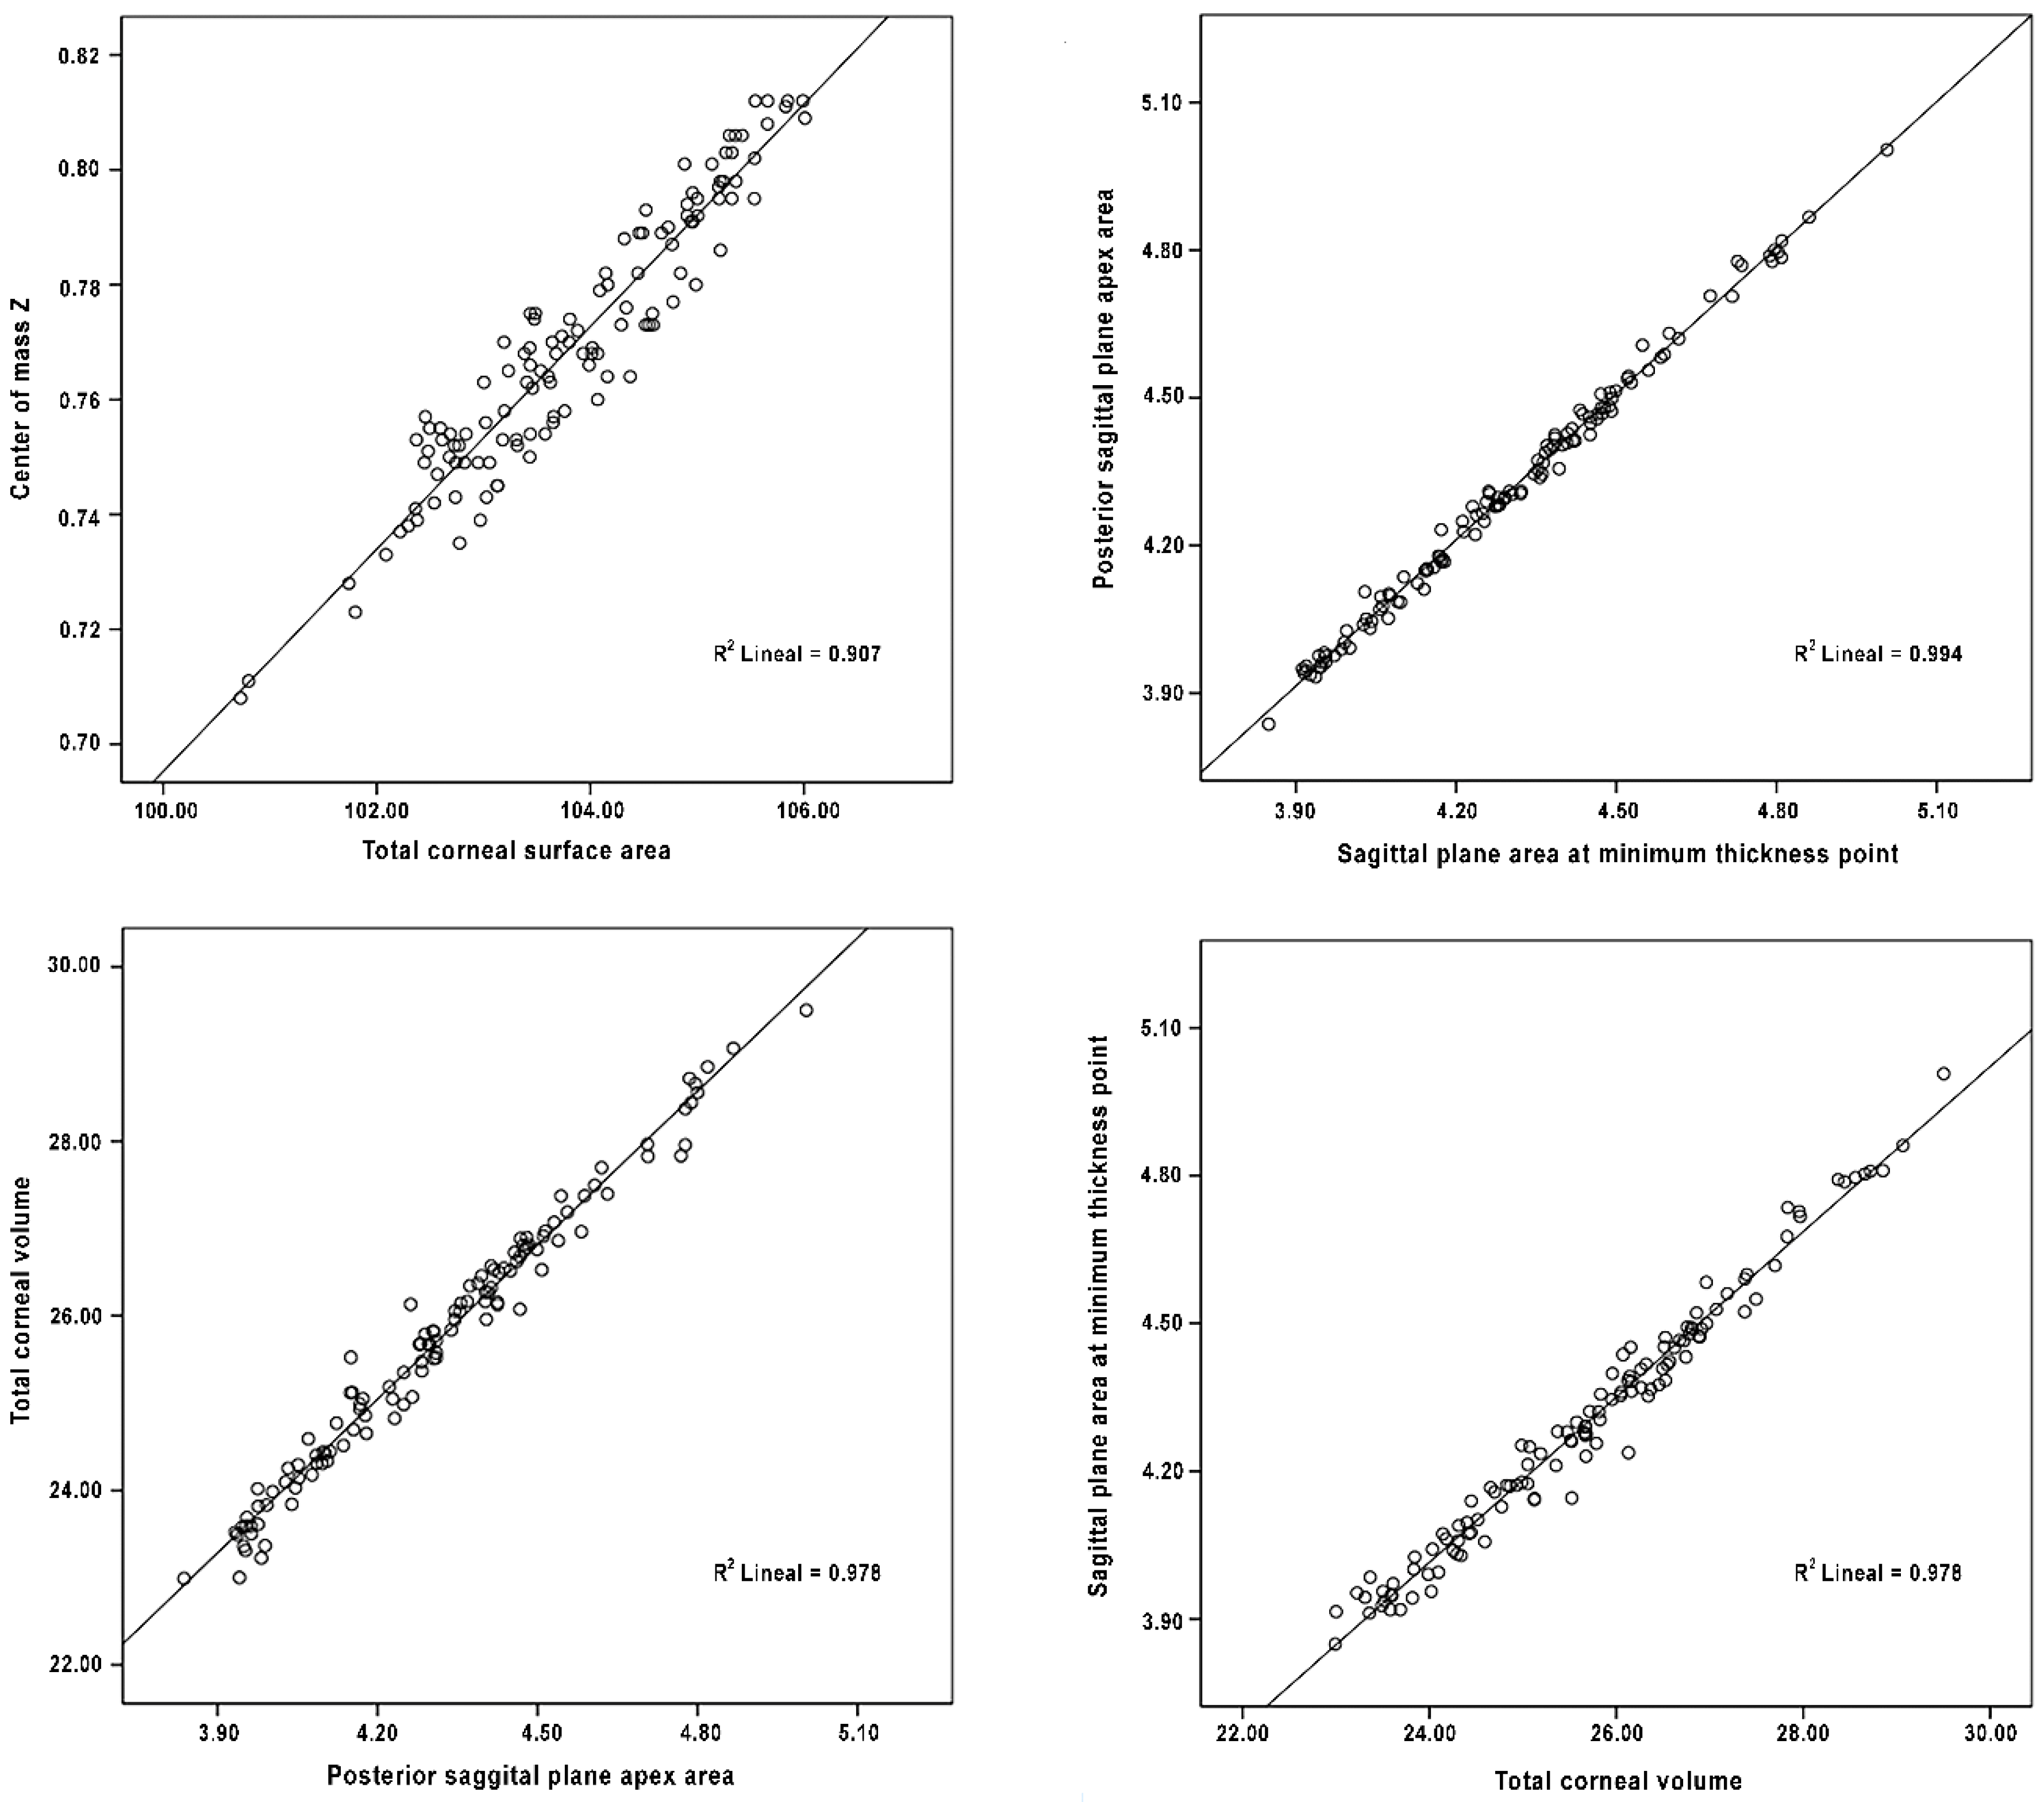
| Apostapex/CV | 0.969 | 0.000 |
| Aant/Apost | 0.853 | 0.000 |
| CV/Atot | 0.699 | 0.000 |
| Aant/CMz | 0.627 | 0.000 |
| Apost/CMz | 0.766 | 0.000 |
| Atot/CMz | 0.816 | 0.000 |
| Apostapex/Apostmct | 0.989 | 0.000 |
| CV/Apostmct | 0.978 | 0.000 |
| Dantmct/Dpostmct | 0.996 | 0.000 |
| Normal Group (n = 122) | ||
|---|---|---|
| Measurement Correlation | Correlation Coefficient | p Value |
| Apostapex/CV (mm3) | 0.987 | 0.000 |
| Apostapex/Atot | 0.814 | 0.000 |
| Atot/CMz | 0.723 | 0.000 |
| Aant/Apost | 0.774 | 0.000 |
| Apost/Atot | 0.649 | 0.000 |
| Apost/CMz | 0.719 | 0.000 |
| CV/Atot | 0.858 | 0.000 |
| CV/CMz | 0.768 | 0.000 |
| Atot/CMz | 0.943 | 0.000 |
| Apostapex/CMz | 0.723 | 0.000 |
| Apostmct/Apostapex | 0.996 | 0.000 |
| CV/Apostmct | 0.987 | 0.000 |
| Atot/Apostmct | 0.813 | 0.000 |
| CMz/Apostmct | 0.730 | 0.000 |
| Dantmct/Dpostmct | 0.988 | 0.000 |
© 2018 by the authors. Licensee MDPI, Basel, Switzerland. This article is an open access article distributed under the terms and conditions of the Creative Commons Attribution (CC BY) license (http://creativecommons.org/licenses/by/4.0/).
Share and Cite
Cavas-Martínez, F.; Fernández-Pacheco, D.G.; Cañavate, F.J.F.; Velázquez-Blázquez, J.S.; Bolarín, J.M.; Alió, J.L. Study of Morpho-Geometric Variables to Improve the Diagnosis in Keratoconus with Mild Visual Limitation. Symmetry 2018, 10, 306. https://doi.org/10.3390/sym10080306
Cavas-Martínez F, Fernández-Pacheco DG, Cañavate FJF, Velázquez-Blázquez JS, Bolarín JM, Alió JL. Study of Morpho-Geometric Variables to Improve the Diagnosis in Keratoconus with Mild Visual Limitation. Symmetry. 2018; 10(8):306. https://doi.org/10.3390/sym10080306
Chicago/Turabian StyleCavas-Martínez, Francisco, Daniel G. Fernández-Pacheco, Francisco J. F. Cañavate, Jose S. Velázquez-Blázquez, Jose M. Bolarín, and Jorge L. Alió. 2018. "Study of Morpho-Geometric Variables to Improve the Diagnosis in Keratoconus with Mild Visual Limitation" Symmetry 10, no. 8: 306. https://doi.org/10.3390/sym10080306