Reduction of Image Complexity Explains Aesthetic Preference for Symmetry

1
Department of Psychology, National Taiwan University, Taipei 10617, Taiwan
2
Neurobiology and Cognitive Science Center, National Taiwan University, Taipei 10617, Taiwan
3
Taipei First Girls’ High School, Taipei 10045, Taiwan
*
Author to whom correspondence should be addressed.
Symmetry 2011, 3(3), 443-456; https://doi.org/10.3390/sym3030443
Submission received: 11 April 2011
/
Revised: 2 June 2011
/
Accepted: 29 June 2011
/
Published: 11 July 2011
(This article belongs to the Special Issue Symmetry Processing in Perception and Art)
Abstract
:Symmetric patterns are more appealing to human observers than asymmetric ones. Here, we investigate the visual information processing mechanisms underlying this aesthetic preference. All stimuli were derived from phase scrambled versions of forty face or nature images. In addition to the scrambled images, there were four other types of test image: symmetric, in which one part of the image was a reflection of another around an axis; repetitive, in which one part of the image was a copy of the other; anti-symmetric, similar to symmetric but with the contrast of one side reversed; and interleaved patterns, in which half of the symmetric pattern was replaced by a scrambled image. The number of axes ranged from 1 to 16 for all image types. The task of our 20 observers was to give a preference rating to each image on a 6-point Lickert scale. The preference rating increased with the number of axes for all stimulus types. The observers showed a similar preference for symmetric and repetitive patterns and slightly less preference for anti-symmetric patterns. The preference for interleaved patterns was much less than for other types of stimuli. Preference for an image cannot be explained by either the ecological significance of its content or the slope of its amplitude spectrum. Instead, preference can be accounted for by the complexity of the image.
1. Introduction
Symmetry occurs when some part of an image is a reflection of another part about a certain axis. It is a desirable feature in many different types of human aesthetic experience. The importance of symmetry in architecture and landscape design is well known and has been carefully observed since the first century BCE, as demonstrated in the classical architectural writer Vitruvius’ thesis [1] writing in circa 15 BCE, to modern days [2]. It is also a defining factor in a well-designed Zen garden [3]. In addition, numerous studies have shown that a symmetric face or body (for a review, see [4,5,6]) is more attractive than an asymmetric one.
The question we are interested in is why symmetry is so appealing. One possibility is that human observers like symmetry because it makes ecological sense. Many authors have advocated the evolutionary origin of human aesthetic preferences [7,8,9]. In the context of symmetry, it has been noted that in the wild, animals (which could be potential predators, food sources or mates) tend to be symmetric while background elements, such as rocks, bodies of water, trees, and hillsides, are largely non-symmetric [10]. That is, a symmetric object is more likely to be relevant to the survival of an observer; hence, it pays to take an extra look at it. Furthermore, it is suggested that preference for symmetry may have evolved for reasons of mate choice [11,12]. Since the degree of symmetry is correlated with fitness and health in an animal [13], it is theorized that animals prefer symmetry because it indicates the quality of a mate [11,12]. Females of many species, including insects and birds, prefer mates with more symmetric ornaments [11,14,15]. In humans, a person with a more symmetric face or body is considered to be more sexually attractive [16].
Notice that, this ecological approach implies that symmetry is desirable because it represents a certain desirable quality in an object. That is, it is the symmetric object that appeals to an observer rather than symmetry per se. However, symmetry preference may arise when there is no relation between the symmetry of an object and its quality [17,18]. After all, as a quick peek into a kaleidoscope will show, one can appreciate the aesthetic value of symmetry in abstract patterns that have no ecological significance. Thus, there must be factors in the image itself that make a symmetric image appealing. Using a set of random polygons, Days [19] showed that observers prefer patterns that are neither too complex nor too simple. Vitz [20] also reported a similar effect using randomly drawn lines. Based on these results, Kaplan and Kaplan [21] proposed that complexity, defined as the number of visual elements in an image, is one of the major factors that determine whether a scene is appealing to a human observer. In a symmetric pattern, one can infer the content of half of the image from the other half. Thus, a symmetric image contains fewer unique image elements, and is less complex, than an asymmetric image. This reduction of complexity may make symmetry appealing [22].
Recently, there have been attempts to associate the aesthetic value of an image with the amplitude spectrum slope of that image. It is known that, if one applies a Fourier transform to an image of a natural scene, the amplitude spectrum of that image decreases with spatial frequency. The relationship between the amplitude, a, and spatial frequency, f, can be described by the equation a = f−k, where k is a scalar parameter [23,24,25]. That is, on log-log coordinates, the relationship between the amplitude and spatial frequency is a straight line with a slope −k. Graham and Field [26,27] showed that the amplitude spectrum of paintings also decreases with spatial frequency. Furthermore, the value of slope k for the paintings, which were created for aesthetic purposes, is greater than randomly sampled nature images [26,27]. The implication is that the aesthetic value of an image may be related to the spectrum slope.
Here, we investigated whether the three hypotheses discussed above could account for the aesthetic preference for symmetric patterns. We measured the preference rating for different types of images, including symmetric, anti-symmetric, repetitive, and interleaved patterns with different numbers of axes (See Figure 1 for examples of stimuli). Previous studies of symmetry preference have focused on the preference for symmetric objects, such as faces and bodies (e.g., [16]). Here, we derived symmetric patterns from phase-scrambled images that contained no meaningful structure. If the aesthetic value of an image is influenced by symmetry per se, we would expect a higher preference specifically for symmetric patterns over scrambled ones. If preference for symmetry is due to its ecological significance, then the observers should find symmetric patterns more appealing than any other types of patterns. On the other hand, if symmetry preference is due to a reduction of image complexity, then we would expect the observers to have a similar preference for both symmetric and repetitive patterns but lower preference for the other types. In addition, the preference rating should increase with the number of axes in symmetric, repetitive, and anti-symmetric patterns. Finally, we tested the amplitude spectrum hypothesis by calculating the correlation between the spectrum slope of a test image and the observers’ preference rating for that image.
2. Method
2.1. Stimuli
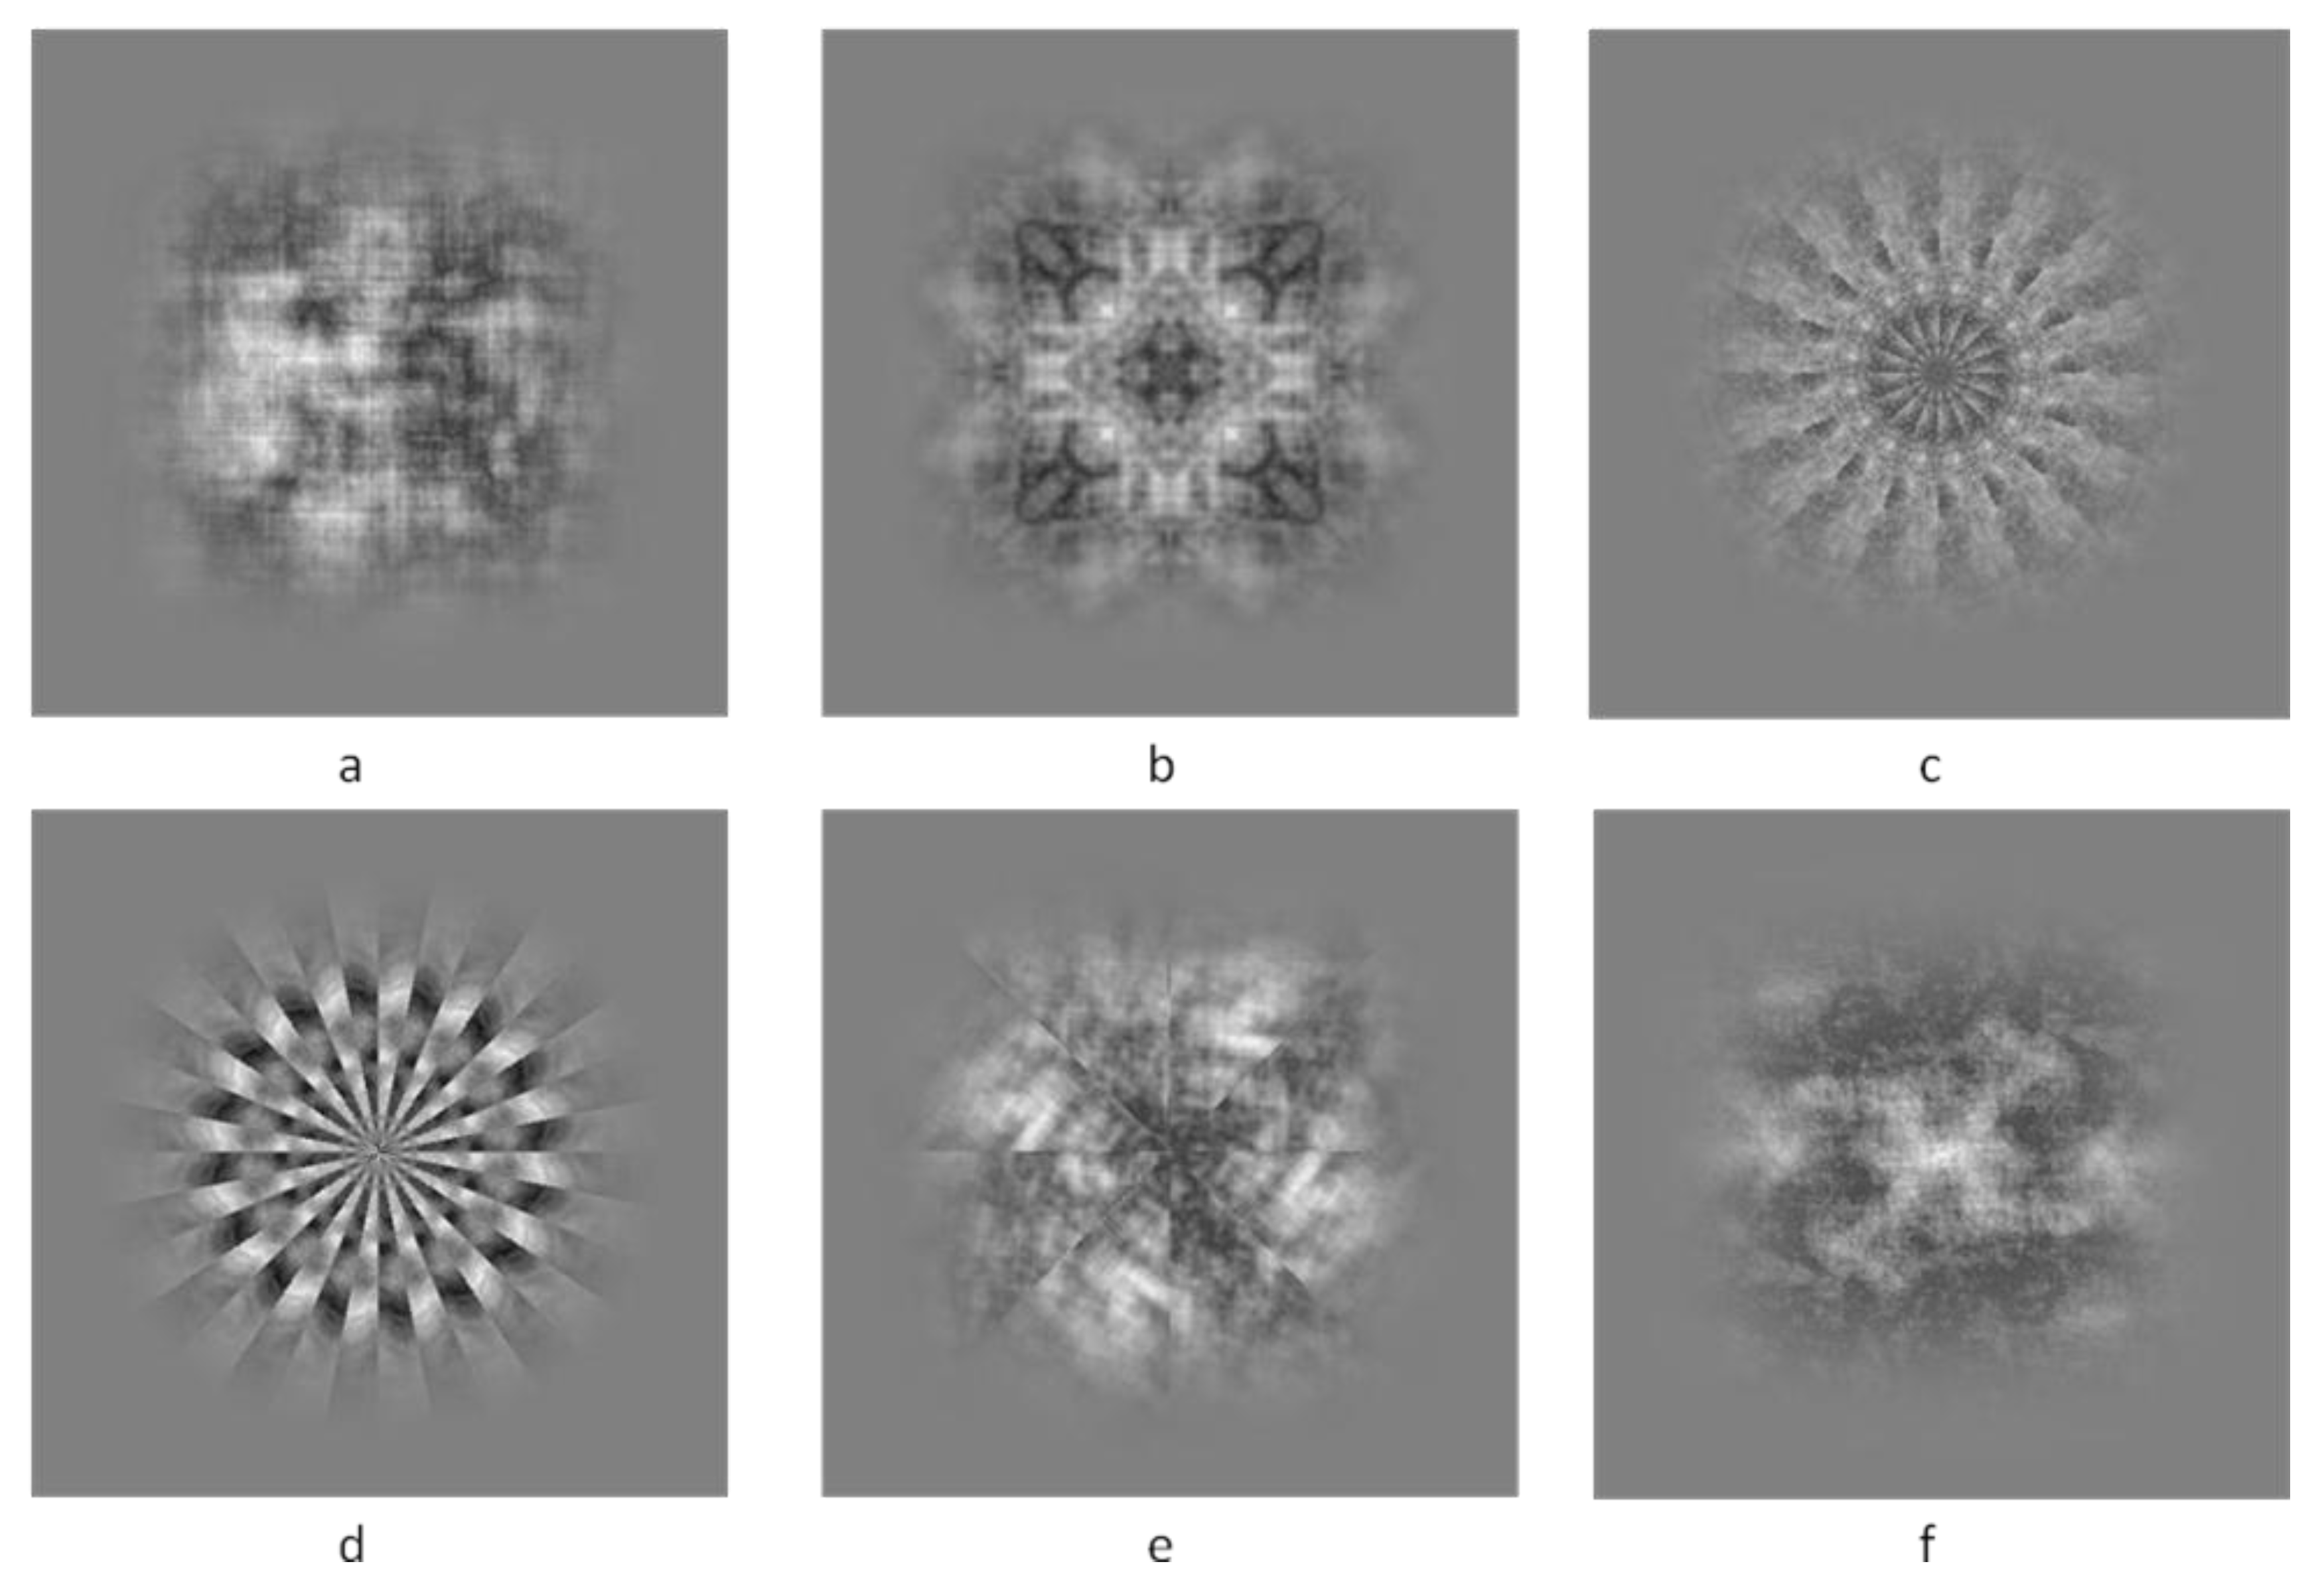
Figure 1 shows examples of the stimuli used in our experiments. There were five types of pattern: symmetric, repetitive, anti-symmetric, interleaved, and scrambled. All stimuli were derived from 20 gray scale images: ten contained a human face and the other ten a nature scene. For each image, we first applied a Fourier transform to that image. We then randomly scrambled its phase spectrum while leaving its amplitude spectrum intact. The combination of the scrambled phase spectrum and amplitude spectrum was then inverse Fourier transformed back to the space domain. The result was the scrambled image used as the baseline condition in the experiments and the base for deriving other types of stimuli.
Let f(r, θ) be the luminance of a point on a test image, where r is the distance from that point to the center of the image and θ is the angle (in radiance) between the horizontal axis that passes through the center of the image and the line connecting that point and the center. In the symmetric patterns, one part of the image was a reflection of another part about the symmetry axis. That is, the luminance of a pixel on one side of the axis matched that of the corresponding pixel on the opposite side. Hence, the luminance of a point L(r, Ф − θ) on the image was the same as that of the point L(r, Ф + θ), where Ф defined the orientation of the axis of symmetry. For a pattern with n axis, θ ranged between 0 and π/n, and φ was π/i + z, where i = 1,2,…,n, and z determined the orientation offset of the axis of symmetry. For instance, for n = 1, a horizontally symmetric pattern would have z = 0 while a vertically symmetric one would have z = π/2. In our experiment, the number of axes in an image was 2k where k varied from 0 to 4. That is, there could be 1, 2, 4, 8 or 16 axes in a symmetric pattern. For patterns with 1 or 2 axes of symmetry, we also measured the effect of axis orientation offset. There were four possible axis orientations for the one-axis patterns: z = 0 (horizontal), π/4 (right diagonal), π/2 (vertical) and 3/4π (left diagonal). There were two possible axis orientation offsets for the two-axis patterns: z = 0 (or “+” type, with one vertical and one horizontal axis), and π/4 (“x” type, with two diagonal axes.) We used patterns with different orientations because it is easier to detect vertical symmetry [28]. We thus tested whether this vertical advantage persists in preference. In addition to mirror symmetric patterns, we also used point symmetry patterns where L(r, θ) = L(r, θ + π).
The luminance of a pixel in the anti-symmetry patterns was the opposite of that of the corresponding pixel on the other side of the axis. Hence, the anti-symmetric patterns were constructed by L(r, Ф − θ) = −L(r, Ф + θ). The positive value denotes an increment of luminance from the mean, and the negative value a decrement. In the repetition patterns, one part of the image was a copy of another part on the opposite side of the axis. Hence, they were defined by L(r, θ) = L(r, Ф + θ). An interleaved pattern with n axes was a combination of a symmetric pattern with n/2 axes and the original phase scrambled image. Pixels with an azimuth θ in the range (2 × (i − 1)) × π/n to (2 × (i − 1) + 1) × π/n were from the symmetric pattern while pixels with θ in the range (2 × (i − 1) + 1) × π/n to (2 × i) × π/n were from the phase scrambled image. There could be 1, 2, 4, 8 or 16 axes for anti-symmetric, repetitive and interleaved patterns. In total, there were 520 images used in this study, including 200 symmetric patterns (20 × (4 orientations for 1-axis + 2 orientations for 2-axis, and 1 for point symmetry and 4-, 8- and 16-axis images), 100 images (20 × 5 number of axis) for each pattern type (anti-symmetric, repetitive and interleaved) and 20 scrambled images.
All images were windowed by a fourth-power Gaussian function exp(−(x4 + y4)/σ4) where the scale constant σ was 3.47°. The purpose of the Gaussian window was to avoid sharp edges at the borders of the image and the resulting high spatial frequency ripples in the power spectrum. All were also scaled to have the same mean luminance and contrast energy.
The images were presented on a TFT-LCD monitor controlled by a PC-compatible computer. The viewing distance was 50 cm. The pixel size was 1.3’ at this viewing distance.
2.2. Procedure
In each trial, a beep sound and the presentation of a fixation point signaled the beginning of the trial. One test stimulus was then presented at the center of the display and remained there until the observer made a response. The observers were instructed to press a key to indicate on a 6-point Lickert scale how beautiful the test stimulus was (1: “not beautiful”, 6: “beautiful”). The observers were instructed to make the frequency of each response type as even as possible. The purpose of this instruction was to encourage the observer to anchor the extreme values of the Lickert scale to the stimuli used in this experiment rather than to objects from their personal experience whose aesthetic value might span a much greater range than our stimuli. There were 20 exemplars for each type of pattern. The images were presented in random order.
Each symmetric image was rated by 20 observers while each of the other types of image was rated by 17 observers. The age of observers ranged from late teens to early 50 s. Written consent was obtained from each observer and written parental consent was obtained for each observer under 18 years old.
3. Result
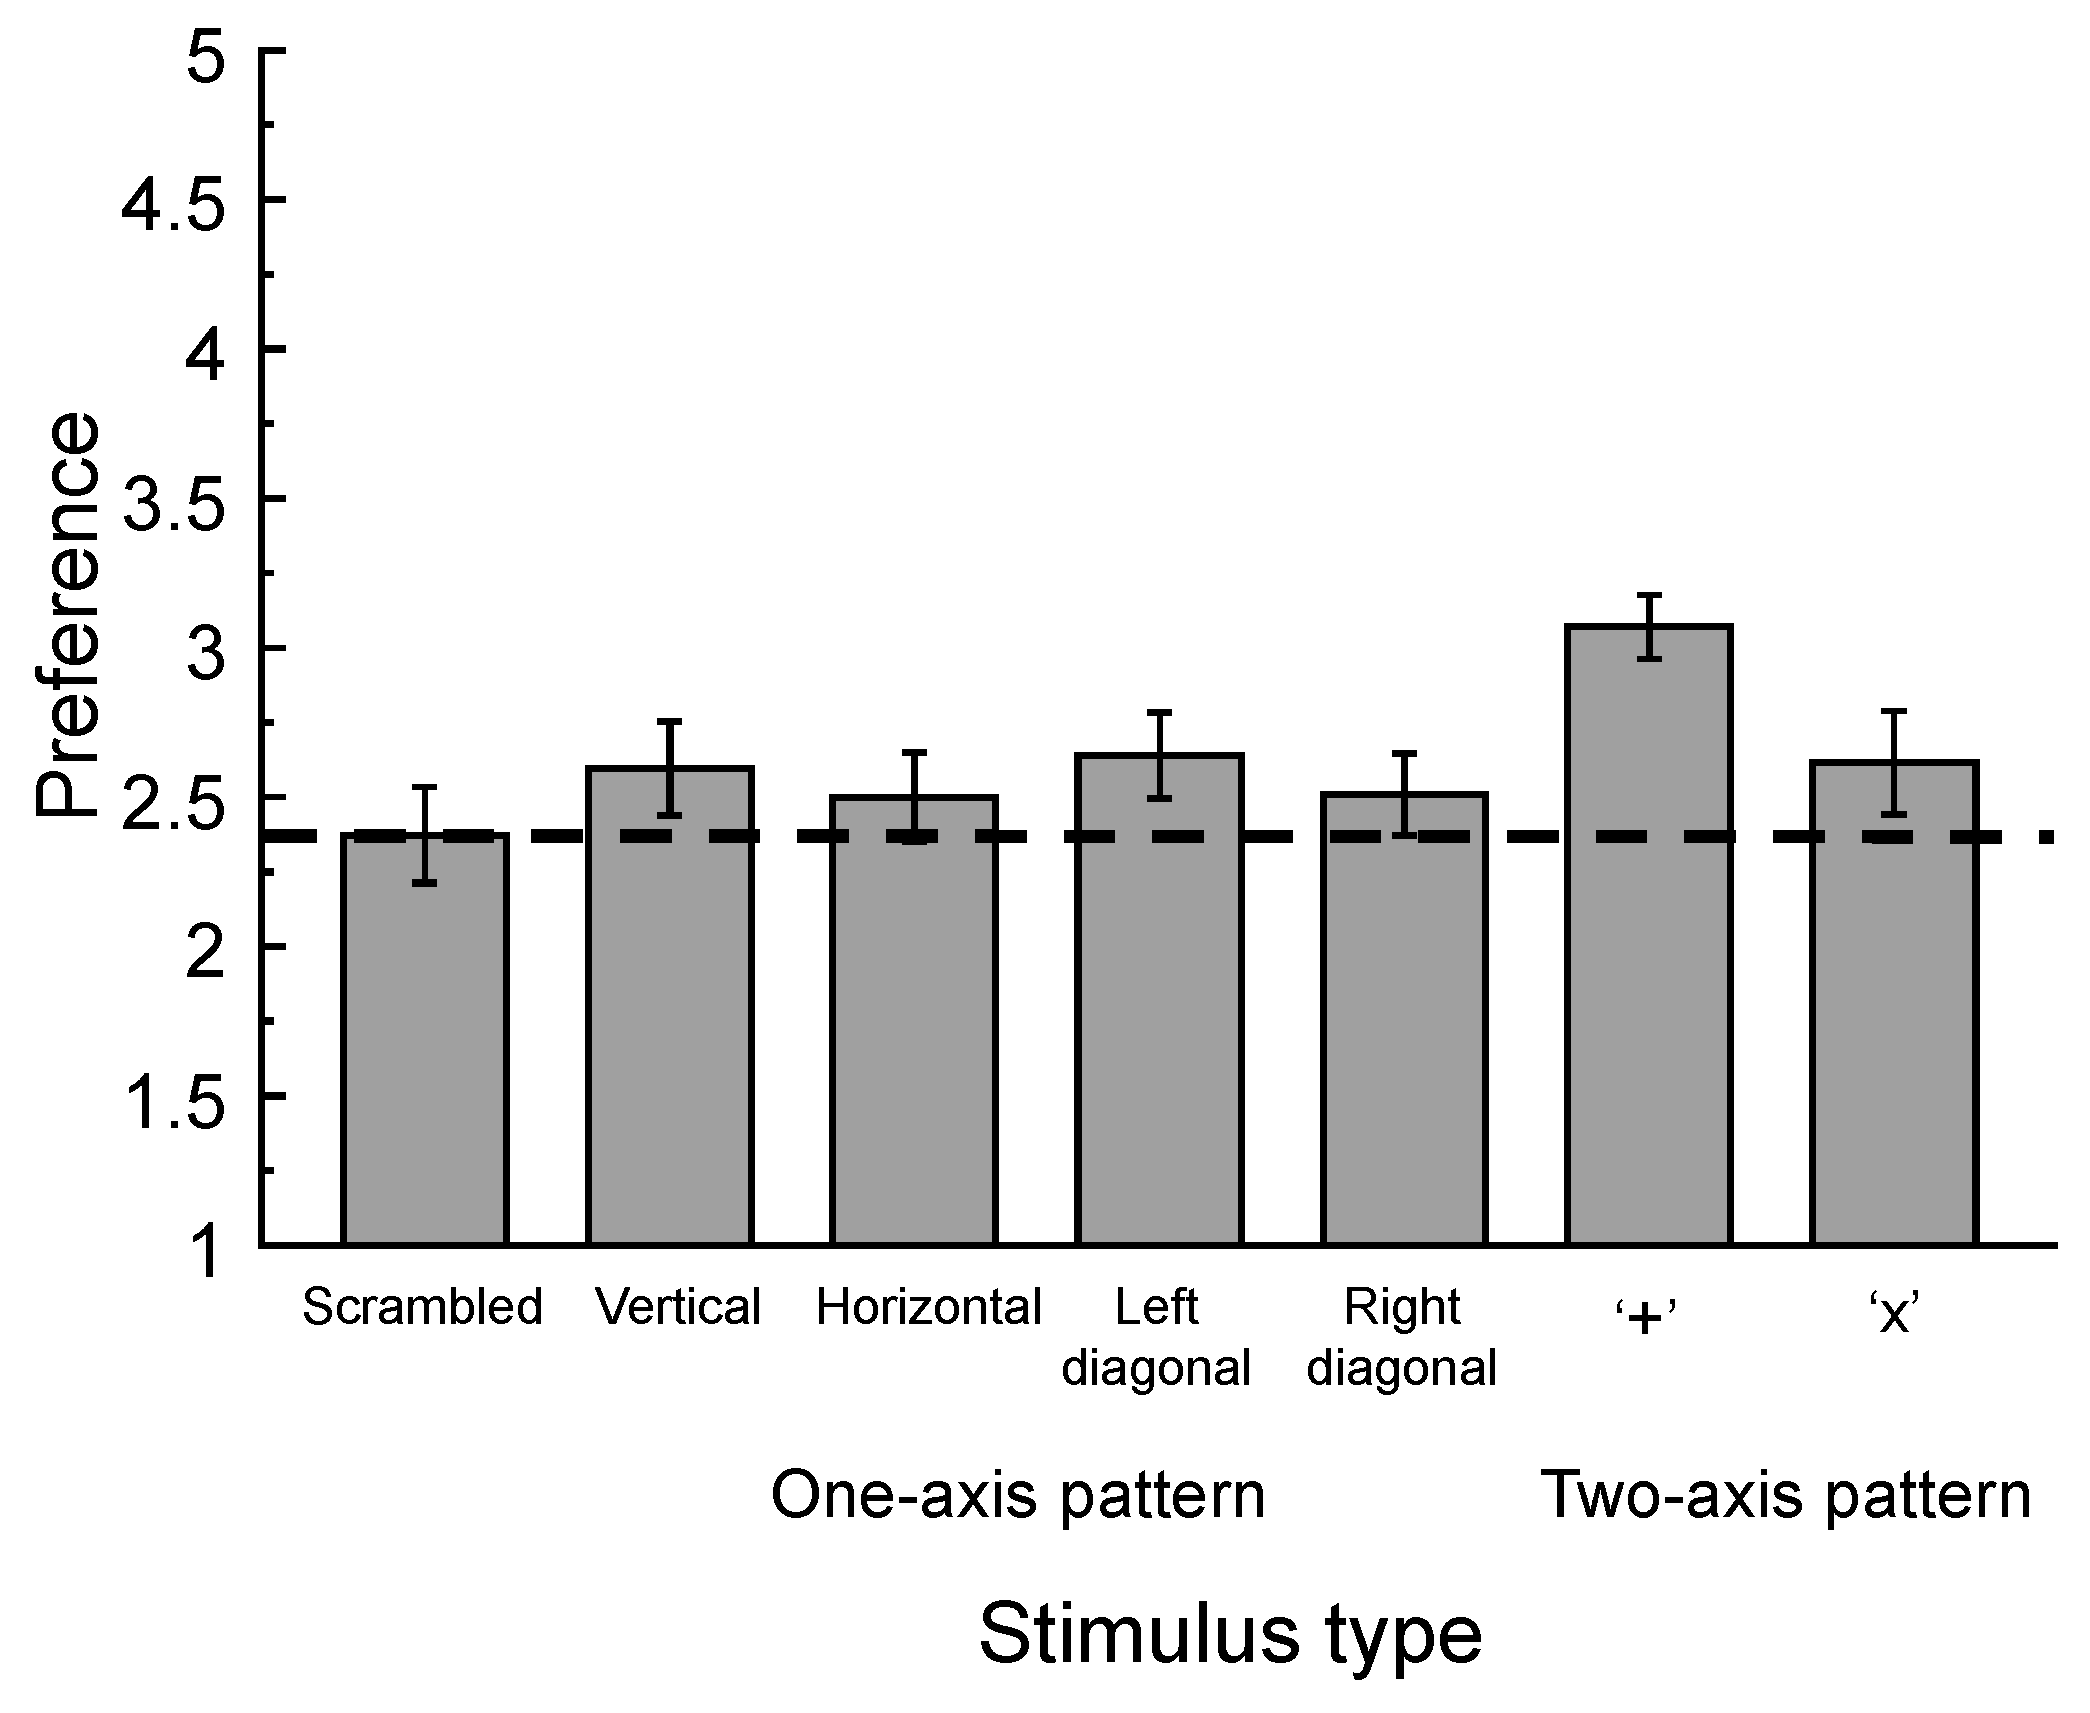
Wenderoth [28] reported that it is easier for a human observer to detect a vertical symmetric pattern than a horizontal symmetric pattern, which in turn is easier to detect than one that is diagonal. We thus first checked whether this vertical advantage effect is prevalent in preference. Figure 2 shows the preference rating for one-axis symmetric patterns at different orientations. The ratings for scrambled and point symmetric patterns are also plotted here for comparison. The preference rating for the vertical symmetric pattern (2.60) was not significantly different than for horizontal (2.50, paired t(19) = −1.79, p = 0.09), right diagonal (2.63, paired t(19) = 0.79, p = 0.44) and left diagonal (2.51, paired t(19) = −1.44, p = 0.16) symmetric patterns. Hence, the vertical advantage effect, while conspicuous in detection, was not observed in preference rating. Figure 3(b) shows the preference rating for both the “+” (3.07) and: “x” (2.61) types of the two-axis symmetric patterns. The preference rating for these two types of patterns was statistically significant (paired t(19) = 3.04, p = 0.007). The observers showed a preference for a combination of vertical and horizontal symmetry over a combination of two diagonals.
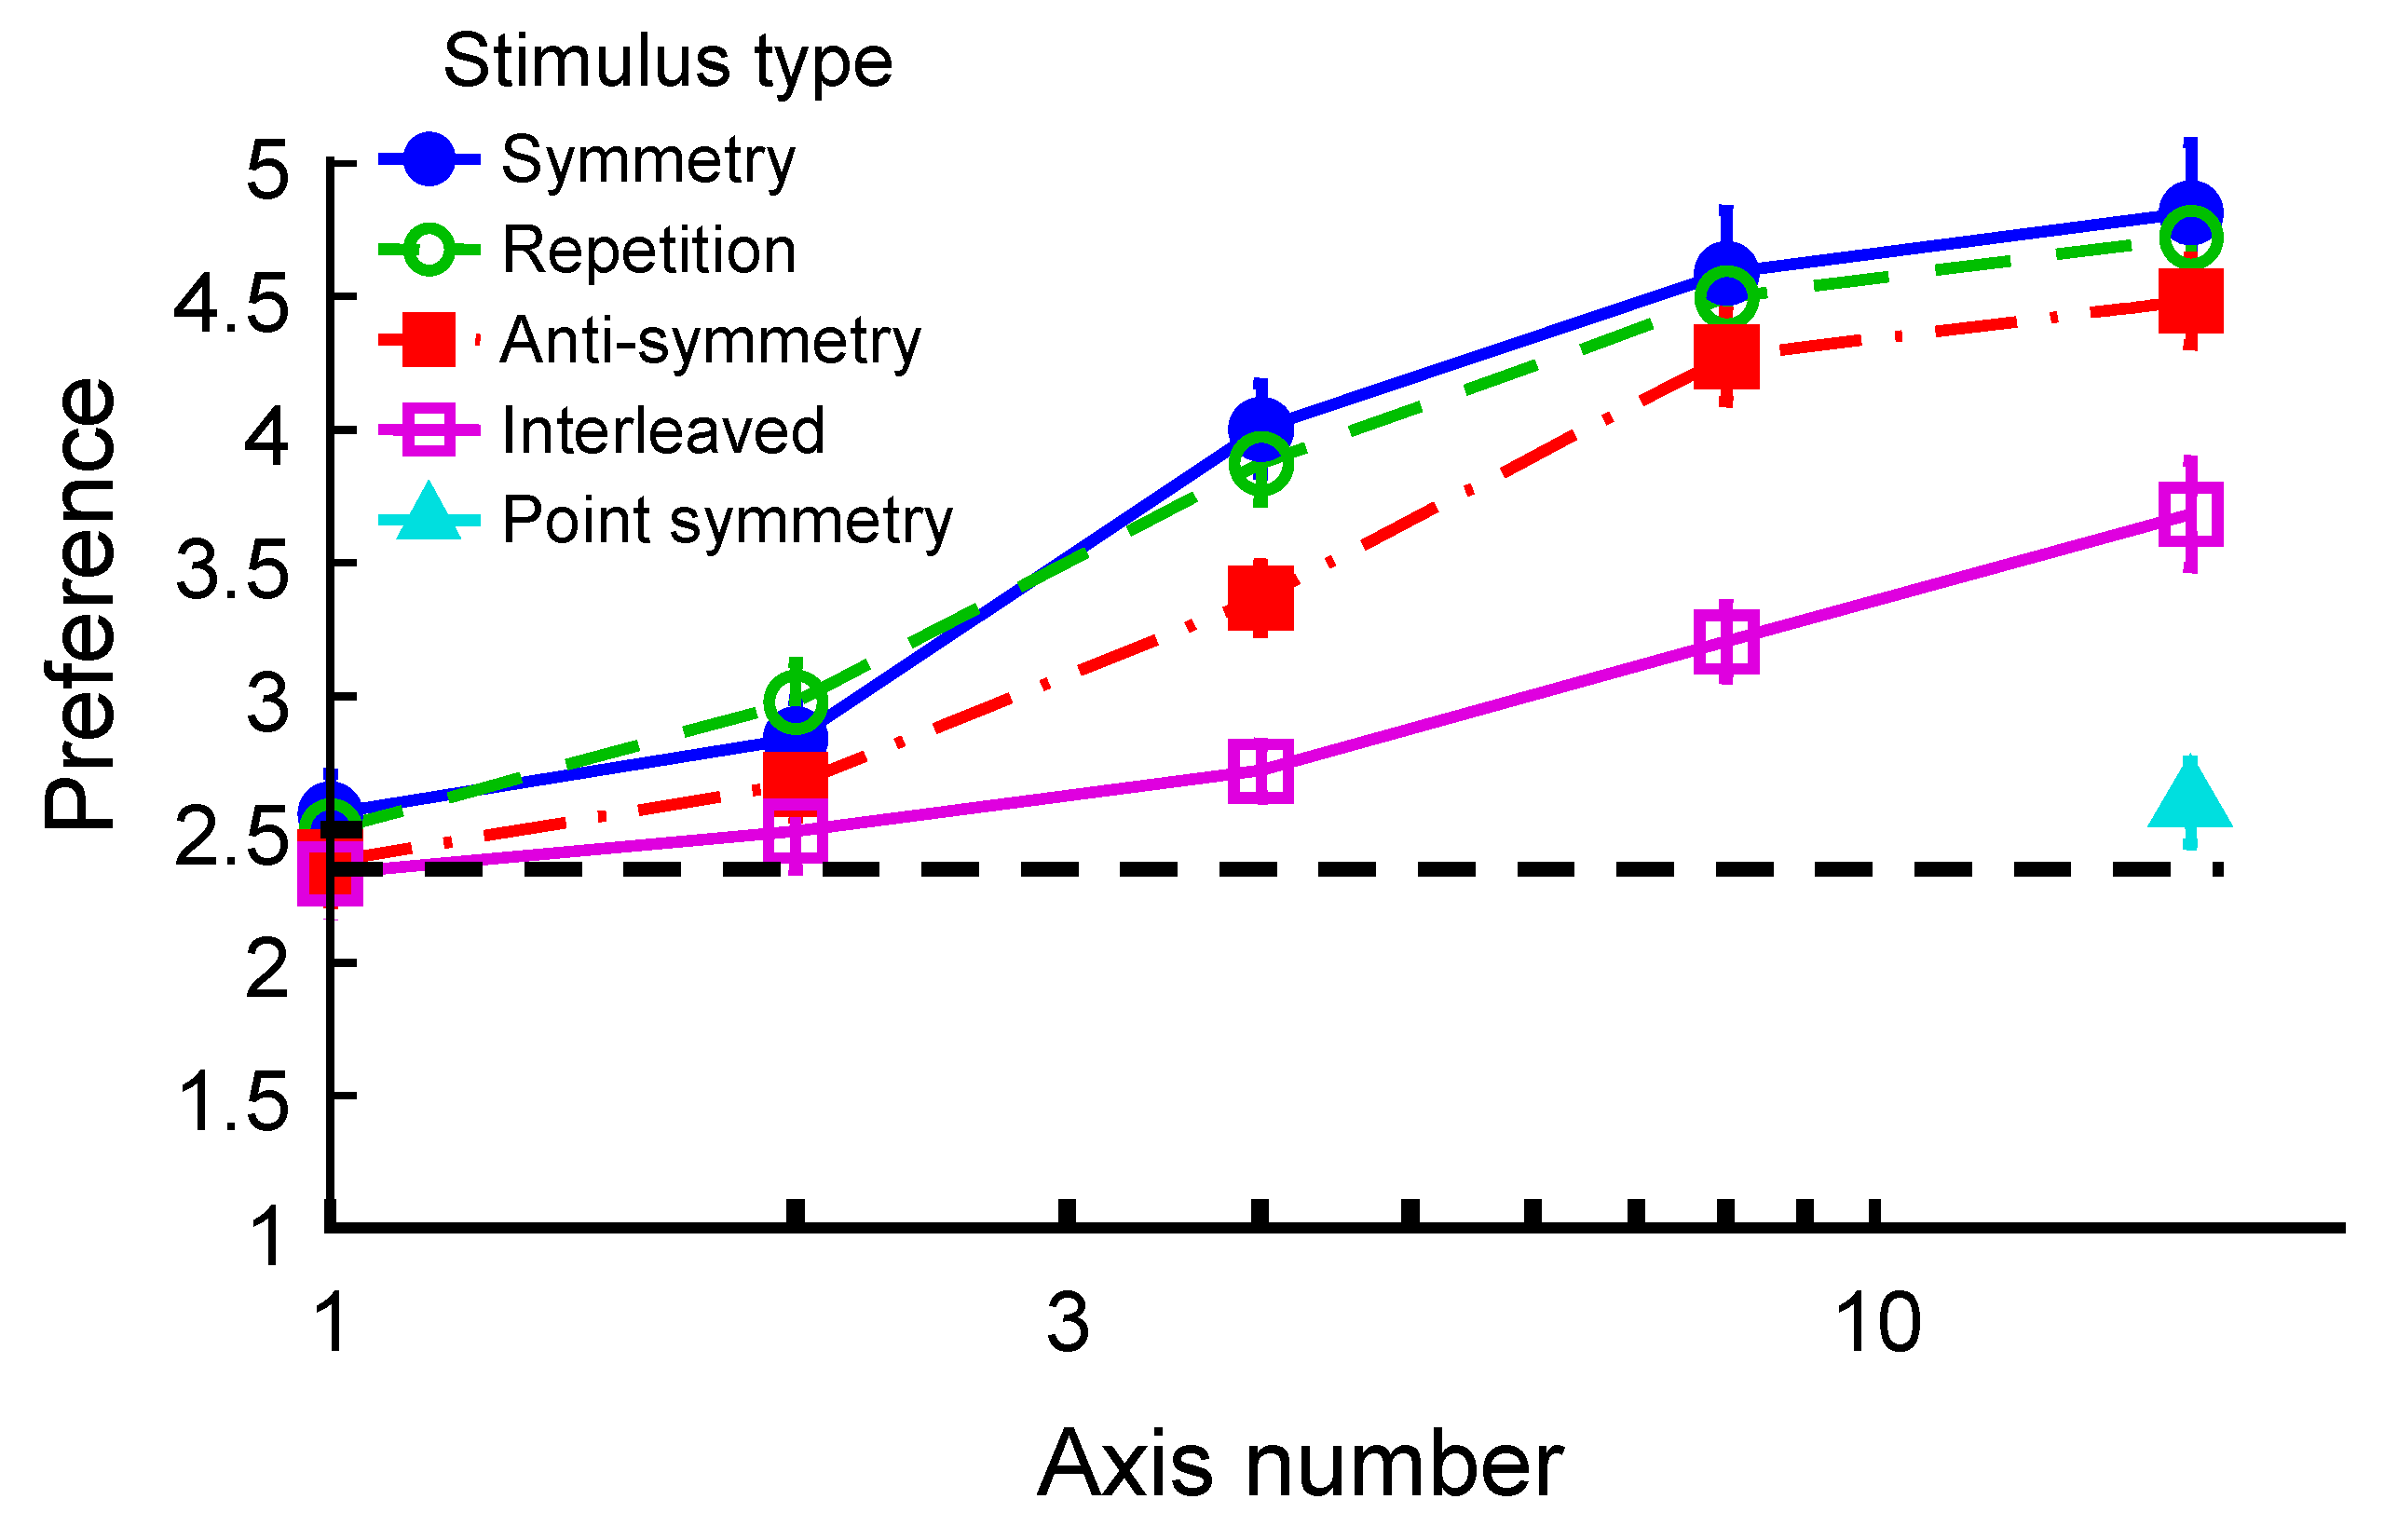
Figure 3 shows the effect of axis number on preference rating. The dashed horizontal line in the figure denotes the mean preference rating for phase scrambled images. Preference ratings for the one-axis and two-axis symmetric patterns were averaged over orientation. For symmetric patterns (blue closed circles and solid lines) in Figure 3, the preference rating increased with the number of axes. This effect was particularly pronounced for patterns with more than two axes of symmetry. The one-axis symmetric patterns had the lowest preference ratings (2.56) of all the symmetric patterns but their ratings were still statistically significantly higher (paired t(19) = 2.18, p = 0.021 < α = 0.05) than preference ratings for the scrambled images (2.37). The observers also preferred point-symmetric patterns (2.60) over scrambled images (paired t(19) = 3.75, p = 0.001). Symmetric patterns with more axes received even greater preference ratings than the 1-axis and point symmetric patterns. Thus, the observers always preferred symmetric images even when there was no recognizable structure in the image.
All other types of patterns also showed the same effect, where preference rating increased with the number of axes. Where the number of axes was the same, the preference rating was also the same for the repetitive pattern (Green open circles and dashed lines in Figure 3) as for the symmetric pattern, and preference was lower for the anti-symmetric patterns (red closed squares and dash-dot lines) than for the symmetric patterns. However, this difference was statistically significant only for four-axis patterns. Notice that both repetitive and anti-symmetric patterns with more than two axes are also point symmetric. Yet their preference rating was greater than the preference rating for point symmetric patterns with no axis (cyan triangle in Figure 3). Thus, the axis effect was strong for the repetitive and anti-symmetric patterns even taking the point symmetric property into account.
The preference rating was much lower for the interleaved patterns (magenta open squares and solid lines) than for the symmetric patterns. This difference was statistically significant when there were more than two axes. Notice that, at the same axis number, the interleaved patterns contained the same number of sharp edges as the symmetric patterns. Hence, the axis number effect cannot be explained by the emergence of sharp edges.
4. Discussion
In this study, we showed that the observers always preferred symmetric patterns over scrambled images and that their preference increased with the number of axes used in the images. At the same axis number, preference was about the same for symmetric and repetitive patterns but was slightly lower for anti-symmetric patterns, while preference for interleaved patterns was significantly less than for all three other pattern types.
4.1. Comparison between Preference and Detection Performance
The detectability of symmetry is often measured by (1) the coherence threshold, or the minimal number of symmetric visual elements needed for an observer to tell the difference between symmetric and asymmetric patterns [29,30,31]; or (2) reaction time, or the minimal time required for an observer to make a correct response [32]. Several studies showed that the detectability of symmetry, at least for 1-, 2- and 4-axis patterns, increased with the number of axes [32,33,34]. Our result also shows that preference for symmetric patterns increases with the number of axes. Hence, for the number of axis effect, there is a correspondence between preference and detectability, at least for 1-, 2- and 4-axis patterns.
Such correspondence, however, is not clear between different types of patterns. It is more difficult to detect a symmetric pattern when there is noise in the display [29,30]. Our observers also considered an interleaved pattern to be less appealing than a symmetric pattern. On the other hand, it is easier to detect symmetry than repetition in an image [33,35] but our data show that preferences for symmetric and repetitive patterns are about the same. Our results show that observers prefer symmetry to anti-symmetry. However, there is no consensus in the literature on the difference in detectability between anti-symmetry and symmetry. Some studies [36,37] show that the detectability of symmetric and anti-symmetric patterns was equal, while others [38,39] report that symmetric patterns are easier to detect. Overall, it seems that there is little correspondence between preference and detection performance across different types of patterns.
In addition, it is easier to detect vertical symmetry than symmetry of other orientationsin 1-axis symmetric patterns [28,32], and it is also easier to detect a 2-axis symmetric pattern with a “+” rather than “x” configuration [32]. However, we did not find that orientation had any effect on preference for 1-axis patterns. Hence, there is also little correspondence between preference and detection performance in the axis orientation effects.
4.2. Theoretic Implications
Our result is not consistent with the ecological explanation for symmetry preference. All images used in this study were constructed from phase scrambled images and thus contained no recognizable objects. Our results show that observers prefer symmetric patterns over scrambled images. This suggests a preference for symmetry per se, rather than symmetry as a property of an object, consistent with previous studies [17,18]. Furthermore, while one-axis symmetry is ubiquitous in the natural world, multiple-axis symmetry is rare. If preference for symmetry results from its ecological significance, one would expect that one-axis symmetry would be the most appealing type. This is inconsistent with our result, in which preference increased with the number of axes. In addition, repetition and anti-symmetry are not considered to be desirable features in natural objects. Yet, the preference rating was much greater for both anti-symmetric and repetitive patterns than for scrambled images when the number of axes was greater than two. At the same number of axes, the preference rating for repetitive patterns was even close to that for symmetric patterns. Therefore, ecological significance cannot explain our preference for symmetry.
Our observers preferred 4-axis symmetric patterns to 2-axis patterns, which in turn were more favored than 1-axis patterns. In our experiment, there were 40 instances of 1-axis symmetric patterns (four axis orientations) but only 20 instances of the 2-axis (2 axis orientations) and 10 instances of the 4-axis patterns. This difference in the number of instances might lead one to argue that novelty may have played a role in our result. After all, there are studies showing that observers might prefer novel stimuli to familiar ones [40,41]. This argument, however, has a severe limitation. Notice that our observers preferred 1-axis symmetric patterns to scrambled patterns, even though the latter occurred only 1/4 as frequently. In addition, our observers also preferred 4-axis repetitive patterns to 2-axis and 1-axis ones. Yet, the number of instances of repetitive patterns was the same for all numbers of axis. Hence, novelty cannot explain our result.
Next, we examined the effect of spatial frequency content on preference. For this purpose, we did a Fourier transform on all the test images. We then did a rotation average over the two-dimensional amplitude spectrum of each image. The purpose of this operation was to average the Fourier amplitude over orientation at every spatial frequency and thus reduce the spectrum from two-dimensional to one-dimensional. Empirically, we would expect this one-dimensional spectrum obtained from a nature scene [25] to be a straight line in log-log coordinates. That is, the relationship between the amplitude, a, and spatial frequency, f, can be described by the equation a = f−k, where k is a scalar parameter. Our images also showed the same property. We fit this function to the amplitude spectrum of each image between 4 cycles per image and the Nyquist limit of the horizontal dimension to get the amplitude slope on log-log coordinates.
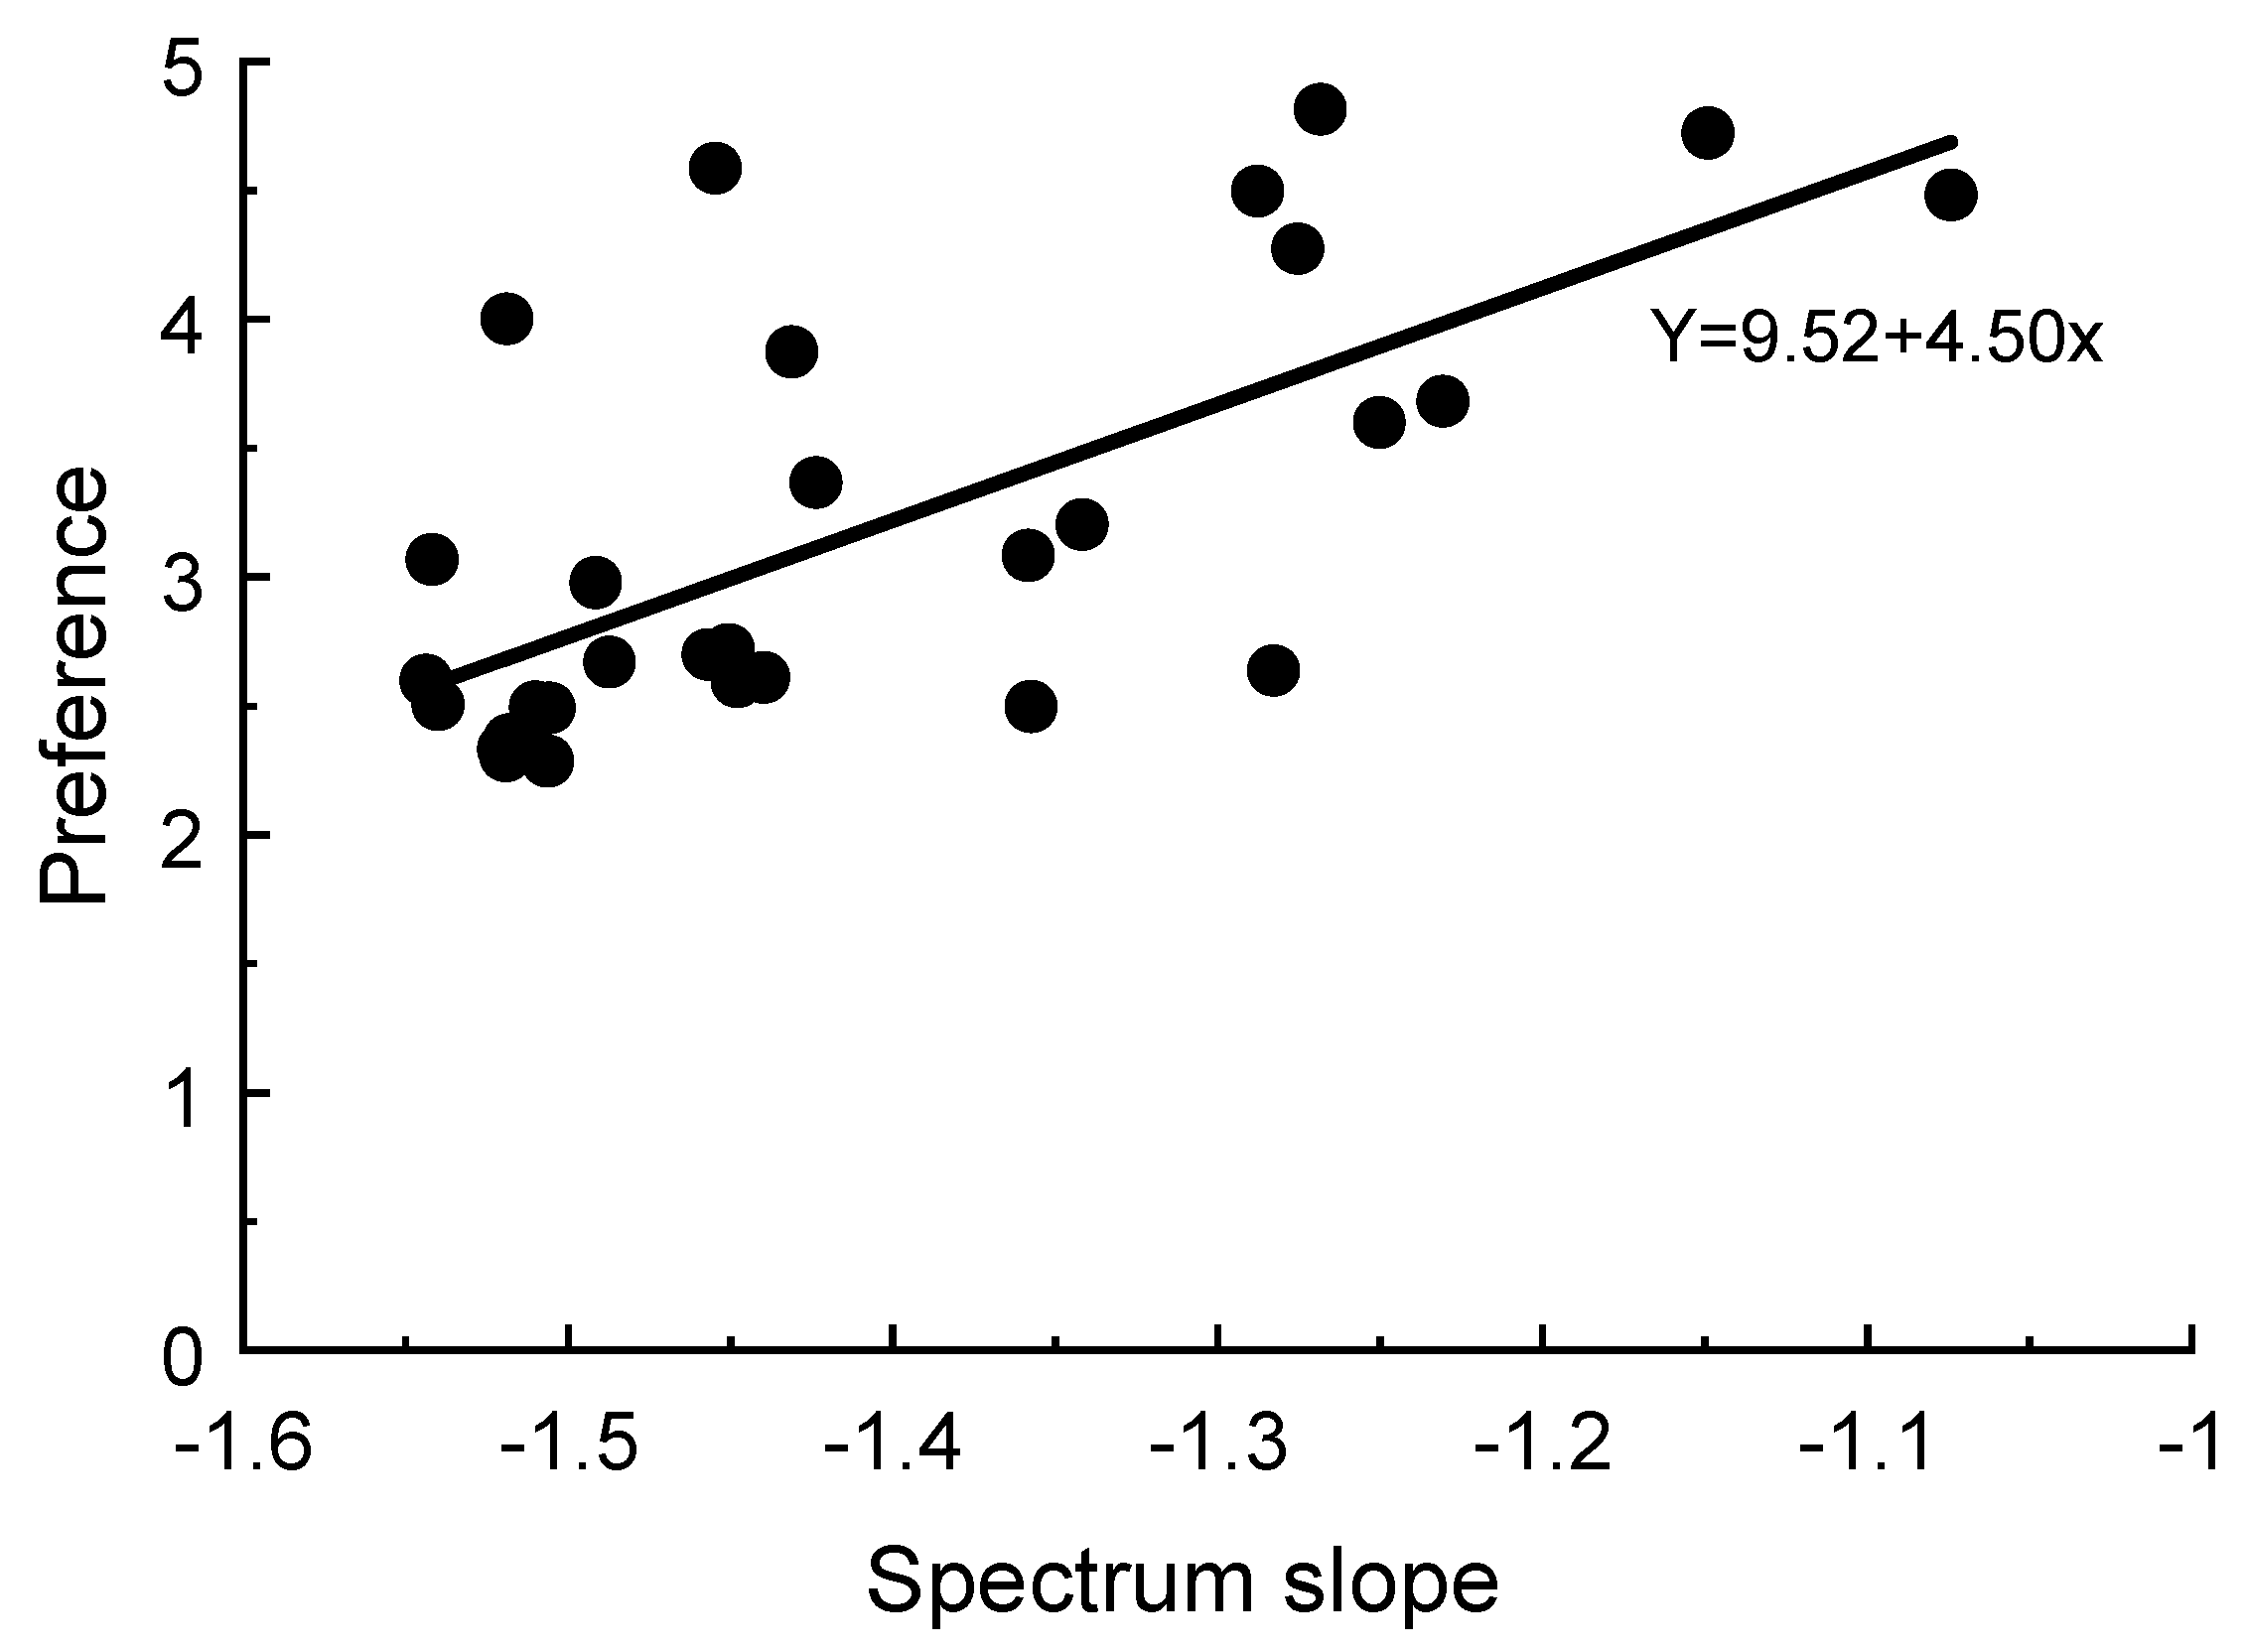
Figure 4 plots the averaged preference for each type of image against the averaged amplitude spectrum slope. In general, preference increased as the spectrum slope became shallower. Despite the wide spread of the data in this plot, a linear regression analysis showed that the slope parameter was significantly different from zero (t(1) = 5.04, p < 0.001). The correlation between the two was 0.68. Hence, at first glance, it seems our result is consistent with the notion that the aesthetic value of an image depends on its amplitude spectrum slope.
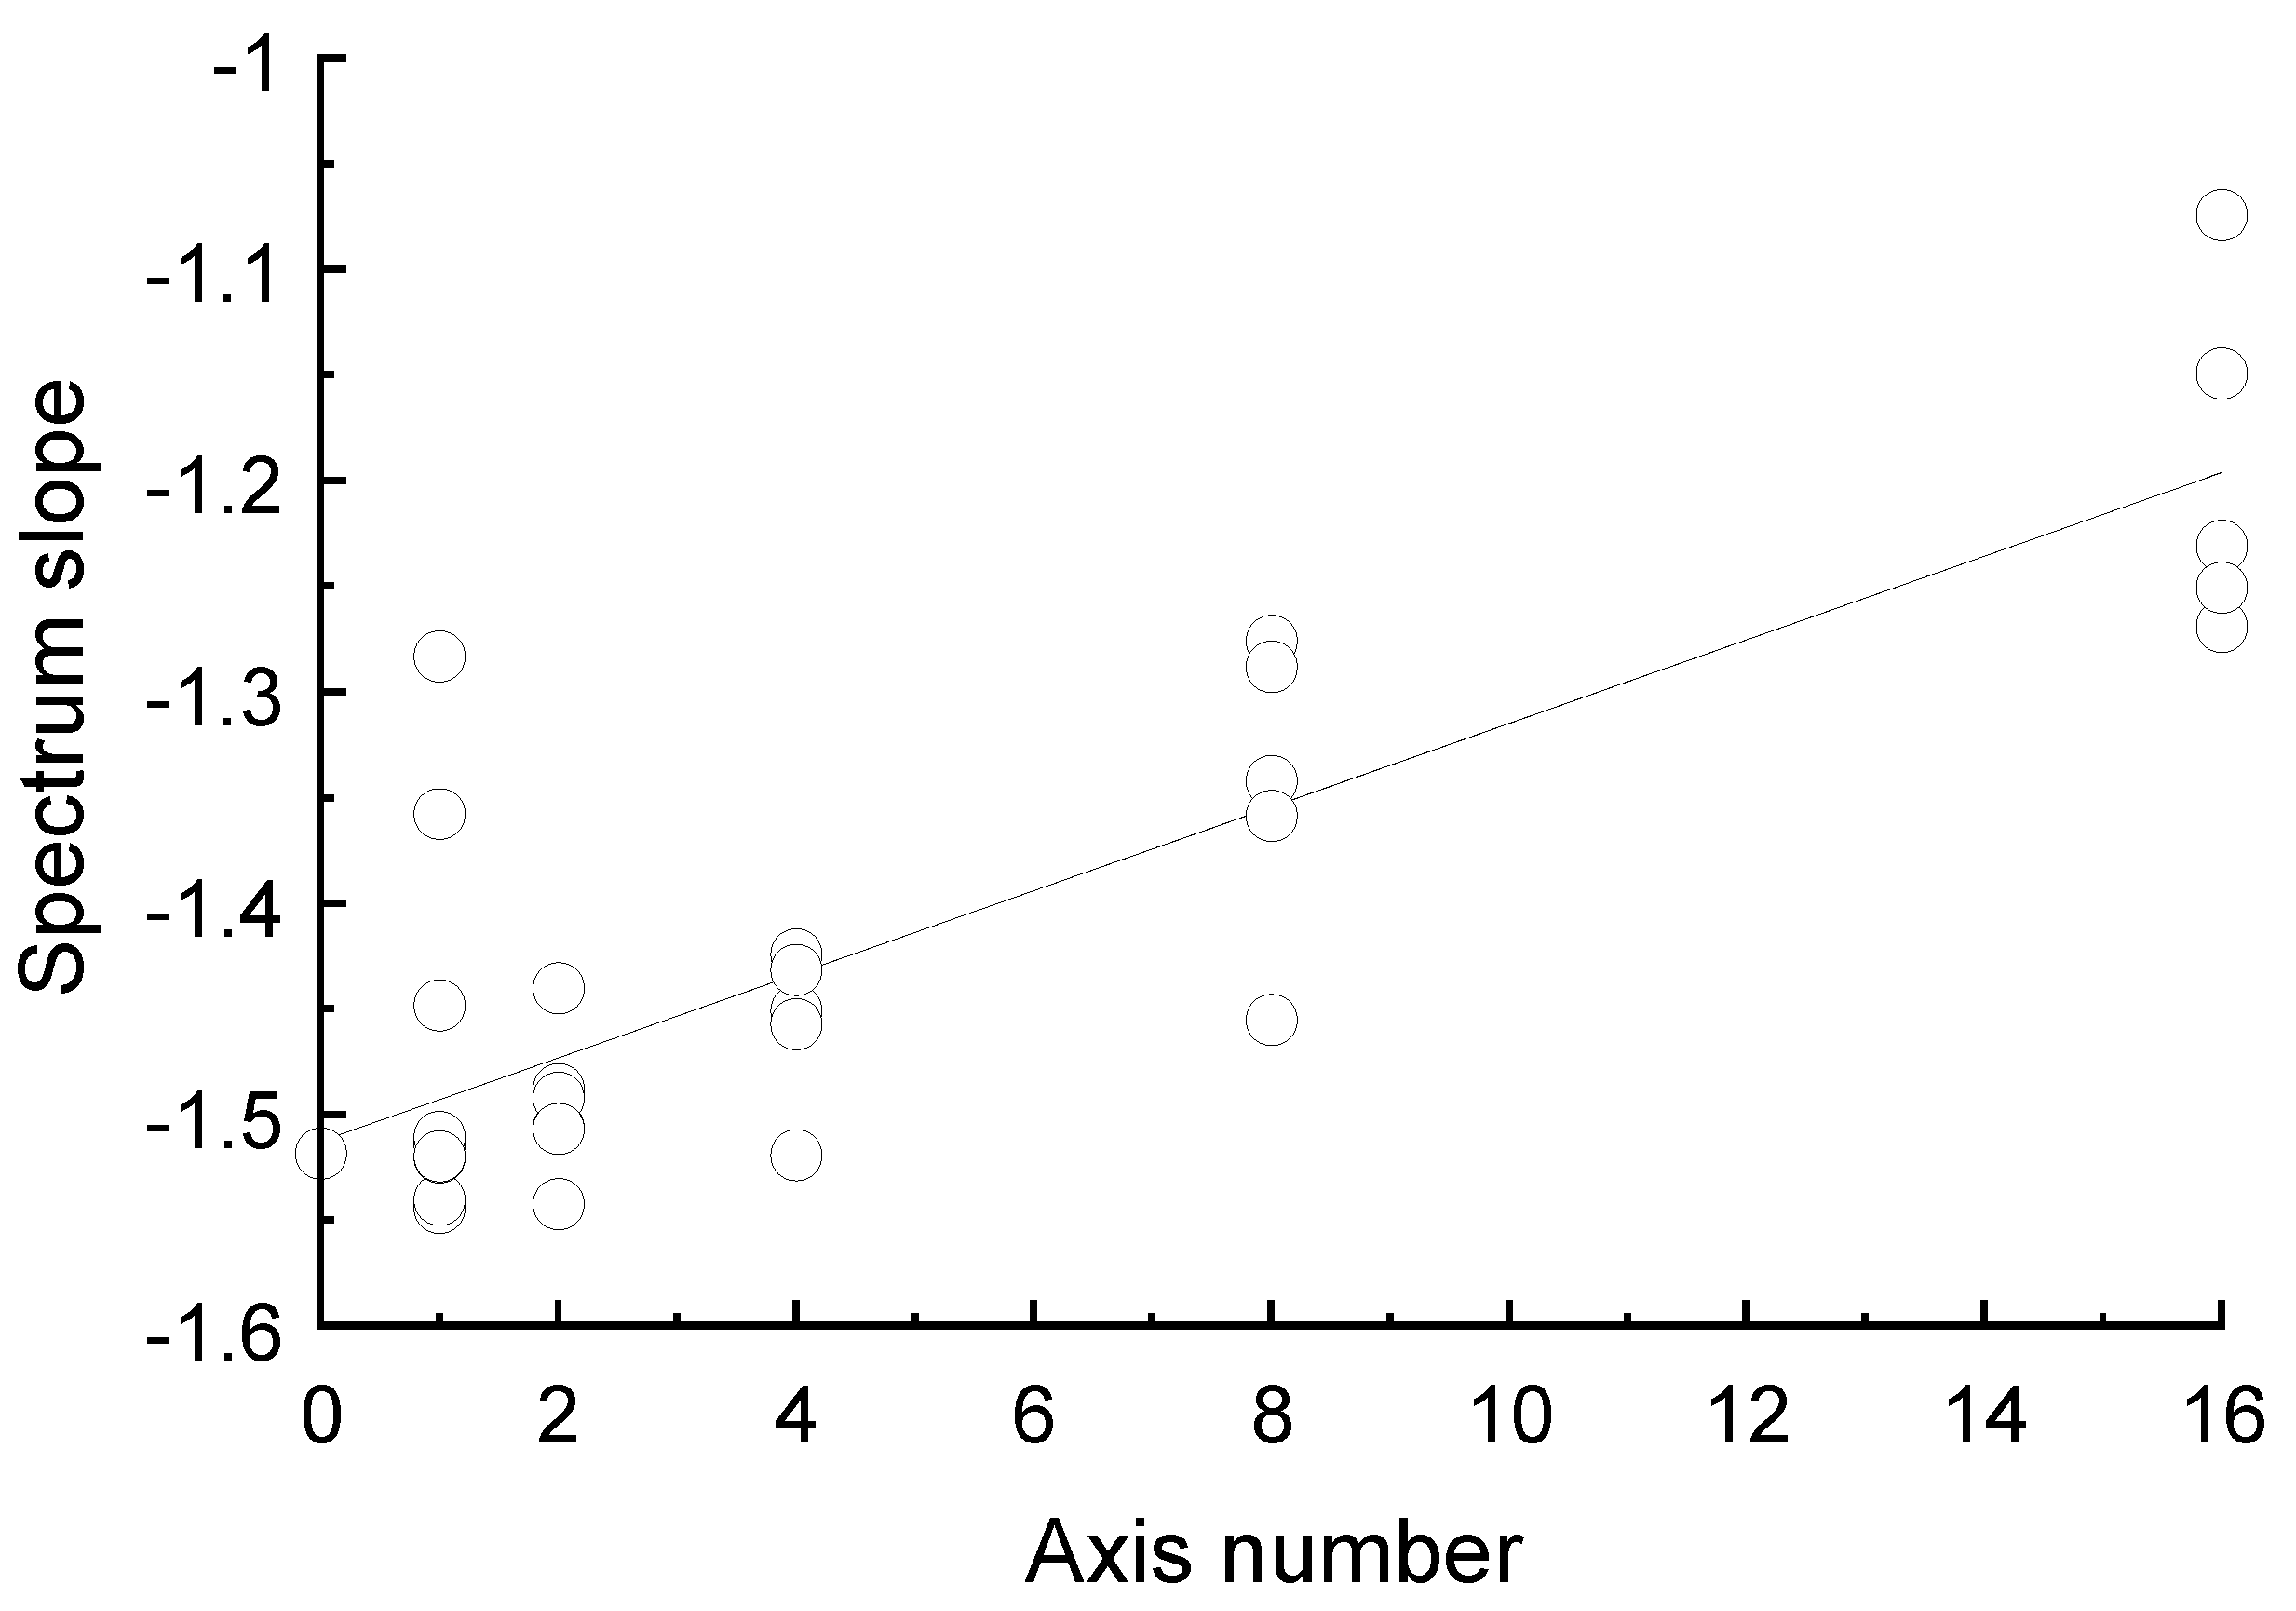
However, a detailed analysis shows that this spectrum slope effect may simply be coincidental. Notice that, in our result, preference rating increased with axis number. As shown in Figure 5, spectrum slope also becomes shallower as the axis number increases. This relationship between the spectrum slope and number of axes is expected. After all, a symmetric pattern with 2n+1 axes can be considered to be a combination of two 2n-axis symmetric patterns each, times a square wave with a radial frequency π/2n of opposite phase. Hence, as axis number increases, the radial frequency of the square wave also increases. As a result, an image with a high number of axes has more high frequency content and its amplitude does not decrease with spatial frequency as fast as an image with fewer axes. Thus, it is likely that the observers preferred images with a shallow spectrum slope only because they have more axes.
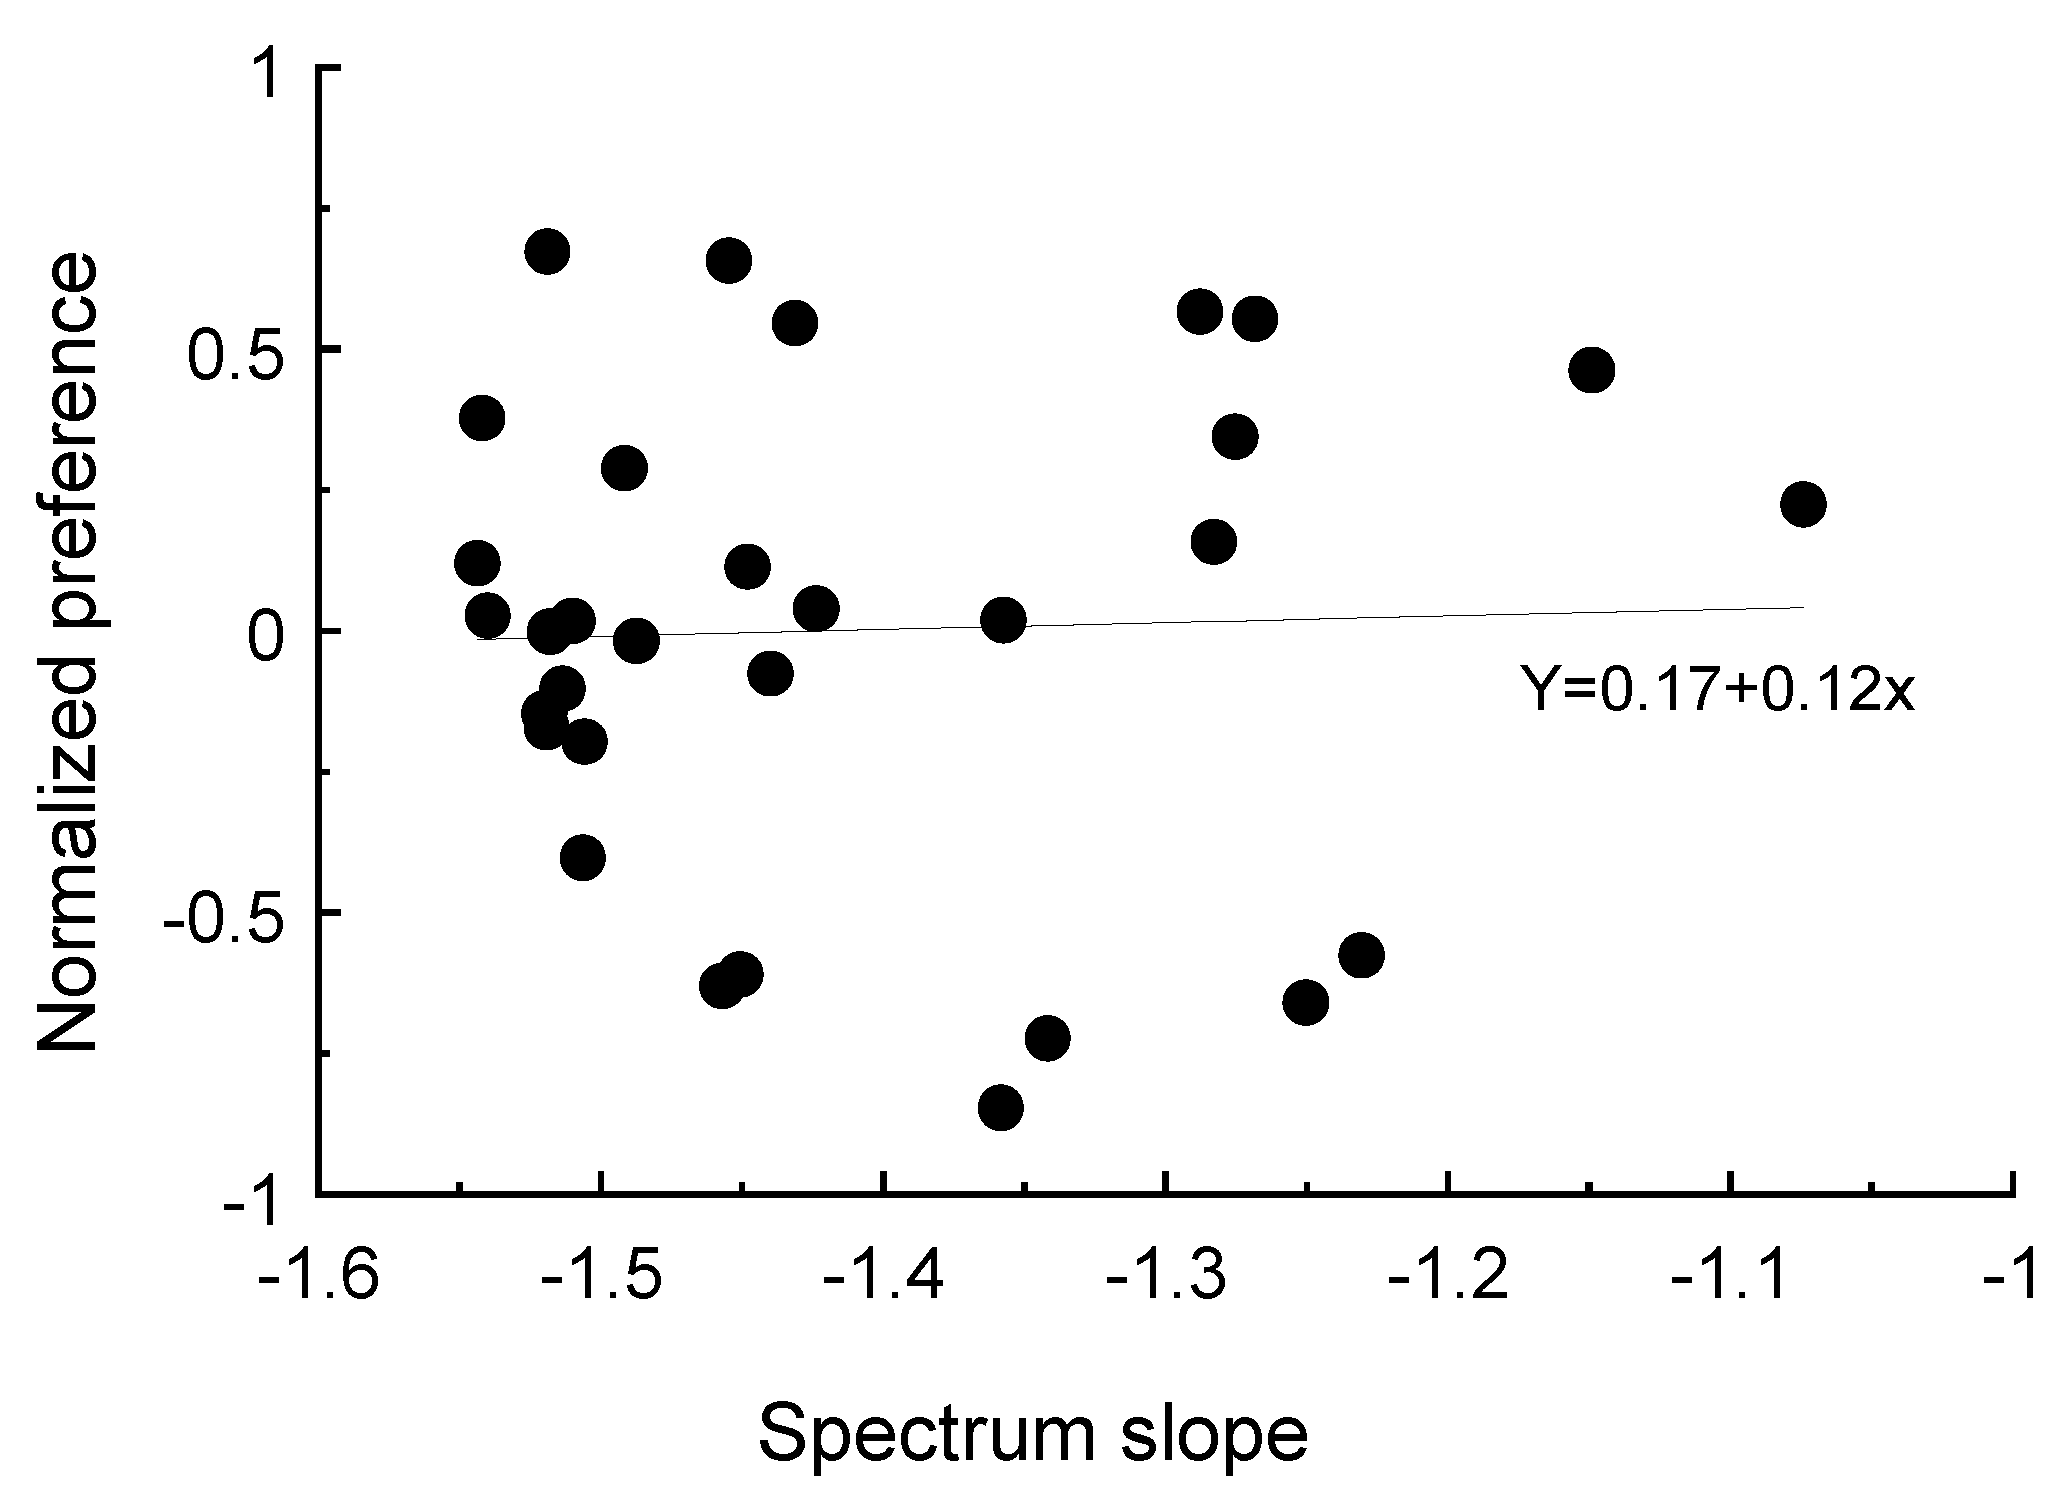
This point is clearer if we also consider the effect of stimulus type. Our result shows that preference can differ for various types of stimuli. Yet, since all our stimuli were derived from the same set of phase scrambled images, when the number of axes is the same there is no reason that the spectra for different types of stimuli would be different, except for some sampling variation. Therefore, at the same axis number, the spectrum slope may not be able to explain preference for different types of images. To test this hypothesis, we replotted the data in Figure 4, normalized by the mean preference at each axis number (Figure 6). Once the axis number effect was excluded, there was little correlation between preference and spectrum slope. A linear regression analysis showed that the slope parameter was not significant from zero (t(1) = 0.18, p = 0.88 > 0.05). In addition, the partial correlation between preference and spectrum slope was only 0.02 after the axis number effect was controlled. Therefore, it is obvious that spectrum slope cannot explain the stimulus type effect.
Next, we considered whether complexity reduction could account for preference. Complexity of an image is defined as the number of elements in that image [21]. In a symmetric image, one part of the image is a reflection of another part of the image about an axis. Each side of a symmetric axis contains the same information. Thus, a symmetric pattern is less complex than an asymmetric one. Similarly, in a two-axis symmetric pattern, one can infer the whole image from the information in just 1/4 of the image. Therefore, a two-axis symmetric pattern is less complex than a one-axis one, and so on and so forth. Thus, the complexity of an image reduces with axis number.
Here, we see a clear relationship between complexity and preference: as axis number increases, complexity decreases while preference increases. Thus, preference is inversely proportional to complexity. This relationship also exists for different types of stimuli. In a repetitive pattern, one part of the image is a copy of another across the axis. With the same number of axes, a repetitive pattern should have the same complexity as a symmetric pattern. This is consistent with our result that, at the same axis number, the preference rating for repetitive patterns was similar to that for symmetric patterns. An anti-symmetric pattern is quite similar to a symmetric pattern except that the two parts of the image are opposite in luminance contrast. That is, there is one extra transform for the anti-symmetric pattern across the axis. Hence, an anti-symmetric pattern should be slightly more complex than a symmetric pattern with the same number of axes. This is also consistent with our finding that preference is lower for anti-symmetric patterns than for symmetric patterns. Finally, an interleaved pattern has half of the pattern from a scrambled image with no meaningful structure. Hence, its complexity is greater than that of other types of patterns. As a result, the preference is lower for interleaved patterns than any other types. Therefore, complexity can account for the effect on preference of not only the axis number but also image type.
It is not yet clear why the reduction of complexity should make an image more appealing. One possible reason is that the reduction of complexity in the image also reduces the cognitive loading of the observer analyzing the image [21,42]. This would in turn reduce the arousal level of the observer, making the image more pleasant [43,44]. However, in order for this to work, the observer has to be able to pick up cues that the presented image is symmetric at the first glance, and then take advantage of the redundancy in the image before investing too much cognitive effort in analyzing it. Hence, it should be easier for an observer to tell the difference between an aesthetically preferred image and a non-preferred one from a random image. However, as discussed in the previous section, there is not always a correspondence between preference and detection performance.
The other possibility is that the reduction of complexity improves “goodness” of the image [45]. Since, in Gestalt theory, observers tend to organize visual elements by principles of goodness, a better image should be more easily picked up by the observer. However, there is also difficulty with this interpretation, due to the fact that there is not always a correspondence between preference and detection performance. In addition, while we found that preference increased with the tested number of axes, there may not be a monotonic relationship between goodness and the number of axes in multiple symmetric patterns [46].
Our interleaved patterns drew half of their pattern from a scrambled image while the other half contained repetitive copies of the same image slice. For instance, a 16-axis interleaved pattern would contain 32 slices (see Figure 1):16 slices that had no relationship to each other and 16 that were identical. Hence, there were unique image elements in half of the image plus a slice in an interleaved pattern. Thus, one would not expect preference for an interleaved pattern to exceed that for a 1-axis repetitive or symmetric pattern which had unique image elements in only half of the pattern. However, while this prediction holds for interleaved patterns with 8 axes or fewer, it is not true for the 16-axis interleaved patterns (Figure 3). Therefore, there may be other factors than complexity involved when there is an irregularity introduced to the image, as suggested by Boselie and Leeuwenberg [47].
5. Conclusion
In this study, we showed that observers always preferred symmetric patterns over scrambled images and that this preference increased with axis number. Where the number of axes was the same, preference for symmetric patterns was about the same as for repetitive patterns, but was slightly higher than for anti-symmetric patterns. Preference for the interleaved patterns was significantly less than for the symmetric, repetitive, and anti-symmetric patterns. Our result cannot be explained by the ecological significance of symmetry, because: (1) what observers prefer is symmetry per se, not symmetric objects; (2) the observers prefer patterns with a higher number of axes, even though their occurrence is more rare; and (3) observers also preferred repetitive and anti-symmetric patterns, which have no known ecological value. Spectrum slope, although it has an effect that is consistent with axis number, cannot explain the difference in preference between various stimulus types. Our result, however, is consistent with the notion that preference is inversely proportional to the complexity of an image.
Acknowledgement
Support by NSC 99-2410-H-002-081-MY3 to CCC.
References
- Morgan, M.H. Vitruvius: The Ten Books on Architecture, Translated by Morris Hicky Morgan; Harvard University Press: Cambridge, MA, USA, 1914. [Google Scholar]
- Ching, F.D.K. Architecture: Form, Space, and Order, 3rd ed.; Wiley: New York, NY, USA, 2007. [Google Scholar]
- van Tonder, G.J.; Lyons, M.J.; Ejima, Y. Perception psychology: Visual structure of a Japanese Zen Garden. Nature 2002, 419, 359–360. [Google Scholar] [CrossRef] [PubMed]
- Rhodes, G. The evolutionary psychology of facial beauty. Annu. Rev. Psychol. 2006, 57, 199–226. [Google Scholar] [CrossRef] [PubMed]
- Naini, F.B.; Gill, D.S. Facial aesthetics: 1. Concepts and canons. Dent. Update 2008, 35, 102–107. [Google Scholar] [CrossRef] [PubMed]
- Tovee, M.J.; Tasker, K.; Benson, P.J. Is symmetry a visual cue to attractiveness in the human female body? Evol. Hum. Behav. 2000, 21, 191–200. [Google Scholar] [CrossRef]
- Dissanayake, E. What Is Art for? University of Washington Press: Seattle, WA, USA, 1988. [Google Scholar]
- Pinker, S. How the Mind Works; W. W. Norton: New York, NY, USA, 1997. [Google Scholar]
- Tooby, J.; Cosmides, L. Does beauty build adapted minds? Toward an evolutionary theory of aesthetics, fiction and the arts. Substance 2001, 94/95, 6–27. [Google Scholar]
- Tyler, C.W. Theoretical issues in symmetry perception. Spat. Vis. 1994, 8, 383–391. [Google Scholar] [CrossRef] [PubMed]
- Moller, A.P. Female swallow preference for symmetrical male sexual ornaments. Nature 1992, 357, 238–240. [Google Scholar] [CrossRef] [PubMed]
- Brookes, M.; Pomiankowski, A. Symmetry is in the eye of the beholder. Trends Ecol. Evol. 1994, 9, 201–202. [Google Scholar] [CrossRef]
- Watson, P.J.; Thornhill, R. Fluctuating asymmetry and sexual selection. Trends Ecol. Evol. 1994, 9, 21–25. [Google Scholar] [CrossRef]
- Moller, A.P.; Thornhill, R. Bilateral symmetry and sexual selection: A meta-analysis. Am. Nat. 1998, 15, 174–192. [Google Scholar]
- Swaddle, J.P.; Cuthill, I.C. Preference for symmetric males by female zebra finches. Nature 1994, 367, 165–166. [Google Scholar] [CrossRef]
- Perrett, D.I.; Burt, D.M.; Penton-Voak, I.S.; Lee, K.J.; Rowland, D.A.; Edwards, R. Symmetry and human facial attractiveness. Evol. Hum. Behav. 1999, 20, 295–307. [Google Scholar] [CrossRef]
- Enquist, M.; Arak, A. Symmetry, beauty and evolution. Nature 1994, 372, 169–172. [Google Scholar] [CrossRef] [PubMed]
- Johnston, R.A. Female preference for symmetrical males as a by-product of selection for mate recognition. Nature 1994, 372, 172–175. [Google Scholar] [CrossRef] [PubMed]
- Day, H.I. Evaluations of subjective. Psychophys complexity, pleasingness and interestingness for a series of random polygons varying in complexity. Atten. Percept. Psychophys. 1967, 2, 281–286. [Google Scholar] [CrossRef]
- Vitz, P.C. Preference for different amounts of visual complexity. Behav. Sci. 1966, 11, 105–114. [Google Scholar] [CrossRef]
- Kaplan, R.; Kaplan, S. The Experience of Nature: A Psychological Perspective; Cambridge University Press: Cambridge, MA, USA, 1989. [Google Scholar]
- Reber, R.; Schwarz, N.; Winkielman, P. Processing fluency and aesthetic pleasure: Is beauty in the perceiver’s processing experience? Pers. Soc. Psychol. Rev. 2004, 8, 364–382. [Google Scholar] [CrossRef]
- Tolhurst, D.J.; Tadmor, Y.; Chao, T. The amplitude spectra of natural images. Ophthalmic Physiol. Opt. 1992, 12, 229–232. [Google Scholar] [CrossRef]
- Billock, V.A. Neural acclimation to 1/f spatial frequency spectra in natural images transduced by the human visual system. Phys. D 2001, 137, 379–391. [Google Scholar] [CrossRef]
- Field, D.J. Scale-Invariance and Self-Similar “Wavelet” Transforms: An Analysis of Natural Scenes and Mammalian Visual Systems. In Wavelets, Fractals and Fourier Transforms; Farge, M., Hunt, J., Vassilicos, J.C., Eds.; Oxford University Press: Oxford, UK, 1993. [Google Scholar]
- Graham, D.J.; Field, D.J. Statistical regularities of art images and natural scenes: Spectra, sparseness and nonlinearities. Spat. Vis. 2007, 21, 149–164. [Google Scholar] [CrossRef]
- Graham, D.J.; Field, D.J. Variations in intensity statistics for representational and abstract art, and for art from the Eastern and Western hemispheres. Perception 2008, 37, 1341–1352. [Google Scholar] [CrossRef] [PubMed]
- Wenderoth, P. The salience of vertical symmetry. Perception 1994, 23, 221–236. [Google Scholar] [CrossRef] [PubMed]
- Barlow, H.B.; Reeves, B.C. The versatility and absolute efficiency of detecting mirror symmetry in random dot displays. Vis. Res. 1979, 19, 783–793. [Google Scholar] [CrossRef]
- Chen, C.C.; Tyler, C.W. Symmetry: Modeling the effects of masking noise, axial cueing and salience. PLoS ONE 2010, 5. [Google Scholar] [CrossRef]
- Wagemans, J. Detection of visual symmetries. Spat. Vis. 1995, 9, 9–32. [Google Scholar] [CrossRef]
- Palmer, S.E.; Hemenway, K. Orientation and symmetry: Effects of multiple, rotational, and near symmetries. J. Exp. Psychol. Hum. Percept. Perform. 1978, 4, 691–702. [Google Scholar] [CrossRef] [PubMed]
- Wagemans, J.; van Gool, L.; Swinnen, V.; van Horebeek, J. Higher-order structure in regularity detection. Vis. Res. 1993, 33, 1067–1088. [Google Scholar] [CrossRef]
- Treder, M.S.; van der Vloed, G.; van der Helm, P.A. Interactions between constituent single symmetries in multiple symmetry. Atten. Percept. Psychophys. 2011, 73, 1487–1502. [Google Scholar] [CrossRef]
- Corballis, M.C.; Roldan, C.E. On the perception of symmetrical and repeated patterns. Percept. Psychophys. 1974, 16, 136–142. [Google Scholar] [CrossRef]
- Tyler, C.W.; Hardage, L. Mirror Symmetry Detection: Predominance of Second Order Pattern Processing Throughout the Visual Field. In Human Symmetry Perception and its Computational Analysis; Tyler, C.W., Ed.; VSP: Utrecht, The Netherlands, 1996; pp. 157–171. [Google Scholar]
- Saarinen, J.; Levi, D.M. Perception of mirror symmetry reveals long-range interactions between orientation-selective cortical filters. Neuroreport 2000, 11, 2133–2138. [Google Scholar] [CrossRef]
- Van der Zwan, R.; Badcock, D.R.; Parkin, B. Global form perception: Interactions between luminance and texture information. Aust. N. Z. J. Ophthalmol. 1999, 27, 268–270. [Google Scholar] [CrossRef] [PubMed]
- Mancini, S.; Sally, S.L.; Gurnsey, R. Detection of symmetry and anti-symmetry. Vis. Res. 2005, 45, 2145–2160. [Google Scholar] [CrossRef] [PubMed]
- Berlyne, D.E. Novelty, complexity, and hedonic value. Percept. Psychophys. 1970, 8, 279–286. [Google Scholar] [CrossRef]
- Park, J.; Shimojo, E.; Shimojo, S. Roles of familiarity and novelty in visual preference judgments are segregated across object categories. Proc. Natl. Acad. Sci. USA 2010, 107, 14552–14555. [Google Scholar] [CrossRef] [PubMed]
- Berlyne, D.E. Conflict, Arousal and Curiosity; McGraw-Hill: New York, NY, USA, 1960. [Google Scholar]
- Krupinski, E.; Locher, P. Skin conductance and aesthetic evaluative responses to nonrepresentational works of art varying in symmetry. Bull. Psychon. Soc. 1988, 26, 355–358. [Google Scholar] [CrossRef]
- Locher, P.; Nodine, C. The perceptual value of symmetry. Comput. Math. Appl. 1989, 17, 475–484. [Google Scholar] [CrossRef]
- Palmer, S.E. On Goodness, Gestalt, Groups, and Garner: Local Symmetry Subgroups as a Theory of Figural Goodness. In The Perception of Structure: Essays in Honor of Wendell R. Garner; Lockhead, G., Pomerantz, J., Eds.; American Psychological Association: Washington, DC, USA, 1991. [Google Scholar]
- van der Helm, P.A. The Influence of Perception on the Distribution of Multiple Symmetries in Nature and Art. Symmetry 2011, 3, 54–71. [Google Scholar] [CrossRef]
- Boselie, F.; Leeuwenberg, E.L.J. Birkhoff revisited: Beauty as a function of effect and means. Am. J. Psychol. 1985, 98, 1–39. [Google Scholar] [CrossRef] [PubMed]
Figure 1.
Examples of stimuli: (a) a phase scrambled image; (b) a symmetric pattern with four axes; (c) a repetitive pattern with eight axes; (d) An anti-symmetric pattern with 16 axes; (e) an interleaved pattern with four axes; and (f) point symmetry.
Figure 1.
Examples of stimuli: (a) a phase scrambled image; (b) a symmetric pattern with four axes; (c) a repetitive pattern with eight axes; (d) An anti-symmetric pattern with 16 axes; (e) an interleaved pattern with four axes; and (f) point symmetry.

Figure 2.
The preference rating for one- and two-axis patterns with different orientation offset. The first bar dashed line denotes the preference level for phase scrambled image. The second to the fifth bars denotes the preference level for the one-axis patterns and the sixth and seventh, the two-axis patterns. The error bar denotes 1 standard error of measurement.

Figure 3.
The preference rating for the symmetric (blue closed circles and solid lines), repetitive (Green open circles and dashed lines), anti-symmetric (red closed squares and dash-dot lines) and interleaved (open squares and solid lines) patterns. The cyan triangle denotes the preference rating for the point symmetry patterns. The dashed straight lines denote the preference level for phase scrambled image. The error bar denotes 1 standard error of measurement.

Figure 4.
The relationship between preference and spectrum slope. Each dot represents one type of pattern at one axis number. A linear regression analysis (R2 = 0.47) can account for this effect with preference = 9.52 + 4.5 × (spectrum slope).
Figure 4.
The relationship between preference and spectrum slope. Each dot represents one type of pattern at one axis number. A linear regression analysis (R2 = 0.47) can account for this effect with preference = 9.52 + 4.5 × (spectrum slope).

Figure 5.
Spectrum slope increases with axis number.

Figure 6.
The relationship between normalized preference and spectrum slope. Each dot represents one type of pattern at one axis number. Once the axis number effect is excluded, there is little correlation between preference and spectrum slope. The R2 for the linear regression analysis was only 0.01.

© 2011 by the authors; licensee MDPI, Basel, Switzerland. This article is an open access article distributed under the terms and conditions of the Creative Commons Attribution license (http://creativecommons.org/licenses/by/3.0/).
Share and Cite
MDPI and ACS Style
Chen, C.-C.; Wu, J.-H.; Wu, C.-C. Reduction of Image Complexity Explains Aesthetic Preference for Symmetry. Symmetry 2011, 3, 443-456. https://doi.org/10.3390/sym3030443
AMA Style
Chen C-C, Wu J-H, Wu C-C. Reduction of Image Complexity Explains Aesthetic Preference for Symmetry. Symmetry. 2011; 3(3):443-456. https://doi.org/10.3390/sym3030443
Chicago/Turabian StyleChen, Chien-Chung, Jo-Hsuan Wu, and Chia-Ching Wu. 2011. "Reduction of Image Complexity Explains Aesthetic Preference for Symmetry" Symmetry 3, no. 3: 443-456. https://doi.org/10.3390/sym3030443