Symmetry in the Language of Gene Expression: A Survey of Gene Promoter Networks in Multiple Bacterial Species and Non-σ Regulons

Department of Biological Sciences, Benedictine University, Lisle, IL 60532, USA
*
Author to whom correspondence should be addressed.
Symmetry 2011, 3(4), 750-766; https://doi.org/10.3390/sym3040750
Submission received: 5 September 2011
/
Revised: 8 October 2011
/
Accepted: 11 November 2011
/
Published: 18 November 2011
Abstract
:The language of gene expression displays topological symmetry. An important step during gene expression is the binding of transcriptional proteins to DNA promoters adjacent to a gene. Some proteins bind to many promoters in a genome, defining a regulon of genes wherein each promoter might vary in DNA sequence relative to the average consensus. Here we examine the linguistic organization of gene promoter networks, wherein each node in the network represents a promoter and links between nodes represent the extent of base pair-sharing. Prior work revealed a fractal nucleus in several σ-factor regulons from Escherichia coli. We extend these findings to show fractal nuclei in gene promoter networks from three bacterial species, E. coli, Bacillus subtilis, and Pseudomonas aeruginosa. We surveyed several non-σ transcription factors from these species and found that many contain a nucleus that is both visually and numerically fractal. Promoter footprint size scaled as a negative power-law with both information entropy and fractal dimension, while the latter two parameters scaled positively and linearly. The fractal dimension of the diffuse networks (dB = ~1.7) was close to that expected of a diffusion limited aggregation process, confirming prior predictions as to a possible mechanism for development of this structure.
1. Introduction
Genomes display symmetry on several levels of organization. On the most basic level, the DNA double helix is symmetric about its central axis [1]. There is also self-similarity distributed along the length of a DNA molecule as 1/f correlations and power-law scaling in nucleotide base composition and in the abundance of genome components including gene types [2,3,4,5,6,7]. Several studies now show a fractal organization of chromatin [8,9,10] and fractal folding and compaction of whole genomes [11]. In medicine, the fractal dimension of nuclear chromatin has been examined for the prognosis of cancer [12,13,14].
While many of these examples of symmetry derive from studies of structural genomics, others draw from functional genomics–cases in which genome behavior is symmetric as revealed by Gene Regulatory Networks (GRNs; [15,16,17]). In a GRN, nodes represent genes and arcs or arrows represent regulatory relationships between genes. Typically there are a few highly connected genes, or global regulators, that organize much of the transcription in a genome; most regulators control only one or a few genes. This highly skewed distribution of control linkages across genes tends to follow a power-law relationship [18,19], showing that there is symmetry in the rate at which regulatory work is partitioned across the genome.
These fractal genetic systems are embedded within other levels of self-similarity in living systems. Many cellular interaction networks also exhibit scale-free architectures including protein-protein interaction and metabolic networks [18,20,21,22,23]. There is fractal structure found at the level of tissue organization [24], as well as whole-organism physiology [25] and development [26], and there are patterns of allometric scaling that explain biological pattern ranging from biochemistry to ecosystem organization [27,28,29].
In the present study we consider symmetry at the interface between structural and functional genomics–at the DNA-protein binding event that initiates transcription. A critical stage of gene expression is the binding of RNA polymerase and its helper proteins during transcription [30]. Typically there is a promoter region slightly upstream of the transcription start site that is recognized by one or more regulatory proteins, or transcription factors; these proteins aid in the positioning and activation of RNA polymerase so that binding is both efficient and specific [31,32,33]. Many of the regulatory proteins are dimers and bind to symmetric palindromic sequences in the promoter region [30,34]. Some transcription factors bind to more than one place in the genome and some bind to hundreds–the latter being an example of a global regulator. These global regulators define a regulon of genes that may be turned on or off in concert in response to a given cellular need [33,35]. In bacteria, the sigma factors (σ) are important global regulators that mediate responses such as heat shock and nitrogen response.
Gene Promoter Networks (GPNs)–as opposed to Gene Regulatory Networks (GRNs)–are systems-level representations of the DNA-based language used to initiate gene expression [36]. More literally, a GPN is a network-based rendering of base pair-sharing among the promoter elements within a genome, typically promoters within a regulon. Consider the hypothetical GPN comprised of nodes A, B, and C. Each node represents a promoter sequence bound by the same DNA-binding protein. Links or edges form between nodes (promoters) in the GPN based on the number of base pairs shared by promoter pairs. For example, given promoters A (AATA), B (AATT), and C (GCTA), there would be the following weighted edges formed between node pairs: A – B (w = 3 base pairs), A – C (w = 2 bp), and B – C (w = 1 bp)(see Supplementary Figures).
GPN analysis was first applied to σ-factor regulons in the bacterium Escherichia coli [36]. The promoters in these GPNs displayed considerable sequence variation and were not well-represented by a single consensus motif. Given this, and that the regulons contained numerous promoters, the full GPNs were exceedingly dense and contained numerous weak links representing the sharing of few bases between promoters. In order to detect fine topological structure it was necessary to apply a thresholding method, removing a subset of the edges and retaining only those within a certain interval. Such thresholding is standard procedure in studies ranging from protein interaction networks [37] to neurological networks in the brain [38] and social networks [39]. The thresholding of the GPNs at the phase transition (break up of the giant component) revealed nuclei of high-weight edges that represented high bp-sharing among promoters. These GPN nuclei displayed a strong fractal structure [36]. In general, fractal structures display a self-similar symmetry across spatial scales [40], and the presence of a fractal core in the GNP suggested a self-organizing complexity interfacing the evolution of genome regulatory elements and the grammar of transcriptional regulation.
More recent work on GPNs [41] involved in silico simulations intended to identify mechanisms that could produce a fractal nucleus. Evolutionary factors that contributed to the development of fractal topology in modeled GPNs included promoter duplication and attractive forces arising from DNA-protein binding chemistry; repulsive forces due to binding chemistry were ruled out as unimportant under the conditions examined. However, random evolution of the promoter set introduces an intrinsic repulsion among promoters–in that most random promoters differ considerably in sequence composition from any optimal consensus promoter. These findings were notable since it is thought that repulsion is a critical causal agent in the development of fractality in most networks [42]. Collectively these patterns supported a weak version of the diffusion limited aggregation model first posed to explain the fractal nuclei in GPNs [36], positing that fractality arises by the random accretion of promoters around the periphery of a GPN, and repulsive forces increase the fractal signal.
These studies of GPNs prompt certain questions about the evolution of gene regulation. Why is it that a given protein regulator binds a multiplicity of promoter sequences in large regulons as opposed to one or a few sequences presenting an optimal binding chemistry? A partial answer is that suboptimal binding events present the opportunity to fine-tune gene expression using additional transcription factors that aid the binding, transcription factors that may be responsive to other conditions in the cell [30]. But is this selective advantage of flexibility the driving force of promoter evolution, or simply a response to a stochastically driven promoter evolution in which promoters blink on and off all across the genome? While it is likely that promoters arise by either random mutation or duplication events, it is unclear to what extent natural selection directly controls the frequency of promoters in a population or species. Instead of a presence/absence of a simple consensus promoter, it is likely we must consider the extended promoter phenotype that must be evaluated in the context of whether or not the cell can form an adequate transcription factor set that will facilitate RNA polymerase function. This loosens the selective forces on the promoter bases, and allows a more diffuse and random process of accretion into a GPN, compared to natural selection rigidly maintaining base composition near an optimal consensus sequence.
This plasticity of the language controlling gene expression, a lack of simple 1:1 mappings, is also found in human languages. While linguists [43] have held for some time that language must be functional but not overly rigid, recent studies [44,45] suggest that human languages emerge abruptly at the phase transition between referentially useless systems and overly indexed systems. Here the explanation entails consideration of the balance between the opposing interests of the listener and the speaker in a communicative exchange. The listener attempts to get as much information as possible, which is best achieved when there is a 1:1 mapping between words and objects. The approach employs mutual information, a metric from Shannon’s information theory [46], to measure this mapping. By contrast, the speaker seeks to minimize his effort in forming sentences, which is more difficult to do when there are many words to choose from. Here, information entropy can be used to quantify the lexical diversity. Large studies of semantic networks [47] support this view of language evolution by showing that synonym sets display some of the topological features we have found in bacterial gene regulatory systems.
Our current work tests the generality of prior findings on fractality in GPNs, and evaluates pattern within the context of information theory. Specifically we address the following: (a) Do other regulons (other than σ-factors) contain fractal nuclei in their GPNs? (b) Do other species (other than E. coli) contain fractal nuclei in their GPNs? (c) Is there a quantitative relationship between information entropy of the promoter signals in a regulon and the fractal dimension of a GPN nucleus? Do these factors co-vary with promoter footprint size? (d) In addition to addressing these questions, we offer greater detail in the methods used to study GPNs in this fashion (see Supplementary Information).
2. Materials and Methods
2.1. Predicted Promoters
Promoter sequences were obtained from Virtual Footprint [48,49] which offers promoter prediction tools that interface with several prokaryotic genome libraries including Prodoric [48] and RegulonDB [50]. We used the Regulon Analysis option, downloading several non-σ factor predictions for Escherichia coli (strain K12), Bacillus subtilis (strain 168), and Pseudomonas aeruginosa (strain ATCC 15692/PAO1). Default settings were used, though sensitivities were varied (0.5–1.0). The single pattern option (rather than bipartite) was used yielding single block promoter footprints (~10–20 bp) without a spacer. Alignments used were as provided by Virtual Footprint. Regulons were sampled haphazardly with a preference for those that included >100 genes and exhibited some type of visually non-random structure.
2.2. GPNs and Thresholding
Perl script was used to extract and process promoter sequence information from the Virtual Footprint flat files. Pairwise similarities between promoter sequences i and j (Aij) were evaluated as the number of bp shared. These weighted edge values were used to form the adjacency matrix, A. A network or graph G was generated based on the matrix A (see Supplementary Figure 1). Networks were visualized using Pajek [51,52], a program used to work with large networks. Projections were rendered with the Kamada and Kawai [53] algorithm.
Thresholding was achieved through serial x-sections [39] in which only edges with value x are retained, all others are removed (see Supplementary Figure 1). For our purposes x was a positive integer no larger than F (footprint size). Separate subgraphs (G’) were formed from the total graph (G) based on a sliding x-threshold (see Supplementary Figure 2). In each subgraph, the largest connected component was extracted from G and evaluated for the number of nodes (graph size) and number of edges. The largest (maximal) connected component (LCC) is the subgraph G’ containing all nodes still interconnected in the largest group after removal of edges not meeting the threshold criterion. An LCC is a giant component when it contains at least half the nodes present in the full graph G. Note that for these regulons taking m-slices (retaining edges above a certain threshold) at the upper phase transition returned comparable LCC sizes (node counts) as did x-sections, so we somewhat arbitrarily chose to report x-sections.
We report the LCC at the upper phase transition of these serial extractions. The phase transition in graph size occurs around the threshold that fractures the giant component into numerous smaller connected components (see Supplementary Figure 2).
2.3. Assessment of Fractal Structure
Python script was written to implement the renormalization method of Song et al. [54,55] and evaluate the fractal dimension of the LCCs extracted from the GPNs. The program utilized NetworkX [56,57], an open source Python package for the analysis of complex networks. The renormalization method is a graph coloring exercise founded on the traditional box-covering method of fractal measurement. In brief, for a given box length (lB), or shortest path length between nodes, each node is colored in a fashion such that neighbors of like color are no further away than the current box length. Then the network is renormalized by collapsing adjacent nodes into a single node if they share the same color (see Supplementary Figure 3). This enforces the graph coloring rule that no two adjacent nodes can share the same color. The value NB then gives the minimum number of boxes of length lB required to cover the graph of NB nodes, and is equal to the graph size (node count) following renormalization. Considering a range of box lengths, a plot of lB versus NB on a log-log scale will be linear for networks with a fractal topology (see Supplementary Figure 3). On a normalized series of graphs with minimum size N, the fractal dimension dB is obtained from linear regression of the log-log transformation of the general scaling relation:
The coefficient of determination (R2d) was used to assess the fit of the renormalization data to this fractal model.
2.4. Information Entropy
Base conservation was evaluated using Shannon’s information entropy [36] as described for DNA sequences [58,59]:
where H(l) is the entropy or the amount of uncertainty regarding base composition (b: A, C, G, T) at position l in the promoter sequence. The frequency of each base at position l is denoted by pb,l and is calculated across the set of promoter sequences within a GPN or regulon. RSequence represents the amount of information present at position l, and is calculated as the observed uncertainty minus the maximum possible uncertainty (2) under a 2-bit system:
In our analyses, the value IRMean denotes the arithmetic mean of RSequence(l) across the l positions in the promoter footprint. We used the entropy calculator from the HCV database website [60] maintained by the Los Alamos National Laboratory to obtain summary estimates of RSequence for each regulon, and WebLogo [61] to obtain figures of the sequence logos [59].
2.5. Footprint Size, Information Entropy, and Fractal Dimension
We explored the correspondence between footprint size (F), information entropy (IRMean), and fractal dimension (dB) using regression. MATLAB (The MathWorks Inc., Natick, MA, USA) was used to fit the linear model Y = βX + A + ε in which x and y were the independent and dependent variables, respectively. All three pair-wise relationships were explored, separately, given the three parameters F, IRMean, and dB. We examined relationships in which neither variable was transformed and in which both variables were log10-transformed; a linear fit in the latter circumstance indicates a power-law relationship, and this type of association has been found among numerous genome properties [4]. The fit was judged by the coefficient of determination (R2), and the corresponding correlation coefficient (r) is also reported.
3. Results
3.1. Visual Pattern
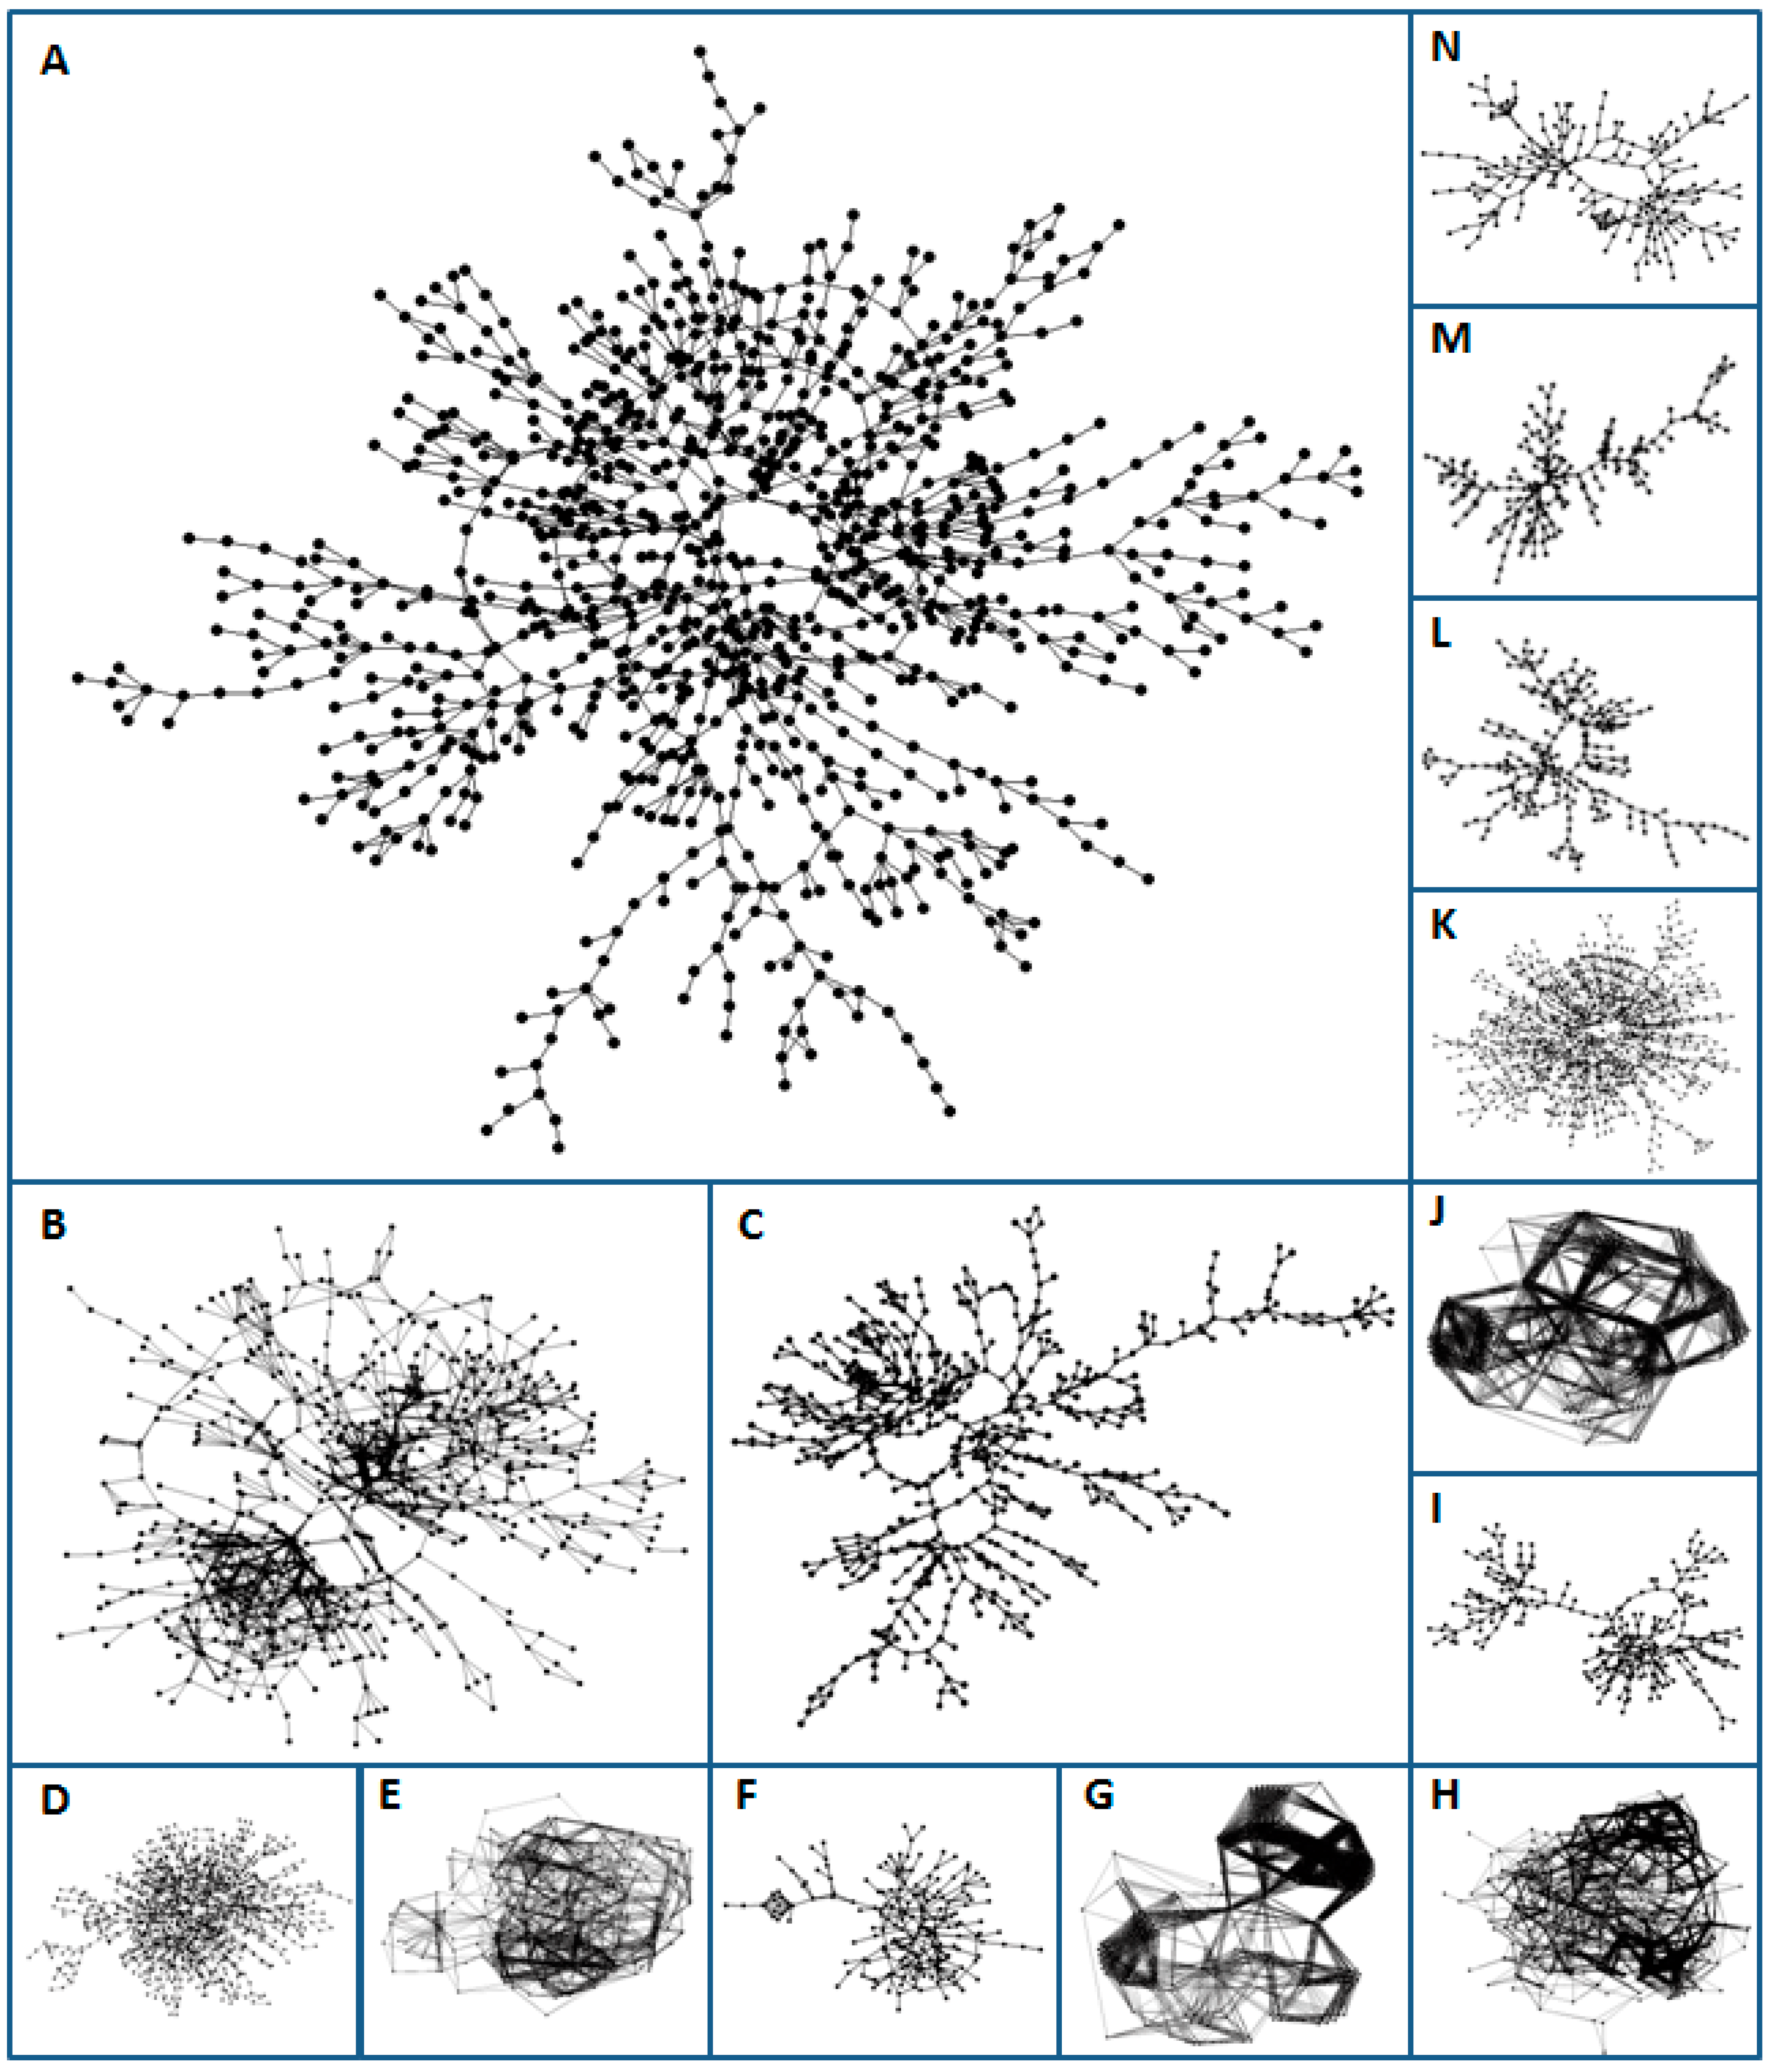
Symmetric patterns were visually evident at upper phase transitions in several of the GPNs studied (Figure 1). There were other GPNs that showed no obvious visual structure and we do not consider these any further in the present study. The type of symmetry varied across GPNs. Several of the large networks (containing many nodes) displayed radial symmetry around an open center (e.g., Figure 1A, K). Others, typically smaller GPNs, displayed bilateral symmetry along a linear axis (e.g., Figure 1L, M), while some showed a combination of bilateral and radial symmetry (e.g., Figure 1I, N). A few of the GPNs were very dense with numerous links between closely related node pairs (e.g., Figure 1G, J).
3.2. Fractal Dimensions
Most of the GPN x-sections taken from phase transitions exhibited a strong self-similarity as measured by the method of Song et al. [55], as seen in the fractal dimension (dB, Table 1). The average fractal dimension was dB = 2.118. The lowest observed was dB = 1.534 (Figure 1M) for a long linear symmetry; the highest observed was dB = 3.415 (Figure 1J) for a highly dense network. The fit of the fractal relationship was generally high for these (R2d = 0.906–0.978).
3.3. Footprint Symmetry and Information Entropy
Many of the promoter binding sites displayed palindromic symmetry. Some were mirror palindromes such as 5’-TAAAT-3’ (Figure 2A, Pvds), and some were inverted repeats (Figure 2N; Crp), such as the sequence 5’-GTGA(n6)TCAC-3’ and complementary strand 3’-CACT(n6)AGTG-5’.
The promoter sequences were highly variable and departed from the consensus sequence considerably in many but not all regulons. Sequence-level information, IRMean, ranged between 0.927 (Fur) and 1.557 (−35 box of AlgU).
3.4. Scaling of Footprint Size, Information (IRMean), and Fractal Dimension
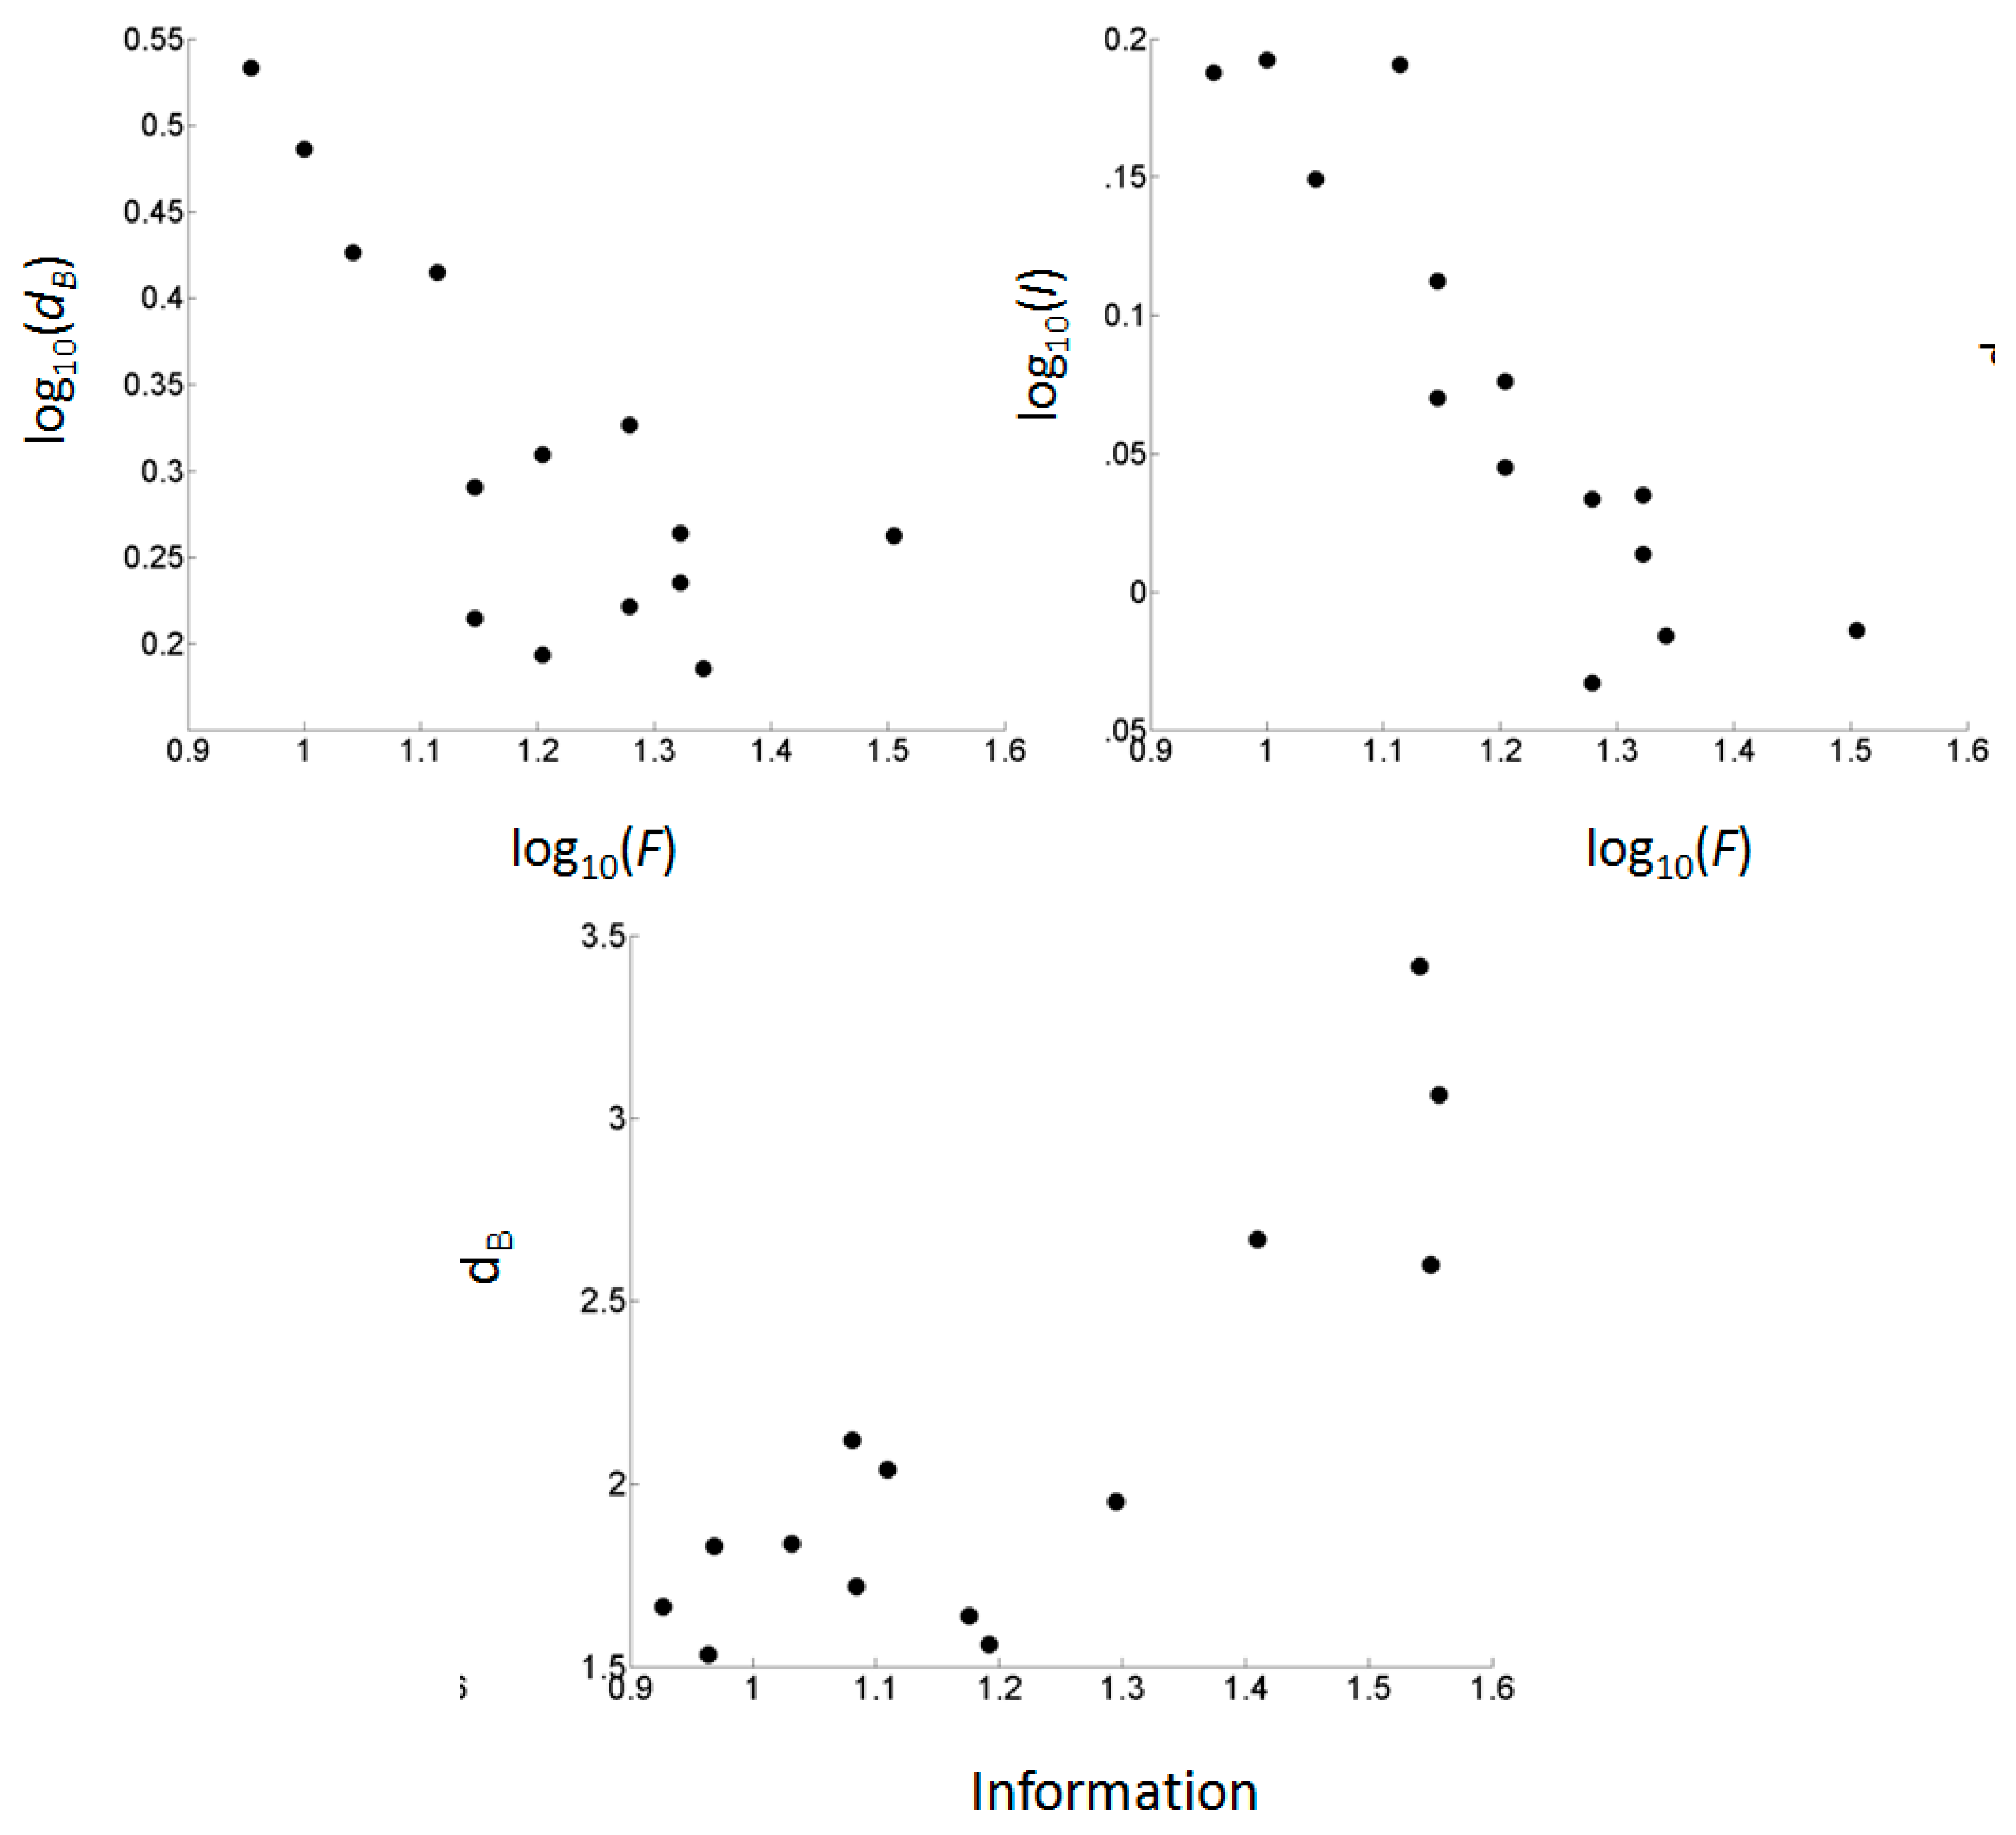
Fractal dimension (dB) scaled negatively with footprint size (F) (Figure 2 and Figure 3; Table 2). The power-law relationship (log-log transformation) was strongest (R2 = 0.569) and significant (P = 0.002). The relation can be seen in Figure 2 in that the sequences near the base are generally longer than near the top. The smallest footprints ranged in size from 9–13 bp and displayed the highest fractal dimensions (group mean dB = 2.937), and these were topologically densest, containing numerous edges between very similar promoters (Figure 1). This contrasted with the larger footprint GPNs which generally had lower fractal dimensions (group mean dB = 1.790) and a greater likelihood of visually evident bilateral or radial symmetry.
Information entropy (IRMean) also scaled negatively with footprint size (Figure 2 and Figure 3; Table 2). Again, the power-law relationship gave the best and significant fit (R2 = 0.795; P = 0.001). The relationship can be seen in Figure 2 whereby the smaller promoter motifs tend to have greater sequence conservation overall.
4. Discussion
Our findings demonstrate that a fractal symmetry is present in the nucleus of GPNs of bacteria including but not limited to E. coli. We have expanded the scope of the first study of E. coli GPNs [36] to include two other species, B. subtilis and P. aeruginosa. This taxonomic coverage spans considerable diversity within the bacteria. Bacillus represents the phylum Firmicutes whereas both Escherichia and Pseudomonas are in the Proteobacteria, each representing orders Enterobacteriales and Pseudomonadales, respectively [62].
Our results also show that fractal organization is not limited to the σ-factors. Several, though not all, of the GPNs we examined displayed strong visual self-similar structure including bilateral and radial symmetry, and these displayed a good fit to the power-law relation expected for fractal networks [54,55]. It should be noted, though, that ours was not a quantitative survey across all regulons available through the Virtual Footprint database. A principle challenge to estimating the frequency of fractal nuclei relates to the fact that the algorithm used by the Virtual Footprint site to detect promoters is adjustable by sensitivity. This is a desirable property given the complexity of transcription [33,63], but it leads to a variety of possible GPN outcomes for any given regulon defined by a DNA-binding protein. Thus, we took it as our task simply to determine if fractal nuclei are present beyond the domain of the original study [36], outside of the E. coli σ-factor system.
On a very general level, fewer than half of the regulons considered showed visually obvious fractal structure in the LCC taken from the upper phase transition of their GPN (we have not shown all of them here). Yet, it is not clear that different processes are necessarily at play in the fractal versus non-fractal GPNs since many of the regulons lacking an obvious visual symmetry contained fairly few promoters to begin with, and network size poses an inherent constraint on fractal complexity. Our results are in keeping with the first study [36] which was small in scope but found that several but not all (3 of 4) of the σ-factor regulons had a fractal nucleus.
The data on the fourteen fractal nuclei revealed several scaling relationships which offer insights into dynamics that might yield symmetry in the grammar of transcription. Although further research is warranted, some reasonable patterns emerged. Footprint sizes of the DNA-binding proteins scaled negatively as a power-law with both fractal dimension and information, and the latter two attributes scaled directly and positively.
The scaling of footprint with information shows that small footprints exhibit more sequence conservation and so are more likely to be uniformly constrained by natural selection. Larger footprints often contain spacer regions in which DNA base composition varies more widely across promoters compared to the distal portions of the footprint. Indeed, the promoter data used in the first study of σ-factors [36] had been provided by RegulonDB [50] as a two block footprint with spacer size information. Putative spacer regions are evident in sequence logos of several of the larger regulons shown in Figure 2. Bases in these spacer regions might be constrained by natural selection though perhaps under diversifying selection in which some promoters within a regulon demand one base at a given position while other promoters within the regulon require another base. It also is likely that some of these bases are free to vary and are neutral to selection. Given that the DNA double helix undergoes a complete turn in roughly ten base pairs [1], it is noteworthy that many of the conserved sites in Figure 2 are separated by spacers of ten or twenty bases (one or two full turns around the double helix), suggesting that the binding sites occur on the same side of the DNA. Such patterns have been noted in other DNA-protein binding studies [58,64,65] and argue that the spacer positions may be less accessible to the binding of the protein.
The fractal dimensions of the GPN nuclei had a significant negative power-law correspondence with footprint size and a simple linear scaling with information. Before addressing these relationships it is perhaps useful to consider in greater detail what fractal dimension means in this context.
In general, fractal dimension gives a quantitative measure of self-similarity, that is, how many smaller parts are revealed as one rescales the graininess or magnification with which an object is viewed [66]. In the method we used to appraise fractal dimension [55], the fractal scaling coefficient (dB) implies the rate at which the network changes in size (log10 of the number of nodes) with each change of box length (log10 of the relevant scale in number of edges). Thus a GPN with dB = 3.0 (i.e., line with slope = −3.0) drops in size much more quickly as box length is increased compared to one with dB = 2.0. Those with dB = 3.0 (e.g., Figure 1G and J) contain dense groups of highly related promoters, and on renormalization the size of the groups changes rapidly whereas change on renormalization is more gradual for the GPNs with dB = 2.0 (e.g., Figure 1A).
The fractal dimension gives us some indication of how rapidly mappings amplify or condense at the phase transition x-section. We focused on the x-section positioned at the phase transition which is the part of the sectional series at which the giant component experiences the greatest change in size (number of nodes). If there is a correspondence between human language and cellular DNA-based communication, this phase transition represents the point at which mappings between symbols and objects changes from overly general (many diffuse connections) to overly specific (few but specific connections).
Promoters with small footprints are generally highly conserved in their sequence and their GPNs scale rapidly under renormalization during the fractal analysis. This is because there are numerous connections amongst highly related promoters in these higher x-sections, and renormalizing across larger and larger scales (number of edge steps between promoter nodes in a GPN) serves to collapse the graph rapidly (see Supplementary Figures) resulting in a higher scaling exponent. For regulons involving promoters with a larger footprint, these tend to be less conserved in their sequence. Thus each promoter node is connected to fewer other nodes of high sequence similarity in these higher x-sections, and renormalization collapses the network more slowly, leading to a smaller scaling exponent; these GPNs are more diffuse and spread out, yet fractal nonetheless.
5. Conclusion
The fractal symmetry of these bacterial GPNs supports the view that natural communicative systems emerge as a self-organizing form of complexity. For some time it has been known that DNA contains a self-similarity [3,5] comparable to Zipf’s scaling law first observed in human textual corpora [67]. And there is continued interest in understanding functional aspects of self-organizing complexity as it pertains to behavior in the cell and the genome [68,69,70,71]. In the present study we have probed the generality of the observation that there exists a symmetric interface between the signals used to initiate gene expression. The GPN permits visualization of this grammatical context of transcription events within a regulon. Linguists have found with human language that words are embedded within a wider context of usages which support and give form to meanings [43,44], and in bacterial gene regulation this contextual framework is also present, symmetric, and self-organizing.
Acknowledgments
We thank two anonymous reviewers for valuable comments, Virtual Footprint, Prodoric, and RegulonDB for use of their promoter databases, Benedictine University for support of the work, J. Nadolski for comments, and Y. Ahmed for assistance in portions of this study.
References
- Watson, J.D.; Crick, F.H.C. A Structure for Deoxyribose Nucleic Acid. Nature 1953, 171, 737–738. [Google Scholar] [CrossRef] [PubMed]
- Li, W.; Marr, T.G.; Kaneko, K. Understanding long-range correlations in DNA sequences. Phys. D: Nonlinear Phenom. 1994, 75, 392–416. [Google Scholar] [CrossRef]
- Mantegna, R.N.; Buldyrev, S.V.; Goldberger, A.L.; Havlin, S.; Peng, C.; Simons, M.; Stanley, H.E. Linguistic features of noncoding DNA sequences. Phys. Rev. Lett. 1994, 73, 3169–3172. [Google Scholar] [CrossRef]
- Luscombe, N.M.; Qian, J.; Zhang, Z.; Johnson, T.; Gerstein, M. The dominance of the population by a selected few: Power-law behavior applies to a wide variety of genomic properties. Genome Biol. 2002, 3, research0040.1–research0040.7. [Google Scholar] [CrossRef] [PubMed]
- Li, W. Features, patterns, correlations in DNA and protein texts. Available online: http://www.nslij-genetics.org/dnacorr/ (accessed on 11 November 2011).
- Molina, N.; Van Nimwegen, E. Scaling laws in functional genome content across prokaryotic clades and lifestyles. Trends Genet. 2009, 25, 243–247. [Google Scholar] [CrossRef]
- Van Nimwegen, E. Scaling laws in the functional content of genomes. Trends Genet. 2003, 19, 479–484. [Google Scholar] [CrossRef]
- Cattani, C. Fractals and hidden symmetries in DNA. Math. Probl. Eng. 2010, 2010, 507056. [Google Scholar] [CrossRef]
- Lebedeva, D.V.; Filatova, M.V.; Kuklinb, A.I.; Islamovb, A.K.; Kentzingerc, E.; Pantinaa, R.; Toperverga, B.P.; Isaev-Ivanova, V.V. Fractal nature of chromatin organization in interphase chicken erythrocyte nuclei: DNA structure exhibits biphasic fractal properties. FEBS Lett. 2005, 579, 1465–1468. [Google Scholar] [CrossRef] [PubMed]
- Lebedev, D.V.; Filatov, M.V.; Kuklin, A.I.; Islamov, A.K.; Stellbrink, J.; Pantina, R.A.; Denisov, Y.Y.; Toperverg, B.P.; Isaev-Ivanov, V.V. Structural hierarchy of chromatin in chicken erythrocyte nuclei based on small-angle neutron scattering: Fractal nature of the large-scale chromatin organization. Crystallogr. Rep. 2008, 53, 110–115. [Google Scholar] [CrossRef]
- Lieberman-Aiden, E.; van Berkum, N.L.; Williams, L.; Imakaev, M.; Ragoczy, T.; Telling, A.; Amit, I.; Lajoie, B.R.; Sabo, P.J.; Dorschner, M.O.; et al. Comprehensive mapping of long-range interactions reveals folding principles of the human genome. Science 2009, 326, 289–293. [Google Scholar] [CrossRef] [PubMed]
- Adam, R.L.; Silvab, R.C.; Pereira, F.G.; Leite, N.J.; Lorand-Metze, I.; Metze, K. The fractal dimension of nuclear chromatin as a prognostic factor in acute precursor B lymphoblastic leukemia. Cell. Oncol. 2006, 28, 55–59. [Google Scholar] [PubMed]
- Bedin, V.; Adam, R.L.; de Sá, B.C.S.; Landman, G.; Metze, K. Fractal dimension of chromatin is an independent prognostic factor for survival in melanoma. BMC Cancer 2010, 10. [Google Scholar] [CrossRef] [PubMed]
- Ferro, D.P.; Falconi, M.A.; Adam, R.L.; Ortega, M.M.; Lima, C.P.; de Souza, C.A.; Lorand-Metze, I.; Metze, K. Fractal characteristics of May-Grunwald-Giemsa stained chromatin are independent prognostic factors for survival in multiple myeloma. PLoS One 2011, 6. [Google Scholar] [CrossRef] [PubMed]
- Kauffman, S. The Origins of Order: Self-Organization and Selection in Evolution; Oxford University Press: New York, NY, USA, 1993. [Google Scholar]
- Davidson, E.; Levin, M. Gene regulatory networks. Proc. Natl. Acad. Sci. USA 2005, 102, 4935. [Google Scholar] [CrossRef] [PubMed]
- Karlebach, G.; Shamir, R. Modelling and analysis of gene regulatory networks. Nat. Rev. Mol. Cell Biol. 2008, 9, 770–780. [Google Scholar] [CrossRef] [PubMed]
- Barabasi, A.-L.; Oltvai, Z. Network biology: Understanding the cell’s functional organization. Nat. Rev. Genet. 2004, 5, 101–113. [Google Scholar] [CrossRef] [PubMed]
- Babu, M.M.; Luscombe, N.M.; Aravind, L.; Gerstein, M.; Teichmann, S.A. Structure and evolution of transcriptional regulatory networks. Curr. Opin. Struct. Biol. 2004, 14, 283–291. [Google Scholar] [CrossRef] [PubMed]
- Barabasi, A.-L.; Albert, R. Emergence of scaling in random networks. Science 1999, 286, 509–512. [Google Scholar]
- Jeong, H.; Tombor, B.; Albert, R.; Oltvai, Z.N.; Barabási, A.-L. The large-scale organization of metabolic networks. Nature 2000, 407, 651–654. [Google Scholar] [CrossRef]
- Giot, L.; Bader, J.S.; Brouwer, C.; Chaudhuri, A.; Kuang, B.; Li, Y.; Hao, Y.L.; Ooi, C.E.; Godwin, B.; Vitols, E.; et al. A protein interaction map of Drosophila melanogaster. Science 2003, 302, 1727–1736. [Google Scholar] [CrossRef]
- Yook, S.H.; Oltvai, Z.N.; Barabasi, A.-L. Functional and topological characterization of protein interaction networks. Proteomics 2004, 4, 928–942. [Google Scholar] [CrossRef] [PubMed]
- Rocha, L.B.; Adam, R.L.; Leite, N.J.; Metze, K.; Rossi, M.A. Shannon’s entropy and fractal dimension provide an objective account of bone tissue organization during calvarial bone regeneration. Microsc. Res. Tech. 2008, 71, 619–625. [Google Scholar] [CrossRef] [PubMed]
- Goldberger, A.L.; Amaral, L.A.N.; Hausdorff, J.M.; Ivanov, P.Ch.; Peng, C.-K.; Stanley, H.E. Fractal dynamics in physiology: Alterations with disease and aging. Proc. Natl. Acad. Sci. USA 2002, 99, 2466–2472. [Google Scholar] [CrossRef] [PubMed]
- Galvão, V.; Mirandab, J.G.V.; Andradeb, R.F.S.; Andrade, J.S., Jr.; Gallose, L.K.; Maksee, H.A. Modularity map of the network of human cell differentiation. Proc. Natl. Acad. Sci. USA 2010, 107, 5750–5755. [Google Scholar] [CrossRef] [PubMed]
- West, G.B.; Woodruff, W.H.; Brown, J.H. Allometric scaling of metabolic rate from molecules and mitochondria to cells and mammals. Proc. Natl. Acad. Sci. USA 2002, 99, 2473–2478. [Google Scholar] [CrossRef] [PubMed]
- West, G.B.; Brown, J.H. The origin of allometric scaling laws in biology from genomes to ecosystems: towards a quantitative unifying theory of biological structure and organization. J. Exp. Biol. 2005, 208, 1575–1592. [Google Scholar] [CrossRef] [PubMed]
- Savage, V.M.; Allen, A.P.; Brown, J.H.; Gillooly, J.F.; Herman, A.B.; Woodruff, W.H.; West, G.B. Scaling of number, size, and metabolic rate of cells with body size in mammals. Proc. Natl. Acad. Sci. USA 2007, 104, 4718–4723. [Google Scholar] [CrossRef]
- Weaver, R. Molecular Biology, 4th ed.; McGraw-Hill: Boston, MA, USA, 2007. [Google Scholar]
- Collado-Vides, J. Grammatical model of the regulation of gene expression. Proc. Natl. Acad. Sci. USA 1992, 89, 9405–9409. [Google Scholar] [CrossRef]
- Hawley, D.; McClure, W. Compilation and analysis of Escherichia coli promoter DNA sequences. Nucleic Acids Res. 1983, 11, 2237–2255. [Google Scholar] [CrossRef]
- Huerta, A.; Collado-Vides, J. Sigma70 promoters in Escherichia coli: Specific transcription in dense regions of overlapping promoter-like signals. J. Mol. Biol. 2003, 333, 261–278. [Google Scholar] [CrossRef]
- Lu, L.; Jia, H.; Dröge, P.; Li, J. The human genome-wide distribution of DNA palindromes. Funct. Integr. Genomics 2007, 7, 221–227. [Google Scholar] [CrossRef] [PubMed]
- Janga, S.C.; Collado-Vides, J. Structure and evolution of gene regulatory networks in microbial genomes. Res. Microbiol 2007, 158, 787–794. [Google Scholar] [CrossRef] [PubMed]
- Aldrich, P.R.; Horsley, R.K.; Ahmed, Y.A.; Williamson, J.J.; Turcic, S.M. Fractal topology of gene promoter networks at phase transitions. Gene Reg. Syst. Biol. 2010, 4, 75–82. [Google Scholar] [CrossRef]
- Vallabhajosyula, R.R.; Chakravarti, D.; Lutfeali, S.; Ray, A.; Raval, A. Identifying hubs in protein interaction networks. PLoS One 2009, 4. [Google Scholar] [CrossRef] [PubMed]
- Supekar, K.; Menon, V.; Rubin, D.; Musen, M.; Greicius, M.D. Network analysis of intrinsic functional brain connectivity in Alzheimer’s disease. PLoS Comput. Biol. 2008, 4. [Google Scholar] [CrossRef] [PubMed]
- de Nooy, W.; Mrvar, A.; Batagelj, V. Exploratory Social Network Analysis with Pajek; Cambridge University Press: Cambridge, UK, 2005. [Google Scholar]
- Mandelbrot, B.B. The Fractal Geometry of Nature; W.H. Freeman: San Francisco, CA, USA, 1983. [Google Scholar]
- Aldrich, P.R. Diffusion limited aggregation and the fractal evolution of gene promoter networks. Netw. Biol. 2011, 1, 99–111. [Google Scholar]
- Song, C.; Havlin, S.; Makse, H.A. Origins of fractality in the growth of complex networks. Nat. Phys. 2006, 2, 275–281. [Google Scholar] [CrossRef]
- Wittgenstein, L. Philosophical Investigations, Translated by G.E.M. Anscombe, 3rd ed.; MacMillan Publishing Co.: New York, NY, USA, 1958. [Google Scholar]
- Ferrer i Cancho, R.; Solé, R.V. Least effort and the origins of scaling in human language. Proc. Natl. Acad. Sci. USA 2003, 100, 788–791. [Google Scholar] [CrossRef]
- Ferrer i Cancho, R. Zipf’s law from a communicative phase transition. Eur. Phys. J. B 2005, 47, 449–457. [Google Scholar] [CrossRef]
- Shannon, C.E.A. Mathematical Theory of Communication. Bell Syst. Tech. J. 1948, 27, 379–423, 623–656. [Google Scholar] [CrossRef]
- Steyvers, M.; Tenenbaum, J. The large-scale structure of semantic networks: Statistical analyses and a model of semantic growth. Cogn. Sci. 2005, 29, 41–78. [Google Scholar] [CrossRef] [PubMed]
- Münch, R.; Hiller, K.; Grote, A.; Scheer, M.; Klein, J.; Schobert, M.; Jahn, D. Virtual Footprint and PRODORIC: An integrative framework for regulon prediction in prokaryotes. Bioinformatics 2005, 21, 4187–4189. [Google Scholar] [CrossRef] [PubMed]
- Münch, R.; Hiller, K.; Barg, H.; Heldt, D.; Linz, S.; Wingender, E.; Jahn, D. Prodoric Database. 2003. Available online: http://prodoric.tu-bs.de/ (accessed on 11 November 2011).
- Gama-Castro, S.; Jiménez-Jacinto, V.; Peralta-Gil, M.; Santos-Zavaleta, A.; Peñaloza-Spinola, M.I.; Contreras-Moreira, B.; Segura-Salazar, J.; Muñiz-Rascado, L.; Martínez-Flores, I.; Salgado, H.; et al. RegulonDB (version 6.0): Gene regulation model of Escherichia coli K-12 beyond transcription, active (experimental) annotated promoters and Textpresso navigation. Nucleic Acids Res. 2008, 36, D120–D124. [Google Scholar] [CrossRef] [PubMed]
- Batagelj, V.; Mrvar, A. Pajek – program for large network analysis. Connections 1998, 21, 47–57. [Google Scholar]
- Batagelj, V.; Mrvar, A. Networks/Pajek. Available online: http://vlado.fmf.uni-lj.si/pub/networks/pajek/. (accessed on 11 November 2011).
- Kamada, T.; Kawai, S. An algorithm for drawing general undirected graphs. Inf. Process. Lett. 1989, 31, 7–15. [Google Scholar] [CrossRef]
- Song, C.; Havlin, S.; Makse, H.A. Self-similarity of complex networks. Nature 2005, 433, 392–395. [Google Scholar] [CrossRef] [PubMed]
- Song, C.; Gallos, L.K.; Havlin, S.; Makse, H.A. How to calculate the fractal dimension of a complex network: The box covering algorithm. J. Stat. Mech. 2007, P03006. [Google Scholar] [CrossRef]
- Hagberg, A.; Schult, D.; Swart, P. Exploring Network Structure, Dynamics, and Function Using NetworkX. In Proceedings of the 7th Python in Science Conference (SciPy2008), Pasadena, CA USA, 19–24 August 2008; pp. 11–15. [Google Scholar]
- Hagberg, A.; Schult, D.; Swart, P. NetworkX. Available online: http://networkx.lanl.gov/ (accessed on 11 November 2011).
- Schneider, T.D.; Stormo, G.D.; Gold, L.; Ehrenfeucht, A. Information content of binding sites on nucleotide sequences. J. Mol. Biol. 1986, 188, 415–431. [Google Scholar] [CrossRef]
- Schneider, T.D.; Stephens, R.M. Sequence logos: A new way to display consensus sequences. Nucleic Acids Res. 1990, 18, 6097–6100. [Google Scholar] [CrossRef]
- Los Alamos National Laboratory. HCV Sequence Database: Entropy. Available online: http://hcv.lanl.gov/content/sequence/ENTROPY/entropy_one.html (accessed on 11 November 2011).
- Crooks, G.E.; Hon, G.; Chandonia, J.M.; Brenner, S.E. WebLogo: A sequence logo generator. Genome Res. 2004, 14, 1188–1190. [Google Scholar] [CrossRef]
- National Center for Biotechnology Information (NCBI). Taxonomy. Available online: http://www.ncbi.nlm.nih.gov/guide/taxonomy/ (accessed on 11 November 2011).
- Hook-Barnard, I.G.; Hinton, D.M. Transcription initiation by mix and match elements: Flexibility for polymerase binding to bacterial promoters. Gene Reg. Syst. Biol. 2007, 1, 275–293. [Google Scholar] [CrossRef]
- Papp, P.P.; Chattoraj, D.K.; Schneider, T.D. Information analysis of sequences that bind the replication initiator RepA. J. Mol. Biol. 1993, 233, 219–230. [Google Scholar] [CrossRef] [PubMed]
- Schneider, T.D. Reading of DNA sequence logos: Prediction of major groove binding by information theory. Methods Enzymol. 1996, 274, 445–455. [Google Scholar] [PubMed]
- Liebovitch, L.S. Fractals and Chaos; Oxford University Press: New York, NY, USA, 1998. [Google Scholar]
- Zipf, G.K. Human Behaviour and the Principle of Least Effort: An Introduction to Human Ecology; Addison–Wesley: Cambridge, MA, USA, 1949. [Google Scholar]
- Ferrer-I-Cancho, R.; Forns, N. The self-organization of genomes. Complexity 2010, 15, 34–36. [Google Scholar] [CrossRef]
- Solé, R.V. Genome size, self-organization and DNA’s dark matter. Complexity 2010, 16, 20–23. [Google Scholar] [CrossRef]
- Misteli, T. Self-organization in the genome. Proc. Natl. Acad. Sci. USA 2009, 106, 6885–6886. [Google Scholar] [CrossRef] [PubMed]
- Rajapakse, I.; Scalzo, D.; Tapscott, S.J.; Kosak, S.T.; Groudine, M. Networking the nucleus. Mol. Syst. Biol. 2010, 6. [Google Scholar] [CrossRef]
Figure 1.
The nuclei of fourteen gene promoter networks (GPNs) representing in each case the promoter footprint of a transcription factor binding in the genome of one of three bacterial species: Bacillus subtilis (BS), Escherichia coli (EC), and Pseudomonas aeruginosa (PA). Each network is an x-section taken from the upper phase transition of a serial extraction. Promoter predictions were obtained from the Virtual Footprint database [48]. The transcription factors defining each regulon are as follows: (A) DegU, BS; (B) Anr-Dnr(37), PA; (C) ArgR, EC; (D) Hpr, BS; (E) ResD, BS; (F) SigB(n14), BS; (G) AlgU, PA; (H) FleQ, PA; (I) Fur, PA; (J) PvdS, PA; (K) DeoR, EC; (L) CpxR, EC; (M) Crp, EC; (N) MarA, EC. See Table 1 for more details.

Figure 2.
Sequence logos [59] for the fourteen regulons examined in this study. Each row of letters was rendered using WebLogos [61] and represents the sequence conservation across the set of promoters within a GPN. The height of each letter denotes the position-specific information entropy (RSequence). Regulon id’s are as follows: (A) PvdS; (B) AlgU(-35); (C) FleQ; (D) ResD; (E) Hpr; (F) DeoR; (G) Anr-Dnr(37); (H) DegU; (I) SigB(n14); (J) MarA; (K) Fur; (L) ArgR; (M) CpxR; and (N) Crp. The order from bottom to top represents GPNs ranked according to increasing fractal dimension (dB) of their phase transition LCC x-section.
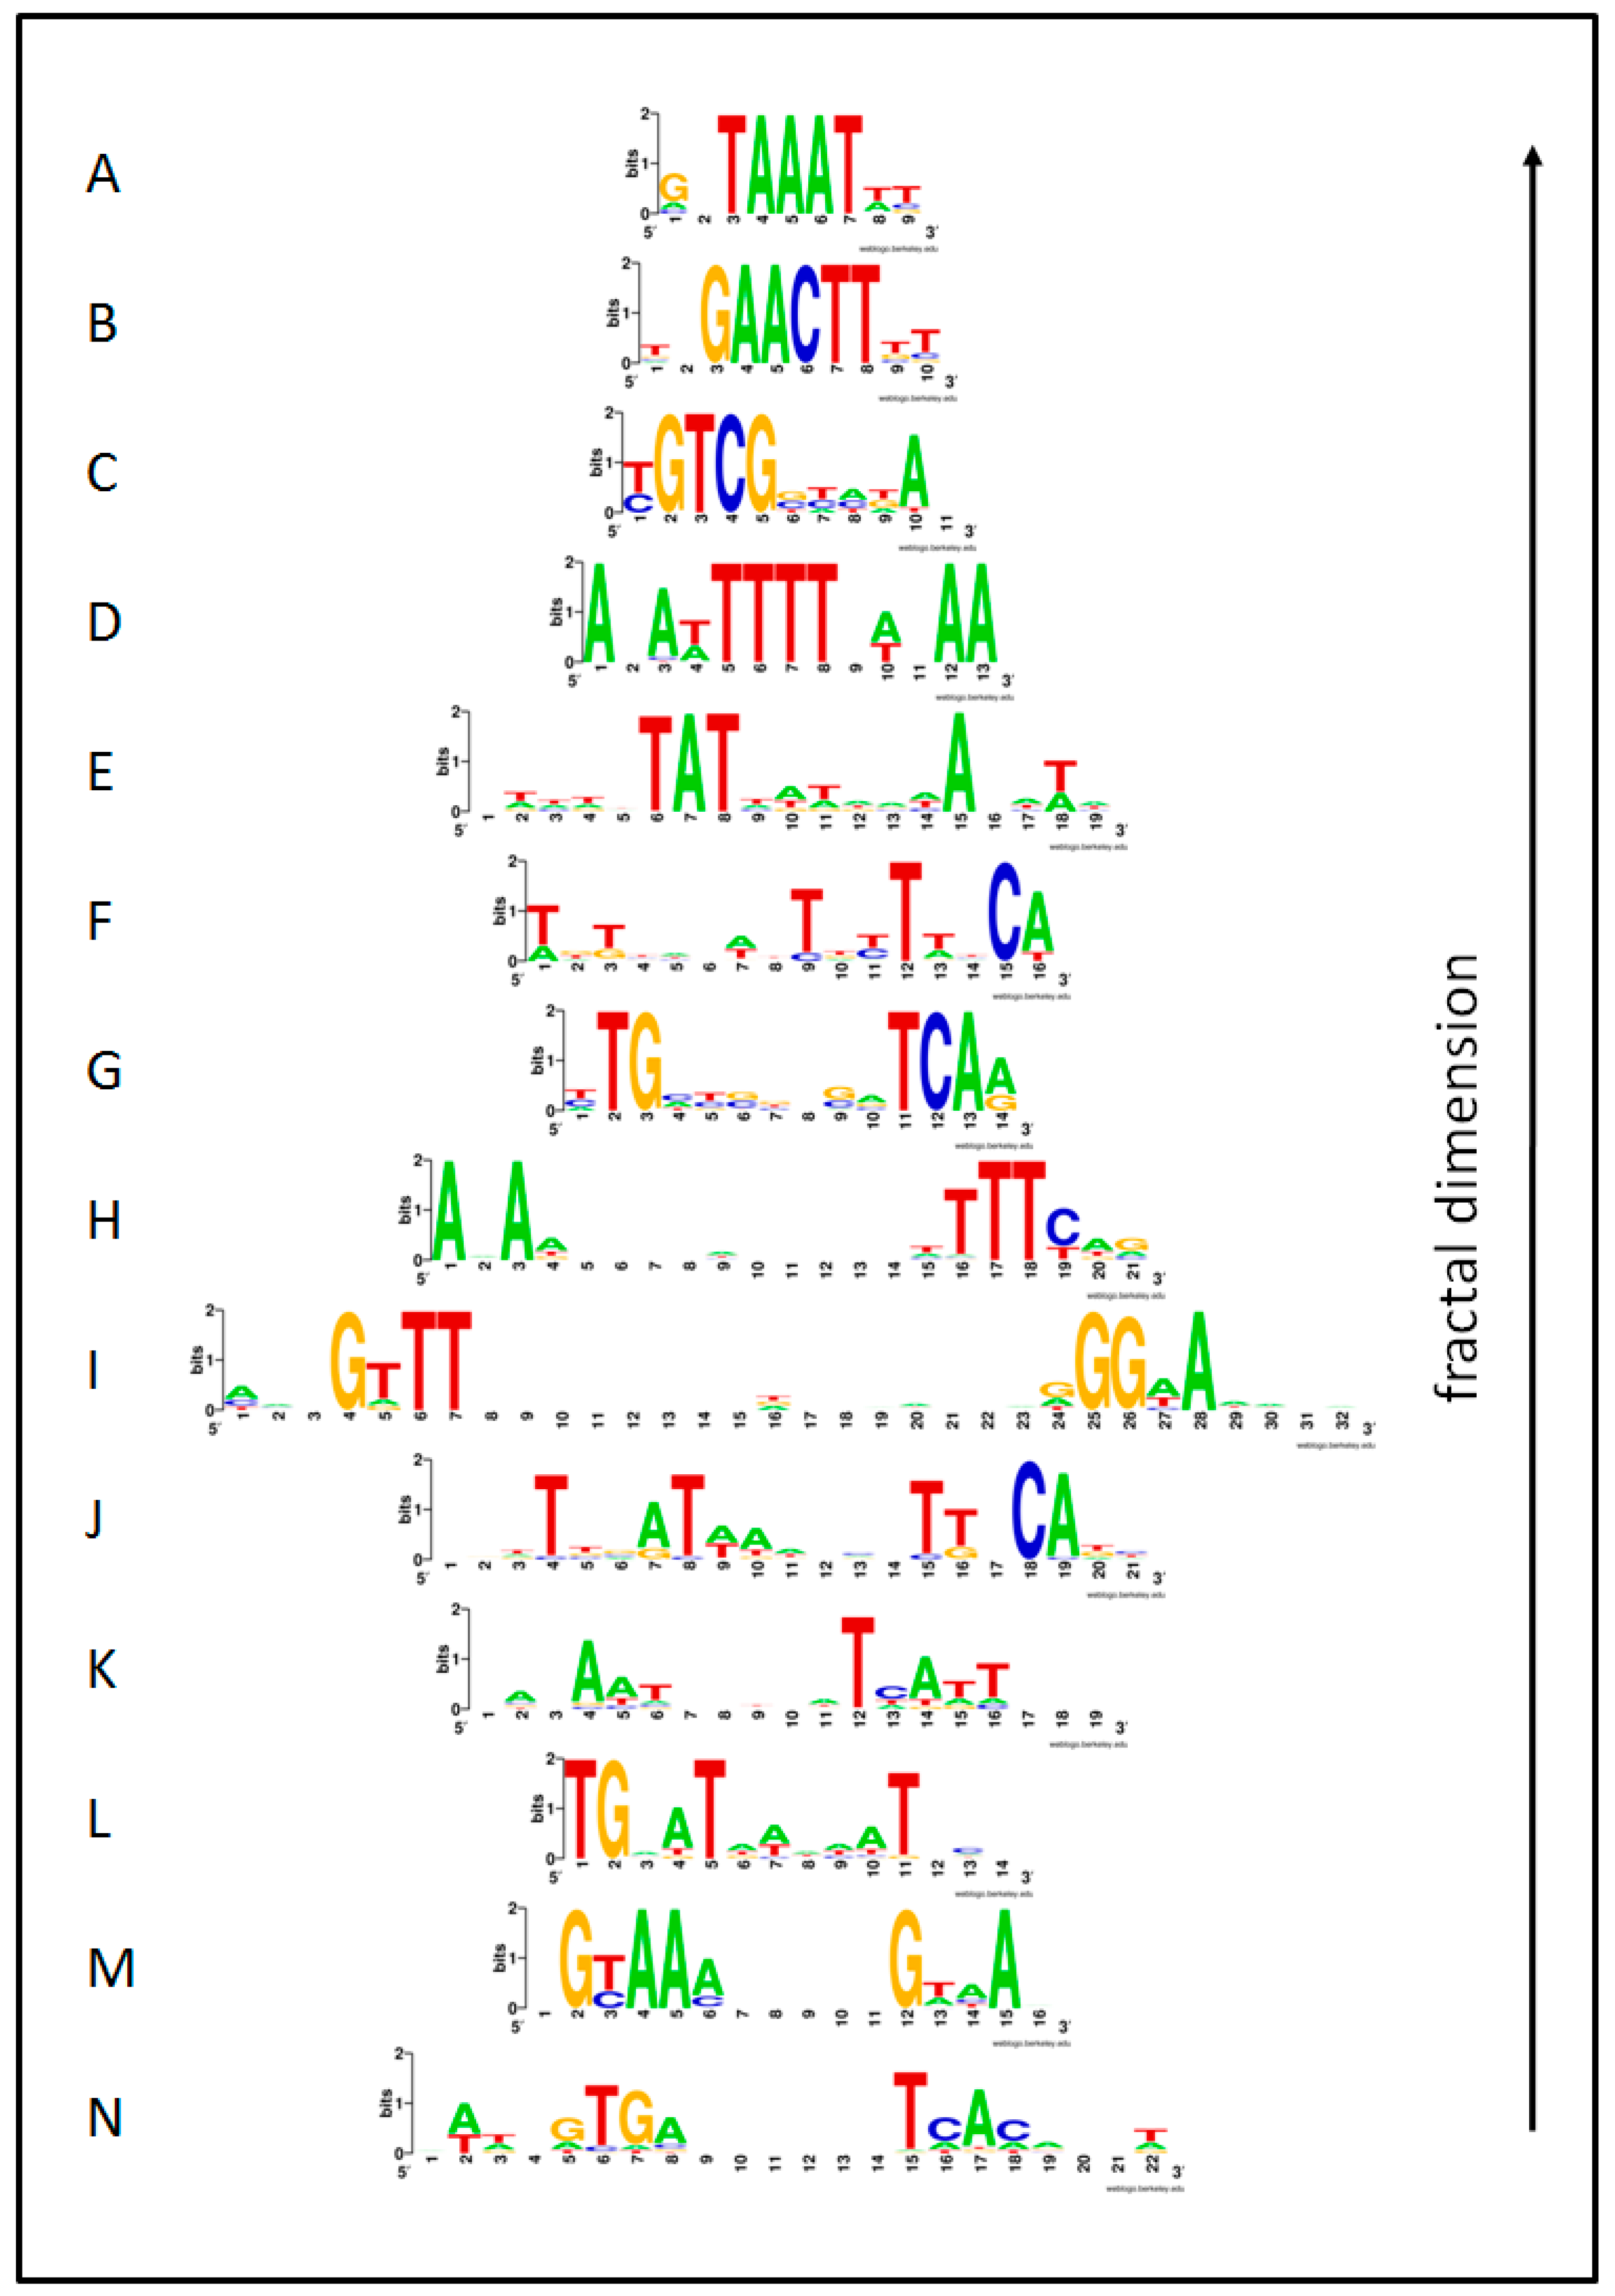
Figure 3.
Relationships between footprint size, information entropy, and fractal dimension across fourteen nuclei of GPNs from three bacterial species.
Figure 3.
Relationships between footprint size, information entropy, and fractal dimension across fourteen nuclei of GPNs from three bacterial species.


Table 1.
Promoter prediction settings for Virtual Footprint downloads along with footprint size, information entropy, and the outcome of fractal analyses.
Table 1.
Promoter prediction settings for Virtual Footprint downloads along with footprint size, information entropy, and the outcome of fractal analyses.
| Image | Regulon | Species | Library | S | X | F | IRMean | dB | R2d |
|---|---|---|---|---|---|---|---|---|---|
| A | DegU | BS | Prod | 0.8 | 17 | 21 | 1.032 | 1.837 | 0.921 |
| B | Anr-Dnr(37) | PA | Prod | 1.0 | 13 | 14 | 1.295 | 1.953 | 0.921 |
| C | ArgR | EC | Prod | 0.7 | 13 | 14 | 1.175 | 1.640 | 0.978 |
| D | Hpr | BS | Prod | 0.8 | 16 | 19 | 1.081 | 2.120 | 0.914 |
| E | ResD | BS | Prod | 0.2 | 12 | 13 | 1.551 | 2.599 | 0.960 |
| F | SigB(n14) | BS | Prod | 0.8 | 20 | 32 | 0.967 | 1.831 | 0.945 |
| G | AlgU(-35) | PA | Prod | 0.5 | 9 | 10 | 1.557 | 3.064 | 0.959 |
| H | FleQ | PA | Prod | 0.5 | 10 | 11 | 1.410 | 2.669 | 0.965 |
| I | Fur | PA | Prod | 0.9 | 15 | 19 | 0.927 | 1.665 | 0.972 |
| J | PvdS | PA | Prod | 0.3 | 8 | 9 | 1.541 | 3.415 | 0.938 |
| K | DeoR | EC | Reg | 1.0 | 14 | 16 | 1.109 | 2.040 | 0.906 |
| L | CpxR | EC | Prod | 1.0 | 14 | 16 | 1.192 | 1.561 | 0.966 |
| M | Crp | EC | Prod | 0.6 | 17 | 22 | 0.964 | 1.534 | 0.977 |
| N | MarA | EC | Reg | 1.0 | 16 | 21 | 1.084 | 1.719 | 0.938 |
Image, visual representation of this network in Figure 1 produced using program PAJEK; Regulon, regulatory protein that binds this set of promoters thereby defining this regulon of genes; Species, BS, Bacillus subtilis; EC, Escherichia coli; PA, Pseudomonas aeruginosa; Library, database of promoter predictions from Virtual Footprint database [48] (Prod, Prodoric [48]; Reg, RegulonDB [50]); S, sensitivity setting on Virtual Footprint; X, x-section critical value for thresholding; for example, X = 17 implies that all edges were removed from the network except those of weight 17 bp shared between promoter pairs; F, footprint size of promoter in base pairs; IRMean, arithmetic mean across base positions of the position-specific information (RSequence) for a regulon of promoters; dB, fractal dimension of GPN for upper phase transition x-section as calculated by method of Song et al. [55]; R2d, coefficient of determination for regression of log-log transformed plot of lB versus NB.
Table 2.
Relationships between footprint size, information (IRMean), and fractal dimension across nuclei of fourteen GPNs from three bacterial species based on linear regression of original data and log-log transformations of data.
Table 2.
Relationships between footprint size, information (IRMean), and fractal dimension across nuclei of fourteen GPNs from three bacterial species based on linear regression of original data and log-log transformations of data.
| x | y | β | A | R2 | r | Fstat | P |
|---|---|---|---|---|---|---|---|
| F | dB | –0.064 | 3.205 | 0.431 | –0.656 | 9.079 | 0.010 |
| log10(F) | log10(dB) | –0.560 | 0.986 | 0.569 | –0.754 | 15.821 | 0.002 |
| F | IRMean | –0.031 | 1.726 | 0.669 | –0.818 | 24.245 | <0.001 |
| log10(F) | log10(IRMean) | –0.472 | 0.643 | 0.795 | –0.892 | 46.551 | <0.001 |
| IRMean | dB | 2.236 | –0.579 | 0.734 | 0.857 | 33.088 | <0.001 |
| log10(IRMean) | log(dB) | 1.168 | 0.225 | 0.696 | 0.834 | 27.463 | <0.001 |
Linear regression model: y = βx + A + ε; x, independent variable; y, dependent variable; F, footprint size of promoter in base pairs; dB, fractal dimension of GPN for upper phase transition x-section; IRMean, average Shannon’s Information index based on measures of sequence entropy; β, slope of regression line (power-law coefficient for log-log scaling); A, intercept of regression line; R2, coefficient of determination for regression; r, correlation coefficient; Fstat, F statistic for regression; P, P-value for regression.
© 2011 by the authors; licensee MDPI, Basel, Switzerland. This article is an open access article distributed under the terms and conditions of the Creative Commons Attribution license (http://creativecommons.org/licenses/by/3.0/).
Share and Cite
MDPI and ACS Style
Aldrich, P.R.; Horsley, R.K.; Turcic, S.M. Symmetry in the Language of Gene Expression: A Survey of Gene Promoter Networks in Multiple Bacterial Species and Non-σ Regulons. Symmetry 2011, 3, 750-766. https://doi.org/10.3390/sym3040750
AMA Style
Aldrich PR, Horsley RK, Turcic SM. Symmetry in the Language of Gene Expression: A Survey of Gene Promoter Networks in Multiple Bacterial Species and Non-σ Regulons. Symmetry. 2011; 3(4):750-766. https://doi.org/10.3390/sym3040750
Chicago/Turabian StyleAldrich, Preston R., Robert K. Horsley, and Stefan M. Turcic. 2011. "Symmetry in the Language of Gene Expression: A Survey of Gene Promoter Networks in Multiple Bacterial Species and Non-σ Regulons" Symmetry 3, no. 4: 750-766. https://doi.org/10.3390/sym3040750