LiFeAs is a very remarkable member in the family of iron based superconductors (IBSC). While consisting of key FeAs structural blocks and losing resistance already at 18 K thus bearing all necessary and representative features of these novel materials [
15,
16,
17], LiFeAs superconducts in its stoichiometric composition, is not magnetic [
11,
12] and its surface electronic structure is the same as in the bulk [
18]. Angle-resolved photoemission (ARPES) at ultra-low temperatures (~1 K) [
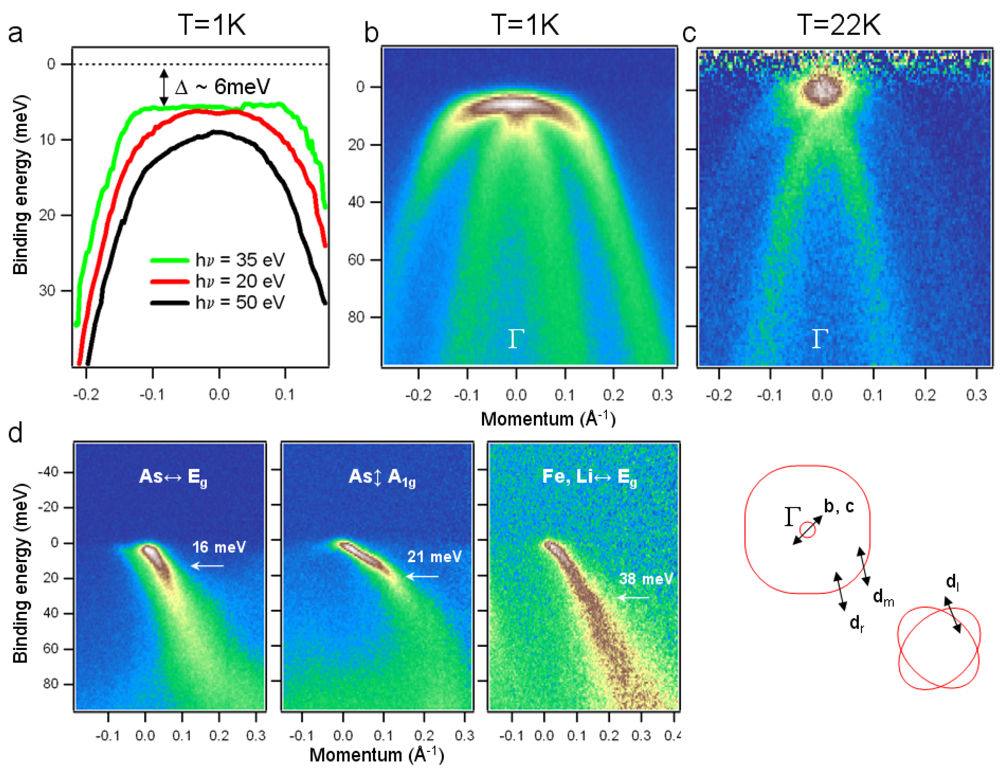
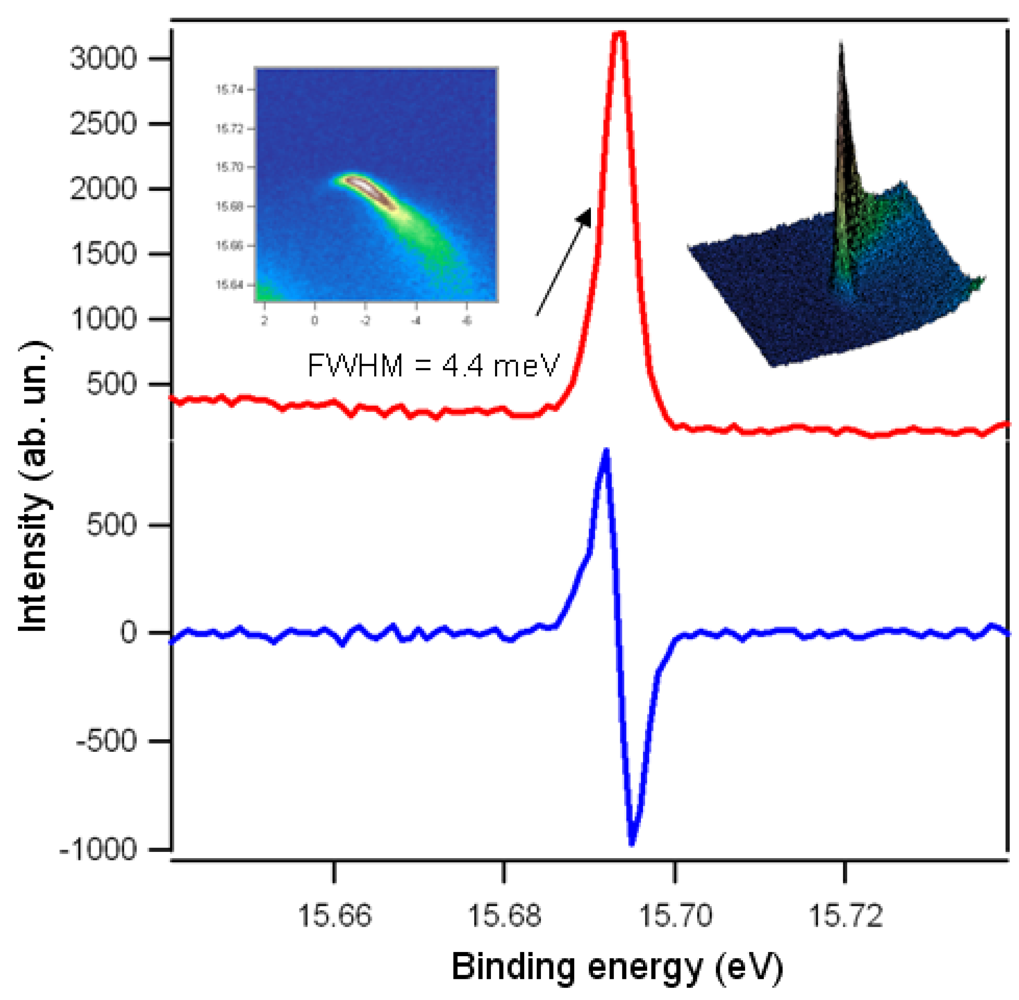
14] offers a unique opportunity to directly determine the full size of the energy gap (Δ) as a function of momentum, virtually in the ground state of a superconductor. Precise and direct determination of the energy gap becomes possible if the maximum energy position of the quasiparticle peak at Fermi momentum (
kF) with respect to Fermi level (E
F) is determined (inset to
Figure 1). LiFeAs is an ideal compound for such ARPES measurements—all Fermi surfaces (locus of
kF at E
F) are well defined and separated in
k-space (
Figure 1a), no other gap or depletion of the spectral weight at E
F (pseudogap) is present and
kF energy distribution curves (EDC) are remarkably sharp.
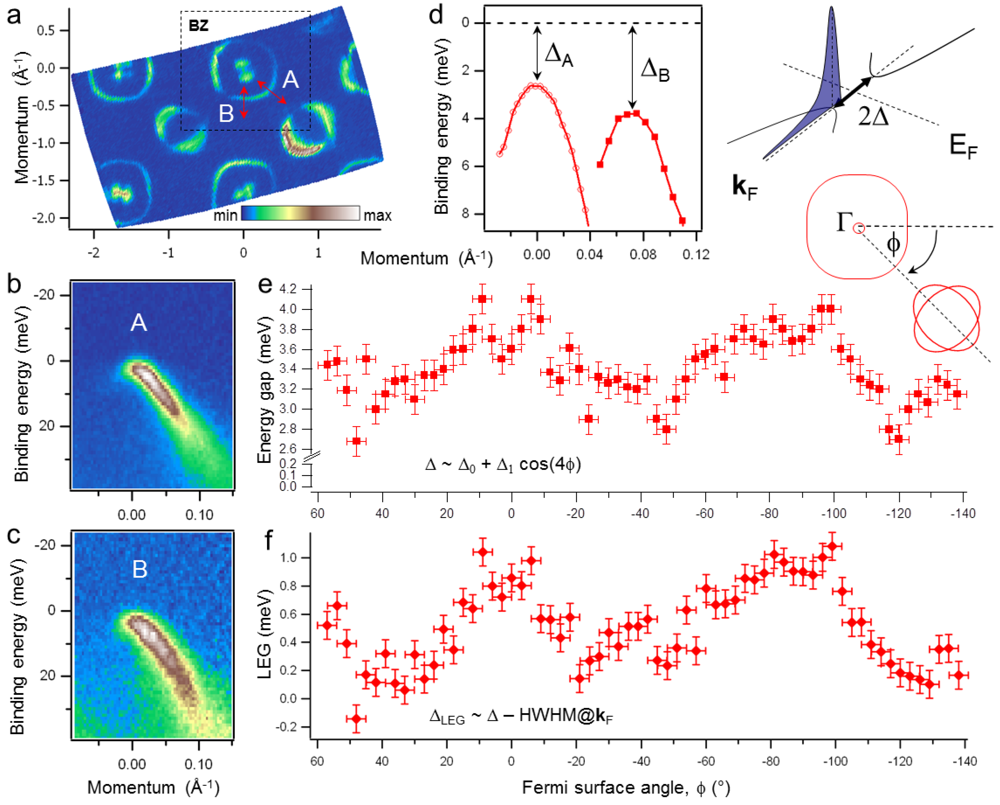
As has been demonstrated previously [
7], the Fermi surface of LiFeAs consists of two hole-like and two electron-like sheets around the center and corners of the Brillouin zone (BZ) respectively (
Figure 1a). We start with the determination of the energy gap corresponding to the large hole-like Fermi surface around Γ-point. This Fermi surface (FS) originates purely from in-plane
dxy orbitals and therefore is 2D without any noticeable
kz dispersion. Single dispersing features shown in
Figure 1b,
c represent the spectral function in the vicinity of the Fermi level at different momenta (A and B). Already visually, the distributions of intensity are not equivalent. Tracking the EDC’s maxima close to E
F (
Figure 1d) one clearly notices the difference: the energy gap is not the same in points A and B since the dispersion bends back at different distances from E
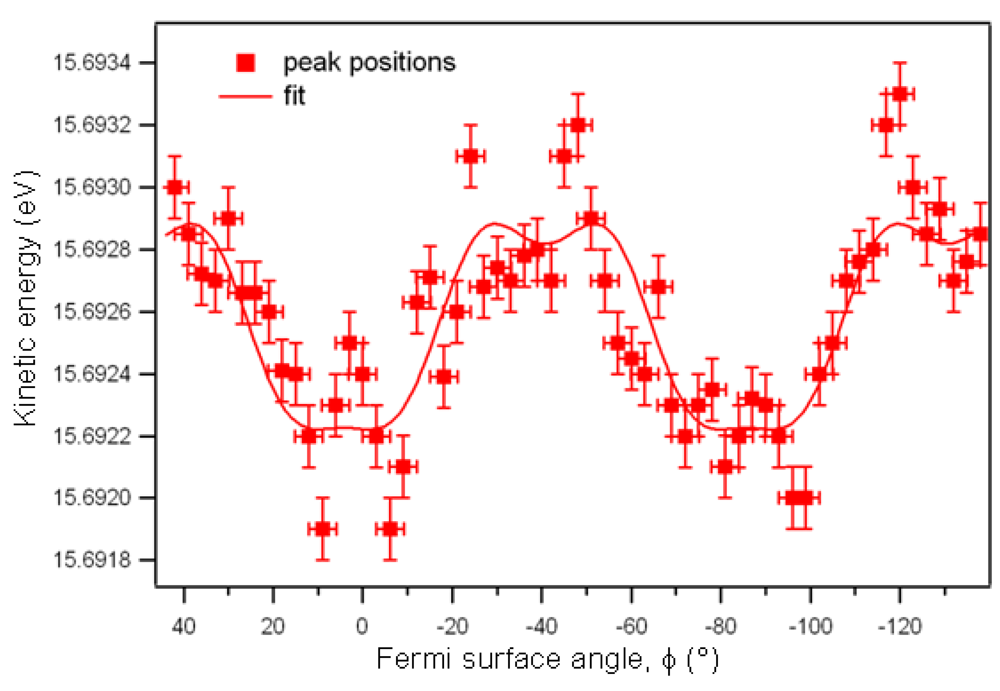
F and this distance is equal to Δ. This is a direct evidence for the gap anisotropy. We have determined the values of Δ for many
kF along the large Fermi surface and the result is shown in
Figure 1e,
f (see Supporting online material). An oscillating behavior, with the functional form
Δ~Δ0 + Δ1cos 4ϕ +… is clearly seen. Even the presence of higher harmonics,
cos 8ϕ (~12%) and
cos 12ϕ (~20%) can be noticed as local extrema at
ϕ = πn/4 and asymmetric shape of global maxima and minima (see SOM). The latter are oriented towards the sides and the corners of the BZ respectively.
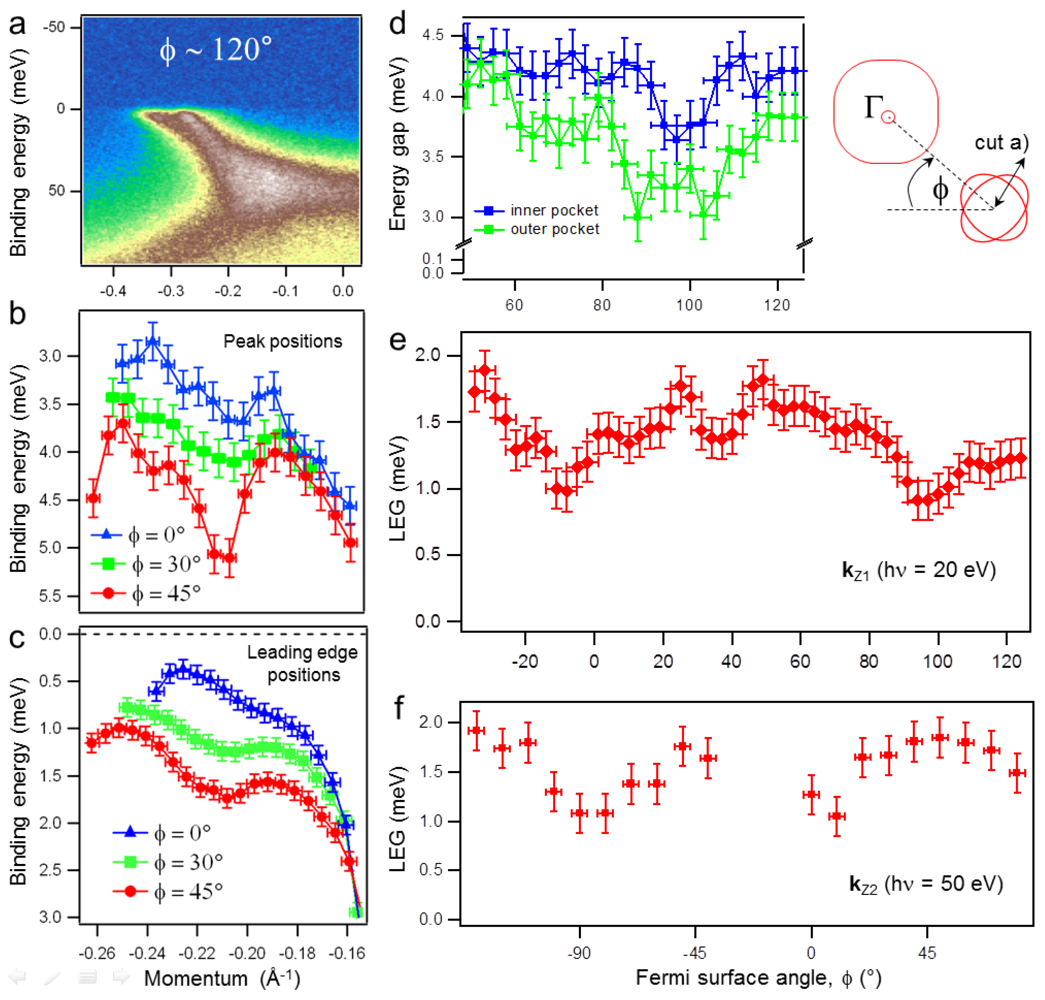
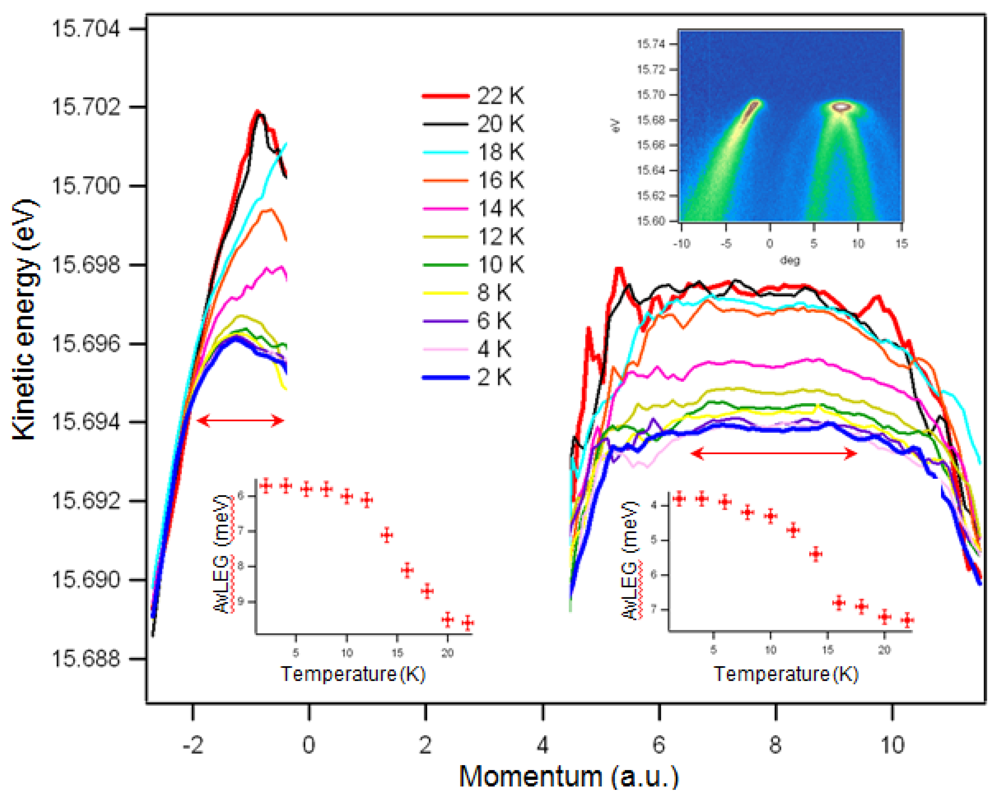
In
Figure 2a we show a typical intensity distribution along one of the radial cuts from the corner of the BZ. This time two dispersing features, which supported electron-like FSs above T
c, are seen in spite of a finite three-dimensionality due to peculiar orbital composition (mostly
dxz,yz but with finite admixture of
dxy) of these FS sheets (see SOM). Panels b) and c) of
Figure 2 show momentum dependences of both, the peak and leading edge positions for selected angles which define the direction of the radial cut (see inset to
Figure 2). From presented results one can see that the gap on the outer FS contour is smaller than on the inner one and that the gaps change in-phase,
i.e., both increase when going from ϕ = 0 to the direction towards the Γ-point. This behavior is confirmed by the more detailed scanning of the angle and plotting the angular dependence for the two gaps (
Figure 2d). To investigate the gap function on a larger angular scale, we take advantage of the gap in-phase variations and consider in the following the averaged for both electron-like FSs gap. In such a way we increase the signal-to-noise ratio, otherwise significantly reduced by nearly degeneracy of FSs close to the crossings of two ellipses and by matrix-element effects. Large scans (
Figure 2e,
f) recorded at different excitation energies (effectively, different
kz’s) again demonstrate approximately
cos 4ϕ behavior with global maxima of the gaps oriented towards the center of the BZ.
Figure 1.
(
a) Fermi surface map of LiFeAs. Large Fermi surface around center as well as crossed elliptical FSs around the corners are seen as closed features with intensity suppression along the high-symmetry directions because of matrix-element effects. Intensity distribution in the center of the Brillouin zone (BZ) strongly depends on the BZ number and is due to the van Hove singularity below the Fermi level. The corresponding dispersing feature crosses the Fermi level only in very limited
kz interval (see
Figure 3) thus resulting in a very small FS. Red arrows show the momentum location of the cuts A and B; (
b,
c) Energy-momentum intensity distributions showing the crossings of the Fermi surface in points A and B. The typical bending back of the dispersion because of energy gap is seen; (
d) Energy distribution curves (EDC) dispersions from panels b and c. The gaps in points A and B are clearly different; (
e) Gap function from the peak positions of
kF-EDCs (see inset); (
f) Gap function from the positions of the EDC’s leading edge midpoint, known as leading edge gap (LEG) and determined from the
kF-EDCs as energy position of a derivative’s maximum.
![Symmetry 04 00251 g001]()
Figure 2.
(a) Typical energy-momentum distribution of photoemission intensity along the radial (ϕ ~120°) momentum cut from the corner of the BZ showing two dispersing features which form electron-like FSs. Note, that two features appear to cross each other at ~30 meV leading to different orbital character of the small FS portion closest to Γ than in the typical calculations: it is of dxz,yz character while the corresponding part of the inner pocket is dxy; (b) Peak positions for several radial cuts. Local maxima correspond to kF-EDCs and their binding energies are the energy gaps; (c) Maximal derivative or leading edge positions for the same cuts as in b; (d) Gap functions in a limited angular interval showing in-phase variation of the gaps on both FSs; (e) LEG from integrated EDCs obtained by summing the spectral weight along the radial cuts, as e.g., between −0.45 Å−1 and 0.0 Å−1 in panel a; (f) Same as in e), but for different kz, set by different photon energy. Angle ϕ as well as the cut from panel a) are defined in the inset. Since the momentum separation between two electron-like FSs along the borders of the BZ is negligible one can consider them either as crossed ellipses or as inner and outer pockets of the same topology.
![Symmetry 04 00251 g002]()
Finally, we determine the superconducting energy gap on the small FS at Γ-point. First of all, we note that the third, closest to Γ, hole-like
dxz,yz feature strongly disperses towards the Fermi level but never crosses it, approaching as close as 10 meV at particular
kz. A detailed photon energy dependent study (not shown) has confirmed this and showed that the middle hole-like feature supports even smaller FS than it was initially thought [
7]. The sizeable, BZ dependent intensity distribution seen in the vicinity of Γ-point is caused by the Van Hove singularity, but the actual FS crossing has been found only for certain
kz intervals as is demonstrated by
Figure 3. Because of finite
kz-dispersion (of the order of 10 meV), the spectra will hardly be sensitive to the onset of superconductivity if the top of this band is situated more than 6 meV away from the Fermi level. It is the case, for instance, when using 20 eV and 50 eV photons (
Figure 3a). Nevertheless, higher temperature measurements (
Figure 3b) do indicate that the band reaches E
F resulting in the so-called “shape resonance” [
19]. For those
kz the feature undergoes a noticeable transformation when crossing T
c (
Figure 3b,
c). The superconducting energy gap of the size of 6 meV opens and is in agreement with the tunneling spectroscopy and ARPES on Co-doped NaFeAs [
20,
21,
22].
Figure 3.
(a) Dispersion of the middle hole-like feature near Γ for different kz, set by various excitation energies; (b,c) Energy-momentum distributions taken below and above Tc for the case when the middle band crosses EF . It is also seen that even in this case the inner hole-like feature does not reach the Fermi level; (d) Kinks in the dispersion at different locations in the BZ seen as abrupt changes in the slope of the dispersing features (hν = 20 eV). Matching phonon modes are indicated as well. Inset shows the momentum location of the cuts from (b), (c) and left/middle/right panels of (d).
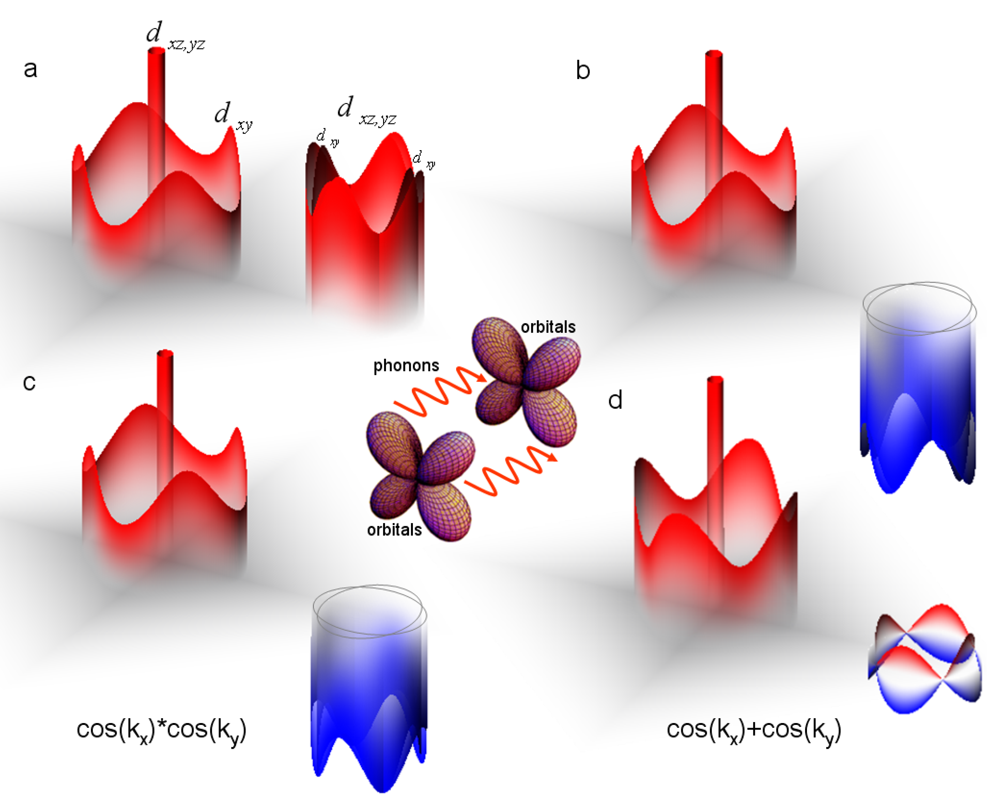
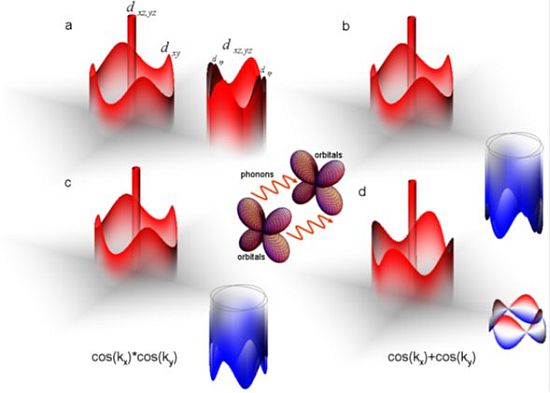
Figure 4.
(
a) 3D representation of the gap function as it follows from angle-resolved photoemission (ARPES) measurements. Only two sets of the Fermi surfaces are shown: those centered at Γ-point and at the corner of the BZ. Note the orientation of the extrema of all FSs and in-phase behavior of the electron-like sheets. Orbital composition of the FSs is indicated as well. Because of the crossing of the dispersions (Figure 2
a) the
dxy character corresponds to the small portions of the
inner electron pockets unlike in most calculations; (
b) Same as a), but taking into account the possibility of different sign between hole- and electron-like FSs; (
c) Gap function corresponding to the nodeless s± order parameter, usually discussed for hole-doped iron based superconductors (IBSC) with nested FSs. Though similar to the case shown in b), the orientation of the extrema on the electron-like FSs is different; (
d) Nodal s± order parameter which should apply to LiFeAs according to the calculations within the spin-fluctuations scenario. Inset schematically represents the orbital-fluctuations model with electron-phonon interaction. Only the calculations based on this latter scenario qualitatively reproduce our experimental observations (see e.g., [
14]).
![Symmetry 04 00251 g004]()
In
Figure 4a we summarize our study by presenting the gap function schematically for the whole BZ. The largest gap (~6 meV) corresponds to the small hole-like FS at Γ-point. Along the large 2D hole-like FS the gap varies around ~3.4 meV roughly as 0.5 meV*cos 4ϕ being minimal at the direction towards the electron-like FS. The gap on the outer electron pocket is smaller than on the inner one and both vary around ~3.6 meV as 0.5 meV*cos 4ϕ having maximal values at the direction towards Γ-point. Since ARPES is not sensitive to the sign of the gap, we also sketch (
Figure 4b) the other possible gap function which would agree with our observations. We now examine to which extent the obtained gap structure corresponds to the popular s± spin-fluctuation scenario for superconductivity in iron pnictides [
1,
2,
3,
4,
5,
6]. There are two main possibilities for the realization of the s± scenario in terms of gap functions. It can be either nodal and have a functional form with dominant cos
kx + cos
ky term or nodeless and have a functional form with dominant cos
kx*cos
ky term, depending on the details of the pair interaction. In real space the former corresponds to the direct Fe-Fe exchange interaction while the latter to the next-nearest-neighbor exchange interaction via As atoms. The Fe-Fe distance in LiFeAs is one of the smallest among all families of pnictides and thus the first possibility is more likely. Moreover, many model calculations of the gap function unanimously predict nodal s± behavior for strongly electron doped materials [
1,
2,
3,
4,
5,
6]. This is natural since upon electron doping the size of hole-like FSs becomes negligible in comparison with the size of electron-like FSs, nesting is destroyed and spin-fluctuation mechanism can only be established when dominant interaction between electron-like pockets would change sign of the order parameter between them (in unfolded BZ). The system should adjust the magnitude of the angle-dependent, ±cos 2ϕ gap component along the two electron FSs to minimize the effect of the inter-electron-pocket repulsion [
4]. LiFeAs, though being stoichiometric because of large
dxy FS, should adopt this scenario for strongly electron-doped systems because the proportion between the
dxz, yz originated FSs is exactly like this. Only one of the hole-like FSs with this orbital composition is present (the other one being completely below the E
F) whereas the electron-like pockets are very large with absolutely no sign of (π, π)-nesting [
7]. These considerations inevitably imply the presence of nodes and anti-phase behavior of the gaps on electron-like FSs of LiFeAs (
Figure 4d), which is clearly not the case according to our experiment. Also, in the simplest case of cos
kx + cos
ky order parameter one would expect the maximal gaps on the large hole-like FS to be oriented in the direction of electron pockets (
Figure 4d). Our results demonstrate just the opposite (
Figure 4a and
Figure 1e,
f).
Let us assume that the unlikely, for effectively electron doped IBSC, scenario of nodeless s± order parameter takes place. Indeed, this would fix the in-phase/anti-phase discrepancy and the orientation of the maxima of the gap on the large hole pocket (
Figure 4c). However, the orientation of the extrema of the in-phase oscillating gaps on electron FSs would then be in conflict with the experimentally observed one (
Figure 4b). It is known that the orbital character of small portions of electron FSs oriented towards Γ-points is
dxy and the interorbital pairing with
dxz, yz states on hole FSs is weaker than the intraorbital pairing for the major parts of electron pockets. On the contrary, our data show that the gaps on these portions are maximal (
Figure 4a,
b and
Figure 3e–g).
Another ingredient necessary for realization of spin-fluctuation scenario is apparently missing in LiFeAs. Recent neutron-scattering experiments on similarly prepared single crystals demonstrate that the strength of spin fluctuations in LiFeAs is an order of magnitude weaker than e.g., in Co-doped 122 system with hardly any evidence for the neutron resonance [
11]. As a consequence, we were not able to find any evidence of electron-magnon coupling in LiFeAs contrary to the case of optimally doped 122 or exemplary case of cuprates [
23]. Moreover, the detected energy spectrum of magnetic fluctuations does not contain any features that can explain the dispersion kinks in electronic spectrum observed earlier [
10,
11,
12]. In
Figure 3d we show more evidence for strong electron-boson coupling. All typical energy scales derived in the present and previous [
10] studies correspond to phonon modes [
24], recently detected experimentally for the center of the BZ by Raman scattering [
25] (see also SI). In spite of the noticeable renormalization (kinks) implying considerable electron-phonon coupling, the largest gap in LiFeAs is twice larger than in a weak coupling BCS scheme and its momentum dependence is very peculiar implying that conventional electron-phonon coupling mechanism is not operational in this material.
This brings us to an alternative approach to superconductivity in pnictides based on the orbital fluctuations model [
13,
14]. A general consensus exists regarding the important role of orbital degrees of freedom played in physics of IBSC. Together with the possibility of Fe3d orbital ordering at structural transition [
26], one of the most remarkable and robust experimental evidences for this importance is the universal bandwidth renormalization of the factor of 2–3 found in all families of pnictides and chalcogenides [
7,
27,
28]. This renormalization is captured by e.g., DMFT calculations which take into account the Hund’s rule coupling [
29,
30,
31]. It is therefore not surprising that fluctuations of orbital order can drive the pairing. It was shown that for this interaction to be attractive, a moderate electron-phonon coupling should be present [
13,
14].
The hallmark of the orbital-fluctuations-mediated-by-phonons scenario is the s++ order parameter,
i.e., the superconducting gap of one sign for the whole BZ. According to the authors of [
13], this superconducting state is likely to be realized exactly in electron-doped IBSC even without impurities (see
Figure 4c in [
13]). Taking into account the above remark about the classification of LiFeAs in terms of doping and directly determined gap function for all FSs, this is in perfect agreement with our data. The gap function in band representation calculated in [
14] (Figure 7) captures all the peculiarities of experimentally observed one: gaps on electron pockets oscillate in phase, their maxima are oriented towards Γ-point and even the orientation of the extrema on large hole-like
dxy FS match the experimental observation.
While the details of the orbital fluctuations mechanism in LiFeAs are still to be understood, for instance, which exactly phonons are crucial for realization of this scenario [
13,
14] or which role is played by the van Hove singularity, intraband nesting of
dxy sheet or higher harmonics, implied by the shape of the gap function, our results clearly suggest that this interaction is a most promising alternative to conventional electron-phonon coupling and to conventional spin fluctuations.


