Article

Morphometric Asymmetry of Frustule Outlines in the Pennate Diatom Luticola poulickovae (Bacillariophyceae)

Department of Botany, Faculty of Science, Charles University Prague, Benátská 2, 12801 Praha 2, Czech Republic
*
Author to whom correspondence should be addressed.
Symmetry 2016, 8(12), 150; https://doi.org/10.3390/sym8120150
Submission received: 20 September 2016 / Revised: 25 November 2016 / Accepted: 30 November 2016 / Published: 7 December 2016
(This article belongs to the Special Issue Fluctuating Asymmetry 2016)

Abstract

:
Side orientation of cells is usually ambiguous in unicellular organisms, making it impossible to separate components of directional asymmetry (DA) and fluctuating asymmetry (FA). However, frustules of the diatom Luticola poulickovae have biradially symmetric outlines, and their central areas bear ornamentation that is asymmetric across the apical axis. The goal of this study was to explore differentiation of morphometric asymmetry across the apical axis into DA and FA components. Is there detectable DA of the valve outlines of two L. poulickovae strains that may be related to the asymmetric central areas? Given that the life cycle of diatoms involves cell-size diminution, and cell shape is strongly affected by allometry, we also explored the question of whether asymmetry is correlated with cell size. The extent of symmetric variation among individuals in each strain, as well as DA and FA across the apical axis, were quantified using two Procrustes ANOVA models. The results revealed no correlation of either total asymmetry or FA with valve size. DA was significant and considerably more pronounced than FA in both strains, indicating that there is previously unknown systematic asymmetry of valve outlines of L. poulickovae, which may be related to the asymmetry of its central area.

1. Introduction

Cellular shapes of algae often involve various complex types of morphological symmetry, which may include bilateral symmetry, such as in the two-dimensional projections of cells of the green algal genera Pediastrum, Sorastrum, and their relatives [1,2], or in the giant cells of the ulvophycean marine seaweeds of the genus Halimeda [3]. However, in most cases, the cells of unicellular algae and protists have multiple symmetric parts arranged along several axes of symmetry. A biradial arrangement of cells with two orthogonal axes of symmetry is typical for the desmids (i.e., members of the green algal order Desmidiales) such as the genera Micrasterias, Euastrum, and Cosmarium [4,5,6]. In addition, multiple rotational or translational symmetric arrangements are present in various filamentous microalgae, foraminiferan shells, and radiolarian skeletons [7].
One of the key attributes of symmetric morphologies exhibited by unicellular organisms is the ambiguity of their side orientation, such that the up/down and left/right sides are interchangeable, which renders fixed side assignment of individual symmetric parts impossible [1,6,7,8,9]. This makes most unicellular symmetric structures fundamentally different from those of multicellular organisms, such as animals and vascular plants. Morphometric analysis of symmetry and asymmetry of cells with side ambiguity, thus, cannot involve decomposition of asymmetric variation into directional asymmetry (DA) and fluctuating asymmetry (FA). DA represents the systematic difference of the shape coordinates between two sides of a structure (i.e., left/right, up/down), or in other words, it is constant deviation of one side compared to the other. FA refers to random individual shape differences between the sides after DA has been taken into account [10,11]; thus, DA is essentially a property of a sample, whereas FA can be quantified for each specimen under study. Separation of DA and FA is of great importance to the shape analysis of symmetric structures in clonal populations, as it is a key step that allows for distinction between systematic asymmetry, which is genetically fixed and heritable, and developmental instability [10,12]. In samples formed by clonal organisms, such as microalgal strains, FA inherently relates to non-genetic factors, such as environmental stressors, and could be directly linked to their disturbing effects on developmental processes.
Because of the impossibility of assigning sides across the symmetric axes, assessments of the morphological asymmetry of most unicellular organisms are restricted to methods that separate symmetry from the asymmetric components, but without further differentiation into DA and FA. A method of object symmetry has been developed for studies of bilaterally symmetric structures in which the axis of symmetry is included within the structure itself and separates left and right sides as halves of a same structure. This method involves a joint morphospace comprising the original and reflected shape configurations that fill up the symmetry group constituted by the structure under study [11,12]. Individual axes of that morphospace (such as the principal components) then describe either entirely symmetric variation or individual patterns of asymmetry, which can, however, only be quantified as the total asymmetry of a particular type [5,12].
The diatoms (Bacillariophyceae) are a group of peculiar, mostly unicellular organisms with unusually complex patterns of morphological symmetry of their surface structures. A shell called the frustule, which is composed primarily of SiO2 and consists of two halves (the epitheca and the hypotheca), surrounds the cell. The slightly smaller and younger half is formed following the vegetative binary division of a cell; during the formation of the younger half, the remaining epitheca serves as a mold for the synthesis of the new half [13]. In a series of successive vegetative divisions, this leads to a cell size reduction in a population. During this cell size diminution, the nucelar/cytoplasmic ratio changes, as well as the surface/volume ratio. This might influence the “cellular activity and developmental potential” [14,15] resulting in different cell division rates in different size classes and therefore nonlinear distribution of cell sizes in a population [14,15]. This cytological heterogeneity might also lead to subsequent morphological heterogeneity in a population [13]. Cells that attain a species-specific critical size as a result of numerous vegetative divisions typically transform into gametes and reproduce sexually. Vegetative cells that then begin a new cycle again are in the upper size range of the species-specific interval [16]. Size reduction is typically accompanied by a change in the shape of the frustules [17,18,19,20], which leads to pronounced morphological allometry, a process typical of nearly every diatom population in natural habitats or cultured strains. Pappas et al. [19] recently reported that variation in the empirical morphospace of most pennate diatom species relates to allometry as a result of the size reduction that occurs over successive vegetative cell divisions. Interestingly, these authors also suggested that the second most important variation pattern usually involves the asymmetry of valve outlines.
Pennate diatoms, which belong to the subclasses Bacillariophycideae and Fragilariophycideae, compose the bulk of diatom diversity, forming a monophyletic crown group of the class [21]. Although their valves (i.e., the upper planes of the frustules) are usually elongated and bilaterally symmetric across the longitudinal (apical) axis [16], the basic outline of the valves is typically biradial, with a second, transapical axis of symmetry orthogonal to the apical axis. The most species-rich subclass, Bacillariophycideae, includes diatoms with raphe, a pair of fissures that typically run along the longitudinal axis of valves. In some genera—such as Frustulia, Cavinula, and Mastogloia—the raphe is generally straight and there are no visible departures from the biradial symmetry of the valve shape [22]. Conversely, there are several genera, such as Cymbella or Encyonema, that feature distinctly curved, crescent-like valve outlines, and thus, in these genera there is a pronounced DA of the frustule outline across the longitudinal axis. Likewise, there are several genera with distinct DA across the transapical axis, such as Gomphonema, Gomphoneis, and Didymosphaenia [16]. In addition to asymmetry in valve outline, there may also be additional structures on the valve surface that further emphasize the pronounced DA in these diatom taxa; for instance, there are often one or several distinct isolated and asymmetrically located points, called stigmata, in the central area of the valves, the asymmetric position of which invariably corresponds to the asymmetry of the valve outline. Notably, there are also diatom genera with valve outlines that have traditionally been considered biradially symmetrical but with distinctly asymmetric internal structures, such as raphe endings and stigmata. These intriguing genera include Sellaphora and Pseudofallacia, the species of which are characterized by unilateral deflection of the distal raphe ends [22]. Likewise, the proximal raphe ends are unilaterally bent in species of the genera Pinnularia and Muelleria [22]. In addition, an asymmetric pair of stigmata is common to species within the genus Placoneis, and an asymmetrically positioned isolated punctum is typical of species of Geissleria [22]. On the other hand, the valves of Neidium have straight raphe but contain an asymmetric structure called the Voigt discontinuity that occurs always on the secondary valve side, which allows for differentiation between both sides of the valve across the apical axis. Species of the genus Luticola are typified by the presence of both unilateral deflection of the proximal raphe ends and by asymmetric stigma in the central area of the valves (Figure 1), features that unambiguously denote two sides of Luticola valve outlines across the longitudinal axis. The valves of the Luticola, as well as of the other above-mentioned genera, represent relatively rare examples of morphological symmetry with clearly assigned sides in unicellular organisms. As such, analyses of symmetric and asymmetric variation similar to those conducted for multicellular organisms may be possible by using these structures. Because of the consistently asymmetric position of stigma and proximal raphe ends, the ”side” factor can be included as a fixed effect in a Procrustes ANOVA model and the asymmetric variation can then decomposed into components of DA and FA. Klingenberg [9], in a recent review of quantitative morphometric studies focusing on biological symmetry, demonstrated that slight but significant DA in shape has been detected in most multicellular model systems. Although the functional or evolutionary adaptive significance of DA in multicellular organisms remains unclear, it may be a non-adaptive byproduct of the distinctive DA of their internal morphology. This pattern may not be easily applicable to unicellular structures, such as the inorganic shells of diatoms that surround cells of several successive vegetative generations, but in diatoms with distinct DA of the central area of valves, such as species of Luticola, the entire valve outline may also be systematically asymmetric in relation to the pattern of their central area.
To the best of our knowledge, FA and DA of diatom valve outline shapes have never been explicitly evaluated. Our study focused on the genus Luticola, and we asked the basic question of whether there is detectable DA of valve outline shape across the longitudinal axis with sides designated by the position of stigma and proximal raphe ends; if such asymmetry is detectable, it may suggest that the valve outline is morphogenetically related to the arrangement of the internal structures of frustules and cells. We also evaluated the degree of FA in valve shape across the longitudinal axis, to ascertain whether FA is significant when tested against the measurement error (ME), and how prominent this segment of asymmetry may be in relation to DA.
Shape variation of pennate diatoms is predominantly determined by allometric changes relating to size diminution of frustules [19,23], and therefore, we also examined the relationship between the DA and FA of valve outlines across the longitudinal axis and cell size. Does FA (or even DA) increase during successive vegetative divisions, thereby resulting in accumulating irregularities in the shape of the siliceous frustules? It has been shown that teratogenic morphological asymmetry of diatom frustules in natural habitats is often related to chemical contamination, as well as resulting from physical stress factors [24], features that have been used in various biomonitoring and ecological surveys of freshwater and marine ecosystems [24,25,26]. Separation and quantification of FA, which is directly related to developmental instabilities from DA, which represents the systematic asymmetry of populations, might therefore be useful in environmental applications of diatom morphology.

2. Materials and Methods

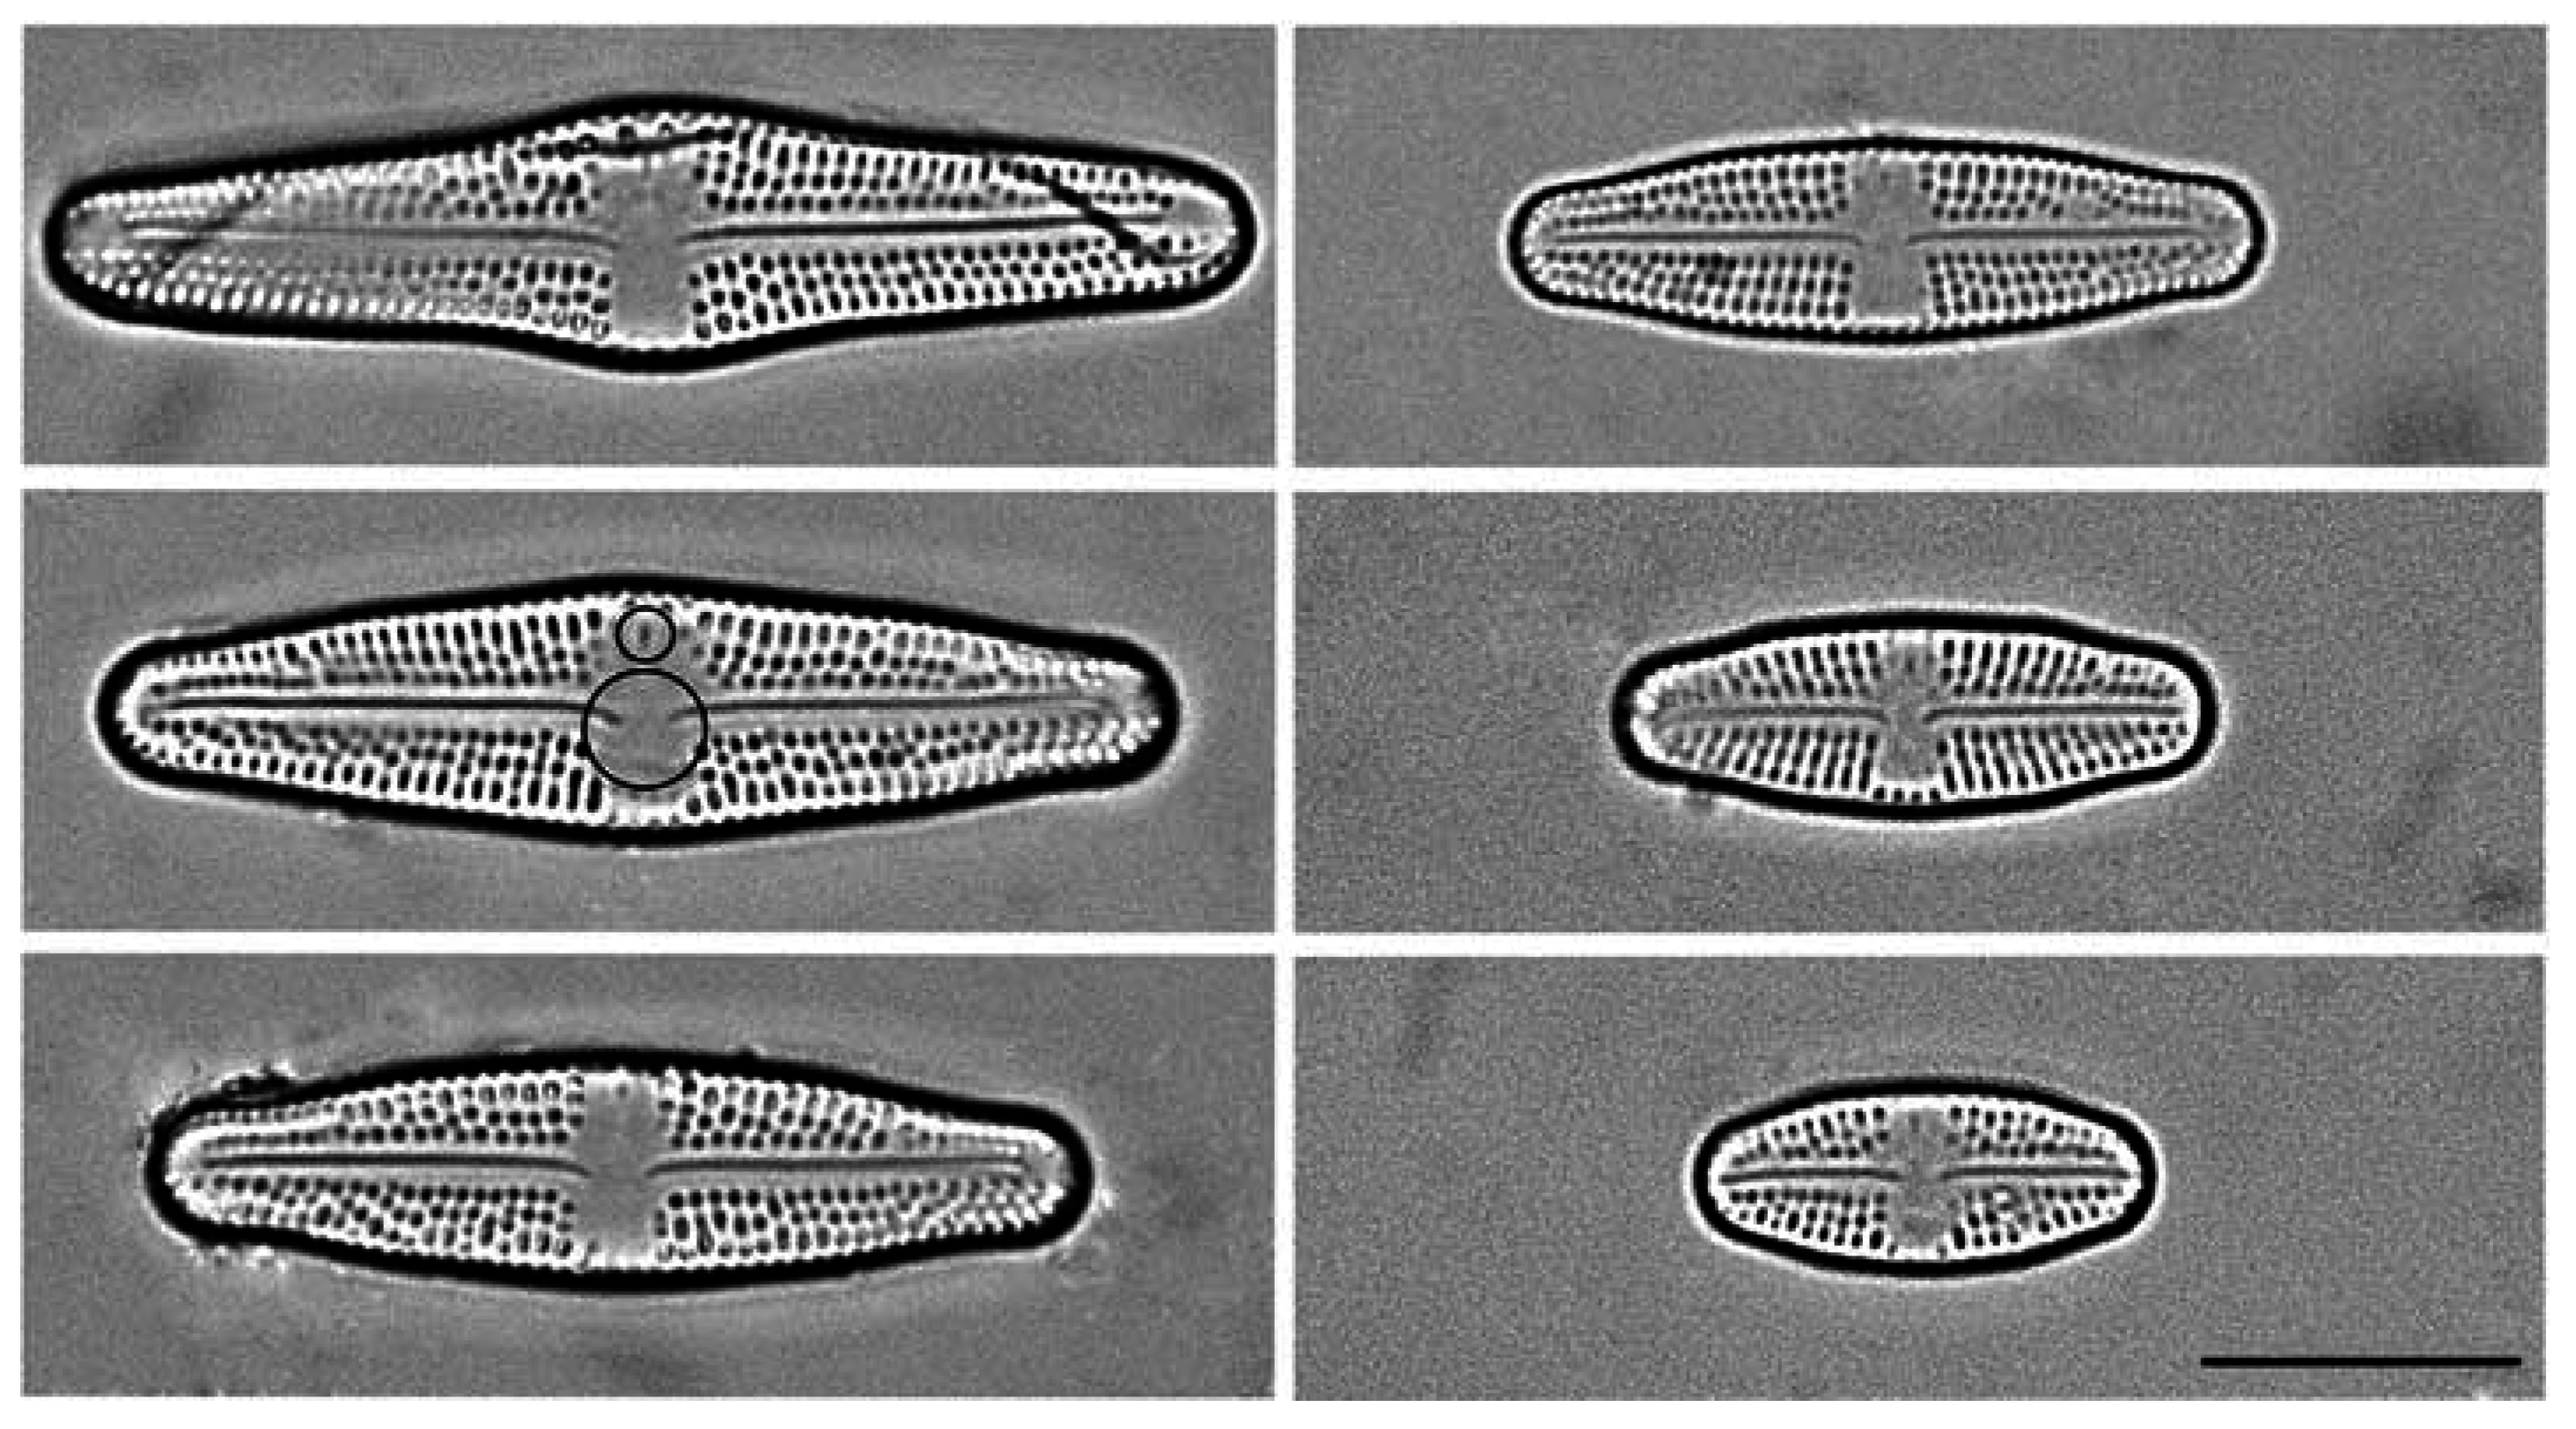
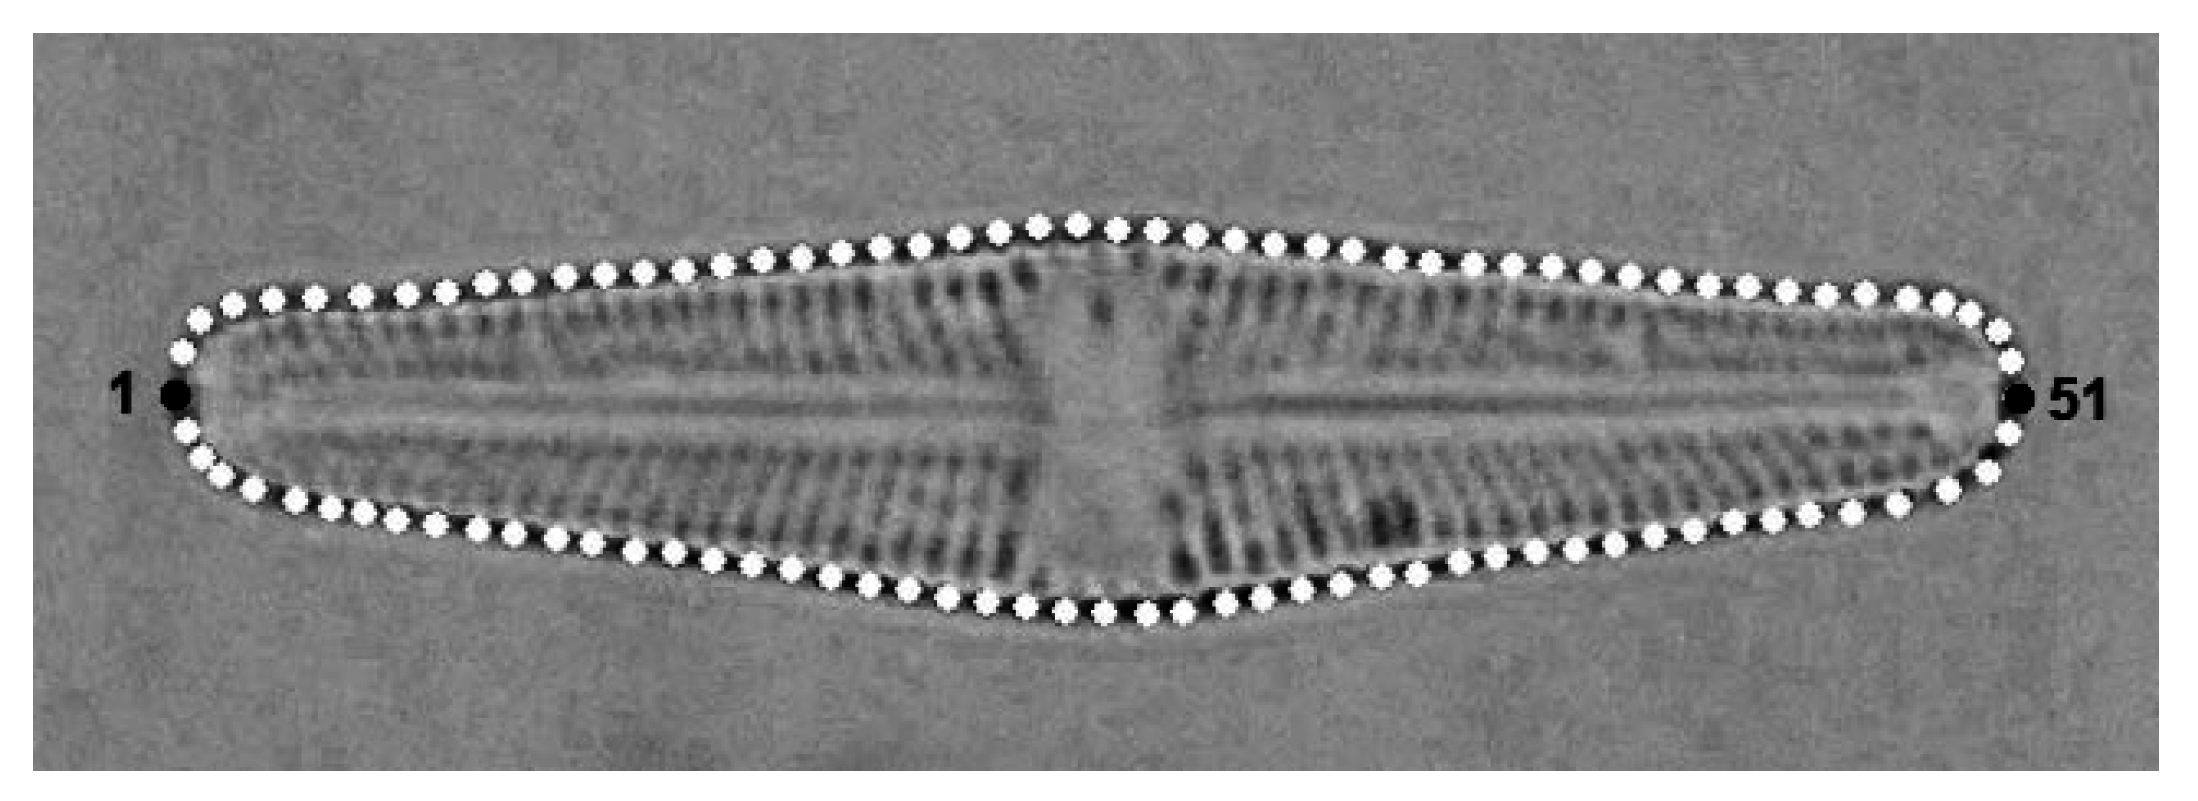
2.1. Culturing and Data Acquisition

Two monoclonal strains of the raphid diatom Luticola poulickovae Levkov, Metzeltin & A. Pavlov (strains LUTM 59: Luticola 1; and LUTM 48: Luticola 2 [27]) were used in this study. Both strains were cultivated for over a year to capture the entire size range of the cells throughout the life cycle, as described in our previous study [23]. The strains were cultivated in liquid WC medium [28] at 18 °C in 7 cm diameter Petri dishes and illuminated at 40 µmol·m−2·s−1 by 18-W cool fluorescent tubes (Phillips TLD 18W/33, Amsterdam, The Netherlands). The medium was exchanged weekly to avoid nutrient depletion, and approximately 10% of the cells were transplanted to new Petri dishes monthly in order to avoid overcrowding. Samples were collected from the cultures and processed for light microscopy analysis every second month [23]. Permanent slides were made from the samples [27,29], with micrographs of 50 valves captured from each permanent slide (i.e., a sample corresponding to a certain life-cycle stage in a culture) using an Olympus BX-51 light microscope (Olympus Corporation, Tokyo, Japan) fitted with an Olympus Z5060 digital camera. The digital micrographs were compiled in Adobe Photoshop CS3 version 10.0 (Adobe Adobe Systems Incorporated, San Jose, CA, USA), and mixed together resulting in one set of micrographs for each strain containing a whole size range of the population. Then, valves were randomly chosen for statistical analyses (75 valves of Luticola 1, 72 valves of Luticola 2). The shapes of the valves were registered in TpsDig, version 2.26 [30]. In total, 100 landmarks were positioned along the valve outline. Two landmarks were in fixed positions (numbers 1 and 51: intersection of the valve outline with the apical axis), with the remaining 98 landmarks allowed to slide along the outline between the fixed landmarks (2–50; 52–100), (Figure 2).

2.2. Geometric Morphometrics
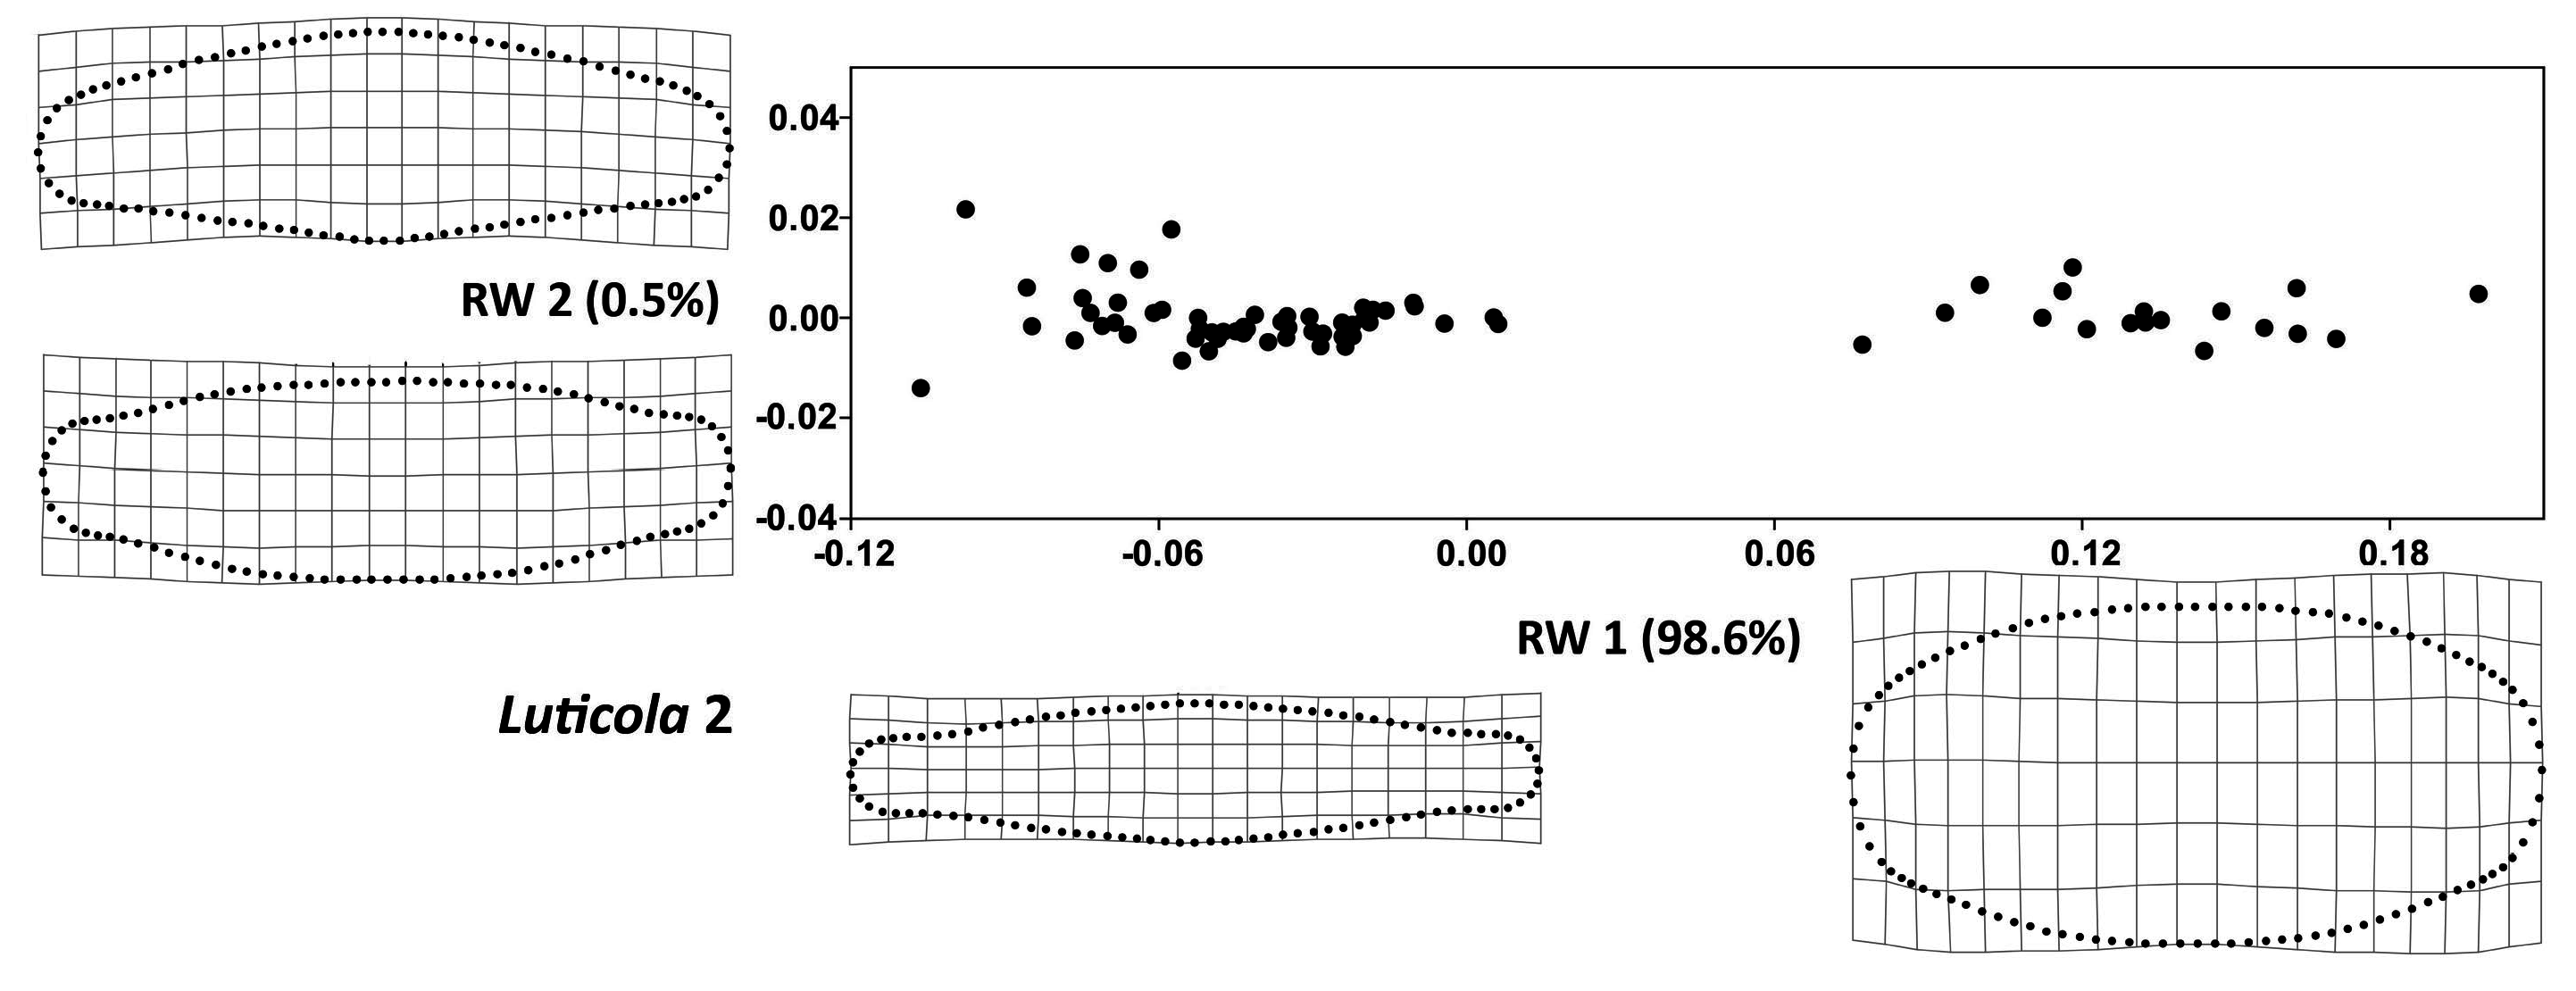
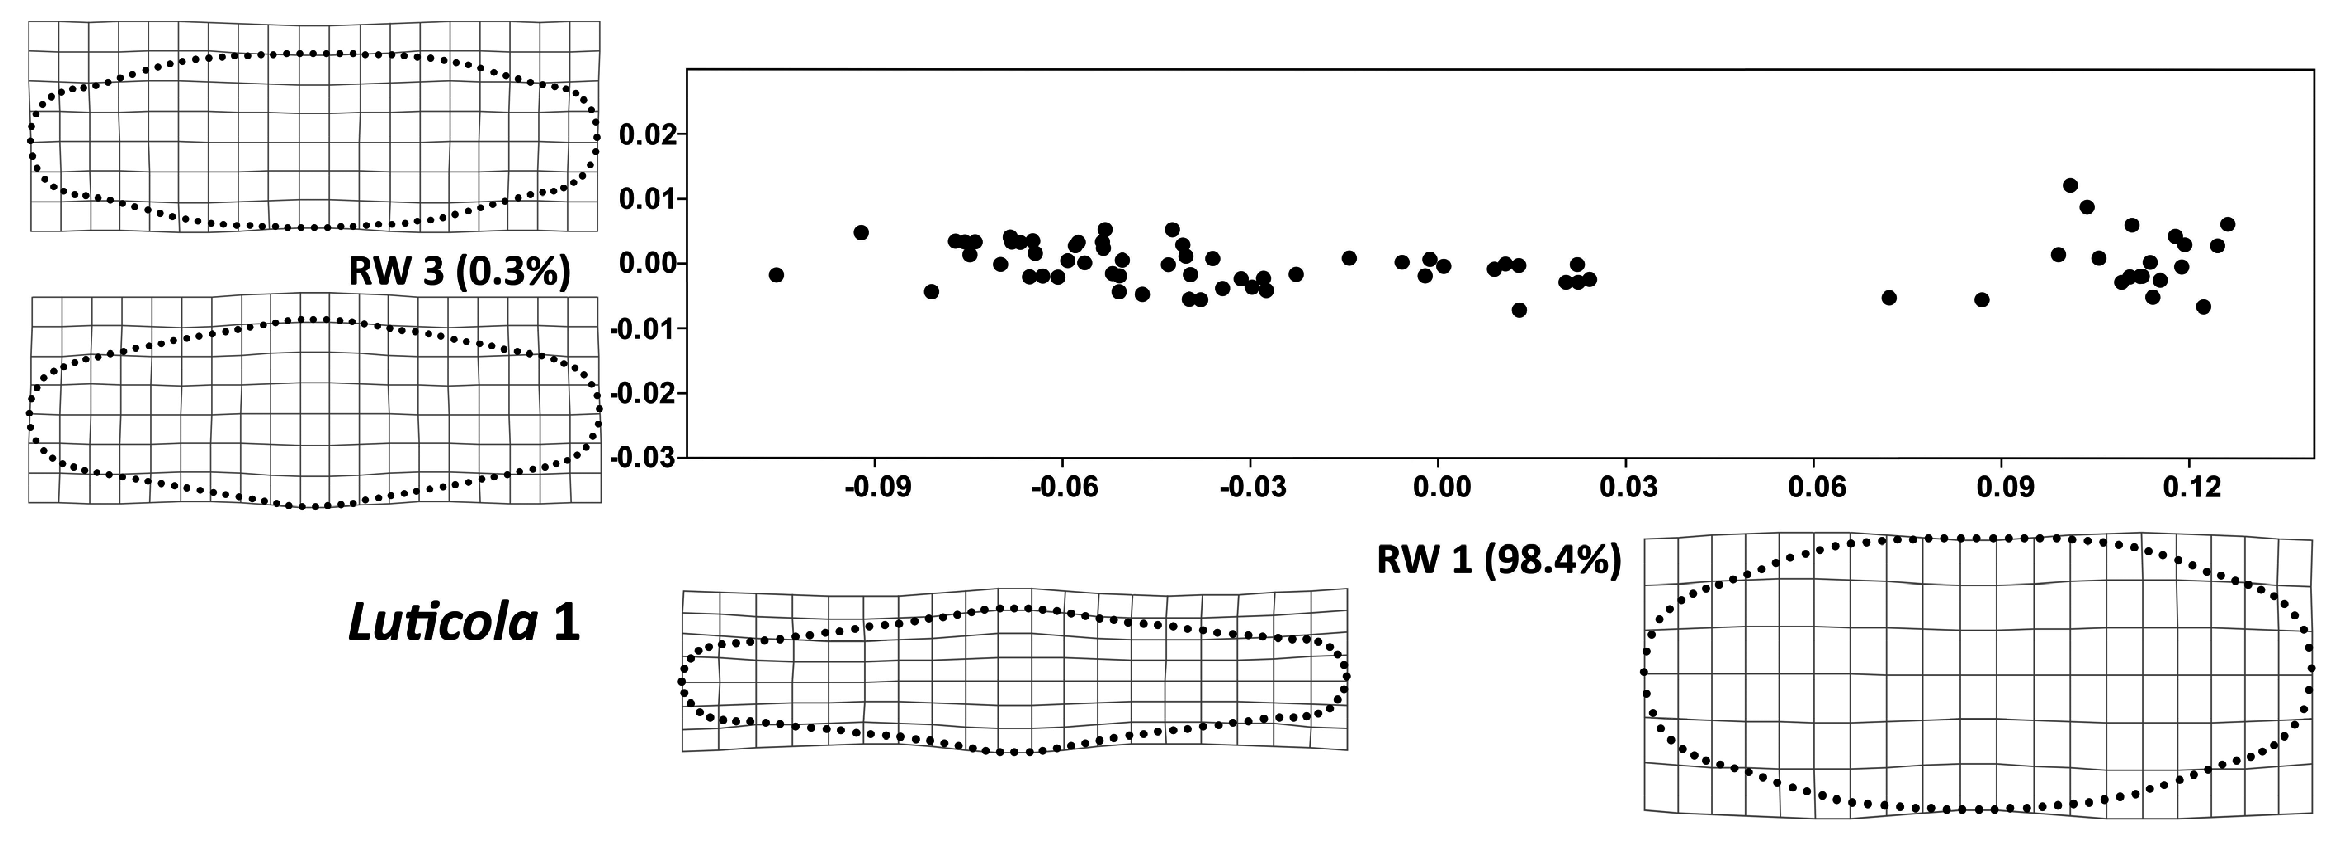
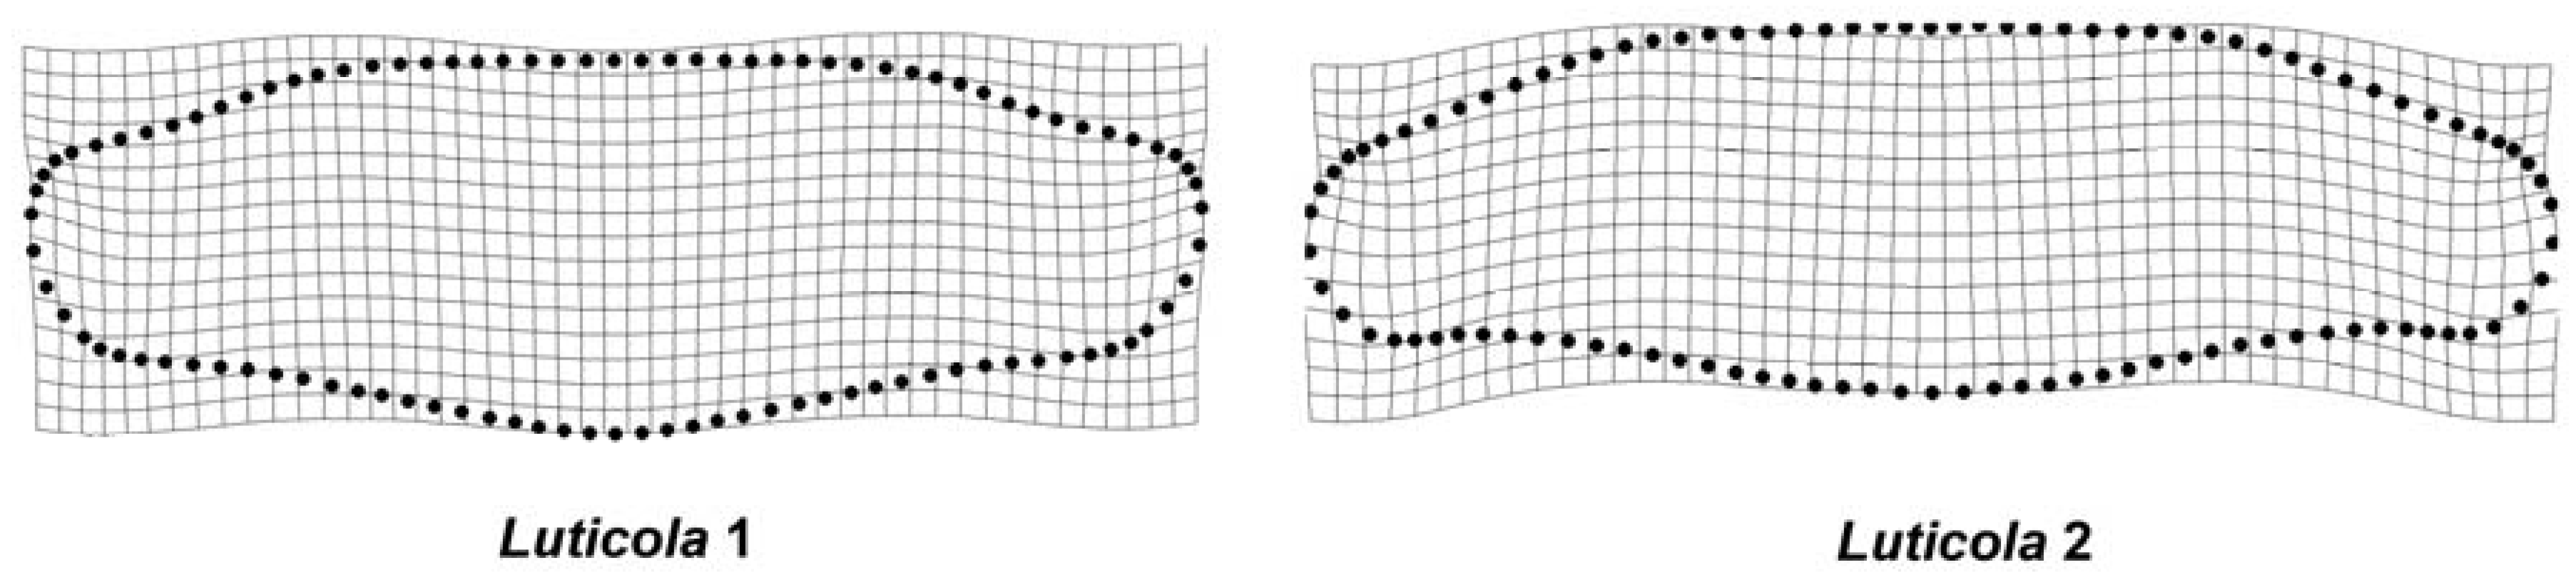
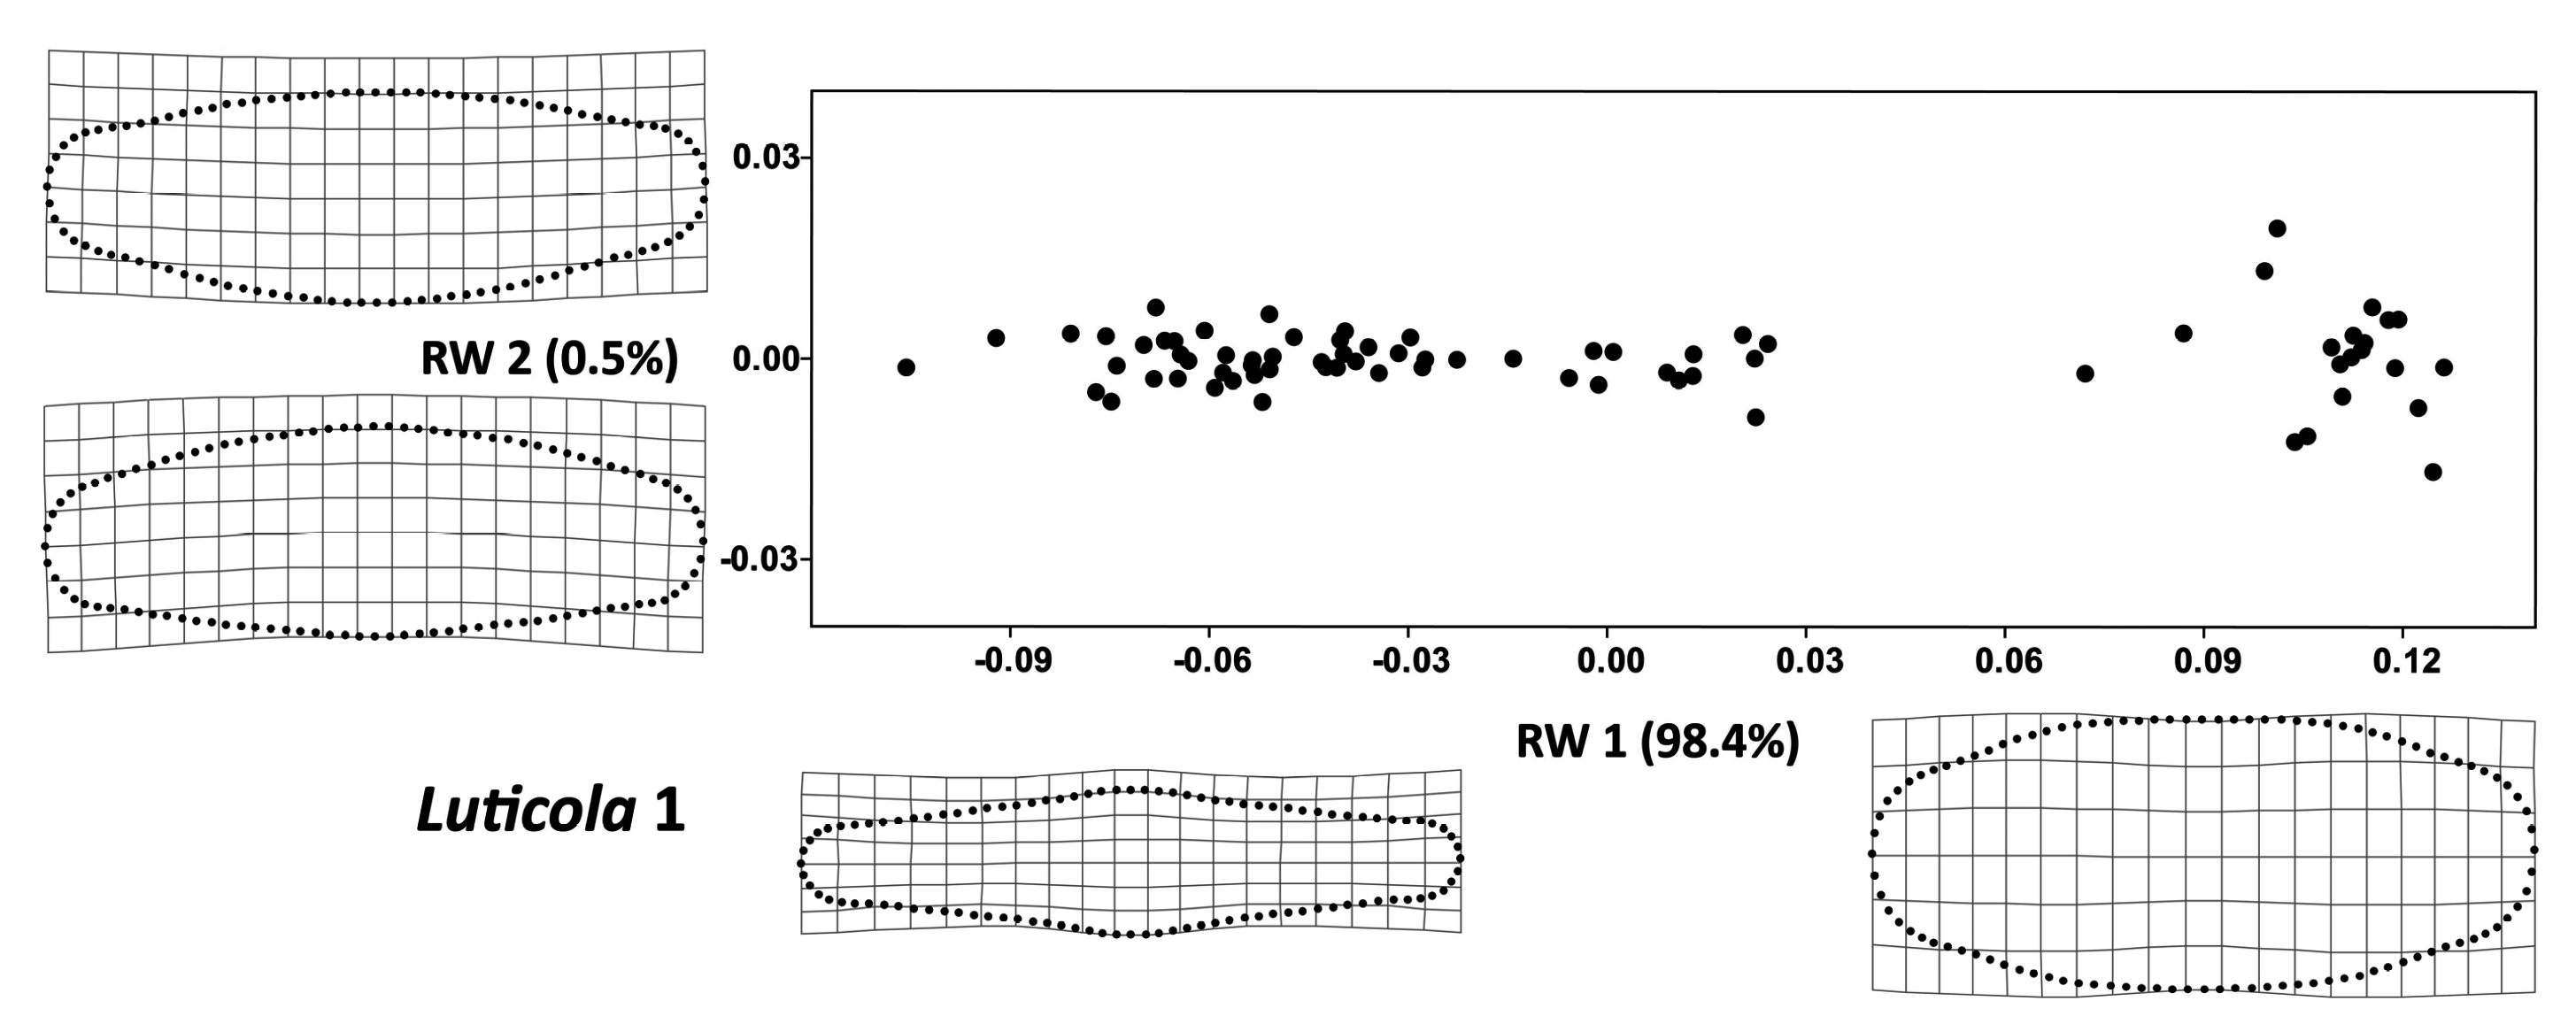
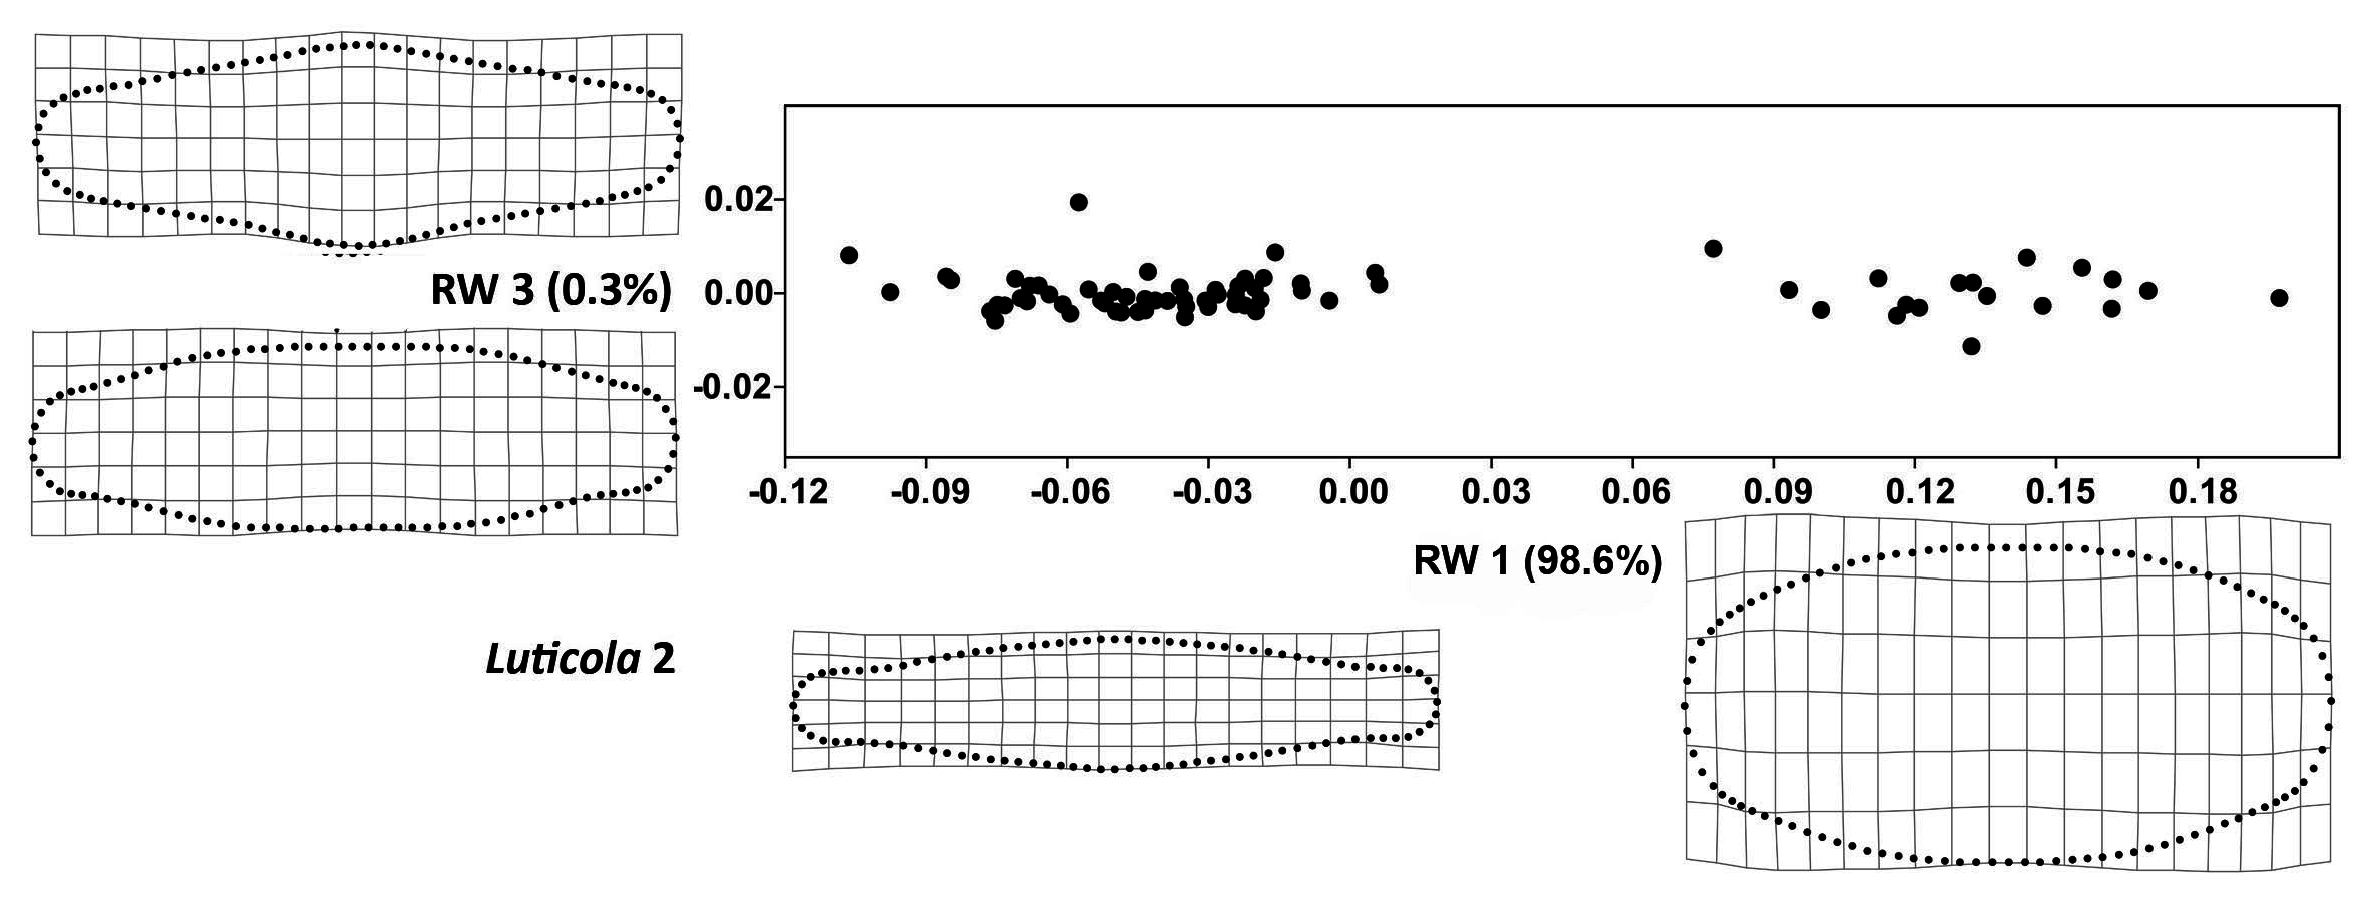
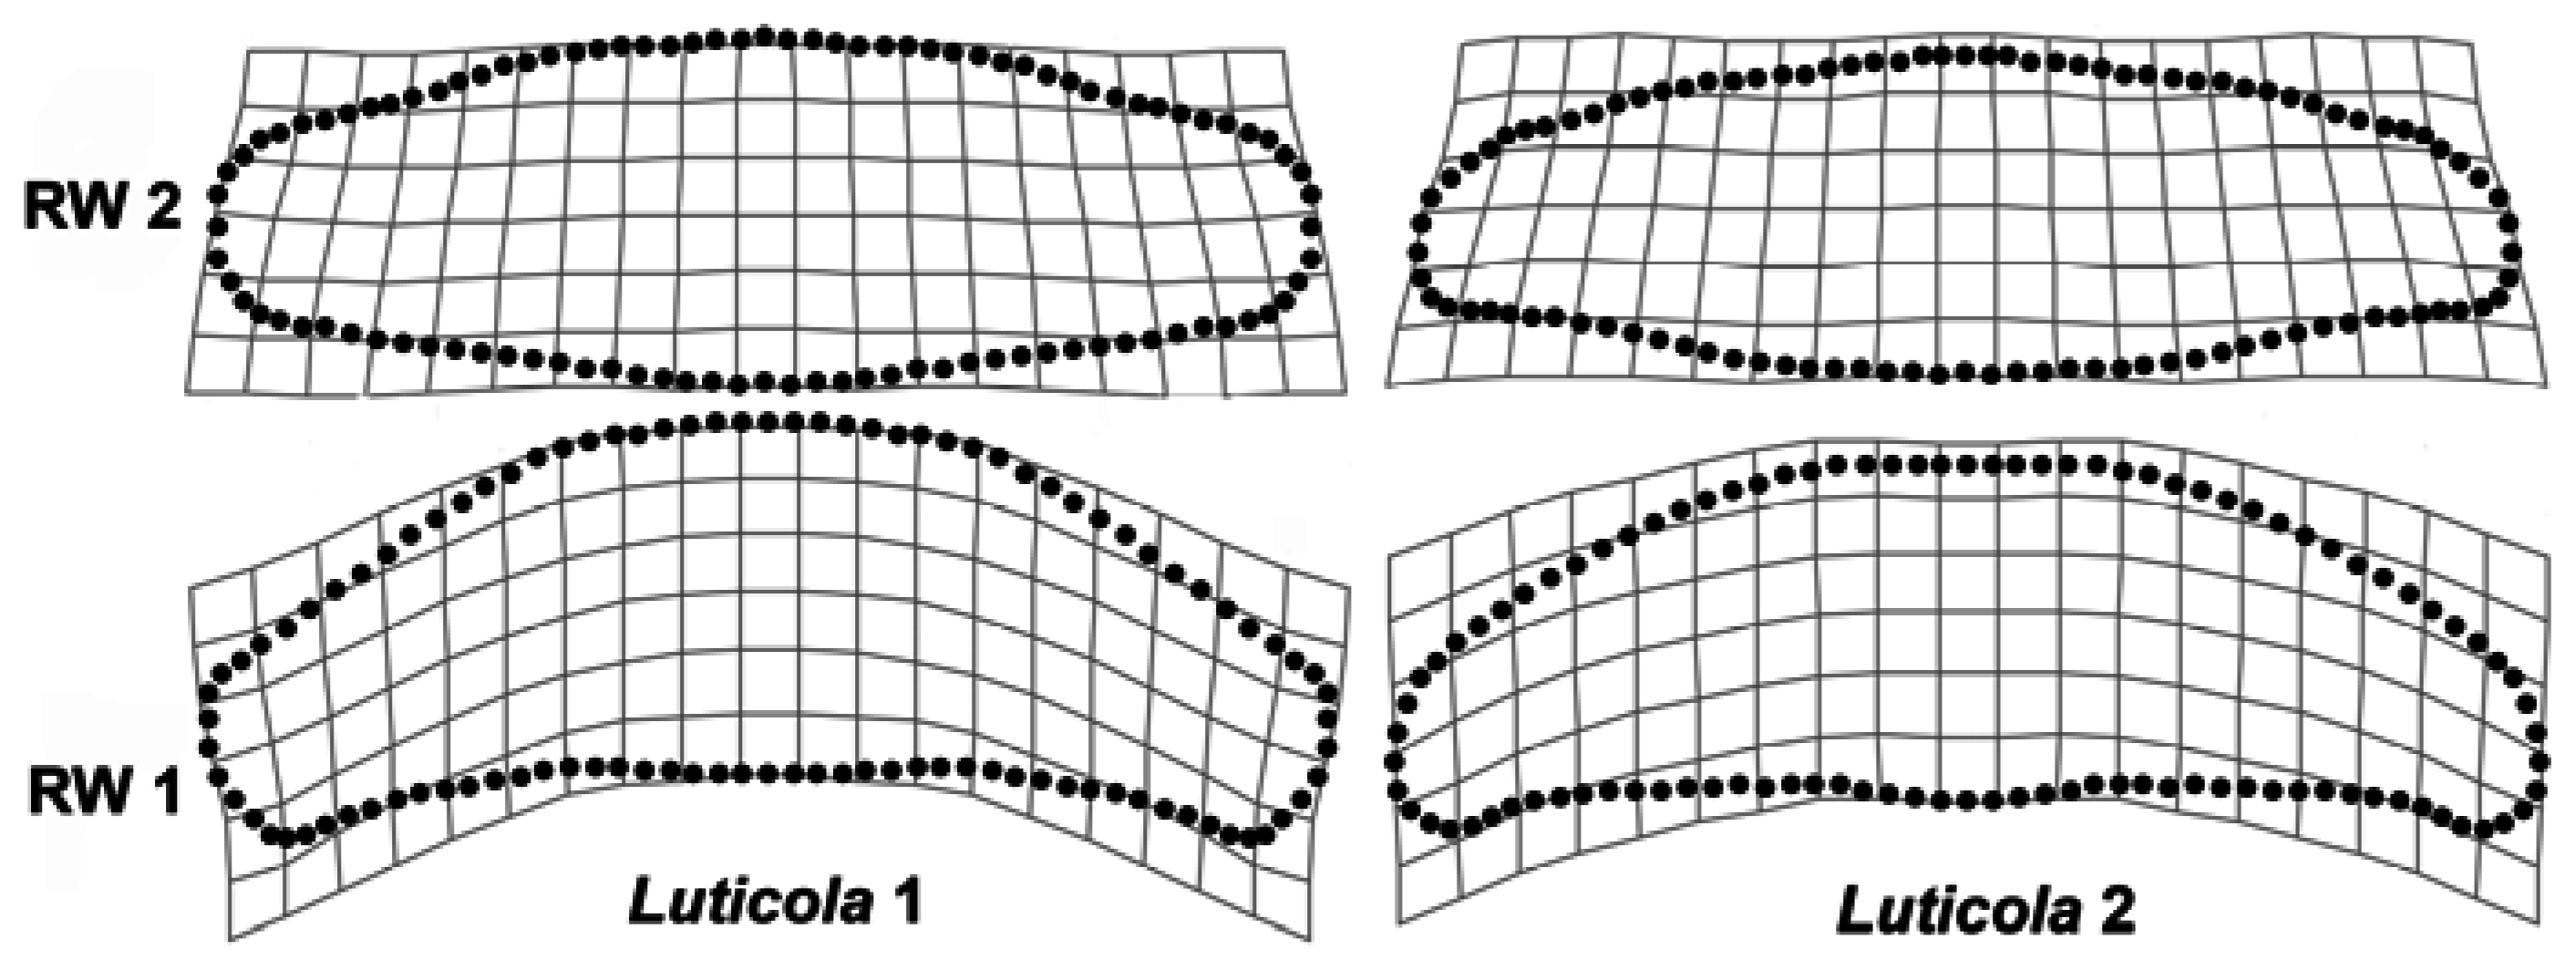
The valves of L. poulickovae are symmetric according to two orthogonal axes, the longitudinal (apical) axis and the transapical axis. Asymmetry across the transapical axis, which was not examined in this study, was removed from the dataset by averaging the landmark and semi-landmark coordinates of the original and reflected/relabeled configurations [10]. Generalized Procrustes analysis (GPA) of this combined dataset also involved sliding the semi-landmarks depicting the outline shape of the valves. The locations of the individual semi-landmarks were optimized by minimizing the bending energy between the reference and target specimens [31], and empirical morphospaces of the averaged configurations in each strain were visualized using relative warps analysis with alpha set to zero, which yielded relative warps equivalent to the principal components of the principal component analysis (PCA) based on the tangent Procrustes coordinates. These analyses were conducted in TpsRelw, ver. 1.42 [30].
For the analysis of asymmetry across the longitudinal axis, we prepared the dataset of the original configurations, as well as those reflected across the symmetry axis of interest, and relabeled them accordingly. Amounts of symmetric variation among individuals, and the DA and FA in both datasets, were quantified and evaluated in two multivariate non-parametric Procrustes ANOVA models. The function ”bilat.symmetry”, implemented in package ”geomorph” version 3.0.0 [32], was used in R 3.2.3 [33]. This function performed the Procrustes ANOVA of morphological symmetry; that is, the multivariate analysis of variance based on a matrix of tangent Procrustes distances among the original and reflected/relabeled configurations. In this analysis, variation was partitioned into several sources and designated as ”individual”, spanning shape differences among the valves; ‘side’, signifying DA, or the differences in the shapes of both symmetric halves across the longitudinal axis in each valve; their interaction ”individual × side”, which denoted FA, or the random fluctuations around the asymmetric mean in each valve; and ‘measurement error’, which illustrated the amount of variation spanned by digitization imprecision [10,34]. Contrary to the original description of Procrustes ANOVA of object symmetry spanned by the geometric morphometric data, the number of degrees of freedom (df) is not obtained via multiplication of the number of landmarks and dimensions subtracted by those lost during GPA [32], as the distance-based Procrustes ANOVA implemented in the ‘geomorph’ package involves computation of df based on the actual number of observations instead; as such, variation is partitioned from the matrix of tangent Procrustes distances among the configurations. One advantage of this approach is that there are no limitations on using semilandmarks, which would otherwise yield incorrect df in the model. The p-values denoting the level of significance of the effects in the model are established by comparing the F-values for each factor to those obtained by 999 random permutation of the shape data (i.e., the rows of the data matrix) [32,35]. In addition, the Z-scores, defined as FobsFrand, depict the effect sizes for each term of the model. The shape changes in valve outlines, corresponding to of DA and FA, were visualized by thin-plate splines in TpsRelw, ver. 1.42 and TpsSplin, ver. 1.20 [30]. The initial TPS grids were square in order to clearly illustrate the deformations [36]. For FA, the deformations of thin-plate splines were magnified four times, and for DA, the deformations were magnified 10 times.
Total asymmetry of individual valves across the longitudinal axis was computed as follows: the original and reflected/relabeled configurations were subjected to a joint PCA that yielded principal components that differentiated between the symmetric and asymmetric variation [5,12]. Then, total asymmetry of individual valves was computed as a sum of the absolute values of their scores on all the asymmetric principal components. Likewise, the amount of FA for each specimen was computed as the sum of the absolute values of scores on the principal components yielded by PCA of the FA shape coordinates resulting from the Procrustes ANOVA. These values were related to the centroid sizes of individual valves via linear correlation analyses in Past ver. 2.17 [37].

3. Results

The RW 1 axes (Figure 3 and Figure 4) accounted for more than 98% of variability in both strains. The valve shape along the RW 1 axis varied between narrow valve outlines with a broad, rounded central area and round outlines with less pronounced undulations, a trend that was similar in both strains. At the same time, the shape variation of the examined strains, described by RW 2 and RW 3, differed slightly; in Luticola 1, RW 2 (Figure 5) corresponded to asymmetry along the apical axis of the valves, whereas in Luticola 2 (Figure 6), this asymmetry was also accompanied by broadness of the central area of the valves. In Luticola 1, RW 3 represented the variability of valve outlines with broad central areas, and outlines with relatively narrow central areas and round apical parts, whereas in Luticola 2, the shape along RW 3 varied between valve outlines with broad and round central areas with relatively wide apical parts and outlines with straight, almost tapered central areas.
Both Procrustes ANOVA models yielded strikingly similar results (Table 1 and Table 2). The shape differences among individual valves were strongly significant and—by looking at the mean squares of individual effects—they were approximately 10 times larger than the asymmetry between both sides of the valves. However, DA still proved to be highly significant and considerably larger than the FA, spanned by the individual × side interaction. FA was relatively subtle, with mean squares about 11 and 19 times lower than for DA, and Z-scores approximately 7 and 11 times lower than for DA. In addition, FA was, on average, only ~2.7 times higher than ME, yet still yielded weakly significant random distributions of F-ratios, with p-values between 0.02 and 0.03. The FA shape trends were represented by magnified thin-plate splines. In Luticola 1, RW 1 represented curved valve outlines and RW 2 represented valves with undulated sides and broad apical parts. In Luticola 2, the trends were similar, except that the undulation of the valves was more pronounced on the secondary valve side (with a stigma) and the apical parts were slightly curved (Figure 7).
Systematic asymmetry of valve outlines, spanned by the DA effect in the Procrustes ANOVA models, was relatively similar in both populations. The actual shape trends were generally too subtle to be visible on the micrographs alone, but the magnified thin-plate splines showed that the central parts of the valves were asymmetrically bulged on the side of the proximal raphe ends deflection (Figure 8); moreover, the apical parts of the valves were slightly bent in the same direction, but this trend was rather less conspicuous in Luticola 1 than in Luticola 2. The opposite side of the valve outlines was straighter, and did not exhibit any distinctive bulges.
There were profound size variations within both datasets—the centroid size of the valves was reduced by 2.6 times in Luticola 1 and by 2.8 times in Luticola 2. This was mirrored by pronounced shape allometry, spanned by the first principal components of both PCAs of the original datasets. However, valve size was not significantly correlated with either total asymmetry or FA (Table 3). In Luticola 1, the relationship between centroid size and total asymmetry yielded a p-value only slightly above 0.05, but this analysis included a single outlying valve with a large centroid-size and total asymmetry values.

4. Discussion

Cell size declined markedly during the vegetative phase of the life cycle, and strong allometric effect caused profound shape differences between big and small cells [23]. This pattern was reflected in our Procrustes ANOVA models by components of symmetric variation among the cells (factor “individual”) that revealed highly significant variability in both populations. DA was strongly significant in both populations. Although this asymmetry is slight and cannot be unambiguously discerned via direct microscopic observation, it implies that valve outlines of L. poulickovae are systematically asymmetric with respect to the position of their stigma. Slight DA of L. poulickovae valve outlines may be related to the general pattern of diatom frustule morphogenesis; in raphid diatoms, the raphe system is deposited first on one side of the valve (the primary side) and then on the other (the secondary side) [38], an irregularity that may affect the outline and result in DA of valves. Alternatively, it is possible that the observed DA of Luticola outline shape is related to the asymmetric central area, and thus genera in which such structures are absent should approximate ”ideally” symmetric outline shapes with much more precision than Luticola species. As such, it would also be informative to examine whether systematic asymmetry between the left and right sides of the valve occurs in other raphid diatom species and genera, including those lacking any asymmetric structures in the raphe or central area but possessing distinct Voigt discontinuities (such as the genus Neidium), which could also be used for recognition of left and right sides of the valves. Conversely, although it is not possible to separate DA and FA in genera that lack distinctly asymmetric valve features, levels of total asymmetry can still be compared. Considering the predominance of DA in L. poulickovae, it is plausible to test whether species and genera with asymmetric central areas have consistently higher levels of total asymmetry than do species with symmetrical central areas. These analyses of total asymmetry could be based on PCA of the Procrustes-aligned configurations that form the symmetry group of the biradial object under study [6,12,39]. Specifically, a variant of this method that includes separate PCAs of the symmetry group for each cell would allow straightforward comparison of the datasets with different numbers of cells [23], an analysis closely related to the continuous symmetry measure introduced by Zabrodsky et al. [11,40,41].
Small but detectable levels of FA, indicative of developmental instability during the morphogenetic process, did not change with cell size. Relatively small sample sizes in analyses decomposing DA, FA, and ME in geometric morphometric studies typically lead to low FA estimates with respect to ME [9]. In addition, relatively low F-ratios for FA could have been produced by high ME, which has been affected by the quality of microphotographs and semilandmark placement along the outlines. Higher ME levels may be expected in geometric morphometric studies involving multiple semilandmarks [42] and this may worsen the FA estimates in datasets such as those used in the present study. In addition, FA estimates in analyses based on the mixed-model two-way Procrustes ANOVA may be confounded with antisymmetry [9,43], which cannot be considered as developmental instability. Therefore, application of the Procrustes methods based on registration of curves by semilandmarks for FA quantification may be fundamentally complicated by these issues. However, it should be mentioned that ME levels could possibly be significantly limited by using high-precision microphotographs; and F-ratios for FA could also be higher in analyses based on extensive datasets with high numbers of specimens [9].
Our study showed that total asymmetry was unchanged during the size-diminution period of the life cycle [23]. On the other hand, some studies suggest a possible increase of asymmetric valve shape and ornamentation deviations with decreasing size [13,14,15,24]. Our previous study also showed a significant increase of shape variability in clonal populations with decreasing size which is supported by Schmid’s [13] hypothesis that morphological inaccuracies during diatom morphogenesis are passed on to next generations, and that their number and magnitude increases during the vegetative phase of the life cycle. However, this above-mentioned increase in variance apparently remained within the symmetric component of the shape variability and therefore the levels of FA and DA were uncorrelated with cell size. On the other hand, independence of FA levels on the life cycle stage of cells highlights its potential for use in environmental assessments based on the morphology of diatom populations. It has previously been shown that FA in aquatic organisms correlates with environmental pollutants that influence the developmental processes [39,44,45]. Falasco et al. [24] also showed that increased occurrence of teratological forms in natural populations of diatoms could be linked to a variety of anthropogenic pollutants. Therefore, provided that reliable estimates of FA in shapes of diatom valves could be obtained by geometric morphometrics or related methods, such as elliptical Fourier analysis (EFA) [46], they might then be used as model systems in biomonitoring of freshwater and marine ecosystems.
Possible drawbacks of the applied methodology, illustrated by relatively high ME estimates in Procrustes ANOVA models, could be overcome by using some of the alternative methods of outline analysis in morphometrics, such as EFA [46]. In that context, decomposition of symmetric variation and individual components of asymmetry (DA, FA) could be based on parallel extraction of coefficients of the harmonic functions characterizing the valve outlines before and after their reflection across the axis of symmetry. Resulting coefficients could then be analyzed in ANOVA models similar to those used in the landmark-based studies. Comparison of such parallel analyses in objects, such as diatom valves, and their ME levels in comparison to detected values of FA could provide a valuable guideline for future research in this field.
With regard to diatom morphological evolution, studies based on cladistic analysis of morphological characters [47], or studies based on analyses of theoretical morphospace [48,49] suggest that strongly asymmetric forms may have evolved from symmetric ancestors. Interestingly, genera with cymbelloid (apical) or gomphonemoid (transapical) types of asymmetry typically have symmetric initial cells (the first cell in the beginning of the life cycle), with apical or transapical asymmetry developing during the vegetative multiplication phase [48,50]. However, molecular phylogenetic research has failed to conclusively support the above-mentioned hypotheses [21]. Nevertheless, if it is taken into account that diatoms with asymmetric central areas may have slightly asymmetric outlines, it is then possible to consider them as theoretical intermediate stages in the evolution of cymbelloid forms with apical asymmetry.

Acknowledgments

The authors express their gratitude to Charles University in Prague for the financial support of this work. The English language and style corrections were made by Editage. We also thank the anonymous reviewers for their critique and recommendations that improved the manuscript.

Author Contributions

Jiří Neustupa conceived and designed the research; Kateřina Woodard performed the experiments; both Jiří Neustupa and Kateřina Woodard analyzed the data and wrote the paper.

Conflicts of Interest

The authors declare no conflicts of interest.

References

  1. Neustupa, J.; Hodac, L. Changes in shape of the coenobial cells of an experimental strain of Pediastrum duplex var. duplex (Chlorophyta) reared at different pHs. Preslia 2005, 77, 439–452. [Google Scholar]
  2. Lenarczyk, J. Morphological plasticity of the microscopic green alga Pseudopediastrum boryanum (Chlorophyceae) under varying nutrient concentrations. Nova Hedwig. 2016, 102, 373–390. [Google Scholar] [CrossRef]
  3. Verbruggen, H.; Clerck, O.D.; Coppejans, E. Deviant segments hamper a morphometric approach towards Halimeda taxonomy. Cryptogam. Algol. 2005, 26, 259–274. [Google Scholar]
  4. Brook, A.J. The Biology of Desmids, 16th ed.; University of California Press: Berkeley, CA, USA, 1981; p. 276. [Google Scholar]
  5. Savriama, Y.; Neustupa, J.; Klingenberg, C.P. Geometric morphometrics of symmetry and allometry in Micrasterias rotata (Zygnemophyceae, Viridiplantae). Nova Hedwig. Beih. 2010, 136, 43–54. [Google Scholar]
  6. Neustupa, J. Patterns of symmetric and asymmetric morphological variation in unicellular green microalgae of the genus Micrasterias (Desmidiales, Viridiplantae). Fottea 2013, 13, 53–63. [Google Scholar] [CrossRef]
  7. Afanasieva, M.S. Radiolarian skeleton: Morphology of spines, internal framework, and primary sphere. Paleontol. J. 2007, 41, 1–14. [Google Scholar] [CrossRef]
  8. Potapova, M.; Hamilton, P.B. Morphological and ecological variation within the Achnanthidium minutissimum (Bacillariophyceae) species complex. J. Phycol. 2007, 43, 561–575. [Google Scholar] [CrossRef]
  9. Klingenberg, C.P. Analyzing fluctuating asymmetry with geometric morphometrics: Concepts, methods, and applications. Symmetry 2015, 7, 843–934. [Google Scholar] [CrossRef]
  10. Klingenberg, C.P.; Barluenga, M.; Meyer, A. Shape analysis of symmetric structures: Quantifying variation among individuals and asymmetry. Evolution 2002, 56, 1909–1920. [Google Scholar] [CrossRef] [PubMed]
  11. Graham, J.H.; Raz, S.; Hel-Or, H.; Nevo, E. Fluctuating asymmetry: Methods, theory and applications. Symmetry 2010, 2, 466–540. [Google Scholar] [CrossRef]
  12. Savriama, Y.; Klingenberg, C.P. Beyond bilateral symmetry: Geometric morphometric methods for any type of symmetry. BMC Evol. Biol. 2011, 11, 280. [Google Scholar] [CrossRef] [PubMed]
  13. Schmid, A.M. Aspects of morphogenesis and function of diatom cell walls with implications for taxonomy. Protoplasma 1994, 181, 43–60. [Google Scholar] [CrossRef]
  14. Hostetter, H.P.; Hoshaw, R.W. Asexual developmental patterns of the diatom Stauroneis anceps in culture. J. Phycol. 1972, 8, 289–296. [Google Scholar]
  15. Hostetter, H.P.; Rutherford, K.D. Polymorphism of the diatom Pinnularia brebissonii in culture and a field collection. J. Phycol. 1976, 12, 140–146. [Google Scholar]
  16. Round, F.E.; Crawford, R.M.; Mann, D.G. The Diatoms: Biology and Morphology of the Genera; Cambridge University Press: Cambridge, UK, 1990; p. 131. [Google Scholar]
  17. Edgar, S.M.; Theriot, E.C. Phylogeny of Aulacoseira (Bacillariophyta) based on molecules and morphology. J. Phycol. 2004, 40, 772–788. [Google Scholar] [CrossRef]
  18. Veselá, J.; Neustupa, J.; Pichrtová, M.; Poulíčková, A. Morphometric study of Navicula morphospecies (Bacillariophyta) with respect to diatom life cycle. Fottea 2009, 9, 307–316. [Google Scholar]
  19. Pappas, J.L.; Kociolek, J.P.; Stoermer, E.F. Quantitative morphometric methods in diatom research. Nova Hedwig. Beih. 2014, 143, 281–306. [Google Scholar]
  20. Edgar, R.K.; Saleh, A.I.; Edgar, S.M. A morphometric diagnosis using continuous characters of Pinnunavis edkuensis, sp. nov. (Bacillariophyta: Bacillariophyceae), a brackish-marine species from Egypt. Phytotaxa 2015, 212, 1–56. [Google Scholar] [CrossRef]
  21. Theriot, E.C.; Ashworth, M.; Ruck, E.; Nakov, T.; Jansen, R.K. A preliminary multigene phylogeny of the diatoms (Bacillariophyta): Challenges for future research. Plant Ecol. Evol. 2010, 143, 278–296. [Google Scholar] [CrossRef]
  22. Spaulding, S.A.; Lubinski, D.J.; Potapova, M. Diatoms of the United States. Available online: http://westerndiatoms.colorado.edu (accessed on 5 December 2016).
  23. Woodard, K.; Kulichová, J.; Poláčková, T.; Neustupa, J. Morphometric allometry of representatives of three naviculoid genera throughout their life cycle. Diatom Res. 2016, 31, 231–242. [Google Scholar] [CrossRef]
  24. Falasco, E.; Bona, F.; Badino, G.; Hoffmann, L.; Ector, L. Diatom teratological forms and environmental alterations: A review. Hydrobiologia 2009, 623, 1–35. [Google Scholar] [CrossRef]
  25. Yang, J.R.; Duthie, H.C. Morphology and ultrastructure of teratological forms of the diatoms Stephanodiscus niagarae and S. parvus (Bacillariophyceae) from Hamilton Harbour (Lake Ontario, Canada). Hydrobiologia 1993, 269, 57–66. [Google Scholar] [CrossRef]
  26. Peres-Weerts, F. Mise en E´vidence des Effets Toxiques des Me´taux Lourds sur les Diatome´es par L’e´tude des Formes Te´ratoge`nes; Agence de l’Eau Artois Picardie: Douai, France, 2000; p. 24. (In French) [Google Scholar]
  27. Poulíčková, A. Morphology, cytology and sexual reproduction in the aerophytic cave diatom Luticola dismutica (Bacillariophyceae). Preslia 2008, 80, 87–99. [Google Scholar]
  28. Andersen, R.A. Algal Culturing Techniques; Elsevier Academic Press: London, UK, 2005; p. 578. [Google Scholar]
  29. Poulíčková, A.; Mann, D.G. Sexual reproduction in Navicula cryptocephala (Bacillariophyceae). J. Phycol. 2006, 42, 872–886. [Google Scholar] [CrossRef]
  30. Rohlf, F.J. The TPS series of software. Hystrix Ital. J. Mammal. 2015, 26, 9–12. [Google Scholar]
  31. Bookstein, F.L. Morphometric Tools for Landmark Data: Geometry and Biology; Cambridge University Press: Cambridge, UK, 1997; p. 436. [Google Scholar]
  32. Adams, D.C.; Otárola-Castillo, E. Geomorph: An R package for the collection and analysis of geometric morphometric shape data. Methods Ecol. Evol. 2013, 4, 393–399. [Google Scholar] [CrossRef]
  33. R Development Core Team. R: A Language and Environment for Statistical Computing; R Foundation for Statistical Computing: Vienna, Austria, 2013; Available online: https://www.r-project.org/ (accessed on 9 July 2016).
  34. Klingenberg, C.P.; McIntyre, G.S. Geometric morphometrics of developmental instability: Analyzing patterns of fluctuating asymmetry with Procrustes methods. Evolution 1998, 52, 1363–1375. [Google Scholar] [CrossRef]
  35. Collyer, M.L.; Sekora, D.J.; Adams, D.C. A method for analysis of phenotypic change for phenotypes described by high-dimensional data. Heredity 2014, 115, 357–365. [Google Scholar] [CrossRef] [PubMed]
  36. Slice, D.E. Modern morphometrics. In Modern Morphometrics in Physical Anthropology; Slice, D.E., Ed.; Klewer Press: New York, NY, USA, 2005; pp. 1–45. [Google Scholar]
  37. Hammer, Ø.; Harper, D.A.T.; Ryan, P.D. PAST: Paleontological statistics software package for education and data analysis. Palaeontol. Electron. 2001, 4, 1–9. [Google Scholar]
  38. Mann, D.G. A note on valve formation and homology in the Diatom Genus Cymbella. Ann. Bot. 1981, 47, 267–269. [Google Scholar]
  39. Savriama, Y.; Stige, L.C.; Gerber, S.; Pérez, T.; Alibert, P.; David, B. Impact of sewage pollution on two species of sea urchins in the Mediterranean Sea (Cortiou, France): Radial asymmetry as a bioindicator of stress. Ecol. Indic. 2015, 54, 39–47. [Google Scholar] [CrossRef]
  40. Zabrodsky, H.; Peleg, S.; Avnir, D. Continuous symmetry measures. J. Am. Chem. Soc. 1992, 114, 7843–7851. [Google Scholar] [CrossRef]
  41. Graham, J.H.; Whitesell, M.J.; Flemming, M.; Hel-Or, H.; Nevo, E.; Raz, S. Fluctuating asymmetry of plant leaves: Batch processing with LAMINA and continuous symmetry measures. Symmetry 2015, 7, 255–268. [Google Scholar] [CrossRef]
  42. De Groote, I.; Lockwood, C.A.; Aiello, L.C. Technical note: A new method for measuring long bone curvature using 3D landmarks and semi-landmarks. Am. J. Phys. Anthropol. 2010, 141, 658–664. [Google Scholar] [CrossRef] [PubMed]
  43. Graham, J.H.; Emlen, J.M.; Freeman, D.C.; Leamy, L.J.; Kieser, J.A. Directional asymmetry and the measurement of developmental instability. Biol. J. Linn. Soc. 1998, 64, 1–16. [Google Scholar] [CrossRef]
  44. Lezcano, A.H.; Quiroga, M.L.R.; Liberoff, A.L.; van der Molen, S. Marine pollution effects on the southern surf crab Ovalipes trimaculatus (Crustacea: Brachyura: Polybiidae) in Patagonia Argentina. Mar. Pollut. Bull. 2015, 91, 524–529. [Google Scholar] [CrossRef] [PubMed]
  45. Trono, D.J.V. Fluctuating asymmetry and developmental instability in Protoreaster nodosus (Chocolate Chip Sea Star) as a biomarker for environmental stress. Comput. Ecol. Softw. 2015, 5, 119–129. [Google Scholar]
  46. Lestrel, P.E. Morphometrics for the Life Sciences; World Scientific: Singapore, 2000; p. 261. [Google Scholar]
  47. Kociolek, J.P.; Stoermer, E.F. A preliminary investigation of the phylogenetic relationships among the freshwater, apical pore field-bearing cymbelloid and gomphonemoid diatoms (Bacillariophyceae). J. Phycol. 1988, 24, 377–385. [Google Scholar] [CrossRef]
  48. Pappas, J.L. Theoretical morphospace and its relation to freshwater Gomphonemoid–Cymbelloid diatom (Bacillariophyta) lineages. J. Biol. Syst. 2005, 13, 385–398. [Google Scholar] [CrossRef]
  49. Pappas, J.L. More on theoretical morphospace and its relation to freshwater gomphonemoid-cymbelloid diatom (Bacillariophyta) lineages. J. Biol. Syst. 2008, 16, 119–137. [Google Scholar] [CrossRef]
  50. Cox, E.J.; Willis, L.; Bentley, K. Integrated simulation with experimentation is a powerful tool for understanding diatom valve morphogenesis. Biosystems 2012, 109, 450–459. [Google Scholar] [CrossRef] [PubMed]
Figure 1. Representative cells in the size diminution series of Luticola 2 strain. Note the unilateral deflection of the proximal raphe ends and the asymmetrically positioned stigma in the central area of the valves (designated by circles). Scale bar for all figures = 10 μm.
Symmetry 08 00150 g001
Figure 2. Position of landmarks. Two landmarks were in fixed positions (numbers1 and 51: intersection of the valve outline with the apical axis), with the remaining 98 landmarks allowed to slide along the outline between the fixed landmarks.
Symmetry 08 00150 g002
Figure 3. Total shape variability in the strain Luticola 1 during the size diminution phase of the life cycle represented by ordination plot of the first (RW 2) vs. second (RW 1) relative warp. Thin-plate splines represent the margins of the realized morphospace on a particular warp.
Symmetry 08 00150 g003
Figure 4. Total shape variability in the strain Luticola 2 during the size diminution phase of the life cycle represented by ordination plot of the first (RW 2) vs. second (RW 1) relative warp. Thin-plate splines represent the margins of the realized morphospace on a particular warp.
Symmetry 08 00150 g004
Figure 5. Total shape variability in the strain Luticola 1 during the size diminution phase of the life cycle represented by ordination plot of the third (RW 3) vs. second (RW 1) relative warp. Thin-plate splines represent the margins of the realized morphospace on a particular warp.
Symmetry 08 00150 g005
Figure 6. Total shape variability in the strain Luticola 2 during the size diminution phase of the life cycle represented by ordination plot of the third (RW 3) vs. second (RW 1) relative warp. Thin-plate splines represent the margins of the realized morphospace on a particular warp.
Symmetry 08 00150 g006
Figure 7. FA shape trends in the strains Luticola 1 and Luticola 2 represented by four times magnified thin-plate splines.
Symmetry 08 00150 g007
Figure 8. DA shape trends in the strains Luticola 1 and Luticola 2 represented by 10-times magnified thin-plate splines.
Symmetry 08 00150 g008
Table 1. Results of Procrustes ANOVA evaluating symmetric and asymmetric variation in the strain Luticola 1.
SourcedfSSMSFZp-Value
Individual740.73850.009980152.741.690.001
Side10.00080.00074911.478.390.001
Individual:Side740.00480.0000652.761.170.020
Measurement error1500.00360.000024---
Total2990.7477----
SS: sum of squares; MS: mean squares.
Table 2. Results of Procrustes ANOVA evaluating symmetric and asymmetric variation in the strain Luticola 2.
SourcedfSSMSFZp-Value
Individual710.90580.012757184.881.680.002
Side10.00130.00131719.0812.580.001
Individual:Side710.00490.0000692.721.160.027
Measurement error1440.00370.000025---
Total2870.9157----
Table 3. Results of the linear correlation analyses comparing amounts of total (TA) and fluctuating asymmetry (FA) of valves with their centroid size (CS).
Luticola 1
AnalysisPearson’s rR2Parametric p-valuePermutation p-value
TA vs. CS0.220.0510.0530.055
FA vs. CS0.040.0020.7190.727
Luticola 2
AnalysisPearson’s rR2Parametric p-valuePermutation p-value
TA vs. CS−0.010.00020.9030.904
FA vs. CS−0.190.0380.0980.097

