1. Introduction
Indeed, the city transport planners have been concerned with the society’s satisfaction about the public transportation quality as the fundamental of urban development. The public transportation users’ insights and expectations can be identified according to their responses regarding the importance and satisfaction levels of the public transportation’s quality [
1,
2,
3].
It has been noted that one of the most prevalent issues faced by government and city planners in Malaysia and other developing countries is the service quality of public transportation. Over the last few years, Malaysia has been struggling to provide high-quality public transportation for the consistent increase in town populations by satisfying the country’s economy, as well as persuading investment in the public transportation sector. In 1935, the British introduced the first public transport company in Malaysia by establishing the General Transport Company [
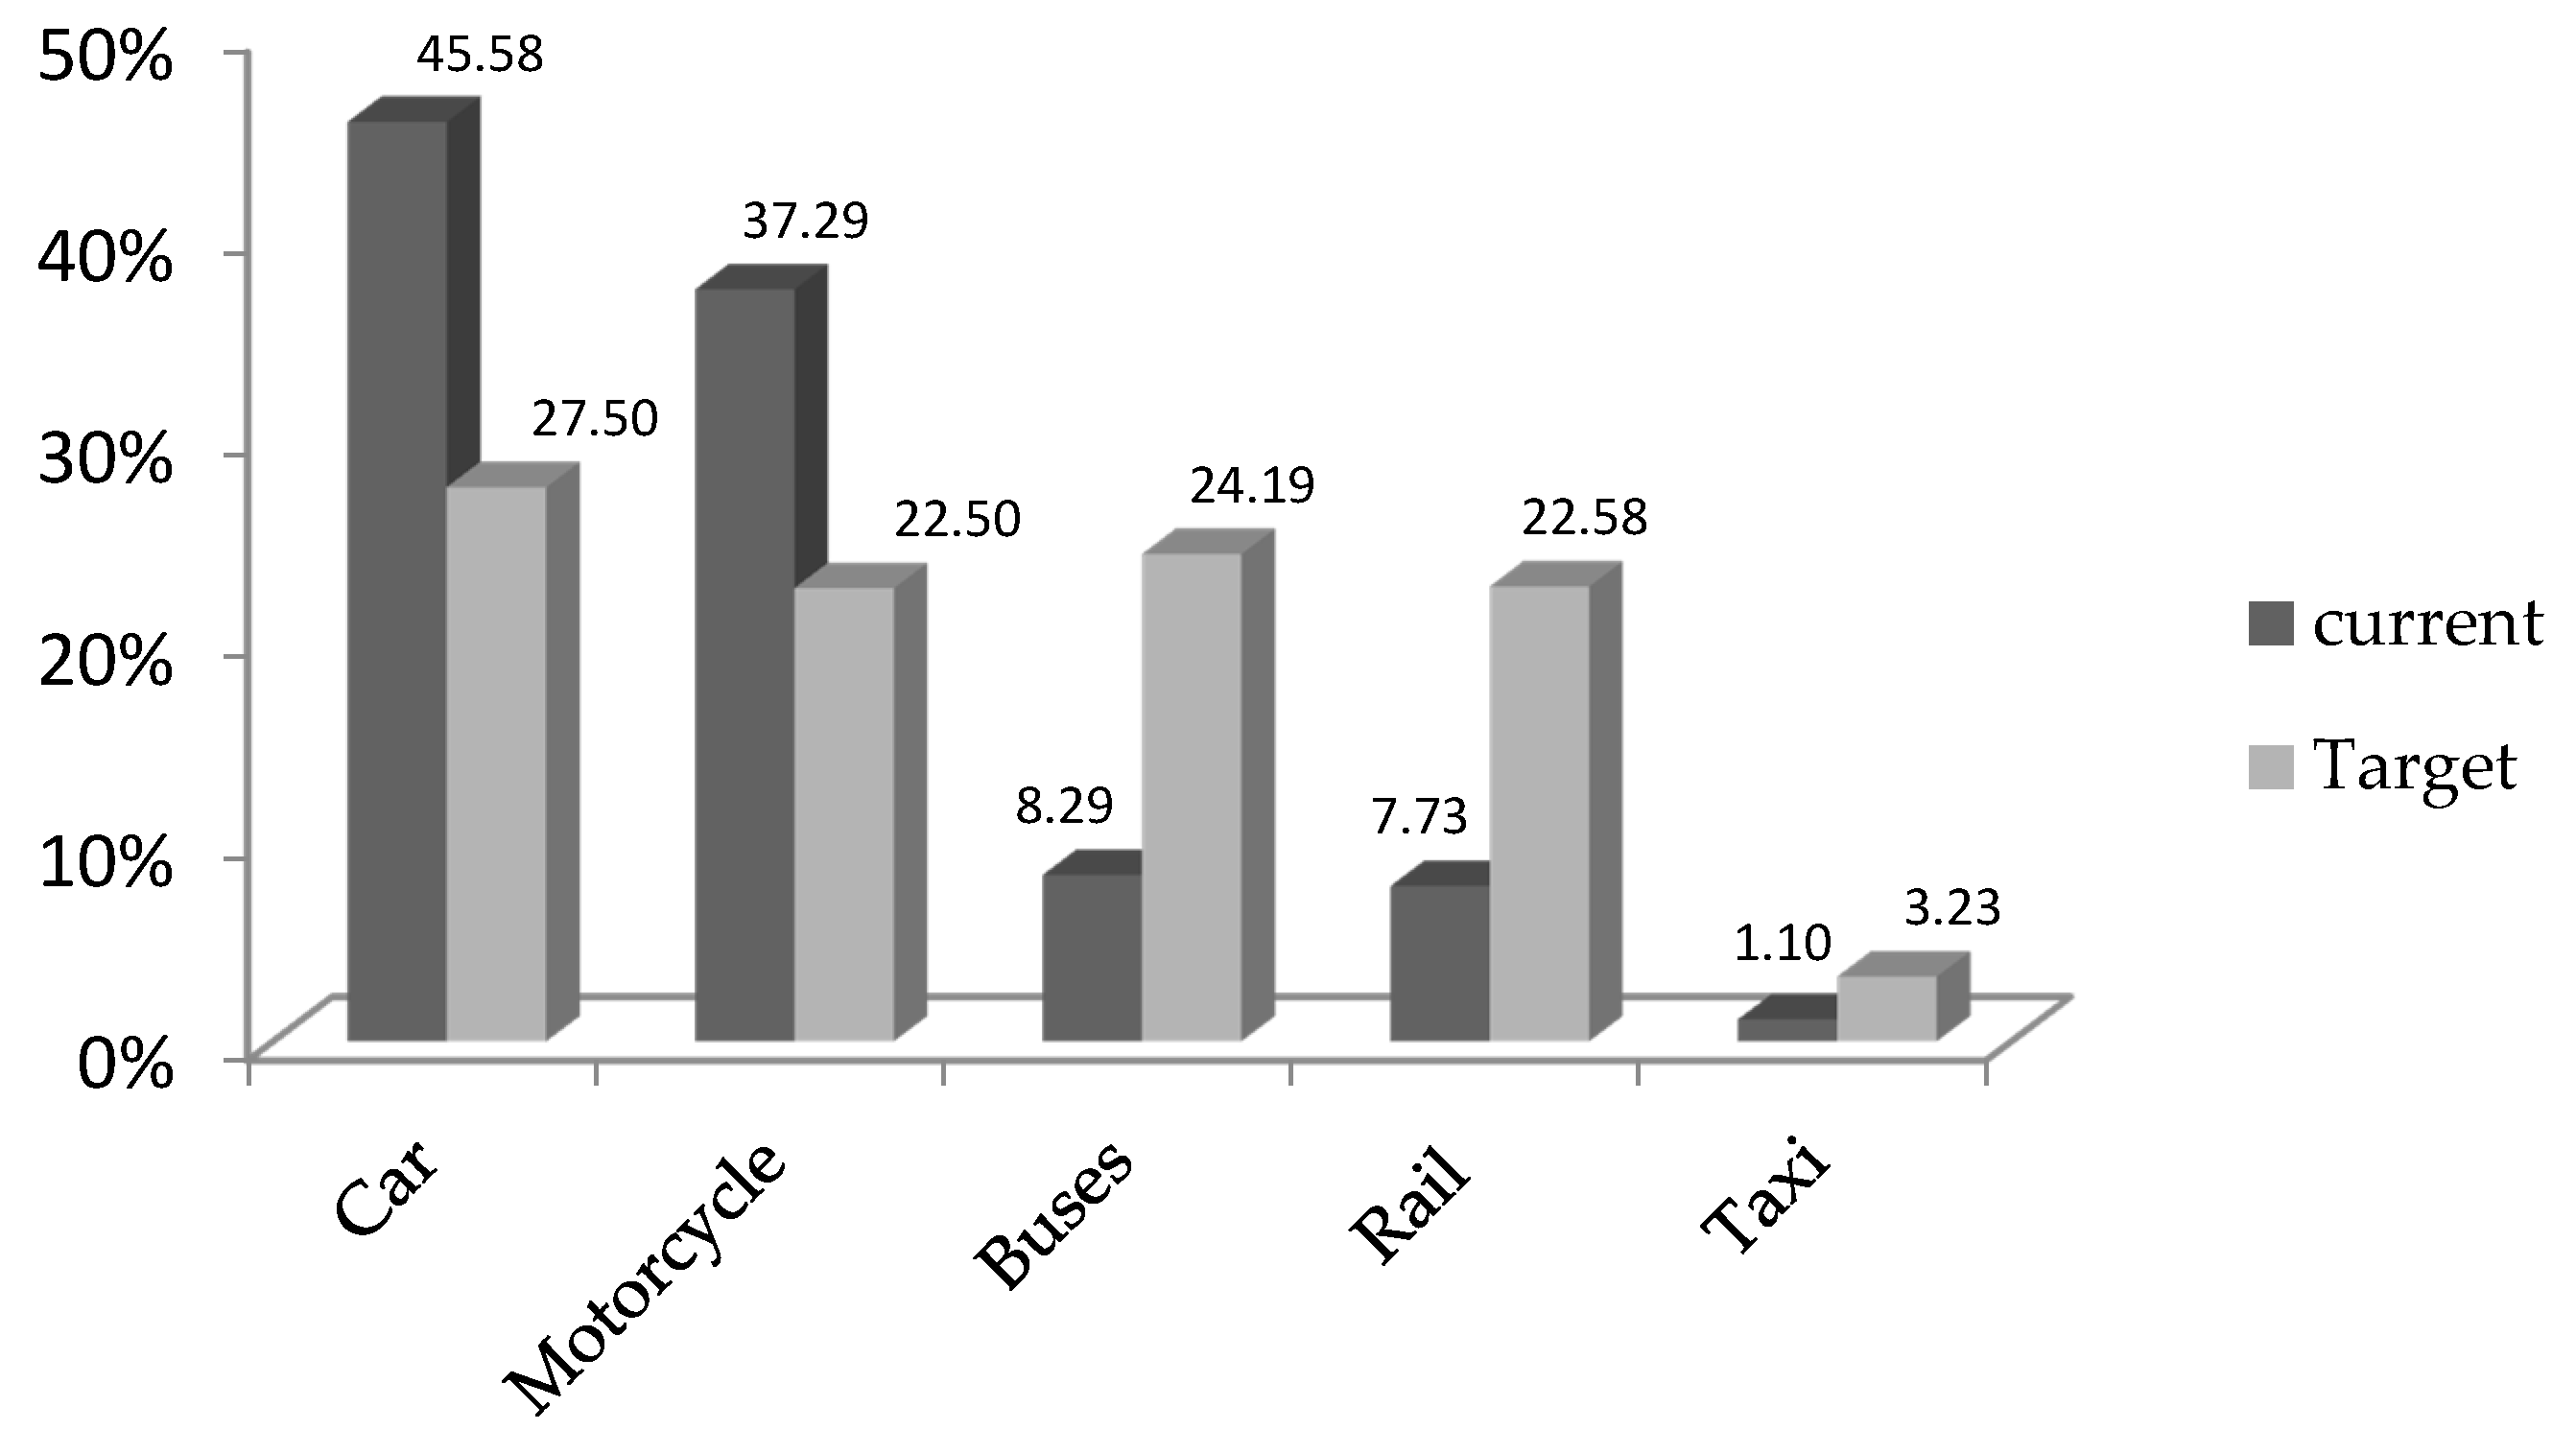
4]. By the end of 2012, the Malaysian government, under the National Key Results Areas (NKRA) initiatives, reported that 12% of total daily travelers used public transport, while 8.3% of the total daily travelers used buses. In other words, the bus is the most preferred mode choice by 69.2% among public transport users. In reference to the 10th Malaysia Plan [
5], the government set a target to enhance the percentage of bus users from 8.3% in the year 2012 up to 24.2% by the year 2020 as shown in
Figure 1. Through the implementation of the plan, the country has the potential to lessen air pollution, sound pollution, and traffic congestion. By increasing the users’ level of satisfaction towards public transport, the transport planners have the opportunity to enhance the users’ willingness to pay (WTP) for the service. However, in order to increase the users’ WTP, there is no choice to improve the service quality and reaching advanced service quality is not possible without increasing in fare and the cost of public transportation or government subsidy. The various methods, such as multinomial logit (MNL), nested logit, error components logit, conjoint analysis, and spike model, are used to encourage the users in using public transportation and increase the WTP.
This study attempts to build a satisfaction model among bus users besides reassuring them to take the bus as their preferred alternative. Another aim of this study is to give more explanations of the public transport users’ behaviors to determine the most favorable strategic measures that can be implemented in the effort to reassure them to use public transport. This study intended to answer the main research question of how much more travelers are willing to pay for public transportation to receive the 50% reduction in travel time. The increase in fare has 50%, 75% or 100% options.
The discrete choice models can be used to measure the public transportation’s quality and improvement. Over the last few decades, the logit models have been commonly utilized to decide the mode choice models where the options are different transport modes [
6,
7,
8,
9].
The present study deals with two scenarios. The first scenario refers to the application of a fuzzy analytical hierarchy process (F-AHP) to understand the satisfactory weight indicators of public transportation users. For the second scenario, this study introduced an experimental design based on the Taguchi method to establish a pattern to recognize the target group which has the highest level of WTP for the service based on the output of the first scenario. Hence, this study will be useful in providing additional comprehensions on the public transportation users’ behaviors in relation to the role of satisfactory and their WTP for the service. The transport planning and policy in Malaysia’s main city will benefit from the outcomes of this study and also the framework can apply in other developing countries which have the same, or at least a slightly different demographic, mode choice behavior, and public transport services (i.e., Indonesia, Thailand, Vietnam etc.).
This paper is arranged in this sequence:
Section 2 discusses the theoretical foundation of the study regarding the satisfaction level on public transportation;
Section 3 summaries the theory structures of the F-AHP, the Taguchi method, and explains sampling procedure;
Section 4 describes the results and discussions;
Section 5 presents the conclusion of the study and illustrates some recommendations for future research related to public transportation users.
2. Literature Review
Satisfaction is defined as “higher level than predictions made by customers on what probably will occur during an imminent transaction” [
10]. According to Lavesque and McDougall [
11], customer satisfaction is defined as the customers’ general attitudes towards a service provider which has different levels of specificity in various studies. Satisfaction is a prompt reaction to utilization, while service quality is deciphered as the total experience of the users’ judgment regarding service provided [
12].
Even though the factors that may affect the level of passengers’ satisfaction towards the use of buses still needs further clarification, there are a few studies that can give some insights on this matter, which include Ibrahim et al. [
13] and Almselati et al. [
14]. From the studies, it is suggested that the main factors that influence the satisfaction level among the users of public transportation are as follows: public transportations’ schedule, affordable fare, comfort, convenience, and short travel time. However, other factors, such as reliability, could add to the main factors, but it is not considered in this study. Parasuraman et al. [
10] stated that the reliability is not a stand-alone factor in customer satisfaction, but it could be an aim. After that, other previous studies, such as Ibrahim et al. [
13] and Almselati et al. [
14], demonstrated that reliability consists of two main factors, safety and on-time services, which safety is considered in the convenience factor and on-time service is in scheduled service. Even these five main factors can divide to more or combine to other factors, but this study preferred to follow the main factors as were considered in previous studies. These main factors should be considered and enhanced in order to improve the quality of public transportation and, at the same time, satisfy the users. Travel time savings is considered as a vital factor in satisfying the needs of public transportation’s users [
15].
Dell’Olio et al. [
16] mentioned that travel time savings has more influence among potential public transport users as compared to the existing users; however, this factor is the major reason of changes in the mode choice behavior among public transport users. Uncertainty associated with the duration of transfers has been shown to be perceived as a risk and, thereby, causes emotional discomfort to users [
15,
17]. One the other hand, public transportation policy, which aims to provide low fare, successfully attracts the users [
18]. Dell’Olio et al. [
19] revealed that socio-demographic characteristics, including gender, income, and age, influence the importance, which is placed on travel cost. Findings of the study suggested that fare hikes have more effects on male users, users under 25 years old, and users with low income. Another study by Hensher [
20] revealed that sporadic single fare commuters are less affected by changes in the travel fares in comparison to passengers, who purchased multi-ride or weekly tickets. However, in improving quality of public transportation, its pricing is considered as part and parcel of it. Another factor that affects the satisfaction of public transportation’s users is the basic amenities such as seating availability, as revealed by Currie and Willis [
21]. Hale and Miller [
22] suggested that convenience is another factor that affects the users’ journey experiences and, thus, the conceptualization effort needs to be a design task, particularly for multimodal stations. In order to enhance the quality of public transportation for the users’ satisfaction and at the same time encourage the public’s WTP for improved transportation services, it is necessary to assess users’ benefits and the values of different travel cost scenarios to the users.
A few studies have analyzed passengers’ WTP for the increase of service quality and switching travel mode behavior to public transportation. One of the ways to measure the quality and improvement of public transportation is using discrete choice models. In this aspect, the MNL framework, which is mainly used for discrete models, can be utilized in assessing the WTP choice behavior among the public transportation users, in which the different transport modes become the variables in the assessment [
23,
24,
25,
26]. Other than MNL, nested logit and error components logit were also applied in previous studies [
2,
27]. Additionally, the spike model can also be used to estimate the WTP. The spike model is a parametric model, which allows the number of respondents to have zero WTP. Furthermore, the spike model also helps with dealing with responses that have negative WTP values [
14,
28,
29]. Additionally, different regression analyses have been used like interval regression method [
30], mixed logit model [
31,
32], autoregressive model [
33], multivariate regression [
34], and factor analysis [
35].
3. Materials and Methods
This part of study first explains the F-AHP process and the Taguchi method as the main mathematical and statistical methods for analyzing the data. After that, the sampling procedure is investigated, which contains the structure of the questionnaire, validity test of the survey, and collecting data.
3.1. F-AHP Process
3.1.1. Fuzzy Set Theory
Traditional fuzzy set theory [
36] has widely been applied to model decision-making processes which are based on imprecise and uncertain information [
37]. It attempts to accommodate fuzziness in the sense that it is contained in human language, judgment, evaluation, and decisions [
38]. Junior et al. [
37] believed that the linguistic factors can be expressed qualitatively by linguistic expressions and quantitatively by a fuzzy set in the universe of discourse and a respective membership function. In fuzzy set theory, the set of elements is belonging to a space with not exactly distinct boundaries. However, in the case of a crisp set, the object may belong to a set of elements or not, while in fuzzy set theory, as Zadeh [
36] mentioned, the objects can take on membership values between 0 and 1 which is the reflected membership degree. The triangular fuzzy numbers (TFN) function, can be used to model the qualitative situation in the form of fuzzy numbers [
39]. This TFN function has been widely used to express the linguistic assessments. A single TFN, symbolized with
, and has the following membership function:
In Equation (1),
acts as parameters of the membership function and they are real numbers indicating, respectively, the lowest potential value, the most favorable value, and the maximum potential value
that describe a fuzzy case. A TFN
is presented in
Figure 2.
3.1.2. F-AHP Technique
The traditional AHP method was suggested by Saaty [
40,
41]. Among multi-criteria decision-making (MCDM) techniques, this method is considered as a powerful approach in solving decision problems that are complex [
42]. AHP functions by ranking the relative importance in a number of criteria in the decision-making problem [
43].
F-AHP was proposed by Buckley [
44], in which the fuzzy theory is incorporated into the AHP approach. Buckley [
44] started the F-AHP as this method assists in yielding more precise results, rather than AHP, in analyzing vague and subjective decision-making problems. Both quantitative and qualitative data can be used in F-AHP.
In comparison with other techniques, in the mathematical calculation context, this method is more easily understood. Despite its wide and successful applications, and Zyoud et al. [
45] believe that fuzzy set theory has always been criticized for its inability in handling uncertainty outcomes from relating whole numbers to decision-making’s understanding. However, Javanbarg et al. [
46] mentioned that, in the real world, fuzzy sets are ineffective in their application to ambiguous decision problems. As a result, the combination of traditional AHP with fuzzy set theory is a pivotal technique in dealing with sources of uncertainty, and Taylan et al. [
47] believed that this combination employs the principles of decomposition, pairwise comparisons, priority vector aggregation, and synthesis. Zyoud et al. [
45] confirmed that there is potential in F-AHP for mapping incomplete information, perceptions, and approximations to bring forward better decisions by engaging the membership functions. It is a proper solution the use of F-AHP for solving the hierarchical rating of fuzzy decision problems. By the end, Del Vasto-Terrientes et al. [
48] agreed that F-AHP permits the decision-maker to focus on the exact sub-criteria to prepare pairwise comparisons among the criteria that having the same root depending on its position in the hierarchy structure which yields the relative trade-off in the form of comparison matrices.
3.1.3. The Extent Analysis of F-AHP Technique
In the literature review, some F-AHP techniques have been reported by Van Laarhoven and Pedrycz [
49], Stam et al. [
50], and Deng [
51]. Büyüközkan et al. [
52] presented advantages and disadvantages of different methods of previous studies in the F-AHP technique. Among different methods, Chang’s extent analysis [
53] has been widely used in different application areas. Chang’s method can be used to derive the priority weights from fuzzy comparison matrices. In the current paper, we apply Chang’s fuzzy extent analysis.
Let the object set be defined by
, and the goal set be defined by
. Based on Chang’s extent analysis, each object is considered one by one, and for each object, the analysis is carried out for each of the possible goals,
. Therefore,
n extent analysis values for each object are obtained and shown as follows:
Let
be a matrix of fuzzy pairwise comparisons with
elements, which is defined in Equation (2):
In conducting Chang‘s extensive analysis, the steps are:
First step—This step requires calculation of the normalized value of row sums (i.e., fuzzy synthetic extent) by applying the fuzzy arithmetic operations as depicted in Equation (3):
In Equation (3), ⊗ represents the extended multiplication of two fuzzy numbers.
Second step—In this step, the degree of possibility of
is calculated by using Equation (4):
This can also be represented as:
Third step—In this step, the degree of possibility of
to be greater than all the other (
n − 1) convex fuzzy numbers
is calculated using Equation (6):
Fourth step—In this step, we define the priority vector
of the fuzzy comparison matrix
using Equation (7):
3.2. Taguchi Method
The Taguchi method was developed by Genichi Taguchi [
54] for the application of designed experiments. The Taguchi method has simplified researchers’ work as this methodology supports the use of fewer experimental designs, and it also provides a clearer understanding of the variation nature and the economic consequences from the view of excellence engineering in the manufacturing field [
55]. Taguchi has incorporated the application of experimental designs, which is commonly implemented in the field of statistics, into the manufacturing field. The use of this methodology assists in yielding better products or processes and, at the same time, parallels with the environmental conditions [
56]. In addition, this method is able to cope with component variations during the developmental phase of the products/processes, as well as minimize the variation of the product/process’ targeted value. The significant advantages of the Taguchi method, over other optimizing techniques, are that multiple factors can be considered at once [
57], reducing the number of experiments [
58], and reducing the experimental cost [
59].
Standard deviation is used to measure the variation from the expected value, in which a lower standard deviation represents response values that are proximate to the expected value, whereas a higher standard deviation represents response values that are spread out from the expected value as results from noise factors. Even though noise factors can be hardly controlled, both of the response value and noise factor are to be controlled by the signal-to-noise ratio (SNR), which is a single term of merit. SNR is the opposite of the coefficient of variation and a unit less value, in which it is an unbiased measurement to calculate the dispersion by taking log transformation [
60]. SNR measures the noise effect factors on performance characteristics and next, it computes the variability. The use of SNR enhances the quality of products/processes through variability reduction and it also assists in improving measurement [
61]. Taguchi used the SNR as the quality characteristic of choice [
62]. SNR is applied as a calculable value instead of standard deviation due to the fact that, as the mean decreases, the standard deviation also decreases, and vice versa. In other words, the standard deviation cannot be minimized first and the mean brought to the target. Taguchi has empirically found that the two-stage optimization procedure involving SNR indeed gives the parameter-level combination, where the standard deviation is minimized while keeping the mean on target [
62]. Based on target of the study, the analyst should choose one of the three calculations of the SNR which are defined in
Table 1. For instance, the larger value of SNR indicated the better WTP for public transportation. Thus, the optimal level of the research factors is the level with the highest SNR.
In
Table 1,
is the average of the observed data, and
represents the variance of
y,
n shows the number of observations, and
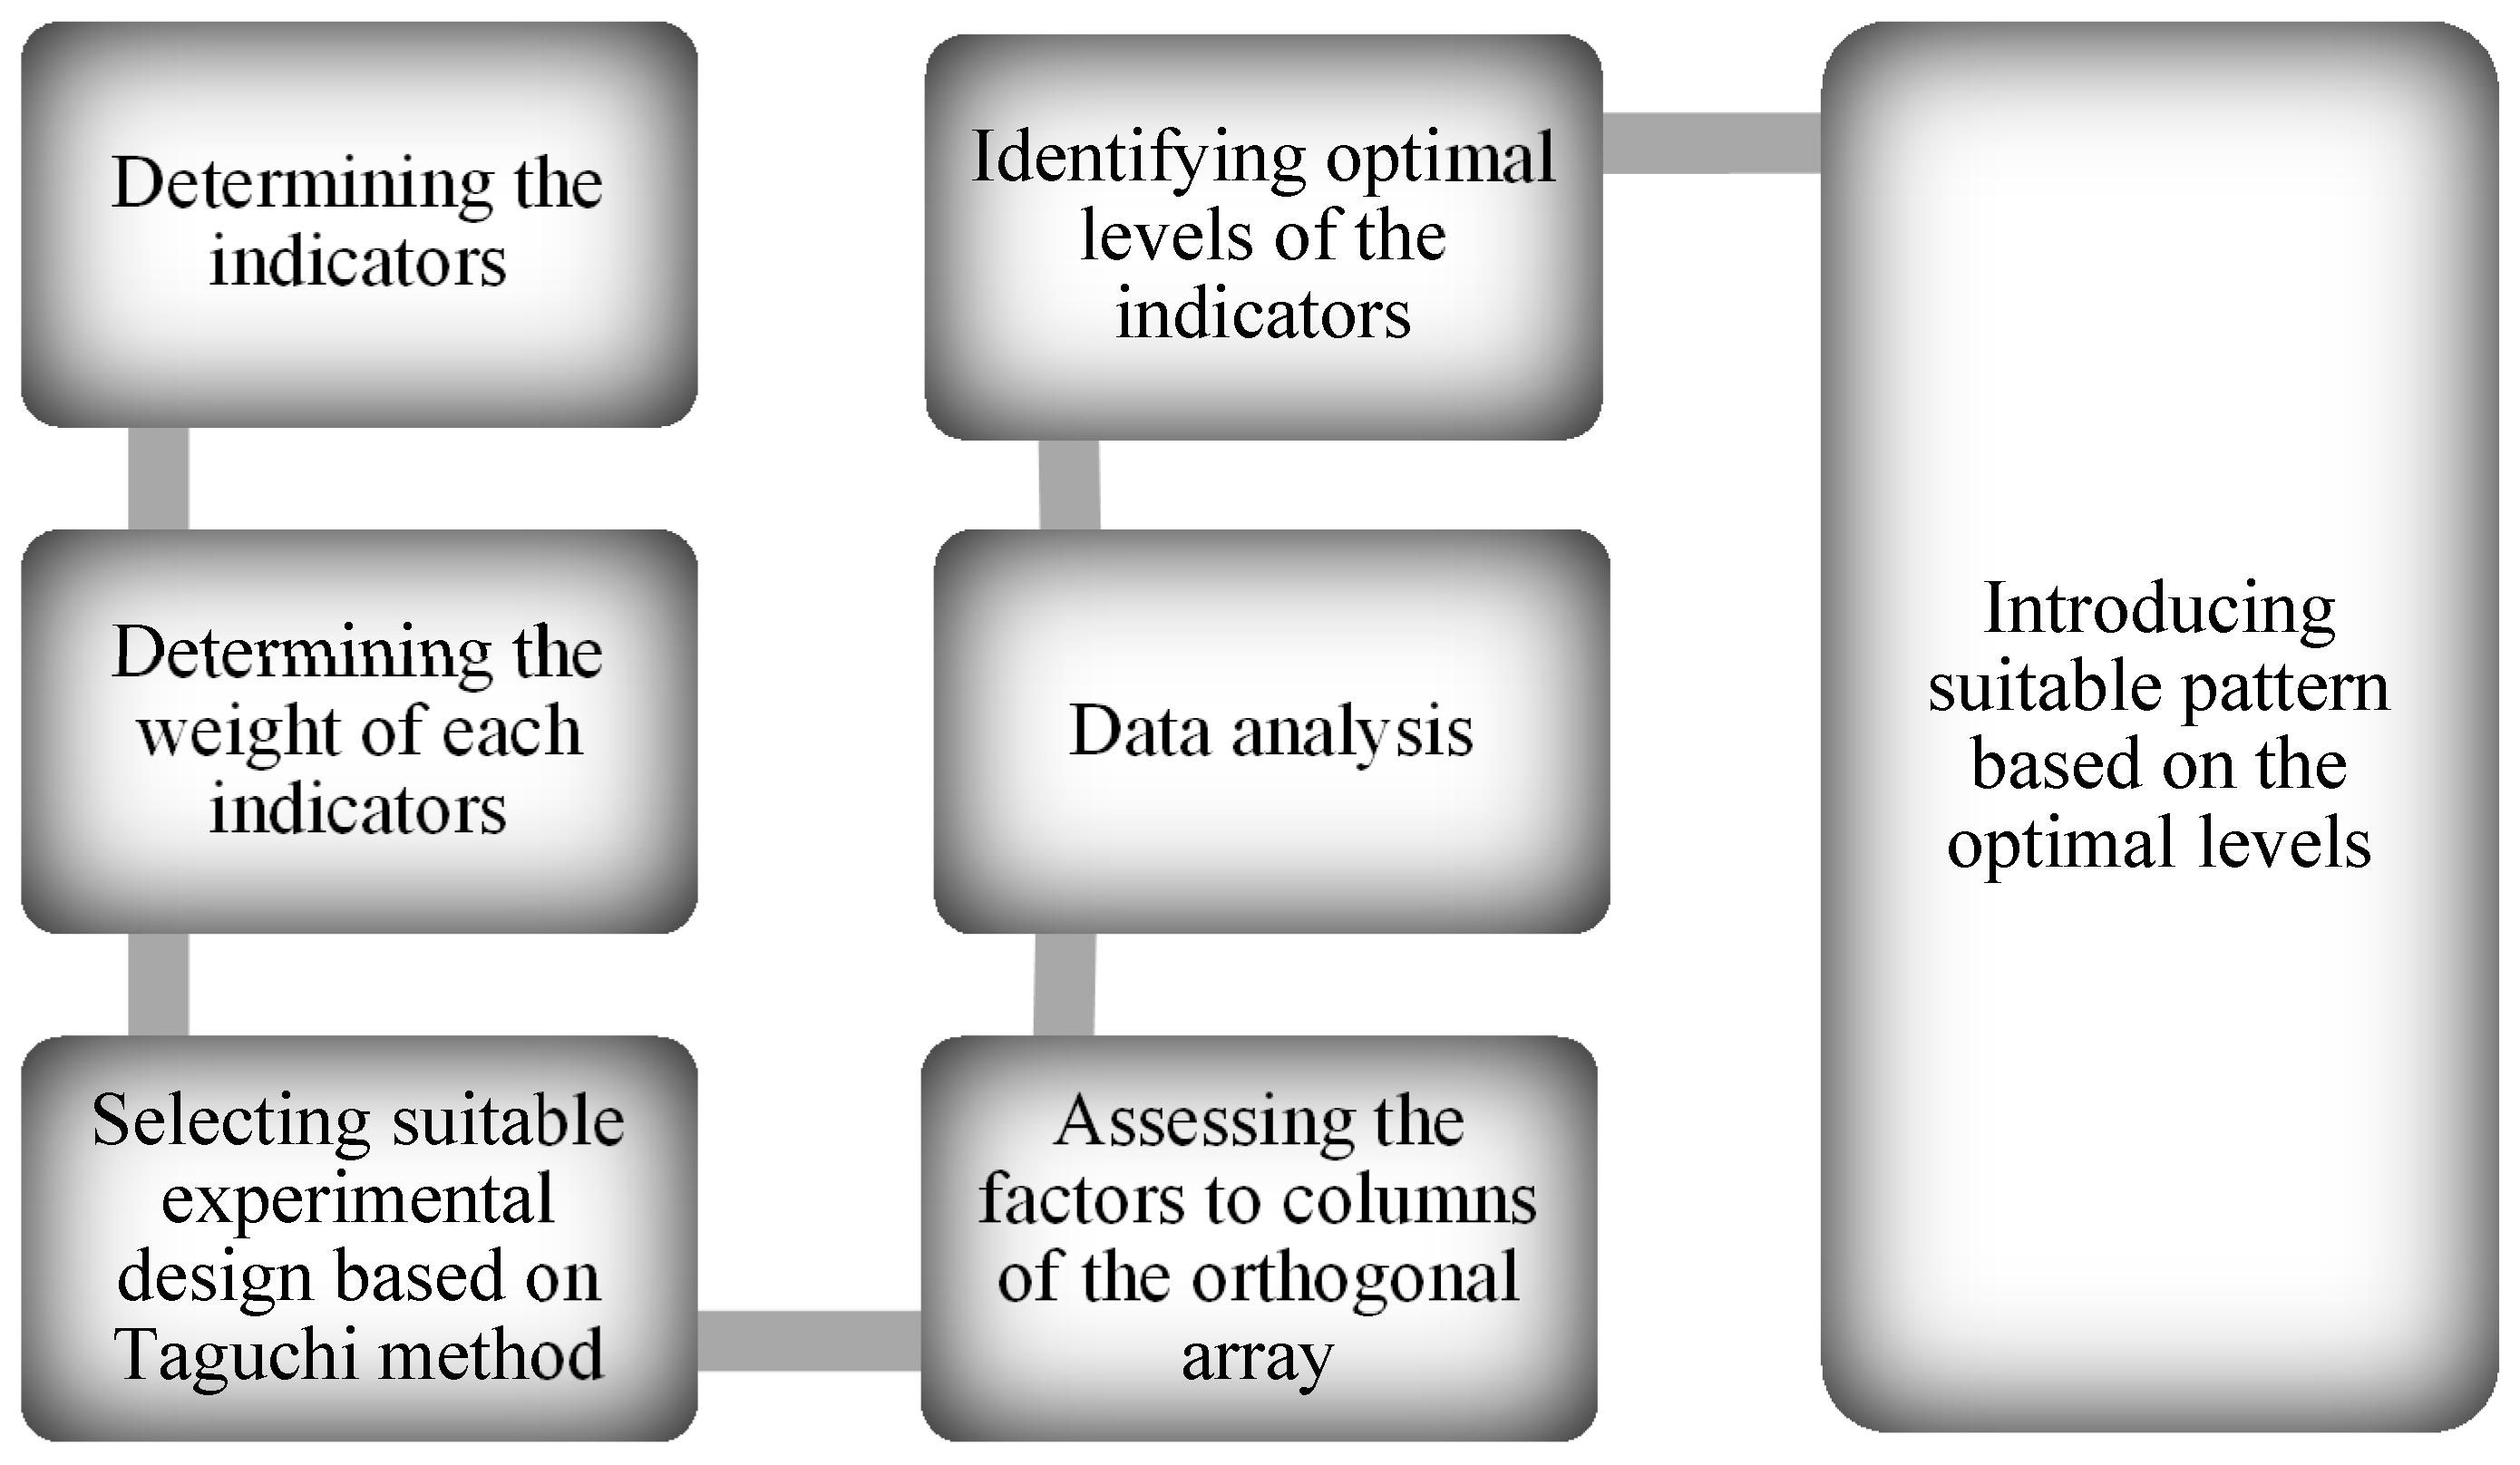
y the shows the observed data. The calculation of SNR will be selected based on the higher goal because this study is going to find the maximum fare that travelers are willing to pay. Application steps in applying Taguchi method are shown in
Figure 3.
This research aimed to determine the demographic characteristics of the target group who are willing to pay more for shorter travel time. This group considers paying at least 50% extra in the effort to reduce their travel time. Next, by considering the target group’s satisfaction factors weight by the F-AHP method, the factors that need prior attention by decision-makers were revealed. The author proposed that, by improving service quality and enhancing the bus users’ satisfaction, it can assist the users to choose the bus as their mode of transportation, and also helps in gaining more financial support from public transport users.
3.3. The Procedure of Sampling
3.3.1. Study Area
Klang Valley was chosen as the study area for this research. Klang Valley, which is located in the center of peninsular Malaysia, includes Kuala Lumpur Federal Territory, Selangor districts of Petaling, Klang, Gombak, and Hulu Langat. The total population of Klang Valley is 6.187 million in 2010, and this figure is estimated to turn into 10 million by 2020. Considering the high density of Klang Valley, there is a variety of public transportation modes there, including bus service, rail transport, and taxi service. The bus is considered the most important public transport service in Klang Valley, in which it has the most passengers, as compared to other public transportation modes, and it makes almost 600,000 trips everyday as depicted in
Table 2. Comparing Klang Valley to other cities like Singapore, Hong Kong, and London, from the aspect of public transportation, shows that percentages of public transportation trips are 64%, 74% and 90%, respectively. It is recorded that 60% of Klang Valley’s citizens lived 400 meters or nearer to a bus route in 2011 and it is expected that the figure would turn into 90% by 2020, as the government aims that buses would serve 50% of the users’ needs in using public transportation in the Klang Valley [
63].
The National Key Economic Area (NKEA) under the Economic Transformation Program is aiming to increase the public transportation modal share from 18% to 50% in the next decade, within the area of the Klang Valley. The Greater Kuala Lumpur/Klang Valley (GKL/KV) plan under NKEA also aims to place Kuala Lumpur and Klang Valley amongst the top 20 livable cities, globally, by 2020, from the aspect of economic growth [
64]. The GKL/KV includes areas of ten local authorities and it is one of the 12 NKEAs under the Economic Transformation Program. Among the major goals of NKEA in the next decade is to enhance economic growth and, at the same time, improve the attractiveness of the cities, in order to provide a living area that meets people’s satisfaction [
64]. A well-grounded public transport policy is needed and has to be coordinated with an effective public transport plan to push public transport in moving forward.
3.3.2. Sampling
In this study, empirical data was collected using self-administered questionnaires that aimed to gather the factors that affect the public transportation users’ intentions in Klang Valley area. A non-probability judgmental sampling technique was used in collecting the data from the target respondents. This was done in order to ascertain that the responses gathered are based on familiarity and the experience of using public transportation.
The questionnaire was adapted from an extensive literature survey to ensure a high content validity of the items. For testing validity of the questionnaire, the questionnaire was first presented to the seven academic experts, including a professor from social sciences, and an associate professor from an engineering faculty who is an expert in the area of transportation. Second, the pilot surveys were conducted to test the instrument validity of the study. In this part, 30 bus users were approached at the two largest bus stations in the Klang Valley area and were asked to fill in the questionnaire and point out any terms, meanings, or issues which might be unclear. The questionnaire was then finalized by using the input given by the experts and pilot study, attached with a cover letter that explains the study purposes, and then distributed to the target respondents.
Data collections were conducted with one supervisor and three bachelor students. The samples were selected from bus users and were interviewed after inquiring whether they had time to complete the questionnaire. The questionnaire was distributed to the selected bus users between 5 December 2013 and 24 April 2014. The respondents were selected from 25 bus stations in Klang Valley, Kuala Lumpur, Malaysia. Klang Valley was chosen as the distribution area as it shows a high number of public transportation users. The purpose of the study was explained to the respondents, and the time required answering the questionnaire ranged from 10 to 15 min. Due to this procedure, high content validity was achieved, one thousand questionnaires were distributed, and it obtained a response rate of 75.1%.
Briefly, the questionnaire contains five parts: (i) demographic and socio-economic characteristics; (ii) commuting mode-related information; (iii) preference and attitude; (iv) discouragement and prevention; and (v) travel time scenario. The first part aims to gather information related to the respondents’ demographic characteristics (see
Appendix A). As shown in
Table 3, six demographic parameters, such as age, education, income, ethnicity, gender and marital status were used.
The second part is started with a question “How often do you use bus?”, and then asked the respondents to measure the satisfaction level of their regular commuting mode. Five indicators include: total travel time, travel cost, comfort in vehicle, safety, convenience, and overall satisfaction were considered. In the third part (preference and attitude), five indicators were measured based on the theories of Ibrahim et al. [
13] and Almselati et al. [
14]. These include vehicles usually arriving on schedule, the fare is low, vehicles are not too crowded, vehicles are clean, and short travel time. In the fourth part, five indicators include desired routes not covered by bus services, takes too long to get to the destination, infrequent public transport services, unreliable services, and vehicles are too crowded to measure discouragement and prevent use. The second, third, and fourth part of the survey follows Ibrahim et al.’s [
13] survey but it is changed to reflect the current situation. In the fifth part, the main scenario of the travel time was considered, which is explained in the introduction (
Section 1). All measurements in this section require the respondents to rank the items based on a four-point and five-point Likert scale.
4. Results
4.1. Results of the F-AHP Application
The end weight of all factors was calculated using the F-AHP as presented in
Table 4. From the table, the weight of factors are 0.217 for vehicles that arrived on schedule; 0.184 for vehicles that charged low fares; 0.071 for vehicles that are not too crowded; 0.050 for clean vehicles; and 0.478 for short travel time. The overall results revealed that the main factors for users’ satisfaction on the bus users are short travel time, punctual vehicles, and vehicles that charged low fares.
4.2. Results of the Taguchi Application
According to the Taguchi method, the design parameters of the system are identified as the control factors or design variables, which primarily influence the output of the objective function. This study used L
16 (4
4 2
2) orthogonal array. L
16 (4
4 2
2) means that the experiment includes four factors with four levels (age, income, education, and ethnicity) and two factors with two levels (gender and marital status). The value of 16 in L
16 represents the number of trials. MINITAB 16 (Bizit Systems (M) Sdn Bhd, Malaysia) is used to analyze the impression of each erosion test parameter. In reality, the L
16 (4
4 2
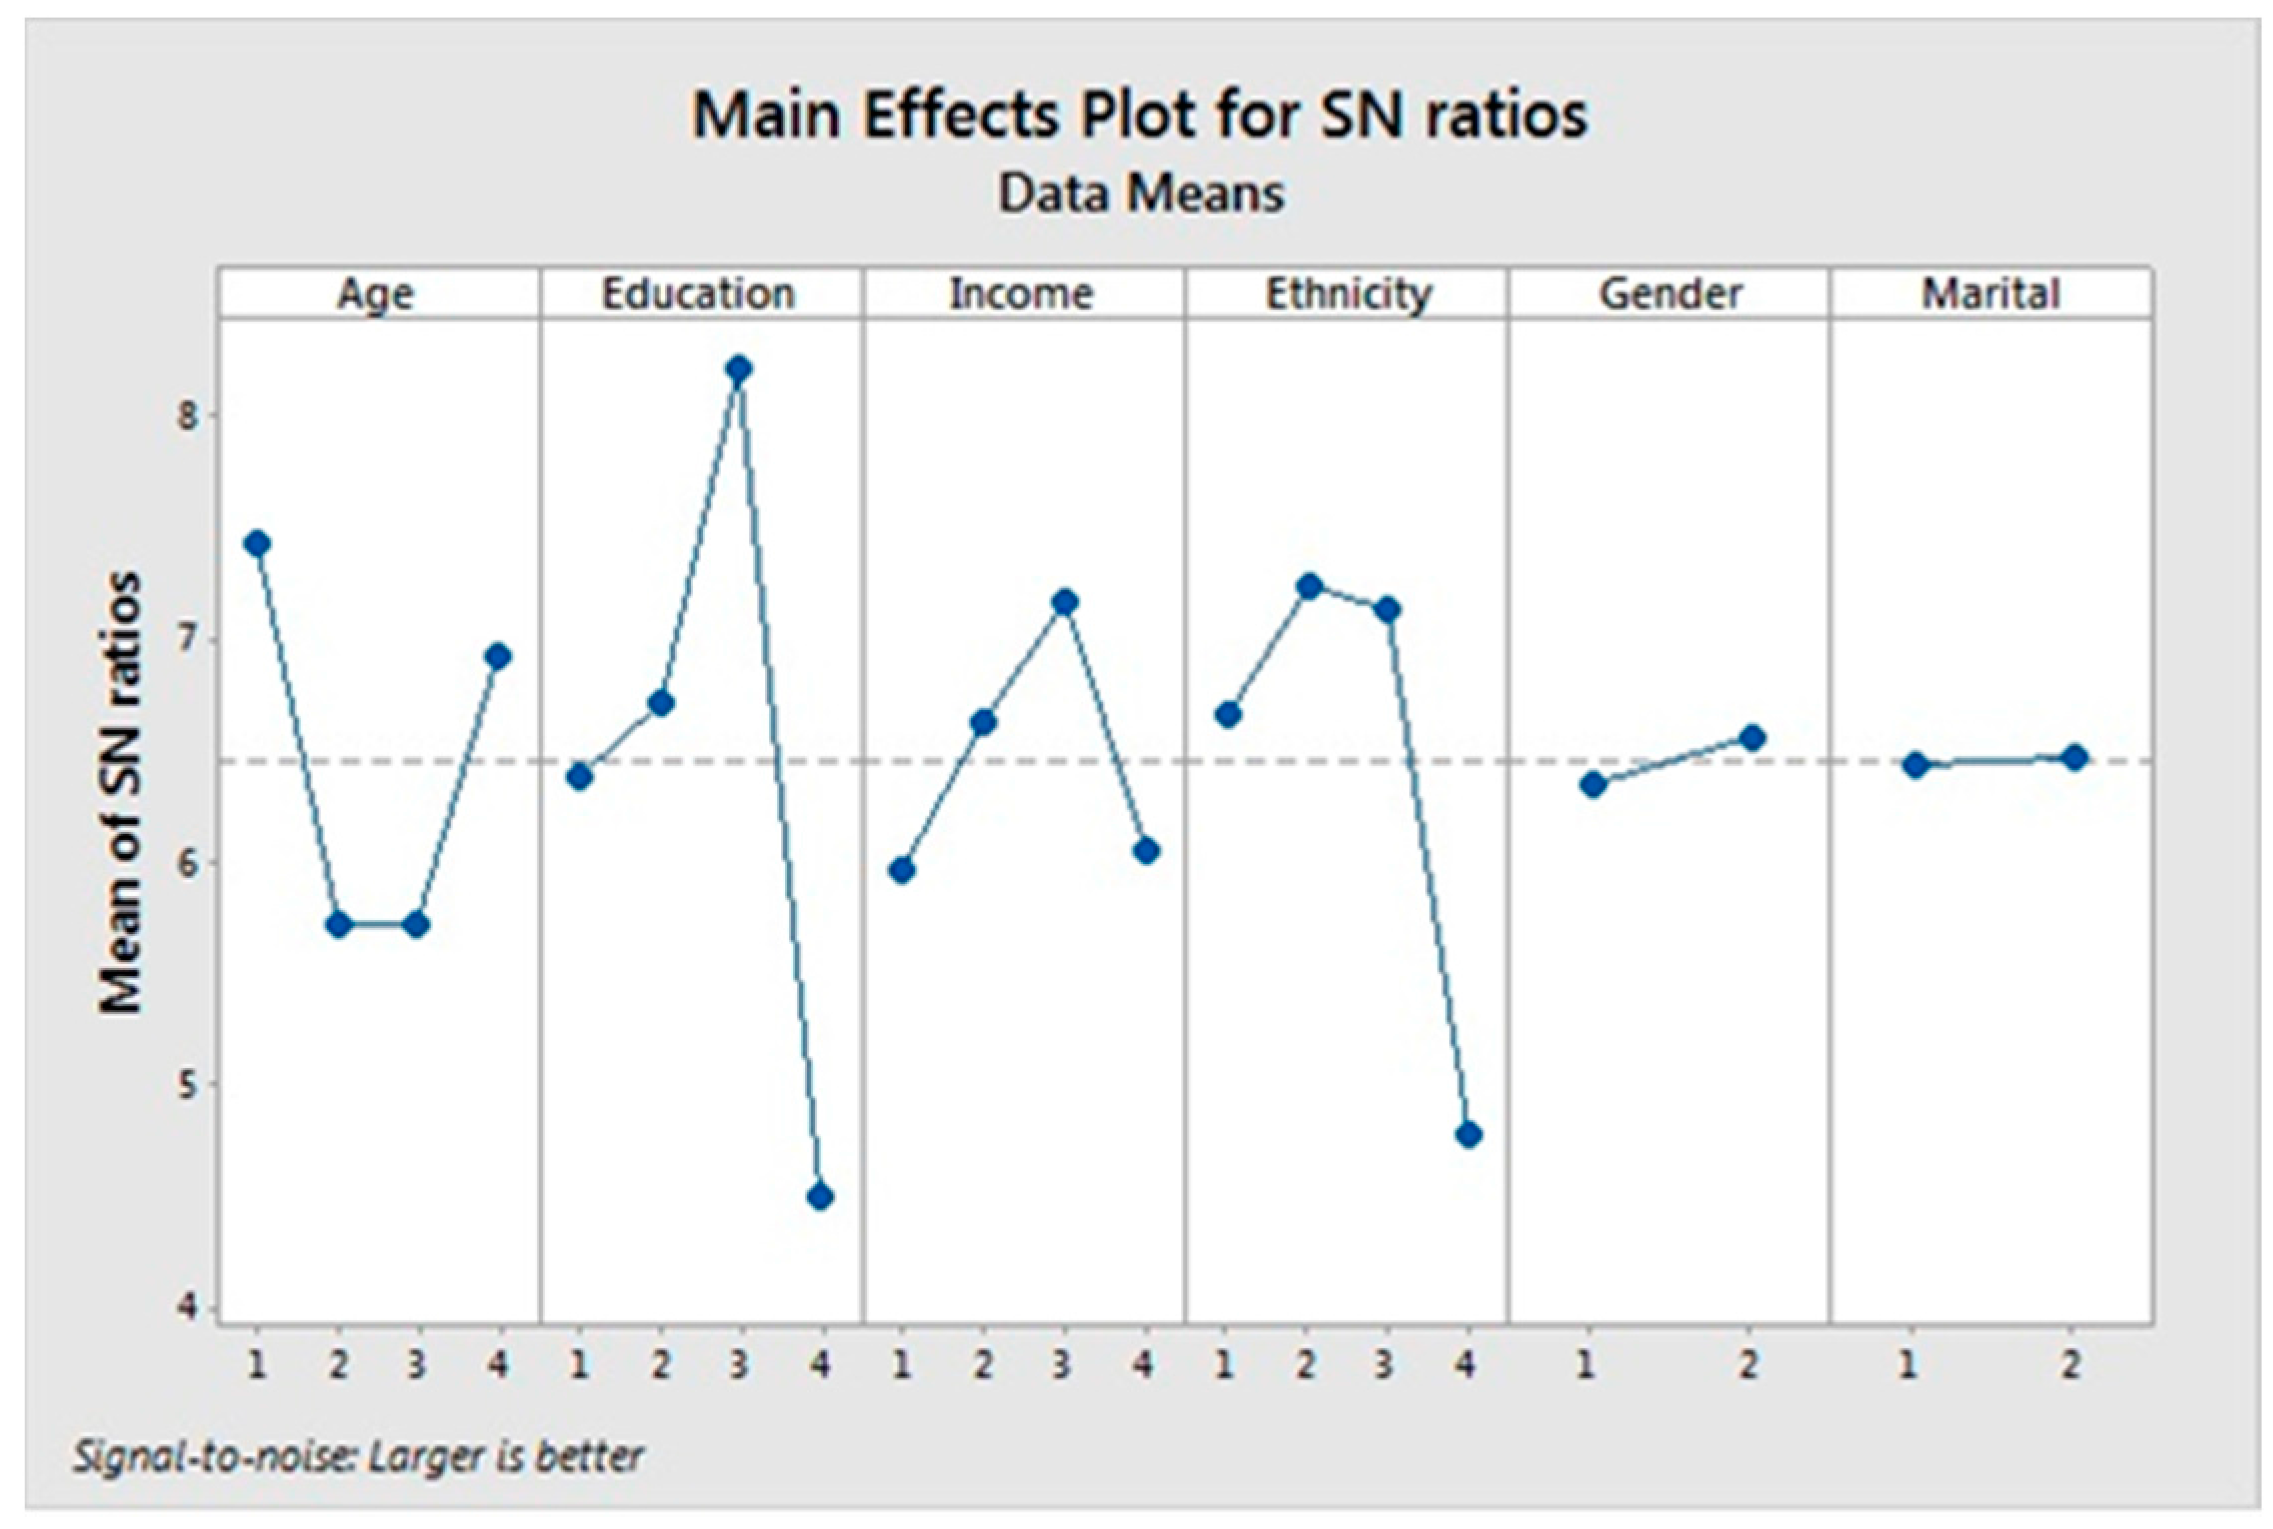
2) Taguchi experimental design could extract 16 records from the main data. The six selecting factors are located at columns as the main variables, and the parameter values which indicated levels are placed at the rows. The levels of each factor are equally presented in each experiment. For this study, the data analysis of the collected data was based on ten repeated experiments. The graphical method (
Figure 4) is illustrated to analyze the responses of increases on the fare.
Table 5 shows the average mean and the average SNR of quality parameters. The SNR refers to the logarithmic function of the desired quality parameters, and it is used as a goal function for optimization. Irrespective of the category of SNR, the higher the SNR was considered for the optimized value.
Table 5 presents the experimental design and output of the Taguchi method. Each row of the matrix shows one trial. The first six columns are factors of the study that contain the age, education, income, ethnicity, gender, marital status, and the experimental design of the combination of these factors are extracted from MINITAB software based on the Taguchi method. Columns with names of T1 to T10 are outputs of WTP measure. SNR is output of calculating Signal-to-Noise based on choosing optimization of WTP with “Higher” (see
Table 1). Means show the average of T1 to T10. Values of demographics are characterized in
Table 3.
5. Discussion
There is an increase in the importance of using F-AHP in determining multiple criteria decision-making under ambiguity. This method also caters extensively to applications in various areas, such as supplier selection, customer requirements assessment, and other related areas. The scientific weight derivation from fuzzy pairwise comparison matrices is required when using the F-AHP for multiple criteria decision-making. On the other hand, the Taguchi method is used as a method to diagnose and forecast multivariate data. The Taguchi method can be used to measure correlations between the variables and different patterns with respect to a base or reference group [
54].
The quality parameters were calculated, and the graph of the Taguchi method was plotted according to the results. According to the plotted graphs, four factors have been found to be influencing the WTP, including age, education, income, and ethnicity. Participants with the characteristics of being less than 25 years old, with an income between RM 2000 and RM 2999, who are of Chinese ethnicity, with an undergraduate education background, and of male gender have the most WTP at least 50% of the increase of the cost for shorter time travel with buses.
According to the findings of the WTP among bus users in Malaysia using an F-AHP application and S/N ratio approach based on the Taguchi method, the present study lists out several important points, as follows:
The F-AHP reveals that short travel time is the most favored satisfaction factor among the 751 individuals who filled the questionnaire, with a weight of 0.478, followed by arriving on schedule, with a weight of 0.217. These results supported the importance of short travel times by Ibrahim et al. [
13] and Almselati et al. [
14].
The Taguchi method helps the decision-makers to recognize the characteristics of Malaysian bus users with higher WTP (target group) who preferred short travel time. The demographic characteristics of the individuals are less than 25 years old, Chinese undergraduates, and middle income of RM 2000 and RM 2999.
The results indicated that gender and marital status are not significantly effective on WTP for public transportation. In other words, there is no significant difference between male and female, and married and single, in the WTP for shorter travel time.
The F-AHP weights of the target group’s satisfaction are shown in
Table 6. According to F-AHP output, the highest value belongs to short travel time. The comparison of satisfaction factors between
Table 4 and
Table 6 demonstrates that there was a significant difference for shorter travel time weight (0.745 − 0.478 = 0.267). However, the difference between the two tables for vehicles that usually arrive on schedule is not significant (0.217 − 0.155 = 0.062).
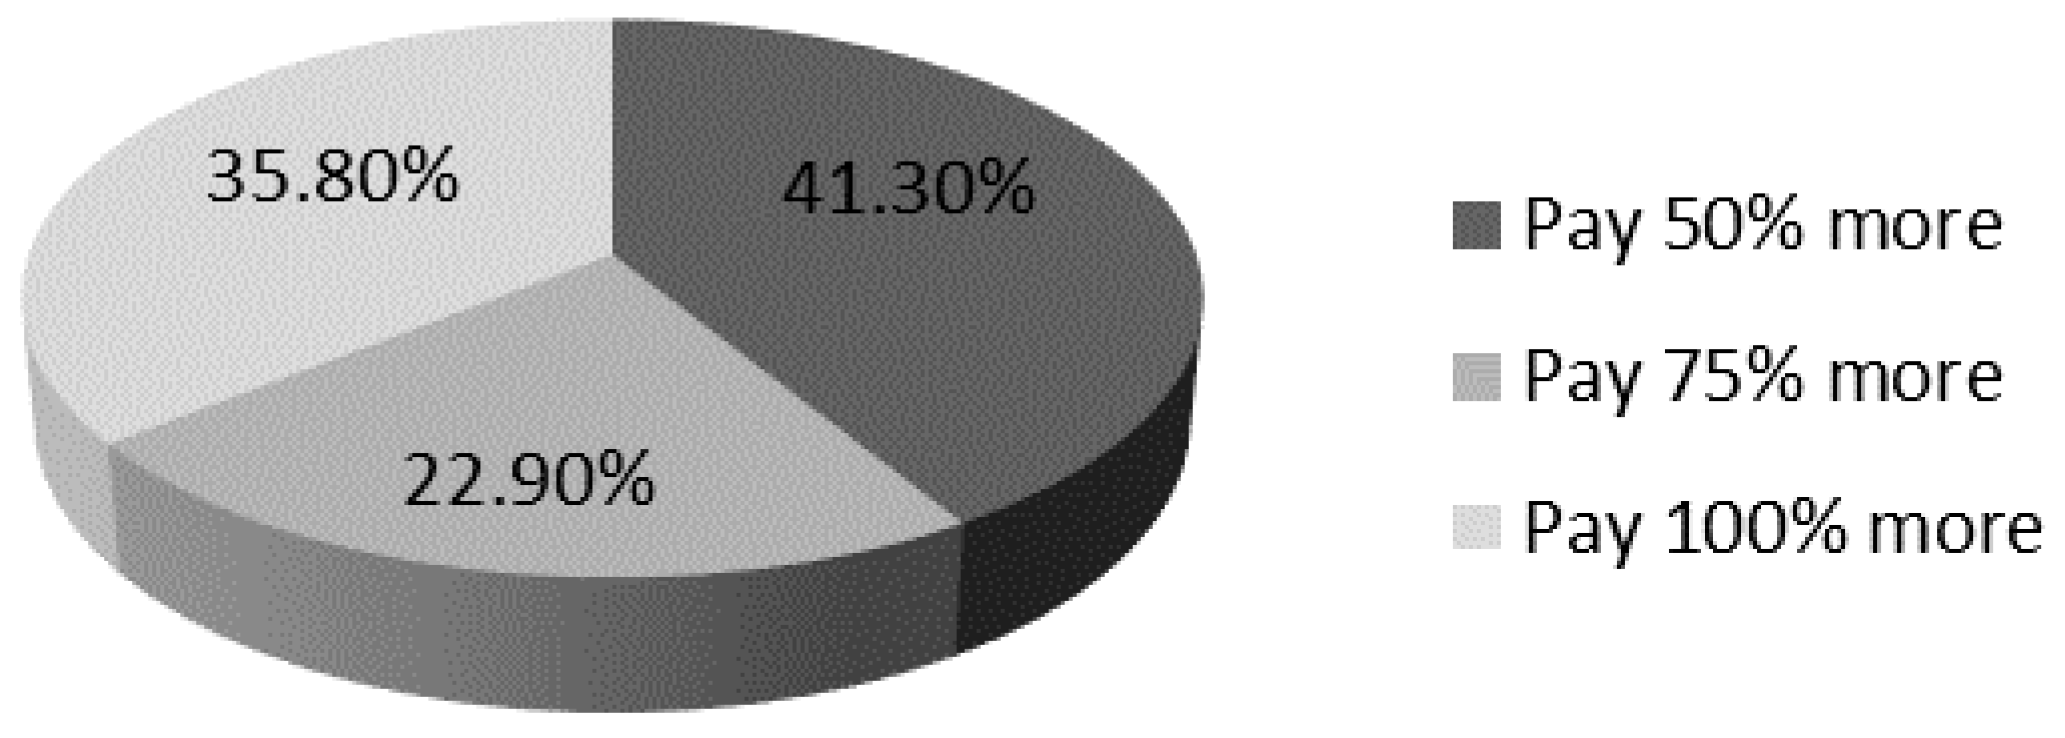
The Taguchi method in this study is used to clarify the target group which has the WTP of 50% and more. Therefore, the target group contains individuals who are willing to pay more than 75% or even 100% of a price hike. The classification is shown in
Figure 5.
This paper adopted Taguchi’s robust design method and found it reliable in determining the pattern for users who are WTP for the bus transportation.
The findings of this study have proven that the application of both the F-AHP and the Taguchi method are effective for the optimization of WTP modeling of bus users.
6. Conclusions
It is important for developing countries, like Malaysia, to encourage their citizen to favor the use of public transportation and improve on their service quality for the satisfaction of the public transport users. There is indeed a strong relation between the increases of service quality with the users’ WTP for public transportation.
This study had weight in five satisfaction factors by F-AHP and the results supported the statement in the previous studies that claimed short travel time is the most important factor for the users’ WTP for the bus users. Additionally, the Taguchi method was also used to determine the demographic characteristics of the target group who is willing to pay more for shorter travel time.
The suggestion taken from the target group F-AHP on the most favored satisfaction factors for the users’ WTP can be useful for the public transport decision-makers. Overall, there is the need to improve on the service quality of the public transportation for the satisfaction of the users in order for them to favor the use of public transportation. This effort can also alleviate the public transportation industry as there will be more financial supports from the public transportation users.
This study had combined an F-AHP and the Taguchi method to introduce a better pattern of users who are willing to pay for public transportation in Malaysia. These combined methodologies can be applied in the willingness to shift to public transport, among other mode choice behavior, or other areas related to customer satisfaction studies. It should be noted that the exact amount of WTP is notably difficult to measure. In point of authors’ view, the relation between an increase in fare and reduction in the travel time will be more essential when the relation between these two factors is estimated (for example, a 25% increase in fare and travel time 25% decrease). The expanded method of this study can be utilized to reach this aim.
In this study a pattern was introduced with interaction of socio-demographic factors with the Taguchi method. Socio-demographics can be used in different ways for future studies. First, every indicator can be considered separately and explain the WTP for public transportation between socio-demographic groups with the application of analysis of variance (ANOVA); second, socio-demographics can be considered as a latent variable and, with the application of structural equation modeling, introduce a model for WTP studies.
Acknowledgments
The authors express their gratitude to the University Kebangsaan Malaysia (UKM) for the financial support of this work.
Author Contributions
Conceived and designed the experiments: P.B., N.I.M.Y., and H.S.J.; performed the experiments: P.B.; analyzed the data: P.B., and H.S.J.; contributed reagents and materials: P.B., N.I.M.Y., and H.S.J.; wrote the paper: P.B., N.I.M.Y., and H.S.J.
Conflicts of Interest
The authors declare no competing financial interests.
Appendix A. Questionnaire for Bus Users
Dear traveler,
Having advanced public transportation is possible just by your cooperation and support. Please help us by filling this survey because we believe that you deserve the best service. All of us are responsible to our society.
Part I—Demographic and Socio-Economic Characteristics
| Gender | ⎕ Male | ⎕ Female | | |
| Age | ⎕ Less than 25 | ⎕ 25–34 | ⎕ 35–44 | ⎕ 45 or more |
| Ethnicity | ⎕ Indian | ⎕ Chinese | ⎕ Malay | ⎕ Other |
| Education | ⎕ Under Diploma | ⎕ Diploma | ⎕ Undergraduate | ⎕ Graduate |
| Income | ⎕ Less than RM 1000 | ⎕ RM 1000–1999 | ⎕ RM 2000–2999 | ⎕ RM 3000 or more |
| Marital | ⎕ Married | ⎕ Single | | |
Part II—Your Commuting Mode Related Information
| How often do you use the bus? | Always | Often | Sometimes | Rarely |
| | | | |
Please give the satisfaction level. Absolutely Dissatisfied
![Symmetry 08 00090 i001]()
Absolutely Satisfied
| Satisfaction Level | 1 | 2 | 3 | 4 | 5 |
| Total travel time | | | | | |
| Travel cost | | | | | |
| Comfort in vehicle | | | | | |
| Safety | | | | | |
| Convenience | | | | | |
| Overall satisfaction | | | | | |
Part III—Preference and Attitude
On the scale of 1 to 5, where 1 indicates “not important at all” and 5 indicates ”very important”, indicate the importance of the following attributes in choosing your mode of commuting by checking the appropriate box: Not important at all
![Symmetry 08 00090 i001]()
Very important
| Qualities | 1 | 2 | 3 | 4 | 5 |
| Vehicles usually arrive on schedule | | | | | |
| Fare is low | | | | | |
| Vehicles are not too crowded | | | | | |
| Vehicles are clean | | | | | |
| Short travel time | | | | | |
Part IV—Discouragement and Prevent
On the scale of 1 to 5 where 1 indicates “strongly disagree” and 5 indicates “strongly agree”, indicate witch of these factors can prevent you from switching to public transportation by checking the appropriate box: Strongly disagree
![Symmetry 08 00090 i001]()
Strongly agree
| Factors | 1 | 2 | 3 | 4 | 5 |
| Desired routes not covered by bus services | | | | | |
| Takes too long to get to destination | | | | | |
| Infrequent public transport services | | | | | |
| Unreliable services | | | | | |
| Vehicles are too crowded | | | | | |
Part V—Travel Time Scenario
How much are you willing to pay more on fare to reduce 50% of your travel time?
- ⎕
I am satisfied with the current travel time and cost (No changes).
- ⎕
I would accept a 50% travel time reduction by the maximum increase of:
| For 50% reduction on my travel time I agree to pay… | 50% | 75% | 100% |
| | | |
considering the existing situation of average travel time and travel cost for bus as stated below, please check any of these alternatives that you will prefer as 1 and range the rest accordingly.
| Services | Total Travel Time | Travel Cost | Service Schedule | Range |
| Service #1 | 60 min | RM 3.00 | Every 30 min | ⎕ |
| Service #2 | 30 min | RM 4.50 | Every 30 min | ⎕ |
| Service #3 | 30 min | RM 6.00 | Every 15 min | ⎕ |
References
- Eboli, L.; Mazzulla, G. A methodology for evaluating transit service quality based on subjective and objective measures from the passenger’s point of view. Transp. Policy 2011, 18, 172–181. [Google Scholar] [CrossRef]
- Li, Z.; Hensher, D.A. Crowding and public transport: A review of willingness to pay evidence and its relevance in project appraisal. Transp. Policy 2011, 18, 880–887. [Google Scholar] [CrossRef]
- Phanikumar, C.V.; Marita, B. Modeling willingness-to-pay values for rural bus attributes under different trip purposes. J. Transp. Res. Forum 2010, 45, 31–44. [Google Scholar] [CrossRef]
- Kamaruddin, R.; Osman, I.; Pei, C.C. Customer expectations and its relationship towards public transport in Klang Valley. J. ASIAN Behav. Stud. 2012, 2, 29–38. [Google Scholar]
- Chuen, C.O.; Karim, M.R.; Yusoff, S. Mode choice between private and public transport in Klang Valley, Malaysia. Sci. World J. 2014, 2014, 934587. [Google Scholar] [CrossRef] [PubMed]
- Hensher, D.A.; Greene, W.H. The mixed logit model: The state of practice. Transportation 2003, 30, 133–176. [Google Scholar] [CrossRef]
- Prioni, P.; Hensher, D.A. Measuring service quality in scheduled bus services. J. Public Transp. 2000, 3, 51–74. [Google Scholar]
- Paulssen, M.; Temme, D.; Vij, A.; Walker, J.L. Values, attitudes and travel behaviour: A hierarchical latent variable mixed logit model of travel mode choice. Transportation 2014, 41, 873–888. [Google Scholar] [CrossRef]
- Forsey, D.; Nurul Habib, K.; Miller, E.J.; Shalaby, A. Temporal transferability of work trip mode choice models in an expanding suburban area: The case of York Region, Ontario. Transp. Metr. A Transp. Sci. 2014, 10, 469–482. [Google Scholar] [CrossRef]
- Parasuraman, A.; Zeithaml, V.A.; Berry, L.L. Servqual: A multiple-item scale for measuring customer perceptions of service quality. J. Retail. 1998, 64, 12–40. [Google Scholar]
- Lavesque, T.; Mcdoughall, G.H.G. Determinant of customer satisfaction in retail banking. Int. J. Bank Mark. 1996, 14, 12–20. [Google Scholar] [CrossRef]
- Hussain, R.; Al Nasser, A.; Hussain, Y.K. Service quality and customer satisfaction of a UAE-based airline: An empirical investigation. J. Air Transp. Manag. 2015, 42, 167–175. [Google Scholar] [CrossRef]
- Ibrahim, S.; Stevenson, M.; Hariza, A. Mode choice model for vulnerable motorcyclists in Malaysia. Traffic Inj. Prev. 2006, 7, 150–154. [Google Scholar]
- Almselati, A.S.I.; Rahmat, R.A.O.K.; Jaafar, O.; Yahia, H.A. Using spike model to reduce traffic congestion and improve public transportation in Malaysia. Trans. Res. Part D Transp. Environ. 2015, 38, 59–66. [Google Scholar] [CrossRef]
- Stradling, S. Transport user needs and marketing public transport. Munic Eng. 2002, 151, 23–28. [Google Scholar] [CrossRef]
- Dell’olio, L.; Ibeas, A.; Cencin, P. The quality of service desired by public transport users. Transp. Policy 2011, 18, 217–227. [Google Scholar] [CrossRef]
- Cender, A.; Chowdhury, S.; Taghipouran, N.; Olsen, J. Modelling public transport users’ behaviour at connection point. Transp. Policy 2013, 27, 112–122. [Google Scholar] [CrossRef]
- Redman, L.; Friman, M.; Garling, T.; Harting, T. Quality attributes of public transport that attract car users: A research review. Transp. Policy 2013, 25, 119–127. [Google Scholar] [CrossRef]
- Dell’olio, L.; Ibeas, A.; Cecin, P. Modelling user perception of bus transit quality. Transp. Policy 2010, 17, 388–397. [Google Scholar] [CrossRef]
- Hensher, D.A. Assessing systematic sources of variation in public transport elasticities: Some comparative warnings. Transp. Res. A Policy Pract. 2008, 42, 1031–1042. [Google Scholar] [CrossRef]
- Currie, G.; Willis, D. Melbourne bus rail interchange strategy. In Proceedings of the 22nd Australasian Transport Research Forum, Sydney, Australia, 1 September 1998.
- Hale, C.A.; Miller, M. Amenity and opportunity at rail stations. Aust. Plan. 2013, 50, 44–54. [Google Scholar] [CrossRef]
- Whelan, G.; Crockett, J. An investigation of the willingness to pay to reduce rail overcrowding. In Proceedings of the 1st International Conference on Choice Modelling, Harrogate, UK, 30 March–1 April 2009.
- Lu, H.; Fowkers, A.S.; Wardman, M. Amending the incentive for strategic bias in stated preference studies: A case study in users’ valuation of rolling stock. Transp. Res. Rec. 2008, 2049, 128–135. [Google Scholar] [CrossRef]
- Douglas, N.; Karpouzis, G. Estimating the passenger cost of train over-crowding. In Proceedings of the 29th Australasian Transport Research Forum, Gold Coast, Australia, 27–29 September 2006.
- Douglas, N.; Karpouzis, G. Estimating the cost to passengers of station crowding. In Proceedings of the 28th Australasian Transport Research Forum, Sydney, Australia, 28–30 September 2005.
- Polydoropoulou, A.; Ben-Akiva, M.E. Combined revealed and stated pre-ference nested logit access and mode choice model for multiple mass transit technologies. Transp. Res. Rec. 2001, 1771, 38–45. [Google Scholar] [CrossRef]
- Jakobsson, K.M.; Dragun, A.K. Contingent Valuation and Endangered Species: Methodological Issues and Applications; Edward Elgar Publishing: Cheltenham, UK, 1996. [Google Scholar]
- Kristrom, B. Spike models in contingent valuation. Am. J. Agric. Econ. 1997, 79, 1013–1023. [Google Scholar] [CrossRef]
- Bigerna, S.; Polinori, P. Willingness to pay and public acceptance for hydrogen buses: A case study of Perugia. Sustainability 2015, 7, 13270–13289. [Google Scholar] [CrossRef]
- Schwarzlose, A.A.I.; Mjelde, J.W.; Dudensing, R.M.; Jin, Y.; Cherrington, L.K.; Chen, J. Willingness to pay for public transportation options for improving the quality of life of the rural elderly. Transp. Res. Part A Policy Pract. 2014, 61, 1–14. [Google Scholar] [CrossRef]
- Lee, B.J.; Kim, K.W.; Kim, G.S.; Oh, S.H. An estimation of willingness to pay for advanced public transportation services using SP. J. Korean Soc. Civ. Eng. 2009, 29, 433–441. [Google Scholar]
- Macfarlane, G.S.; Garrow, L.A.; Moreno-Cruz, J. Do Atlanta residents value MARTA? Selecting an autoregressive model to recover willingness to pay. Transp. Res. Part A Policy Pract. 2015, 78, 214–230. [Google Scholar] [CrossRef]
- Drevs, F.; Tscheulin, D.K.; Lindenmeier, J.; Renner, S. Crowding-in or crowding out: An empirical analysis on the effect of subsidies on individual willingness-to-pay for public transportation. Transp. Res. Part A Policy Pract. 2014, 59, 250–261. [Google Scholar] [CrossRef]
- Phanikumar, C.; Maitra, B. Willingness-to-pay and preference heterogeneity for rural bus attributes. J. Transp. Eng. 2007, 133, 62–69. [Google Scholar] [CrossRef]
- Zadeh, L.A. Fuzzy sets. Inf. Control 1965, 8, 338–353. [Google Scholar] [CrossRef]
- Junior, F.R.L.; Osiro, L.; Carpinetti, L.C.R. A comparison between Fuzzy AHP and Fuzzy TOPSIS methods to supplier selection. Appl. Soft Comput. 2014, 21, 194–209. [Google Scholar] [CrossRef]
- Zimmermann, H.J. Fuzzy set theory. Wiley Interdiscip. Rev. Comput. Stat. 2010, 2, 317–332. [Google Scholar] [CrossRef]
- Khazaeni, G.; Khanzadi, M.; Afshar, A. Fuzzy adaptive decision making model for selection balanced risk allocation. Int. J. Proj. Manag. 2012, 30, 511–522. [Google Scholar] [CrossRef]
- Saaty, T.L. What is the Analytic Hierarchy Process? Springer: Berlin Heidelberg, Germany, 1988. [Google Scholar]
- Saaty, T.L. Homogeneity and clustering in AHP ensures the validity of the scale. Eur. J. Oper. Res. 1994, 72, 598–601. [Google Scholar] [CrossRef]
- Ibrahim, O.; Nilashi, M.; Bagherifard, K.; Hashem, N.; Janahmadi, N.; Barisami, M. Application of AHP and K-Means clustering for ranking and classifying customer trust in M-commerce. Aust. J. Basic Appl. Sci. 2011, 5, 1441–1457. [Google Scholar]
- Ahmadi, H.; Nilashi, M.; Ibrahim, O. Organizational decision to adopt hospital information system: An empirical investigation in the case of Malaysian public hospitals. Int. J. Med. Inform. 2015, 84, 166–188. [Google Scholar] [CrossRef] [PubMed]
- Buckley, J.J. Fuzzy hierarchical analysis. Fuzzy Sets Syst. 1985, 17, 233–247. [Google Scholar] [CrossRef]
- Zyoud, S.H.; Kaufmann, L.G.; Shaheen, H.; Samhan, S.; Fuchs-Hanusch, D. A framework for water loss management in developing countries under fuzzy environment: Integration of Fuzzy AHP with Fuzzy TOPSIS. Expert Syst. Appl. 2016, 61, 86–105. [Google Scholar] [CrossRef]
- Javanbarg, M.B.; Scawthorn, C.; Kiyono, J.; Shahbodaghkhan, B. Fuzzy AHP-based multicriteria decision making systems using particle swarm optimization. Expert Syst. Appl. 2012, 39, 960–966. [Google Scholar] [CrossRef]
- Taylan, O.; Bafail, A.O.; Abdulaal, R.M.; Kabli, M.R. Construction projects selection and risk assessment by fuzzy AHP and fuzzy TOPSIS methodologies. Appl. Soft Comput. 2014, 17, 105–116. [Google Scholar] [CrossRef]
- Del Vasto-Terrientes, L.; Valls, A.; Slowinski, R.; Zielniewicz, P. ELECTRE-III-H: An outranking-based decision aiding method for hierarchically structured criteria. Expert Syst. Appl. 2015, 42, 4910–4926. [Google Scholar] [CrossRef]
- Van Laarhoven, P.; Pedrycz, W. A fuzzy extension of Saaty’s priority theory. Fuzzy Sets Syst. 1983, 11, 229–241. [Google Scholar] [CrossRef]
- Stam, A.; Sun, M.; Haines, M. Artificial neural network representations for hierarchical preference structures. Comput. Oper. Res. 1996, 23, 1191–1201. [Google Scholar] [CrossRef]
- Deng, H. Multicriteria analysis with fuzzy pairwise comparison. In Proceedings of the 1999 IEEE International Fuzzy Systems Conference, FUZZ-IEEE’99, Seoul, Korea, 22–25 August 1999; pp. 726–731.
- Büyüközkan, G.; Kahraman, C.; Ruan, D. A fuzzy multi-criteria decision approach for software development strategy selection. Int. J. Gen. Syst. 2004, 33, 259–280. [Google Scholar] [CrossRef]
- Chang, D.-Y. Applications of the extent analysis method on fuzzy AHP. Eur. J. Oper. Res. 1996, 95, 649–655. [Google Scholar] [CrossRef]
- Taguchi, G.; Jugulum, R. The Mahalanobis-Taguchi Strategy: A Pattern Technology System; John Wiley & Sons: New York, NY, USA, 2002. [Google Scholar]
- Bagci, M.; Imrek, H.; Gachot, C. Erosion wear performance of borax filled novel hybrid composites by using the Taguchi experimental design. Ind. Lubr. Tribol. 2016, 68, 134–140. [Google Scholar] [CrossRef]
- Ross, P.J. Taguchi Techniques for Quality Engineering: Loss Function, Orthogonal Experiments, Parameter and Tolerance Design, 2nd ed.; McGraw–Hill: New York, NY, USA, 1988. [Google Scholar]
- Kong, X.; Yang, L.; Zhang, H.; Chi, G.; Wang, Y. Optimization of surface roughness in laser-assisted machining of metal matrix composites using Taguchi method. Int. J. Adv. Manuf. Technol. 2016. [Google Scholar] [CrossRef]
- Al-Janan, D.H.; Liu, T.-K. Path optimization of CNC PCB drilling using hybrid Taguchi genetic algorithm. Kybernetes 2016, 45, 107–125. [Google Scholar] [CrossRef]
- Yakut, K.; Alemdaroglu, N.; Kotcioglu, I.; Celik, C. Experimental investigation of thermal resistance of a heat sink with hexagonal fins. Appl. Therm. Eng. 2006, 26, 2262–2271. [Google Scholar] [CrossRef]
- Besterfield, D.; Besterfield-Michna, C.; Besterfield, G.; Besterfield-Sacre, M.; Urdhwareshe, H.; Urdhwarshe, R. Total Quality Management, 3rd ed.; Dorling Kindersley Pvt. Ltd.: Noida, India, 2012. [Google Scholar]
- Ghani, J.; Choudhury, I.; Hassan, H. Application of Taguchi method in the optimization of end milling parameters. J. Mater. Process. Technol. 2004, 145, 84–92. [Google Scholar] [CrossRef]
- Phadke, M.S. Quality control, robust design, and the Taguchi method. In Quality Engineering Using Design of Experiments; Springer: New York, NY, USA, 1989. [Google Scholar]
- Road Transport Department. “Statistics for Motorcar Registrations” from Road Transport Department Malaysia. 2010. Available online: http://portal.jpj.gov.my/en/statistik-pendaftaran-motokar (accessed on 25 March 2016). [Google Scholar]
- Ministry of Federal Territories and Urban Wellbeing. Greater KL/KV Comprises 10 Local Authorities. 2011. Available online: http://www.dbkl.gov.my/index.php?lang=ms (accessed on 25 March 2016). [Google Scholar]
© 2016 by the authors; licensee MDPI, Basel, Switzerland. This article is an open access article distributed under the terms and conditions of the Creative Commons Attribution (CC-BY) license (http://creativecommons.org/licenses/by/4.0/).


