Article

Data-Filtering System to Avoid Total Data Distortion in IoT Networking

1
Department of Software Engineering, Changshin University, Changwon 51352, Korea
2
Department of Multimedia Engineering, Dongguk University, Seoul 04620, Korea
3
Department of Computer Software Engineering, Soonchunhyang University, Asan 31538, Korea
*
Author to whom correspondence should be addressed.
Symmetry 2017, 9(1), 16; https://doi.org/10.3390/sym9010016
Submission received: 30 September 2016 / Revised: 25 December 2016 / Accepted: 16 January 2017 / Published: 20 January 2017
(This article belongs to the Special Issue Symmetry in Secure Cyber World)

Abstract

:
In the Internet of Things (IoT) networking, numerous objects are connected to a network. They sense events and deliver the sensed information to the cloud. A lot of data is generated in the IoT network, and servers in the cloud gather the sensed data from the objects. Then, the servers analyze the collected data and provide proper intelligent services to users through the results of the analysis. When the server analyzes the collected data, if there exists malfunctioning data, distortional results of the analysis will be generated. The distortional results lead to misdirection of the intelligent services, leading to poor user experience. In the analysis for intelligent services in IoT, malfunctioning data should be avoided because integrity of the collected data is crucial. Therefore, this paper proposes a data-filtering system for the server in the cloud. The proposed data-filtering system is placed in front of the server and firstly receives the sensed data from the objects. It employs the naïve Bayesian classifier and, by learning, classifies the malfunctioning data from among the collected data. Data with integrity is delivered to the server for analysis. Because the proposed system filters the malfunctioning data, the server can obtain accurate analysis results and reduce computing load. The performance of the proposed data-filtering system is evaluated through computer simulation. Through the simulation results, the efficiency of the proposed data-filtering system is shown.

Graphical Abstract

1. Introduction

Internet of Things (IoT) is recent computing paradigm and consists of many tiny objects. The objects that surround us connect to a network and exchange information. Advances in semiconductor and communication technologies lead to developments of tiny computing devices, and the objects get smaller as embedded systems. They become a sensor or an actuator system. They are deployed in various places and generate numerous data. The network, which is connected by the objects (i.e., IoT devices), is an access network for intelligent services. It is connected to a server in the cloud through gateways. Thus, a lot of data is delivered to the server, and the server gathers data from the objects and then analyzes it for intelligent services. IoT intelligent services (for example, a smart factory, a smart home, a smart city, etc.) depend on the analysis of the server. That is, based on the analyzed information, different behaviors can be provided in the services. The intelligent services are dealt by cyber physical systems (CPS). They approach decision making through the collected data from the objects in a physical domain. Thus, data analysis is an important part in the IoT services.
Figure 1 shows a general architecture for IoT services. As mentioned earlier, it is composed of the IoT access network and the Internet protocol (IP) cloud. In the IoT access network, sensors of devices generate information. The information is transmitted to a server. Then, the server in the cloud makes decisions by data analysis and gives commands to actuators in the access network [1,2,3,4,5,6,7,8,9]. Therefore, IoT services are provided by monitoring data in the physical domain of the access network and analyzing data in the computing domain of the IP cloud.
For decision making, the server analyzes a lot of data. If there exists malfunctioning data in IoT devices, the server may make a wrong decision and service efficiency will be decreased. Because many IoT devices have resource constraints, they can incur malfunction. When device malfunction maintains in the network, malfunctioning data or unreliable data is continuously generated. Then, the server turns out distortional results through the data analysis. Furthermore, injecting additional data with wrong information can happen in the network. The data can also change decision making in the server, and the wrong decision will decrease the user experience for services. Thus, in the server, data integrity must be ensured. It should exploit reliable data, which originates from the correct objects [10,11,12,13].
To obtain reliable data (i.e., normal data, non-suspicious data) in the server, a data-filtering system is necessary, and malfunctioning data should be avoided in the data analysis of the server. By filtering the malfunctioning data, the server leads to the right decision by using reliable data. In addition, the server can spend less energy on computing by reducing computing load in the data processing. Because the IoT devices generate a great deal of data traffic, including malfunctioning data in the physical sensing domain, the data-filtering system should pass the meaningful normal data among them. Thus, the proposed data-filtering system applies learning in order to classify the normal data and the malfunctioning data traffic. The criteria to distinguish the malfunctioning data and normal data can be different, depending on the results of the learning process for each data traffic. For the learning process, the naïve Bayesian classifier—which is based on statistical probabilities—is exploited. By the learning process using the naïve Bayesian classifier, the proposed data-filtering system can easily classify the malfunctioning data and the normal data from IoT devices. The server excludes the malfunctioning data from the collected data analysis for data mining. Thus, it can avoid distortional results of the data analysis.
The remainder of this paper is organized as follows. Section 2 describes the background of the malfunction possibility of IoT devices and intrusion detection by the malfunctioning data. In Section 3, malfunctioning data detection using the naïve Bayesian classifier and the proposed data-filtering system are discussed. Section 4 presents performance evaluation for the proposed method. Finally, Section 5 concludes the paper.

2. Background

IoT devices as sensor nodes are tiny embedded systems, and they construct a wireless sensor network to collect data for intelligent services. In general, sensor nodes have insufficient computing capability in the wireless sensor network. In addition, they have resource constraints with respect to energy, memory, communication, and latency in communication [11,14,15,16,17,18,19].
  • Energy constraints: Because IoT devices generally employ battery sources, energy consumption is the most important design consideration. For a long lifetime, IoT devices should minimize energy consumed for operations.
  • Memory limitations: IoT devices are tiny portable devices or embedded system devices. Because the device size is small, they cannot adopt a lot of memory and storage on their electrical board.
  • Unreliable communication: IoT devices exploit wireless communication in the industrial, scientific, and medical (ISM) frequency band for data delivery. Wireless communication has a higher channel error than wired communication. In addition, because the ISM frequency band is used in many wireless technologies, the wireless technologies can affect data transmission among each other.
  • High latency in communication: Network congestion, processing in the intermediate nodes, and low data rate in wireless cause high latency in data delivery.
Because of the low remaining energy, IoT devices can obtain unusual sensing data. In the ISM frequency band, a transmission signal can be easily perverted by other wireless technologies. Data can be damaged by high channel error from wireless systems and congestion by a lot of traffic. These resource constraints of IoT devices can lead to total data distortion in the server that collects data from whole IoT devices.
The malfunctioning data is related to data integrity. For data integrity in the server, the malfunctioning data and unreliable data should be excluded from the data analysis. The server should use the normal data originated from correct sources for decision making. To detect the malfunctioning data or unusual data, an intrusion detection system can be exploited. The intrusion detection system monitors suspicious data in a network [10,20]. There are two types of intrusion detection systems: anomaly intrusion detection system and misuse intrusion detection system. In the anomaly intrusion detection system, user profiles are defined and the system compares data traffic to the profiles. Through the differences between the profiles and data traffic, the system detects intrusion or malfunctioning data. Thus, the system is exploited to find new or unknown intrusion. In contrast, the misuse intrusion detection system has signatures (i.e., descriptions) of malfunctioning data. It is a rule-based system that uses known patterns of intrusion according to the signatures [11,12].
The misuse intrusion detection system has weakness in unknown patterns, and the anomaly intrusion detection system should construct a model for normal operations that is defined by the user profile. In general, the anomaly intrusion detection is preferred to the misuse intrusion detection in order to detect intrusion data. However, to increase data integrity and to reduce computation load of the data analysis at the server, both the intrusion data from suspicious devices and malfunctioning data at devices in the network should be excluded in the data analysis. To do that, it is necessary to use an adaptive detection system for suspicious data. Suspicious data filtering is classified as content-based filtering and collaborative filtering. The content-based filtering uses domain knowledge of generated data. The collaborative filtering does not exploit extra information [21,22]. In IoT networking, domain knowledge for whole data cannot be maintained. Therefore, the collaborative filtering is considered for the data-filtering system for IoT services. The collaborative filtering is categorized into a memory-based method and a model-based method. The memory-based method finds similarity by calculation of data correlation and filters data by the similarity. To obtain the similarity, common data is used. According to distribution of the common data, this leads to limitation of reliable filtering. Thus, the model-based method has been investigated. The model-based method exploits a learning algorithm for better performance, and data filtering is performed by the learning model [21,22,23,24]. However, when it is applied to IoT services, the existing filtering methods just determine whether data is normal or not. In general, normal data in IoT is periodically generated. Event-driven data is different from normal data. Although the similarity between the event-driven data and the normal data is low, the event-driven data should not be blocked in the filtering system, but the existing filtering methods do not process the event-driven data. Thus, the existing ways of data-filtering is not enough for providing reliable IoT services. Therefore, in this paper, the proposed system adaptively finds the suspicious data using learning by the naïve Bayesian classifier. It includes the valid data (i.e., the normal data and the event-driven data) and excludes the malfunctioning data in data analysis at the management server.

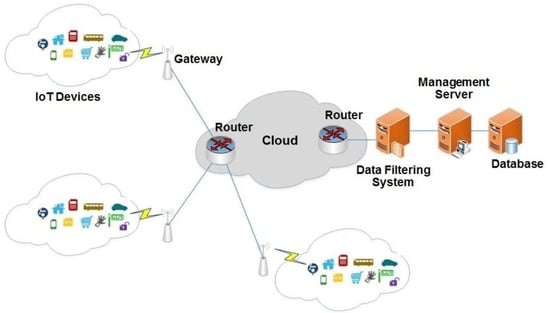
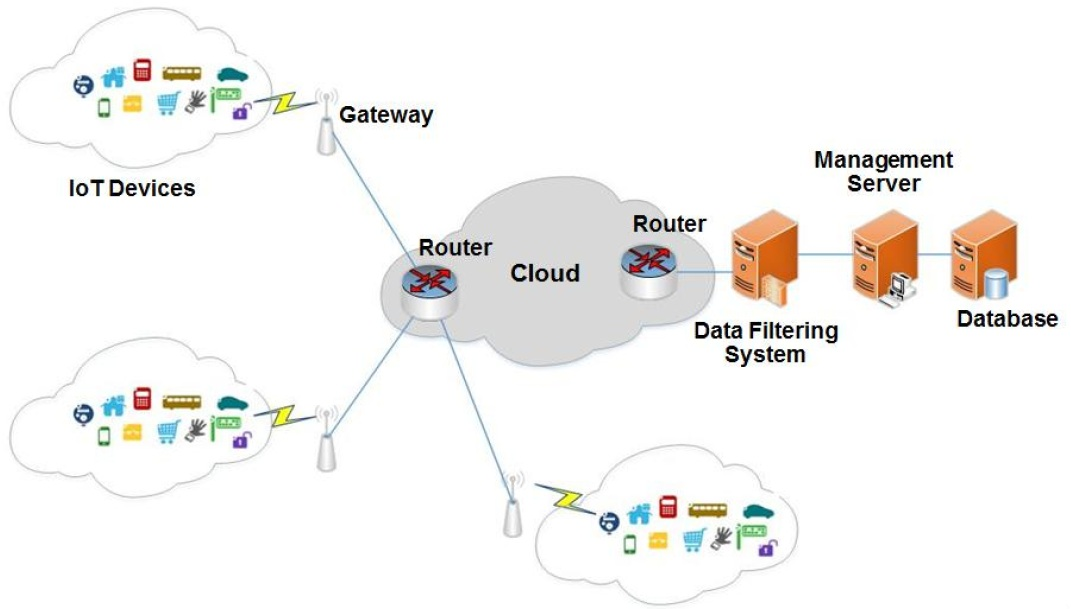
3. The Proposed Data-Filtering System

IoT services are based on collected data from IoT devices. In the IoT area, data gathering and data analysis are occupied in major parts for IoT service implementation. Data gathering is performed through various wireless technologies such as wireless sensor network (WSN), low-power wide area network (LPWAN), Wi-Fi, Bluetooth, cellular network, and so on. The server deals with the gathered data in the networks. As mentioned in Section 1, generated data in the IoT devices is transmitted to the sever in the cloud. The server performs analysis for the gathered data and extracts meaningful knowledge. Intelligent IoT services are provided through the meaningful knowledge.
In the environment where numerous data are concentrated on the server, data integrity is raised as an important element in the data analysis at the server. The data integrity leads to reducing computing load at the server when the server analyzes the collected data from IoT devices. Reducing the computing load can cause decreased energy consumption when the server processes the data. Therefore, a system is needed to support data integrity.
Figure 2 represents the network architecture for the proposed system to support data integrity. Various data are generated in the IoT access networks and are delivered to the cloud through gateways. In the cloud, data is transmitted to the management server, which manages intelligent services. The management server stores the data to databases and then analyzes the data and extracts meaningful knowledge for the intelligent services. For reliable data analysis, it is required to ensure data integrity. If the data integrity is not guaranteed, the extracted knowledge is not reliable, and unreliable knowledge leads to wrong decisions for the services. To support the data integrity, the data-filtering system is placed in front of the management server. It monitors data incoming to the management server. It detects the malfunctioning data and the intrusion data, and blocks them from incoming to the management server.

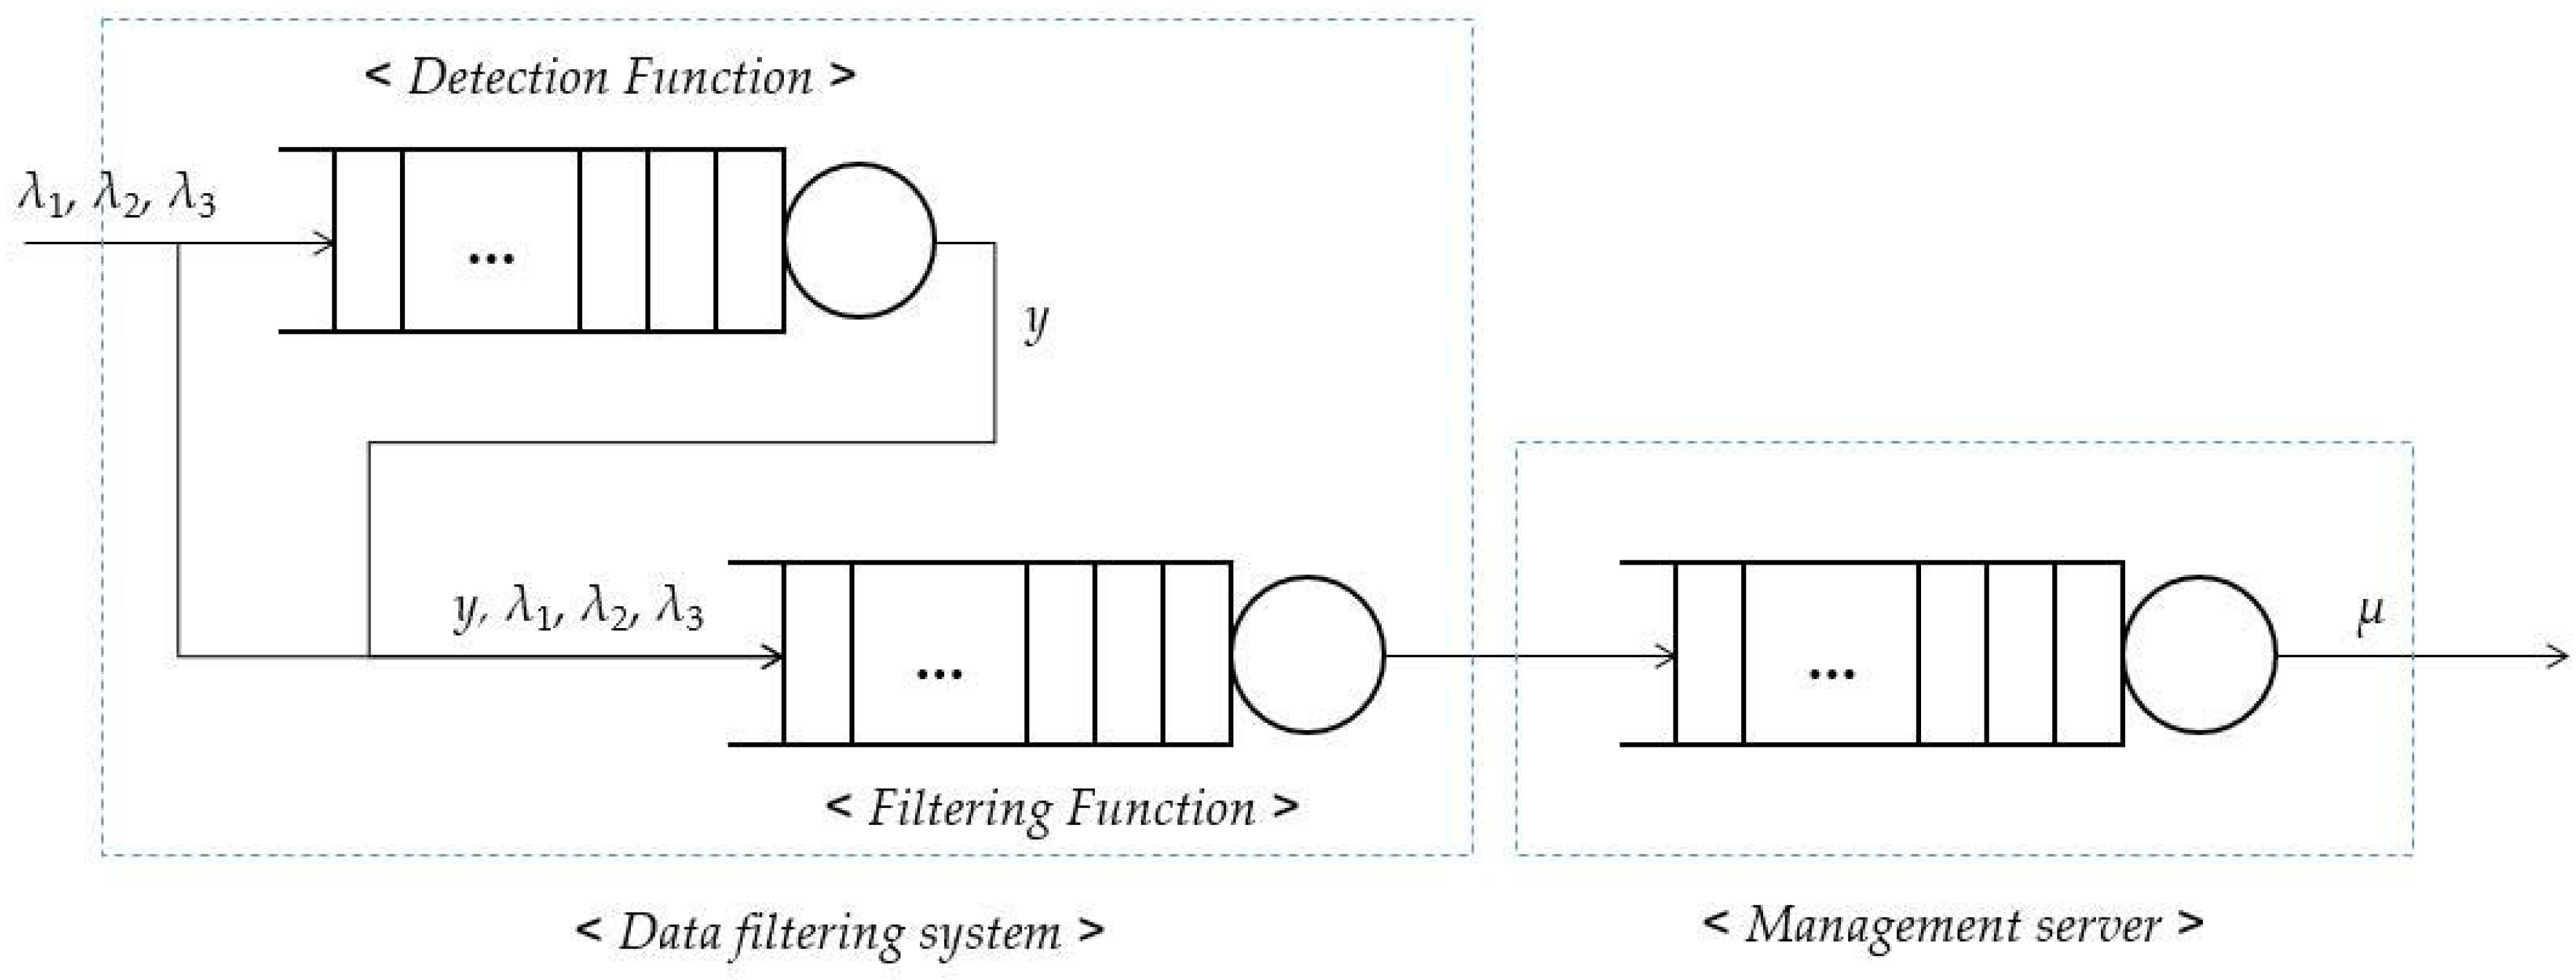
3.1. Detection of the Malfunctioning Data

The data-filtering system finds the malfunctioning data and the intrusion data using learning. Through the incoming data traffic, it performs learning to classify normal data and suspicious data. For the learning process, the proposed data-filtering system employs the naïve Bayesian classifier, which is one of the supervised learning algorithms. Supervised learning is widely used to classify binomial states in computer systems or network systems [25,26]. The naïve Bayesian classifier is based on the Bayes rule, which uses statistical probabilities. That is, it obtains a priori information through statistics about a priori events, calculates probabilities for each state using the a priori information, and then it estimates the most possible state by comparing the probabilities. The probabilities for each state are calculated by the Bayes rule. Then, the detection function in the proposed data-filtering system can be represented as:
v = arg max y P ( y | x ) = arg max y P ( x | y ) P ( y ) P ( x )   = arg max y P ( x | y ) P ( y ) ,
where y means classification state. If the incoming data is suspicious data, y becomes 0; otherwise, y becomes 1. x means attributes for classification. In the proposed system, the attributes are ranges of sensing values of devices (x1) and frequency of the generated data (x2). The most possible state is obtained by posterior probability, and the posterior probability is determined by P(y|x). P(y|x) is calculated by the Bayes rule. That is, P(y|x) turns out P(x|y)P(y)/P(x). The detection function calculates posterior probabilities for each state y and determines the state that has the larger posterior probability as the most possible state. This can be represented as arg max y P ( x | y ) P ( y ) .
For several attributes for classification, when the attributes are conditionally independent for y, Equation (1) becomes Equation (2) as:
v = arg max y P ( x | y ) P ( y ) = arg max y P ( x 1 , x 2 , , x n | y ) P ( y ) = arg max y P ( x 1 | y ) P ( x 2 | y ) P ( x n | y ) P ( y ) = arg max y i = 1 n P ( x i | y ) P ( y ) .
The detection function predicts the suspicious data among incoming data traffic using Equation (2). As mentioned earlier, it employs two attributes (i.e., x1 and x2) for the classification, and the attributes are measured from the incoming data traffic at the data-filtering system, as shown in the Figure 2. The measured attributes are managed as statistical information. The detection function of the data-filtering system can estimate the status (y) of incoming data through the statistical information.
To calculate the posterior probability, the detection function should get the a priori probabilities. To obtain the a priori probability, the detection function counts the values of the attributes when the data enters the system. Then, statistical information for x1 and x2 is made up for normal data and suspicious data. By the statistical information, the a priori probability is calculated. That is, the detection function can find the suspicious data through prediction by using the posterior probability by the a priori probabilities. The counted values for the attributes are described by the indicator function {∙}. The indicator function adds 1 if the given conditions are satisfied. In m training examples as the a priori experiences, the a priori probabilities for normal data (y = 1) and suspicious data (y = 0) are represented as:
P ( x i | y = 1 ) = j = 1 m 1 { x i ( j ) = 1 , y ( j ) = 1 } j = 1 m 1 { y ( j ) = 1 } P ( y = 1 ) = j = 1 m 1 { y ( j ) = 1 } m ,
P ( x i | y = 0 ) = j = 1 m 1 { x i ( j ) = 1 , y ( j ) = 0 } j = 1 m 1 { y ( j ) = 0 } P ( y = 0 ) = j = 1 m 1 { y ( j ) = 0 } m
If the system has no training examples, P(x|y) is 0 in Equations (3) and (4). This means the detection function cannot classify the normal data and the suspicious data. Thus, a method to calculate the a priori probability without a priori statistical information is needed. This is Laplace smoothing [25,26]. The Laplace smoothing adds 1 and k to the numerator and denominator, respectively, where k is the number of statuses in y. Because the proposed system deals with binomial states, its value is 2. Then, Equations (2) and (4) become:
P ( x i | y = 1 ) = j = 1 m 1 { x i ( j ) = 1 , y ( j ) = 1 } + 1 j = 1 m 1 { y ( j ) = 1 } + 2 P ( y = 1 ) = j = 1 m 1 { y ( j ) = 1 } + 1 m + 2 ,
P ( x i | y = 0 ) = j = 1 m 1 { x i ( j ) = 1 , y ( j ) = 0 } + 1 j = 1 m 1 { y ( j ) = 0 } + 2 P ( y = 0 ) = j = 1 m 1 { y ( j ) = 0 } + 1 m + 2
Now, the a priori probabilities for incoming data in the system are obtained by Equations (5) and (6). After the calculation of the a priori probabilities, the detection function calculates posterior probabilities for each status in y. Then, it compares the posterior probabilities and determines the most possible status using Equation (2).

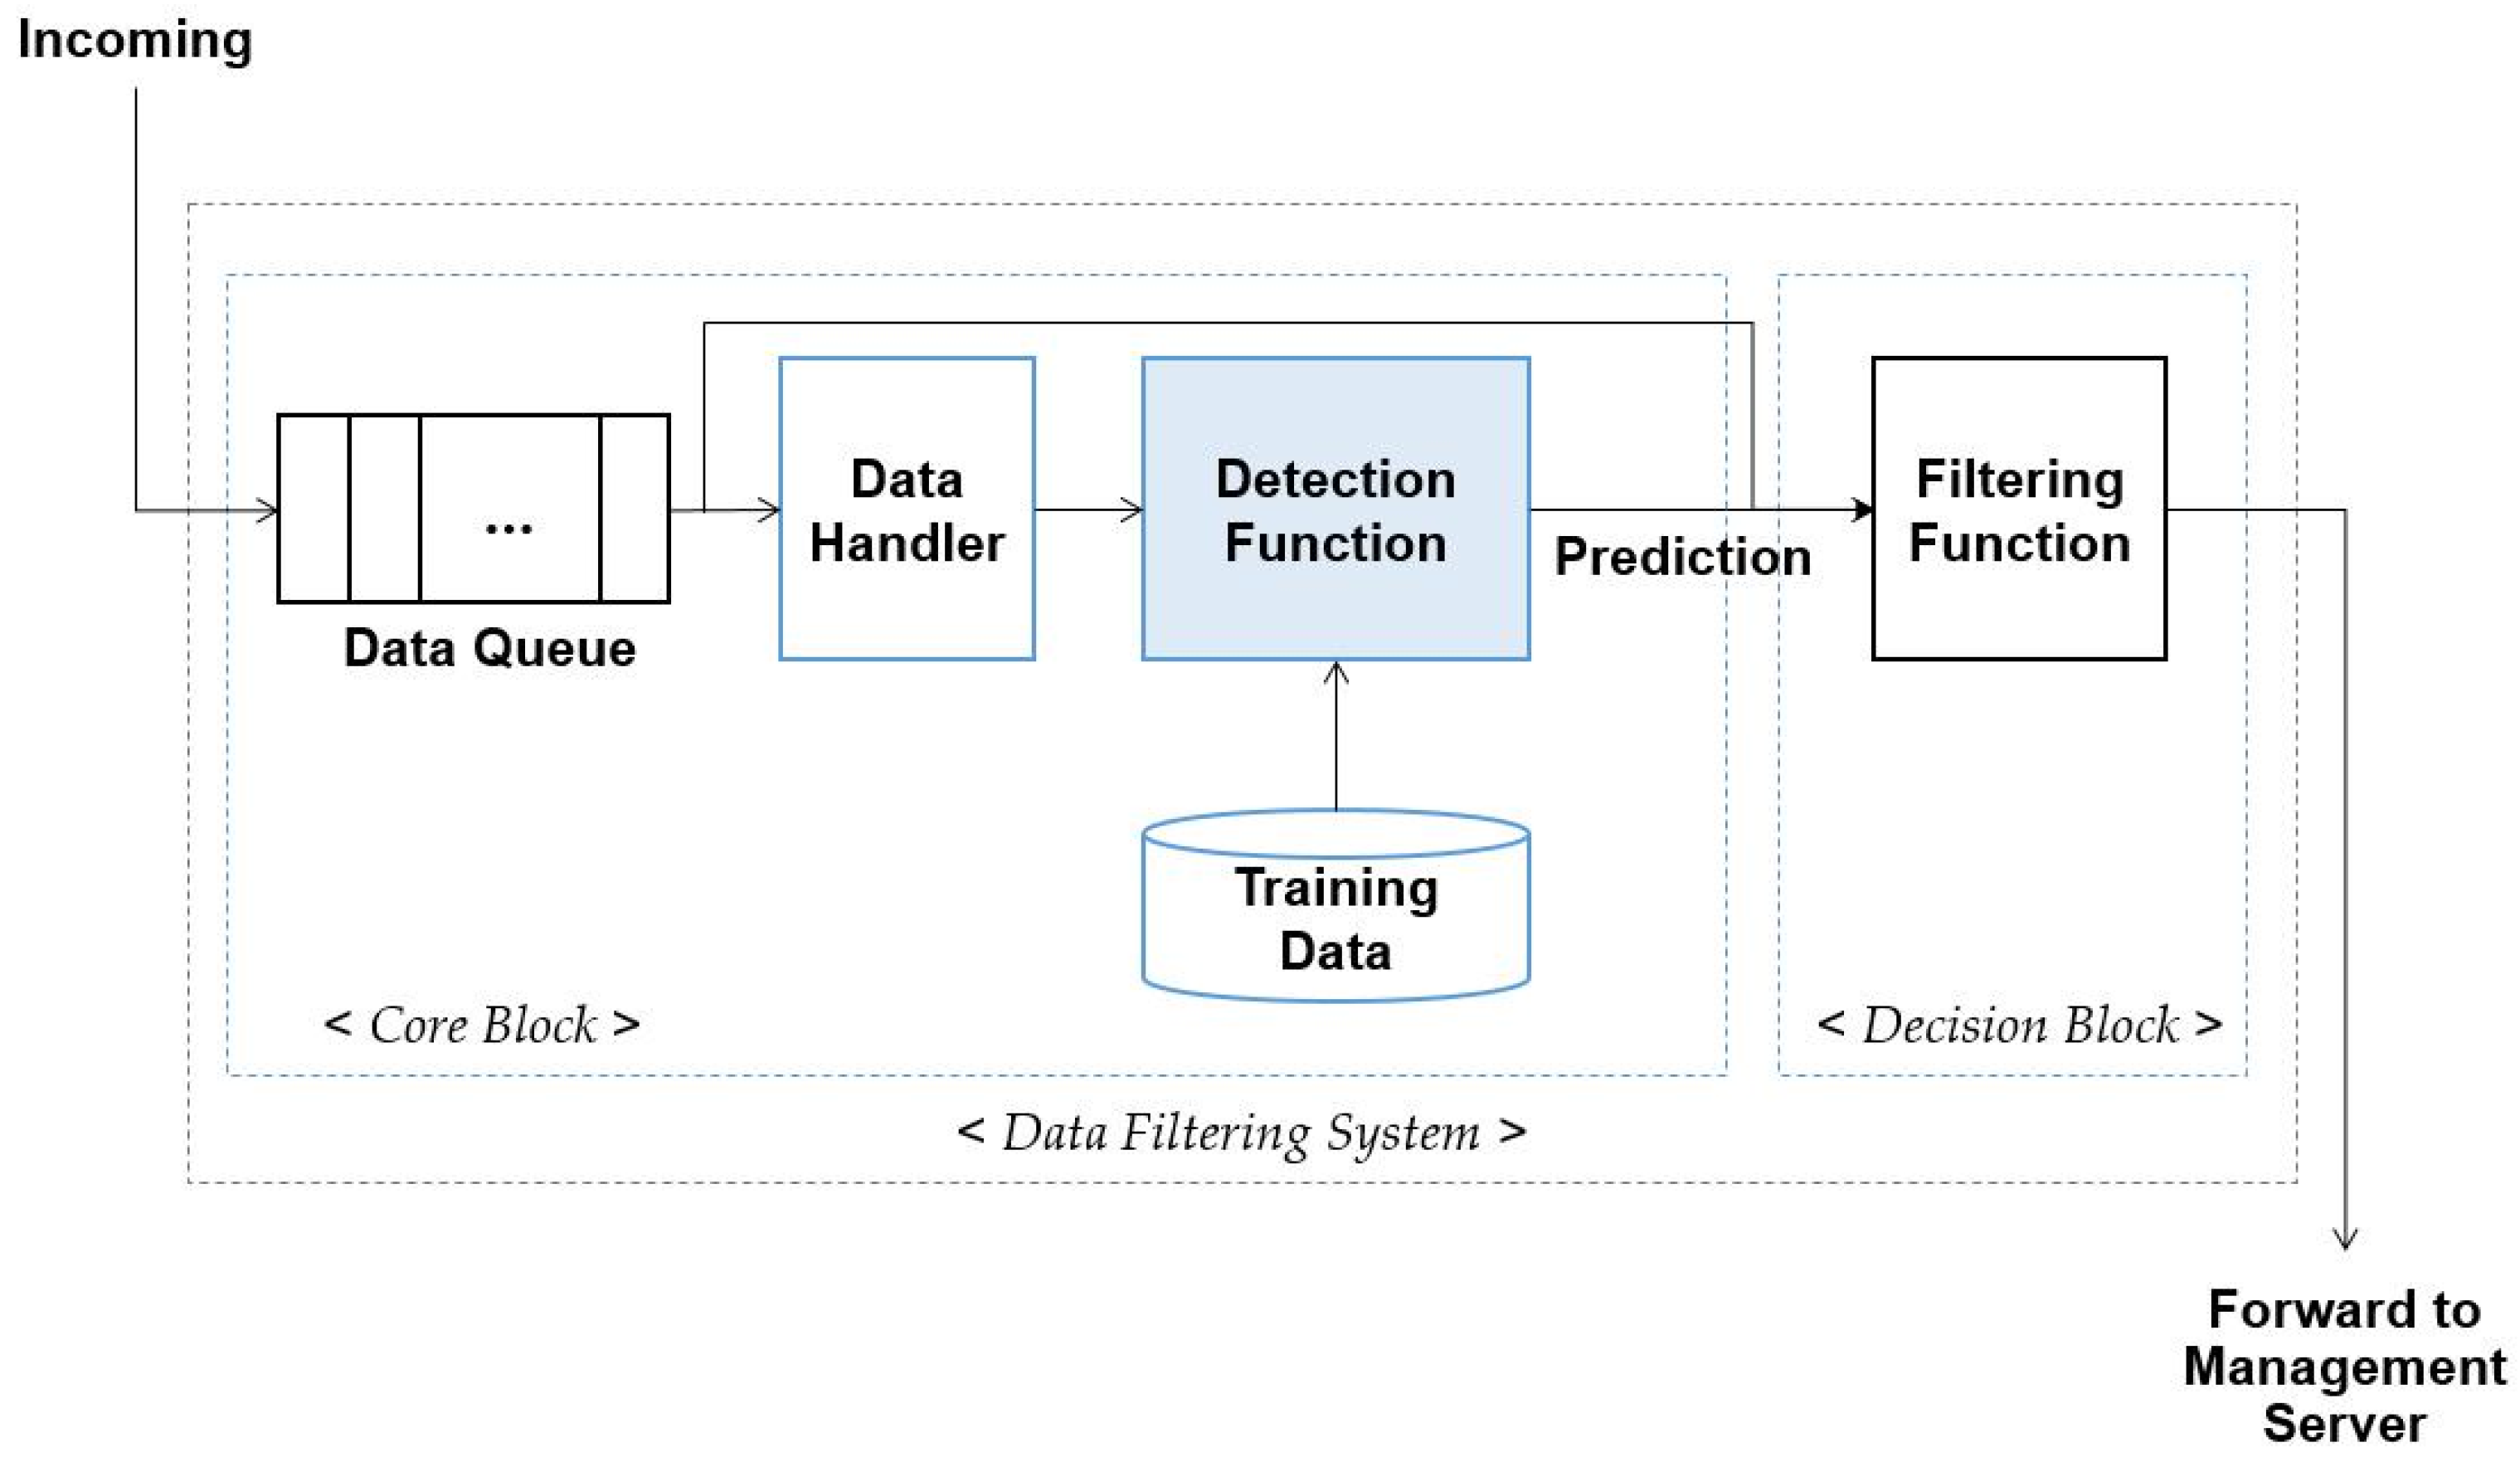
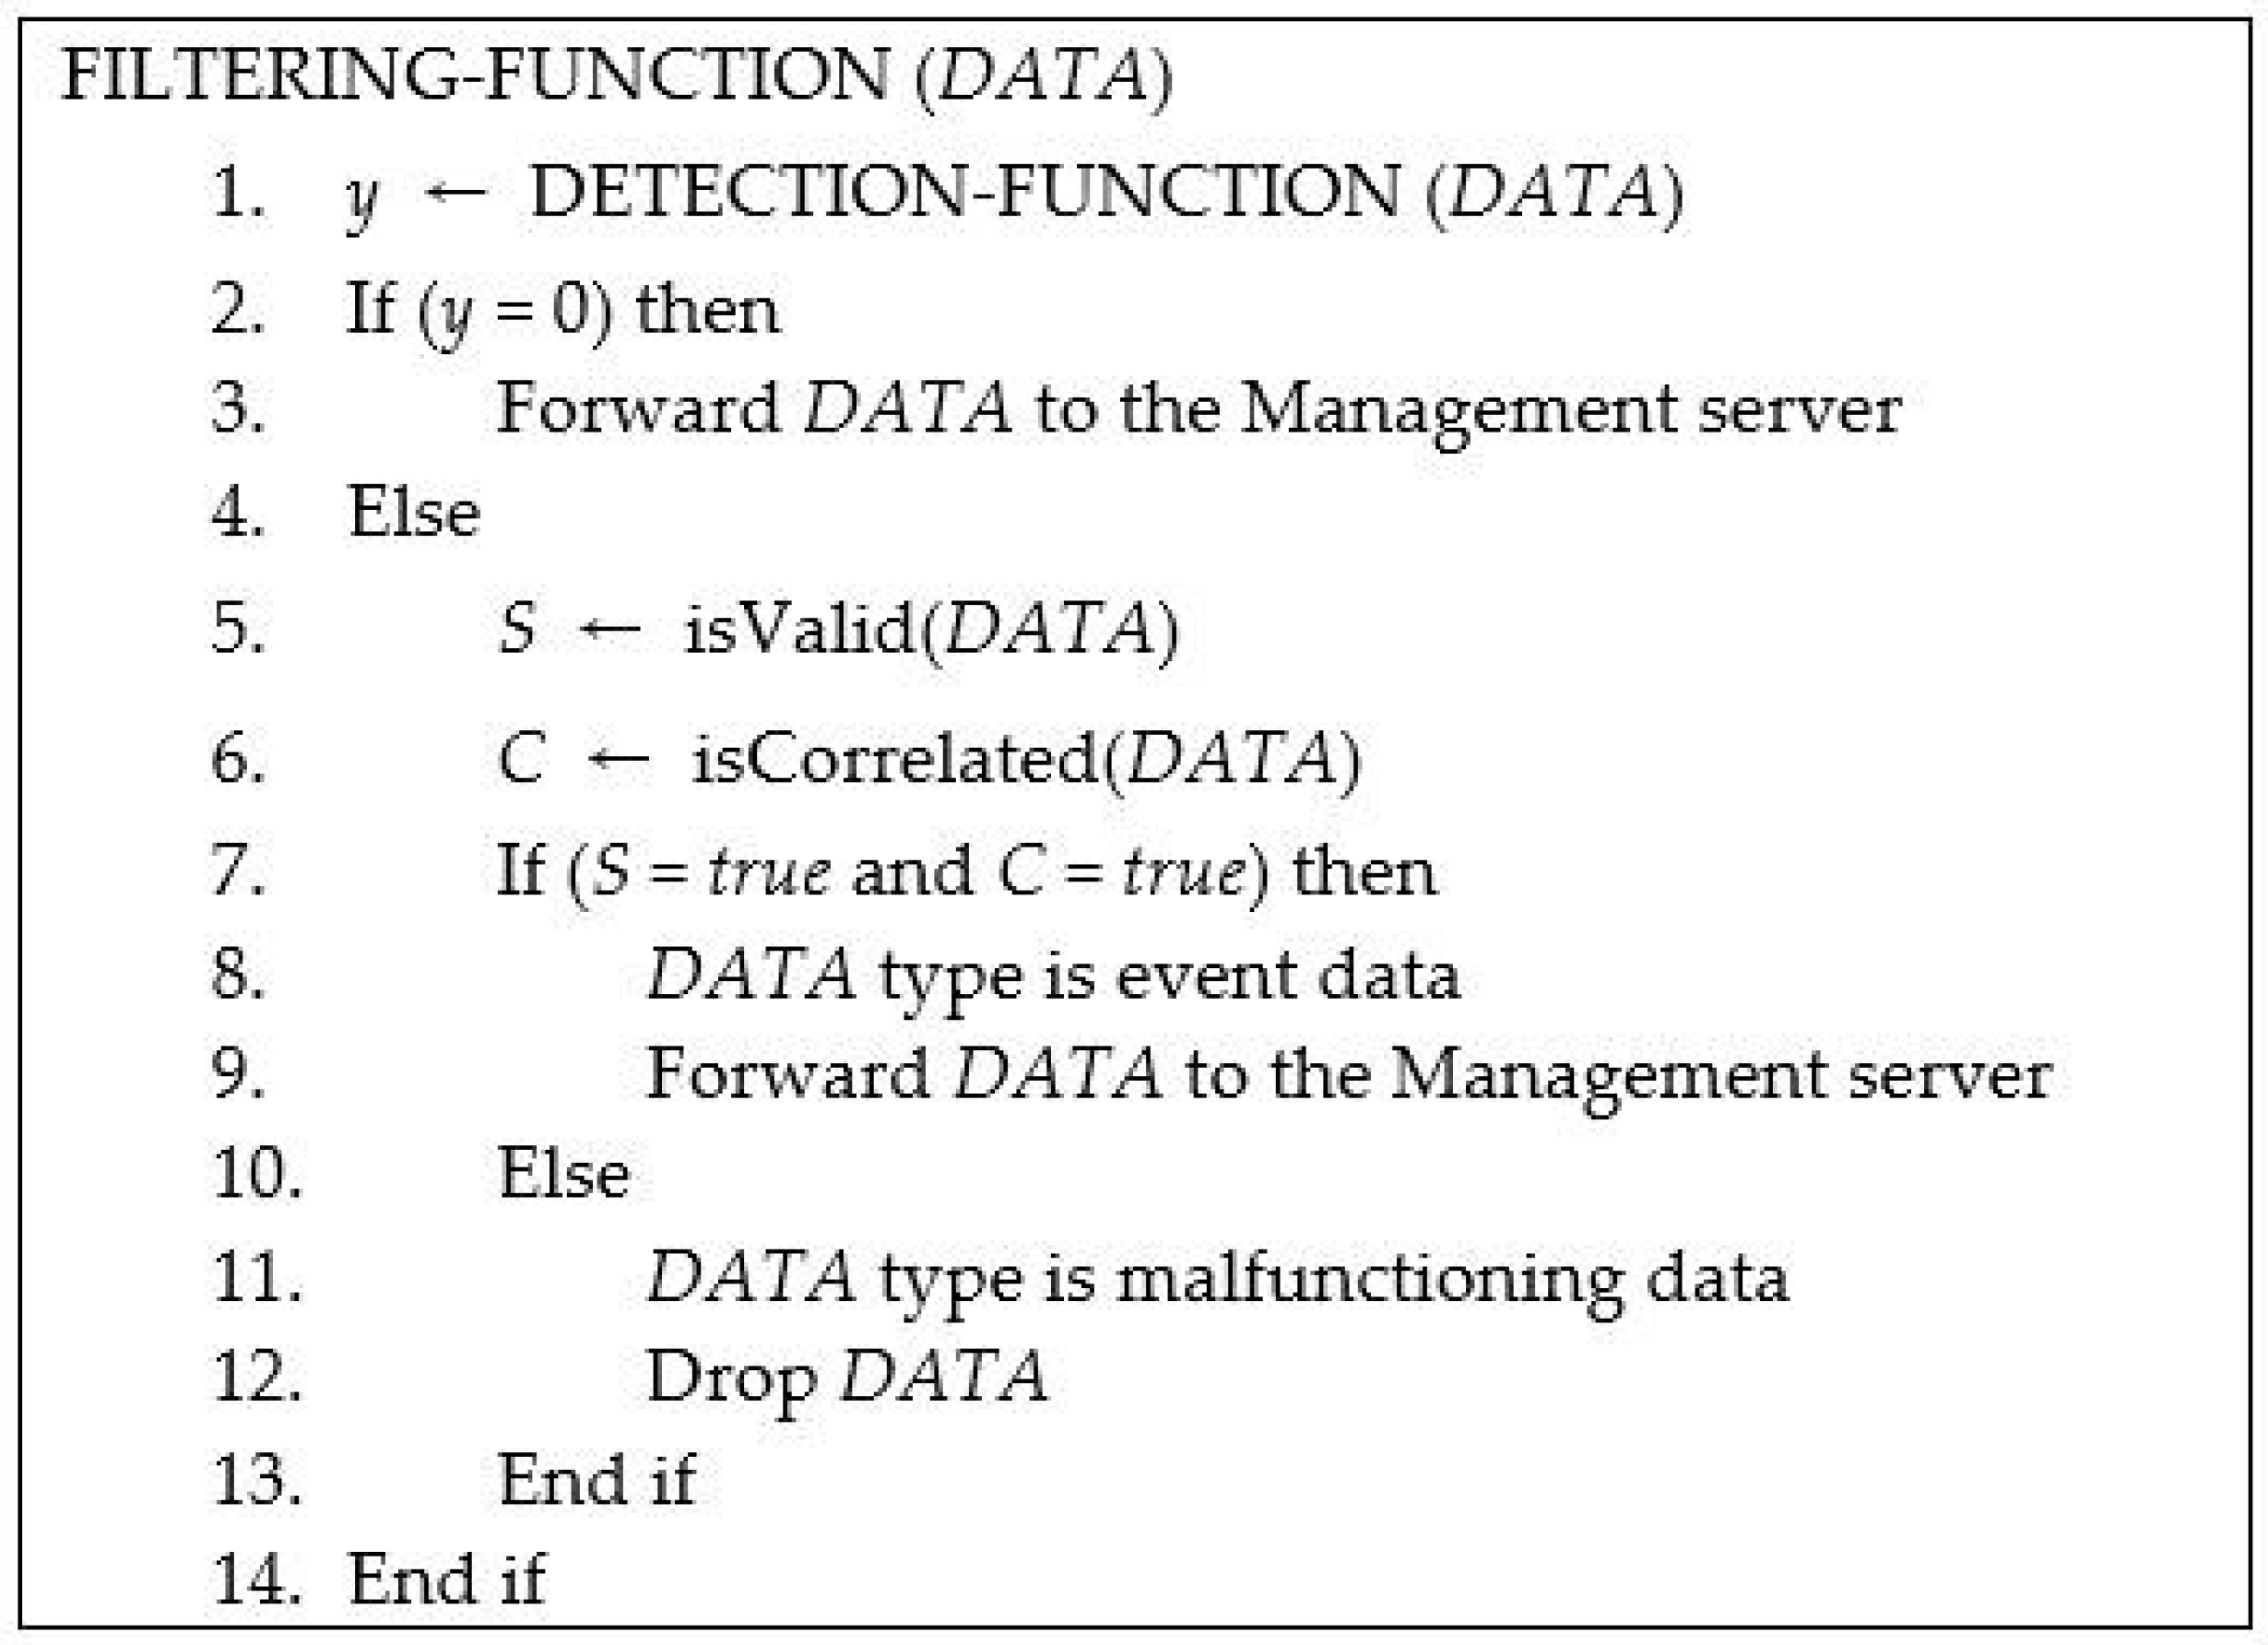
3.2. Data-Filtering System

The proposed data-filtering system has the role to block the suspicious data and the malfunctioning data. Thus, it leads to reducing the computing loads of the management server for data analysis. The reduced computing loads by filtering the suspicious data and the malfunctioning data can lead to low-power computing of servers in the cloud, as well as obtaining reliable results of the data analysis. Figure 3 shows the system architecture of the proposed data-filtering system. In the figure, the data-filtering system consists of data queue, data handler, detection function, training data, and filtering function. It depends on two major functions: the detection function and the filtering function. The analysis results of the detection function are exploited in the filtering function for decision making.
In the system, incoming data enters the data queue, which is a first-in first-out (FIFO) queue. The data handler takes the data in order from the data queue. There exists heterogeneous IoT devices in the IoT access networks, and the devices generate different types of data. Thus, the data handler is needed in front of the detection function. It converts the data to proper data format for learning of the detection function. Then, the detection function predicts the data characteristics through the naïve Bayesian classifier using stored training examples. If the data is normal data in the prediction, the data is forwarded to the management server. If the data is not normal data in the prediction, the filtering function determines whether the data is event data or not. Thus, if it is determined to be event data, the data is also forwarded to the management server by the filtering function. After the prediction at the detection function, the data is stored as a training example for the next learning.
Figure 4 represents the pseudo-code of the filtering function. After the data is classified as suspicious data by the detection function (in line 1), the filtering function should classify it again in order to distinguish the event data and the malfunctioning data (in lines 4–14). The malfunctioning data has error values, but the event data has valid values. In addition, because the event data is the important information in IoT services, it should be delivered to the management server. To classify the event data, the filtering system uses the characteristics of the event generation.
  • If incoming data is the event data, the value of the data is placed in range of sensing levels of IoT devices.
  • Several IoT devices sense the same event. That is, when an event occurs in the environment with many IoT devices, several devices transmit similar data. Thus, correlated data is entered to the data-filtering system.
Thus, the filtering function performs valid checking about sensing ranges of devices for the suspicious data. The valid checking for the current DATA is operated in the isValid() (in line 5). And then, the filtering function examines correlation among similar data in isCorrelated() (in line 6). If the value of the incoming data is placed in valid ranges and there exist several correlated data that enter the system, the incoming data is considered as event data (in line 7). To examine correlation among similar data, k-nearest neighbors (k-NN) algorithm [25,26] can be exploited. Because the algorithm is used to calculate Euclidian distance of data attributes, the correlation checking in the filtering function is performed through the calculated Euclidian distance by the algorithm. If the suspicious data is not considered as event data, it means it is malfunctioning data and it will be blocked.
The proposed data-filtering system—which is composed of two blocks (i.e., core block and decision block) as shown in Figure 3—monitors incoming data, classifies incoming data, and filters the malfunctioning data. It delivers reliable normal data for data analysis and reduces computing loads in the management server.

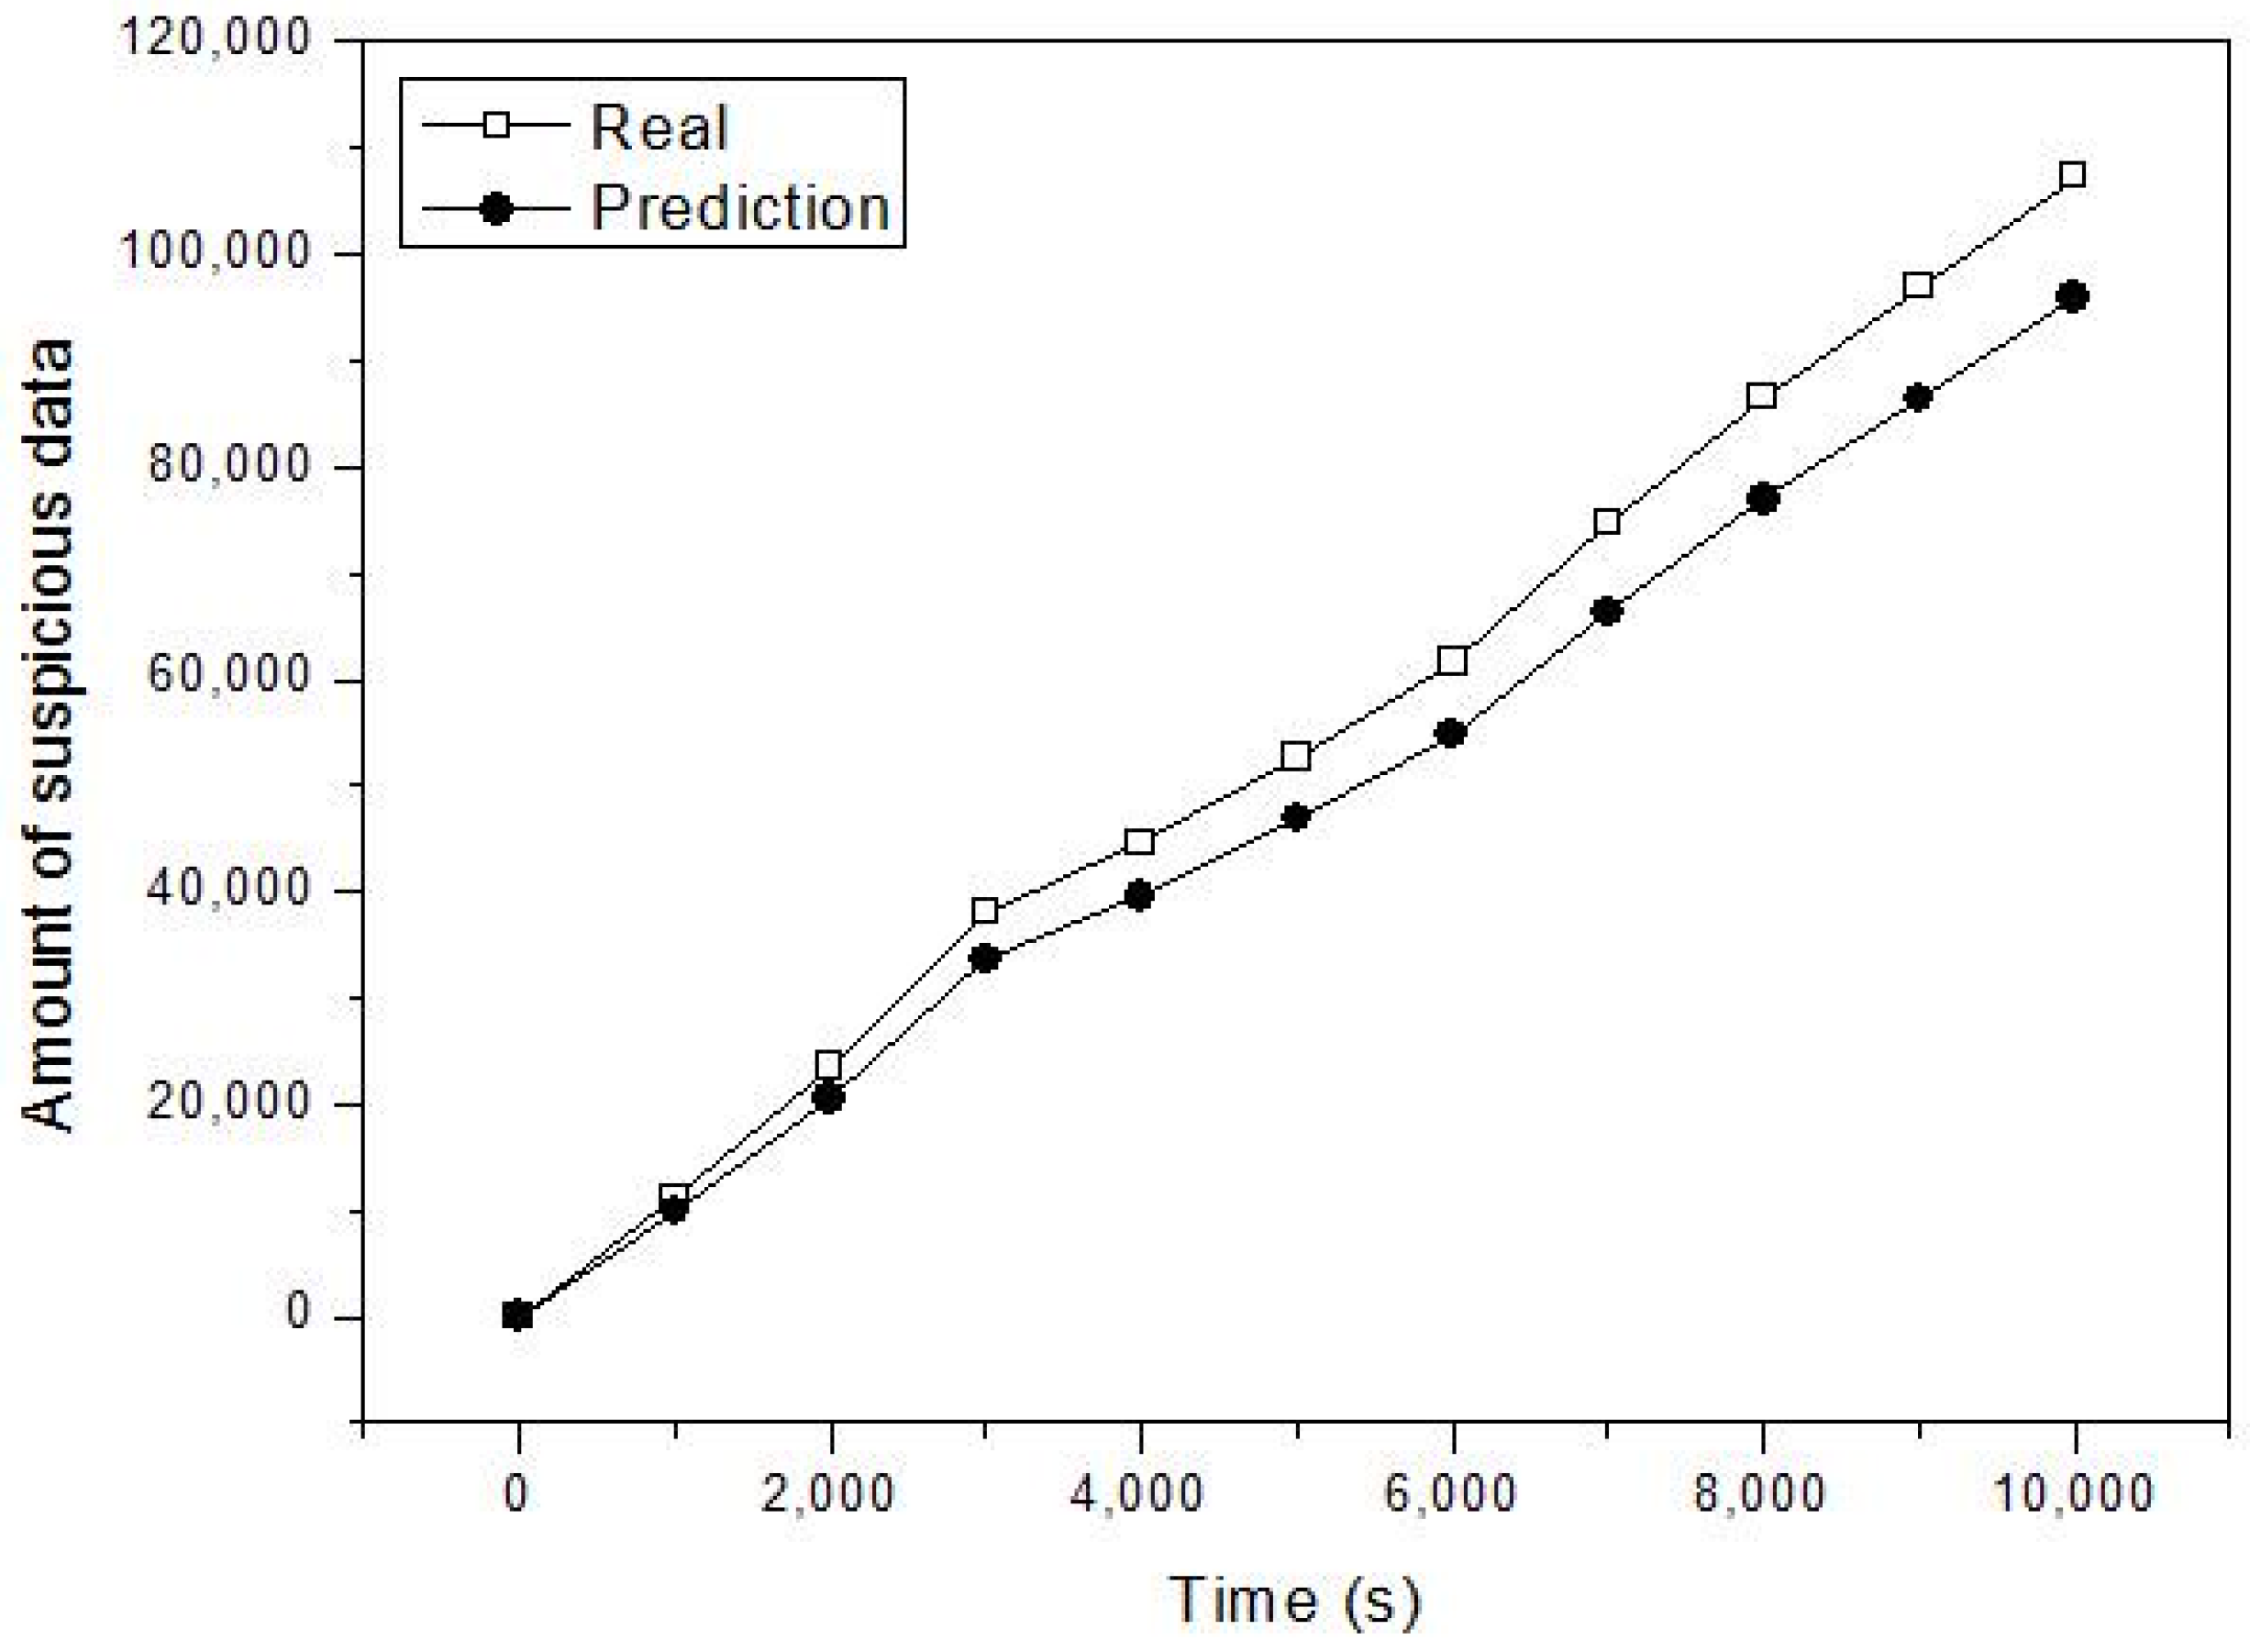
4. Performance Evaluation

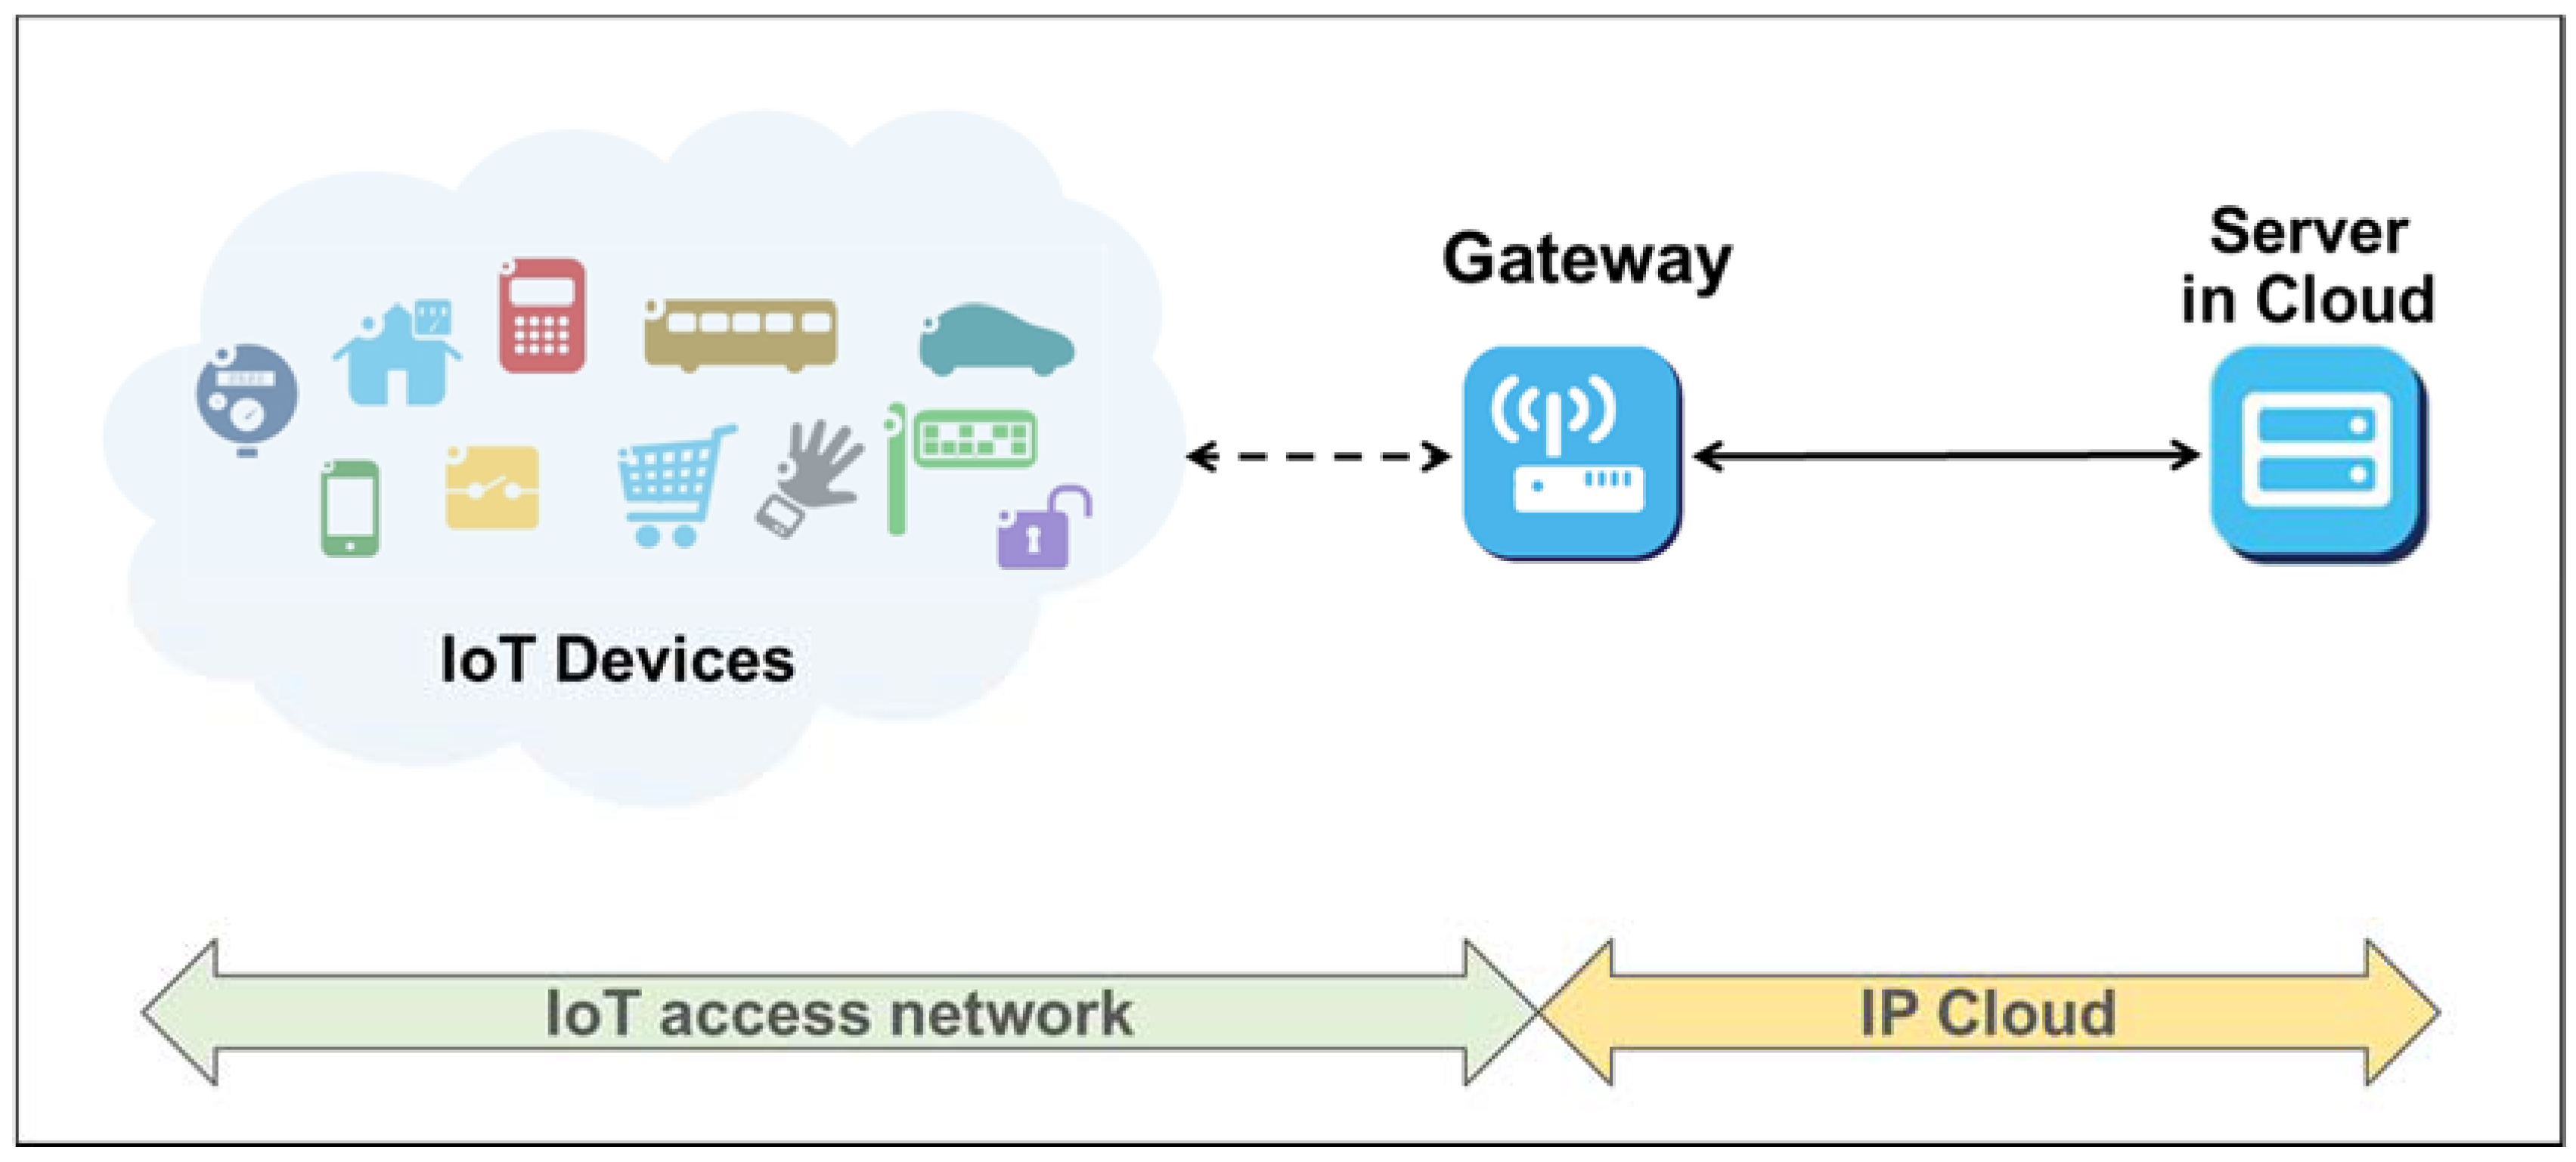
4.1. Simulation Model

For performance evaluations, the data-filtering system and the management server in the cloud are modeled by MM1 queueing systems, as shown in Figure 5. The IoT network is constructed as shown in Figure 2, and data traffic generated in the network is delivered to the simulation model of Figure 5. Three kinds of traffic enter the data-filtering system. Those are normal data, event data, and malfunctioning data. They are entered into the data-filtering system with incoming rates λ1, λ2, and λ3, respectively. In the data-filtering system, the detection function predicts the characteristics of the incoming data packets using the naïve Bayesian classifier, as mentioned in Section 3.1. The learning result (y) of the detection function is used to filter the incoming traffic in the filtering function. The filtering system passes normal data and event data. It blocks malfunctioning data. Then, the normal data and the event data are forwarded to the management server with the incoming rate λ. They are processed in the management server with service rate μ. That is, the management server deals with the filtered data traffic by the filtering function, and the filtering function exploits the learning result of the detection function. To evaluate the compared system (i.e., without the proposed data-filtering system), the incoming data traffic is not processed in either the detection function or the filtering function, and it is passed. Thus, total incoming data enters the management server.
In the management server, the computing load can be described using the queueing theory [27,28]. When the incoming rate to the server is λ and the service rate of the server is μ, the number of data packets in the server (N) is represented by the ratio of λ to μ as:
E [ N ] = ρ 1 ρ , where   ρ = λ μ .
In addition, the number of data packets waiting in the server (Q) is represented as:
E [ Q ] = ρ 2 1 ρ .
Then, the average number of data packets to process in the server is represented as:
E [ N ] E [ Q ] = ρ .
Therefore, λ/μ can be described as the computing load in the server.

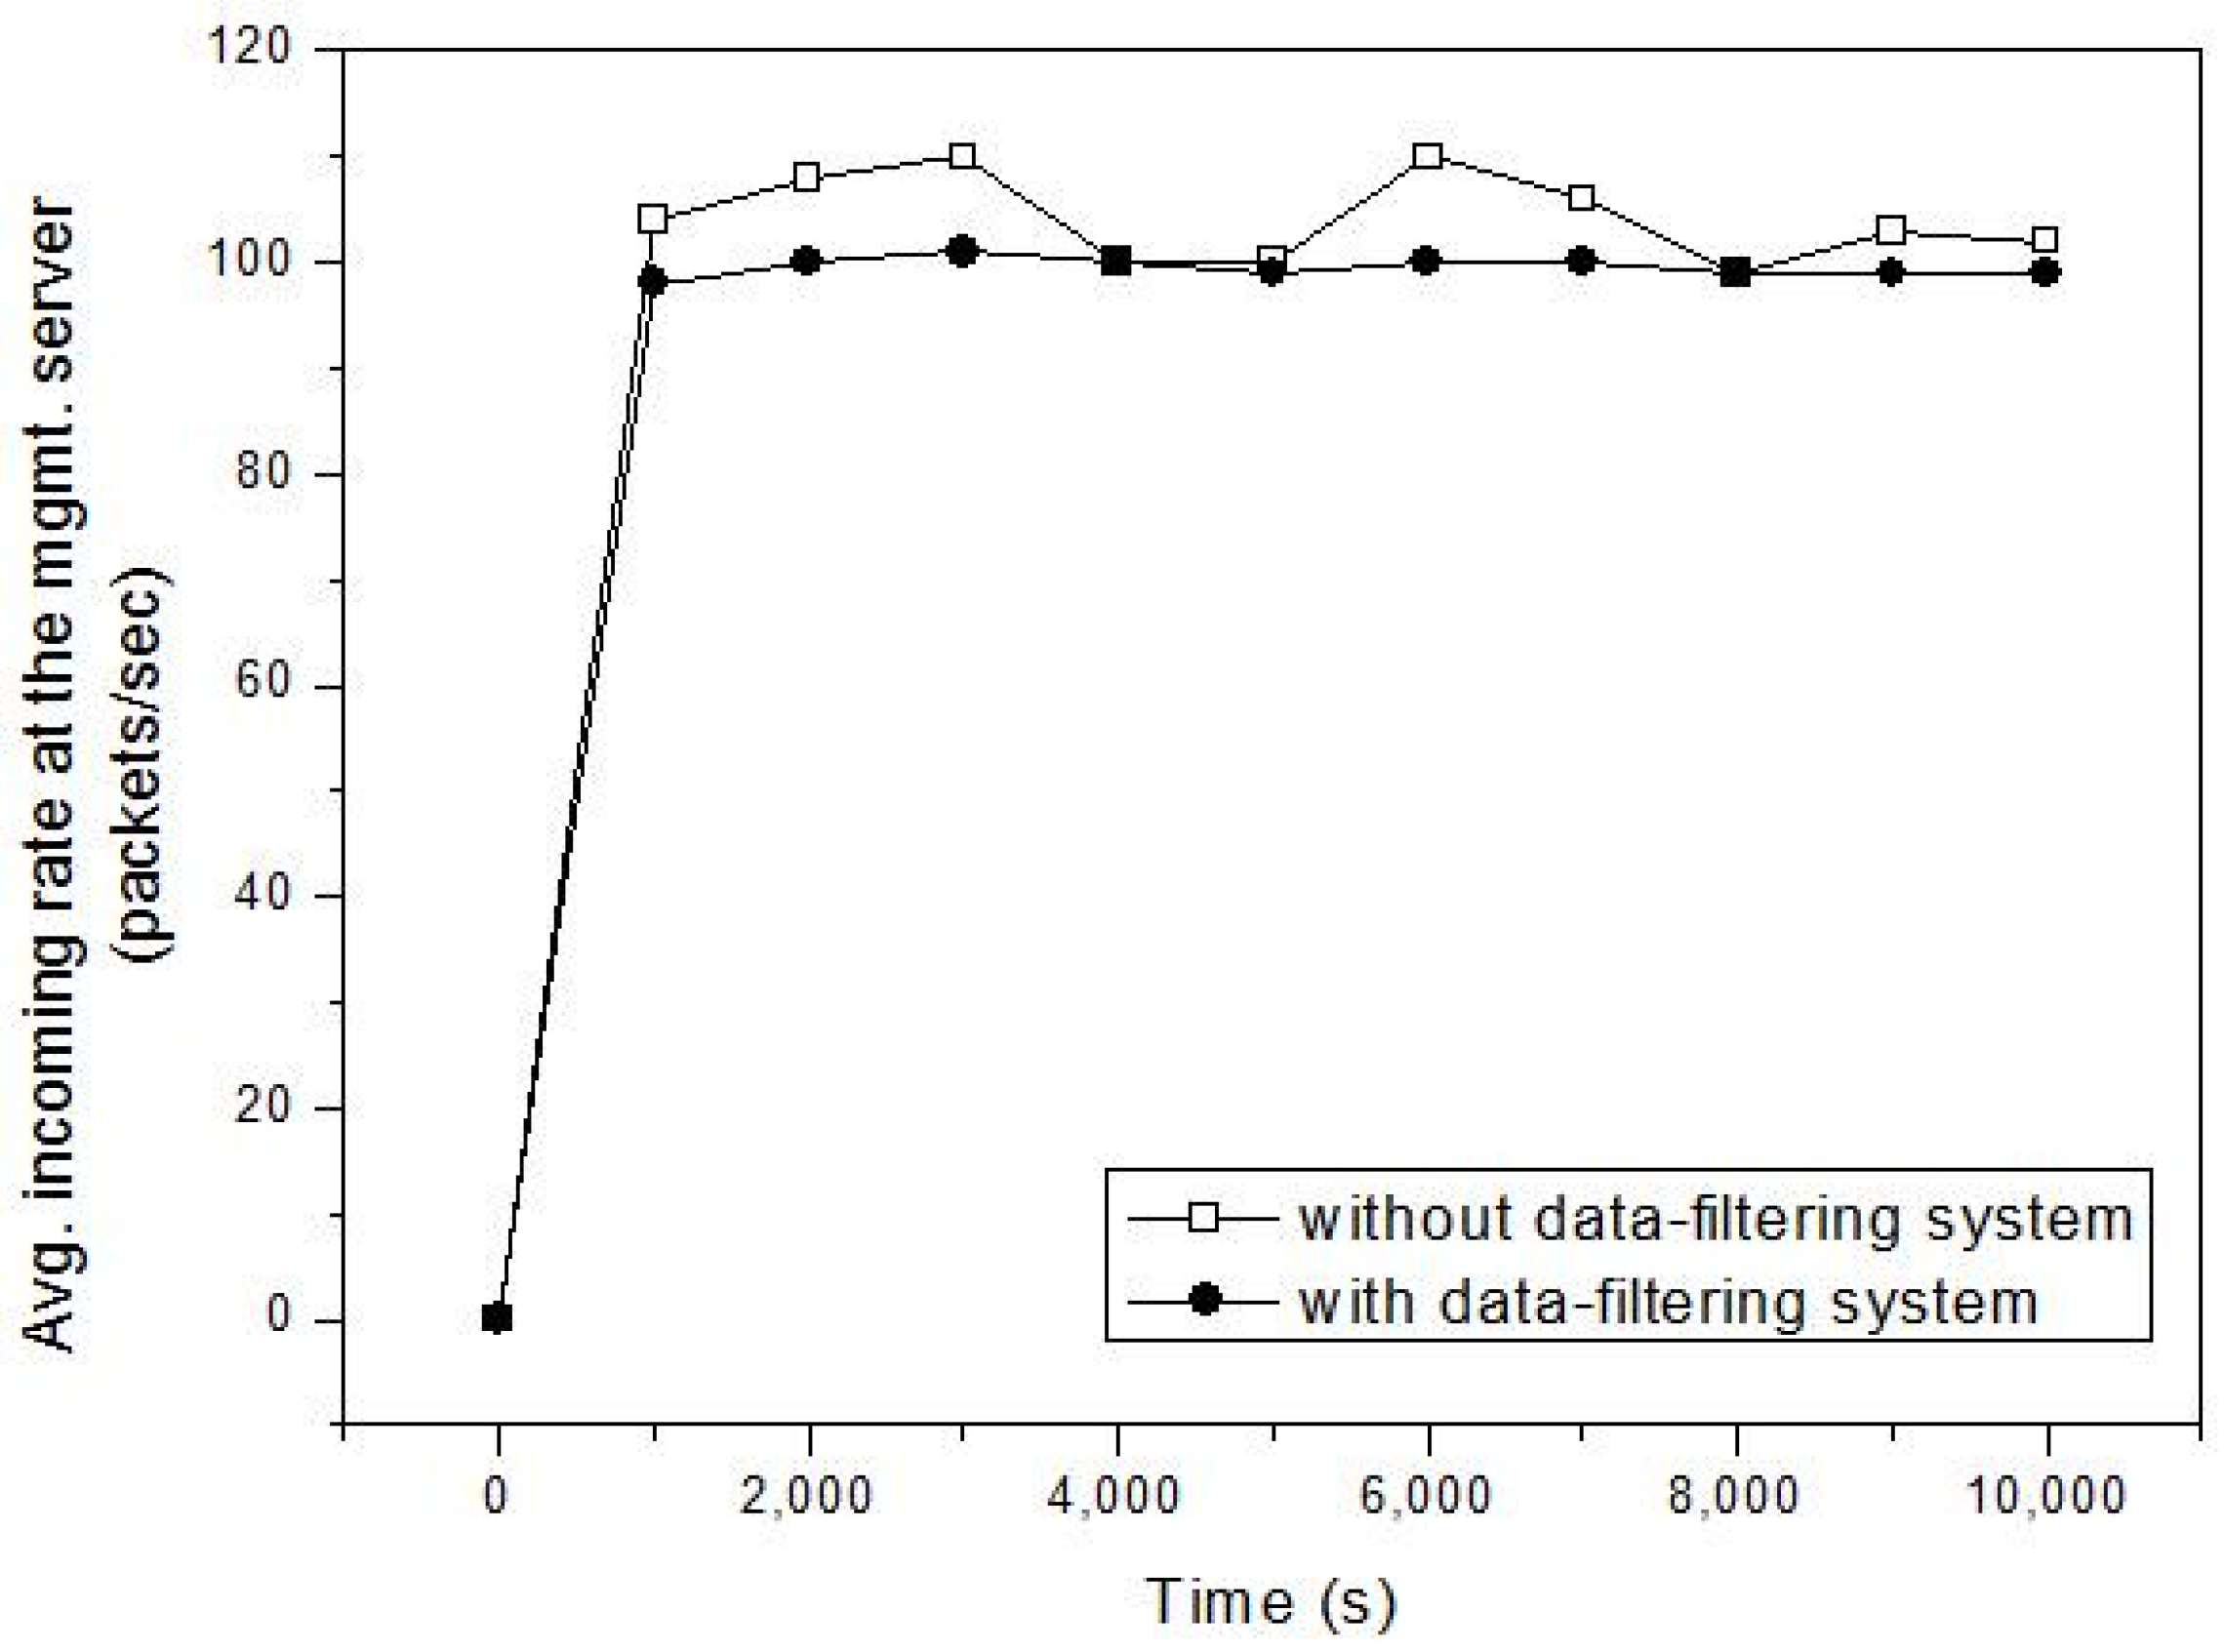
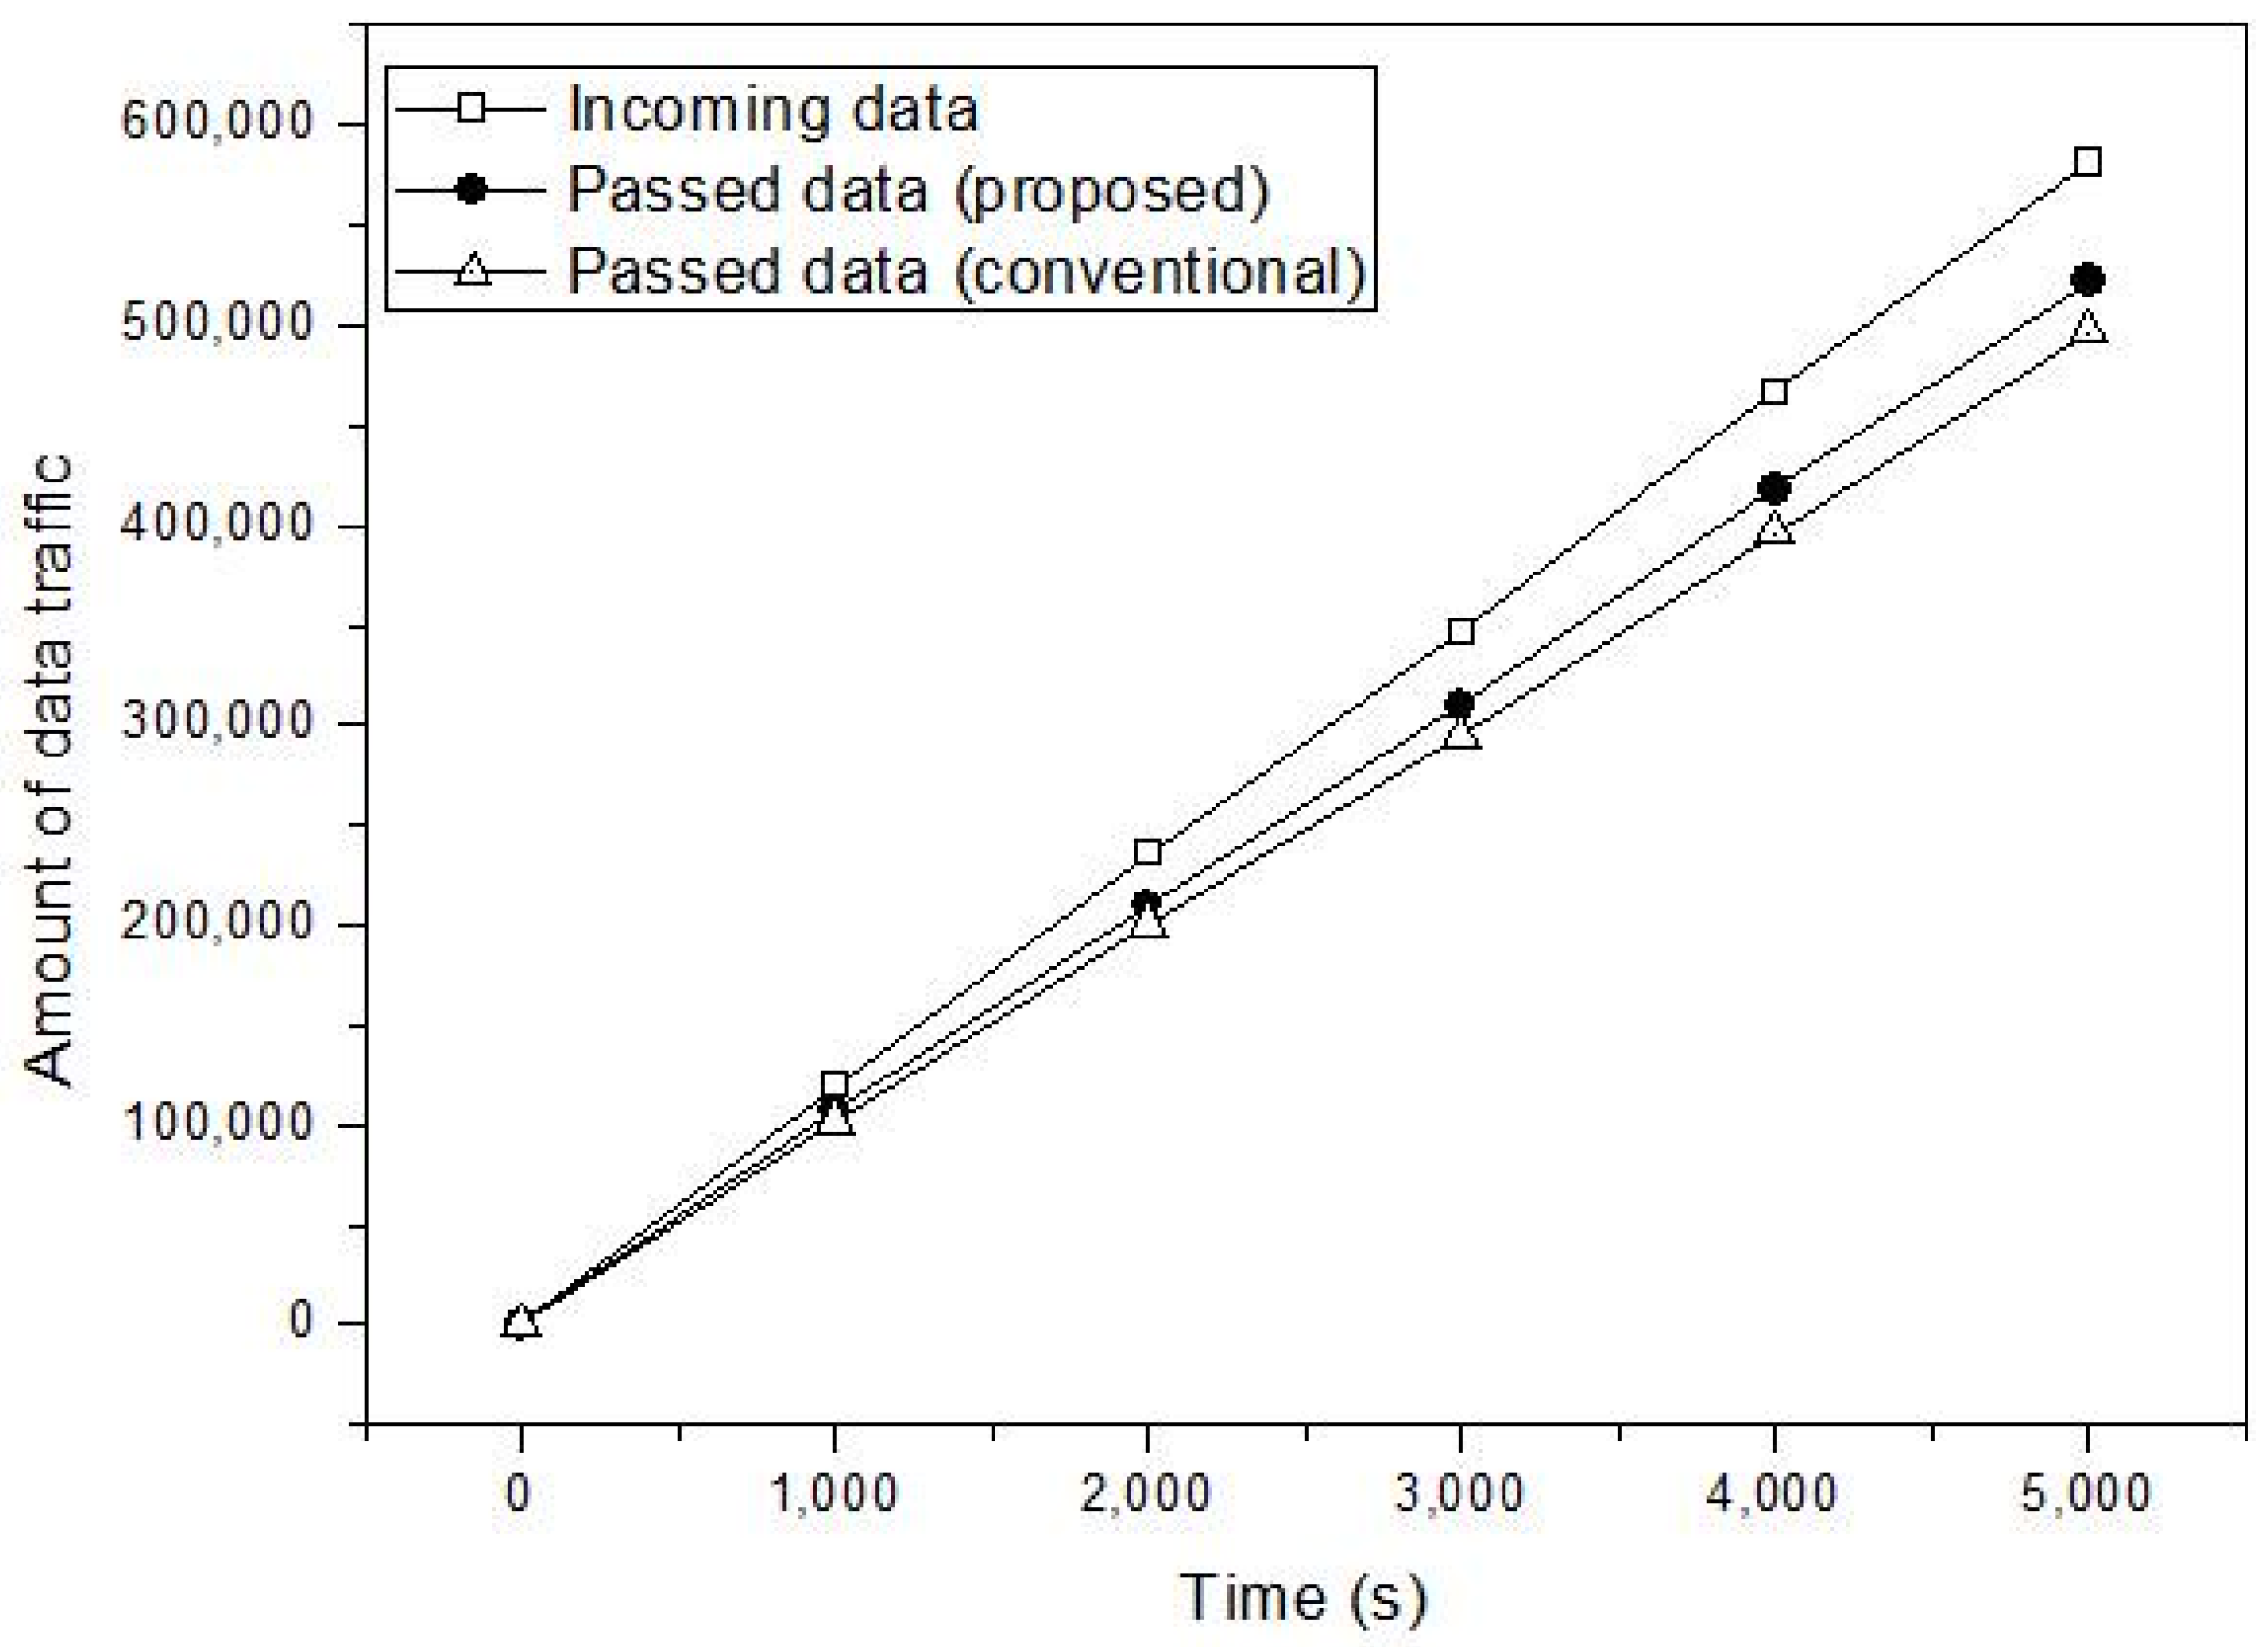
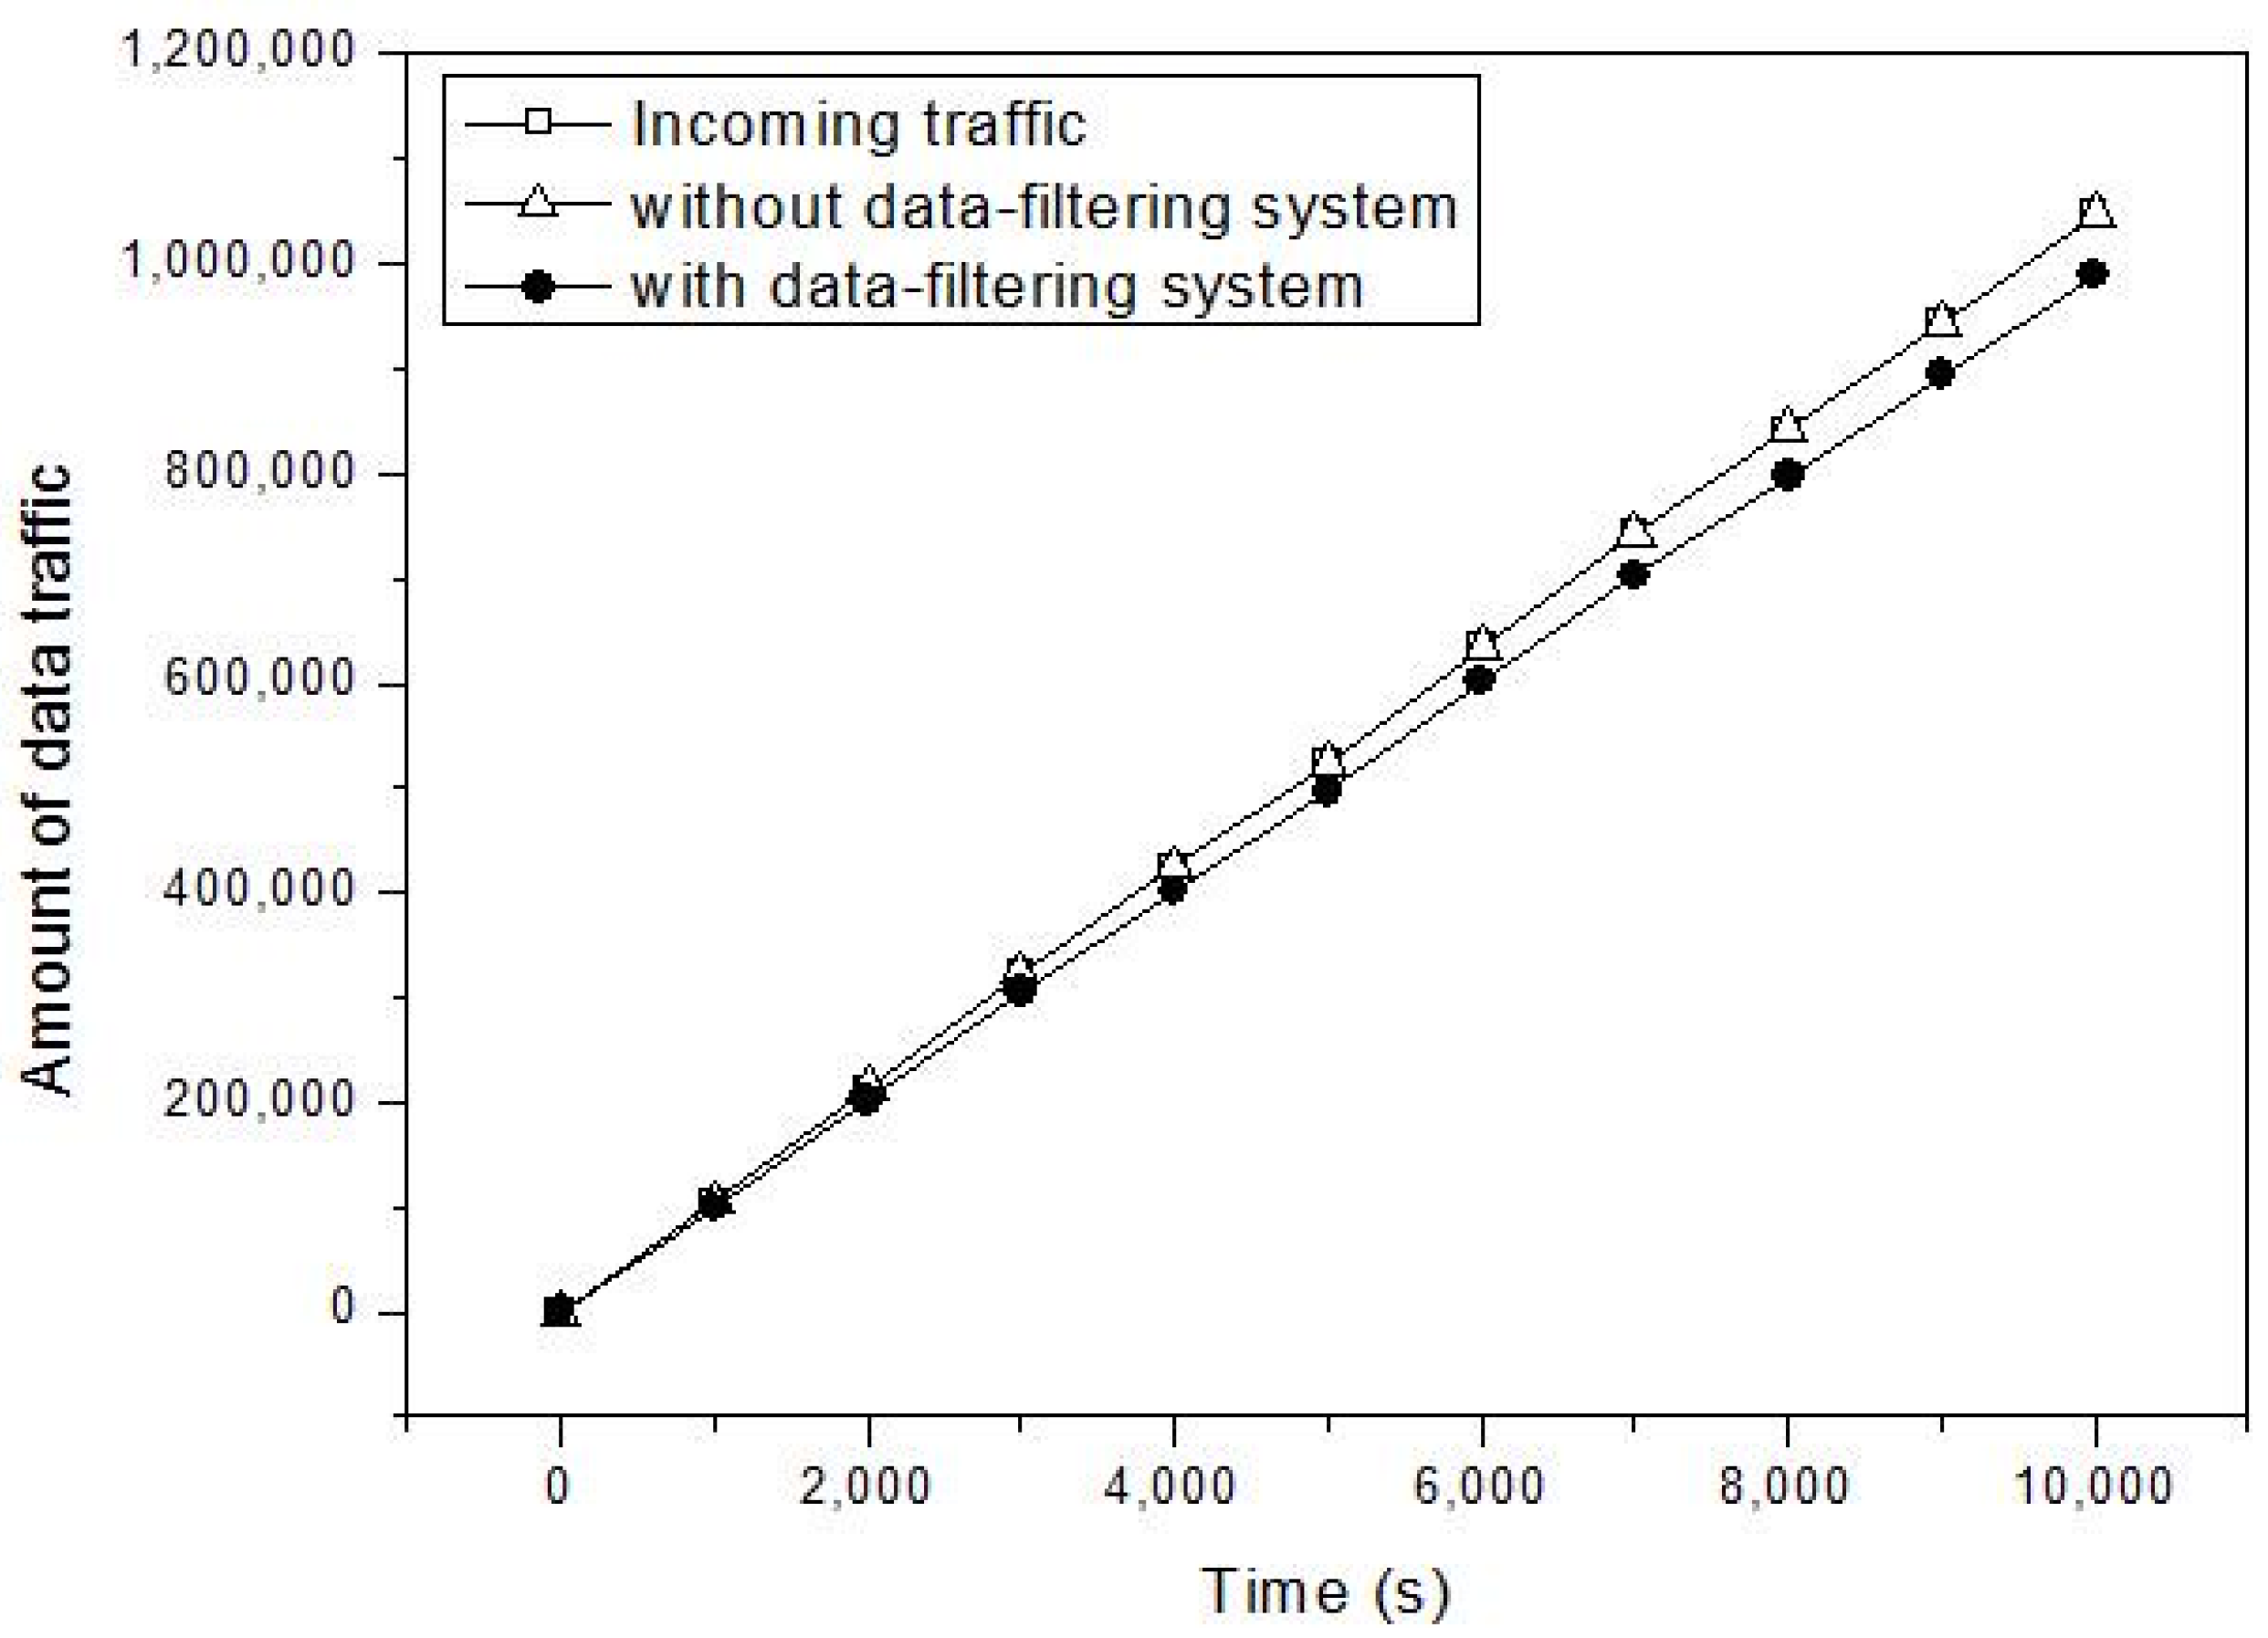
4.2. Simulation Study

For the computer simulation, the simulator is implemented with simple parallel language (SMPL), which is the C-language-based event-driven simulation library [29]. It consists of the data-filtering system part and the management server part and is operated according to the simulation model in Section 4.1. Total simulation time is set to 10,000 s. Data traffic is composed of normal data, event data, and malfunctioning data. Each set of data traffic enters the data-filtering system by the exponential distribution with means λ1, λ2, and λ3. The incoming rate of each data traffic (λi) is set to 100, 10, and 10. The valid range of the data traffic is from 0 to 100. The normal data traffic usually has the randomly selected value between 40 and 80. The event data traffic has the randomly selected value between 0 and 50. The malfunctioning data has the randomly selected value between 90 and 300. The value of data traffic becomes the first attribute x1 for learning. The second attribute x2 for learning is the generated frequency of incoming data. The generated frequency is assumed to be the interval between the current incoming data and the previous incoming data of the same type. For the learning to enable prediction of suspicious data, the detection function uses 1000 recent training examples to avoid storage problem of incoming data traffic. In addition, it is assumed that the service rate of the management server is maintained as a constant value.
Figure 6 represents the compared graph of the amount of real suspicious data and the amount of predicated suspicious data in the data-filtering system. When the simulation time is 5000 s, the amount of suspicious data is 52,684 and 46,887, respectively. When the simulation is ended, the amount of suspicious data is 107,400 and 95,925, respectively. The detection function shows about 90% prediction accuracy. If the detection function exploits more training examples than the recent 1000, the prediction accuracy can be further increased. By the results of the prediction in the detection function, the incoming data is distinguished into normal data and suspicious data. The suspicious data is determined to be malfunctioning data by the operation of the filtering function.
Figure 7 represents the amount of incoming data traffic at the management server. Whole data traffic in IoT networking incomes to the management server to process for intelligent services. For the efficiency of the management server, as mentioned earlier, unnecessary data in the data analysis for the intelligent services should be avoided in the management server. When the proposed data-filtering system is used, the unnecessary data is filtered as shown in the figure. In 5000 s, the incoming data to the server side is 524,693. When the server side employs the data-filtering system, the incoming data to the management server (i.e., the passed data in the data-filtering system) is 497,167. In 10,000 s, the data is 1,046,705 and 990,432, respectively. That is, the computing load in the management server can be reduced by filtering the suspicious malfunctioning data. The management server can avoid total data distortion by using meaningful data. As shown in the figure, the amount of incoming data traffic at the management server means computing load of the management server. In Section 4.1, although the computing load is defined as the ratio of the incoming data rate to the service rate of the server, the incoming data becomes the computing load when the service rate of the server is constant.
Figure 8 shows the average incoming rate of data in the management server. The incoming rate of the figure represents the average of the incoming data per second. As shown in the figure, because the data-filtering system reduces the incoming data rate in the management server, the average incoming rate is maintained with lower values. In addition, because the unusual malfunctioning data is blocked, the average incoming rate maintains similar values during the simulation time. As mentioned earlier, because the proposed system provides reliable prediction results, it can be expected that the system passes meaningful data (such as the normal data and the event data) and it blocks suspicious data (such as the malfunctioning data).
Figure 9 represents a comparison of the proposed system and the conventional method [23], which is introduced in Section 2. As mentioned earlier, because of the characteristics and the limitation of the memory-based filtering, it is difficult to directly apply for comparison. In addition, by [21,22], the model-based filtering has better performance than the memory-based filtering. Among the model-based filtering methods, [23] is the representative method. Thus, the proposed system is compared to [23] as the conventional method. For the comparison, simulation is reperformed with 5000 s simulation time. The conventional method classifies whether the data is normal or not. As mentioned earlier, the proposed method can distinguish the normal data and the event data from the suspicious data. Thus, as shown in Figure 9, the proposed system has more passed data from the filtering function.
By the simulation results, the proposed data-filtering system is necessary in IoT networking. In the simulation, several sets of data traffic are exploited, but there exists a great deal of traffic in IoT areas. The data traffic should be transmitted to the server side for processing, analyzing, and so forth. The data also include malfunctioning data because of resource constraints of IoT devices. For efficiency of server computing, it is required that the server processes reliable data, omitting the malfunctioning data, and tries to reduce computing load in the data processing.

5. Conclusions

The recent computing paradigm has become the IoT, where numerous objects are connected to a network. A lot of data is generated by the objects. The data is delivered to a management server in cloud. Then, the management server computes whole data and finds meaningful knowledge. Intelligent services of IoT depend on the knowledge of the management server. As mentioned earlier, various types of data of the IoT network are transmitted to the management server. However, the objects in the IoT network are tiny devices and have insufficient computing resources. They can easily generate malfunctioning data by their abnormal behaviors, and the malfunctioning data increases computing load in the management server. It is different from periodic normal data of the objects. To reduce computing load and to deliver reliable data to the server, there is a need to filter the malfunctioning data before it enters the server. Thus, this paper proposes the data-filtering system, which is placed in front of the management server.
The proposed data-filtering system classifies suspicious data by learning using the naïve Bayesian classifier. It predicts the status of incoming data in the detection function. If the incoming data is considered suspicious data, it does not forward this data to the management server from the filtering function to achieve the goal of the proposed system. However, in the filtering function, the suspicious data is checked again to distinguish malfunctioning data and event data. The event data also has different characteristics from the periodic normal data. Although it is firstly considered as suspicious data, it must be forwarded to the management server because it includes meaningful data. Thus, the proposed data-filtering system performs data checking one more time. Then, the management system can avoid malfunctioning data, and this can lead to decreased computing load and reduced energy consumption for computing in the server.

Acknowledgments

This research was supported by Basic Science Research Program through the National Research Foundation of Korea (NRF) funded by the Ministry of Education (2016R1D1A1B03931406), and this work was supported by the Soonchunhyang University Research Fund.

Author Contributions

D.-Y. Kim, Y.-S. Jeong and S. Kim conceived and designed the experiments; D.-Y. Kim performed the experiments; D.-Y. Kim analyzed the data; S. Kim contributed reagents/materials/analysis tools; D.-Y. Kim and S. Kim wrote the paper.

Conflicts of Interest

The authors declare no conflict of interest.

References

  1. Gubbi, J.; Buyya, R.; Marusic, S.; Palaniswami, M. Internet of Things (IoT): A vision, architectural elements, and future directions. Future Gener. Comput. Syst. 2013, 29, 1645–1660. [Google Scholar] [CrossRef]
  2. Atzori, L.; Iera, A.; Morabito, G. The Internet of Things: A survey. Comput. Netw. 2010, 54, 2787–2805. [Google Scholar] [CrossRef]
  3. Sundmaeker, H.; Guillemin, P.; Friess, P.; Woelfflé, S. Vision and Challenges for Realizing the Internet of Things; Publications Office of the European Union: Luxembourg City, Luxembourg, 2010. [Google Scholar]
  4. Wang, Y.; Chen, I.-R.; Wang, D.-C. A survey of mobile cloud computing applications: Perspectives and challenges. Wirel. Pers. Commun. 2015, 80, 1687–1701. [Google Scholar] [CrossRef]
  5. Kim, S.; Na, W. Safe data transmission architecture based on cloud for Internet of Things. Wirel. Pers. Commun. 2016, 86, 287–300. [Google Scholar] [CrossRef]
  6. Kang, Y. New approach to the platform for the application development on the Internet of Things environment. J. Platf. Technol. 2015, 3, 21–27. [Google Scholar]
  7. Lin, C.-Y.; Zeadally, S.; Chen, T.-S.; Chang, C.-Y. Enabling cyber physical systems with wireless sensor networking technologies. Int. J. Distrib. Sens. Netw. 2012, 2012. [Google Scholar] [CrossRef]
  8. Gunes, V.; Peter, S.; Givargis, T.; Vahid, F. A Survey on concepts, applications, and challenges in cyber-physical systems. KSII Trans. Int. Inf. Syst. 2014, 8, 4242–4267. [Google Scholar]
  9. Sato, A.; Huang, R.; Yen, N.Y. Design of fusion technique-based mining engine for smart business. Hum.-Centric Comput. Inf. Sci. 2015, 5. [Google Scholar] [CrossRef]
  10. Chelli, K. Security issues in wireless sensor networks: Attacks and countermeasures. In Proceedings of the World Congress on Engineering (WCE), London, UK, 1–3 July 2015.
  11. Sen, J. A survey on wireless sensor network security. Int. J. Commun. Netw. Inf. Secur. 2009, 1, 55–78. [Google Scholar]
  12. Albers, P.; Camp, O. Security in Ad Hoc networks: A general intrusion detection architecture enhancing trust-based approaches. In Proceedings of the International Workshop on Wireless Information Systems (WIS), Ciudad Real, Spain, 2–3 April 2002.
  13. Karlof, C.; Wagner, D. Secure routing in wireless sensor networks: Attacks and countermeasures. In Proceedings of the IEEE International Workshop on Sensor Network Protocols and Applications (SNPA), Anchorage, AK, USA, 11 May 2003.
  14. Culler, D.; Estrin, D.; Srivastava, M. Guest editors introduction: Overview of sensor networks. IEEE Comput. 2004, 37, 41–49. [Google Scholar] [CrossRef]
  15. Karl, H. Protocols and Architectures for Wireless Sensor Networks; John Wiley & Sons: Chichester, UK, 2005. [Google Scholar]
  16. Kim, D.-Y.; Jin, Z.; Choi, J.; Lee, B.; Cho, J. Transmission power control with the guaranteed communication reliability in WSN. Int. J. Distrib. Sens. Netw. 2015, 2015. [Google Scholar] [CrossRef]
  17. Kim, D.-Y.; Cho, J.; Jeong, B.S. Practical data transmission in cluster-based sensor networks. KSII Trans. Int. Inf. Syst. 2010, 4, 224–242. [Google Scholar] [CrossRef]
  18. Gaur, M.S.; Pant, B. Trusted and secure clustering in mobile pervasive environment. Hum.-Centric Comput. Inf. Sci. 2015, 5. [Google Scholar] [CrossRef]
  19. Pughat, A.; Sharma, V. A review on stochastic approach for dynamic power management in wireless sensor networks. Hum.-Centric Comput. Inf. Sci. 2015, 5. [Google Scholar] [CrossRef]
  20. Wood, A.D.; Stankovic, J.A. Denial of service in sensor networks. IEEE Comput. 2002, 35, 54–62. [Google Scholar] [CrossRef]
  21. Su, X.; Khoshgoftaar, T.M. A survey of collaborative filtering techniques. Adv. Artif. Intell. 2009, 2009. [Google Scholar] [CrossRef]
  22. Lee, J.; Sun, M.; Lebanon, G. A comparative study of collaborative filtering algorithms. 2012; arXiv:1205.3193. [Google Scholar]
  23. Miyahara, K.; Pazzani, M.J. Collaborative filtering with the simple Bayesian classifier. In Proceedings of the Pacific Rim International Conference on Artificial Intelligence, Melbourne, Australia, 28 August–1 September 2000.
  24. Miyahara, K.; Pazzani, M.J. Improvement of collaborative filtering with the simple Bayesian classifier. IPSJ J. 2002, 43, 3429–3437. [Google Scholar]
  25. Marsland, S. Machine Learning an Algorithmic Perspective; Chapman & Hall: New York, NY, USA, 2009. [Google Scholar]
  26. Harrington, P. Machine Learning in Action; Manning publications: Shelter Island, NY, USA, 2012. [Google Scholar]
  27. Trivedi, K.S. Probability and Statistics with Reliability, Queuing and Computer Science Applications; John Wiley & Sons: New York, NY, USA, 2002. [Google Scholar]
  28. Ross, S.M. Probability Models for Computer Science; Harcourt/Academic Press: Burlington, VT, USA, 2002. [Google Scholar]
  29. MacDougall, M.H. Simulating Computer Simulations, Techniques and Tool; MIT Press: Cambridge, MA, USA, 1987. [Google Scholar]
Figure 1. A general architecture of Internet of Things (IoT) services.
Symmetry 09 00016 g001
Figure 2. Network architecture for the proposed system.
Symmetry 09 00016 g002
Figure 3. System architecture of the data-filtering system.
Symmetry 09 00016 g003
Figure 4. The pseudo-code for the filtering function.
Symmetry 09 00016 g004
Figure 5. Simulation model for performance evaluation.
Symmetry 09 00016 g005
Figure 6. Prediction of the suspicious data in the data filtering system.
Symmetry 09 00016 g006
Figure 7. Amount of data traffic to enter the management server.
Symmetry 09 00016 g007
Figure 8. Average incoming rate in the management server.
Symmetry 09 00016 g008
Figure 9. Comparison of the proposed system and the conventional method.
Symmetry 09 00016 g009

