Intelligent Aggregation Based on Content Routing Scheme for Cloud Computing


1
School of Information Science and Engineering, Central South University, Changsha 410083, China
2
Department of Computer Science, Stony Brook University, Stony Brook, NY 11794, USA
3
Department of School of Computer Science and Technology, Huaqiao University, Quanzhou 362000, China
4
School of Information Technology in Education, South China Normal University, Guangzhou 510631, China
*
Author to whom correspondence should be addressed.
Symmetry 2017, 9(10), 221; https://doi.org/10.3390/sym9100221
Submission received: 8 September 2017
/
Revised: 28 September 2017
/
Accepted: 6 October 2017
/
Published: 11 October 2017
Abstract
:Cloud computing has emerged as today’s most exciting computing paradigm for providing services using a shared framework, which opens a new door for solving the problems of the explosive growth of digital resource demands and their corresponding convenience. With the exponential growth of the number of data types and data size in so-called big data work, the backbone network is under great pressure due to its transmission capacity, which is lower than the growth of the data size and would seriously hinder the development of the network without an effective approach to solve this problem. In this paper, an Intelligent Aggregation based on a Content Routing (IACR) scheme for cloud computing, which could reduce the amount of data in the network effectively and play a basic supporting role in the development of cloud computing, is first put forward. All in all, the main innovations in this paper are: (1) A framework for intelligent aggregation based on content routing is proposed, which can support aggregation based content routing; (2) The proposed IACR scheme could effectively route the high aggregation ratio data to the data center through the same routing path so as to effectively reduce the amount of data that the network transmits. The theoretical analyses experiments and results show that, compared with the previous original routing scheme, the IACR scheme can balance the load of the whole network, reduce the amount of data transmitted in the network by 41.8%, and reduce the transmission time by 31.6% in the same network with a more balanced network load.
1. Introduction
Cloud computing has emerged as today’s most exciting computing paradigm for providing services using a shared framework, which opens a new door for solving the problems with the explosive growth of digital resource demand and the corresponding convenience [1,2,3,4,5,6,7,8]. The development of cloud computing benefits from the great enhancement of the ability and scope to collect data [9,10,11]. For example, the Internet of Things (IoT) [12,13,14] leverages the ubiquity of smart sensor-equipped devices such as smartphones, iPads and vehicle sensor devices [15,16,17,18,19], unmanned aerial vehicles [9,10] and so on to collect information at low costs and provides a new paradigm for solving complex data sensing based on applications of the significant demand for critical infrastructures such as industrial systems and massive critical infrastructures [20,21,22,23], remote patient care systems in healthcare [24,25], intelligent traffic management [13], and automated vehicles in transportation, environmental [26,27,28], and weather monitoring systems. A great number of new ways to collect data, such as crowd sensing (or participatory sensing) [29,30,31,32], are applied to collecting data, which leads to great pressure on the network. Firstly, the scale of data produced by the IoT increases exponentially [30,31,33]. It is reported by Cisco Corporation that the data throughput produced by the IoT has already taken up sixty-nine percent of the data throughput produced by the whole network, which is thirty times the data throughput produced in 2000 [34,35]. What is more, the rate of increase is still accelerating. Secondly, the number of devices connected to the network is more tremendous than ever before. There are already nine billion devices connected to the IoT such as smartphones, smart cities, and industrial sensing devices, the number of which has exceeded the number of people since 2011. Additionally, it is forecasted that the number will be 24 billion in 2020 [34,35].
Apparently, the tremendous number of devices and the enormous data traffic growth have brought an unprecedented challenge to the network based on the current data transmission [34,35,36]. However, many investigations are still attracted to the data transmissions industry due to the potential prospects, which also contributes to accelerating the development of this industry and makes it more challenging. Due to the current network, which adopts the Store-and-Forwarding routing approach, the scale of the numbers would neither increase nor decrease the transmission. Compared to the increasing rate of the network load, the transmission capacity of the physical line of the network is growing much more slowly, which leads to the contradiction between the increase in network data traffic and the limited transmission capacity of the physical line. This phenomenon can be analogous to the difference between the fast growth rate of urban vehicles and the slow growth rate of road capacity. The increase of data traffic in the network would compress the transmission volume greatly. Without any great progress or innovation in the network technology, we can foresee that the volume will dry out, the delay will intensify, and the Quality of Services (QoS) will become worse quickly, which will cause a decrease in the Quality of Experiments (QoE). As a consequence, the network will face a great challenge in the future [34,35].
In response to the great traffic pressure on the network, a lot of work has already been done by the researchers. Several aspects are included: (1) Increase the physical capacity of the network transmission. This method is the most direct, but it not only requires a huge cost but also has a limited increase in space; (2) Improved network architecture. The increase of data traffic could be achieved by improving the network architecture and handling data locally. For example, the cloud computing architecture could be extended to multi-layer edge and fog computing architecture, which could reduce the data traffic effectively; (3) Apply cache technology to reducing the network transmission traffic. Cache is an effective and the most common method, especially for those content-fixed data having a large amount of transmission such as multimedia. However there are still several disadvantages. This method requires network devices with large amounts of storage, and the type of application matters a lot. The efficiency varies greatly according to different applications and different times. Therefore, cache could not be considered an efficient way to reduce the data traffic; (4) Method of Network Coding. This method is a relatively new technology, and it can effectively reduce the network traffic, but the amount of network traffic that it reduces is limited, so it is inappropriate for large-scale use; (5) Method of Data Aggregation, which was first applied in wireless sensor networks (WSNs). This method is able to reduce the amount of data that needs to be transmitted by 100 times in a data-dependent network, but there are no cases that have applied this method to the backbone network successfully before. There are a few reasons for this: (a) With the development of sensing devices, especially the development of smart phones, the amount of data and the scope of data collection becomes larger. As a consequence, a lot of crowd sensing networks appear to be leading a great change in the components of data traffic and the amount of data. Compared to the previous network, in which there is no strong relationship between data, the relationship between data becomes stronger in the current network. This makes the method of data aggregation more useful now; (b) The previous method of data aggregation was relatively passive, that is, the data aggregation would happen at once when a few data related to each other met in the process of routing. However, if those data with high correlation were sent to the same route path at first, it is believed that the probability and the ratio of aggregation would be enhanced greatly by such an active approach, which can significantly reduce network traffic.
Based on the analysis above, this paper first put forward an Intelligent Aggregation based on a Content Routing (IACR) scheme for cloud computing in response to the development of the current network, which can effectively reduce the number of data in the network and play a fundamental supporting role in the development of cloud computing.
The main innovations of this paper are as follows:
- (1)
- A framework for intelligent aggregation based on content routing is proposed in this paper. In this novel intelligent aggregation based on a routing framework, the data center publishes micro programs to the routers, with the help of which routers can get the similarity between data and then choose the most appropriate routing path for the arrived data. Therefore, a better performance of aggregation would be obtained, and the scale of data throughput would decrease too. Compared to the previous passive aggregation, the approach proposed in this paper could be more effective with an active aggregation approach. Therefore, this proposed approach is considered to be greatly innovative.
- (2)
- A concept named ‘aggregation ID’ (AID) is introduced in this paper to present a set consisting of those data having high correlation with each other. One or more AIDs are used to mark each routing path, which denotes that this routing path is used to carry out the set of data with the same AID. This approach could aggregate those data with high correlation actively and improve the efficiency of aggregation so as to release the network load.
- (3)
- The Intelligent Aggregation based on the Content Routing (IACR) scheme proposed in this paper could gather together those data with similarity that is as high as possible to send the data to the data center along the same routing path. Each router intelligently learns the correlation between data, and the IACR scheme builds and revokes the routing path used to path a set of data dynamically, which could also make the data traffic in the network more balanced on the basis of reducing the data throughput.
- (4)
- Finally, we compare our proposed scheme with existing schemes via extensive simulations. The experimental results show that our intelligent aggregation based on content routing can successfully attain our aim in this work, which is also proved to be more suitable in the real world. Extensive simulation results justify the effectiveness of our scheme well. The load of the router can be reduced by 41.8%, and the total travelling time of data can be reduced by 31.6%.
The rest of this paper is organized as follows. In Section 2, the related works are reviewed. The system model and problem statements are described in Section 3. Section 4 elaborates on the design of the Intelligent Aggregation based on Content Routing (IACR) scheme in cloud computing. The performance analysis and comparisons of the IACR schemes are provided in Section 5. Finally, we conclude in Section 6.
2. Related Work
2.1. Data Based Network Architecture
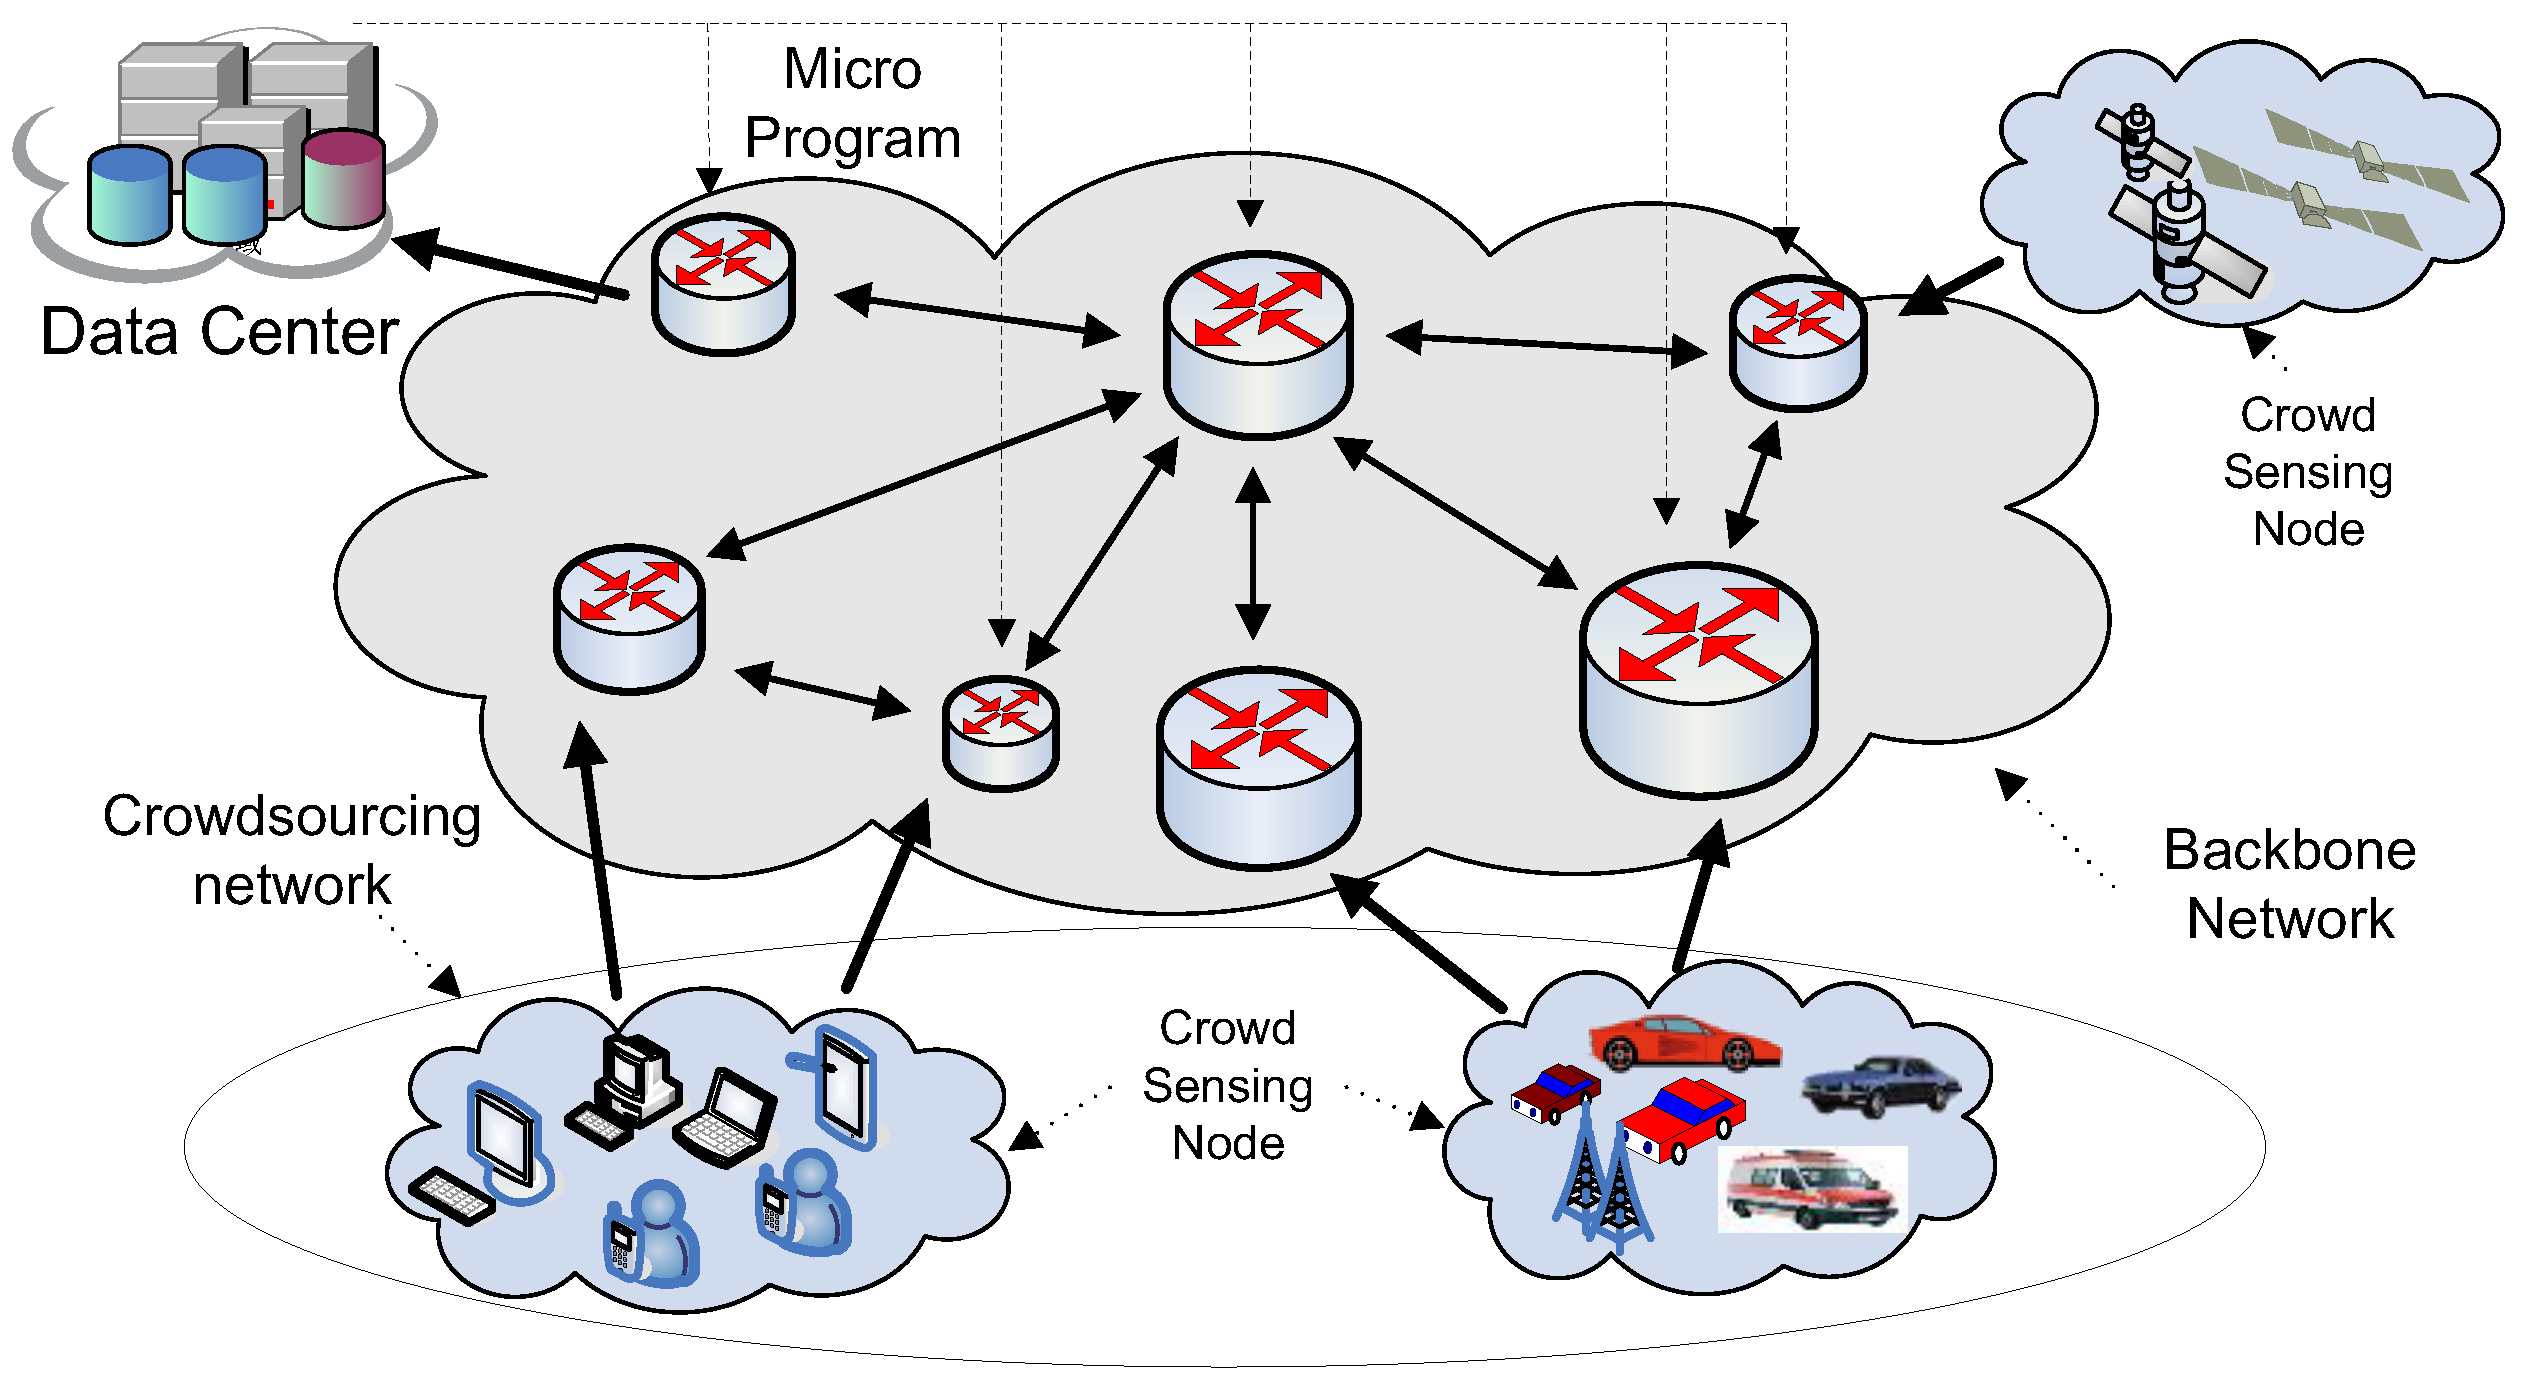
This section is going to introduce the development of current network architecture so as to clarify the pressure faced by the current network. The current network architecture is depicted in Figure 1. The architecture could be divided into five layers as follows: (1) Data collection layer [29]; (2) Fog or edge network layer; (3) Backbone network layer; (4) Data center layer; (5) Application layer.
- (1)
- Data collection layer. It is located at the edge of the whole network and consists of pervasive sensing devices such as smart phones and various industrial sensors [37,38,39]. All of these collecting devices, including people and equipment, could be called big data collectors (BDC) [30], which provide data for Big Data networks. The data collection layer is one of the most important factors in why the current network faces a great challenge. Currently, there are more than nine billion devices were connected to the IoT, and the number of data produced has taken up 69% of the Internet [35]. This great increase makes those applications, which could not be achieved previously, possible. It is forecasted that thousands of new applications will be invented and developed in the future, which will then produce millions of data points. Therefore, this great development will place huge pressure on the current network because of the tremendous data throughput and computing load. However, the capacity of the current network cannot keep up with such rapid development. If we do not explore new technologies and structures, the gap will become larger and larger and will seriously hinder its development.
- (2)
- Fog or edge network layer [34,40]. In terms of physical structure, this layer is similar to the fog computing network, which consists of network devices with different sizes, heterogeneous computing powers, and storage capacities at the edge of the network [34,40]. The presentation of this layer is a change in response to changes in the current network. Due to the enormous growth of IoT devices, the information, content, and form of data have been growing exponentially. Under this circumstance, if we handle these data in a traditional way, all data would be transmitted to the cloud and form application services, and then users will need to send am application to the cloud when they need services. This will create a long journey when we want to transmit some data because it is collected at the edge of the network, far from the data center in the cloud. As a consequence, the pressure on the current backbone will be enormous and lower the QoS (i.e., delay, jitter, throughout, etc.). What makes matters worse is that capacity is growing at a slower rate than data, meaning that cloud-computing architectures are facing lots of difficulties. The fog computing network is an improvement to meet this challenge. The scheme it adopts is to move the network from the center to the edge. Lots of heterogeneous computing and storage devices at the edge are used to localize the data processing and computing. Only when local devices are not equal to processing further will data be passed to the next layer, until it reaches the cloud. It is reported that most of the service applications and data process could be handled locally, so the amount of data sent to the cloud will drop greatly. Then, the backbone network load will be released. But there are too few devices like routers and too few volumes to meet the great demand. Under this circumstance, the fog computing network use some hardware devices to support fog computing, which denotes the thought of marginalizing the network center and devices. However, this idea is hard to achieve because the number of devices is large and the deployment ranges of devices are wide compared with central computing models such as cloud computing, which only need a few devices with strong computing ability in the center. What is more, the efficiency depends on the way that those devices are deployed. If they are deployed inappropriately, it will lead to heavier pressure on the current network.
- (3)
- Backbone network layer. The backbone network layer physically refers to the current backbone network, which utilizes those high-speed devices to provide high-speed data routing.
- (4)
- Data center layer, which could also be called the cloud. It consists of those devices with huge storage capacity and computing power, which are able to analyze and process the collected data in depth and implement a service-oriented network by providing services.
- (5)
- Application layer, which refers to those users who apply for services. If a user requests the service from the network, the fog layer will return the service to the user if the fog layer can meet the demand, otherwise the fog layer will continue to forward the service request to the network center, that is, the cloud. It is worth noting that these five layers may have multiple roles in different situations. For example, at the data collection layer, the handheld smartphone can be used as a data collection device, that is, the big data collector (BDC). It can also play the role of the user, who applies services actively. In addition, there are no clear boundaries between the fog layer and the backbone network layer. A large data center deployed in the edge network layer could also be treated as the data center in the cloud. Therefore, the current network structure is shown in Figure 1.
2.2. Method for Increasing Network Transmission Capacity
When it comes to the way to increase network transmission capacity, deploying dual or multiple network lines is the most direct and common approach. For example, the network transmission speed increases by times by deploying the same lines. However, the cost of this approach is extremely high, and it would be limited by time and space. Another way is to improve the physical transmission speed of the network, but, in theory, due to the limited speed of light, the increase of fiber transmission speed is also limited. Although the pressure on the network could be released by the physical approaches proposed above, the cost of time and space is still too huge to implement this method in a wide range.
2.3. Improve the Network Architecture to Reduce the Amount of Data Required
This improvement has been ongoing since the network was produced. The network architectures experienced are grid computing, cloud computing, fog computation, edge computing, and so on, which are relative to the development level of the network and the practical application demand. However, with the development of the IoT, due to the rapid growth of the number of devices connected to the network and the exponential growth of the range and scale of the data generated, the central network computing model in the backbone network performs poorer and utilizes resources insufficiently. Since a great amount of data produced by millions of devices connected to the edge network would be transmitted to the center of network from the edge, the pressure on the network load increases and the congestion caused by long-distance transmission would also increase the delay and lower the QoS. But, compared with the overloaded devices in the center of the network, lots of devices at the edge of network waste the resources of computing and storage. Therefore, the computational framework of the fog computation and edge calculation is followed. Its main idea is to move the center of network to the edge and meet the demand of users locally through computing and storing devices at the edge so as to reduce the delay and congestion caused by long-distance data transmission. Although, in theory, the establishment of such a distributed network architecture for the nearest service can balance network traffic and lead to a reasonable load distribution, this kind of research is still in the exploration stage. Since this network structure needs to construct a micro computing center similar to cloud computing at the edge of the network, there are still many difficulties to be settled down such as the location and the method of decentralization. What is more important is that this kind of network structure does not significantly reduce the amount of data that needs to be transmitted.
2.4. Reduce Data Traffic Based on Cache Technology
The method discussed below is designed to explore how to directly reduce the amount of data transferred such that the scale of the transmitted data is reduced while the amount of information represented by the transmitted data is not lost. Obviously, if the data to be transferred after processing is only 1/, the data traffic is reduced by times. If is assigned to a relatively big number such as 100 or more than 1000 it will play a fundamental role in the network traffic. The advantage of this approach is that it does not need to add additional hardware resources and does not need to transform the existing physical structure of the network, so it is considered an ideal approach.
In-network caching based on cache technology is a common technology that accelerates information-centric network (ICN) content distribution and improves network resource utilization [39]. In this approach, the information center needs to publish the contents of the cache on some key nodes. When these nodes receive the request of the contents, they send the cached data directly to users instead of forwarding those requests to the ICN or the data center. This approach significantly reduces the number of requests for relaying and reduces the amount of repeated content that needs to be distributed again from the ICN, thereby effectively reducing the amount of data traffic [41]. However, there are still a few disadvantages. First of all, caching requires some storage hardware support, which is improved in the current network, so it is not the main factor restricting its application. Second, the key factor restricting its application is that this approach does not fundamentally solve the problem. Only the content, which is repeated multiple times and is exactly the same, could reflect the cache’s role. Thus, this approach is more suitable for applications such as multimedia, the content of which is large and can be cached completely. However, the content of such applications, after all, is very large, and the network hardware space is relatively limited compared to the dynamic changes in the network, thus restricting the development of this technology so that it can only be used as an auxiliary technology, not a mainstream technology. Finally, this method can only be applied to the distribution of the content, that is, only part of the data traffic from the network center to the edge of the network (i.e., information downstream traffic) can be settled. However, the data traffic produced by a large number of edge networks devices and forwarded to the network center data (i.e., upstream data flow) is still a problem. What is more, it is the existence of upstream data flow or both upstream and downstream data flow that causes the unprecedented pressure on the current network. For example, when instant messenger needs to carry some messages from one end to the other, data should be sent to the data center and then distributed to the other end, which could cause both upstream and downstream data flow and lead to the pressure on the network.
2.5. Reduce the Amount of Data Transmission Based on Network Coding Technology
Network coding is a type of exchange technology, which is fusion of routing and coding information [42]; its core idea is that all data received on every channel is going to be processed linearly or non-linearly in every node of the network and then forwarded to the downstream node, and the middle node will play the role of encoder or signal processor. According to the max-flow min-cut theorem in graph theory, the maximum rate of communication between the sender and the receiver of the data can not exceed the maximum flow value or the minimum cut value between the two sides. If the traditional multicast routing method is used, the upper bound can not generally be reached [42].
2.6. Reduce the Amount of Data Transmission Based on Data Aggregation Technology
Data aggregation is easy to perform to our minds [22]. This method is first applied in a wireless sensor network. A wireless sensor network [43,44], due to the deployment of nodes, is more intensive; thus the value of node-aware events or physical phenomena between different nodes has a large amount of redundancy. For example, in the perception of the temperature and humidity of farm crops, the difference of the temperature and humidity sensed by nodes in a small area is small. Only one value is needed to present others if there is little difference between those values [22]. If so, data produced by sensing nodes could be presented by only one piece of data so that the data needs to be transmitted would be 1/. For another example, in some applications, the way to aggregate is to save and send the maximum value or the minimum value of those collected data to the data center. In these applications, only the maximum or minimum value is considered to be the most valuable data to users or researchers. This is a case in which an infinite number of data packets can be aggregated into one packet [45,46]. Obviously, this approach could significantly lower the network traffic. In the case described above, packets can be aggregated into one packet, but, in practice, the more general case is that multiple packets are merged into a packet that is smaller than the original packet when the packages encounter each other at the intermediate node of the route. The ratio of the size of the packet after aggregation to the size of the original packet is called the aggregation ratio. It is clear that a smaller aggregation ratio means a better effect, but this is determined by the physical properties of the data packet. Therefore, the method of data aggregation still has some limitations in terms of its general applicability.
3. System Model and Problem Statement
3.1. System Model
The network model used in this paper is shown in Figure 2, which is a large data collection network. It mainly consists of three parts, as follows: (1) Crowdsourcing network. It consists of a large number of sensing devices. These sensing devices send several kinds of data to the data center through routers in the network. Then, the data center cleans the data and refines it into services, which are provided for consumers; (2) Backbone network. It refers to the network through which sensing data are sent to the data center. Generally speaking, data sent to the data center will pass through the edge network before the backbone network. However, the main purpose of this study is to reduce the data traffic as much as possible by transmitting data with strong correlation through the same routing path. We do not distinguish between edge networks and backbone networks; (3) Data center. It is considered to be the end of transmission. There are a few data centers in the network, and the type of data to be collected varies in different data centers. Since the routing method with a data center is similar to the routing method with multiple data centers, this paper mainly discusses the strategy of our proposed scheme, assuming there is a data center in the network.
3.2. Data Aggregation Model
In terms of data aggregation, we adopt the lossless step-by-step multi-hop aggregation model introduced in [47,48]. In such a model, incoming data is aggregated with existing data in order of arrival. Assume that router has already received a package and that the new arrived data packet is . The similarity between and . Therefore, the package after aggregation is :
The bigger , the larger the correlation between packages. The after aggregation is also smaller than previous packages.
In the past, data routes according to a common routing algorithm such as the shortest routing algorithm so the data points with the high correlation between the data packets may not be able to meet each other resulting in poor network performance. The scheme proposed in this paper is distinguished from the previous scheme in the use of an active routing approach. Every router will compute the similarity between the arrived package and other packages. Then, the package will be transmitted to the routing path with high correlation so that an effective aggregation can be obtained and the data traffic could be lowered, but the similarity between packages varies between packages of different applications. Therefore, the similarity between packages could not be obtained just depending on routers themselves. The application that is in need of these packages should take charge of helping the routers determine the similarity between those packages. Therefore, in order to compute the similarity between data and achieve the goal of reducing the data traffic, we suppose that every application would send a corresponding micro program to all routers. When a router receives a new package, it could choose the right way to transmit the package with the help of the micro program. This idea is able to be achieved in the current software network [14,18]. This paper assumes that the micro program can return the package type with the highest correlation. For example, if the aggregation ID is , which denotes that this package is most similar to those packages of type , the best performance would be obtained when this package is transmitted through the routing path with .
3.3. Problem Statements
After the discussion above, the main problems of this paper can be summarized as follows:
(1) Minimize the number of network packets:
Suppose that the router set for forwarding packets in the network is , where is the number of routers. In unit time, the number of packages transmitted by is . Therefore, the optimization objective is to minimize the number of packages transmitted by every , shown, as in Equation (2):
However, it is hard to reduce the transmitted packages of every , so the optimization objective could also be to minimize the sum of the transmitted packages of the whole network directly instead of every router. Thus, minimizing the sum of packets forwarded by the entire network is as shown in Equation (3).
(2) Minimize the transmission time of network packages:
There are two kinds of transmission time. One is the time that a package spends passing a router . Another is the end-to-end time that a package spends traveling from the start node to the data center. Suppose that the rate at which a packet is forwarded along a routing path , whose length is , is . The number of packages travelling along is . Therefore, Equation (4), where is the number of routing paths, denotes the minimization of the transmission time of packages travelling along a routing path .
It could be concluded from Equation (4) that reducing the number of packages and the length of routing paths is the key to reducing the transmission time because it is the physical characteristics of a machine that determine the value of . Therefore, although the proposed scheme would increase the routing length because every package would choose the most appropriate path with a high ratio of aggregation instead of the shortest one to be forwarded along, the end to end time from the start node to the data center would still decrease because of the reduction of the number of packages. In order to minimize the total time of transmission, we should minimize the sum of the transmission time of every package travelling along a routing path , shown as Equation (5).
(3) Make the routers in the whole network reach load balancing:
Load balancing refers to the total number of packages forwarded by each that is appropriate in the network. There are not overloading routers or routers with too little load. The variance of the packages forwarded by each router would be a criterion of the network load balancing, and this is shown in Equation (6), where are the total and average number of packages passing the router , respectively:
All in all, the goal of the proposed scheme would be stated as follows:
In Equation (7), and are the upper limits of and . If the transmission time exceeds the limit, the package will be dropped because the timeout package is too old to be valuable and the best way to handle it is to drop it, which could release the pressure on the network without lowering the quality of service.
4. The Design of IACR Scheme
4.1. Network Initialization
The first time that the IACR scheme is applied to a network, some initialization work needs to be done, that is, building the first routing path and distributing a routing table to every router in the network to record the distance to a routing path and the next hop to the path. Suppose that there are a total of routers in the network and the location of data center is . When a package , belonging to , first appears in the network at router , the Dijkstra algorithm would be used to search a shortest path. Then that package, , would be forwarded along this path. Meanwhile, this path would be built as a backbone routing path, , with a specific AID, , and all routers in this path would be marked as , which means that this path would be mainly used to forward the set of packages with . The specific algorithms are shown in Algorithms 1 and 2 below. Then some configuration packages would be broadcast to all the routers in the network to build or update the distance and the next hop of the routing table of each router.
| Algorithm 1: Initialize the Network |
|
| Algorithm 2: Search and Build the Path |
|
The method to broadcast configuration packages is a flooding algorithm. Every router in the backbone routing path sends a package containing the distance from and the next hop to to all its neighbors, that is, the routers connected to it. When a router that is not located at receives a configuration package, it will extract the information from the package and check if there is a corresponding record that records the information about in its routing table. If there is no record, the router will build a record containing the distance and the next hop in its routing table, and then it will create several new packages and send them to every neighbor. Each package created by the router takes the router itself as the next hop and contains the distance, which is the sum of the distance from each neighbor and the distance extracted from the package it received before. However, if there is, the distance extracted from package will be compared with the distance stored in the routing table. If the distance stored before is larger, the newly arrived package will be discarded. If not, the new distance and the new next hop will replace the old ones in the routing table, and then several packages will be created and sent in the way introduced before. However, different from those routers out of , those routers locate at would record the distance between the next hop and the next hop in the routing table instead. Algorithm 3, shown below, depicts the concrete progress of broadcasting.
| Algorithm 3: Broadcast the Configuration Package |
|
4.2. Package Routes in the IACR Scheme
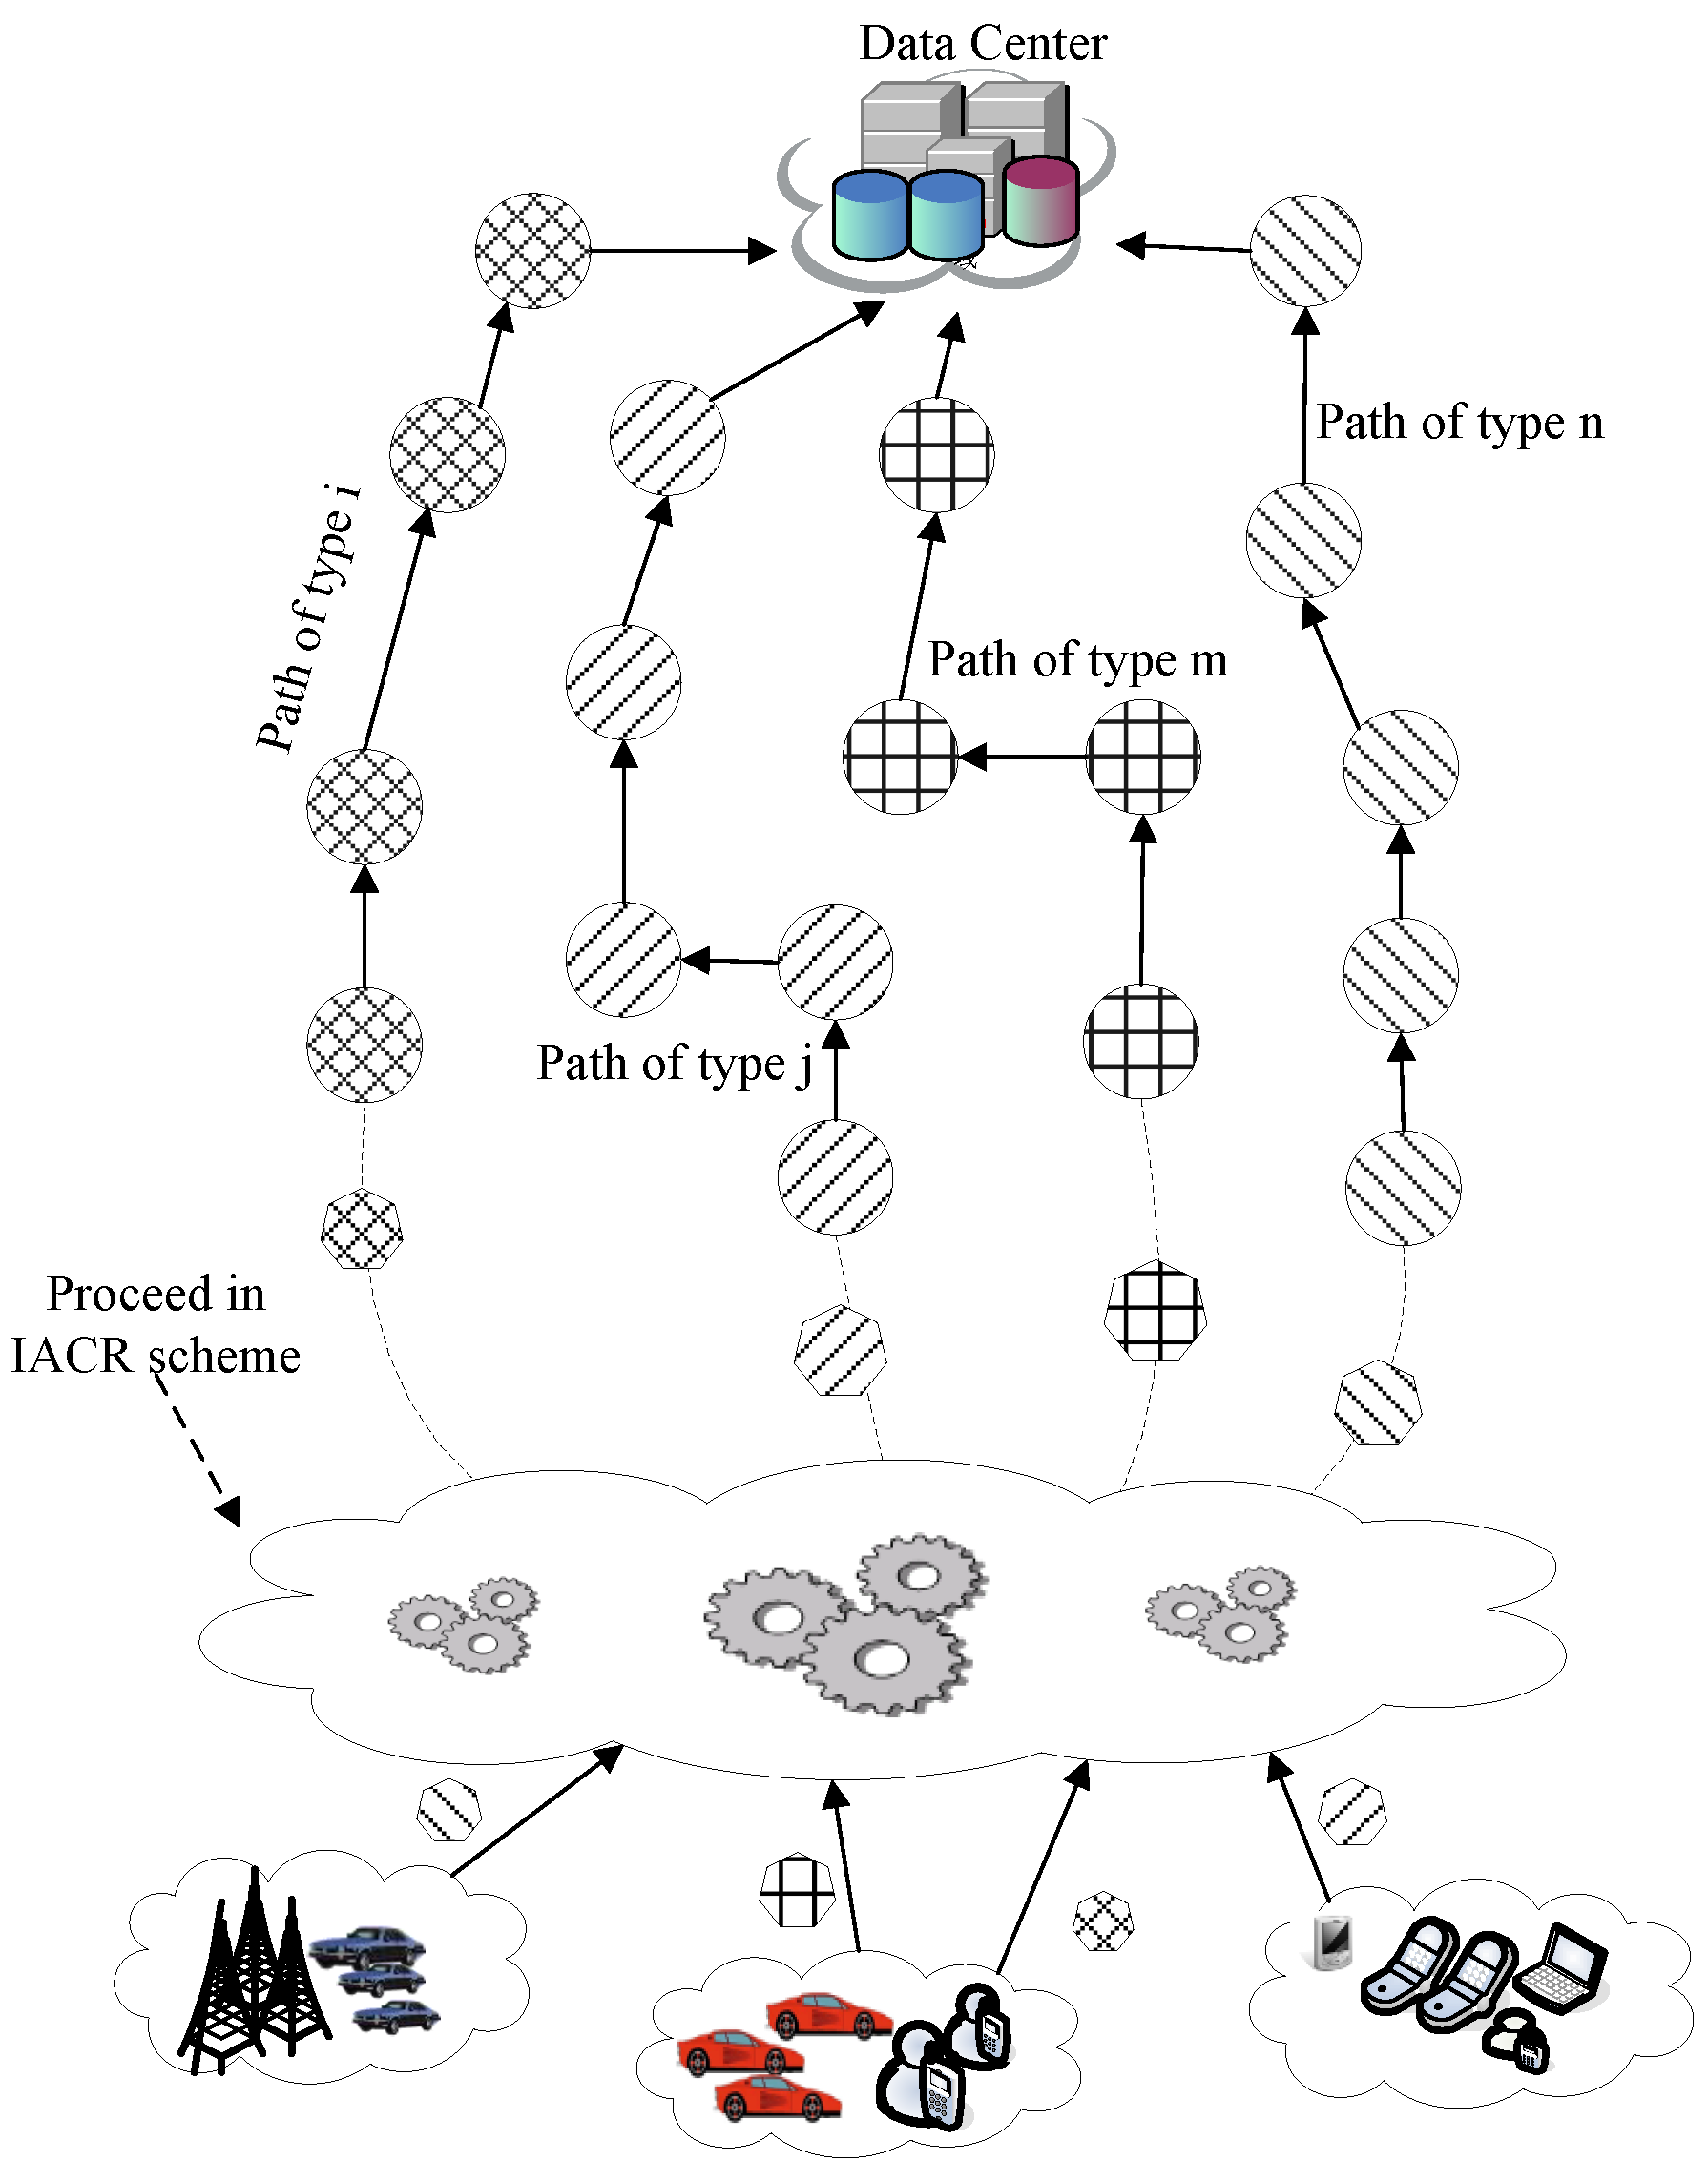
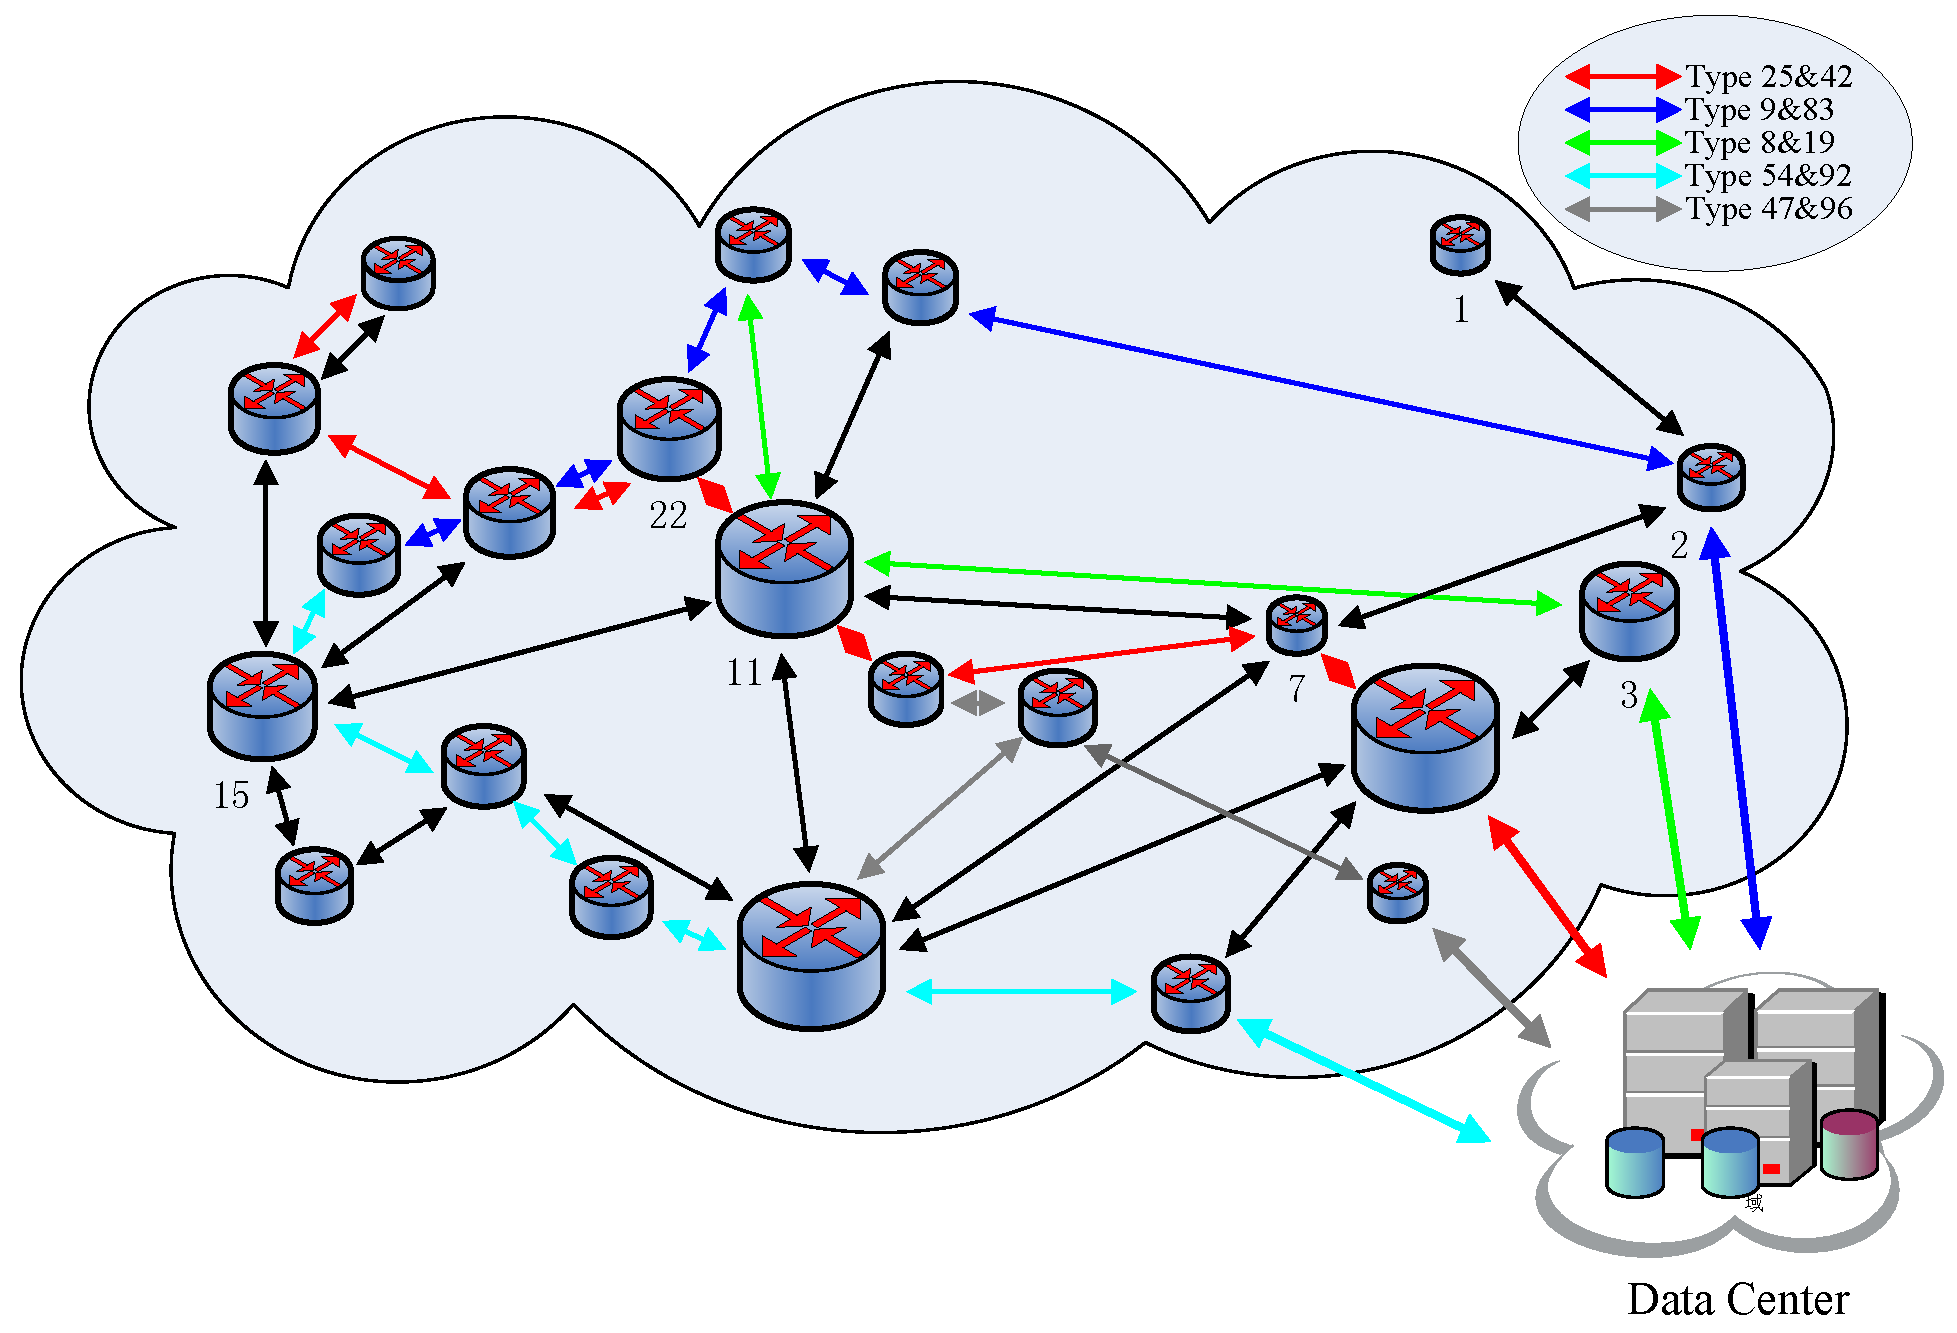
Our proposed IACR scheme is illustrated in Figure 3. Different kinds of packages are produced by different kinds of crowd sensing nodes entering the network. When a package first arrives at the router in the network, the IACR scheme will help the router find the most appropriate routing path. The package would be sent to the routing path at first, and then it would be transmitted to the data center along this path.
When picking up the most appropriate routing path from all routing paths, the router needs a judge function to determine whether a routing path is appropriate or not. There are two factors playing an important role in picking up a routing path:
- (1)
- The similarity between and .
- (2)
- The distance away from the built routing path .
We can learn that the higher the similarity between two kinds of packages are, the lower the aggregation ratio ( that can be obtained [48]. For the sake of convenience, we suppose the relationship between and is shown as Equation (8):
Therefore, it is more reasonable to pick up a routing path with higher similarity between . Additionally, it is clear that a routing path that is close to the start router is more proper, so is also added to the judge function, where is to prevent the case that is at a routing path so that . Therefore, we could define the judge function as Equation (9):
The detail about how the IACR scheme helps the routers find the most appropriate path is shown as follows. When a for arrives at , the IACR scheme would work out the value of judge function between and all built routing paths. Then , which has the highest value, would be selected. Additionally, there is also a threshold, , used to prevent the case that all the built paths are too inappropriate to be forwarded along. If ≥ , would be selected to be forwarded along. If the start router is not at , the package is supposed to be transmitted to the target routing path at first, but, during this journey, the size of the package transmitted is as big as the original size until it arrives at . Then the size is compressed according to the aggregation ratio . After arriving, a smaller will be passed to the data center along , but if , it could be concluded that all existing routing paths could not be satisfying. A new routing path needs to be built by the Dijkstra algorithm. Meanwhile, in order to prevent the case that a router is over-loaded and congestion happens, there can not be more than two AID marks in a router, that is, a router can only be located in less than three routing paths. If there is a router against this rule in the shortest path found by the algorithm, the second shortest path wukk be judged again, but if all paths found fail to be built, the package can only be transmitted to the data canter along with the highest value of . However, if there is one routing path built successfully, the IACR scheme will also mark the new path and all routers in the path with a specific AID and broadcast the configuration packages to build or upgrade the routing table of each router in the network, as was done during initialization. There is still a limitation on building new paths. Under the circumstance of the case that one router could only locate in two routing paths at most and most of short paths have been occupied, if there are too many routing paths built in the network, the newly built paths will be much longer than before, which will lead to a great increase in the routing distance. Therefore, there is also an upper limit on the number of backbone routing paths. If the amount of paths has reached the upper limit, the package will still be forwarded along with highest value of to prevent the total routing distance being too long. The specific progress is shown in Algorithm 4 below.
| Algorithm 4: Package Routes with the IACR Scheme |
|
4.3. Network Maintenance and Dynamic Changes
In order to make sure that every router in the network knows how to forward a package to the target backbone routing path, every router will maintain a routing table in the IACR scheme. Therefore, when a new routing path is built, some configuration packages are going to be broadcasted to all routers to update the information about the distance and the next hop contained in the routing table. The concrete steps are described in Section 4.1 and Algorithm 3.
However, because the appearance of packages can not be forecasted in advance, the routing paths built at first may be useless after that. These paths will occupy those routers, even though they do not forward anything, so that the performance of our proposed IACR scheme will be lower. Therefore, dynamic change in the backbone routing paths in the network is applied to our scheme. In the IACR scheme, a timer is set. Every passing time period, each path that has been created will be checked. If, during this time, no packages are forwarded along the path, this path will be deleted. All the routers occupied will be free and their marked AIDs will be revoked as well. Then the corresponding record in the routing table of all routers will also be deleted, as shown in Algorithm 5.
| Algorithm 5: Delete the Path |
|
4.4. Analysis of Time and Space Complexity of the IACR Scheme
When building a new routing path, the IACR scheme is going to run the Dijkstra algorithm at first, which is considered to be , using a priority queue under the assumption that there are routers and edges in the network. Then, configuration packages will be broadcasted by every router in the shortest path to update the routing table. Suppose that there are routers in a routing path, the upper limit of the broadcasting time would be , where is constant, meaning the transmission time of a package, if every configuration package sent by the routers in routing path arrives at all routers in the network. Therefore, the time complexity of maintaining the whole network is . Additionally, in order to make the routers record the corresponding information about the built routing paths, every router should maintain a routing table, and the number of built routing paths should be less than a constant, which would ensure that the size of the routing table is smaller than a constant. So, the space complexity of the IACR scheme is . Then, when a package arrives at the network, the IACR scheme will search all the paths, which would cost , and is the degree of every router. This is because a router will check all edges connected to it to search the path. However, if no existing routing path is selected, the IACR scheme will continue to search for a new shortest path. Therefore, when dealing with a new arriving package, the time complexity would be . Finally, with a dynamic change in the network, every router in the routing path will be visited, and the corresponding record in every router in the network will be removed, which costs . Therefore, with the analysis above, the time and space complexity of the IACR scheme are both considered to be acceptable.
5. Performance Analysis and Experimental Result
In order to analyze the performance of the proposed IACR scheme, we put forward a network topological structure shown in Figure 4. Every node in this structure could be considered a crowd-sensing node, which could produce a package to be transmitted at any time. Additionally, it could also be considered as a router playing a role in forwarding packages. Meanwhile, for the sake of convenience of analysis and computing, we suppose that all packages to be transmitted have the same size as others in the IACR scheme. If there are some sensing nodes producing over-size packages, these would be divided. If some small-size packages are produced, the sensing nodes are supposed to wait for more data until a standard-size package is formed.
5.1. Produce Related Data
In order to fully demonstrate the validity of the IACR scheme, we supposed that there are 100 different package types in total, and then we randomly generated two sets of related data for further experiments. Each set of data contains the similarity between any two types. Taking the practice into consideration, the similarity of packages of the same type could be randomly generated from 0.8 to 0.95 for Set 1 and from 0.7 to 0.85 for Set 2. In reality, packages of the same type would be highly similar to each other. Meanwhile, they could not be exactly same as each other. Therefore, the similarity between packages of the same type would be relatively high but less or more than one. As for different packages, their similarity would be bigger than 0 and smaller than the similarity between the same packages for each set.
5.2. Performance of the IACR Scheme with 100,000 Packages
Having the related data, we supposed that 100,000 packages and their corresponding start routers in the network are randomly generated to simulate packet delivery in the network and analyze the performance of the IACR scheme. In the preliminary experiments, the upper limit of the number of routing paths is assigned to 10, and the threshold of judge function is 0.5. Meanwhile, all the existing routing paths will be checked for whether there are packages transmitted along them or not when 50 packages have been delivered from the start router to the data center. If a path does not relay any package, it would be deleted and all occupied routers will be freed. In subsequent experiments, the parameters of the IACR scheme were adjusted to observe their performance further. As a comparison, 100,000 identical packages will be sent in the same network to simulate the performance of the original routing scheme. An original routing scheme means that each packet entering the network is sent directly to the data center along the shortest path without any compression.
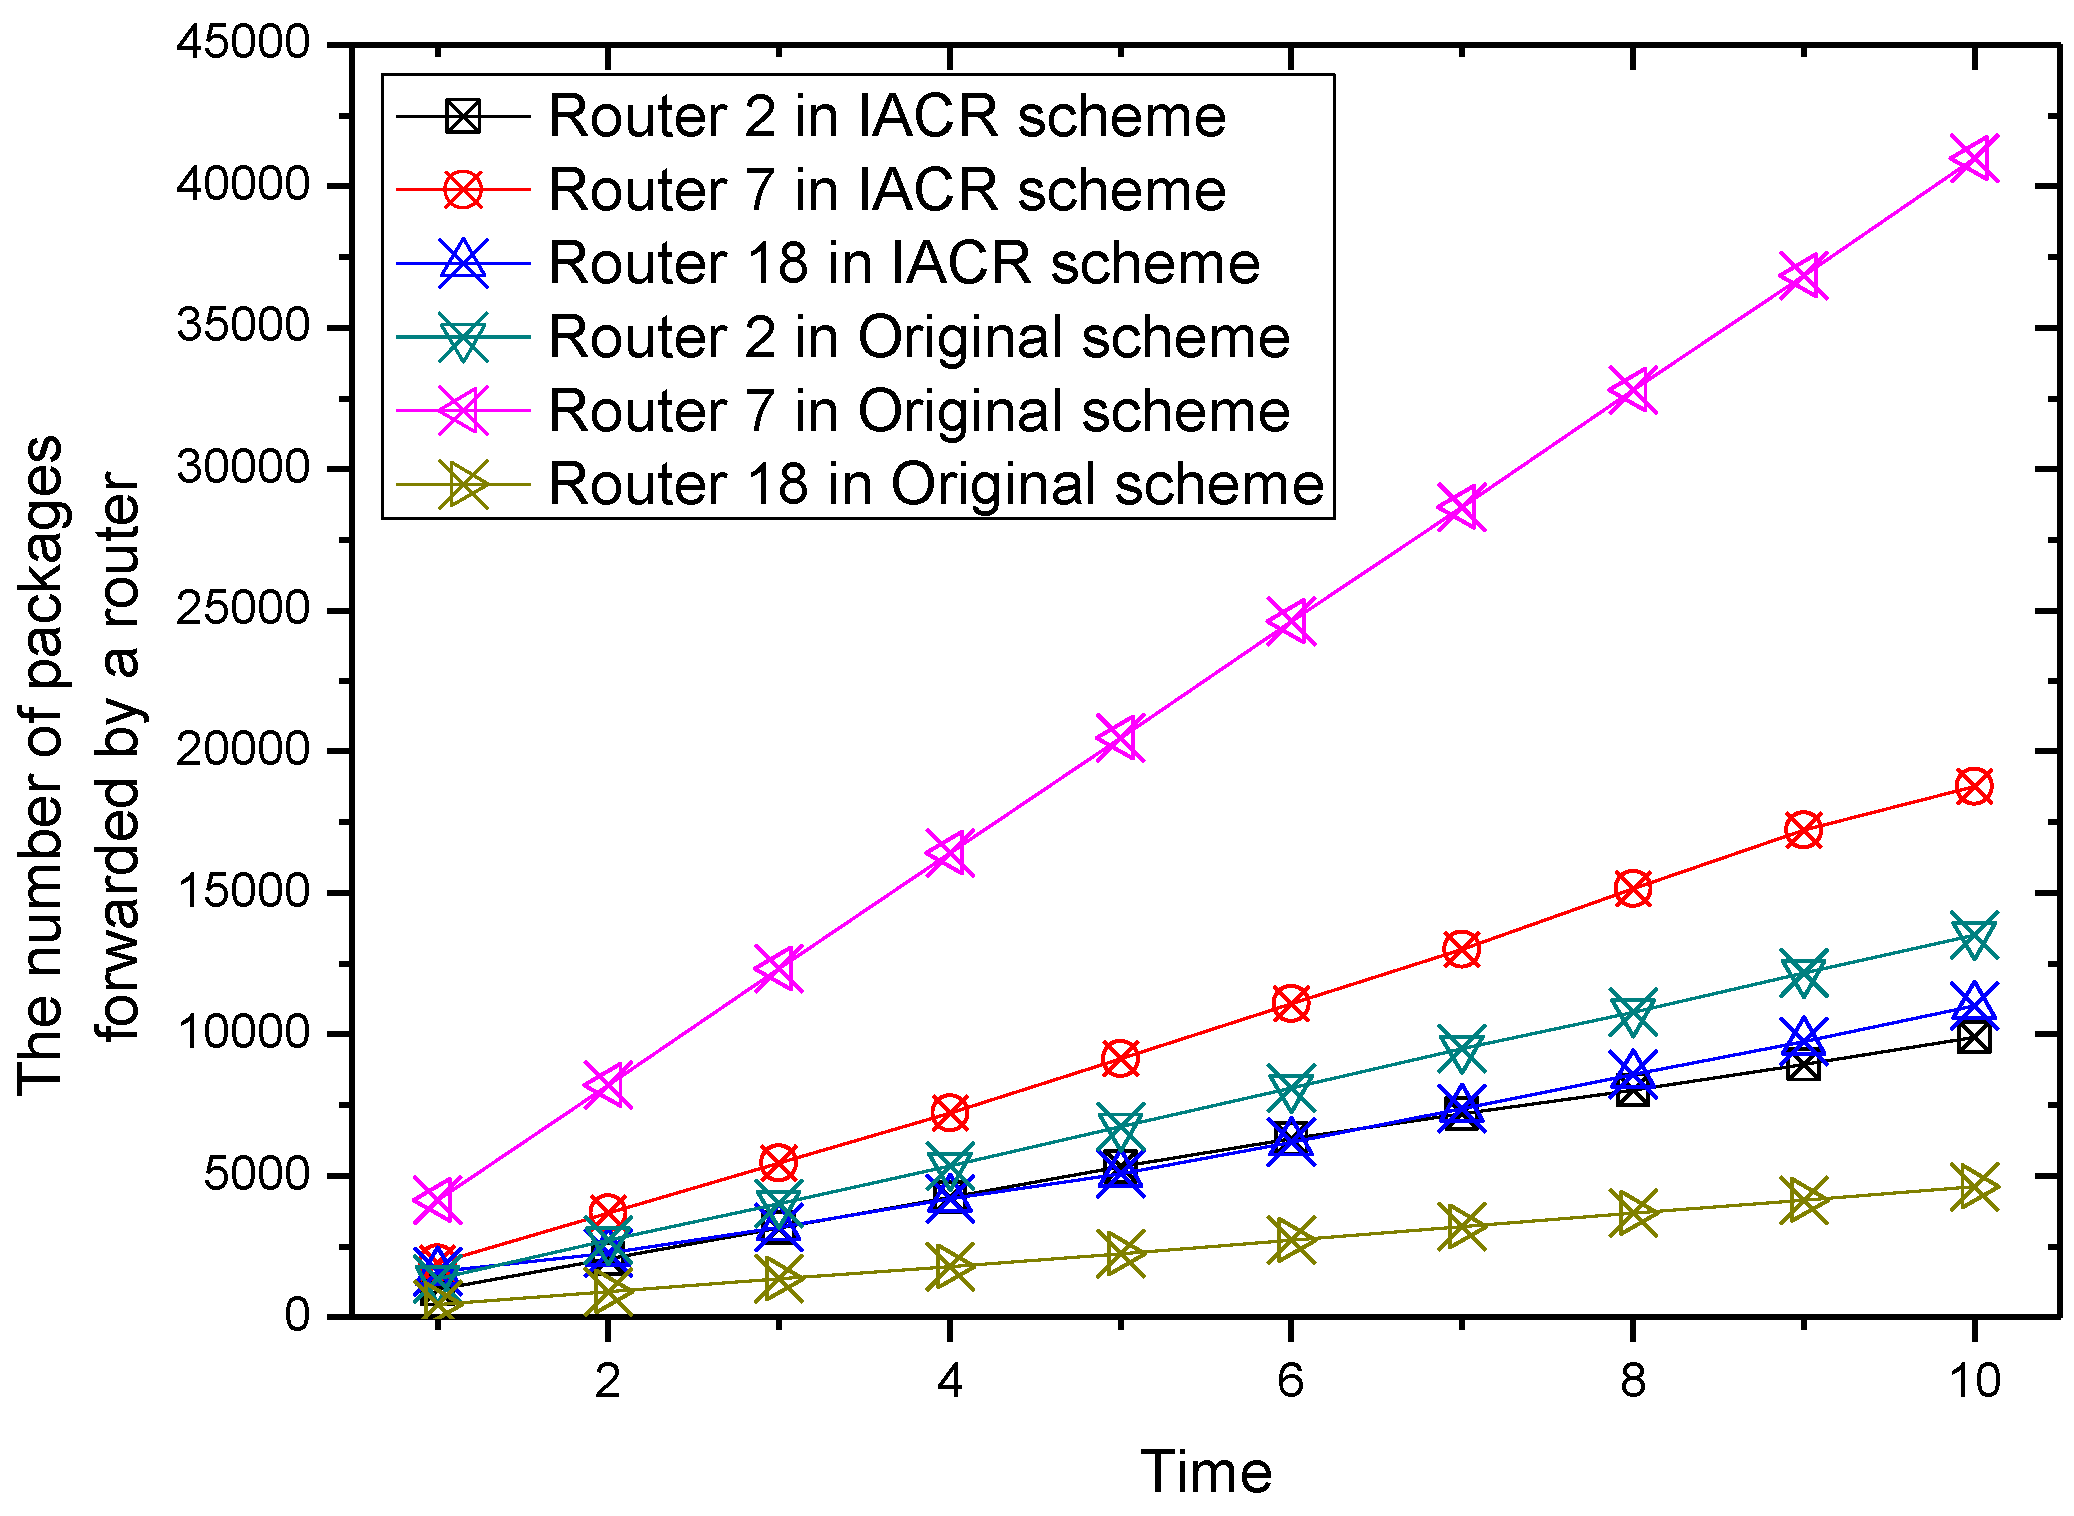
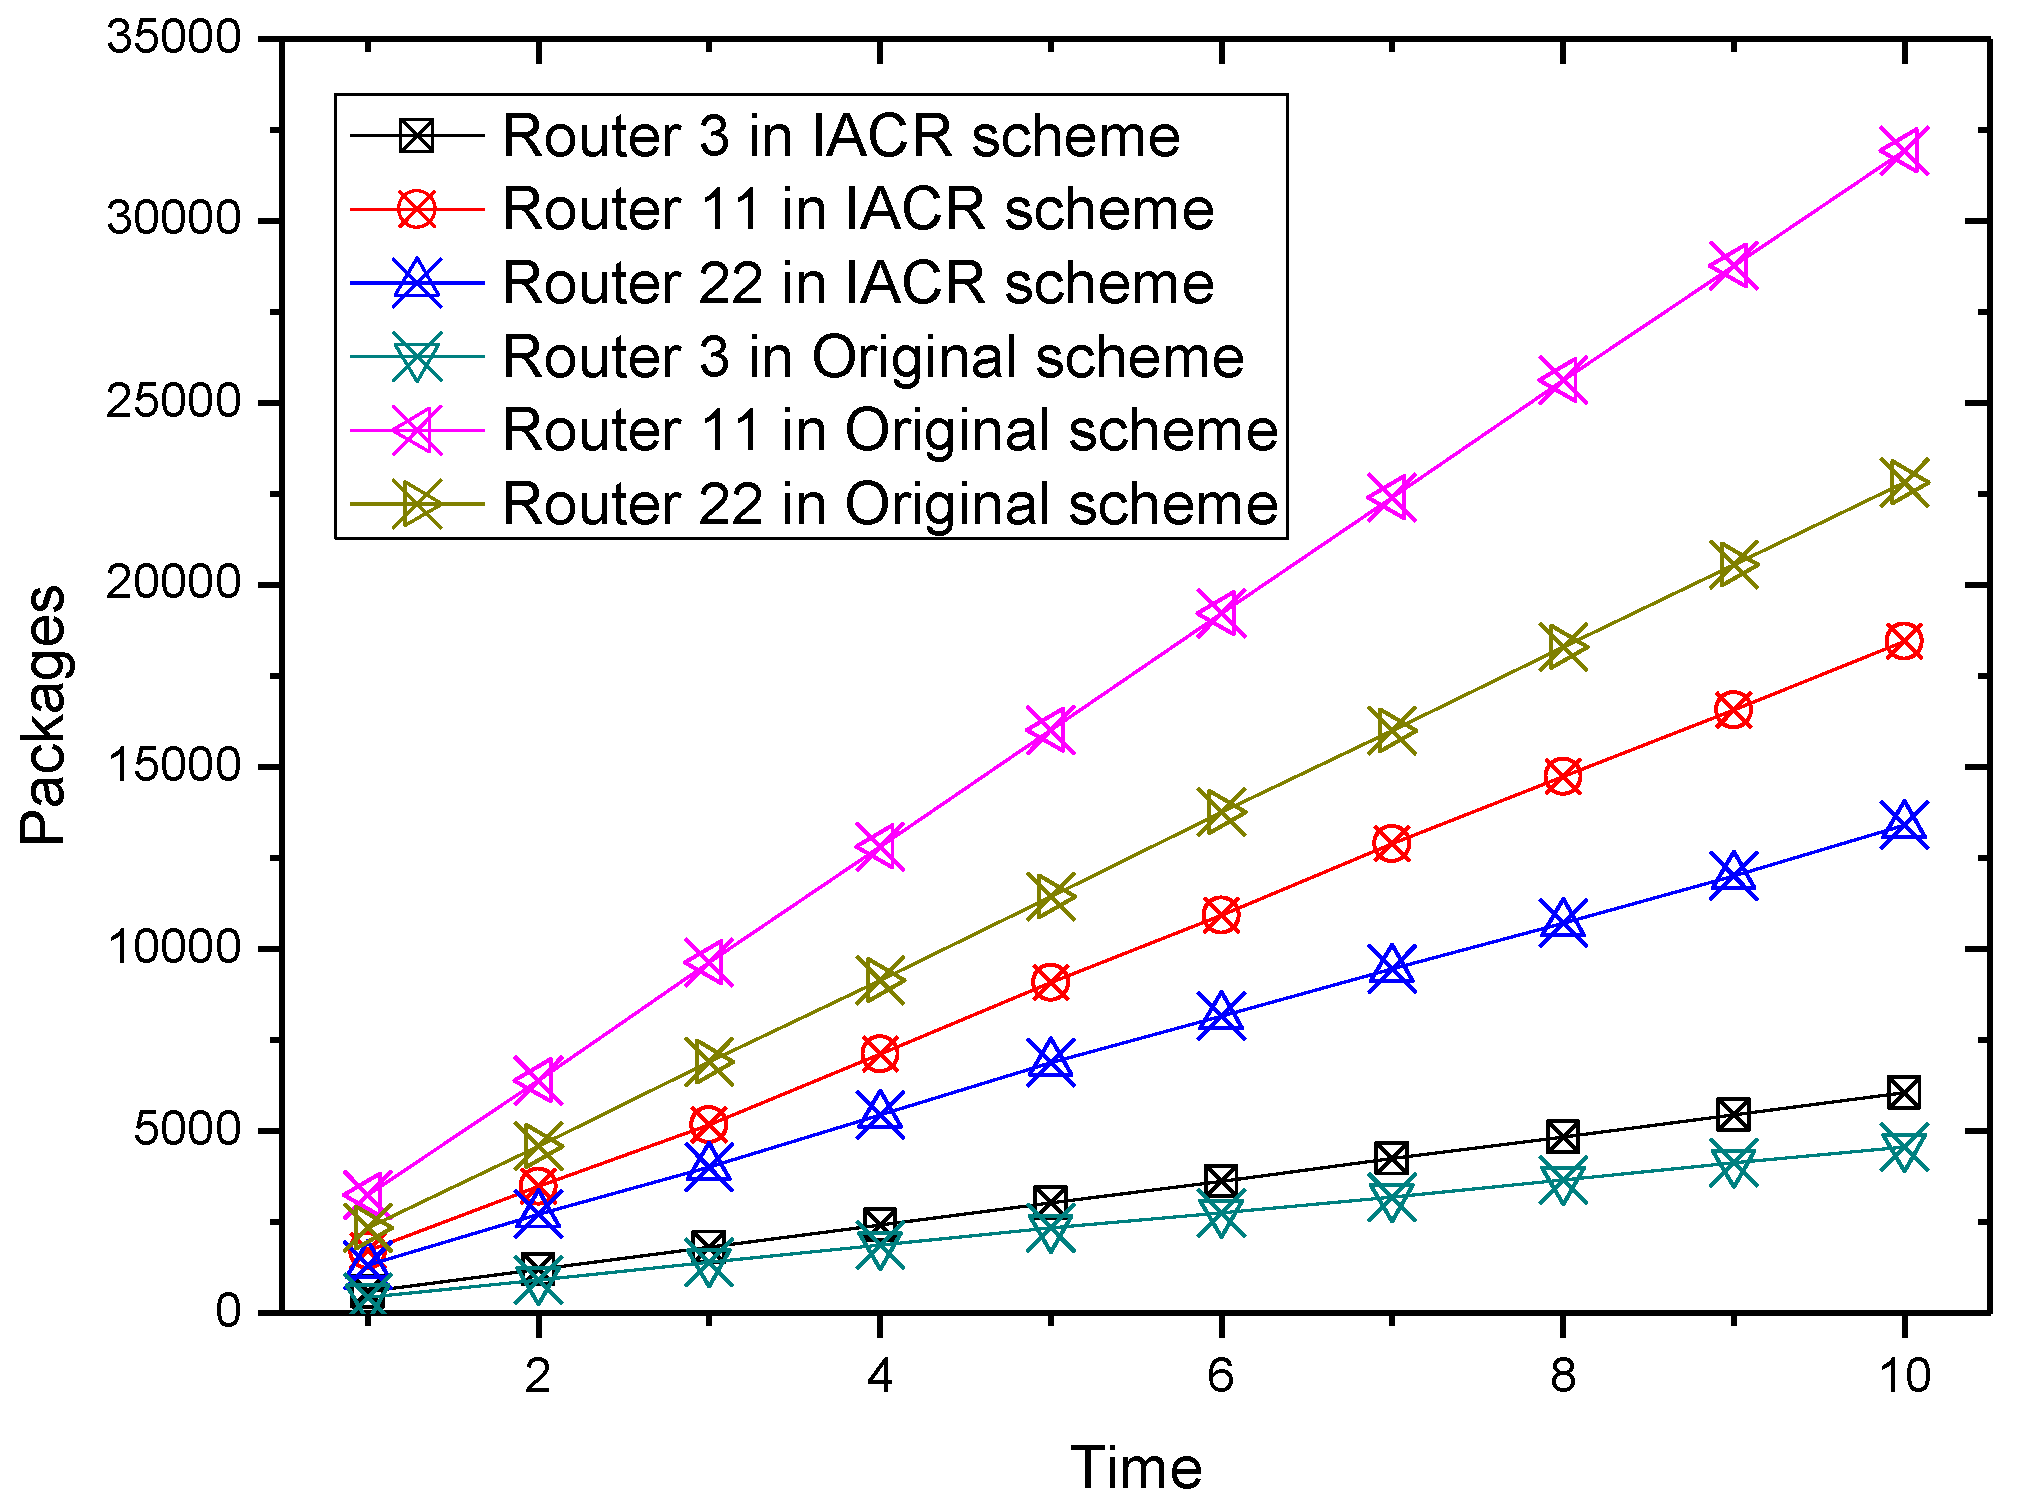
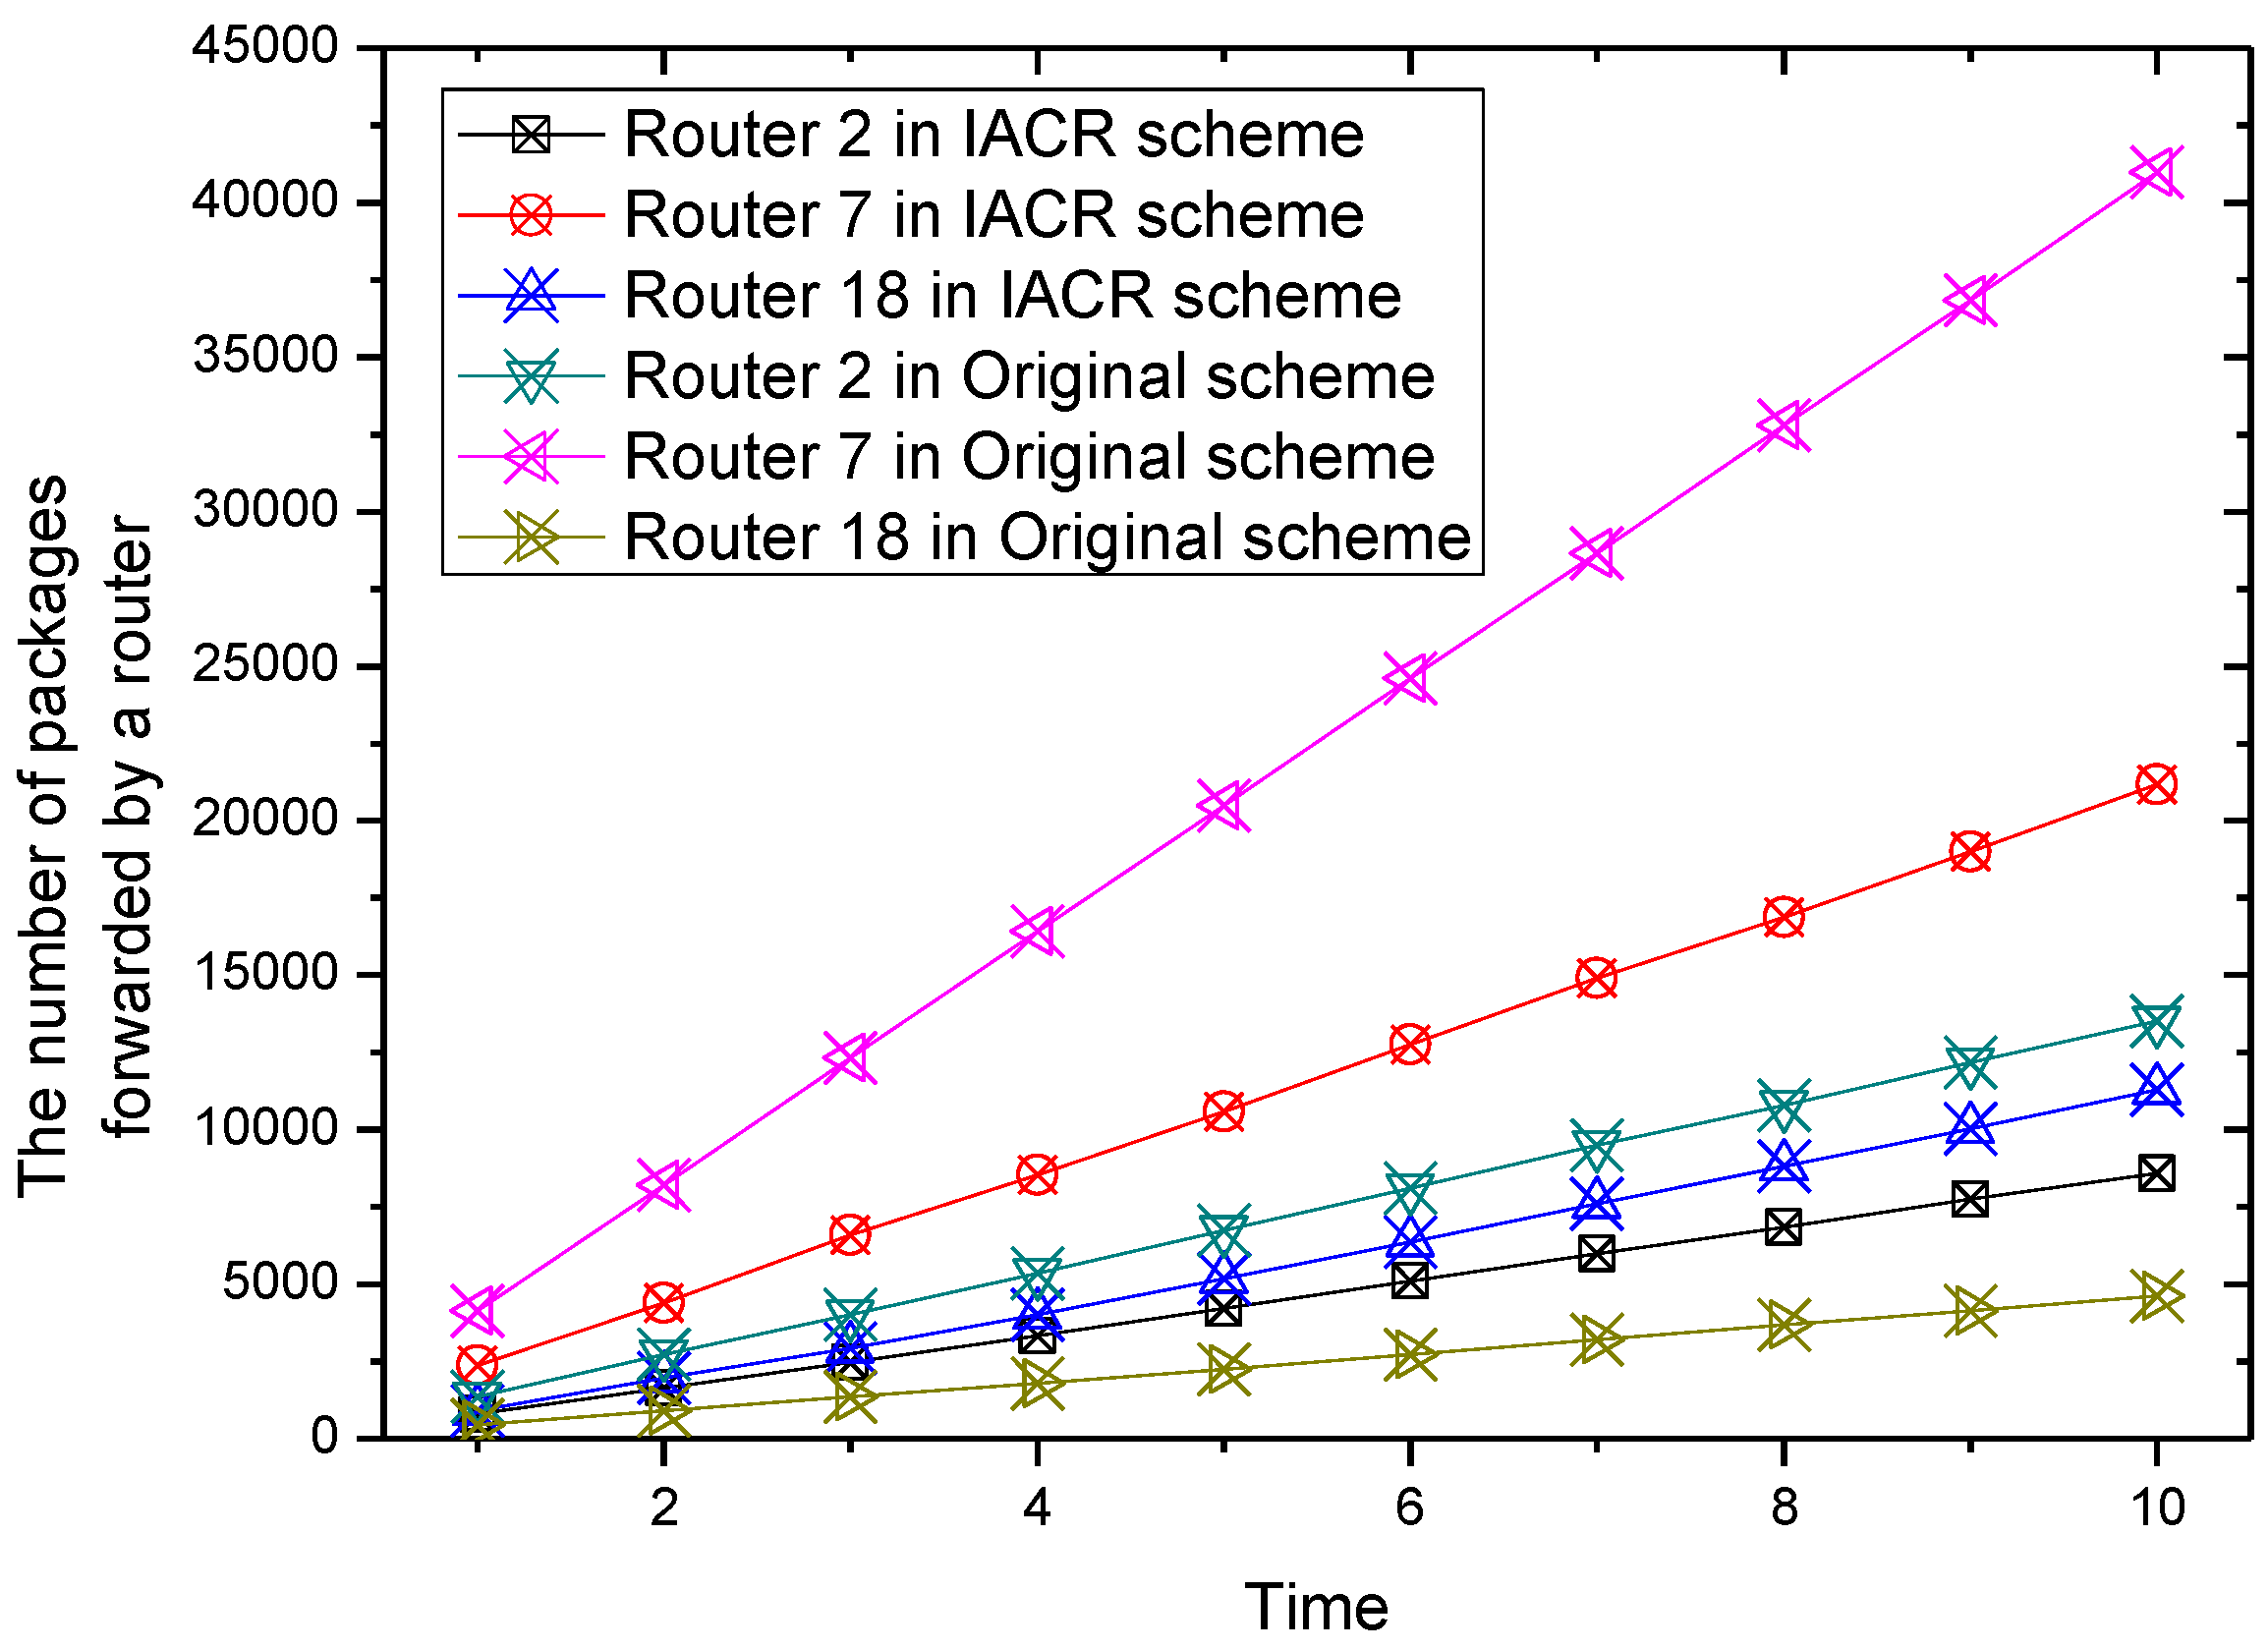
For the convenience of graphical representation, the number of packages forwarded by six routers varying over time are chosen randomly to be depicted in Figure 5, Figure 6, Figure 7 and Figure 8.
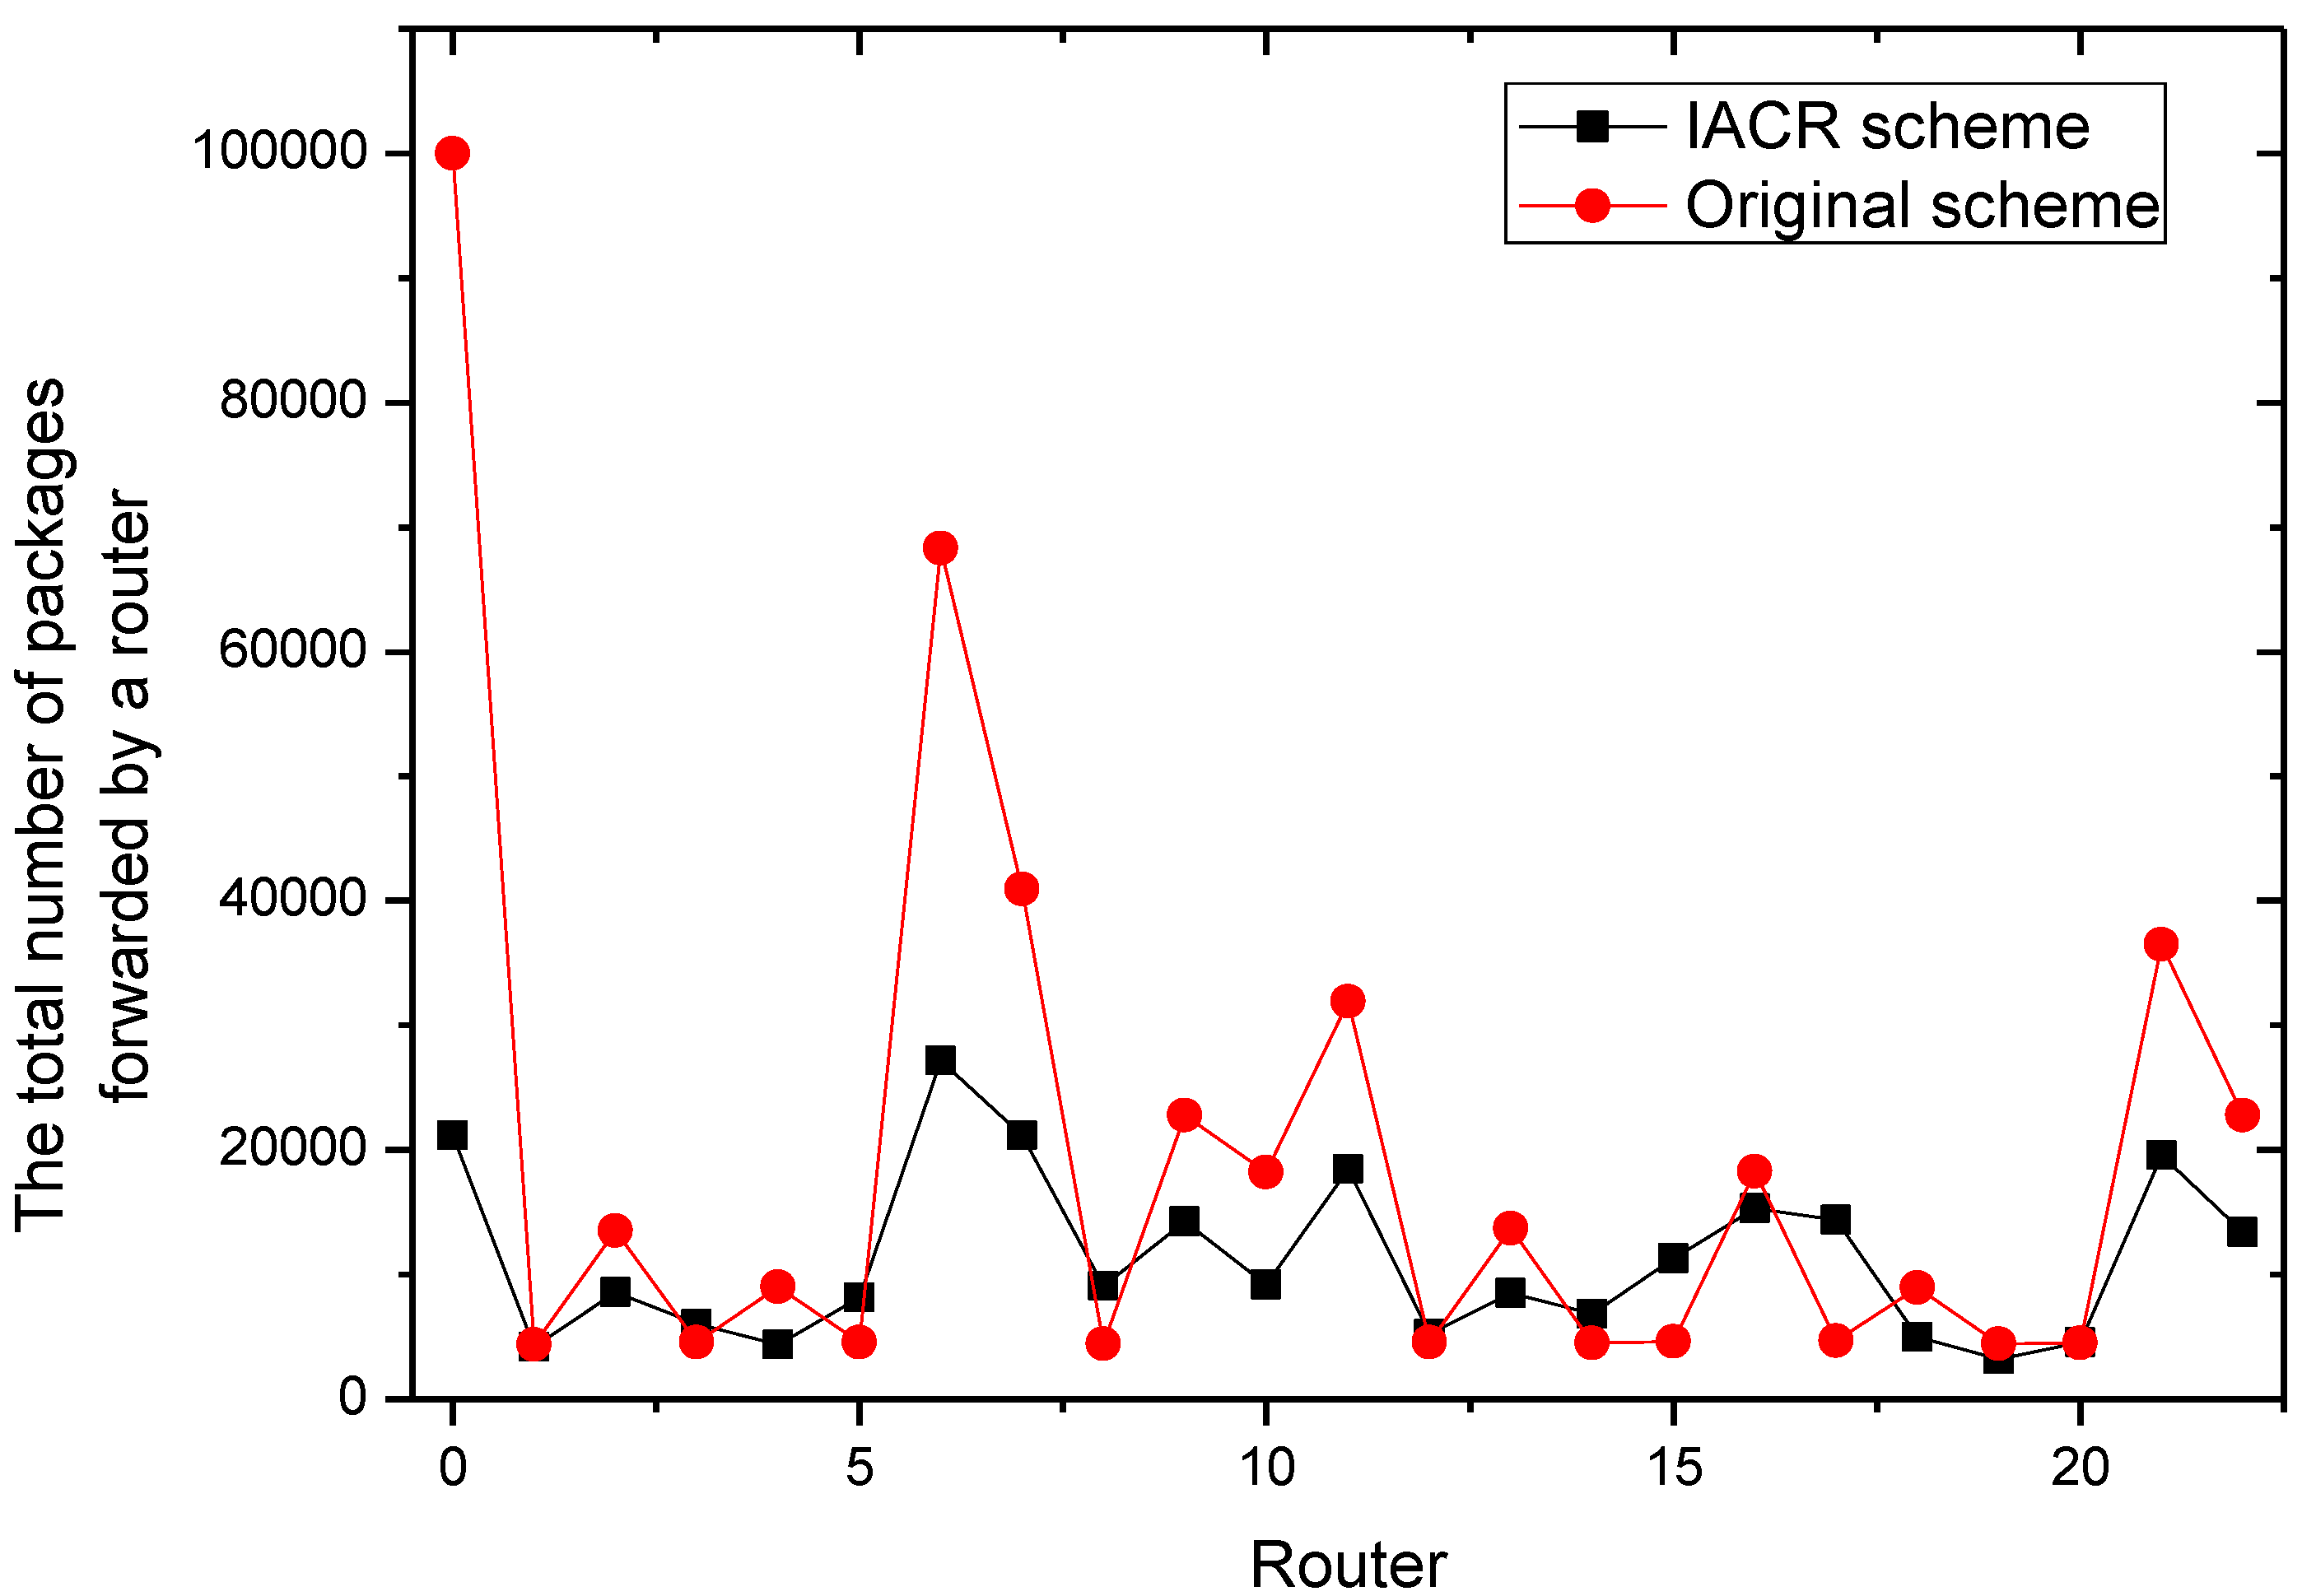
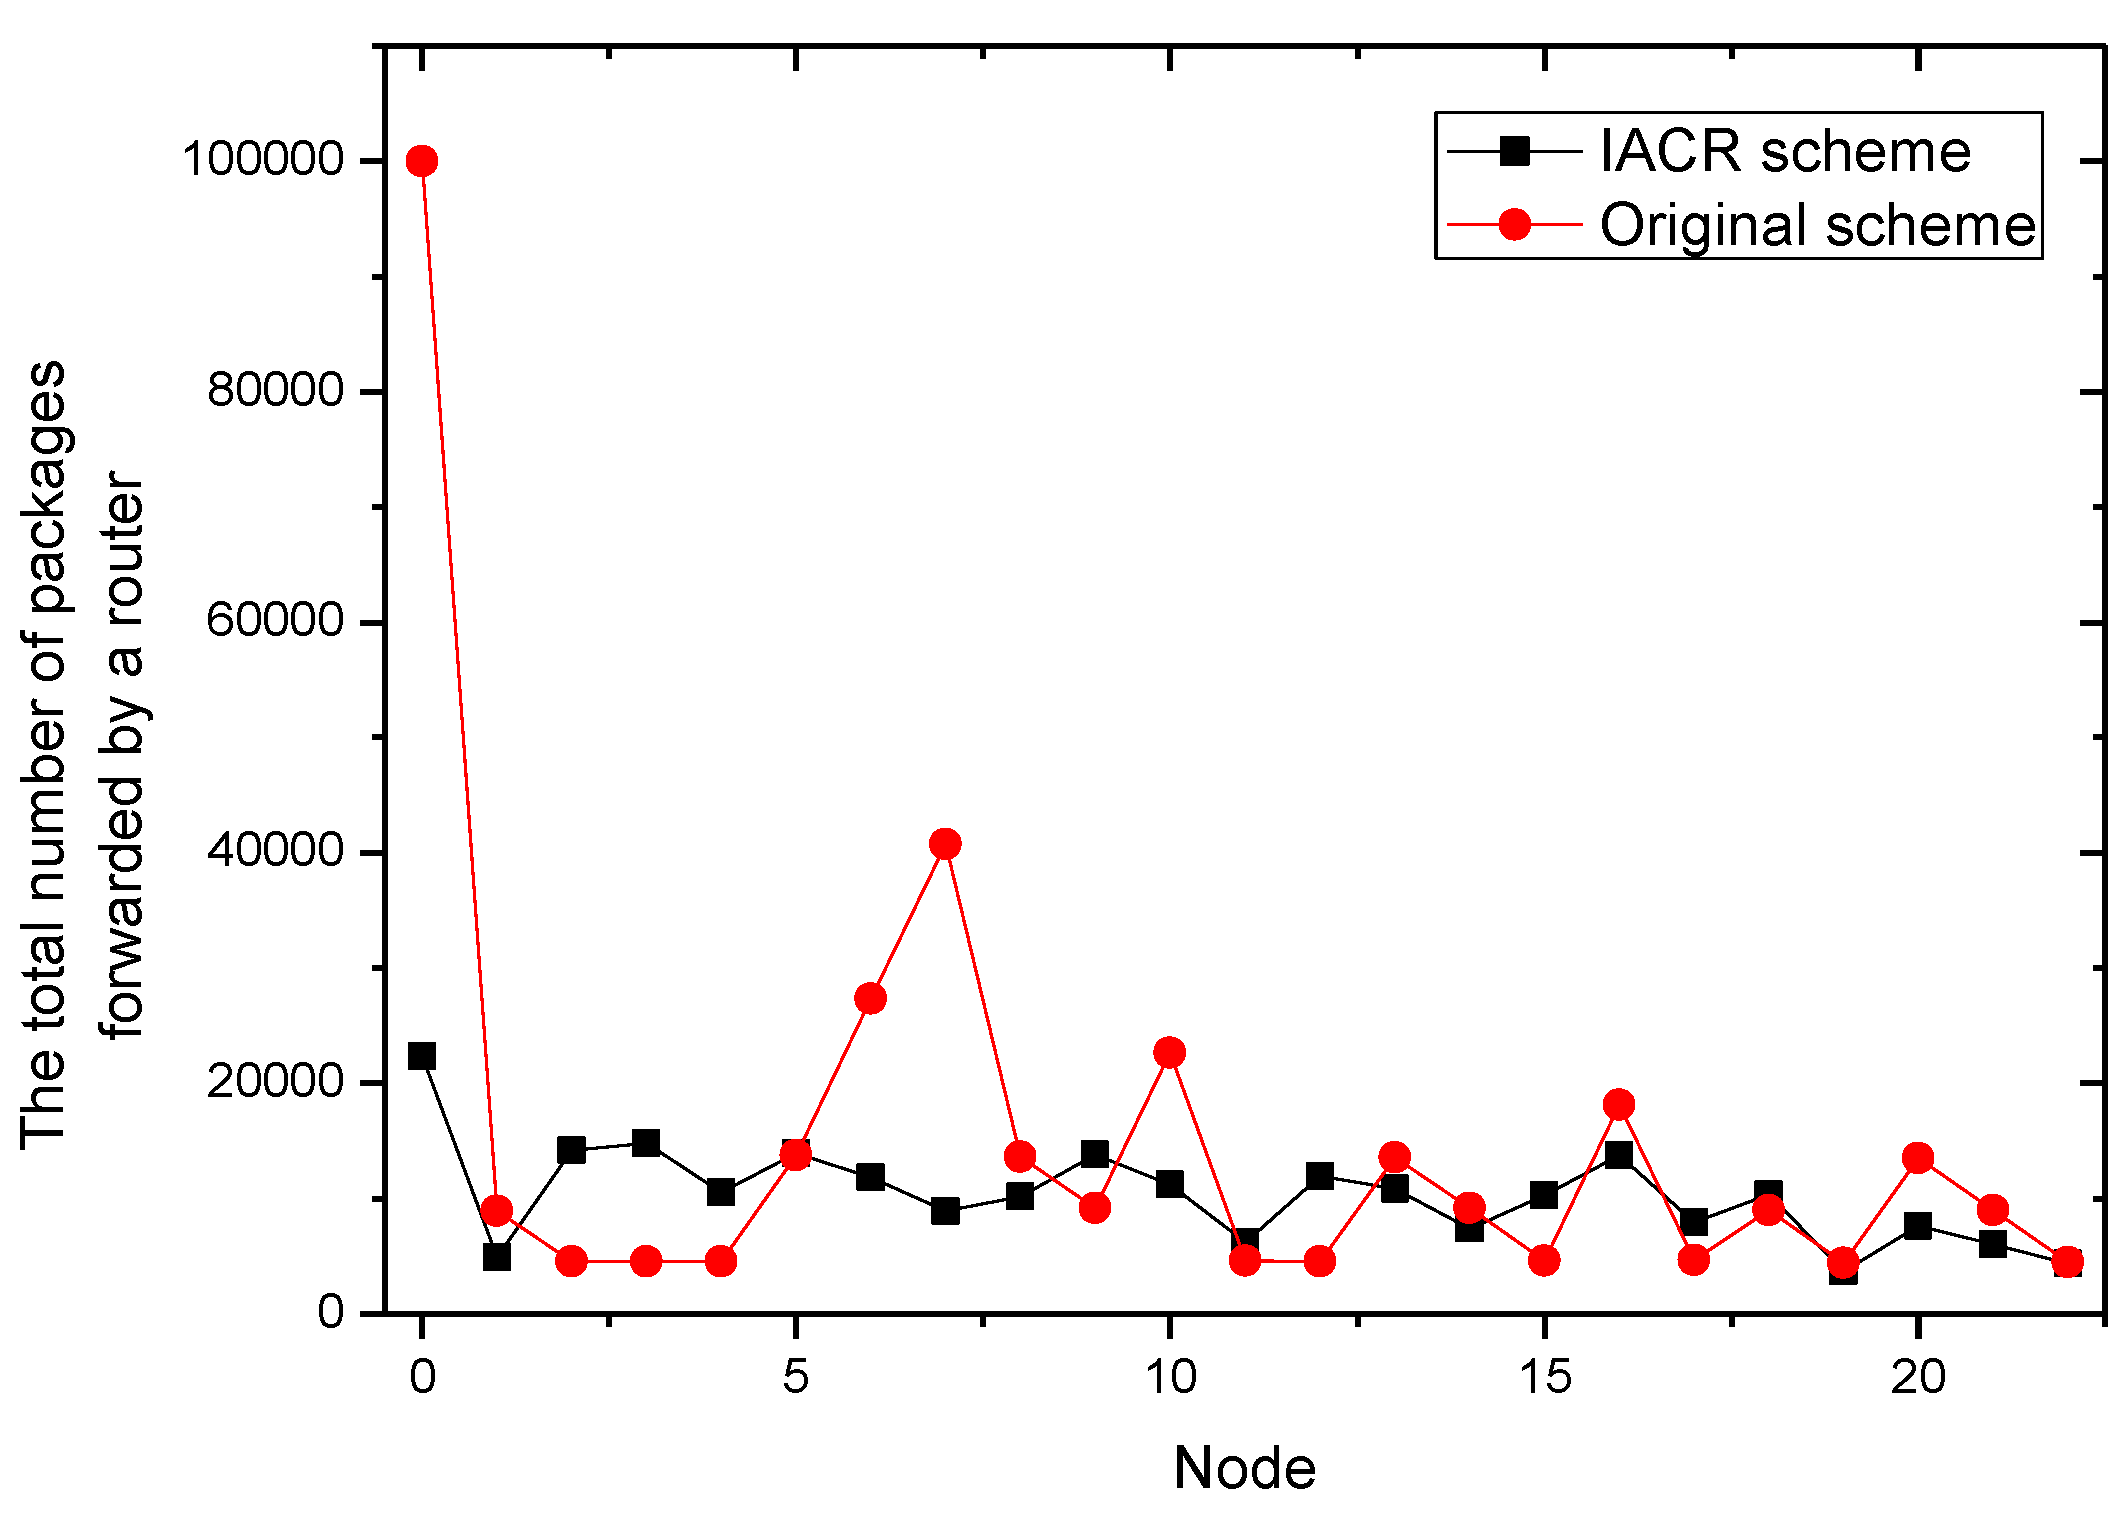
It could be concluded from the pictures above that no matter whether in Set 1 or Set 2, the numbers of packages transmitted by router 2, router 7, router 11, and router 22 all increase at a slower speed in the IACR scheme compared to those in the original routing scheme. In the same period of time, the number of packages transmitted would be much smaller in the IACR scheme. However, it could also be found that abnormal phenomena happen when router 3 and router 15 forward the packages. The number of packages forwarded by router 3 and router 15 increases at a faster speed in IACR scheme compared to the original routing scheme, and the number of packages forwarded is also greater. Analyzing the whole network’s topological structure, we think that the IACR scheme transfers those packages that should be forwarded by other routers in the original scheme to router 3 and router 15 so that the number of packages forwarded by both of them increases intensively. Therefore, further experiments and analysis are conducted to research the total number of packages forwarded by every node after all packages are transmitted from the start routers to the data center in both the IACR scheme and the original routing scheme. The results are shown as Figure 9 and Figure 10 for Set 1 and Set 2, respectively.
It is concluded that, compared to original routing scheme, Ithe ACR scheme reduces the number of packages in total, but, when analyzing all routers in Set 1 and Set 2, we found that there are some routers forwarding less packages and some routers forwarding more packages than they do in original routing scheme as well. However, the numbers of packages forwarded by every router are close to each other. The differences between the maximum forwarding amount and the minimum forward amount of the Set 1 and Set 2 are reduced by 62.5% and 68.6%, respectively. The phenomenon that there are some routers that are over loaded and that there are still some routers forwarding no packages, which leads to the greatly uneven use of routers, disappears. This effect is in line with our thought that the IACR scheme could decrease the number of both the over loaded routers and the under loaded routers to shunt the data traffic. Therefore, we initially believe that the IACR approach has the effect of shunting as well.
In addition, it can be concluded that router 0, which represents the data center, receives fewer packages than it receives in the original routing scheme. It is because our proposed IACR scheme can compress those packages so that the packages are smaller and the storage capacity of the data center is saved as much as possible.
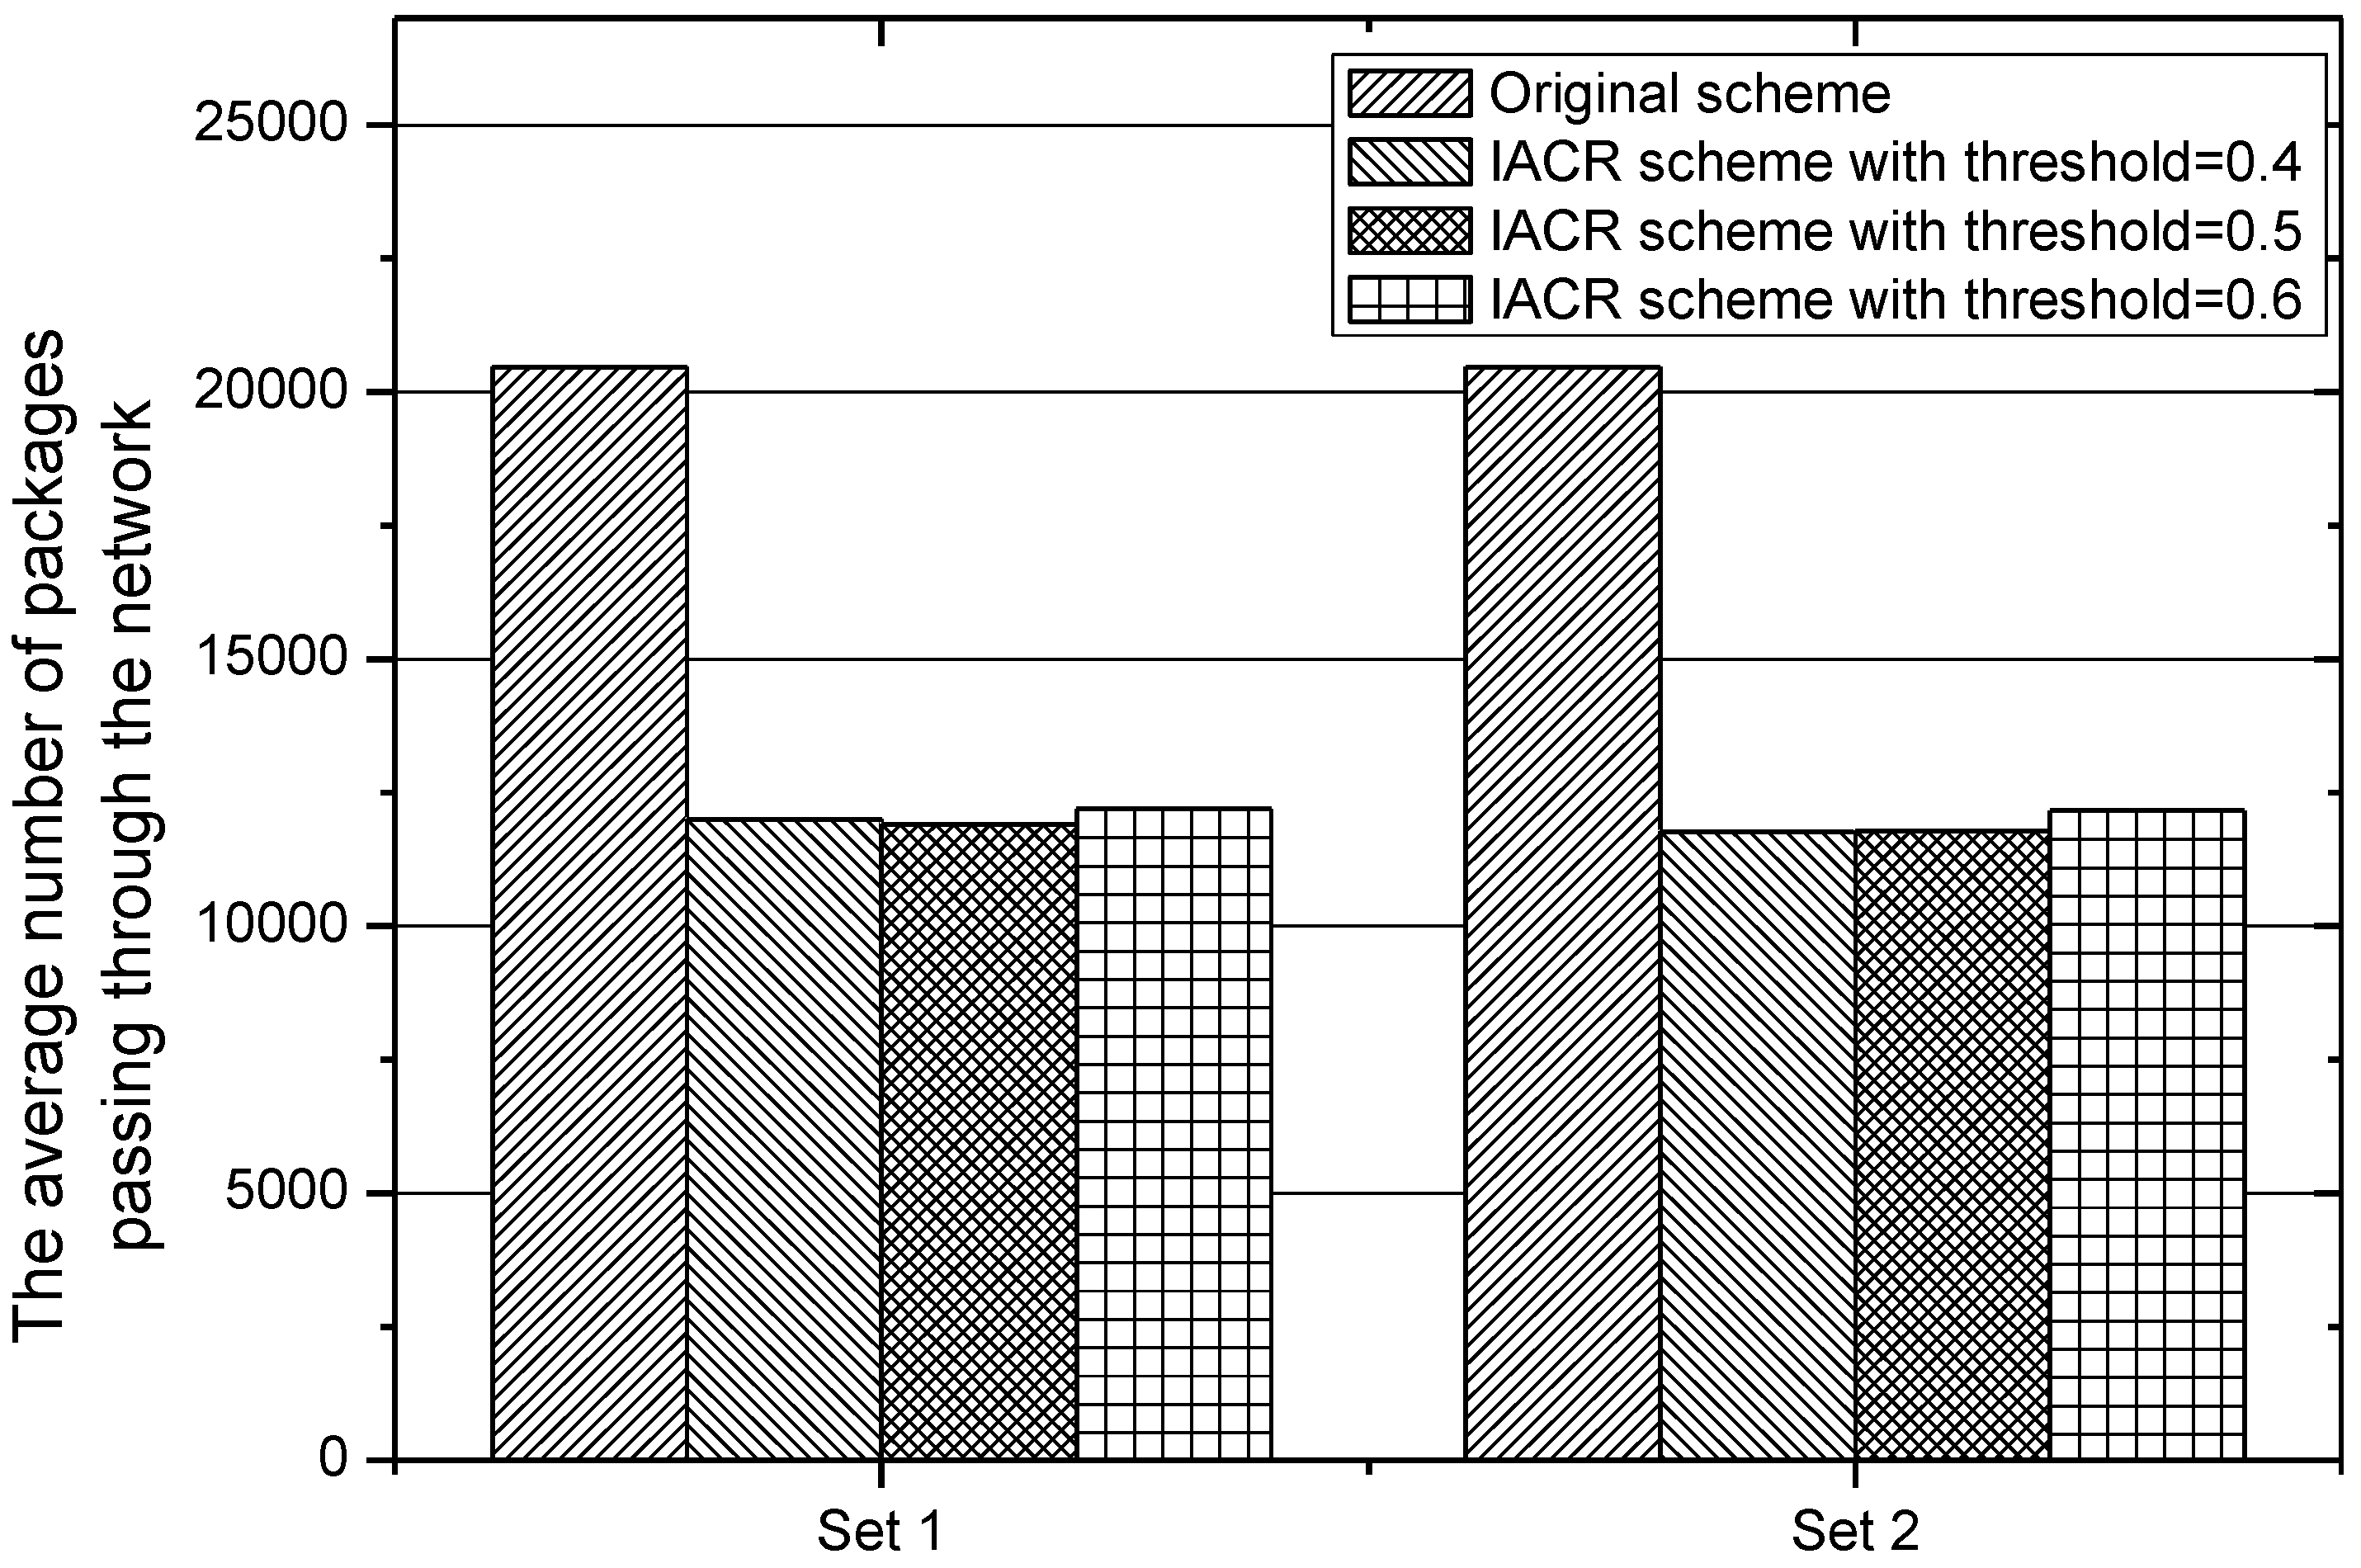
In order to analyze accurately the performance of our proposed IACR scheme for reducing the number of packages transmitted in the network, the total and average numbers of packages forwarded by all routers in IACR schemes with different and in the original routing scheme are counted and depicted in Figure 11 and Figure 12 for Set 1 and Set 2, respectively, above. It can be found that the difference between IACR schemes with different for different sets is small. The total number of packages forwarded by all routers in the IACR scheme is around 263,972.18, and the total number in the original routing scheme is 450,473. The average number of forwarded packages also drops from 20,476.05 in the original routing scheme to 11,907.98 in the IACR scheme, about 41.8% less. Therefore, it is clear that our proposed IACR scheme significantly reduces the number of packages in the network and releases the pressure on the network.
5.3. Performance with 200,000 Packages
In order to exclude the possibility of accidents in the experiment and prove the stability of the IACR scheme when facing potential sudden large data flows, another 200,000 packages and their corresponding start routers are randomly generated according the related data in Set 1 and Set 2. Figure 13 and Figure 14 depict the total number of packages forwarded by each router for Set 1 and Set 2, respectively. It can also be concluded that the IACR scheme performs well to reduce the number of packages forwarded by most routers, even facing a sudden large data flow. This denotes the robustness of our IACR scheme.
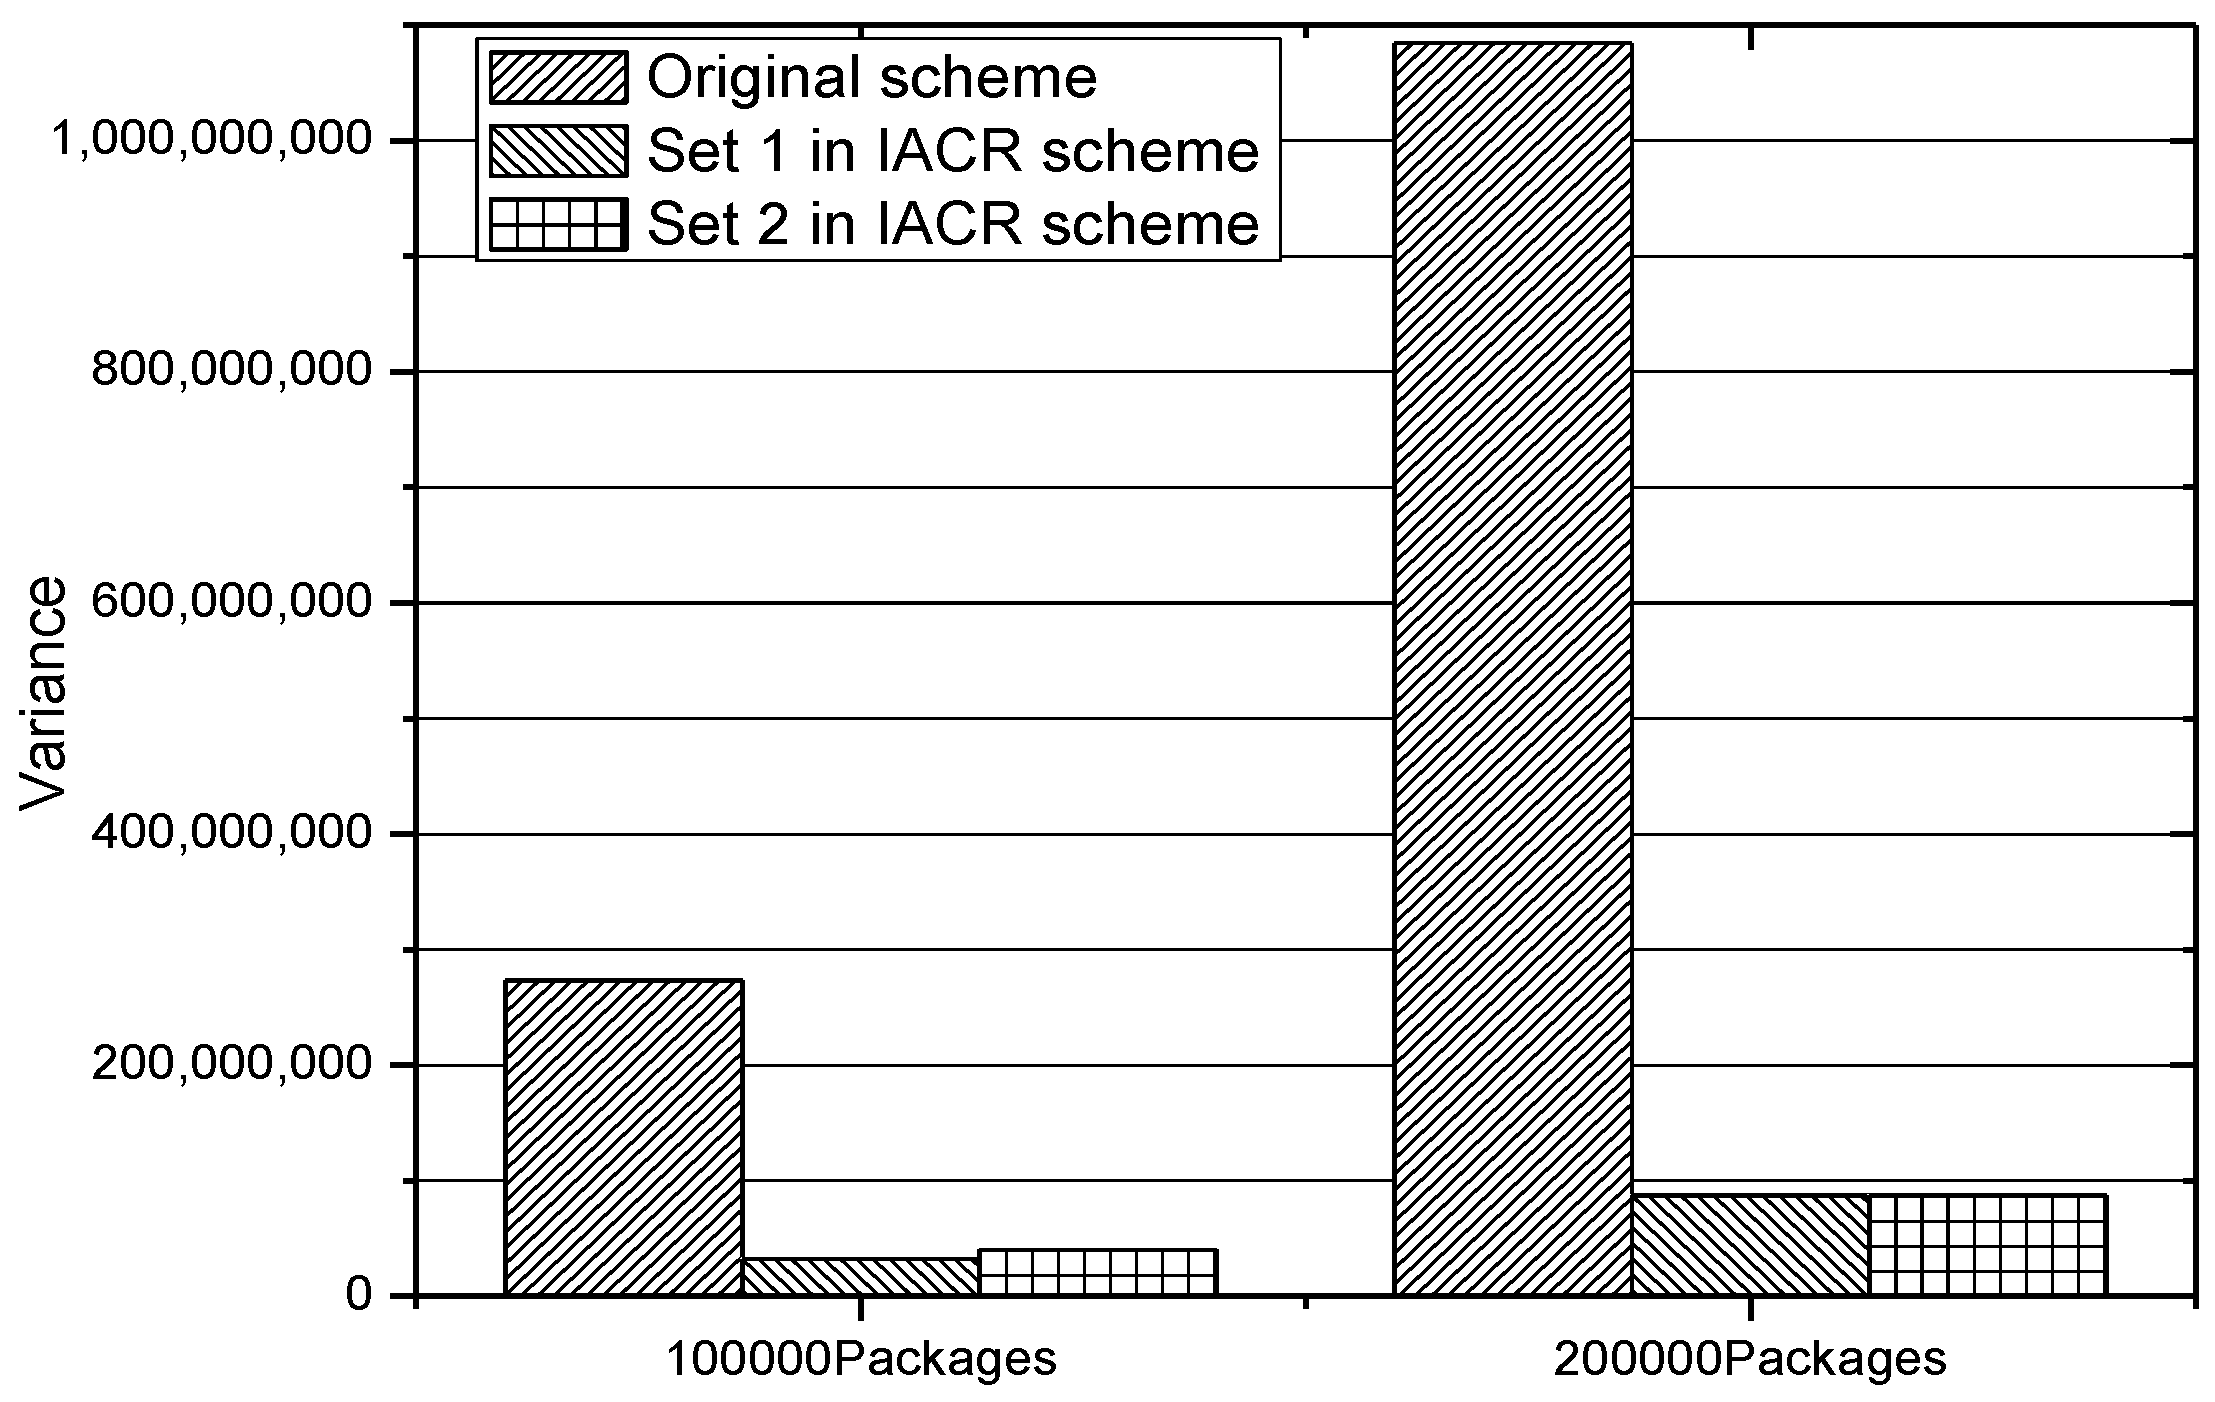
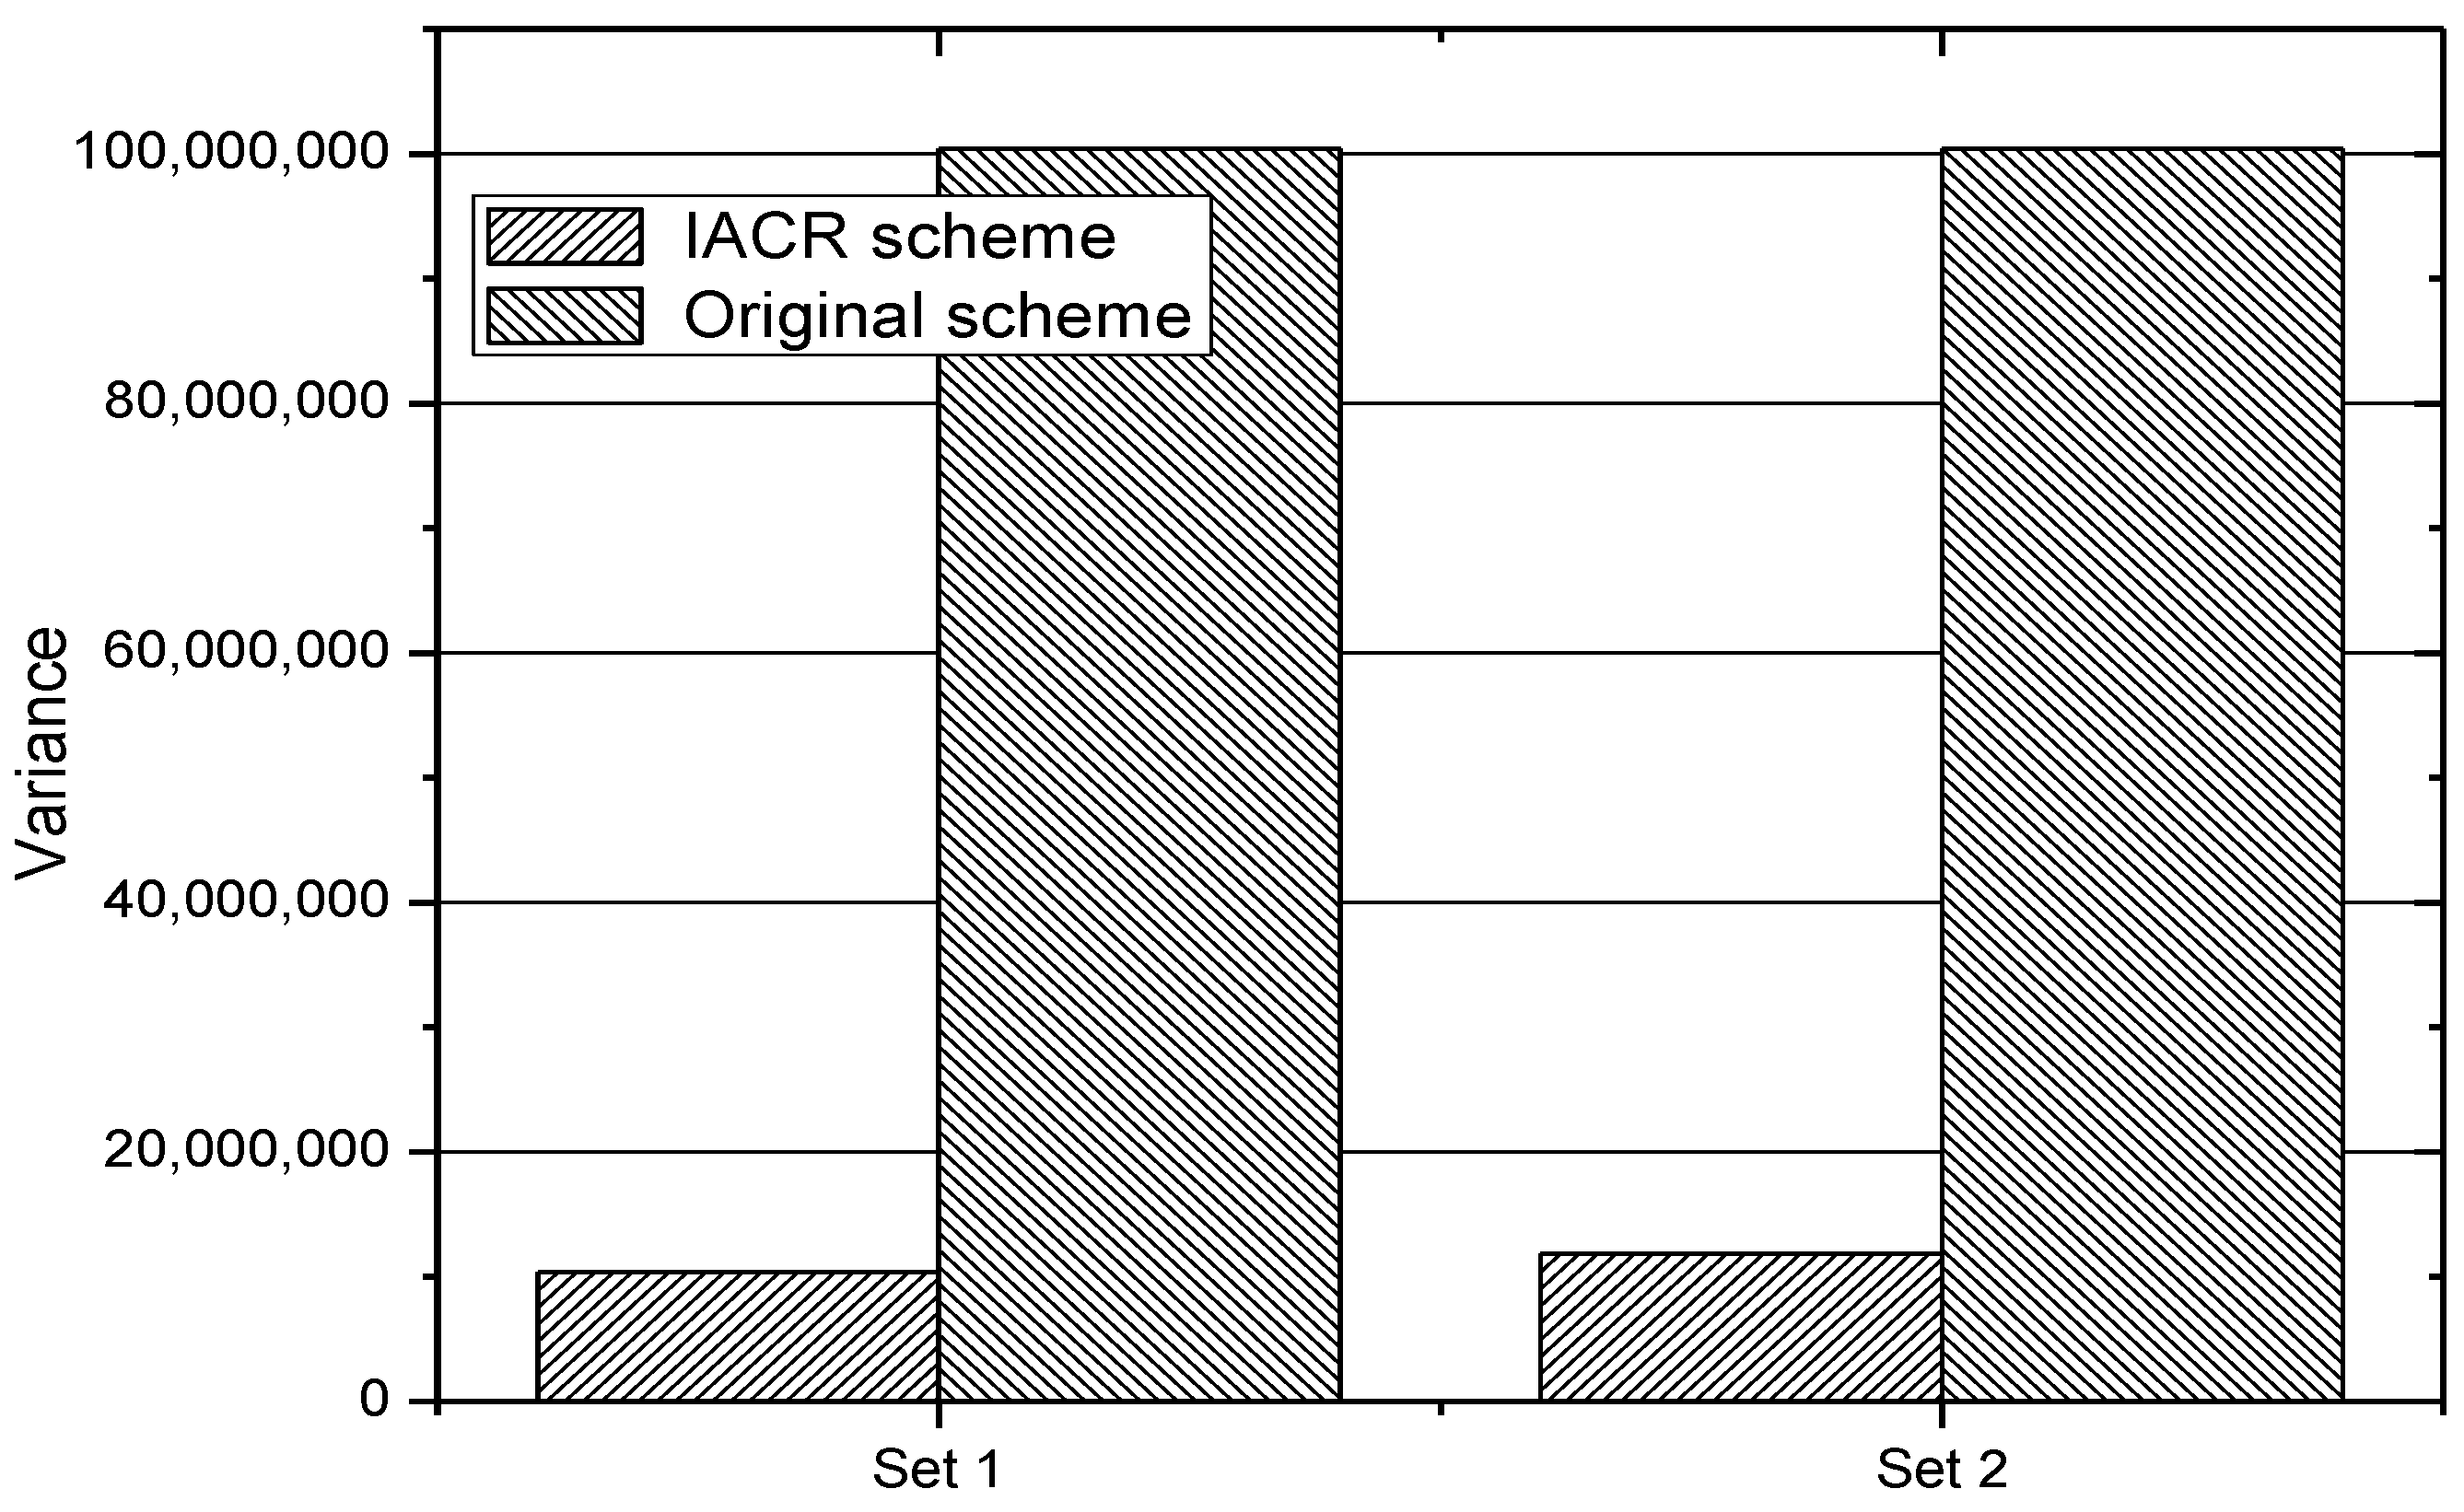
In addition, in order to prove that the proposed IACR scheme can make the routers in the whole network reach load balancing, which means that the numbers of both routers with high load and routers with low load decrease, we calculate the variances of both the original routing scheme and the IACR scheme for Set 1 and Set 2 when facing 100,000 and 200,000 packages. The results are shown in Figure 15. It could be concluded from this figure that the IACR scheme has much less variance than the original routing scheme has, which means that the routers in the whole network reach load balancing and the average ratio of the usage of every router is improved in the IACR scheme.
5.4. The Traveling Distance and Time of IACR
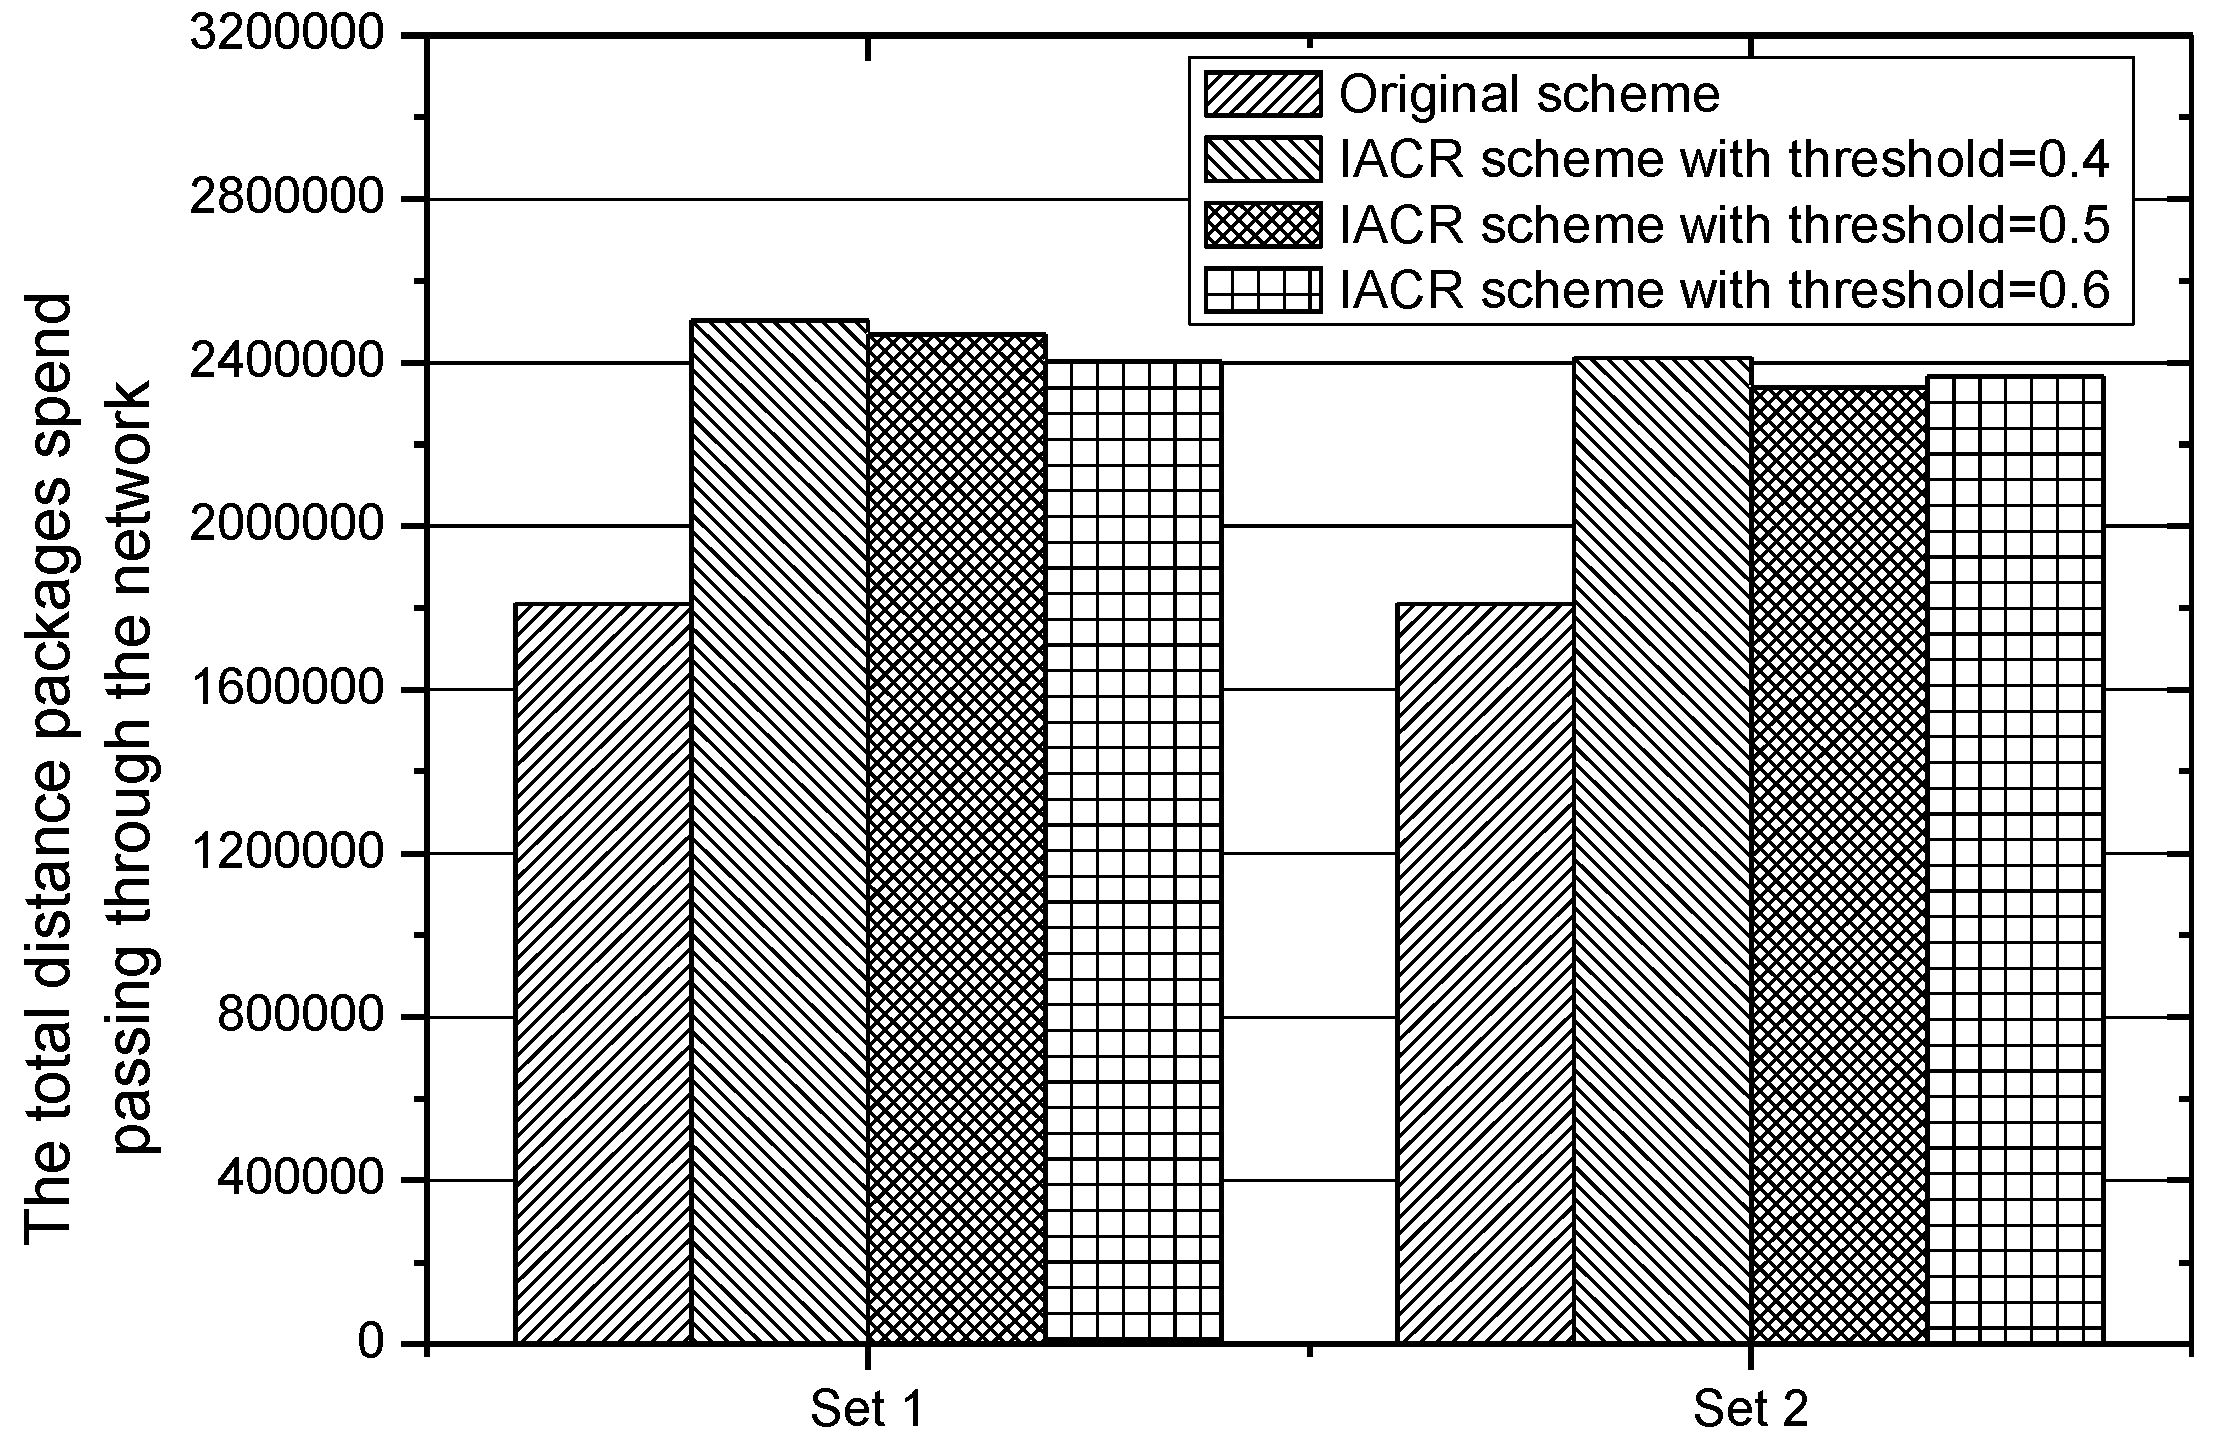
In order to judge whether our proposed IACR scheme is effective, another criterion proposed by us in Section 3.3 is the total transmission time, except for the number of packages and the load balancing. A key factor that plays an important role in transmission time is the routing distance. Figure 16 depicts the total routing distance, which all packages transmitted from the start router to the data center would take in IACR schemes with different and the original routing scheme. It is found that the total routing distance is 1,810,717 in the original routing scheme because of the Dijkstra algorithm, but the distance in IACR approaches with different parameters increases by around 38.3%. Therefore, the longer total distance is considered to be a disadvantage of the IACR scheme.
According to Equation (5), another key factor determining the transmission time is the number of packages. Firstly, for the sake of simplicity, we assume that the speed of transmitting a package is one. Then the total time that all packages would spend travelling from start routers to the data center is calculated and depicted in Figure 17. It shows that, though the original routing scheme has a much shorter routing path, it would still cost 1,810,717 m to send all the packages from the start routers to the data center. Although it takes a longer journey to transmit all the packages to the data center in IACR schemes with different parameters, the total time it costs is around 1,147,424.62 m, which is 36.4% less than the original routing scheme would cost. This is because the IACR scheme can compress those packages as much as possible, so it can lower the time to deliver all packages across even a much longer journey with the same speed.
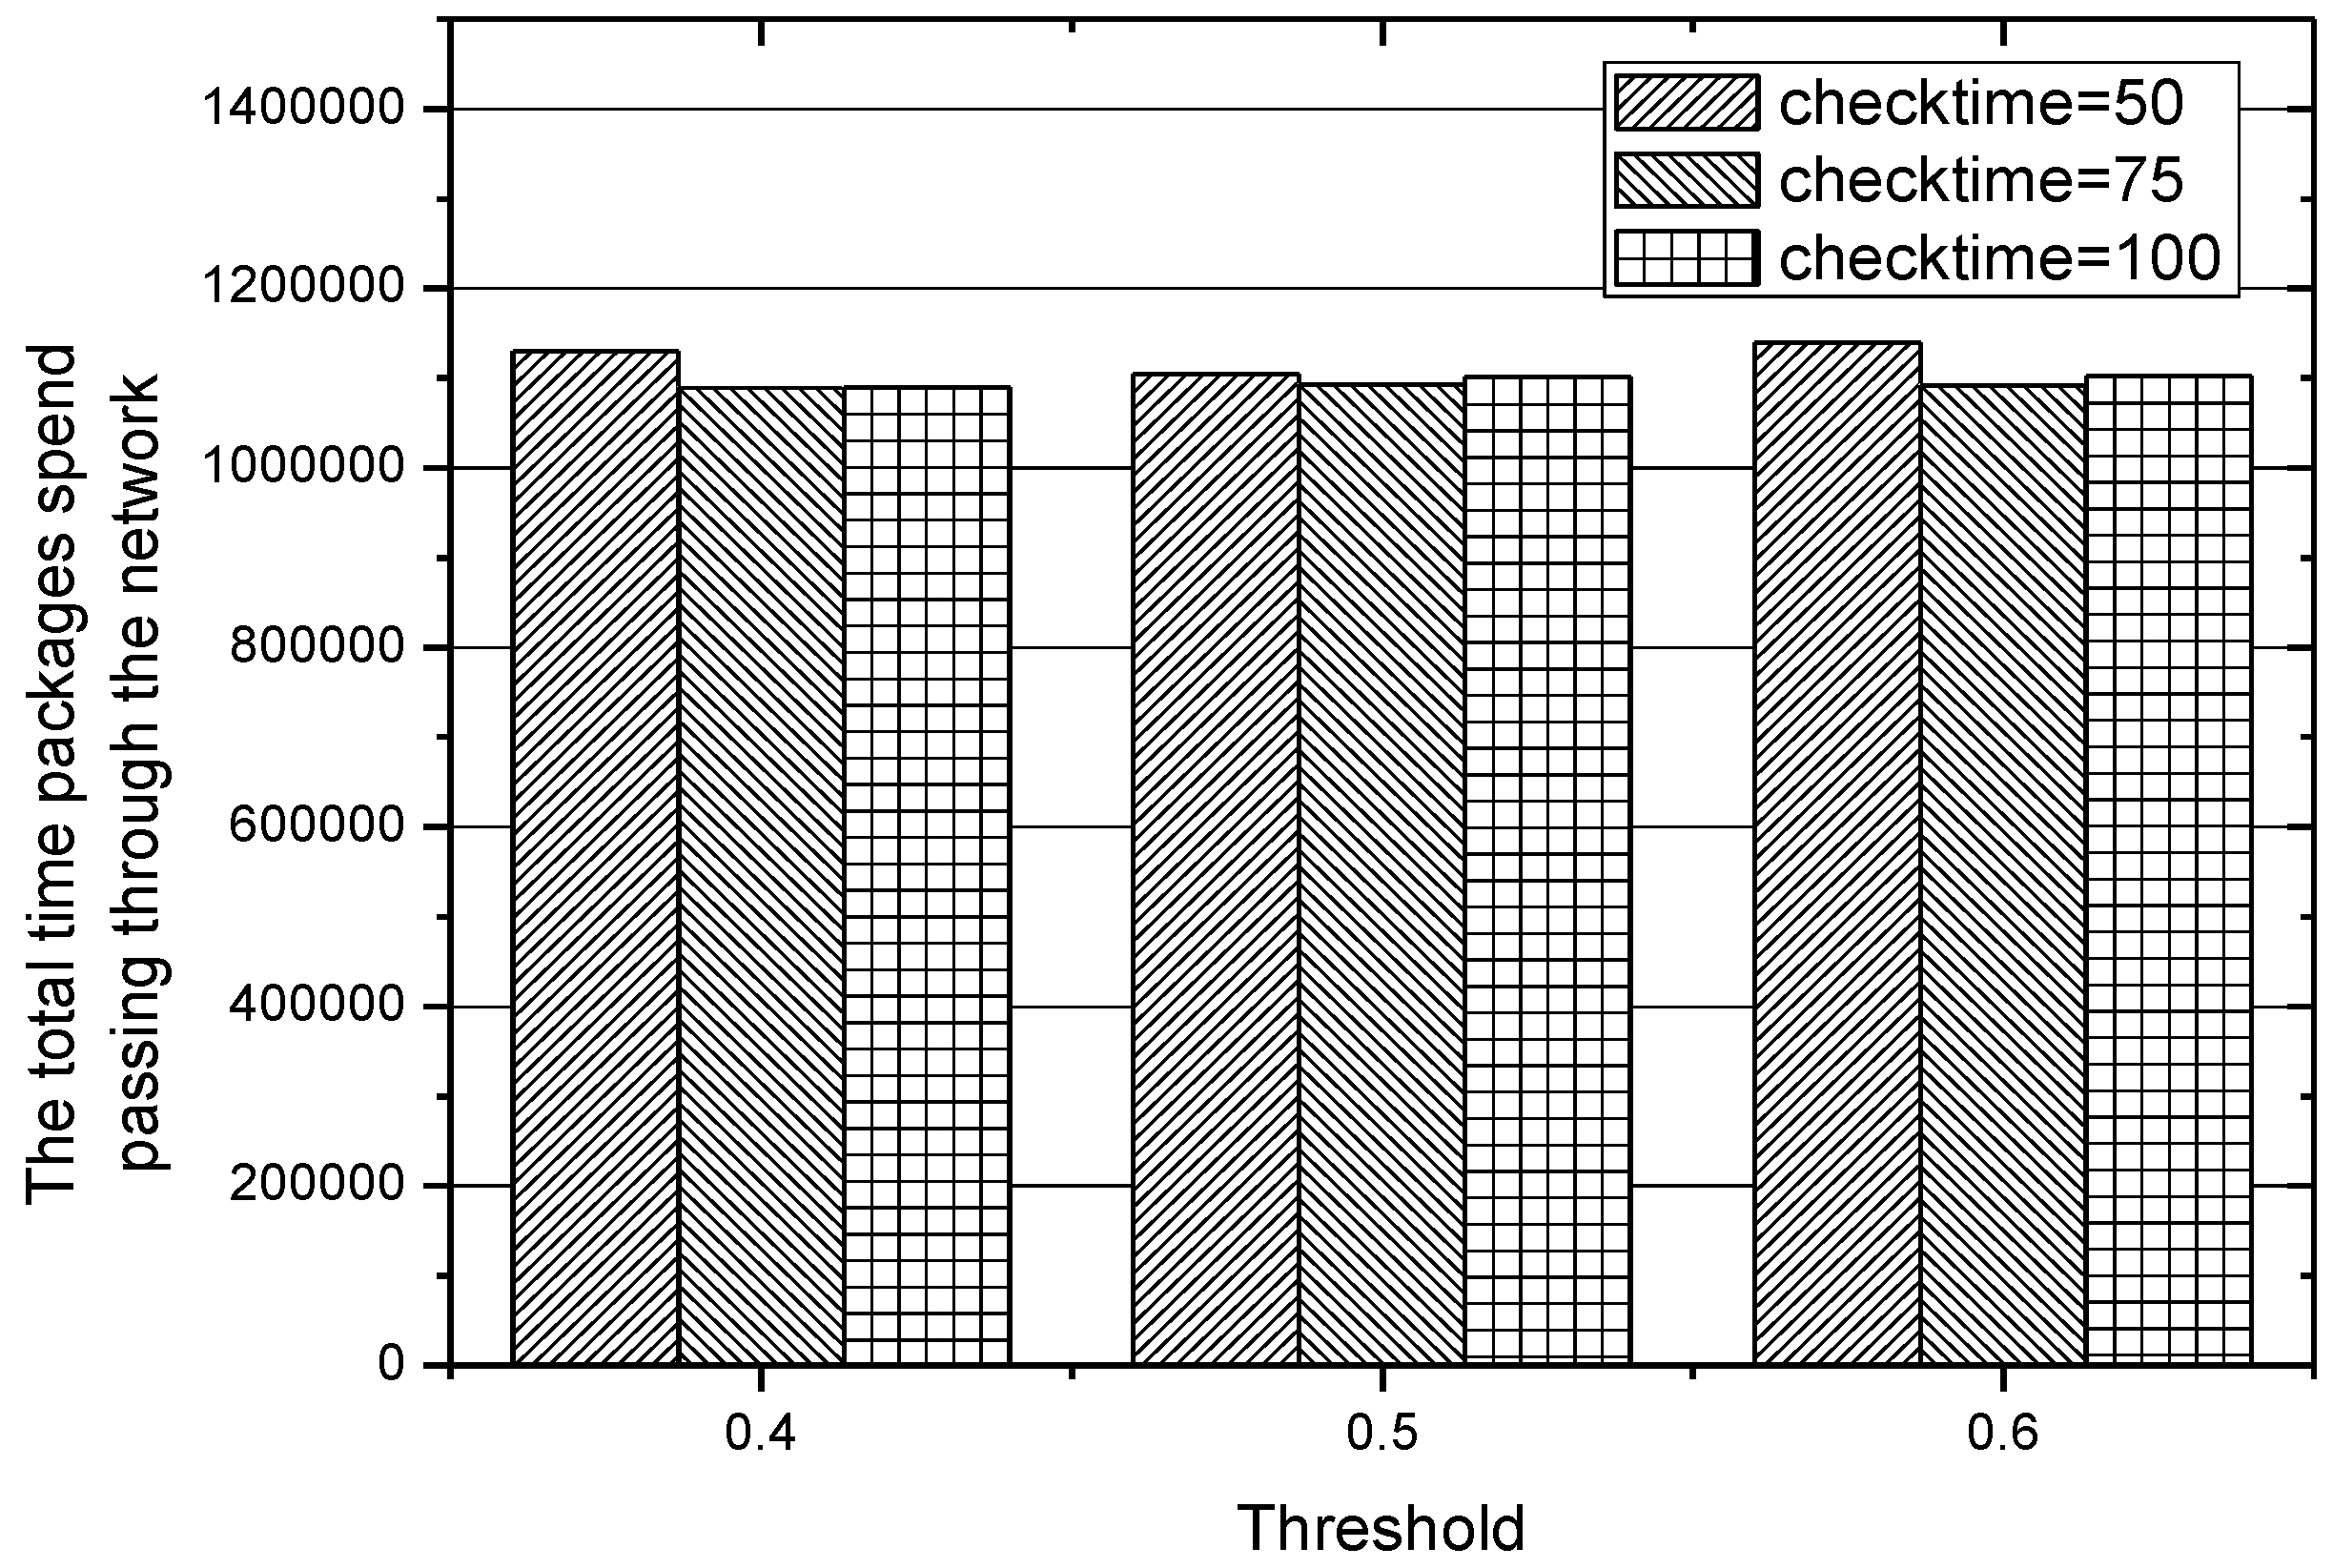
5.5. Adjustment to Parameters of IACR
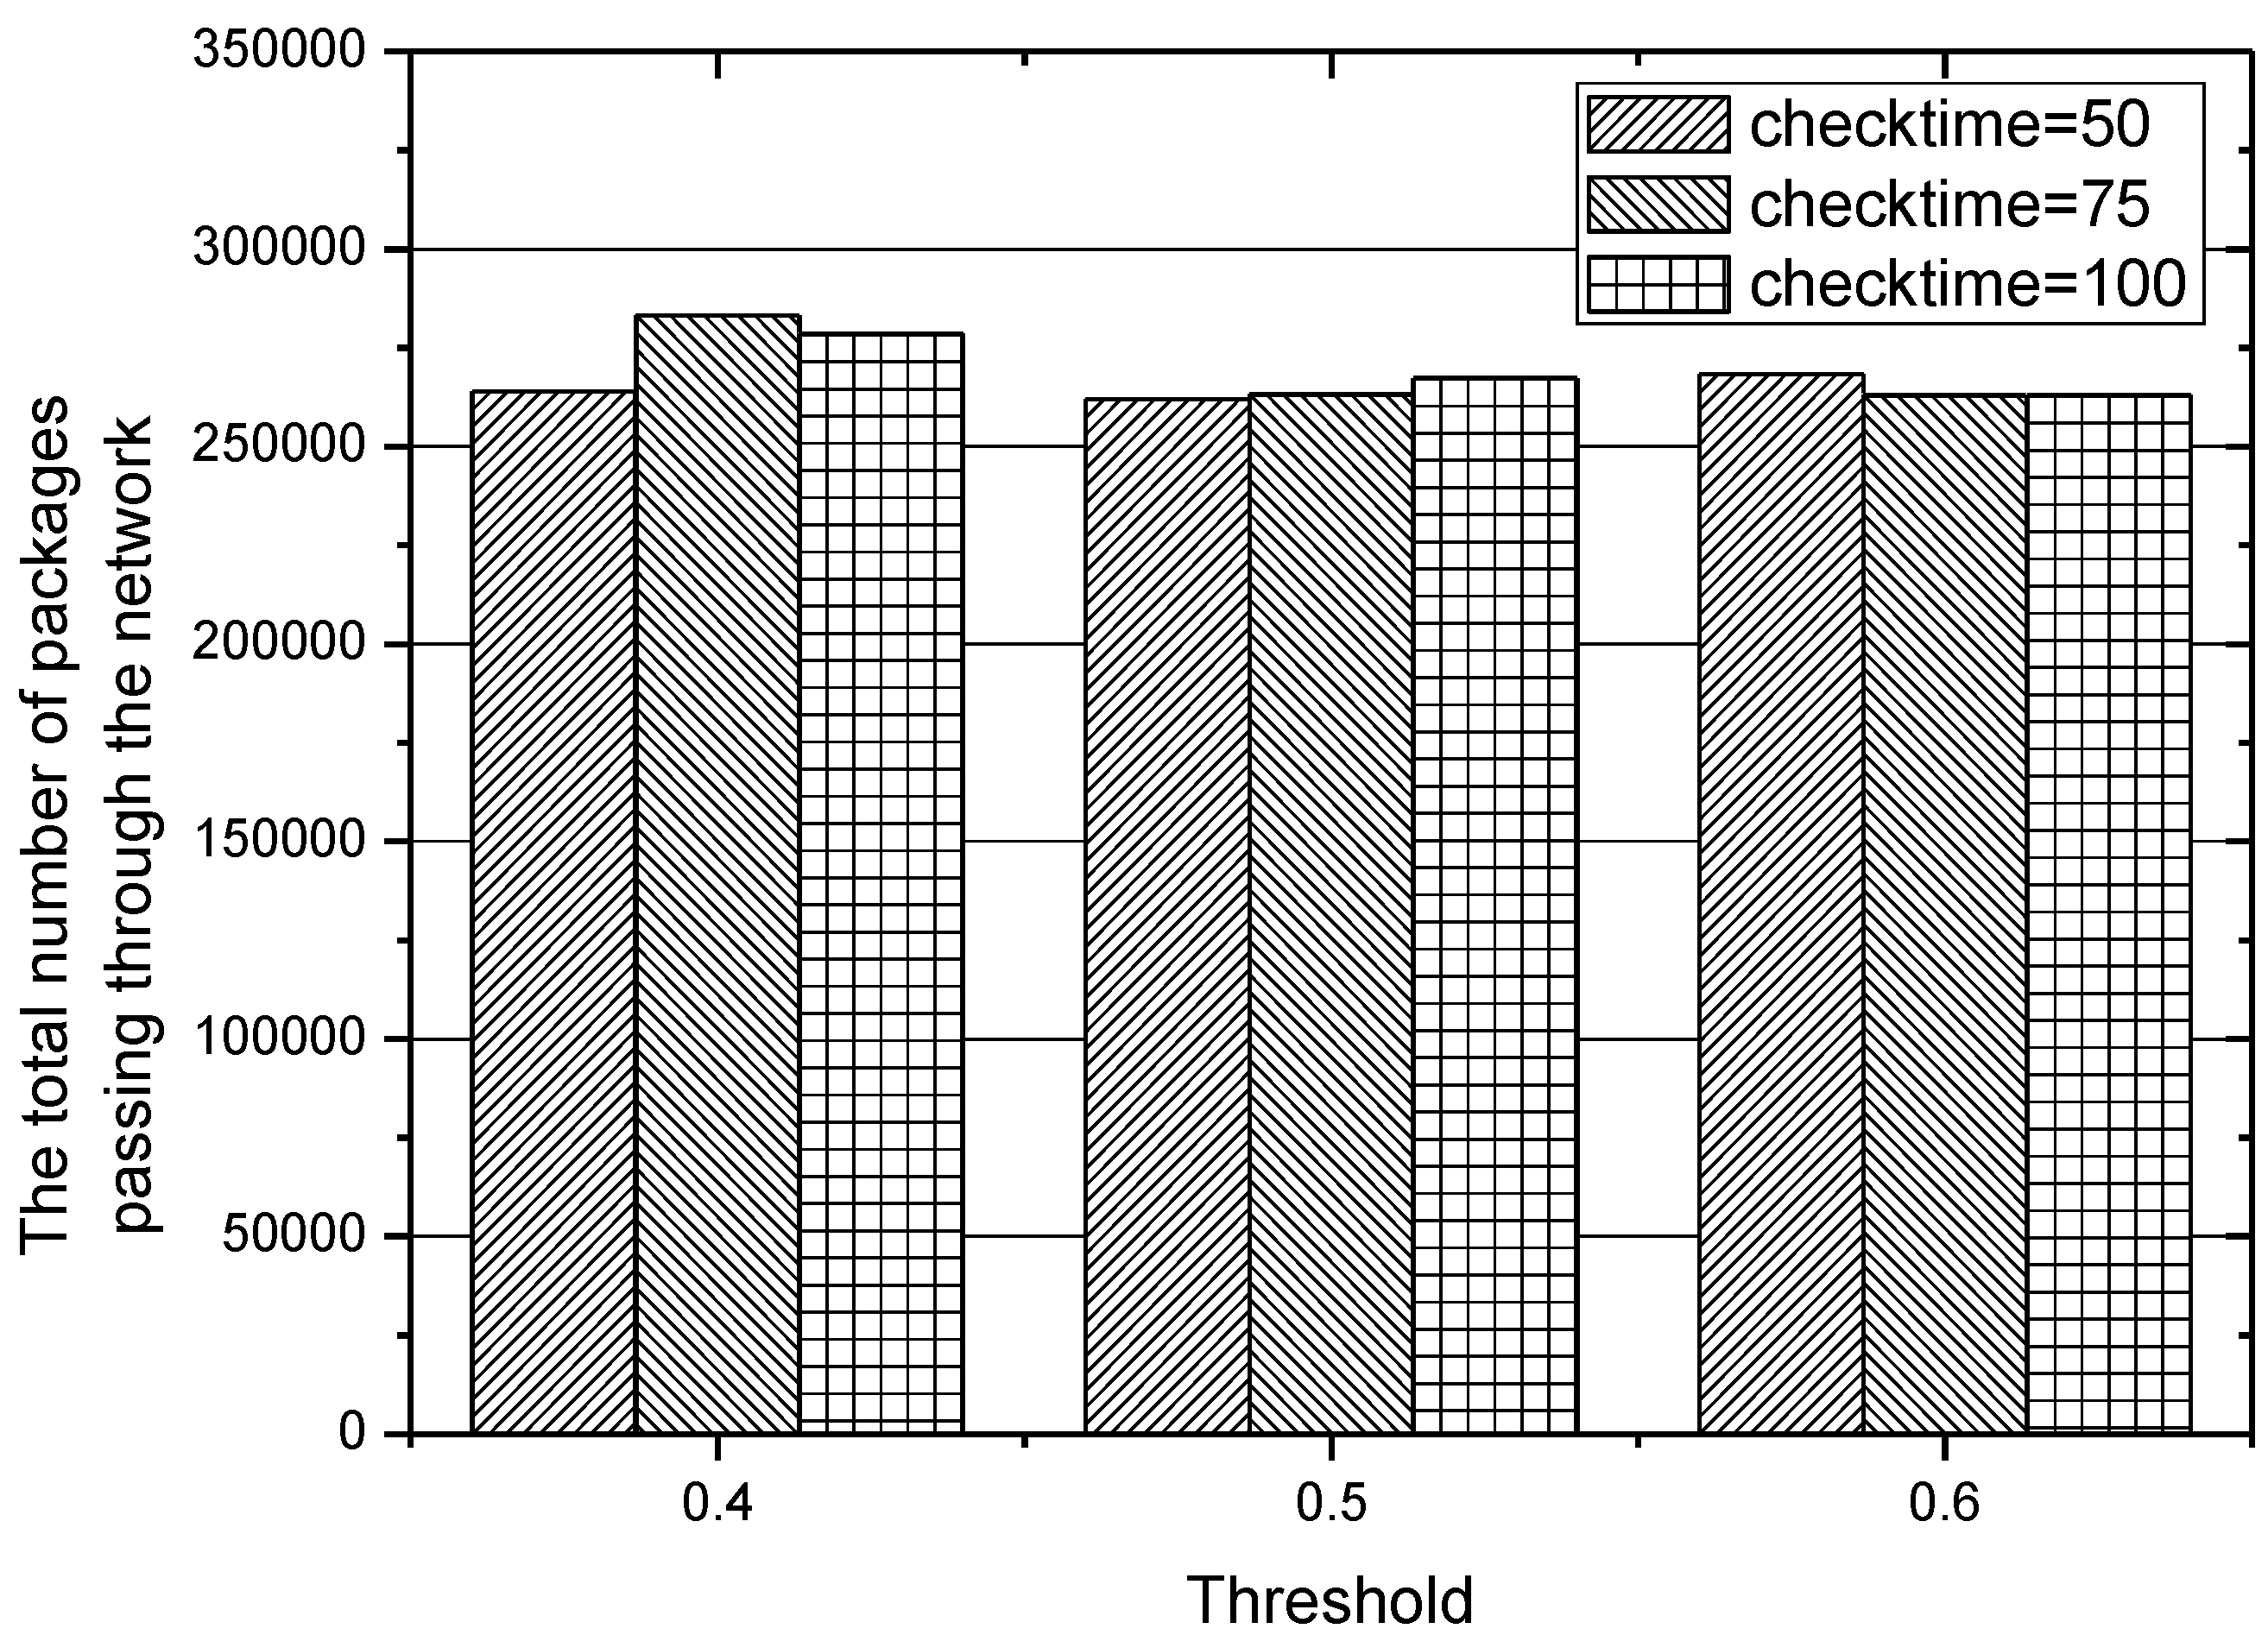
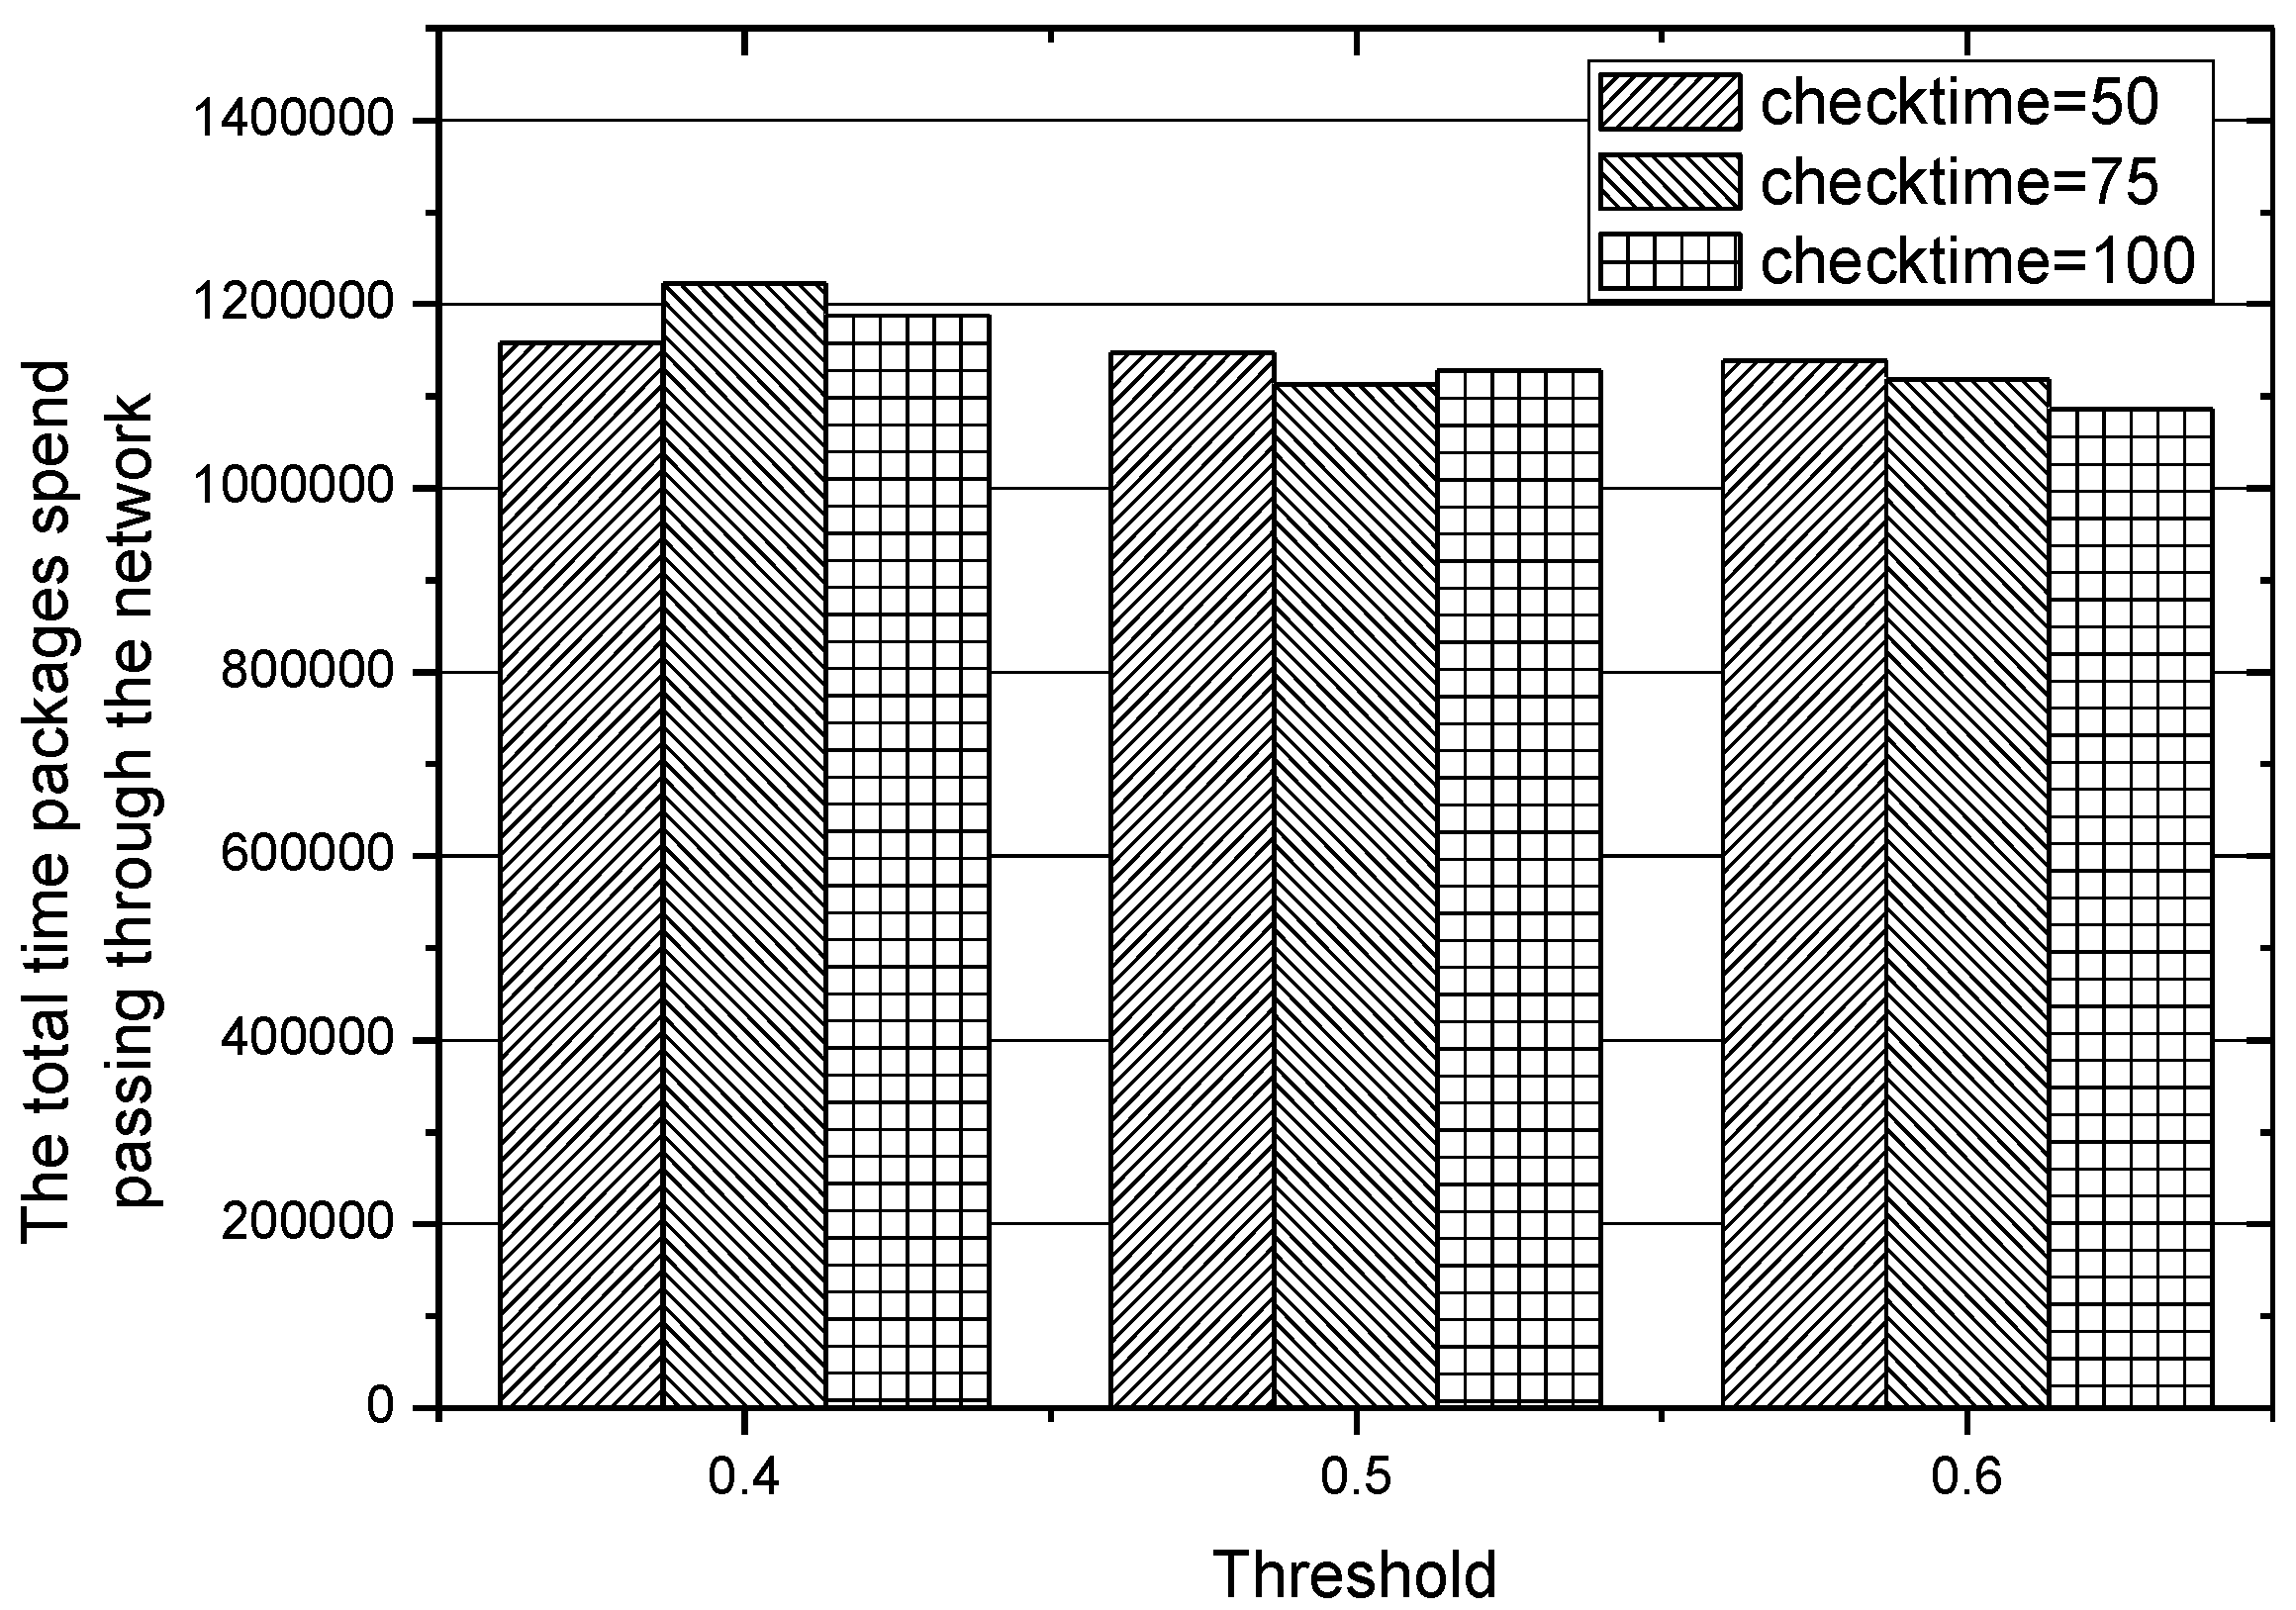
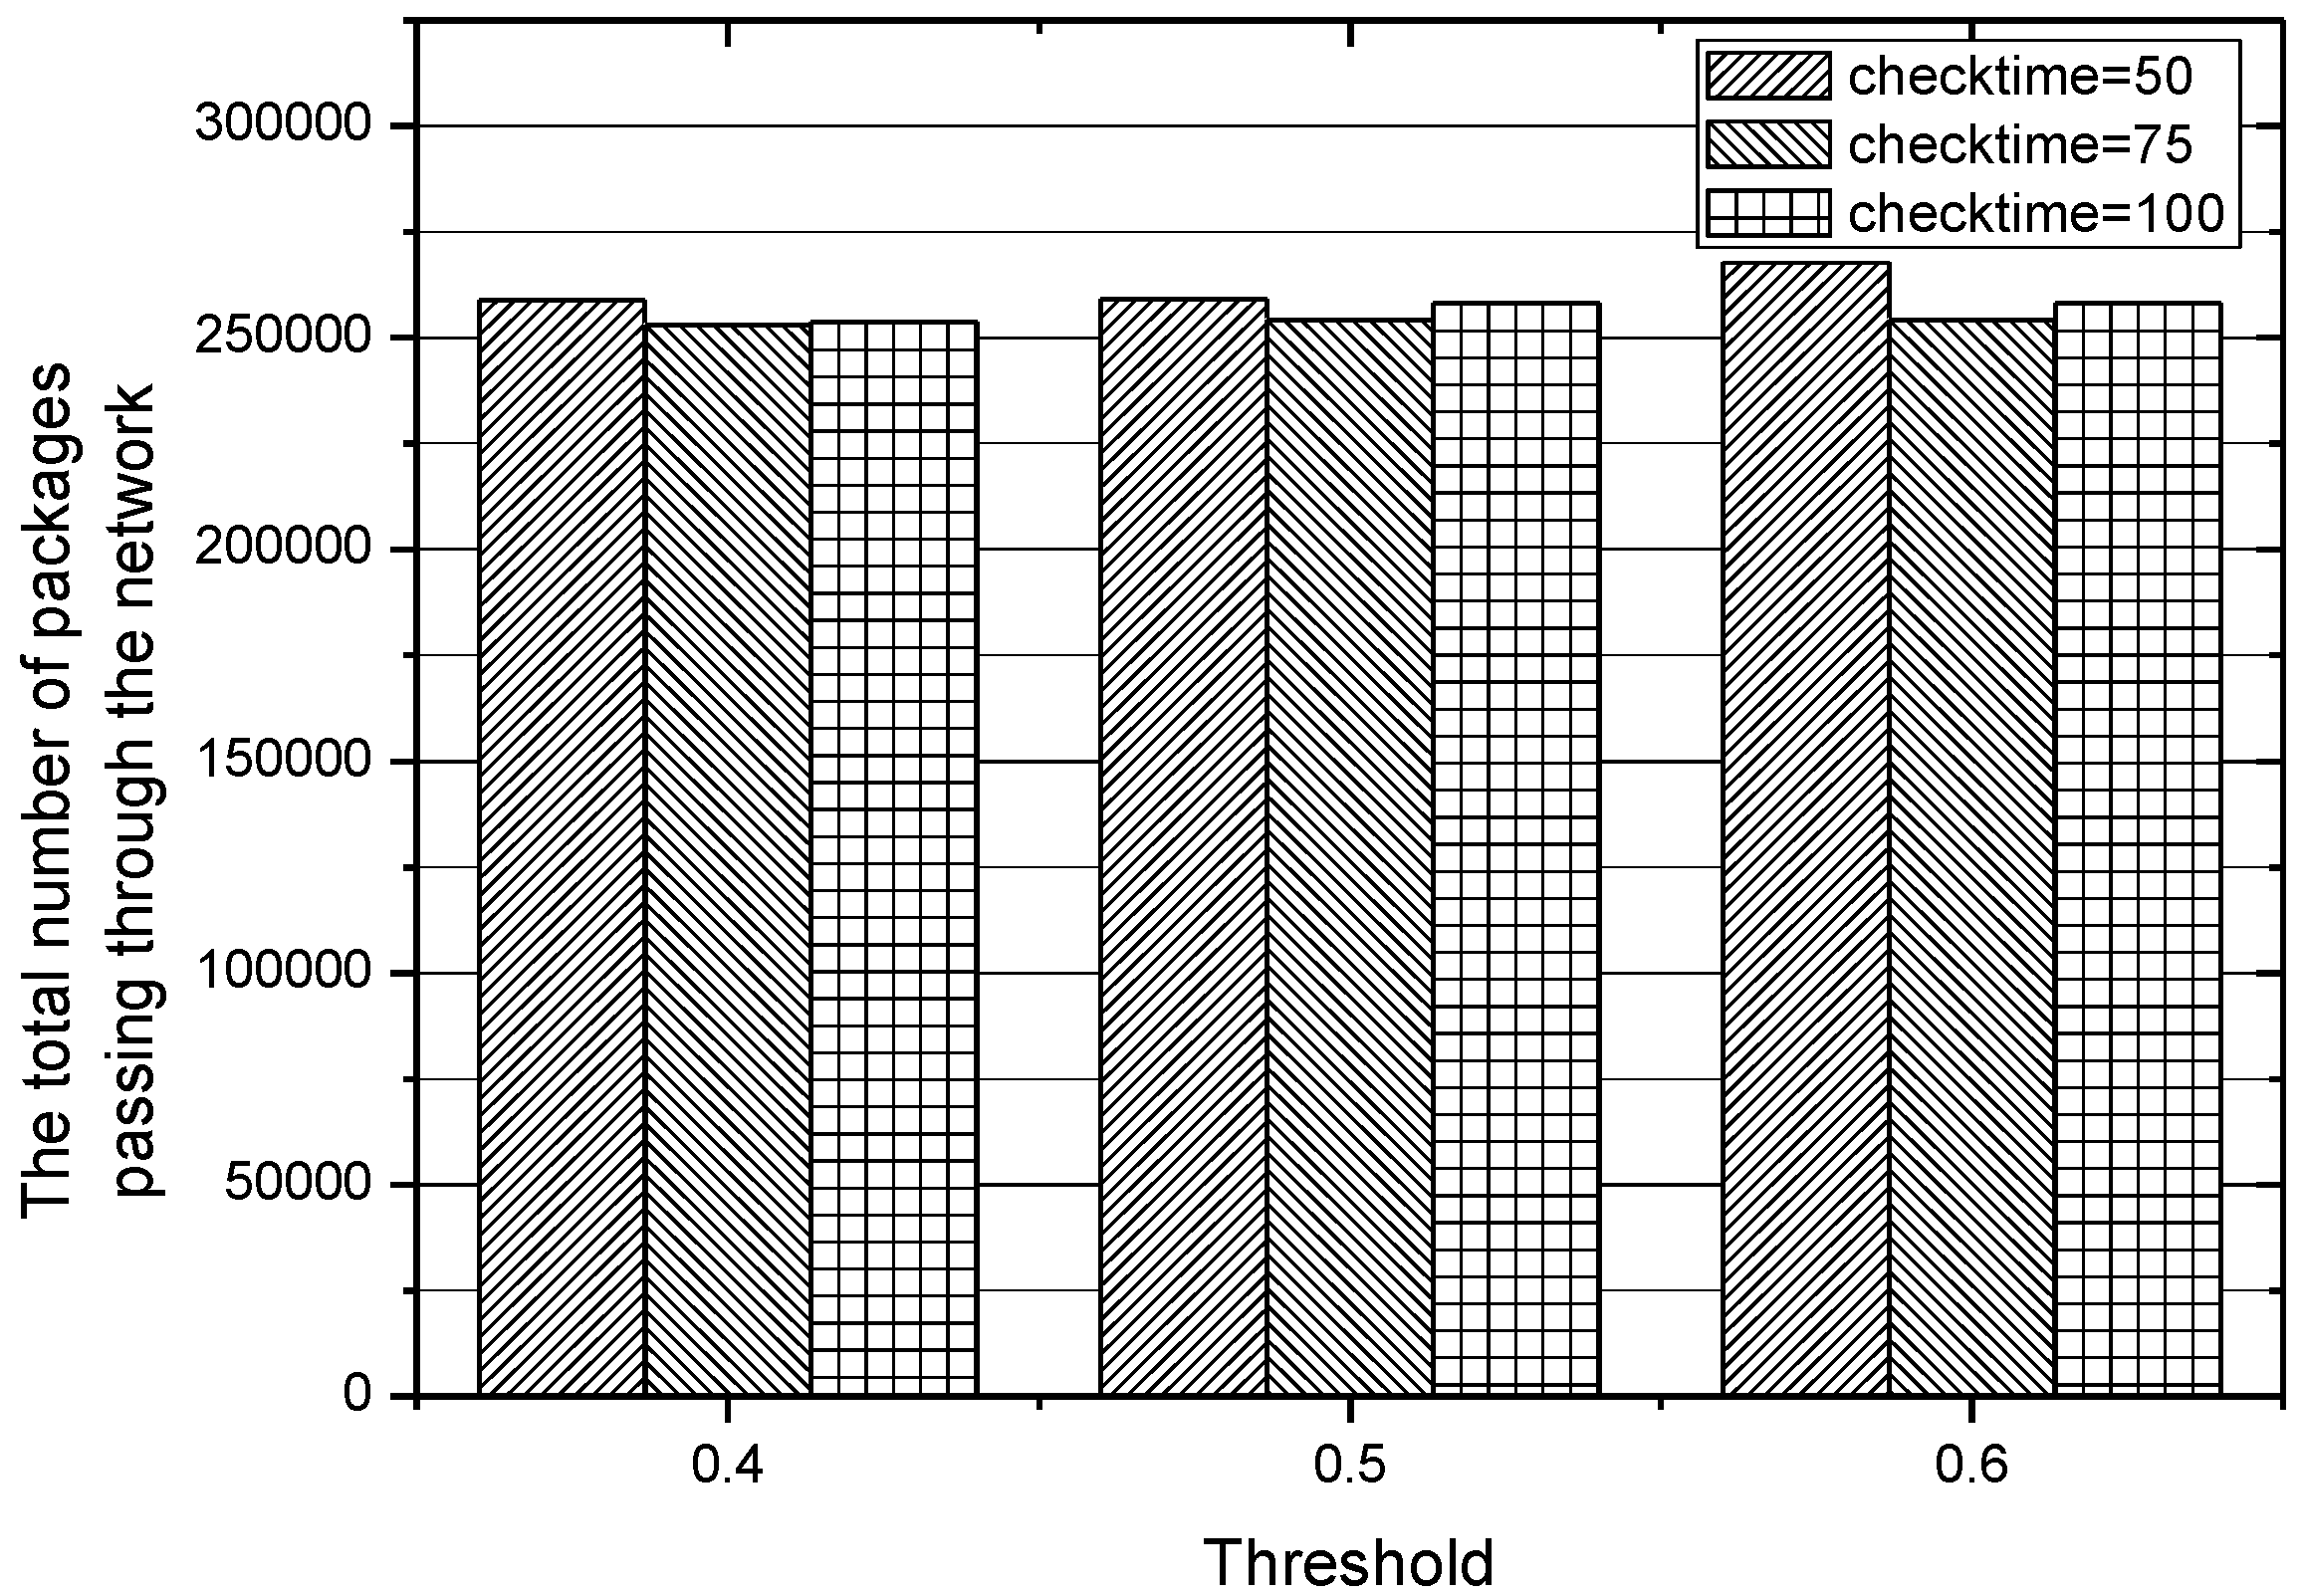
In the experiments conducted before, the different values of threshold , which plays an important role in choosing an appropriate routing path, lead to different performances of the IACR scheme, so we also make more adjustments to the length of the time interval of checking those existing routing paths, that is, checking those routing paths when 50, 75, and 100 packages have been transmitted to the data center. The results obtained in Set 1 are depicted in Figure 18 and Figure 19, while the results obtained in Set 2 are depicted in Figure 20 and Figure 21. We can conclude that the IACR scheme performs differently with different parameters. When the threshold , is 0.5 and when the routing paths are checked after 75 packages are transmitted, the performance of the IACR scheme is much better than the performance of other schemes.
5.6. Dynamic Changes in Backbone Routing Paths
What we would like to achieve when designing the IACR scheme is that a few dynamic changes happen in the network during transmission. If a router fails to find the most appropriate routing path when package arrives, the IACR scheme will help build a new backbone routing path . If there exists a routing path that never relays any packages in a period of time, this routing path is supposed to be deleted, all the routers it occupies will be free, and the corresponding record in the routing table will be revoked. Therefore, dynamic changes happen to the whole network according to the type of arrived packages in the IACR scheme.
For the sake of convenience of presentation, the changes happening in the network when 100,000 packages are transmitted to the data center in Set 1 will be taken as an example to show how the IACR schemes makes dynamic changes in the routing paths with different arrived packages. Figure 22 shows the topological structure of the whole network and the backbone routing paths in the network when the number of routing paths reaches the upper limit for the first time. Except the paths in black, different kinds of routing paths are presented in different colors. Routing paths are used to relay packages that are similar to them, that is, having the same AID as the routing path. Additionally, a router could be only located in two routing paths at most. Figure 23 shows the topological structure of the whole network and the backbone routing paths in the network when all 100,000 packages have already been transmitted to the data center. Different colors, except black, are also used to present different paths. Compared to Figure 22, some changes happen to the backbone routing paths. A few routing paths are deleted because they are not used, while a few are built because they are needed, but there are still some routing paths existing until the end such as . It is the dynamic changes characteristic of that IACR scheme that make sure it will perform well and steadily, even when facing sudden large data traffic or changes in the topological structure of the network.
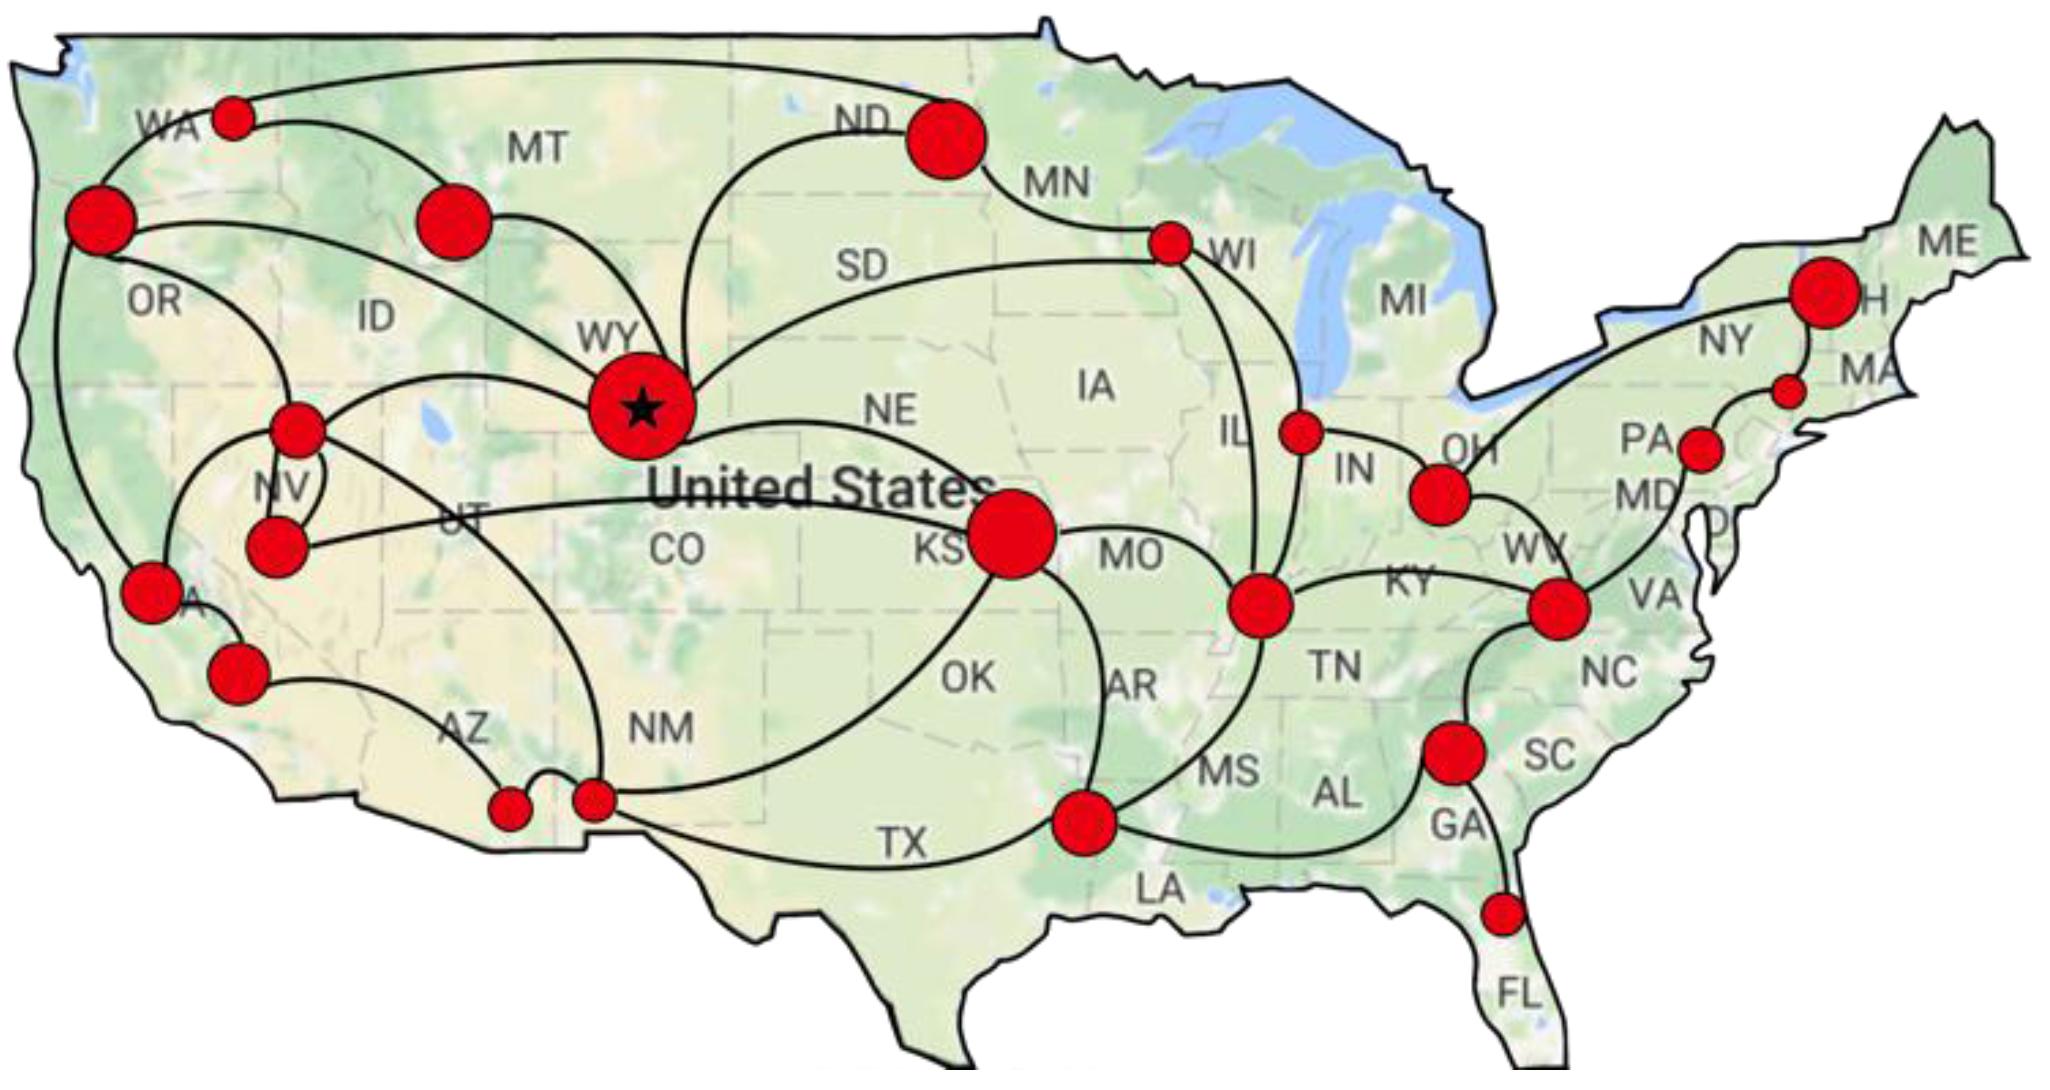
5.7. Experiment with American Network
Further experiments are conducted to prove the effectiveness and feasibility of our proposed IACR approach with the topological structure of the American network, which was downloaded online [49]. For the sake of simplicity, the original network we downloaded is simplified. As is shown in Figure 24, the red circles are both routers and crowd sensing devices, and the red circle with a star is the data center.
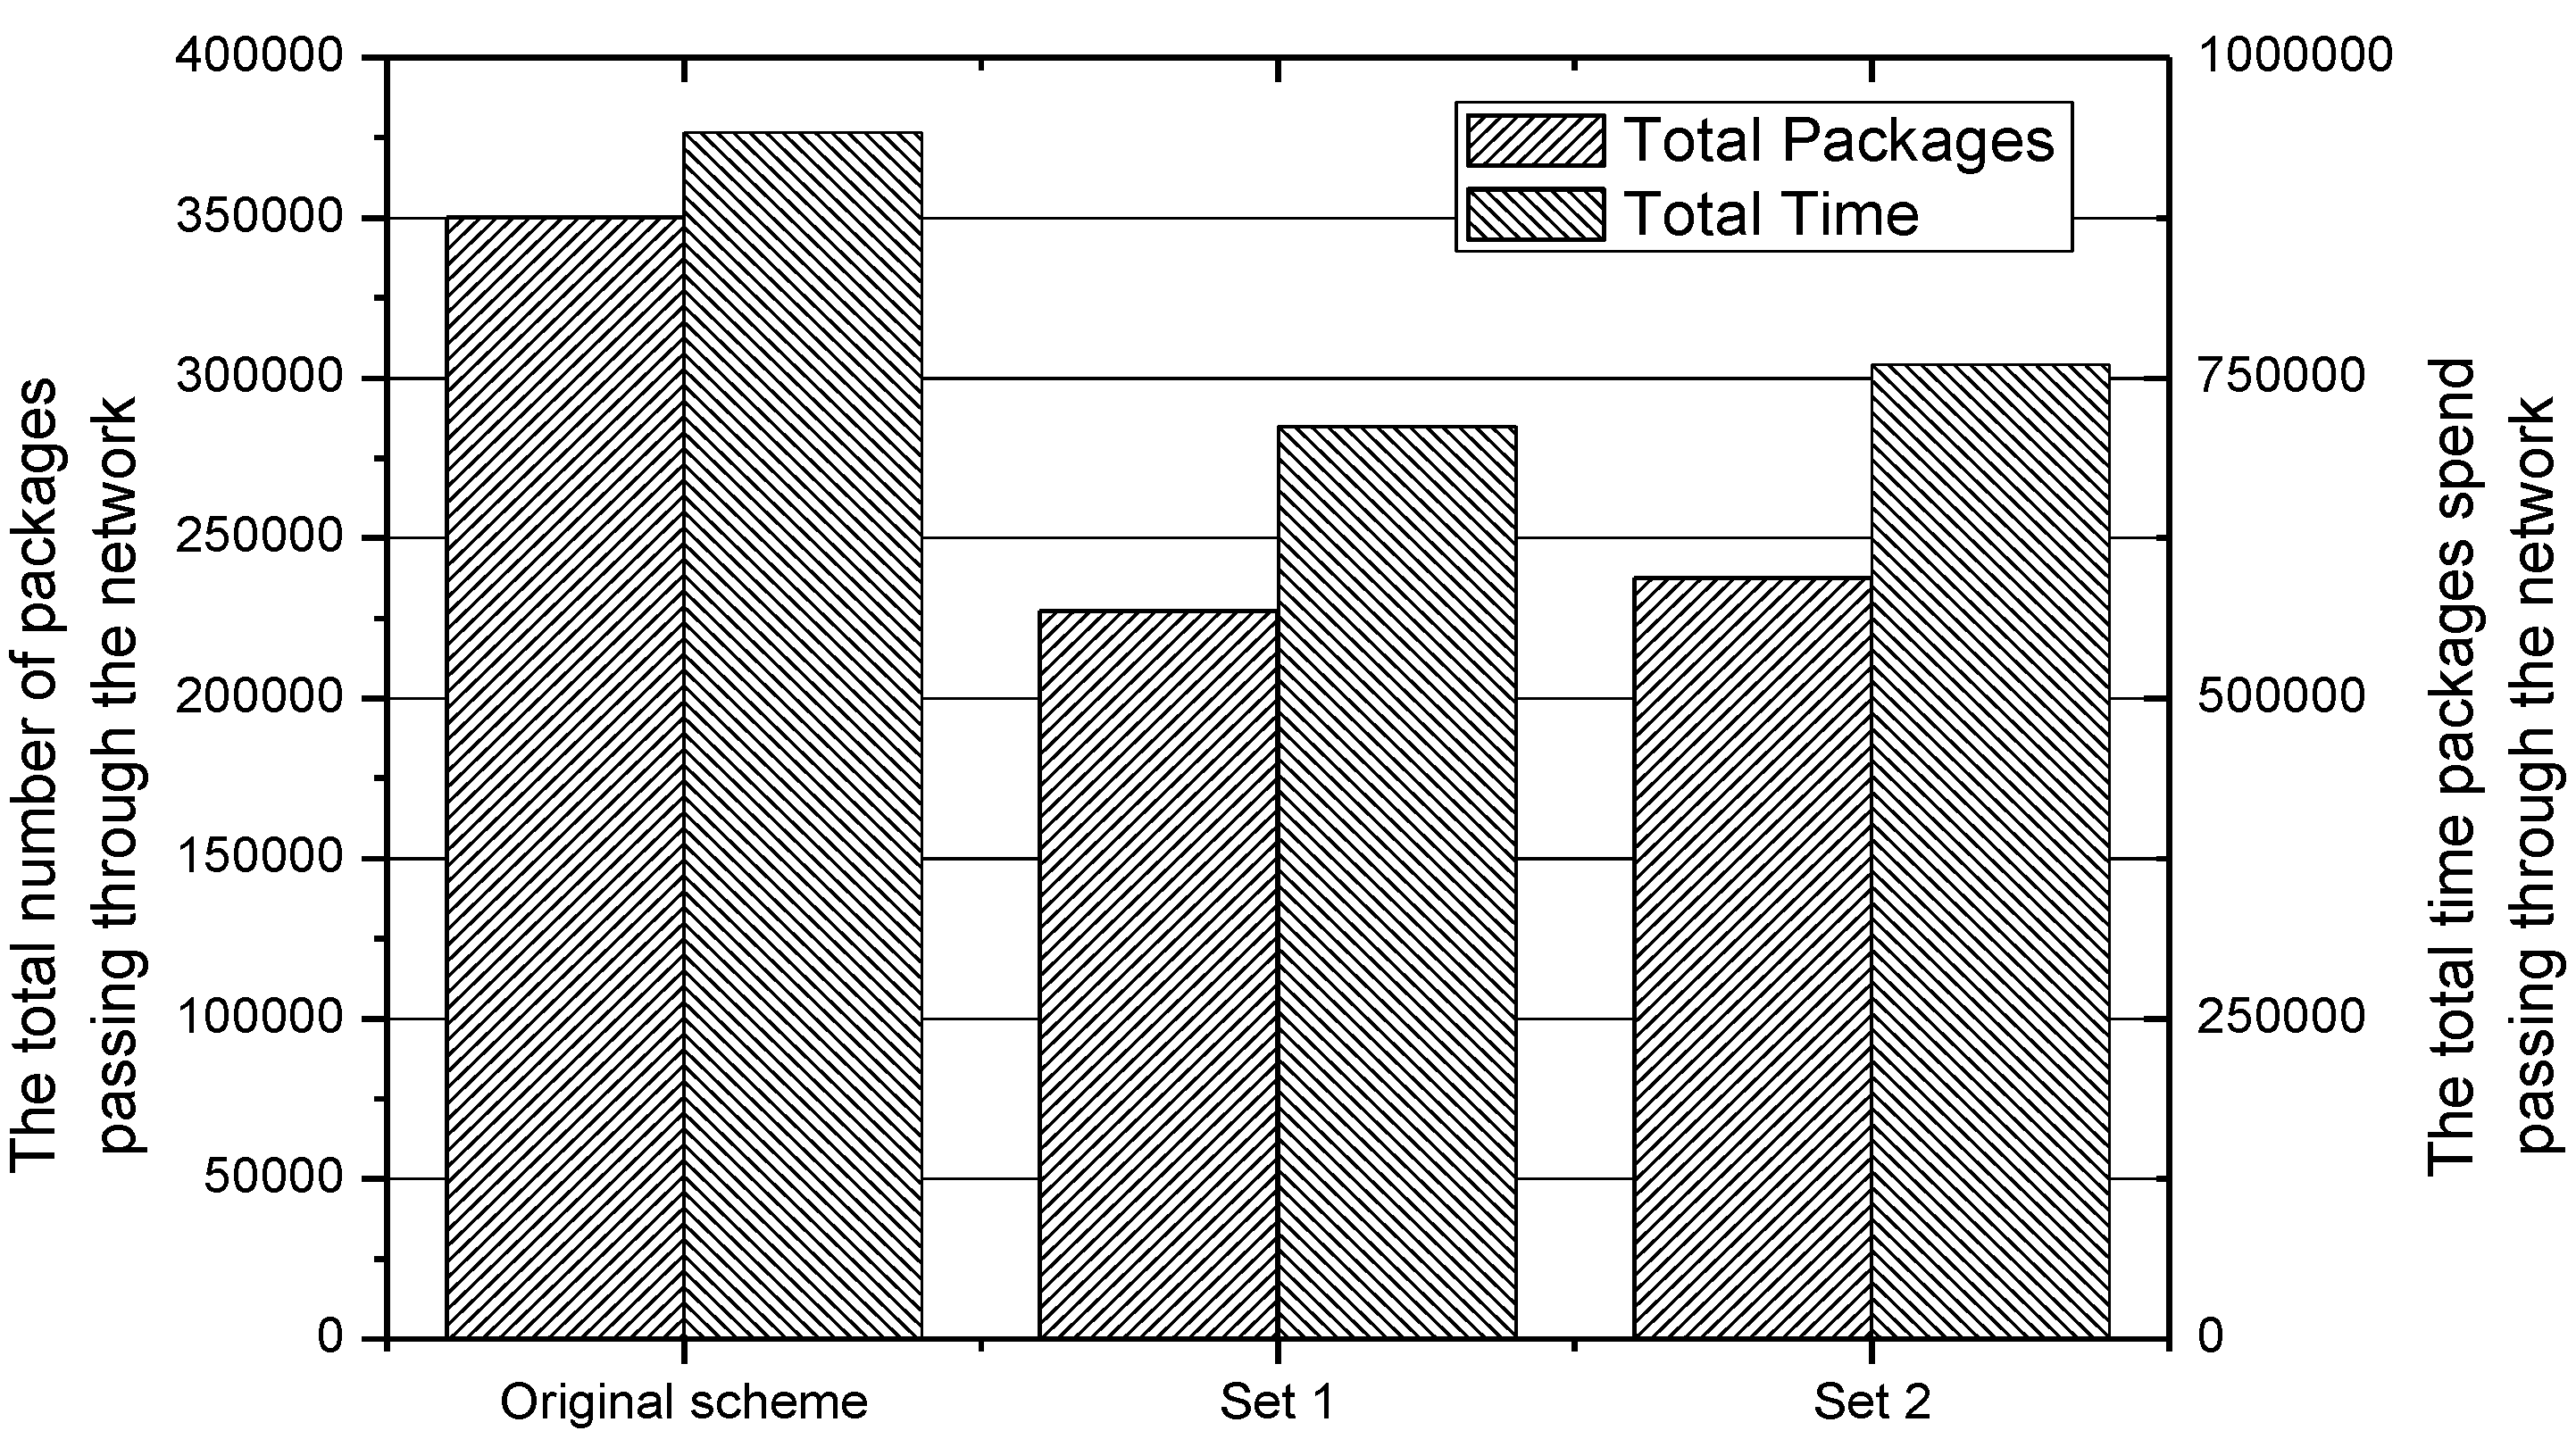
As we did before, 100,000 packages and their corresponding start routers in the network are generated randomly for Set 1 and Set 2. After transmitting these packages in the IACR scheme and the original routing scheme, we obtain four figures with the data. Figure 25 and Figure 26 depict the total number of packages forwarded by every router for Set 1 and Set 2, respectively. Similar to what we found before, our proposed IACR scheme performs much better than the original routing scheme. The number of packages forwarded by most of routers decreases, and the differences between any two routers are also reduced. It can be concluded from Figure 27 that, no matter whether in Set 1 or Set 2, the variance of the number of packages forwarded in the IACR scheme is always much less than the variance in the original routing scheme. This means that the balance of load in the network has been achieved in the IACR scheme. As shown in Figure 28, the total number of packages in the network and the total transmission time are both reduced in the IACR scheme compared to the original routing scheme.
According to the experiments conducted in a new network, we comes to a conclusion that our proposed IACR scheme could, not only reduce the number of packages in the network to release the pressure and keep load balancing, but also reduce the transmission time to improve the efficiency of transmission in a different network.
6. Conclusions and Future Work
In the era in which the Internet of Things is developing at a high speed, the amount of data that needs to be transmitted to the data center through networks increases greatly, which causes congestions to happen in the network frequently. As a result, how to reduce the amount of data to be forwarded in the network becomes an intractable problem. In this paper, an intelligent aggregation based on content routing (IACR) scheme is proposed. This scheme would aggregate those packages with high similarity to a specific backbone routing path intelligently and compress these similar packages as much as possible so as to release the pressure on the network and lower the transmission time. When a package arrives at a network, routers will pick up a routing path with the help of the IACR scheme. In addition to taking the similarity into consideration, the IACR scheme also takes the distance between the start router and the target routing path as a criterion. Meanwhile, the IACR scheme could also make dynamic changes in existing routing paths in the network, as we demonstrate in Section 5.6. After the experiments and analysis we conducted, the total number of packages in the network decreased by 41.8% in our proposed IACR scheme. The pressure on the data center and the congestions happening in the network are released as well. However, compared with a traditional routing scheme, the distance that a package travels from the start router to the data center would be longer in the IACR scheme because of the function of shunting. Despite the longer distance, the total transmission time of all the packages is still reduced by 31.6% because of the decrease in the number of packages transmitted. Consequently, the IACR scheme is considered to be an effective and stable routing scheme.
With further analysis of the data, our IACR scheme can also be partially improved. Since it is taken into consideration that some adjustments are supposed to be done if no package passes along a backbone routing path over a period of time, some adjustments could also be made if some paths are overloaded during a period of time. For example, an extra path that has the same AID as the overloaded path could be built so that the effect of shunting can be further improved.
Acknowledgments
This work was supported in part by the National Natural Science Foundation of China (61772554, 61379110, 61370229, and 61370178); The National Basic Research Program of China (973 Program) (2014CB046305); the science and technology Projects of Guangdong Province, China under Grant Nos. 2016B010109008, 2016B030305004; the science and technology Projects of Guangdong Municipality, China under Grant Nos. 201604010003, 201604016019 and Guangdong Province Universities and Colleges Pearl River Scholar Funded Scheme (2015).
Author Contributions
Jiachen Xu designed the algorithms and wrote part of the manuscript. Ming Ma commented on the work. Xiao Liu commented on the work. Anfeng Liu conceived the work and wrote part of the manuscript. Tiang Wang and Changqin Huang commented on the work.
Conflicts of Interest
The authors declare no conflicts of interest.
References
- Liu, Y.; Liu, A.; Guo, S.; Li, Z.; Choi, Y.J.; Sekiya, H. Context-aware collect data with energy efficient in Cyber-physical cloud systems. Future Gener. Comput. Syst. 2017. [Google Scholar] [CrossRef]
- Wang, J.; Liu, A.; Zhang, S. Key Parameters Decision for Cloud Computing: Insights from a Multiple Game Model. Concurr. Comput. Pract. Exp. 2017. [Google Scholar] [CrossRef]
- Chen, M.; Ma, Y.; Song, J.; Lai, C.F.; Hu, B. Smart clothing: Connecting human with clouds and big data for sustainable health monitoring. Mob. Netw. Appl. 2016, 21, 825–845. [Google Scholar] [CrossRef]
- Su, Z.; Xu, Q.; Fei, M.; Dong, M. Game theoretic resource allocation in media cloud with mobile social users. IEEE Trans. Multimed. 2016, 18, 1650–1660. [Google Scholar] [CrossRef]
- Li, H.; Liu, D.; Dai, Y.; Luan, T.H. Engineering searchable encryption of mobile cloud networks: When QoE meets QoP. IEEE Wirel. Commun. 2015, 22, 74–80. [Google Scholar] [CrossRef]
- Li, H.; Yang, Y.; Luan, T.H.; Liang, X.; Zhou, L.; Shen, X.S. Enabling fine-grained multi-keyword search supporting classified sub-dictionaries over encrypted cloud data. IEEE Trans. Dependable Secur. Comput. 2016, 13, 312–325. [Google Scholar] [CrossRef]
- Chen, M.; Hao, Y.; Hwang, K.; Wang, L.; Wang, L. Disease Prediction by Machine Learning over Big Healthcare Data. IEEE Access 2017, 5, 8869–8879. [Google Scholar] [CrossRef]
- Shojafar, M.; Canali, C.; Lancellotti, R.; Abawajy, J. Adaptive computing-plus-communication optimization framework for multimedia processing in cloud systems. IEEE Trans. Cloud Comput. 2016. [Google Scholar] [CrossRef]
- Kwak, J.; Park, J.H.; Sung, Y. Unmanned Aerial Vehicle Flight Point Classification Algorithm Based on Symmetric Big Data. Symmetry 2017, 9, 1. [Google Scholar] [CrossRef]
- Shojafar, M.; Cordeschi, N.; Baccarelli, E. Energy-efficient adaptive resource management for real-time vehicular cloud services. IEEE Trans. Cloud Comput. 2016. [Google Scholar] [CrossRef]
- Zhuang, Y.; Fong, S.; Yuan, M.; Sung, Y.; Cho, K.; Wong, R.K. Predicting the next turn at road junction from big traffic data. J. Supercomput. 2017, 73, 3128–3148. [Google Scholar] [CrossRef]
- Liu, A.; Chen, Z.; Xiong, N. An adaptive virtual relaying set scheme for loss-and-delay sensitive WSNs. Inf. Sci. 2017. [Google Scholar] [CrossRef]
- Liu, X.; Zhao, S.; Liu, A.; Xiong, N.; Vasilakos, A.V. Knowledge-aware Proactive Nodes Selection Approach for Energy management in Internet of Things. Future Gener. Comput. Syst. 2017. [Google Scholar] [CrossRef]
- Liu, A.; Zhang, Q.; Li, Z.; Choi, Y.J.; Li, J.; Komuro, N. A green and reliable communication modeling for industrial internet of things. Comput. Electr. Eng. 2017, 58, 364–381. [Google Scholar] [CrossRef]
- Liu, X.; Li, G.; Zhang, S.; Liu, A. Big Program Code Dissemination Scheme for Emergency Software-define Wireless Sensor Networks. Peer-to-Peer Netw. Appl. 2017. [Google Scholar] [CrossRef]
- Liu, Q.; Liu, A. On the hybrid using of unicast-broadcast in wireless sensor networks. Comput. Electr. Eng. 2017. [Google Scholar] [CrossRef]
- Liu, A.; Liu, X.; Tang, Z.; Yang, L.T.; Shao, Z. Preserving Smart Sink Location Privacy with Delay Guaranteed Routing Scheme for WSNs. ACM Trans. Embed. Comput. Syst. 2017, 16, 68. [Google Scholar] [CrossRef]
- Huang, C.; Ma, M.; Liu, Y.; Liu, A. Preserving Source Location Privacy for Energy Harvesting WSNs. Sensors 2017, 17, 724. [Google Scholar] [CrossRef] [PubMed]
- Liu, X.; Liu, Y.; Song, H.; Liu, A. Big data orchestration as a service networking. IEEE Commun. Mag. 2017, 55, 94–101. [Google Scholar]
- Chen, Z.; Liu, A.; Li, Z.; Choi, Y.J.; Sekiya, H.; Li, J. Energy-efficient Broadcasting Scheme for Smart Industrial Wireless Sensor Networks. Mob. Inf. Syst. 2017. [Google Scholar] [CrossRef]
- Liu, X.; Dong, M.; Ota, K.; Yang, L.T.; Liu, A. Trace malicious source to guarantee cyber security for mass monitor critical infrastructure. J. Comput. Syst. Sci. 2016. [Google Scholar] [CrossRef]
- Liu, A.; Liu, X.; Wei, T.; Yang, L.T.; Rho, S.C.; Paul, A. Distributed Multi-representative Re-Fusion approach for Heterogeneous Sensing Data Collection. ACM Trans. Embed. Comput. Syst. 2017, 16, 73. [Google Scholar] [CrossRef]
- Liu, X.; Liu, A.; Li, Z.; Tian, S.; Choi, Y.J.; Sekiya, H.; Li, J. Distributed Cooperative Communication Nodes Control and Optimization Reliability for Resource-Constrained WSNs. Neurocomputing 2017, 270. [Google Scholar] [CrossRef]
- Chen, X.; Xu, Y.; Liu, A. Cross Layer Design for Optimal Delay, Energy Efficiency and Lifetime in Body Sensor Networks. Sensors 2017, 17, 900. [Google Scholar] [CrossRef] [PubMed]
- Chen, X.; Ma, M.; Liu, A. Dynamic Power Management and Adaptive Packet Size Selection for IoT in e-Healthcare. Comput. Electr. Eng. 2017. [Google Scholar] [CrossRef]
- Xu, Y.; Chen, X.; Liu, A.; Hu, C. A Latency and Coverage Optimized Data Collection Scheme for Smart Cities Based on Vehicular Ad-hoc Networks. Sensors 2017, 17, 888. [Google Scholar] [CrossRef] [PubMed]
- Li, T.; Liu, A.; Huang, C. A similarity scenario-based recommendation model with small disturbances for unknown items in social networks. IEEE Access 2016, 4, 9251–9272. [Google Scholar] [CrossRef]
- Li, T.; Liu, Y.; Gao, L.; Liu, A. A Cooperative-based Model for Smart-Sensing Tasks in Fog Computing. IEEE Access 2017. [Google Scholar] [CrossRef]
- Liu, X.; Dong, M.; Ota, K.; Hung, P.; Liu, A. Service pricing decision in cyber-physical systems: Insights from game theory. IEEE Trans. Serv. Comput. 2016, 9, 186–198. [Google Scholar] [CrossRef]
- Marjanović, M.; Skorin-Kapov, L.; Pripužić, K.; Antonić, A.; Žarko, I.P. Energy-aware and quality-driven sensor management for green mobile crowd sensing. J. Netw. Comput. Appl. 2016, 59, 95–108. [Google Scholar] [CrossRef]
- Antonić, A.; Marjanović, M.; Pripužić, K.; Žarko, I.P. A mobile crowd sensing ecosystem enabled by CUPUS: Cloud-based publish/subscribe middleware for the Internet of Things. Future Gener. Comput. Syst. 2016, 56, 607–622. [Google Scholar] [CrossRef]
- Liu, Y.; Liu, A.; Li, Y.; Li, Z.; Choi, Y.J.; Sekiya, H.; Li, J. APMD: A fast data transmission protocol with reliability guarantee for pervasive sensing data communication. Pervasive Mob. Comput. 2017. [Google Scholar] [CrossRef]
- Maisonneuve, N.; Stevens, M.; Niessen, M.E.; Steels, L. NoiseTube: Measuring and mapping noise pollution with mobile phones. Inf. Technol. Environ. Eng. 2009, 215–228. [Google Scholar] [CrossRef]
- Sarkar, S.; Chatterjee, S.; Misra, S. Assessment of the Suitability of Fog Computing in the Context of Internet of Things. IEEE Trans. Cloud Comput. 2015. [Google Scholar] [CrossRef]
- Internet of Things Market Forecast: Cisco. Available online: http://postscapes.com/internet-of-things-market-size (accessed on 8 September 2017).
- Wang, J.; Liu, A.; Yan, T.; Zeng, Z. A resource allocation model based on double-sided combinational auctions for transparent computing. Peer-to-Peer Netw. Appl. 2017. [Google Scholar] [CrossRef]
- Xu, Y.; Liu, A.; Huang, C. Delay-Aware Program Codes Dissemination Scheme in Internet of Everything. Mob. Inf. Syst. 2016, 2016. [Google Scholar] [CrossRef]
- Chen, Z.; Liu, A.; Li, Z.; Choi, Y.J.; Li, J. Distributed Duty Cycle Control for Delay Improvement in Wireless Sensor Networks. Peer-to-Peer Netw. Appl. 2017, 10, 559–578. [Google Scholar] [CrossRef]
- Chen, Z.; Ma, M.; Liu, X.; Liu, A.; Zhao, M. Reliability Improved Cooperative Communications over Wireless Sensor Networks. Symmetry 2017, 9, 209. [Google Scholar] [CrossRef]
- Liu, X.; Liu, A.; Deng, Q.; Liu, H. Large-Scale Programing Code Dissemination for Software-Defined Wireless Networks. Comput. J. 2017. [Google Scholar] [CrossRef]
- Fang, C.; Yu, F.R.; Huang, T.; Liu, J.; Liu, Y. A Survey of Green Information-Centric Networking: Research Issues and Challenges. IEEE Commun. Surv. Tutor. 2015, 17, 1455–1472. [Google Scholar] [CrossRef]
- Ahlswede, R.; Cai, N.; Li, S.Y.R.; Yeung, R.W. Network information flow. IEEE Trans. Inf. Theory 2000, 46, 1204–1216. [Google Scholar] [CrossRef]
- Zhao, S.; Liu, A. High performance target tracking scheme with low prediction precision requirement in WSNs. Int. J. Ad Hoc Ubiquitous Comput. 2017. Available online: http://www.inderscience.com /info/ingeneral/forthcoming.php?jcode=ijahuc (accessed on 8 September 2017).
- Zhang, Q.; Liu, A. An Unequal Redundancy Level Based Mechanism for Reliable Data Collection in Wireless Sensor Networks. EURASIP J. Wirel. Commun. Netw. 2016. [Google Scholar] [CrossRef]
- Ke, H.; Li, P.; Guo, S.; Stojmenovic, I. Aggregation on the fly: Reducing traffic for big data in the cloud. IEEE Netw. 2015, 29, 17–23. [Google Scholar] [CrossRef]
- Jiang, L.; Liu, A.; Hu, Y.; Chen, Z. Lifetime maximization through dynamic ring-based routing scheme for correlated data collecting in WSNs. Comput. Electr. Eng. 2015, 41, 191–215. [Google Scholar] [CrossRef]
- Luo, H.; Liu, Y.; Das, S.K. Routing correlated data with fusion cost in wireless sensor networks. IEEE Trans. Mob. Comput. 2006, 5, 1620–1632. [Google Scholar]
- Yang, C.; Chen, J. A Scalable Data Chunk Similarity based Compression Approach for Efficient Big Sensing Data Processing on Cloud. IEEE Trans. Knowl. Data Eng. 2017, 29, 1144–1157. [Google Scholar] [CrossRef]
- The Topological Structure of the American Network. Available online: http://ninjurl.us/us-fiber-map.html (accessed on 8 September 2017).
Figure 1.
Current network structure.
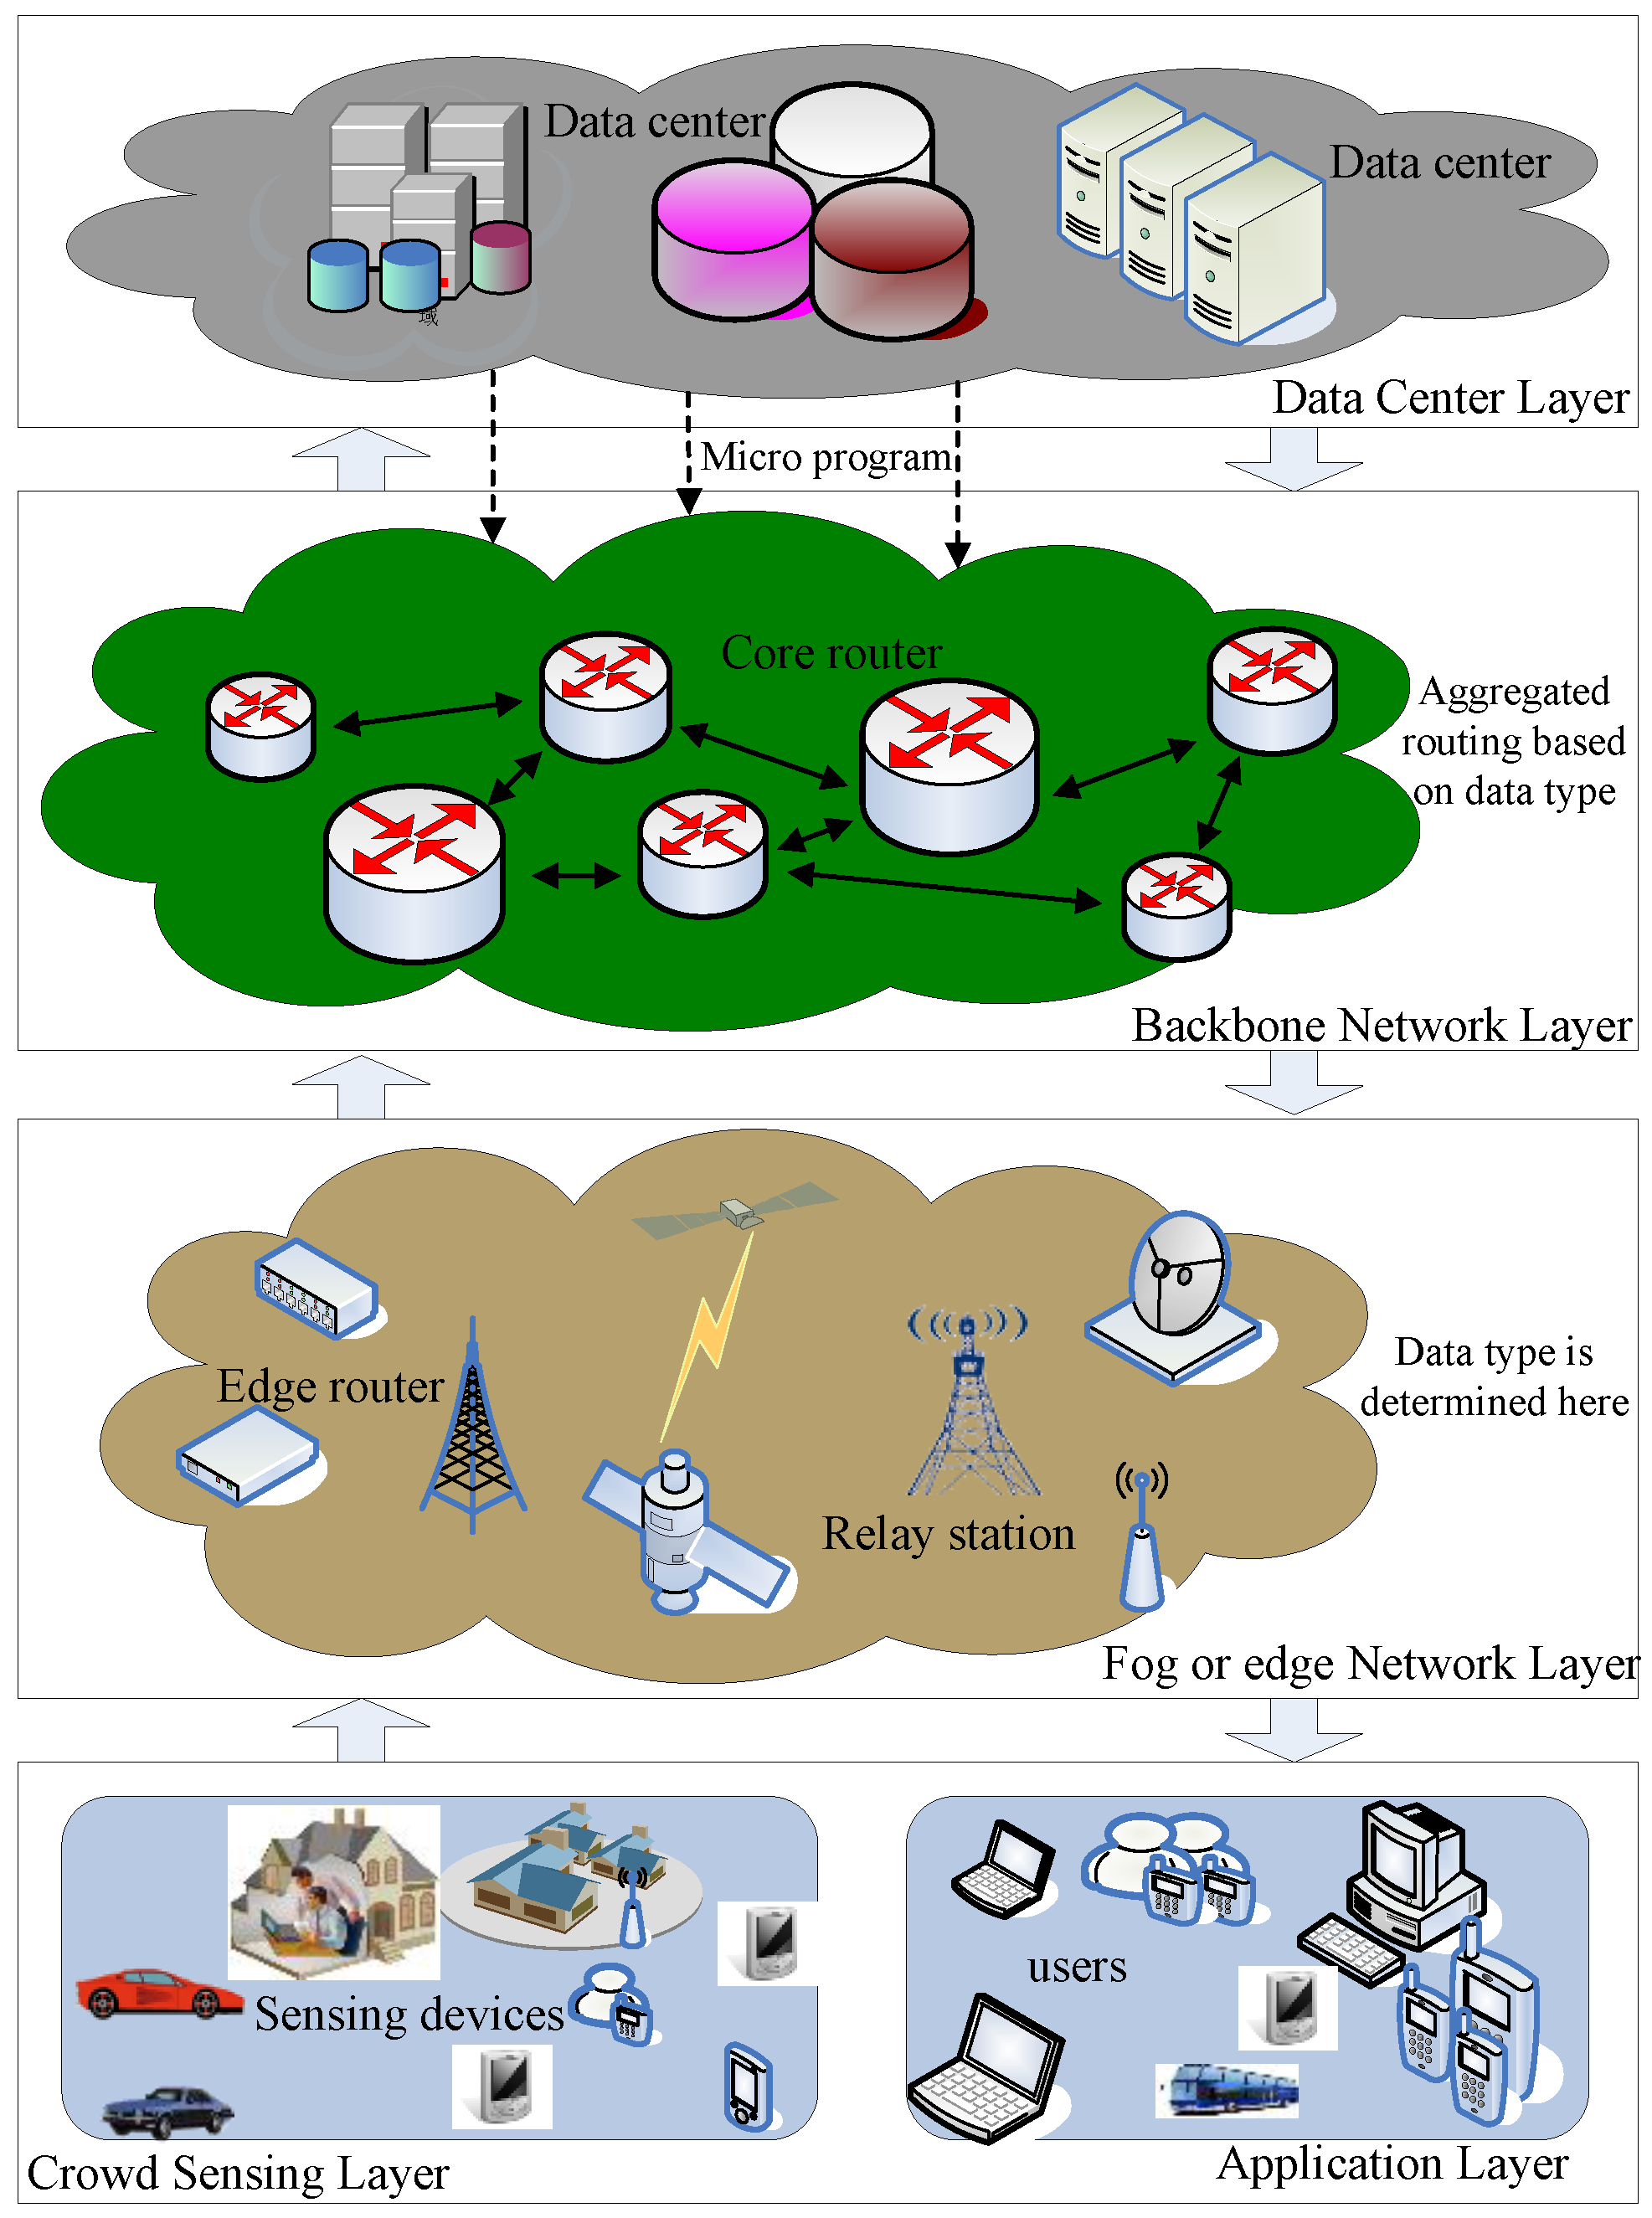
Figure 2.
The network model.

Figure 3.
Description of the intelligent aggregation based on content routing (IACR) scheme.

Figure 4.
The topological structure of the network.
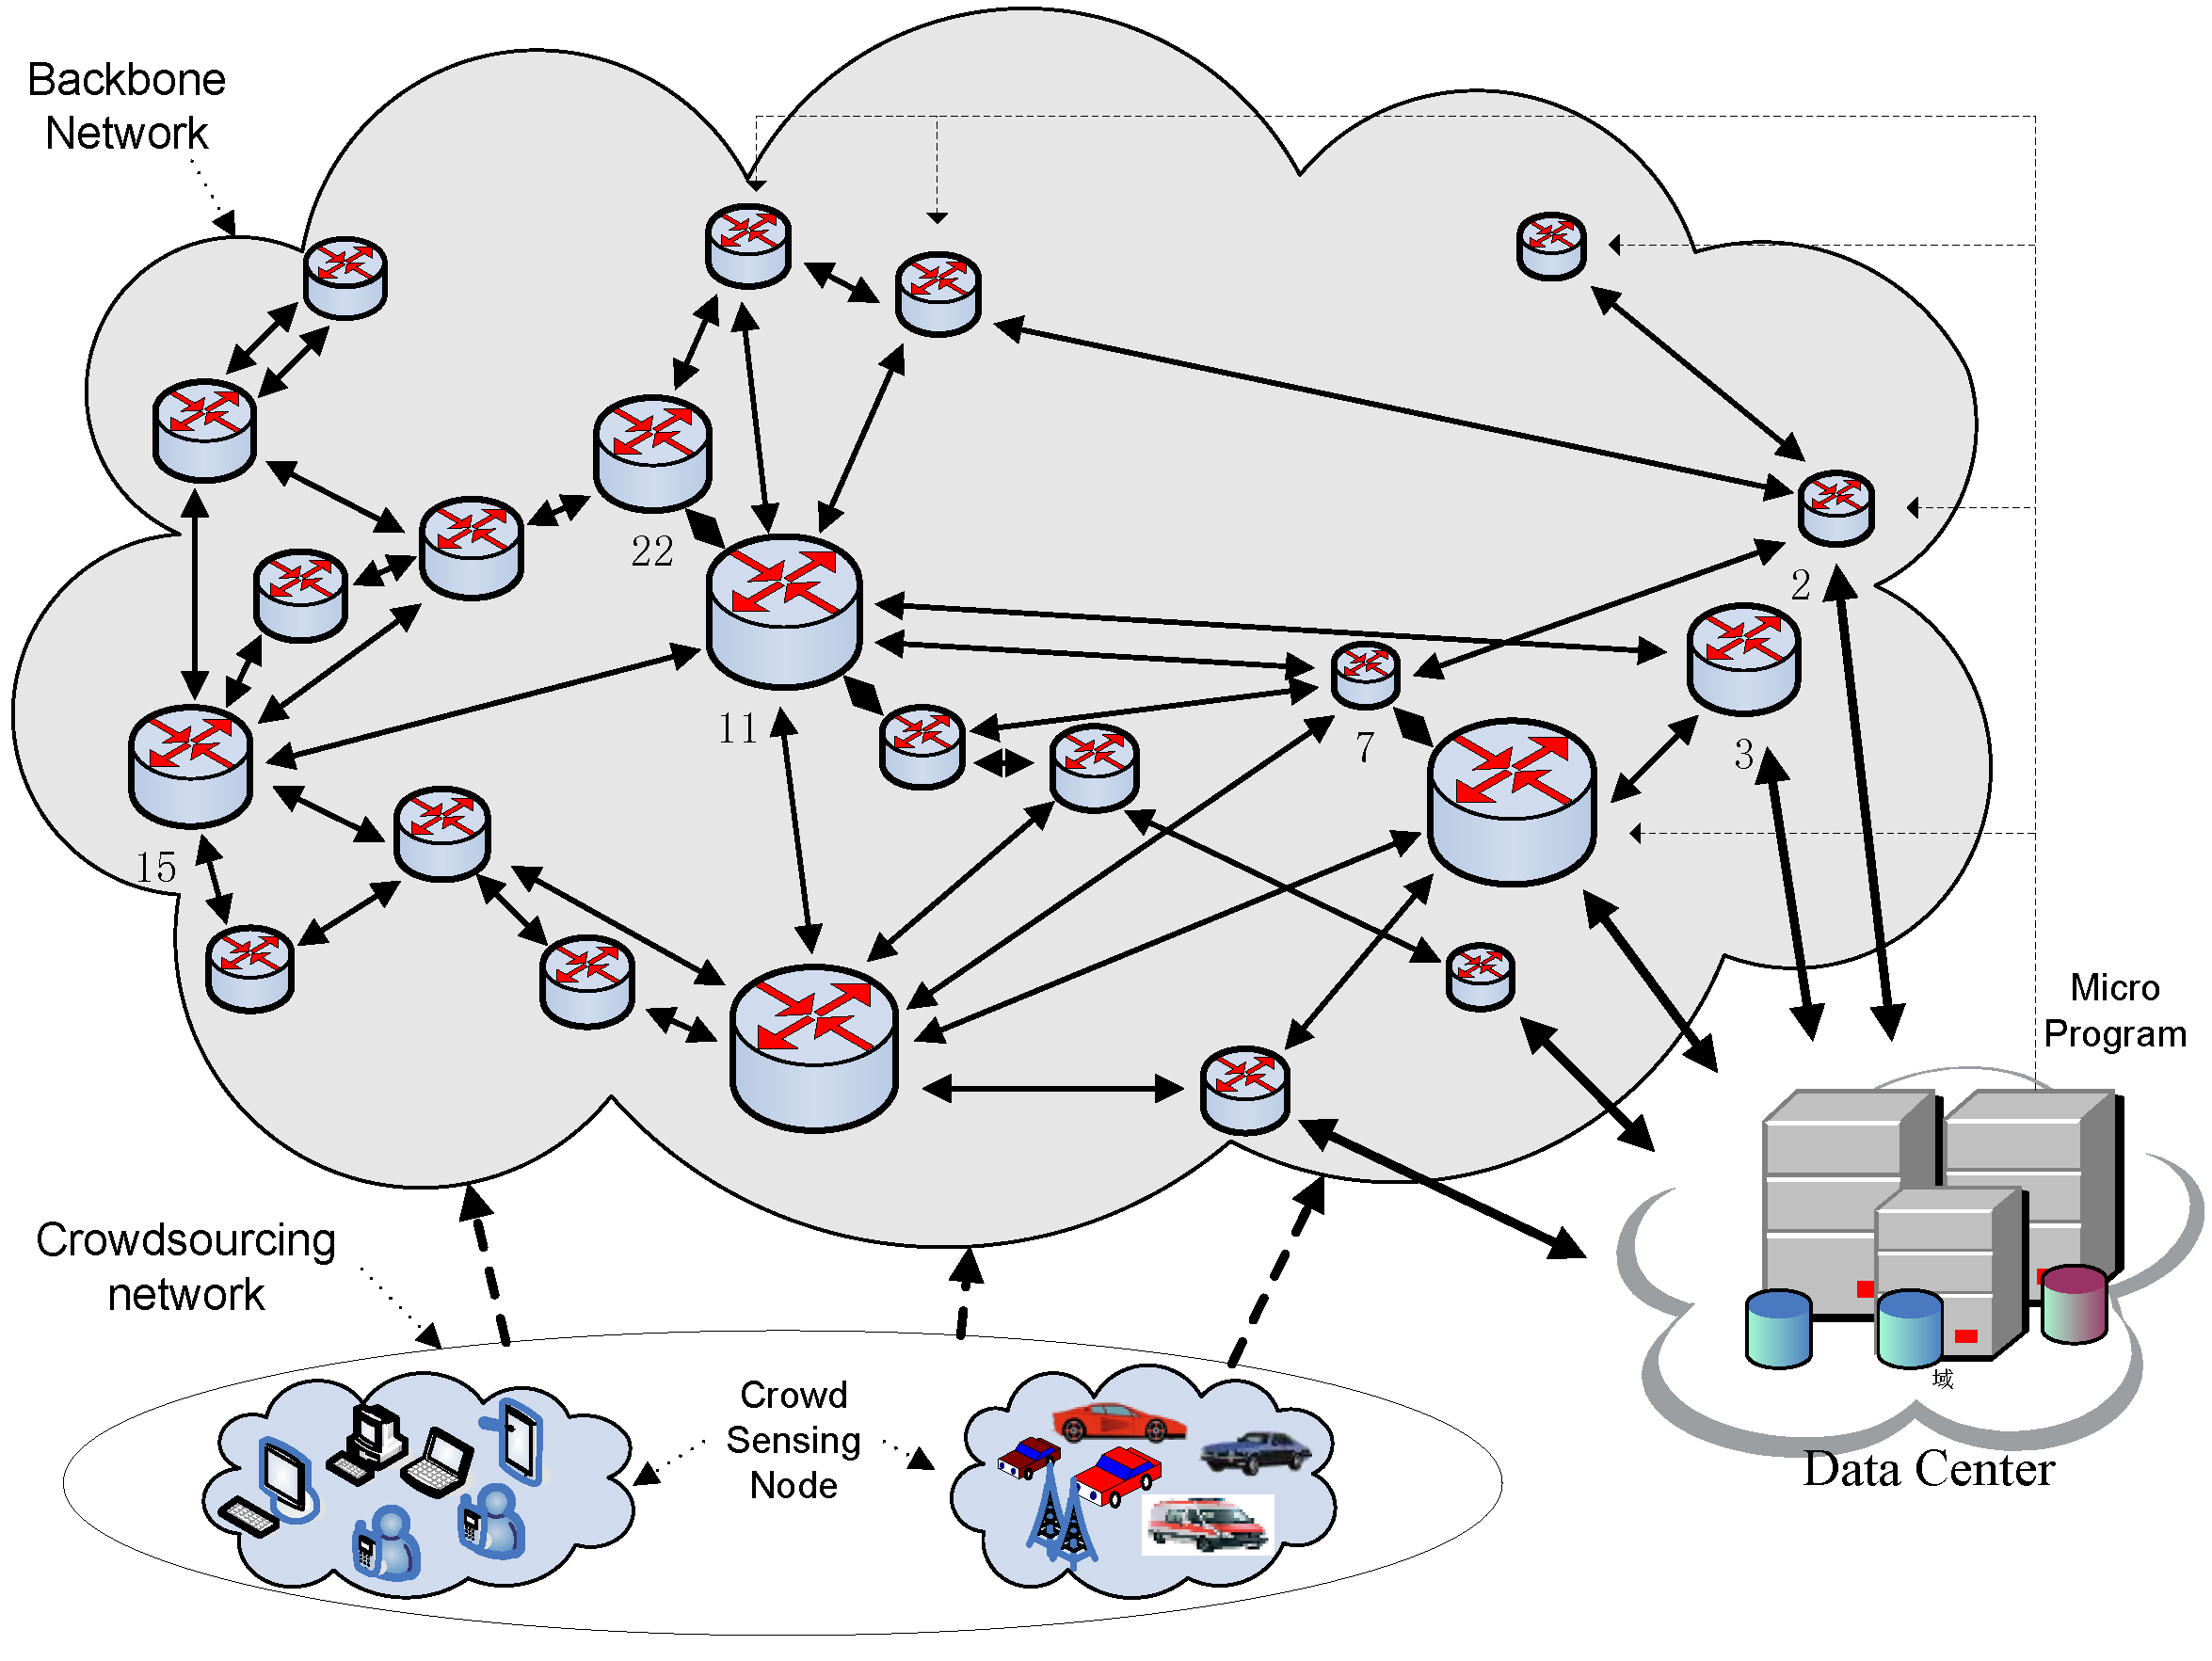
Figure 5.
The number of packages passing through router 3, 11 and 22 in the IACR and the original routing schemes in Set 1.
Figure 5.
The number of packages passing through router 3, 11 and 22 in the IACR and the original routing schemes in Set 1.
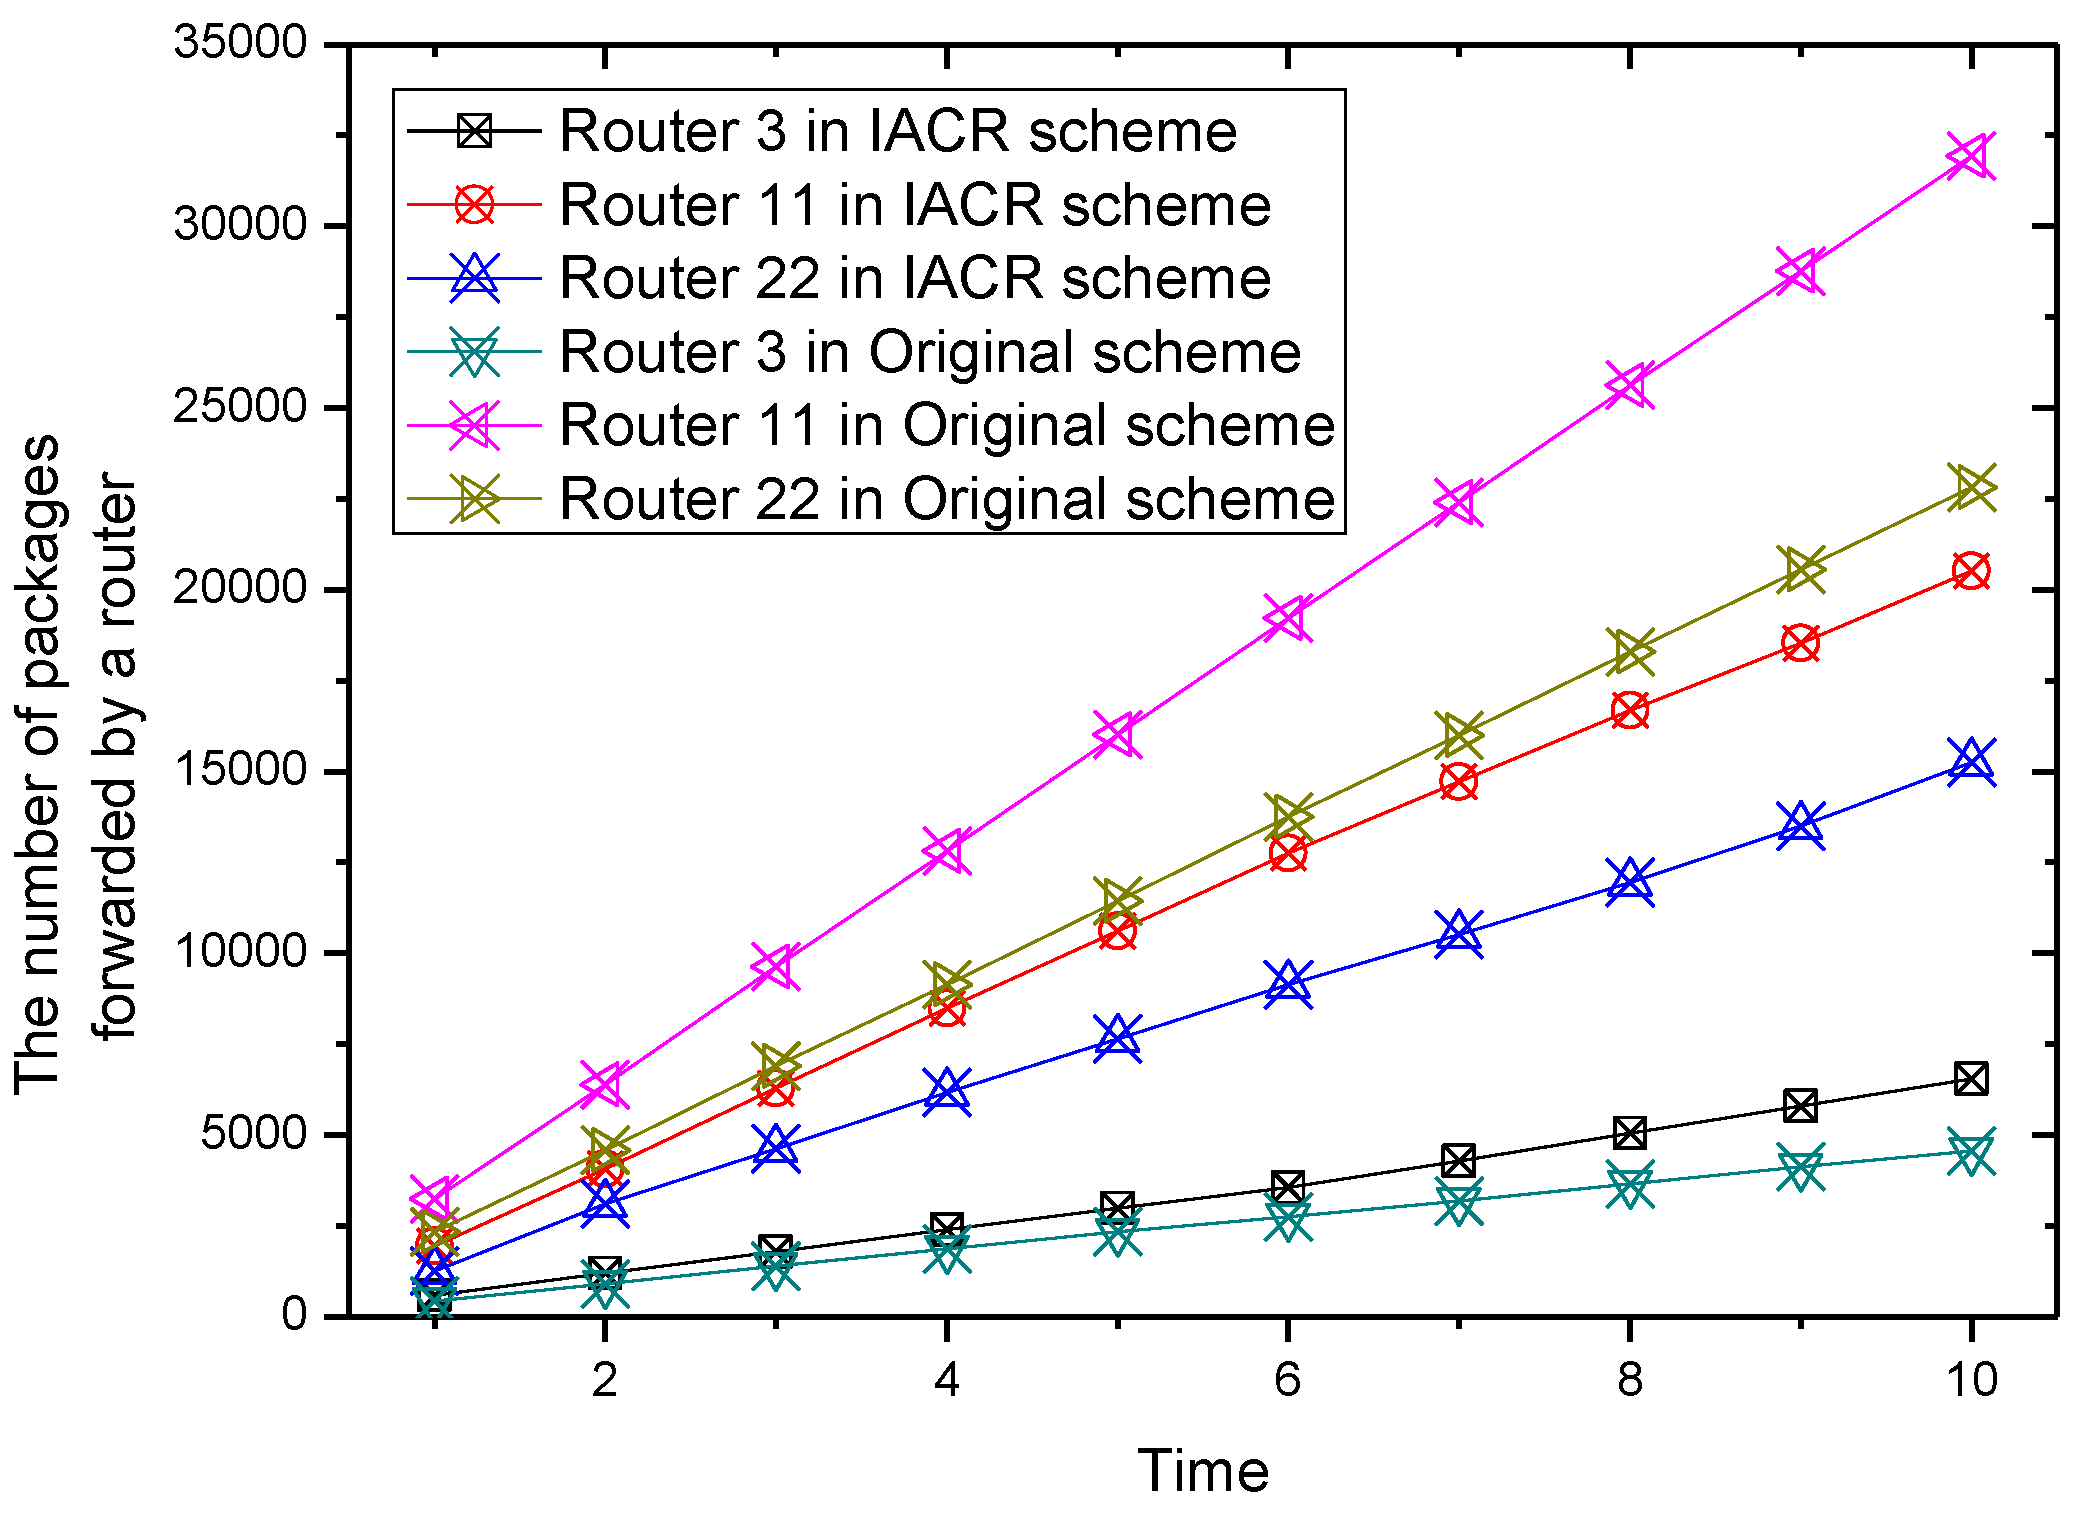
Figure 6.
The number of packages passing through router 2, 7 and 18 in the IACR and original routing schemes in Set 1.
Figure 6.
The number of packages passing through router 2, 7 and 18 in the IACR and original routing schemes in Set 1.

Figure 7.
The number of packages passing through router 3, 11 and 22 in the IACR and the original routing scheme in Set 2.
Figure 7.
The number of packages passing through router 3, 11 and 22 in the IACR and the original routing scheme in Set 2.

Figure 8.
The number of packages passing through router 2, 7 and 18 in the IACR and the original routing schemes in Set 2.
Figure 8.
The number of packages passing through router 2, 7 and 18 in the IACR and the original routing schemes in Set 2.

Figure 9.
The total number of packages passing through different nodes in the network with 100,000 packages in the IACR and the original routing schemes in Set 1.
Figure 9.
The total number of packages passing through different nodes in the network with 100,000 packages in the IACR and the original routing schemes in Set 1.
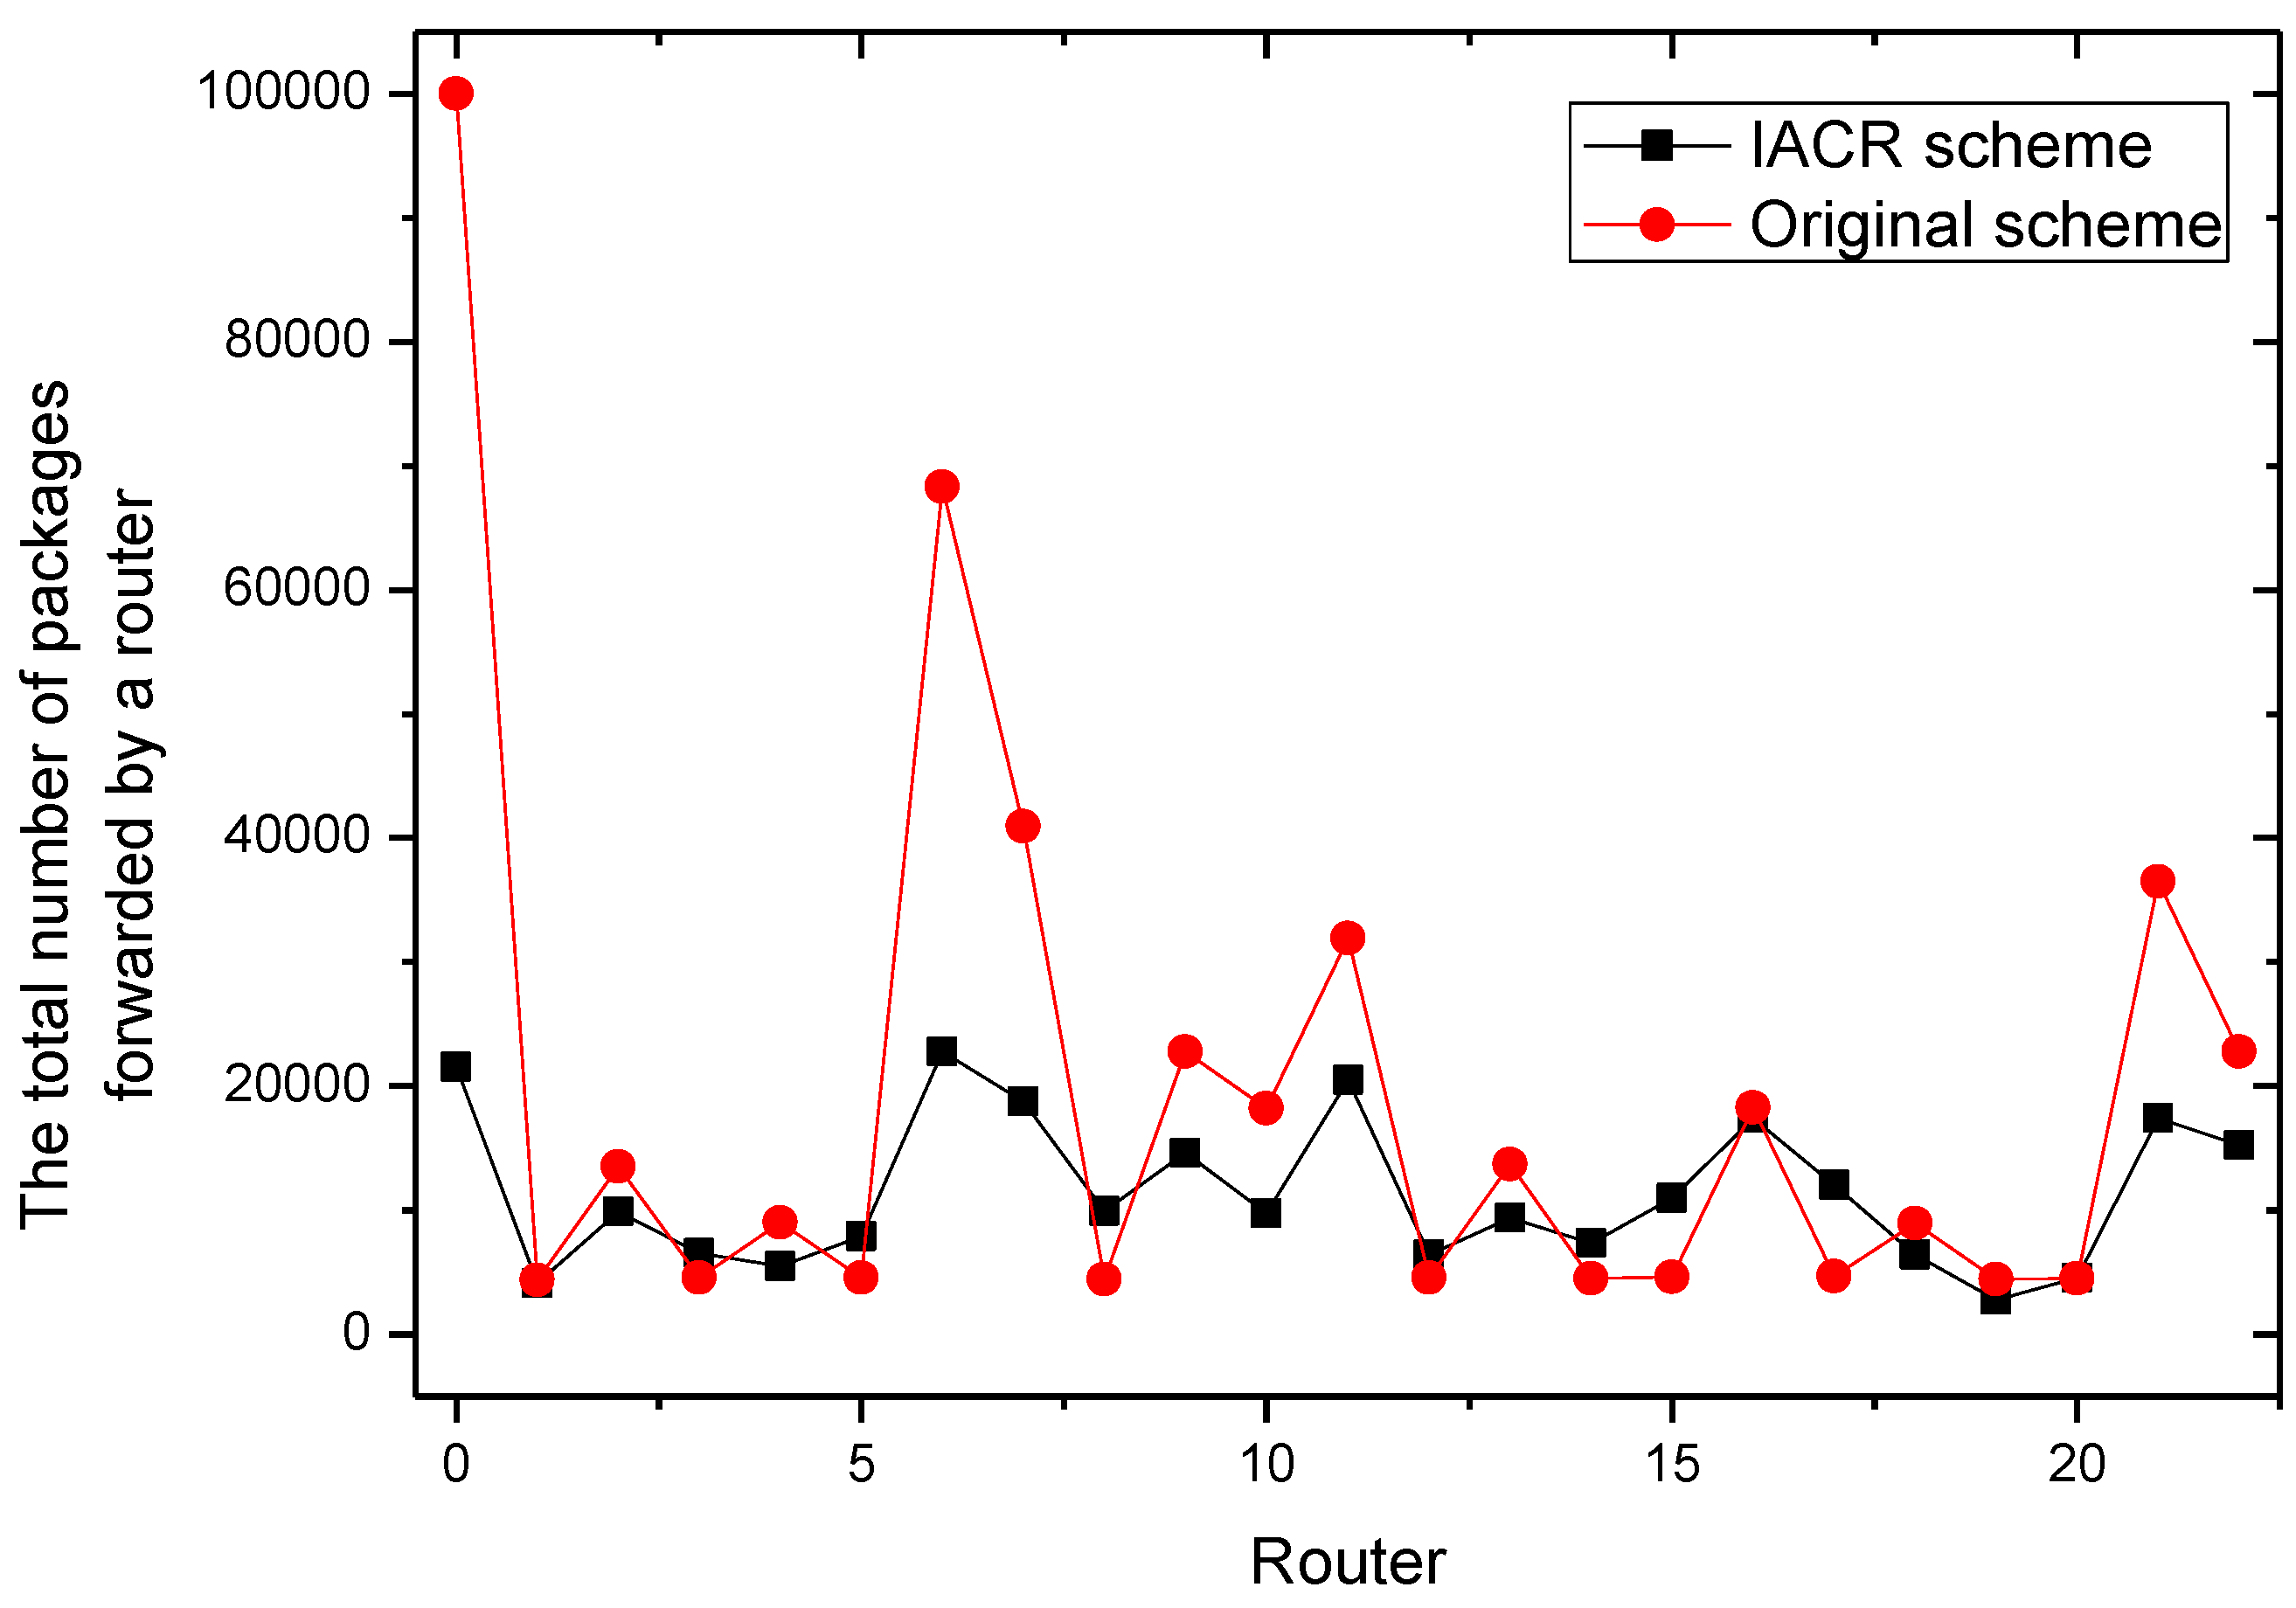
Figure 10.
The total number of packages passing through different nodes in the network with 100,000 packages in the IACR and the original routing schemes in Set 2.
Figure 10.
The total number of packages passing through different nodes in the network with 100,000 packages in the IACR and the original routing schemes in Set 2.

Figure 11.
The total number of packages passing through the network in IACR schemes with different thresholds and the original routing scheme in Set 1 and Set 2.
Figure 11.
The total number of packages passing through the network in IACR schemes with different thresholds and the original routing scheme in Set 1 and Set 2.
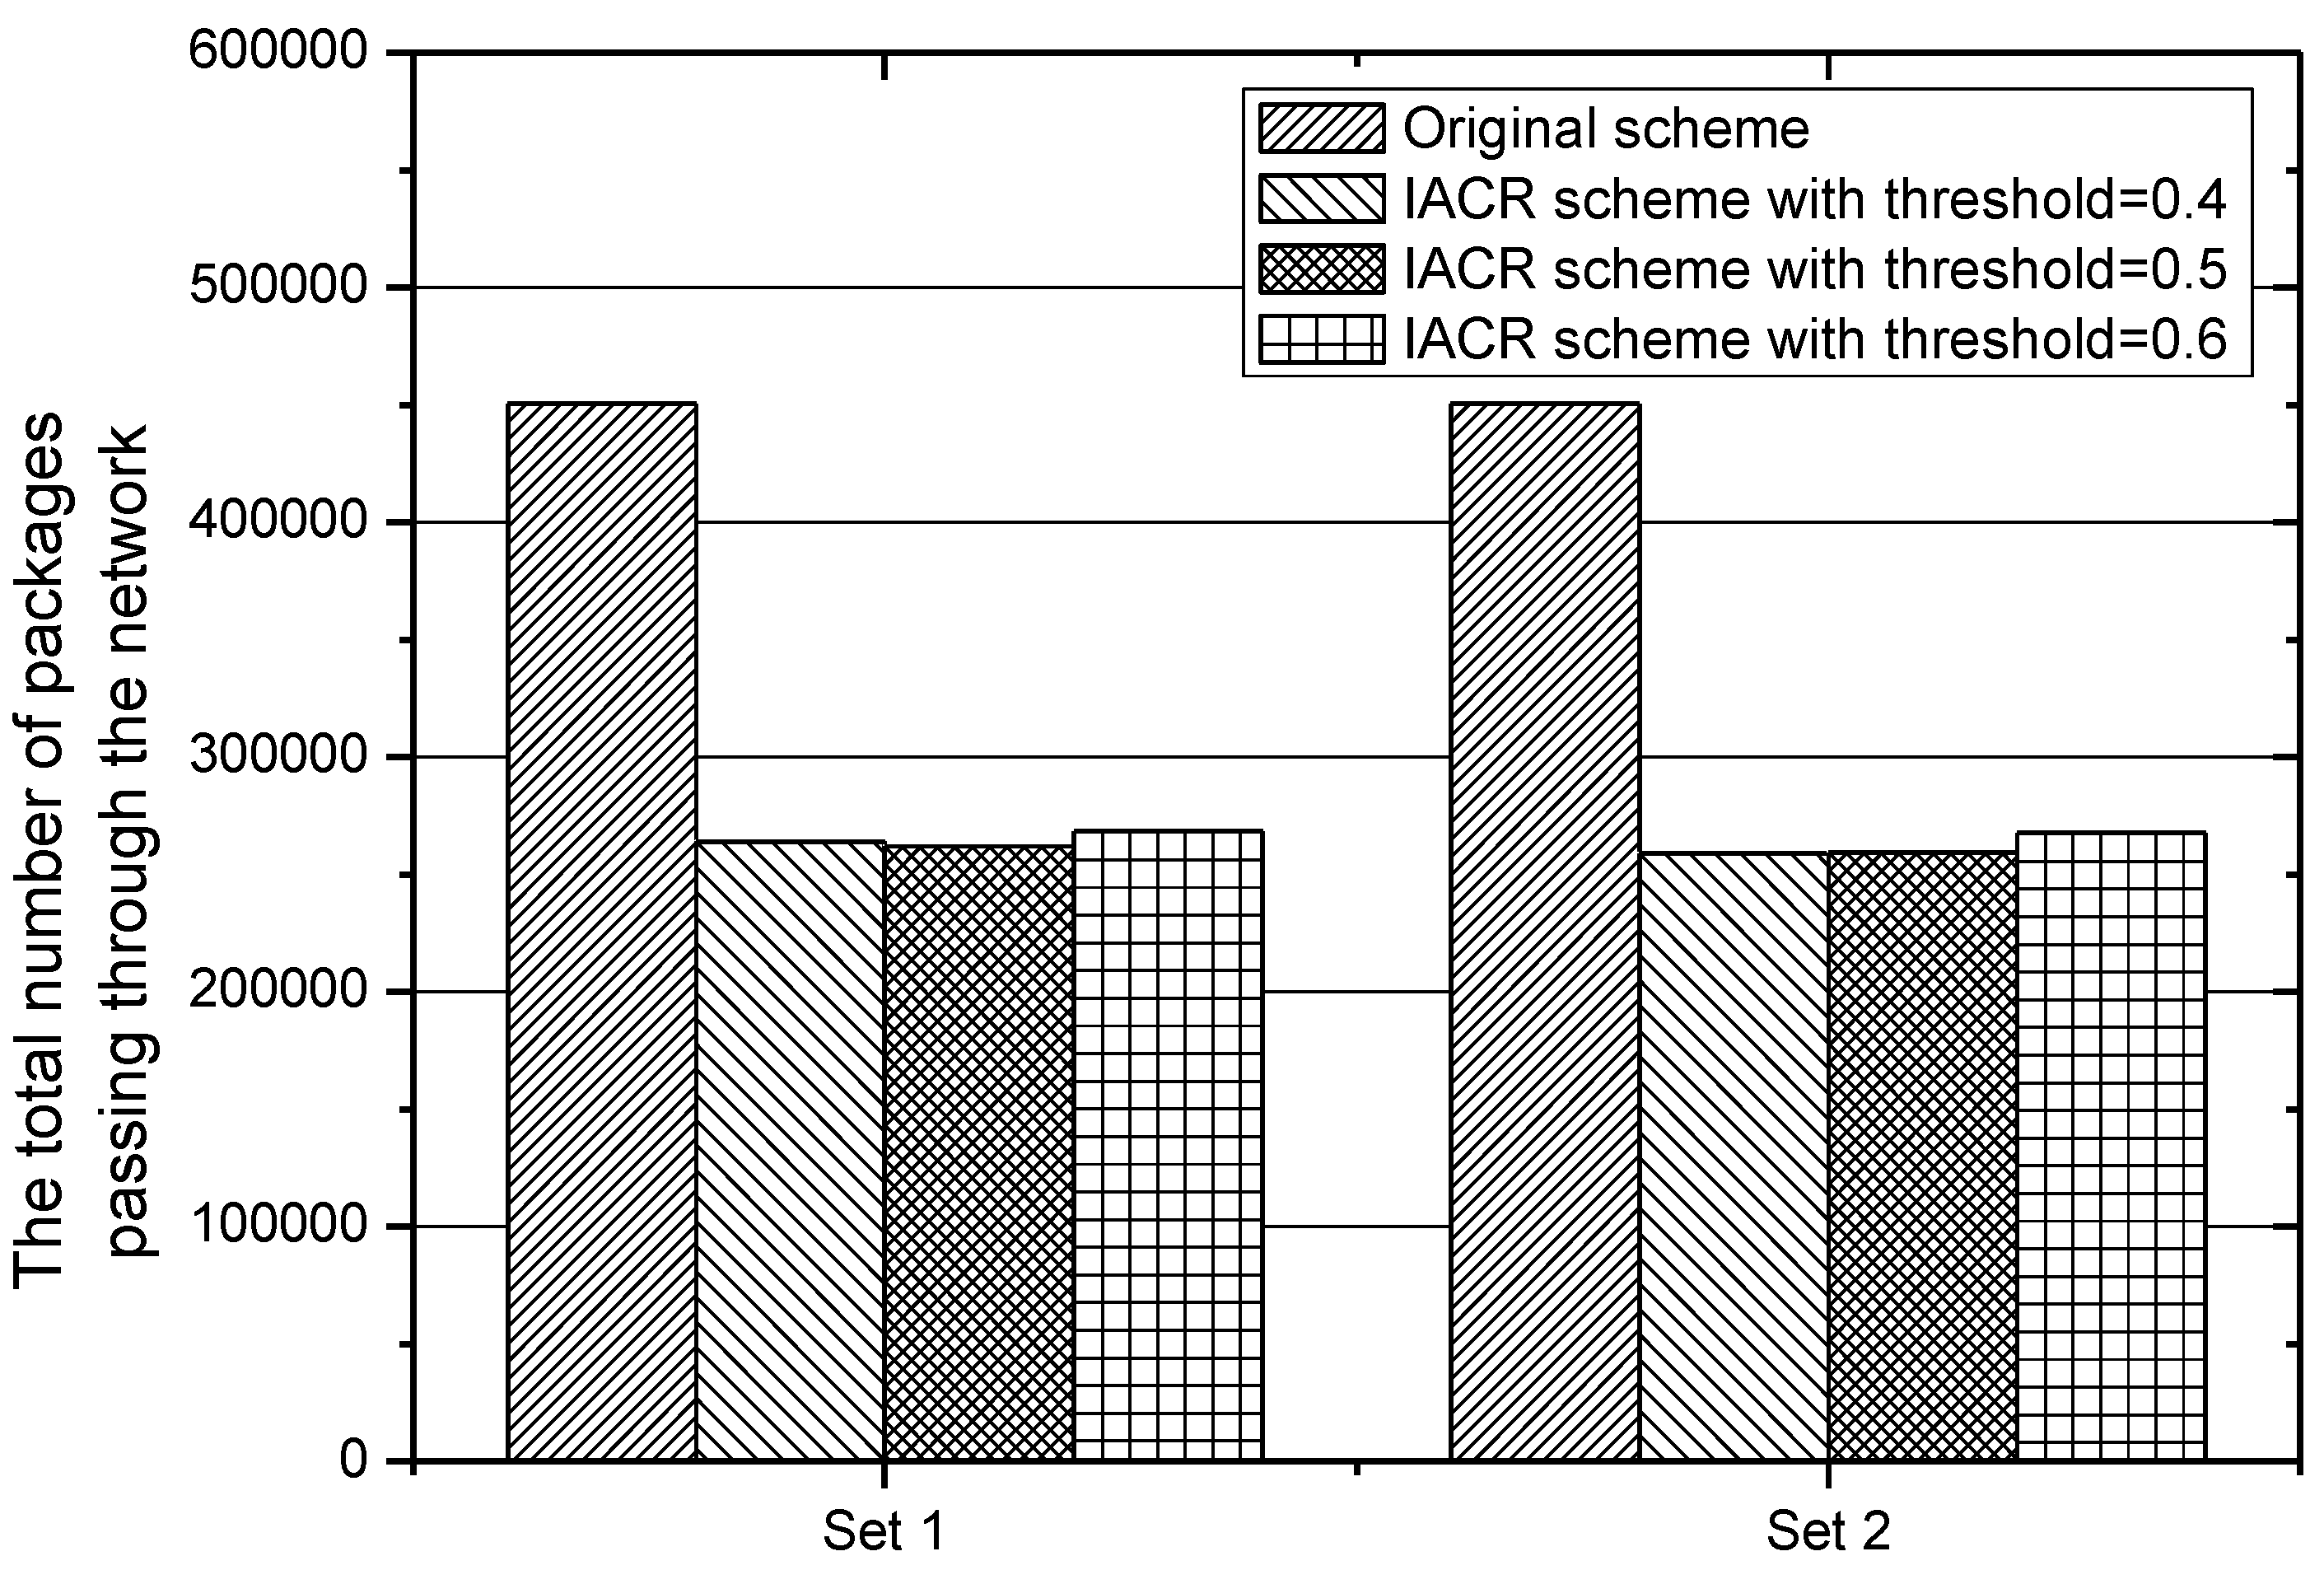
Figure 12.
The average number of packages passing through the network in IACR schemes with different thresholds and the original routing scheme in Set 1 and Set 2.
Figure 12.
The average number of packages passing through the network in IACR schemes with different thresholds and the original routing scheme in Set 1 and Set 2.

Figure 13.
The number of packages passing through the different nodes in the network with 200,000 packages in the IACR and the original routing schemes in Set 1.
Figure 13.
The number of packages passing through the different nodes in the network with 200,000 packages in the IACR and the original routing schemes in Set 1.

Figure 14.
The number of packages passing through the different nodes in the network with 200,000 packages of the IACR and the original routing schemes in Set 2.
Figure 14.
The number of packages passing through the different nodes in the network with 200,000 packages of the IACR and the original routing schemes in Set 2.
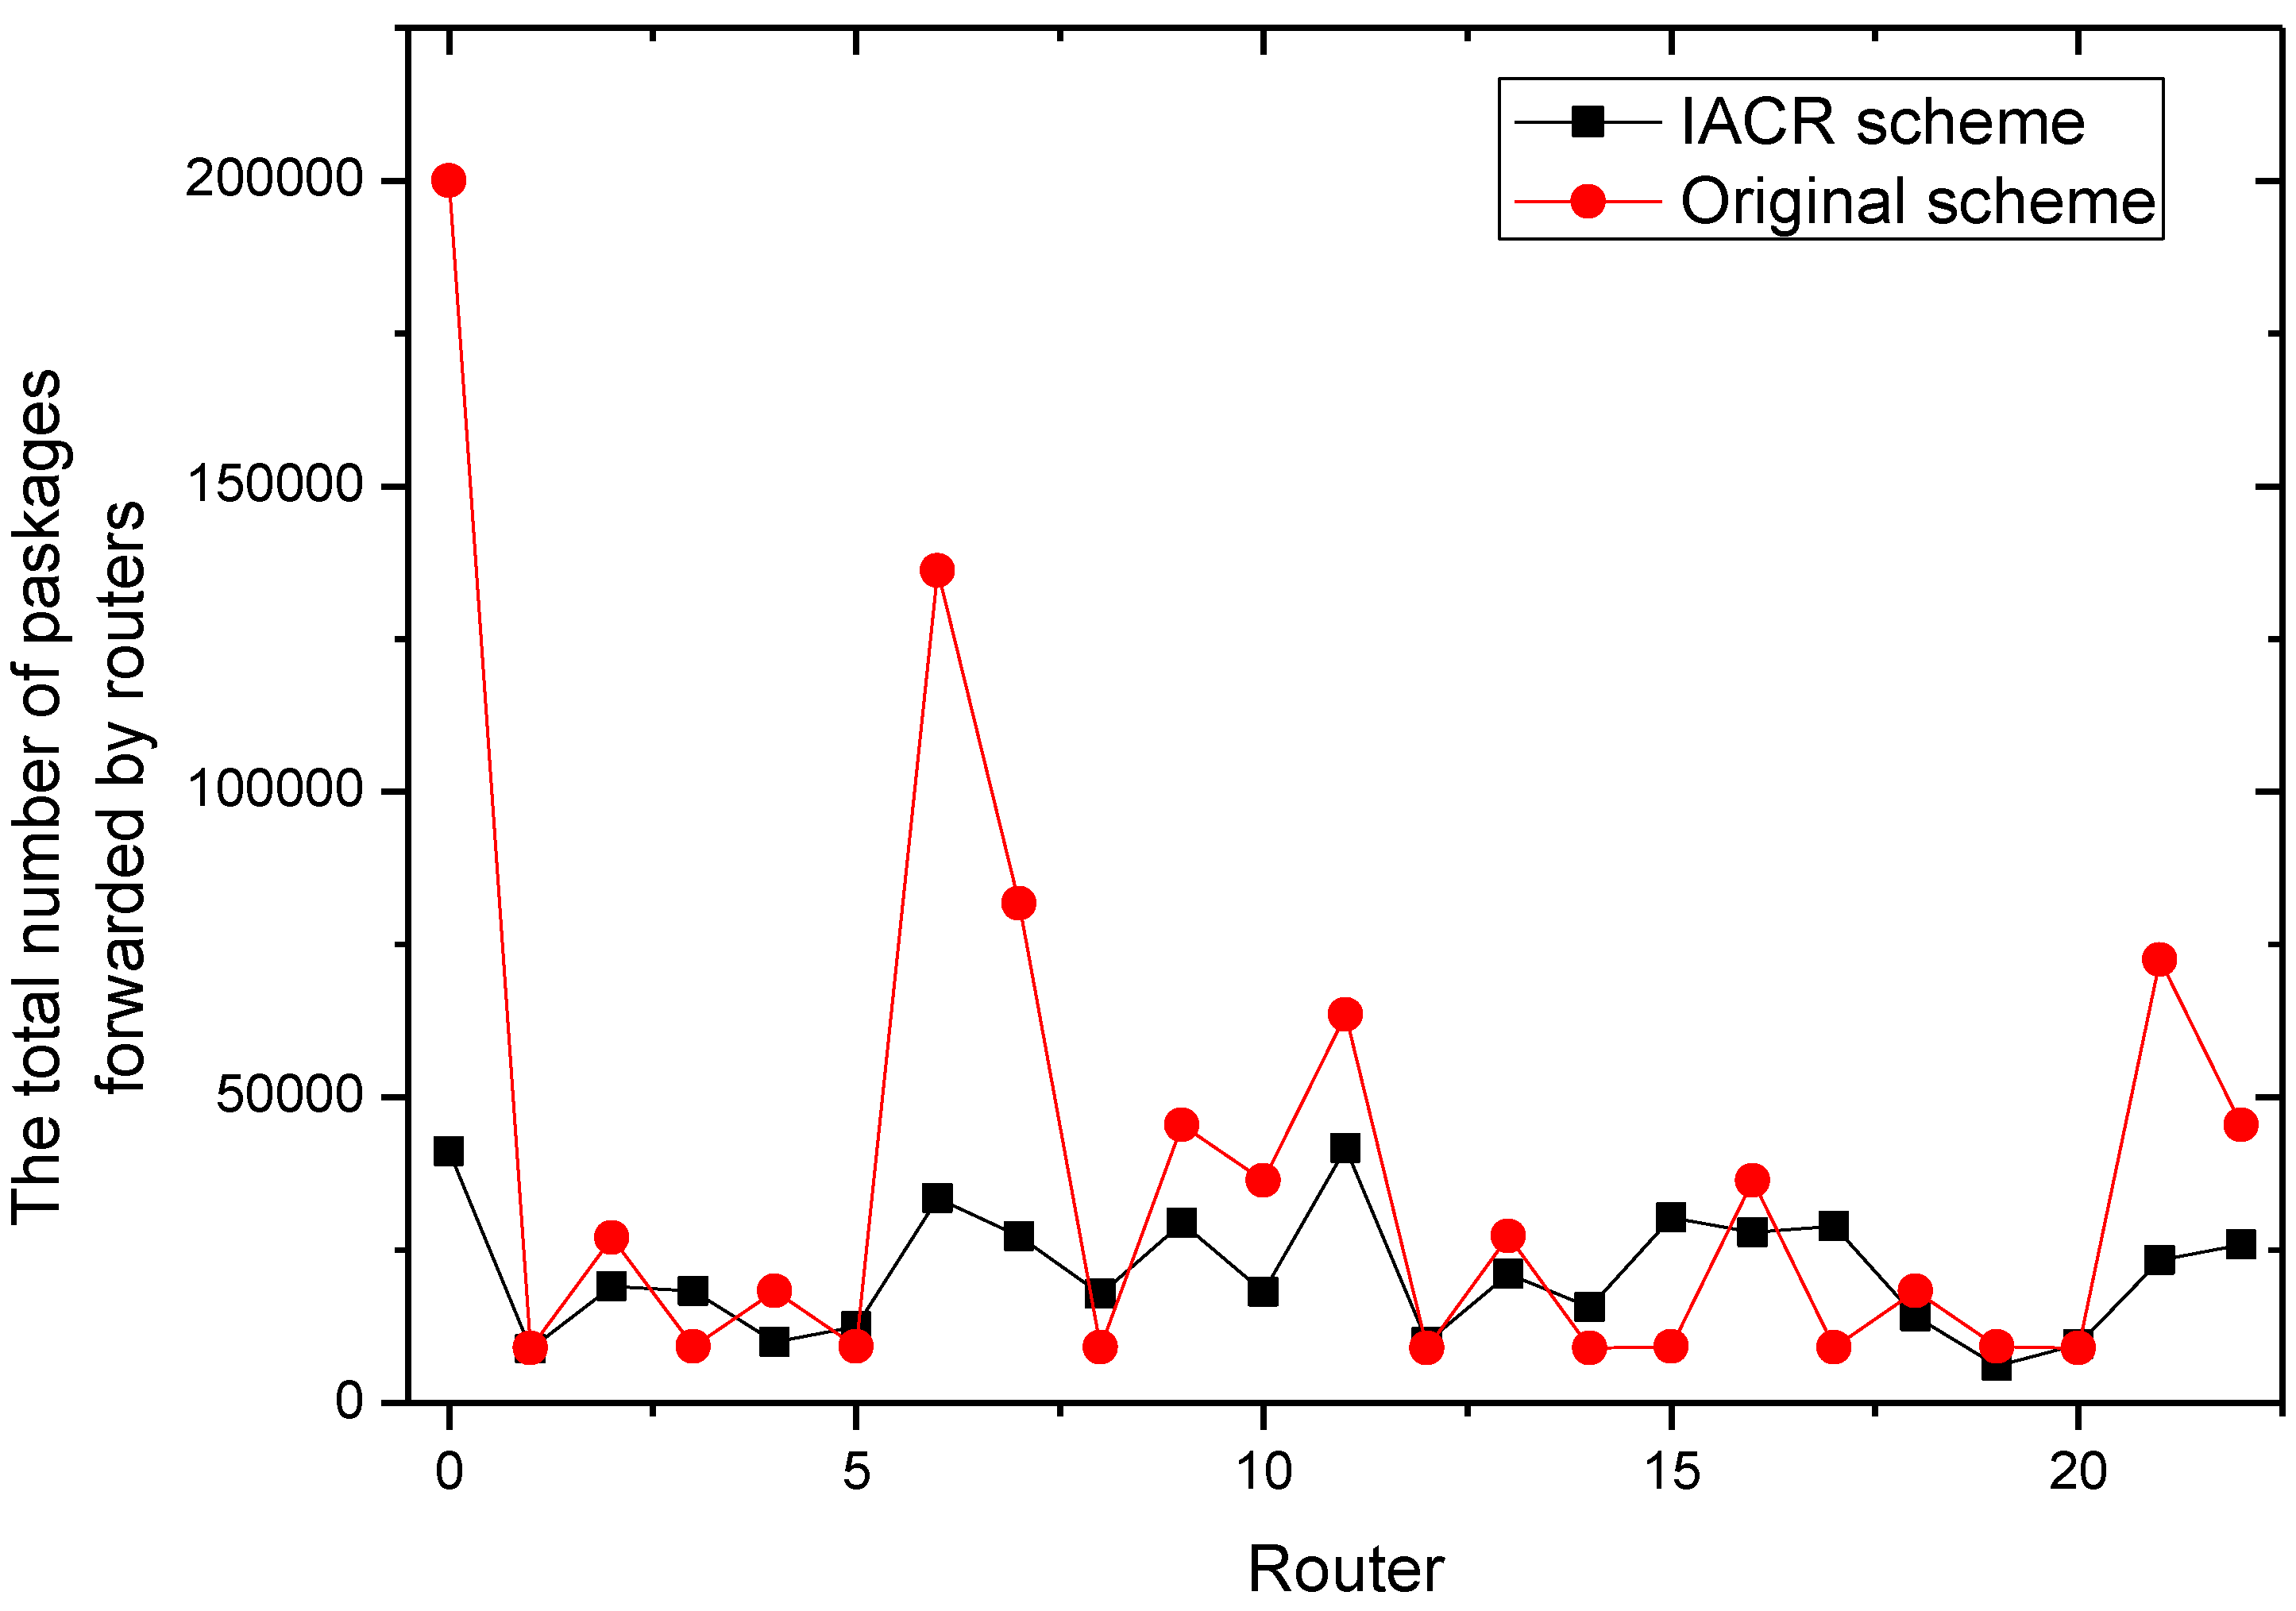
Figure 15.
The variance in the original routing scheme and the IACR scheme in Set 1 and Set 2 with 100,000 and 200,000 packages.
Figure 15.
The variance in the original routing scheme and the IACR scheme in Set 1 and Set 2 with 100,000 and 200,000 packages.

Figure 16.
The total distance that packages in the network travel in IACR schemes with different thresholds and in the original routing scheme in Set 1 and Set 2.
Figure 16.
The total distance that packages in the network travel in IACR schemes with different thresholds and in the original routing scheme in Set 1 and Set 2.

Figure 17.
The total time that packages in the network travel in IACR schemes with different thresholds and in the original routing scheme in Set 1 and Set 2.
Figure 17.
The total time that packages in the network travel in IACR schemes with different thresholds and in the original routing scheme in Set 1 and Set 2.
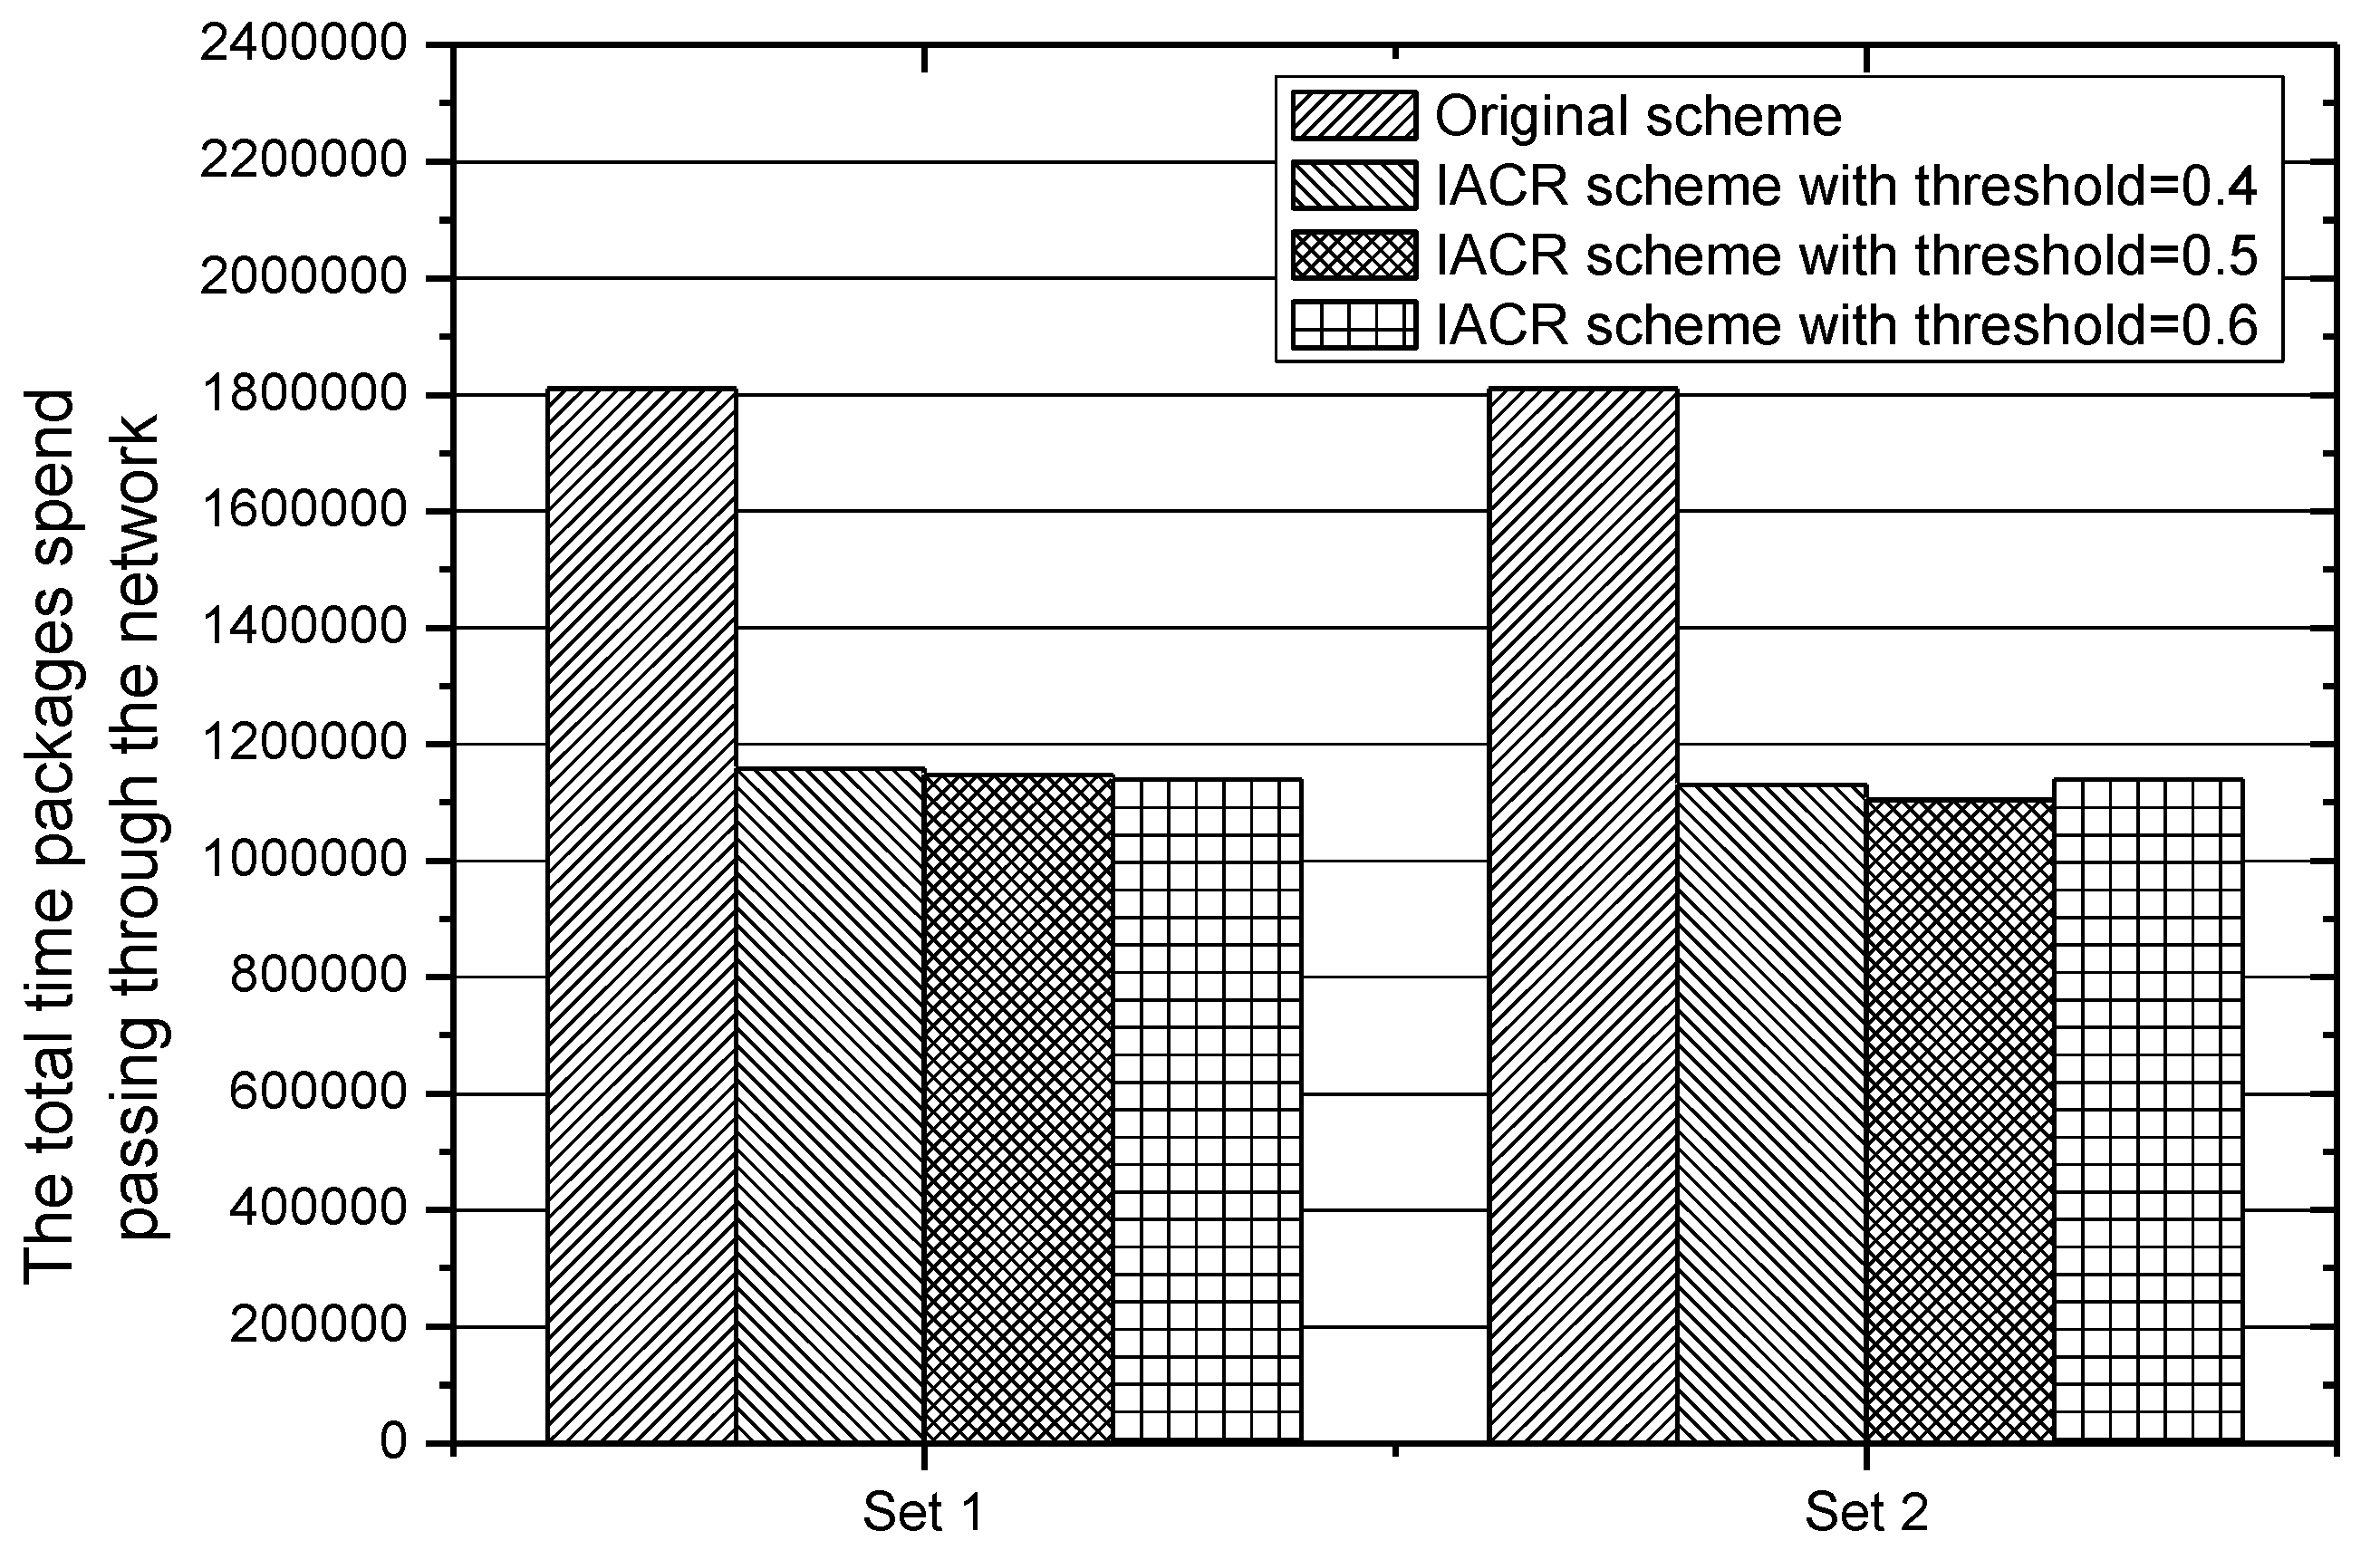
Figure 18.
The total number of packages passing through the network in IACR schemes with different thresholds and checktimes in Set 1.
Figure 18.
The total number of packages passing through the network in IACR schemes with different thresholds and checktimes in Set 1.

Figure 19.
The total time of packages spending travelling in the network in IACR schemes with different thresholds and checktimes in Set 1.
Figure 19.
The total time of packages spending travelling in the network in IACR schemes with different thresholds and checktimes in Set 1.

Figure 20.
The total number of packages passing through the network in IACR schemes with different thresholds and checktimes in Set 2.
Figure 20.
The total number of packages passing through the network in IACR schemes with different thresholds and checktimes in Set 2.

Figure 21.
The total time of packages spending travelling in the network in IACR schemes with different thresholds and checktimes in Set 2.
Figure 21.
The total time of packages spending travelling in the network in IACR schemes with different thresholds and checktimes in Set 2.

Figure 22.
The backbone routes at the beginning of running the IACR scheme.
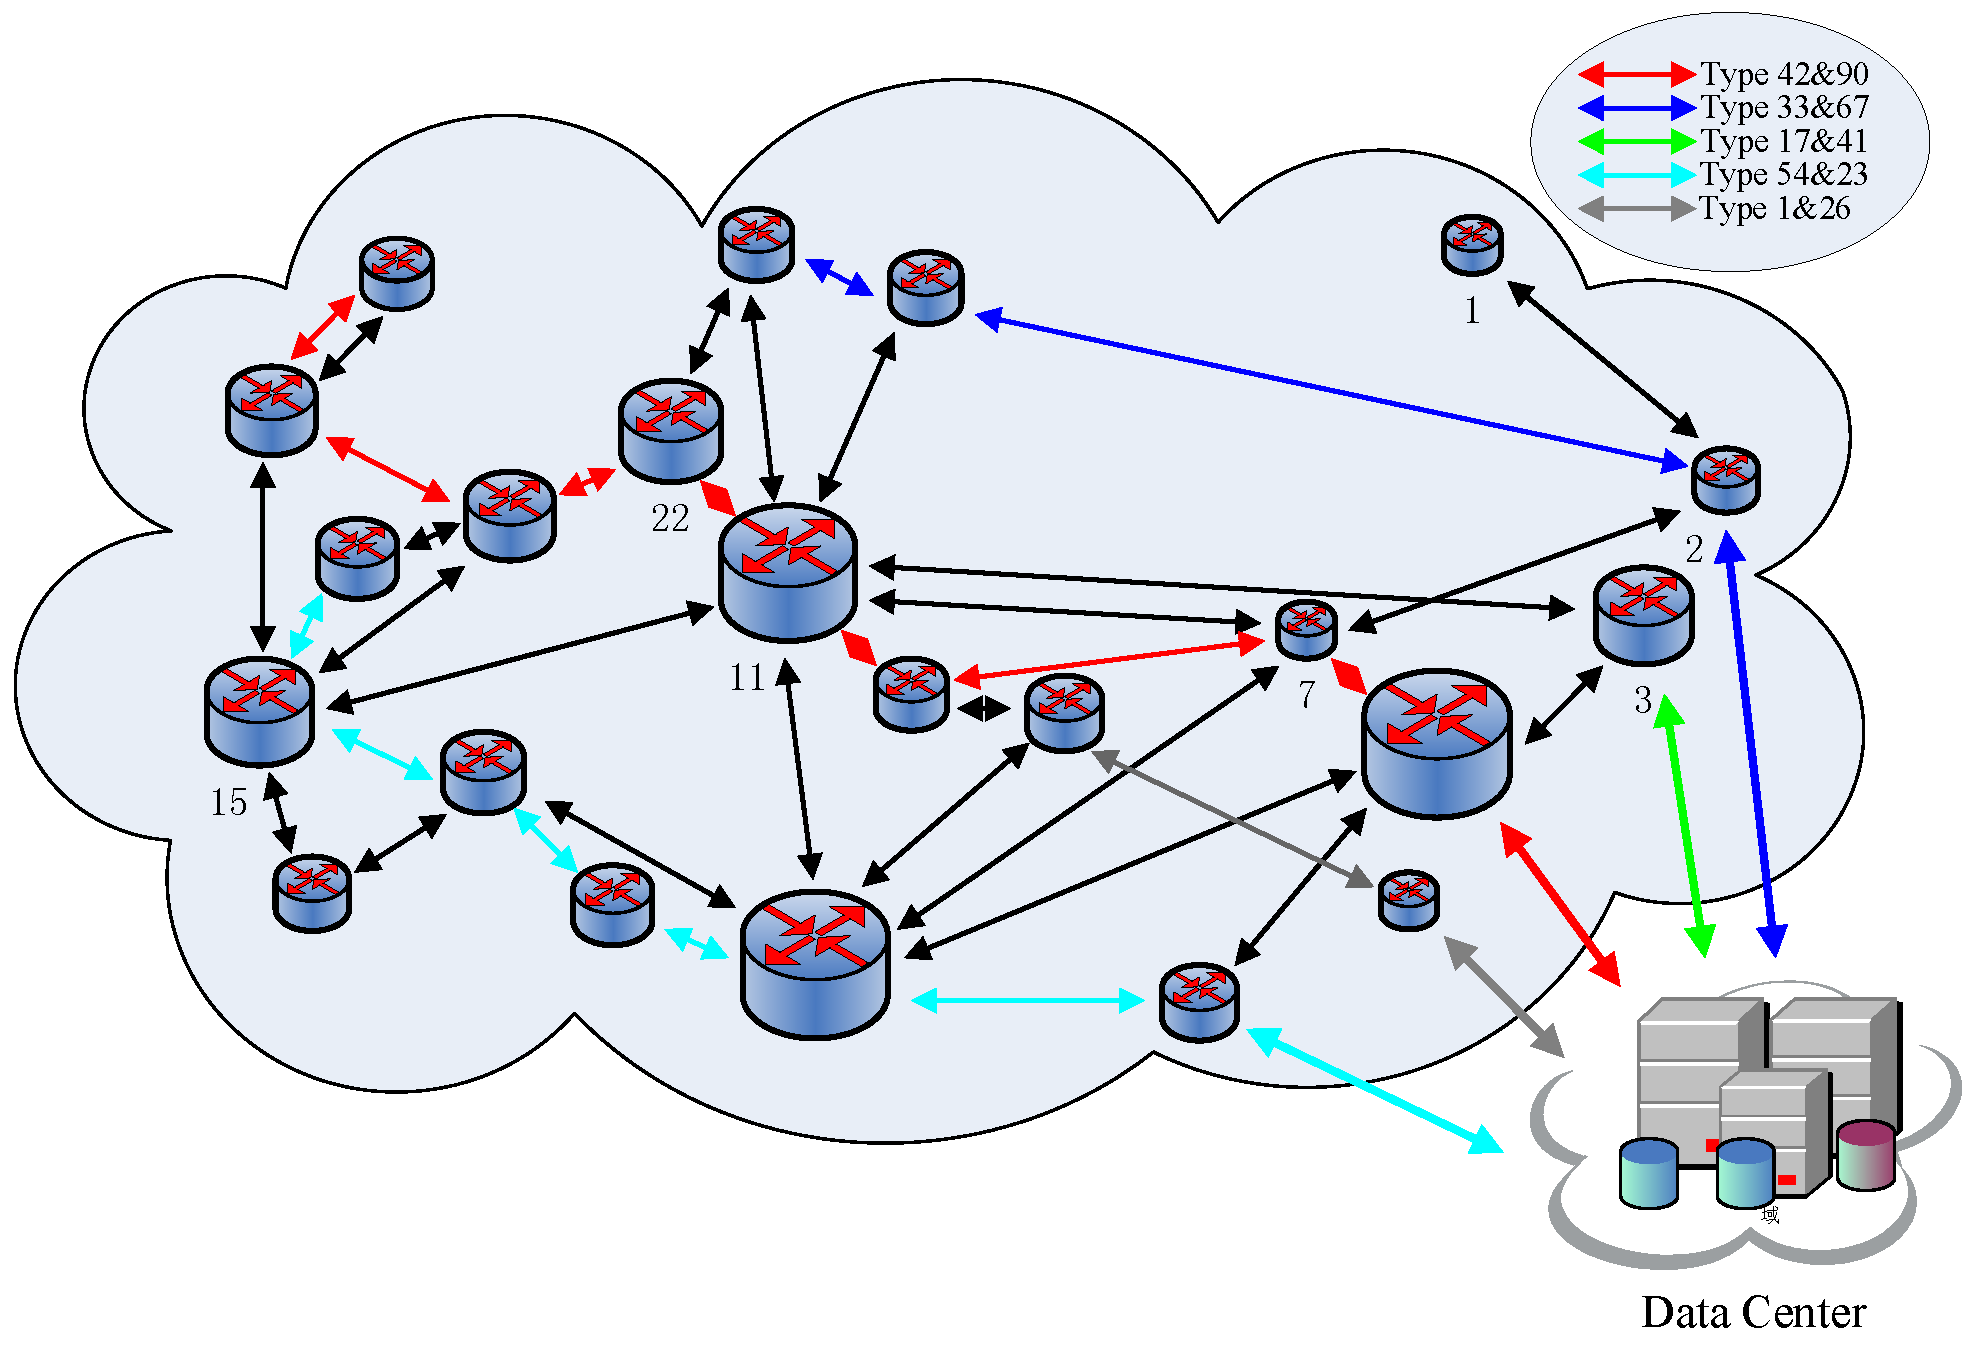
Figure 23.
The backbone routes after running the IACR scheme.

Figure 24.
The backbone network of the USA.

Figure 25.
The number of packages passing through different nodes in the American backbone network with 100,000 packages in the IACR and the original routing schemes in Set 1.
Figure 25.
The number of packages passing through different nodes in the American backbone network with 100,000 packages in the IACR and the original routing schemes in Set 1.
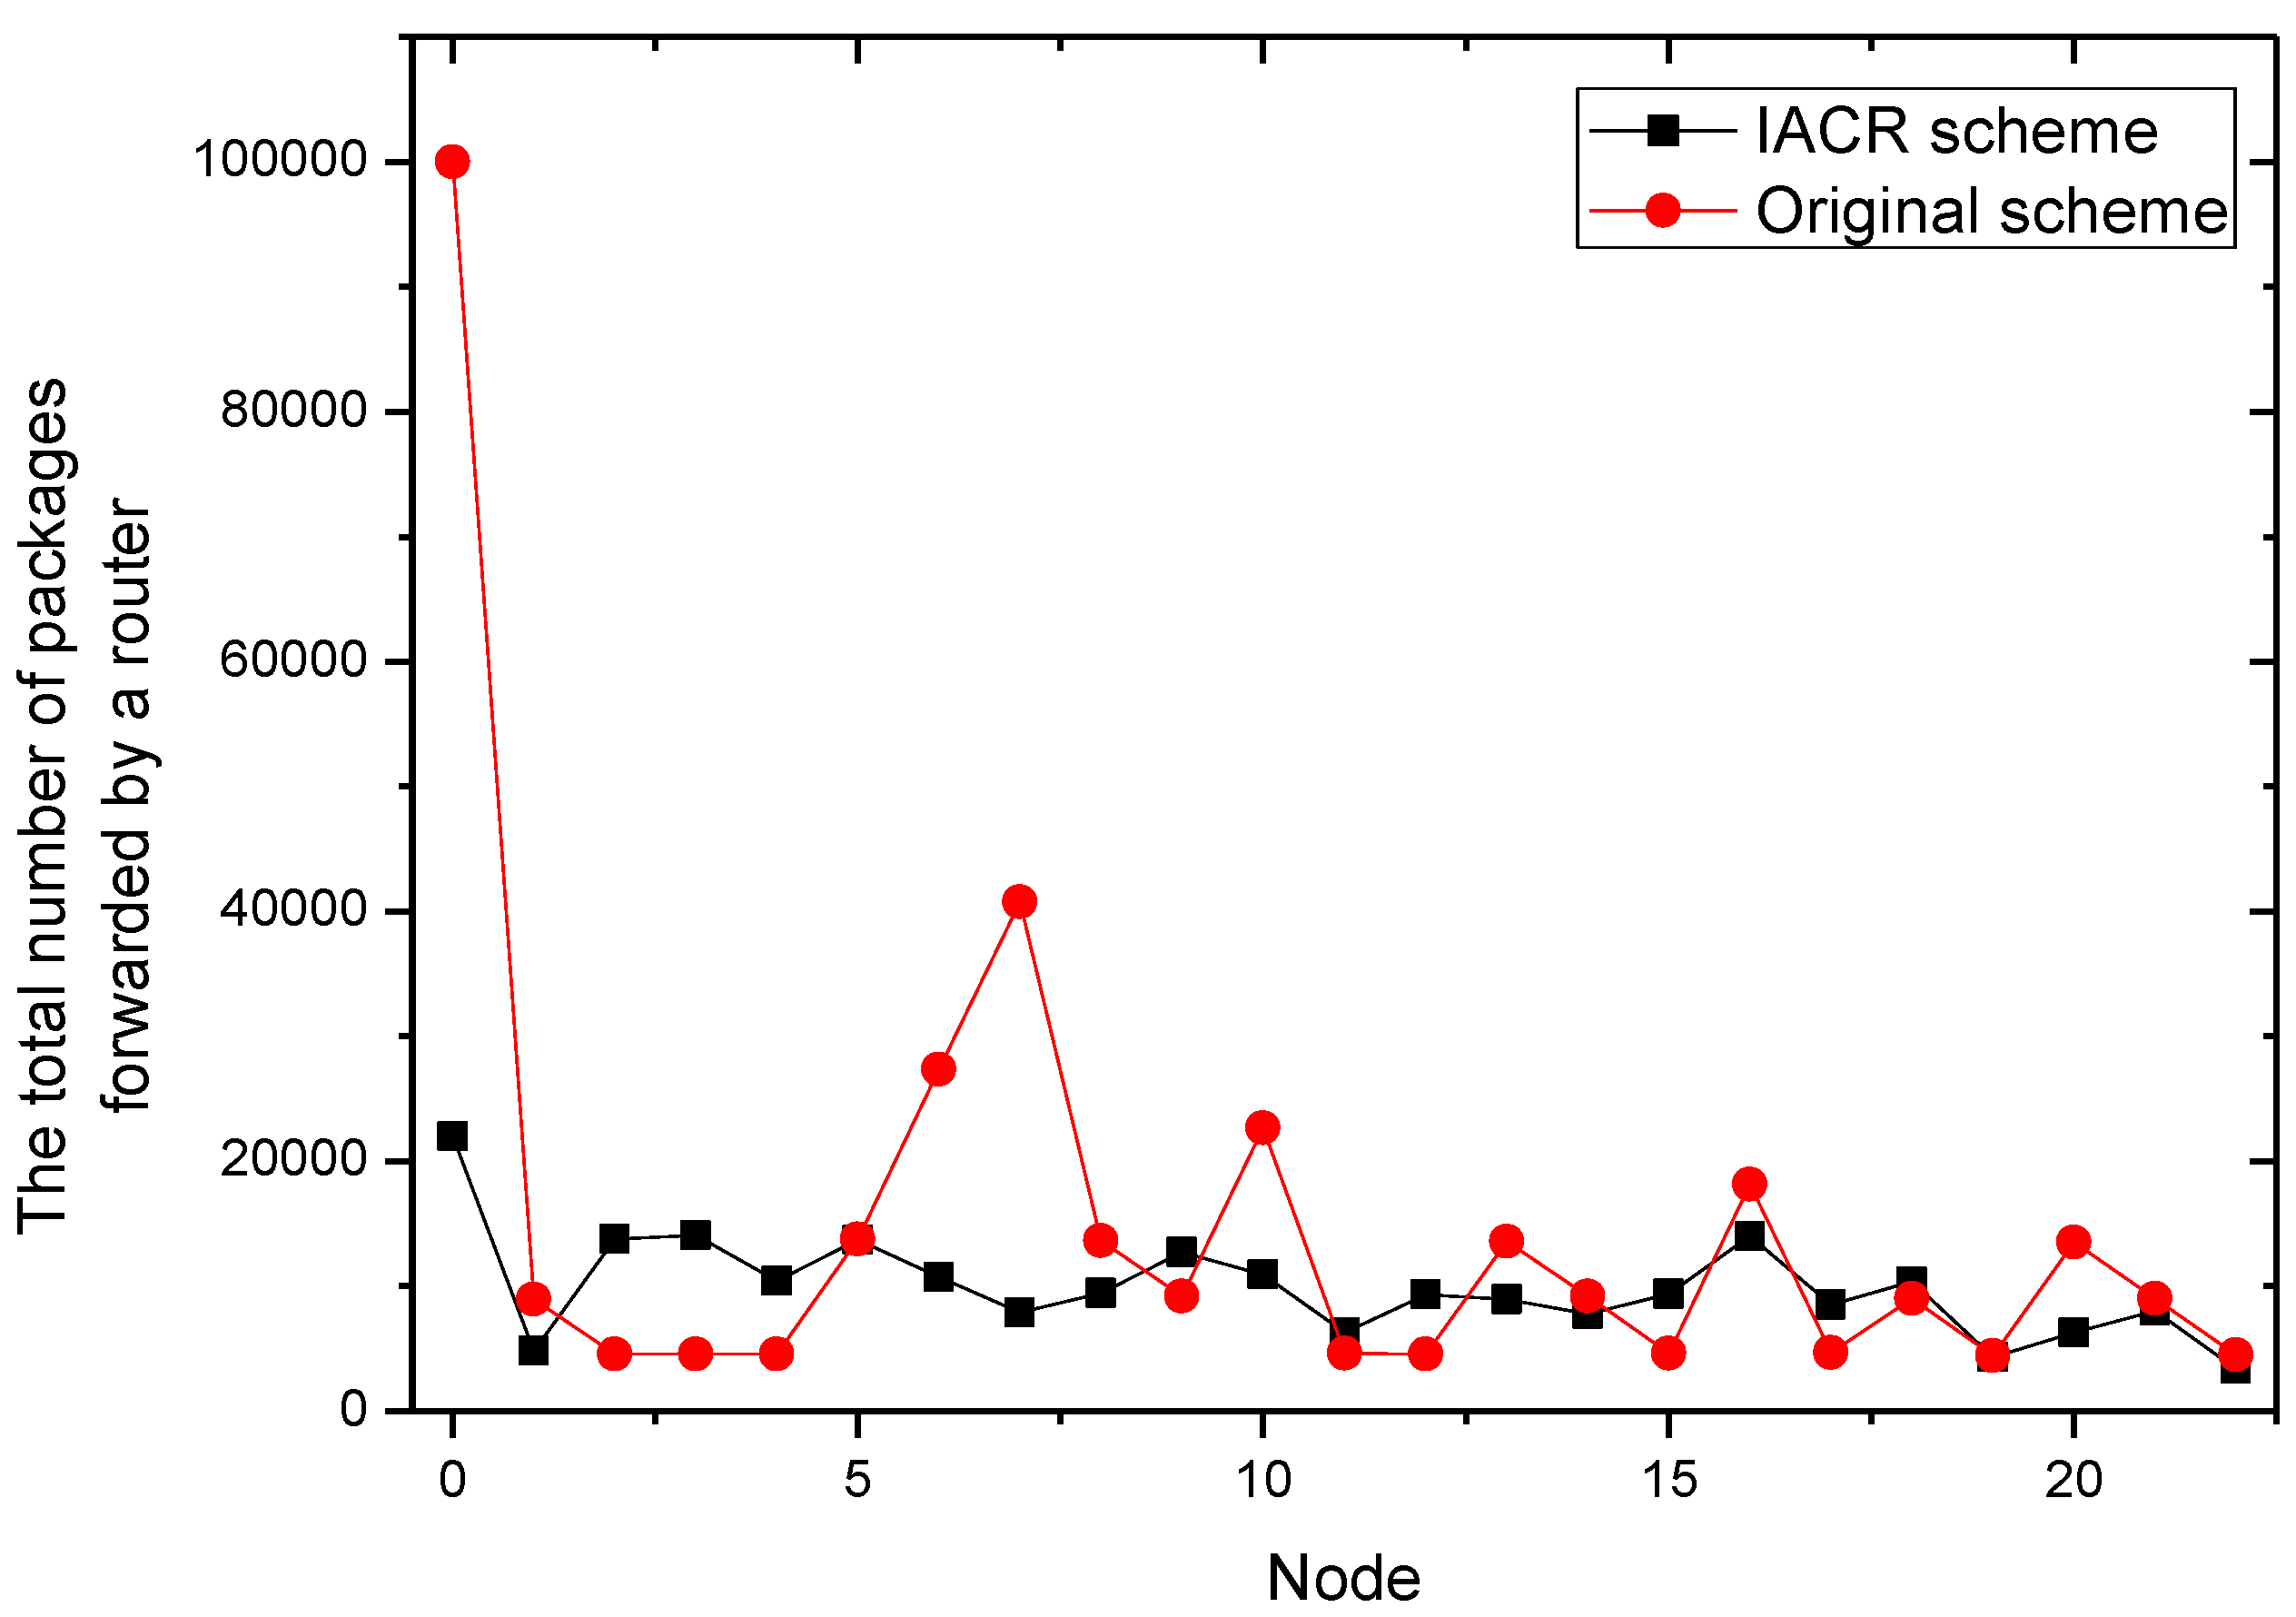
Figure 26.
The number of packages passing through different nodes in the American backbone network with 100,000 packages in the IACR and the original routing schemes in Set 2.
Figure 26.
The number of packages passing through different nodes in the American backbone network with 100,000 packages in the IACR and the original routing schemes in Set 2.

Figure 27.
The variance in the original routing scheme and the IACR scheme in Set 1 and Set 2 with 100,000 and 200,000 packages in the American backbone network.
Figure 27.
The variance in the original routing scheme and the IACR scheme in Set 1 and Set 2 with 100,000 and 200,000 packages in the American backbone network.

Figure 28.
The total number of packages passing through the American network and the total time the packages spent travelling in the network in Set 1 and Set 2.
Figure 28.
The total number of packages passing through the American network and the total time the packages spent travelling in the network in Set 1 and Set 2.
© 2017 by the authors. Licensee MDPI, Basel, Switzerland. This article is an open access article distributed under the terms and conditions of the Creative Commons Attribution (CC BY) license (http://creativecommons.org/licenses/by/4.0/).
Share and Cite
MDPI and ACS Style
Xu, J.; Liu, X.; Ma, M.; Liu, A.; Wang, T.; Huang, C. Intelligent Aggregation Based on Content Routing Scheme for Cloud Computing. Symmetry 2017, 9, 221. https://doi.org/10.3390/sym9100221
AMA Style
Xu J, Liu X, Ma M, Liu A, Wang T, Huang C. Intelligent Aggregation Based on Content Routing Scheme for Cloud Computing. Symmetry. 2017; 9(10):221. https://doi.org/10.3390/sym9100221
Chicago/Turabian StyleXu, Jiachen, Xiao Liu, Ming Ma, Anfeng Liu, Tian Wang, and Changqin Huang. 2017. "Intelligent Aggregation Based on Content Routing Scheme for Cloud Computing" Symmetry 9, no. 10: 221. https://doi.org/10.3390/sym9100221
Note that from the first issue of 2016, this journal uses article numbers instead of page numbers. See further details here.