Image Recovery of an Infrared Sub-Imaging System Based on Compressed Sensing

College of Information and Communication Engineering, Harbin Engineering University, Harbin 150001, China
*
Author to whom correspondence should be addressed.
Symmetry 2017, 9(11), 260; https://doi.org/10.3390/sym9110260
Submission received: 26 September 2017
/
Revised: 12 October 2017
/
Accepted: 23 October 2017
/
Published: 2 November 2017
Abstract
:An infrared (IR) sub-imaging system is composed of an optical scanning device and a single IR detector, which provides the target location information to the servo system. Currently, further improvement of positioning accuracy and imaging quality in the traditional rosette scanning guidance mode is experiencing a bottleneck. The emergence of the compressed sensing (CS) technique provides a new solution for this problem as it can recover a high-resolution IR image including richer information with fewer sampling points. In this paper, the complementarity of the CS framework and IR rosette sub-imaging system was analyzed. A new method to improve the resolution of reconstructed IR images, multi-frame joint compressive imaging (MJCI), was proposed. The simulation results revealed the potential of the CS technique when applied to the IR sub-imaging system and demonstrated that the proposed method performed well for reconstruction.
1. Introduction
Compressed sensing (CS) is an emerging technique that achieves sampling and compression processing simultaneously [1,2,3]. According to CS theory, a sparse (or compressible) signal can be recovered from incomplete linear measurements. Supposing that a signal can be represented in a given standard orthogonal basis with coefficients, the incomplete measurement can be obtained from using the measurement matrix . Then, the original signal can be perfectly recovered by solving an optimization problem. Most of the data will be abandoned within the sampling process in CS theory when compared to the traditional sampling method, which samples first and then compresses the data before transmission and storage. The CS technique reduces the cost of front-end sampling and gives the complicated signal reconstruction task to the powerful back-end computer. CS theory makes use of the novel idea that it is possible to recover a signal with much fewer samples.
An infrared (IR) imaging guidance system was used to detect, identify, and track the target by processing the thermal energy radiated from the target [4,5]. The development of the IR imaging guidance technique can be divided into two generations. The first generation is optical scanning sub-imaging guidance, which consists of an optical scanning device and a single or line detector [6] such as the typical monochrome and dual-color multi-petal rosette scanning pattern. The second generation is focal plane array (FPA) imaging guidance. The pace of IR imaging technique development partly depends on the progress of the IR detector. IR detector technology has been developed from the unit or the line array detector to the FPA detector. Performance, reliability, miniaturization, and uncooled direction are increasing for the FPA; however, FPA imaging technology is not applicable in low-cost scenarios as it is less cost-effective than optical scanning sub-imaging technology. Therefore, we studied the potential application of the CS technique to improve the imaging resolution of the sub-imaging system.
An IR rosette scan sub-imaging system (IRSSIS) is a kind of IR sub-imaging system, and is the most effective one when compared with other scanning methods. It has the advantages of high sensitivity, long operating range, and effective suppression of background interference. Meanwhile, it also has defects such as low resolution, high overlap rate, and blind area. The IRSSIS scans the total field of view (TFOV) with a single IR detector using a rosette scanning pattern. The IR detector can receive the radiation energy of the instantaneous field of view (IFOV), which is usually small. The smaller the IFOV, the higher the imaging resolution. However, if the IFOV is designed to be too small, it cannot cover the full space. Even if the IFOV is able to cover the entire field of view (FOV), the final image obtained is of low-resolution, which is called a sub-image. Based on the existing seeker hardware structure, CS theory offers a new way to recover a better quality image for the IRSSIS.
The IR imaging guidance technique has been an important development direction in the field of precision guidance. The purpose of studying the potential application of the CS framework for the IRSSIS was to reconstruct an IR image that contained more valuable information about targets, which is beneficial for subsequent target detection, identification, and tracking work. On this issue, other scholars have carried out related research [7,8,9]. In Reference [8], Uzeler et al. introduced the rosette measurement matrix for single detector rosette scanning systems. Numerical simulations of the proposed scheme showed that the rosette measurement matrix was feasible in reconstructing the IR images captured by a long-wave IR camera and the synthetic IR images. Nevertheless, the quality of the reconstructed IR image is subject to target location in the FOV.
In this paper, we further studied the possibility and recovery performance of the CS technique applied to the IRSSIS. The IRSSIS works with only a single detector. There are several single-pixel imaging applications based on CS theory [10,11,12,13], which reveal the potential of the compressive imaging technique. In addition, a new compressive imaging method to improve the IR image resolution was proposed. The numerical simulation results demonstrated that the proposed method could effectively improve the resolution of the reconstructed IR image under the condition of less sampling points.
The remainder of this paper is organized as follows. Section 2 introduces the background of CS theory and the IRSSIS. Section 3 presents an analysis of the CS technique applied to the IRSSIS. Furthermore, the IFOV measurement matrix and the multi-frame joint compressive imaging (MJCI) method are introduced. Section 4 presents some simulations to validate the MJCI method. Section 5 concludes this paper.
2. Relevant Background
2.1. Compressed Sensing
CS is a novel sampling framework in signal processing introduced by Donoho and Candes [1,2,3]. CS suggests that a sparse signal can be recovered from fewer measurements, and aims to capture the characteristics of the signal using fewer samples. Consider a signal , which can be sparsely represented over a fixed sparsity dictionary , .
where is the coefficient vector that represents on . A vector given by Equation (1) is called the -sparse signal if . The sparsity of the signal is a priori condition of CS.
CS compresses the -sparse signal by a non-square matrix , where . The output vector is called the measurement vector and is called the measurement matrix, can be written as:
where is called the sensing matrix.
The original signal can be recovered from by solving the sparse expression , which satisfies .
It is known that Equation (3) is generally NP-hard [14] and some feasible solutions are used. These methods can be divided into two classes, one is to convert the -norm minimization into the -norm minimization, given that the -norm minimization is equivalent to the -norm minimization under certain conditions [15]. CS theory points out that the signal can be recovered by solving the problem given in Equation (4) through the linear programming (LP) technique.
2.2. Infrared Rosette Scan Sub-Imaging System
The rosette scanning pattern of the IRSSIS is formed by two titled prisms or mirrors. When the two optical elements rotate around the spin axis at different frequencies and in the opposite direction, the IR detector can receive the thermal energy of the IFOV with a rosette pattern. Figure 1 shows the typical optical scanning structure of the IRSSIS.
The loci of the rosette scanning pattern can be represented in Cartesian coordinates by:
where is the radius of the TFOV. and are the initial phases of the rotary drive motor of the two optical elements. The IR detector receives the thermal radiation of the IFOV according to the rosette scanning pattern. The size of the IFOV is defined as:
where the number of petals in the rosette scanning pattern is , , , , is the greatest common divisor of and . Furthermore, the region of the IFOV contains many pixels rather than one pixel. The background noise can be reduced greatly if the IFOV is as small as possible. However, if the IFOV is too small, the scanning pattern may not cover the full observation space.
The received thermal radiation is converted to electrical signal by the IR detector in the traditional imaging mode. Then, a low-resolution sub-image is obtained after a series of signal processing steps, which contains the possible location information and the shape characteristics of the target. Subsequently, the IRSSIS will be transferred into the target detection, identification, and tracking mode. A large number of samples are usually collected during the sampling process to acquire more reference information, which increases the difficulty of real-time processing and wastes lots of resources in the compression process. However, even so, the imaging resolution is not sufficient to meet the accuracy requirements. The conventional approach in the IRSSIS is to face the bottleneck of improving the imaging resolution.
3. Multi-Frame Joint Compressive Imaging Method
The measurement matrix is a key element in the CS framework which projects the desired high dimensional signal onto a low dimensional signal. The general measurement matrix is the random measurement matrix such as the random Gaussian measurement matrix, and the random Bernoulli measurement matrix. The other is the deterministic measurement matrix, which has recently become a hot research topic [20,21,22]. However, these two measurement matrices are mostly implemented by the digital micro-mirror device (DMD), and the realization process is more complex. The research on optical imaging systems based on a CS framework is in full swing [23,24,25]. In this paper, the proposed measurement matrix can be implemented in another way in the form of light-machine scanning, which is different from the traditional DMD and phase mask methods.
As previously mentioned, the single IR detector receives the radiation of the IFOV with a rosette scanning pattern in the IRSSIS. Here, the IFOV is not one pixel, but a small area, and is related to the optical system and the detector. Every radiation of the IFOV can be seen as one measurement data corresponding to the total radiation intensity of a region. The compressed data can be obtained by sampling the output signal of the IR detector. Finally, some recovery algorithms are used to reconstruct the scene. While the construction of the measurement matrix in the IRSSIS is generated from the optical scanning system itself, which realizes the application of the CS framework physically, and the constructed measurement matrix is determined and is equally difficult to optimize. In other words, the entire scanning process in the IRSSIS can be viewed as an observation behavior in CS. The physical implementation of the measurement matrix usually is a thorny problem in CS theory, but this problem is solved through optical scanning in the IRSSIS. On the other hand, the IRSSIS can obtain a better resolution IR image by sampling only a small number of samples. It can be said that the two are just a complementary relationship. The details of the measurement matrix construction and the MJCI method are presented in the next subsection.
3.1. IFOV Measurement Matrix
In a traditional IRSSIS, the smaller the IFOV, the higher the imaging resolution. However, the IFOV is too small to cover the entire observation space. On the contrary, the imaging resolution is no longer subject to the IFOV size in the new rosette imaging manner based on CS, and the smaller IFOV means less computational complexity. In the rosette scanning pattern, every IFOV can form a sub-matrix. Figure 2a shows a rosette scanning pattern with and . The center position of each IFOV is assigned by Equation (5). The conventional diameter of the IFOV is usually defined by Equation (6), which is about 16 pixels here. If the pixel location lies in the region of the IFOV completely, the corresponding value of the sub-matrix is set to one. The pixel value at the edge of the IFOV takes the proportion of the intersection. The remaining pixel values are set to zero. Every IFOV produces a sub-matrix and the sub-matrix forms the row of the IFOV measurement matrix by the vectorization operation. This new observation using the IFOV measurement matrix can be seen as a non-uniform block observation. The block size is determined by the IFOV, and the block position depends on the number of samples. Figure 2b shows part of an IFOV sub-matrix and the diameter of the IFOV is 15 pixels.
To illustrate the construction of the IFOV measurement matrix more vividly, we describe it in a mathematical way. Suppose that samples are acquired in a frame of time. The instantaneous positions of the samples can be derived from Equation (5). Every sample corresponds to a sub-matrix , which contains an IFOV at different positions. A row vector can be obtained by vectorizing a sub-matrix. We can obtain row vectors in the same way (). The IFOV measurement matrix can be expressed as:
3.2. Multi-Frame Joint Compressive Imaging
According to the trait of the rosette scanning pattern, the samples in the center of the TFOV are denser than in the other regions. The reconstruction performance of the IR image is affected by the target position in the FOV. The quality of the reconstructed IR image when the target locates the center is better than in the other areas. To resolve this problem, this paper proposed the MJCI scheme to improve the imaging quality, especially for situations that the target locates in the sparse sampling areas.
The rosette scanning system itself has randomness. It can be observed from the loci of the rosette scanning pattern that the instantaneous position of the IR detector in the FOV is related to the initial phases and except for the rotating frequencies and . The rosette scanning pattern rotates a certain angle in a direction when the initial phases and change. The proposed MJCI method is derived from this feature. The loci of the rosette scanning pattern at any time can be expressed in polar coordinates by:
It can be seen that when the polar radius , the IFOV happens to be at the top of the rose petal at this moment. Suppose that the initial phases of the current frame are and , the rotation angle with respect to the rosette scanning pattern in the previous frame is:
where . Once are fixed, the rotation angle of the rosette scanning pattern depends only on and . Figure 3a shows the rosette scanning pattern with and . Figure 3b shows the rosette scanning pattern with the same parameter values and here .
In the process of observing the FOV via the rosette scanning mode, the measurements could contain more valuable information with a wider range of observations. The MJCI method can achieve this through a multi-frame joint approach. If 3000 samples need to be collected in single-frame compressive imaging, the 3000 samples can be obtained in batches by two or three frames in the MJCI proposal. It is even more critical for this approach to obtain a wider range of observations. Figure 4a shows the superimposed observation area of two frames with a total of 3000 samples. Figure 4b shows the superimposed observation area of three frames with a total of 3000 samples.
By comparing Figure 3 and Figure 4, it can be seen that the observation range of two or three frames was larger than that of one frame. Correspondingly, the IFOV can also be small on the basis of a wide observation range without affecting the imaging quality. The superiority of the MJCI method is to broaden the scope of observations and make the measurements contain more information. In addition, it further reduces the number of samples required per frame. This new compressive imaging approach can greatly improve the resolution of reconstructed IR images, especially for the target locates in a non-central position of the FOV. Figure 5 shows the diagram of three-frame joint compressive imaging framework.
4. Simulations and Discussions
In this section, numerical simulations were conducted to validate the imaging performance of the IFOV measurement matrices and MJCI scheme. The test IR images were pixels in size with 256 gray levels. The discrete cosine transform (DCT) matrix was chosen as the sparsity basis. The generalized orthogonal matching pursuit (gOMP) algorithm was used to reconstruct the IR image [26]. All simulations were run on a PC with a 2.1 GHz Intel Xeon CPU and Windows 7 system. The algorithms were implemented in MATLAB.
4.1. IFOV Measurement Matrices
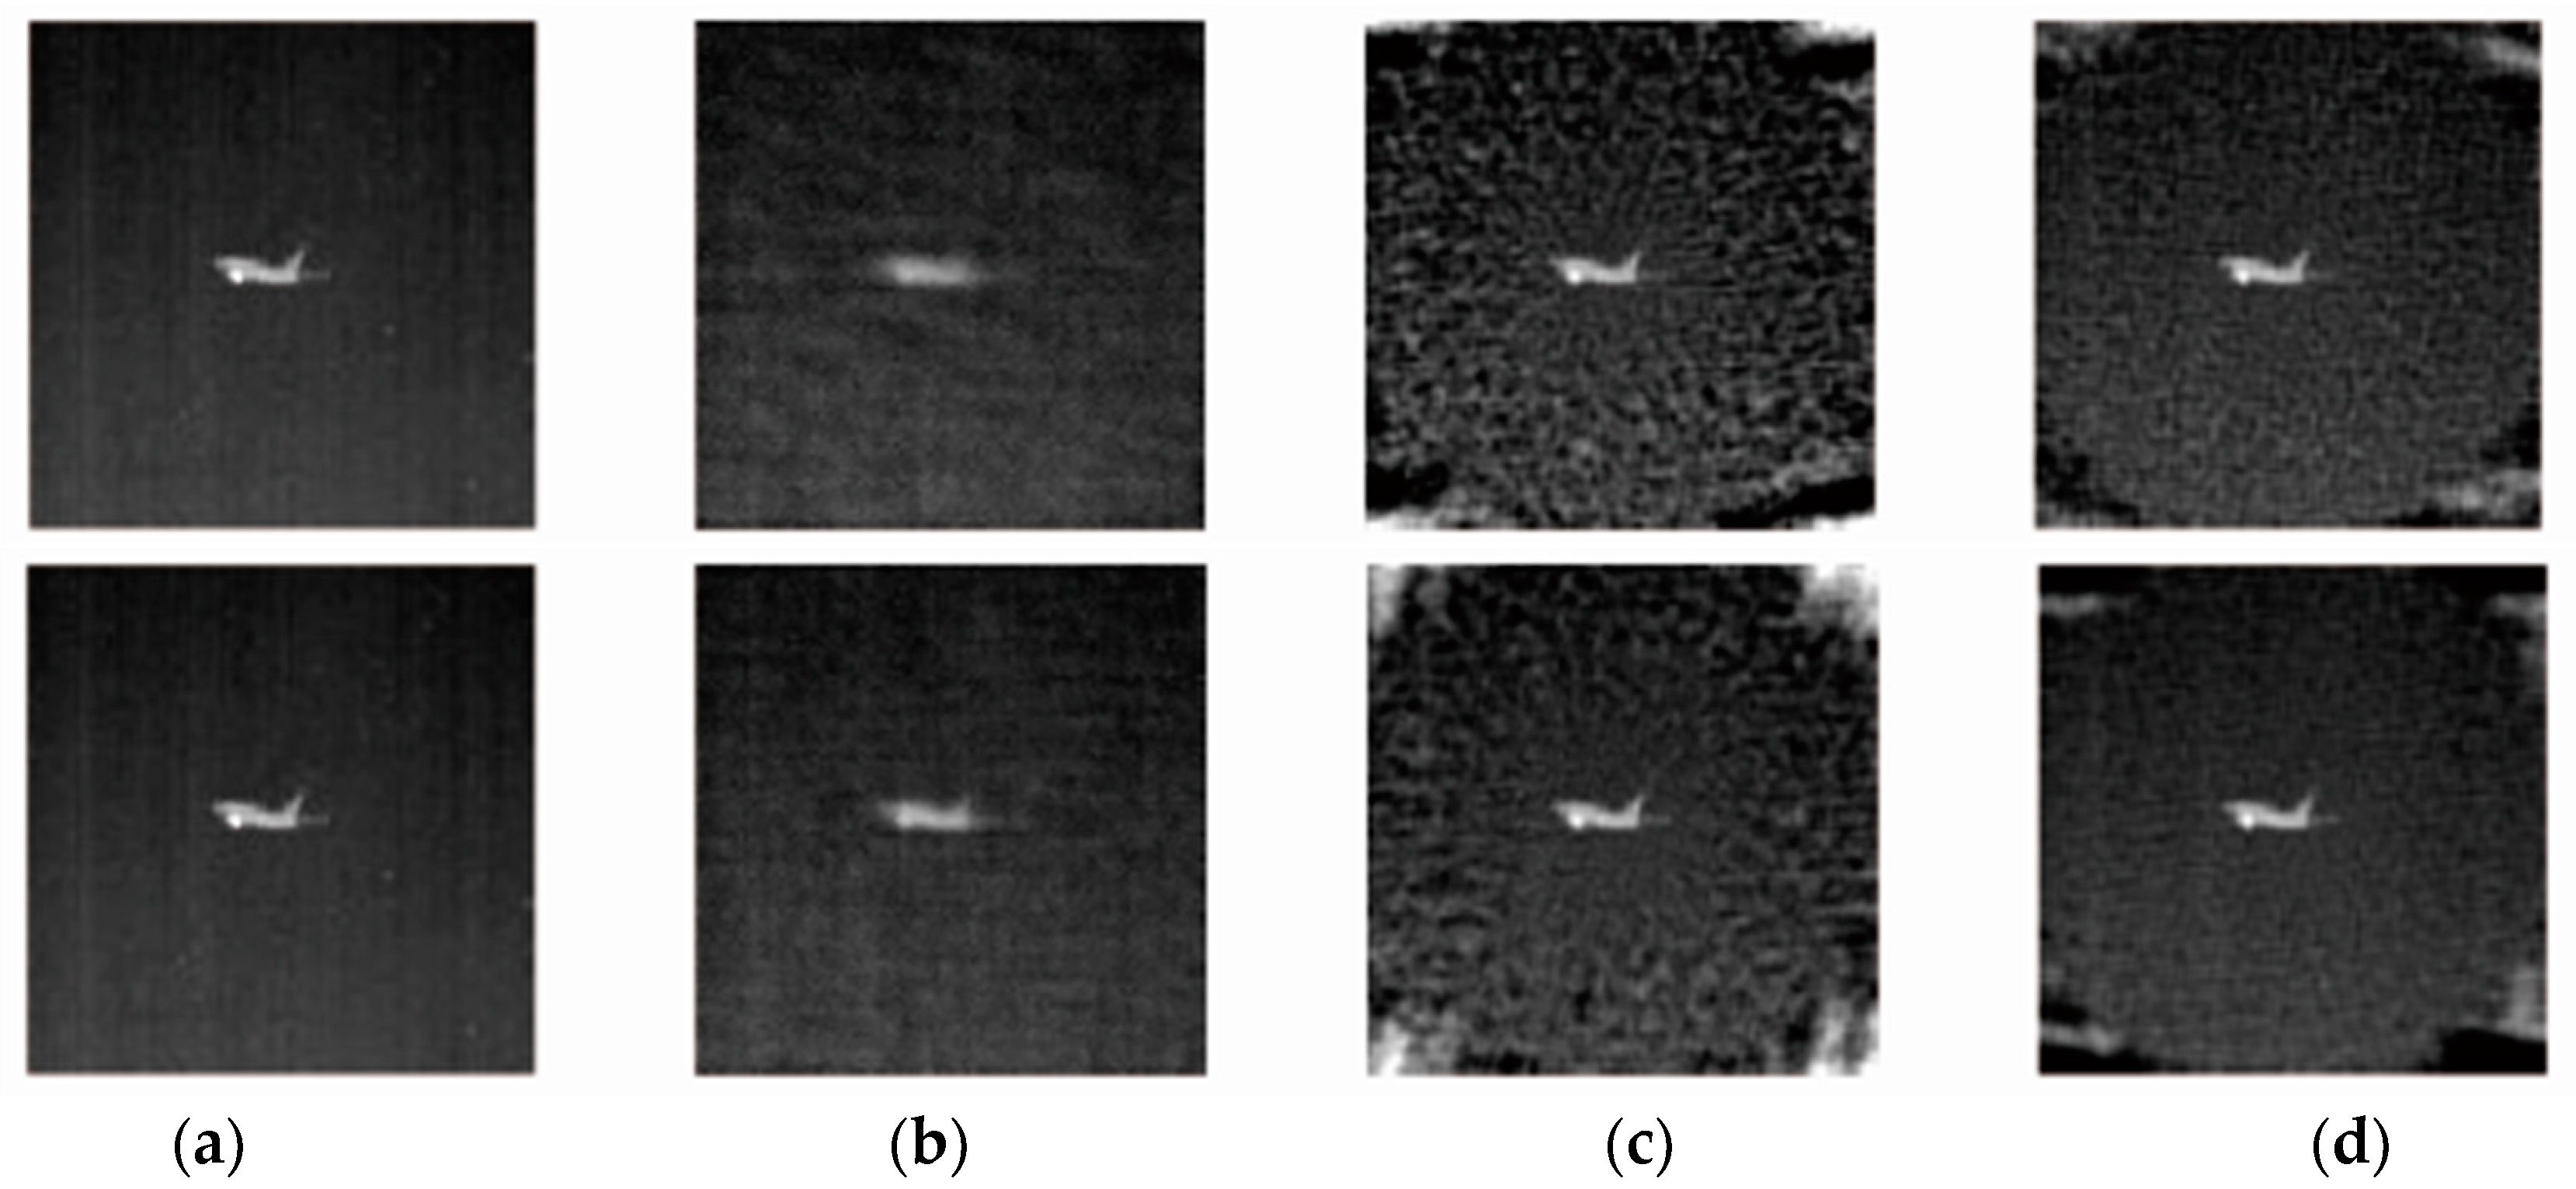
In this subsection, we tested the IR image reconstruction performance of the IFOV measurement matrix with different IFOV diameters. The IFOV measurement matrix construction is described in Section 3.1. For comparison, a random Gaussian measurement matrix was performed in the simulations. In addition, we observed the IR image reconstruction effect under different compression ratios and different target positions, which could be used to illuminate the reconstruction ability of the IFOV measurement matrices comprehensively. The results are shown in Figure 6.
It can be seen from Figure 6 that the reconstruction performance of the IFOV measurement matrices were comparable to or even better than that of the random measurement matrices. In the reconstructed images using the IFOV measurement matrix, although there was more noise, the target resolution was higher and the target contour discernible. This phenomenon was more pronounced when the target locates in the central position. When the target was on the edge, the IR image reconstruction quality was poor and the target contour blurred. This result was determined by the characteristics of the rosette scanning mode as there is a scanning blind spot in the four corners as shown in Figure 3. The sampling in the central position was more intensive, so the reconstructed image quality was better when the target was in the center. Moreover, the change in compression ratio did not have a significant effect on the IR image reconstruction based on the special sampling method. As seen in Figure 6, when the target locates on the edge, the reconstructed image quality could not be improved by increasing the sampling points. Similarly, when the target was located in the center, reducing the number of samples did not degrade the quality of the reconstructed image.
Furthermore, the influence of the IFOV measurement matrix with different diameters on IR image reconstruction could be ignored, but the IFOV could not be too small. Simulation results showed that only the single-frame compressive imaging mechanism was limited in some cases such as when the target was in the corner. In general, the reconstruction performance of the IFOV measurement matrix was satisfactory, even in the case of low sampling rates.
4.2. Multi-Frame Joint Compressive Imaging
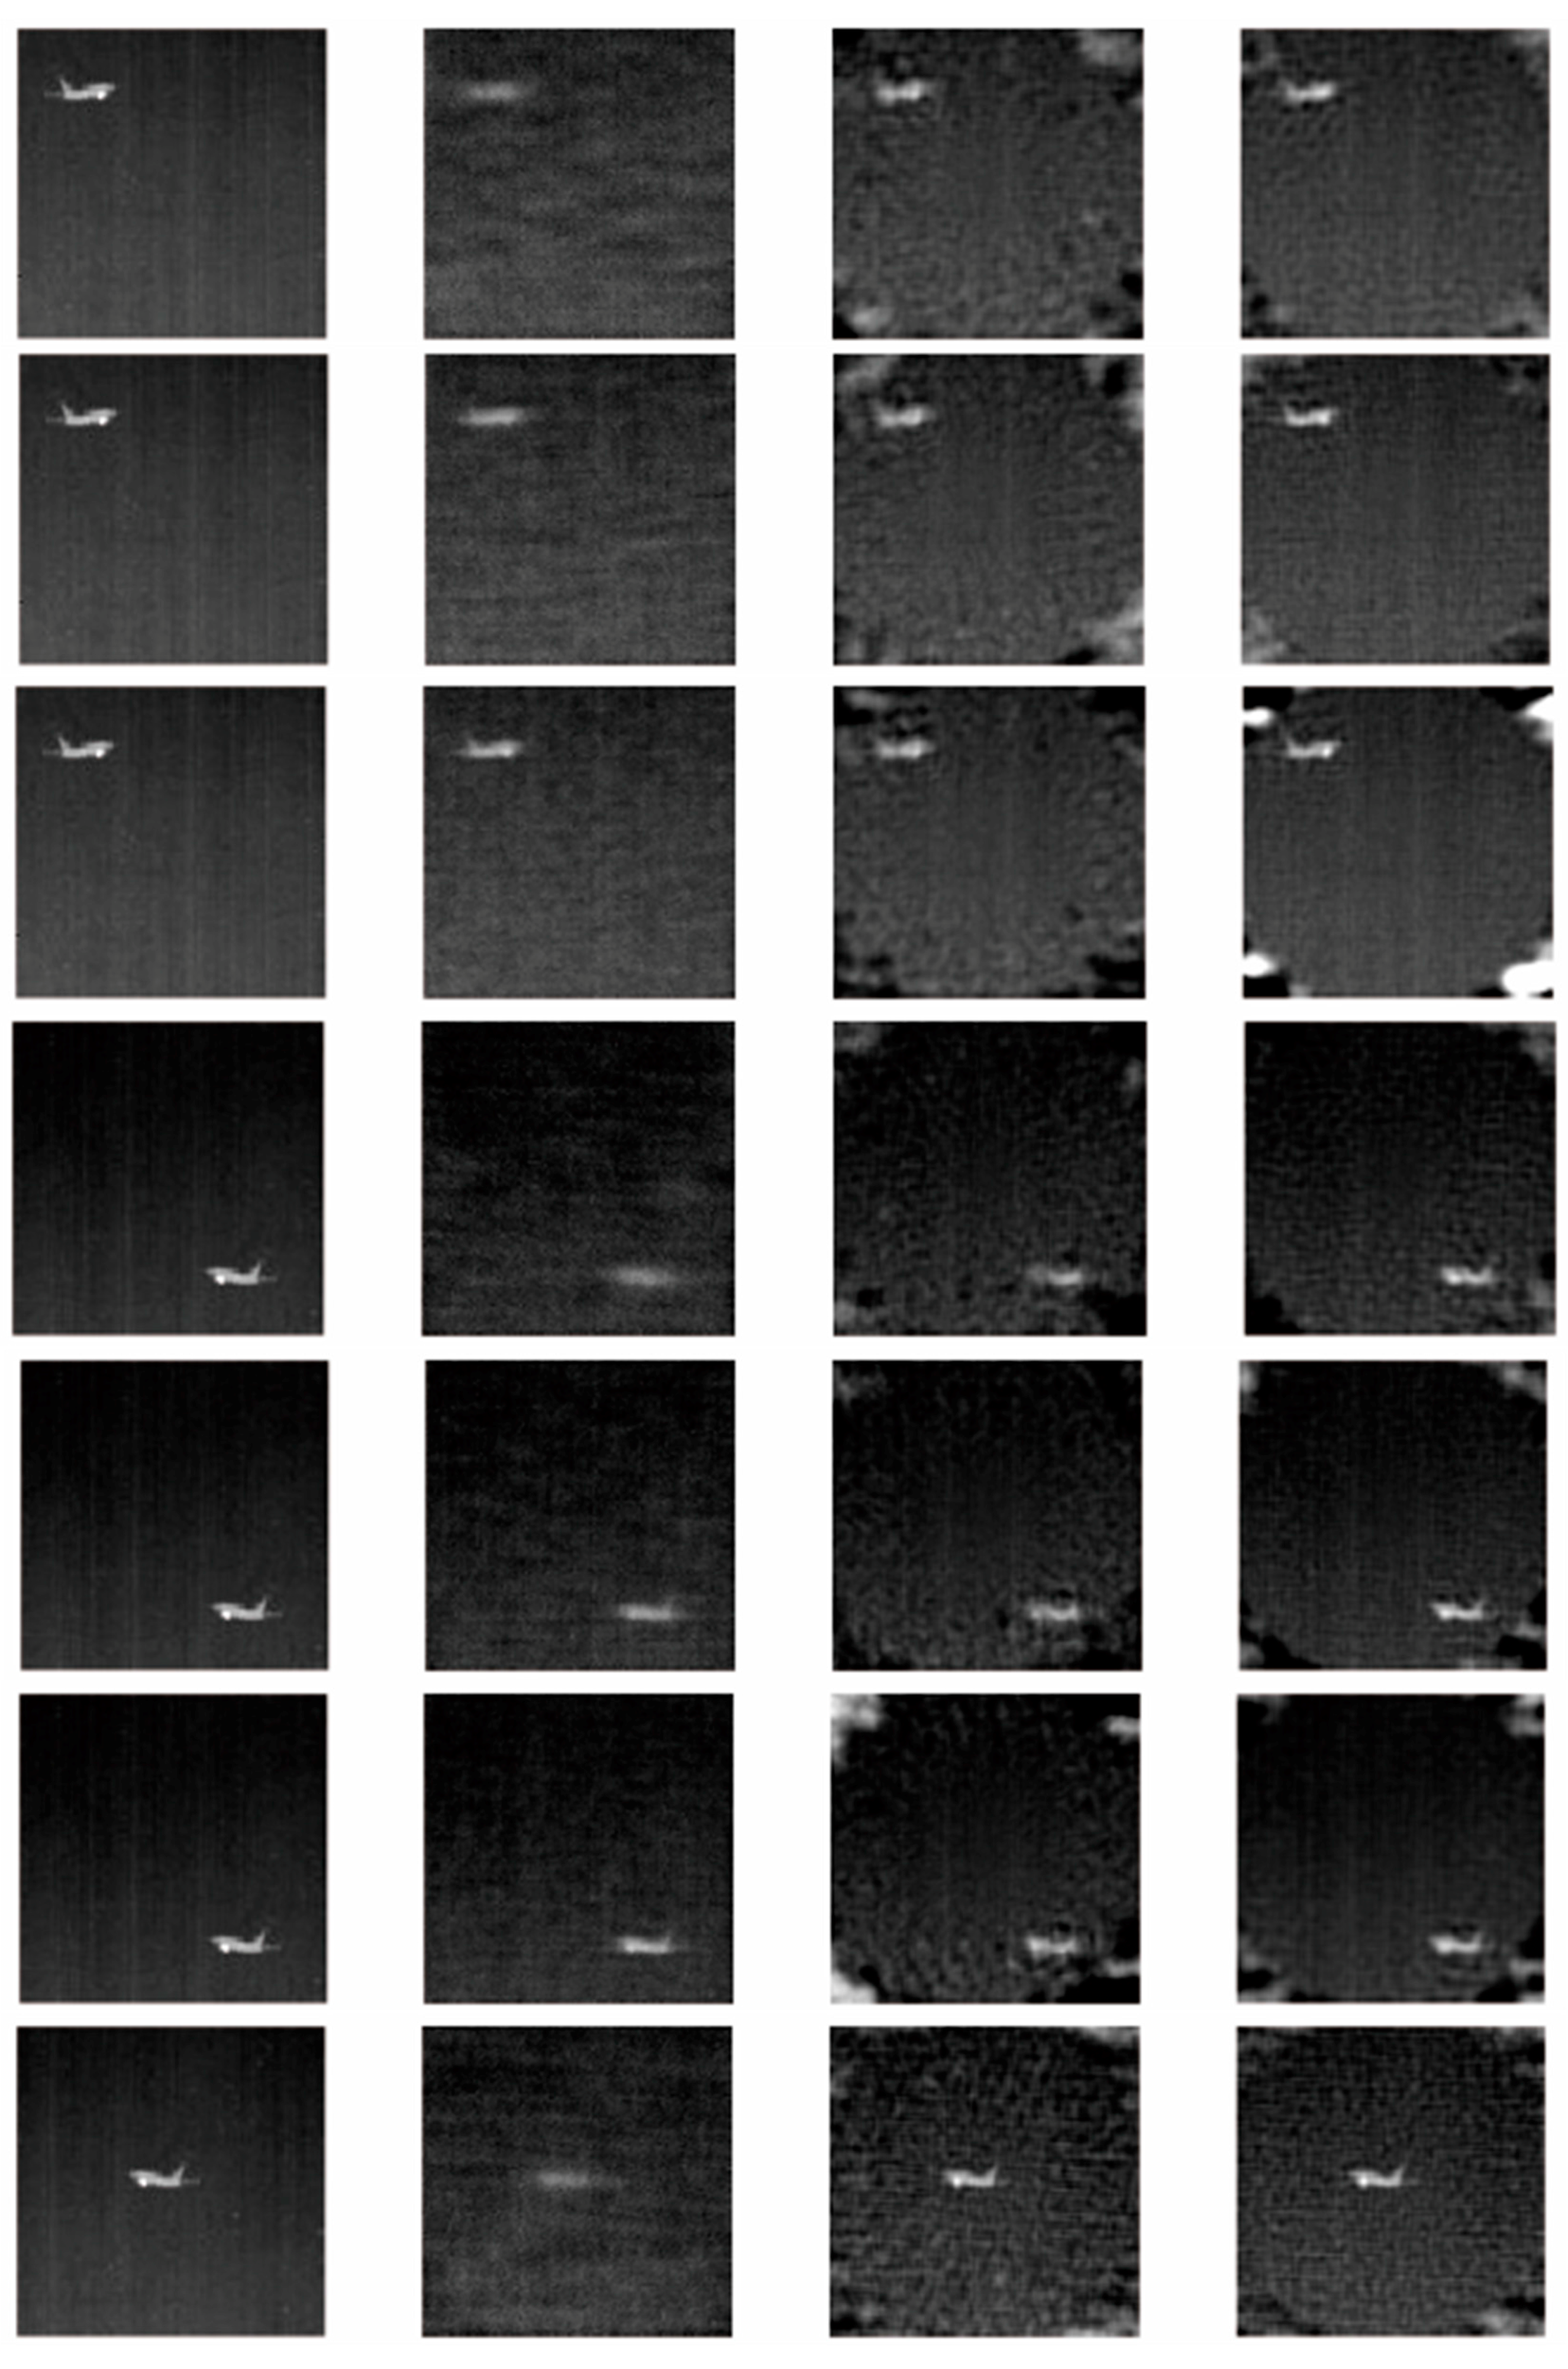
To further improve the imaging resolution of the reconstructed IR image, the MJCI method was proposed. In this subsection, two groups of simulations were performed to verify the reconstruction performance of two-frame joint compressive imaging method and three-frame joint compressive imaging method. The diameter of the IFOV measurement matrix was 11 pixels, and the initial phases followed the Gaussian distribution. In this section, the target position in the FOV was also considered. The results are shown in Figure 7 and Figure 8, respectively.
As shown in Figure 7 and Figure 8, the MJCI scheme was feasible and effective for IR image reconstruction. The MJCI method reproduced high-quality IR images with much fewer samples regardless of where the target was located in the FOV. At the same time, this method greatly reduced the noise in the reconstructed images and obtained better resolution IR images when compared to the single-frame compressive imaging approach shown in Figure 7 and Figure 8. The function of noise reduction was more obvious as the sampling point increased. The reconstruction performance of the random measurement matrices was far less than the MJCI approach. In addition, the three-frame compressive imaging method could effectively reduce the effect of edge noise versus the two-frame compressive imaging method. It was observed from Figure 6, Figure 7 and Figure 8 that all reconstructed IR images contained a large amount of noise around them, which was due to the fact that there were few samples in these locations. To further test the quality of the recovered IR images, the average peak signal-to-noise ratio (PSNR) was used to quantify the recovery performance. The results are shown in Table 1 where it can be seen that the PSNR values of the single-frame and multi-frame methods were comparable to the random Gaussian matrix. However, the PSNR were not proportional to the number of samples in the MJCI method, which was influenced by the recovery algorithm. The sparsity level of an image was uncertain, so there was no effective algorithm for image reconstruction. Table 1 also shows that fewer samples may have a better recovery result by the MJCI method.
Table 2 shows the reconstruction time of the first test IR image in Section 4.2. From Table 2, it can be observed that a reduction in IFOV size could accelerate the image recovery, but sometimes would fail, such as the three-frame joint compressive imaging results when samples were 2700. The reason was that the number of required indices when the IFOV size was bigger than that when in the image recovery process by the gOMP algorithm.
5. Conclusions
In this paper, a new imaging fashion, termed MJCI, was presented to improve the imaging resolution for the IRSSIS. The new compressive imaging method combined the characteristics of the IRSSIS and CS theory and reconstructed a better quality IR image. The introduced IFOV measurement matrix formed by the optical scanning system satisfied the measurement matrix conditions and the size of the IFOV could be appropriately reduced, which was useful for accelerating the IR image recovery. Numerical simulations showed that the MJCI method could be used to reconstruct the IR image and exhibited a better recovery performance when compared with the single-frame IFOV measurement matrices and random Gaussian measurement matrices. In addition, the proposed MJCI method could perfectly recover an IR image even when the target location was not in the center of the FOV. The application of CS theory to the IR imaging system remains promising and challenging, and further research needs to be continued.
Acknowledgments
This work presented here was funded by the National Natural Science Foundation of China (61571146).
Author Contributions
Both the authors contributed equally to this paper.
Conflicts of Interest
The authors declare no conflict of interest.
References
- Donoho, D.L. Compressed sensing. IEEE Trans. Inf. Theory 2006, 52, 1289–1306. [Google Scholar] [CrossRef]
- Candes, E.J.; Tao, T. Decoding by linear programming. IEEE Trans. Inf. Theory 2006, 51, 4203–4215. [Google Scholar] [CrossRef]
- Candes, E.J.; Romberg, J.; Tao, T. Robust uncertainty principles: Exact signal reconstruction from highly incomplete frequency information. IEEE Trans. Inf. Theory 2004, 52, 489–509. [Google Scholar] [CrossRef]
- Jahng, S.G.; Hong, H.K.; Han, S.H.; Choi, J.S. Dynamic simulation of the rosette scanning infrared seeker and an infrared counter-countermeasure using the moment technique. Opt. Eng. 1999, 38, 921–928. [Google Scholar] [CrossRef]
- Jahng, S.G.; Hong, H.K.; Seo, D.S.; Choi, J.S. New infrared counter-countermeasure technique using an iterative self-organizing data analysis algorithm for the rosette scanning infrared seeker. Opt. Eng. 2000, 39, 2397–2404. [Google Scholar] [CrossRef]
- Rodger, J.A. Toward reducing failure risk in an integrated vehicle health maintenance system: A fuzzy multi-sensor data fusion kalman filter approach for ivhms. Expert Syst. Appl. 2012, 39, 9821–9836. [Google Scholar] [CrossRef]
- Uzeler, H.; Aytaç, T. Image generation for single detector infrared seekers via compressive sensing. J. Asian Stud. 2013, 49, 460–473. [Google Scholar]
- Uzeler, H.; Cakir, S.; Aytaç, T. Image reconstruction for single detector rosette scanning systems based on compressive sensing theory. Opt. Eng. 2016, 55, 023108. [Google Scholar] [CrossRef]
- Uzeler, H.; Aytaç, T. Compressive sensing applications for single detector rosette scanning infrared seekers. In Proceedings of the Electro-Optical and Infrared Systems: Technology and Applications XII and Quantum Information Science and Technology, San Francisco, CA, USA, 8–12 February 2015; pp. 1–4. [Google Scholar]
- Zhao, M.; Liu, J.; Chen, S.; Kang, C.; Xu, W. Single-pixel imaging with deterministic complex-valued sensing matrices. J. Eur. Opt. Soc. Rapid Publ. 2015, 10. [Google Scholar] [CrossRef]
- Shin, J.; Bosworth, B.T.; Foster, M.A. Single-pixel imaging using compressed sensing and wavelength-dependent scattering. Opt. Lett. 2016, 41, 886. [Google Scholar] [CrossRef]
- Duarte, M.F.; Davenport, M.A.; Takhar, D.; Laska, J.N.; Sun, T.; Kelly, K.F.; Baraniuk, R.G. Single-pixel imaging via compressive sampling. IEEE Signal Process. Mag. 2008, 25, 83–91. [Google Scholar] [CrossRef]
- Chan, W.L.; Charan, K.; Takhar, D.; Kelly, K.F.; Baraniuk, R.G.; Mittleman, D.M. A single-pixel terahertz imaging system based on compressed sensing. Appl. Phys. Lett. 2008, 93, 121105. [Google Scholar] [CrossRef]
- Natarajan, B.K. Sparse approximate solutions to linear systems. Siam J. Comput. 1995, 24, 227–234. [Google Scholar] [CrossRef]
- Candès, E.J. The restricted isometry property and its implications for compressed sensing. Comptes Rendus Math. 2008, 346, 589–592. [Google Scholar] [CrossRef]
- Tropp, J.A.; Gilbert, A.C. Signal recovery from random measurements via orthogonal matching pursuit. IEEE Trans. Inf. Theory 2007, 53, 4655–4666. [Google Scholar] [CrossRef]
- Donoho, D.L.; Tsaig, Y.; Drori, I.; Starck, J.L. Sparse solution of underdetermined systems of linear equations by stagewise orthogonal matching pursuit. IEEE Trans. Inf. Theory 2012, 58, 1094–1121. [Google Scholar] [CrossRef]
- Needell, D.; Vershynin, R. Signal recovery from incomplete and inaccurate measurements via regularized orthogonal matching pursuit. IEEE J. Sel. Top. Signal Process. 2007, 4, 310–316. [Google Scholar] [CrossRef]
- Dai, W.; Milenkovic, O. Subspace pursuit for compressive sensing signal reconstruction. IEEE Trans. Inf. Theory 2009, 55, 2230–2249. [Google Scholar] [CrossRef]
- Li, S.; Gao, F.; Ge, G.; Zhang, S. Deterministic construction of compressed sensing matrices via algebraic curves. IEEE Trans. Inf. Theory 2012, 58, 5035–5041. [Google Scholar] [CrossRef]
- Devore, R.A. Deterministic constructions of compressed sensing matrices. J. Complex. 2007, 23, 918–925. [Google Scholar] [CrossRef]
- Naidu, R.R.; Jampana, P.; Sastry, C.S. Deterministic compressed sensing matrices: Construction via euler squares and applications. IEEE Trans. Signal Process. 2016, 64, 3566–3575. [Google Scholar] [CrossRef]
- Neifeld, M.A.; Ke, J. Optical architectures for compressive imaging. Appl. Opt. 2007, 46, 5293. [Google Scholar] [CrossRef]
- Takhar, D.; Laska, J.N.; Wakin, M.B.; Duarte, M.F.; Baron, D.; Sarvotham, S.; Kelly, K.F.; Baraniuk, R.G. A new compressive imaging camera architecture using optical-domain compression. In Proceedings of the Computational Imaging IV, San Jose, CA, USA, 2 February 2006. [Google Scholar] [CrossRef]
- Sui, X.; Chen, Q.; Gu, G.; Shen, X. Infrared super-resolution imaging based on compressed sensing. Infrared Phys. Technol. 2014, 63, 119–124. [Google Scholar] [CrossRef]
- Jian, W.; Kwon, S.; Shim, B. Generalized orthogonal matching pursuit. IEEE Trans. Signal Process. 2014, 60, 6202–6216. [Google Scholar] [CrossRef]
Figure 1.
The optical scanning structure of the IRSSIS.

Figure 2.
(a) Rosette scanning pattern; and (b) an IFOV region, pixels.

Figure 3.
Rosette scanning pattern with (a) 3000 samples, ; and (b) 3000 samples, .
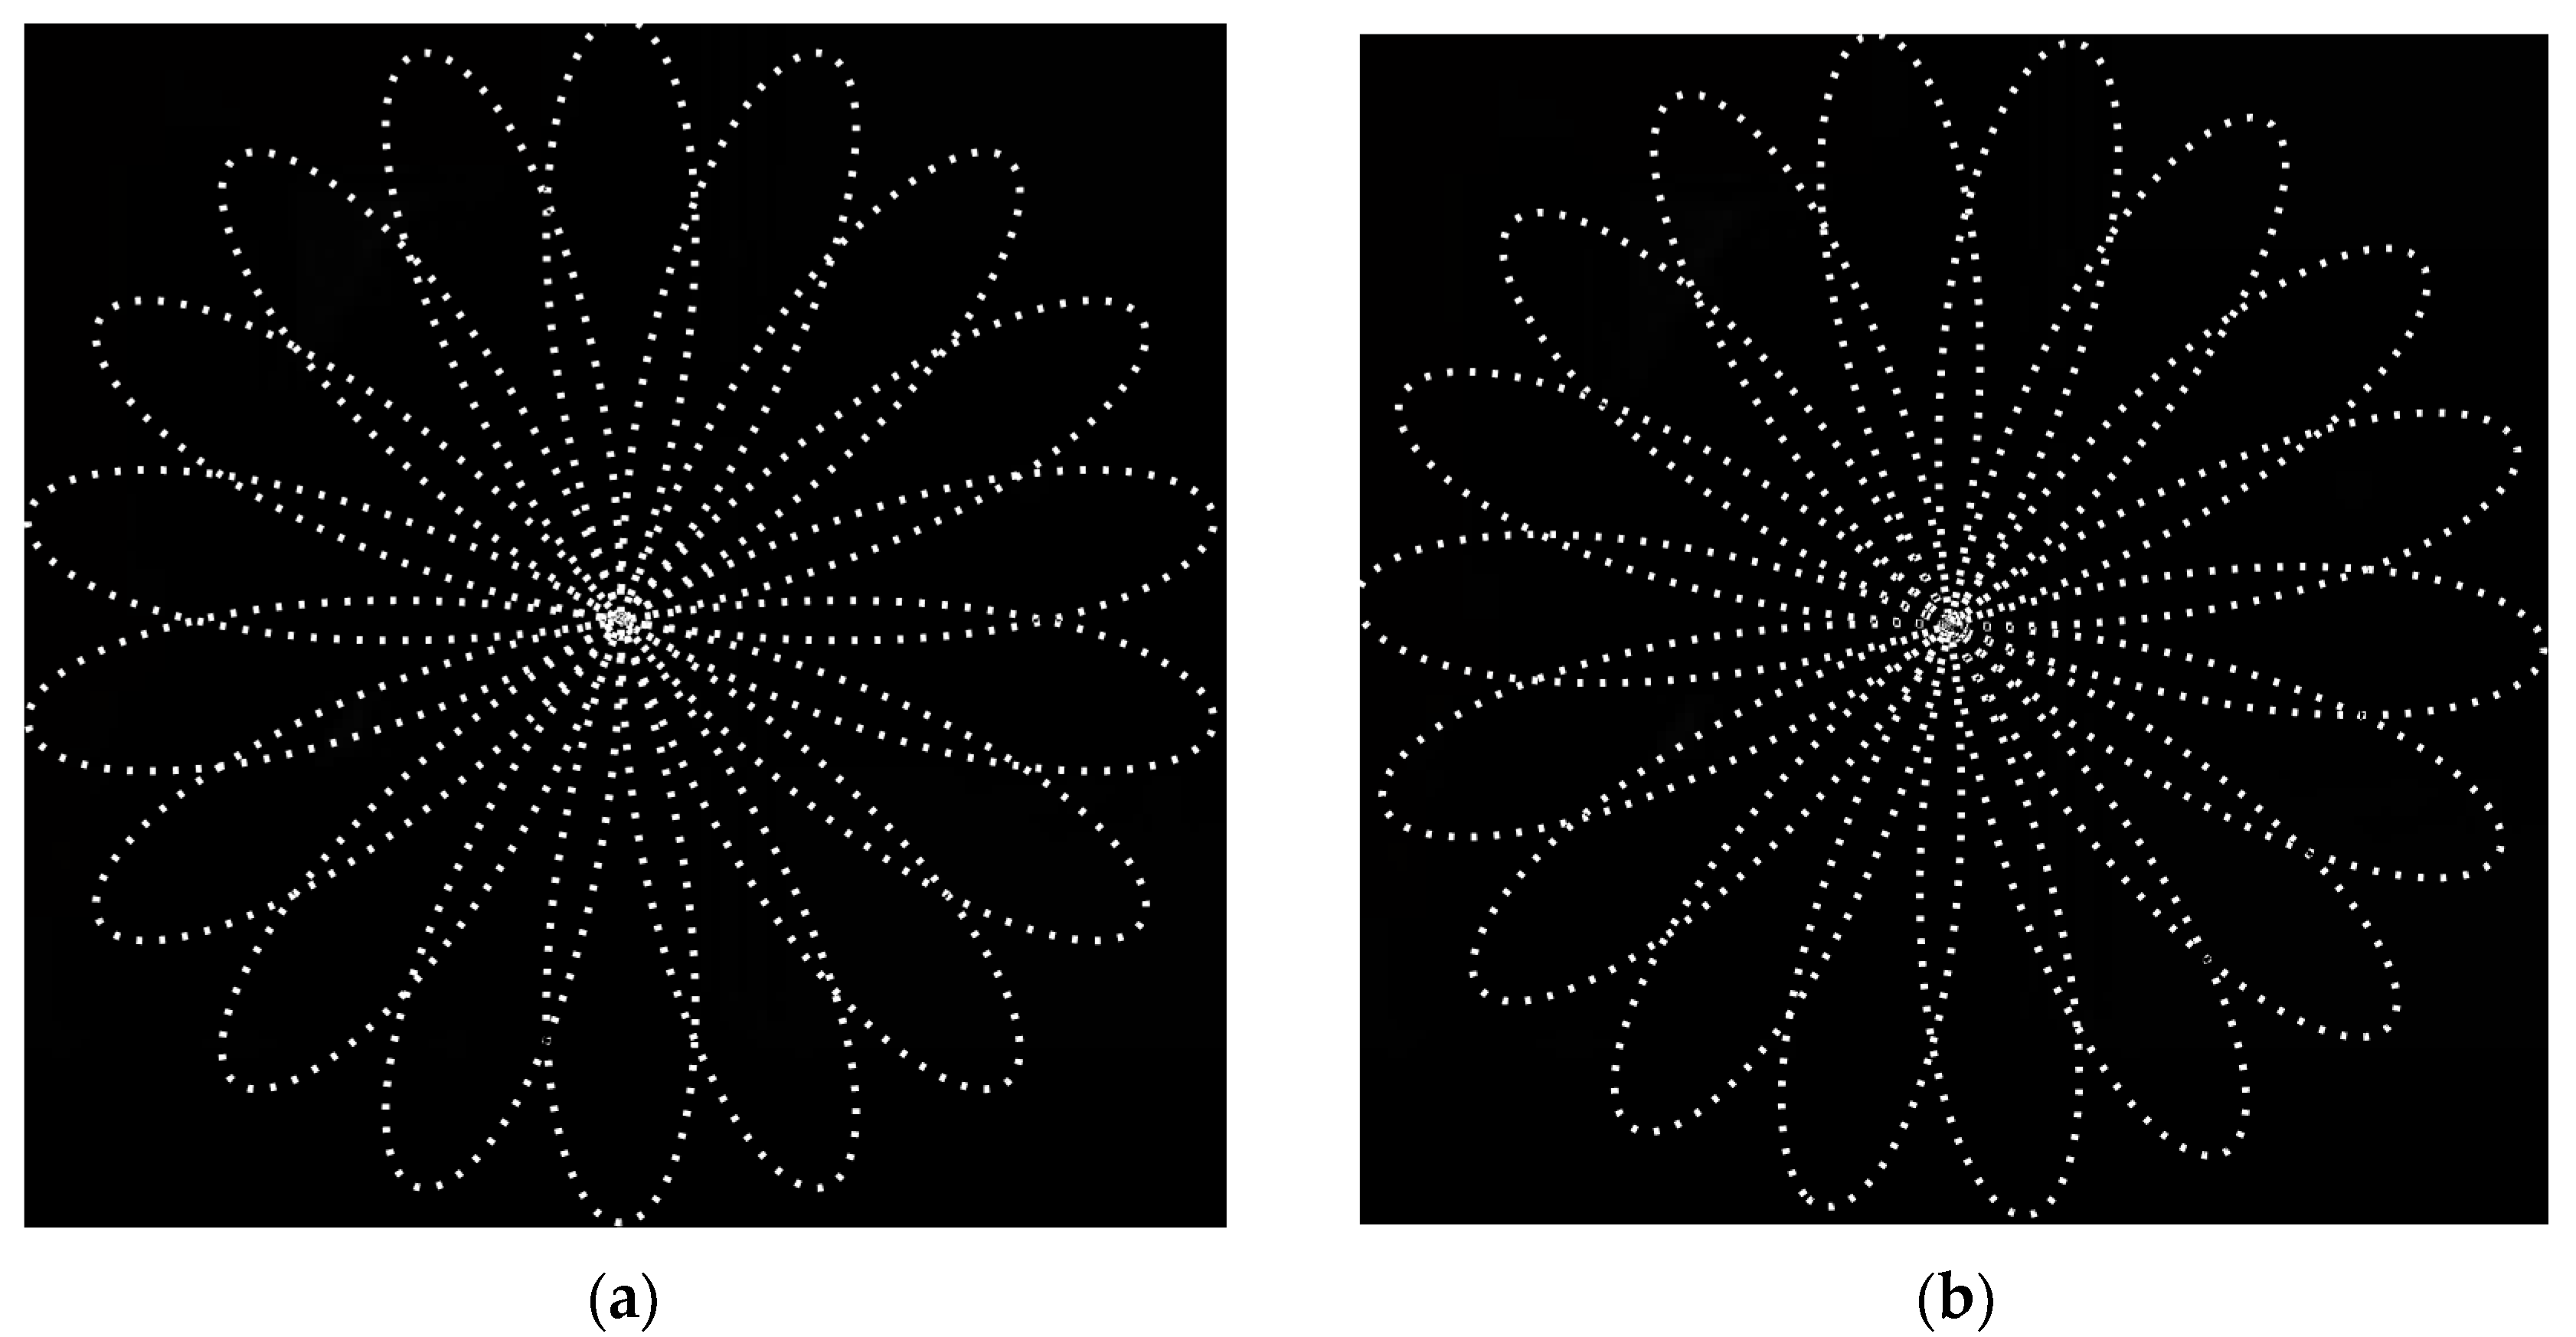
Figure 4.
Rosette scanning pattern with 3000 samples formed by the accumulation of (a) two frames; and (b) three frames.
Figure 4.
Rosette scanning pattern with 3000 samples formed by the accumulation of (a) two frames; and (b) three frames.
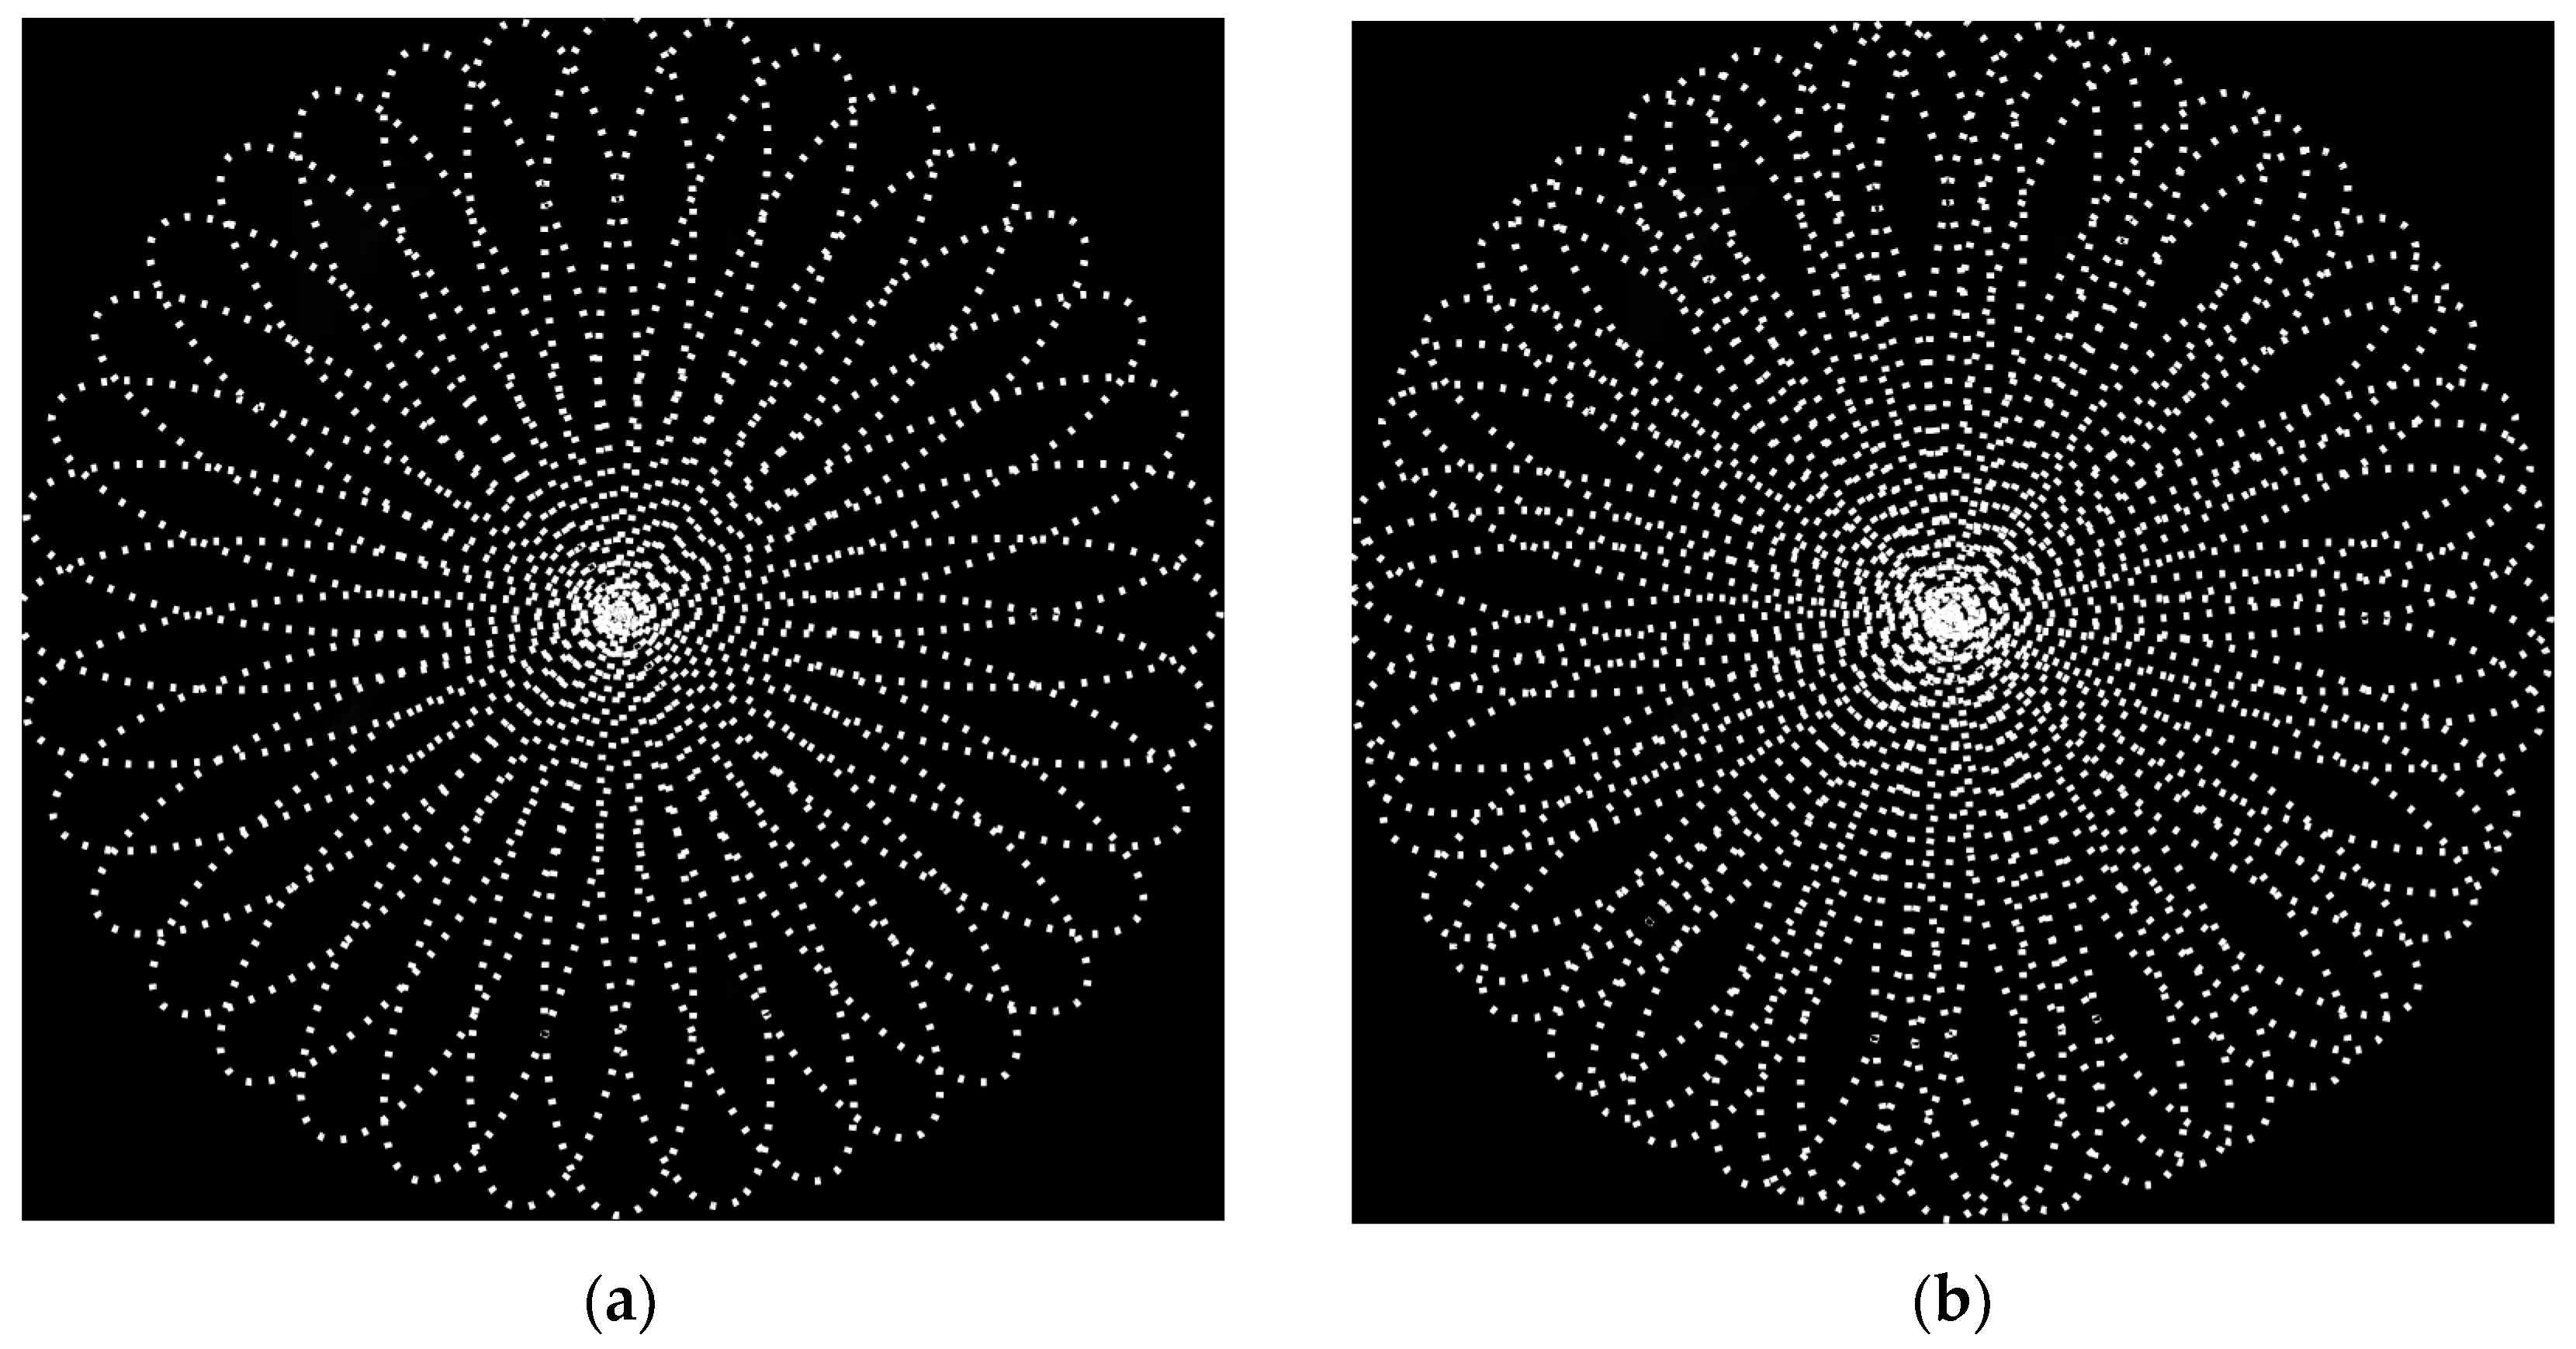
Figure 5.
The diagram of three-frame joint compressive imaging framework.
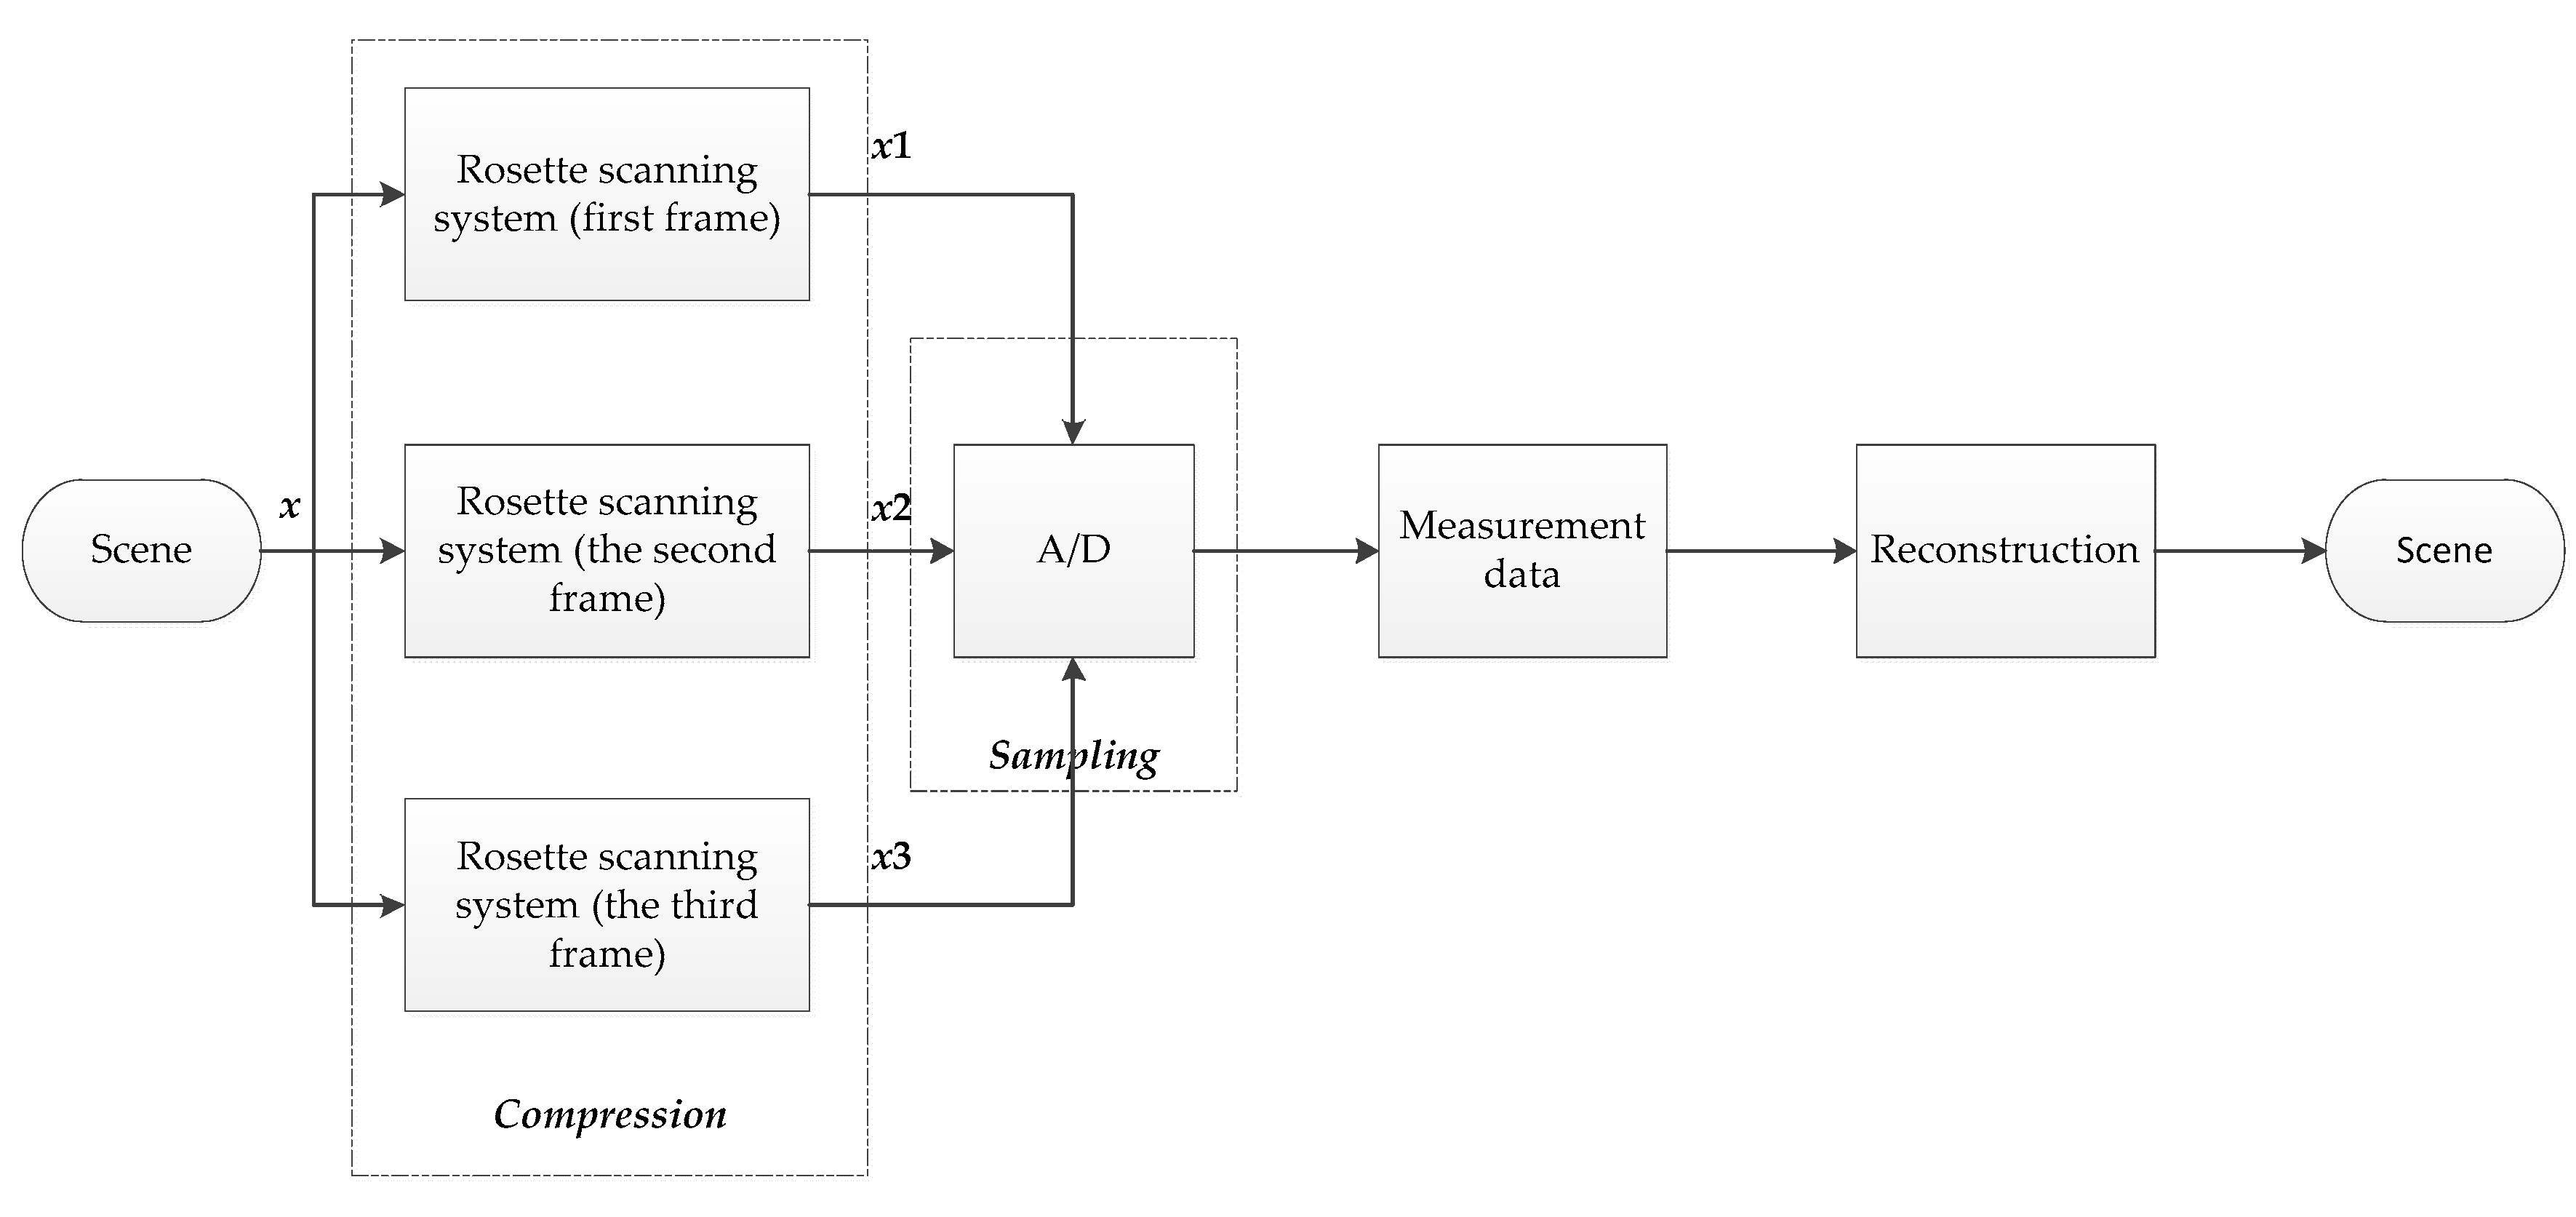
Figure 6.
Images from the numerical simulations. (a) the test image; (b) the reconstructed images with random Gaussian measurement matrix; (c) with IFOV measurement matrix; and (d) with IFOV measurement matrix. From top to bottom: 1500, 2700, 4200, 1500, 2700, and 4200 samples, respectively; weather condition, sunny day.

Figure 7.
Images from the numerical simulations. (a) the test image; (b) the reconstructed images with random Gaussian measurement matrix; (c) with the IFOV measurement matrix; and (d) with two-frame joint compressive imaging method. From top to bottom: 1500, 2700, 4200, 1500, 2700, 4200 samples, respectively; weather condition, sunny day.

Figure 8.
Images from the numerical simulations. (a) the test image; (b) the reconstructed images with random Gaussian measurement matrix; (c) with the IFOV measurement matrix; and (d) with three-frame joint compressive imaging method. From top to bottom: 1500, 2700, 4200, 1500, 2700, 4200, 1500, 2700, and 4200 samples, respectively; weather condition, sunny day.


Table 1.
The average PSNR (dB) with different number of samples and different sampling method.
| Sampling Method | 1500 Samples | 2700 Samples | 4200 Samples |
|---|---|---|---|
| Gaussian | 25.4 | 27.8 | 29.4 |
| Single-frame | 25.1 | 24.6 | 24.2 |
| Two-frame joint | 26.9 | 25.9 | 25.6 |
| Three-frame joint | 27.6 | 28.1 | 26.3 |
Table 2.
The average reconstruction time (s) of test image with different number of samples and different sampling method.
Table 2.
The average reconstruction time (s) of test image with different number of samples and different sampling method.
| Sampling Method | IFOV Size | 1500 Samples | 2700 Samples | 4200 Samples |
|---|---|---|---|---|
| Two-frame joint | 12.1 | 15.2 | 50.4 | |
| 13.3 | 45.1 | 58.4 | ||
| Three-frame joint | 11.7 | 89.4 | 34.9 | |
| 18.4 | 44.7 | 74.5 |
© 2017 by the authors. Licensee MDPI, Basel, Switzerland. This article is an open access article distributed under the terms and conditions of the Creative Commons Attribution (CC BY) license (http://creativecommons.org/licenses/by/4.0/).
Share and Cite
MDPI and ACS Style
Jiang, Y.; Tong, Q.; Wang, H.; Yang, Z.; Ji, Q. Image Recovery of an Infrared Sub-Imaging System Based on Compressed Sensing. Symmetry 2017, 9, 260. https://doi.org/10.3390/sym9110260
AMA Style
Jiang Y, Tong Q, Wang H, Yang Z, Ji Q. Image Recovery of an Infrared Sub-Imaging System Based on Compressed Sensing. Symmetry. 2017; 9(11):260. https://doi.org/10.3390/sym9110260
Chicago/Turabian StyleJiang, Yilin, Qi Tong, Haiyan Wang, Zhigang Yang, and Qingbo Ji. 2017. "Image Recovery of an Infrared Sub-Imaging System Based on Compressed Sensing" Symmetry 9, no. 11: 260. https://doi.org/10.3390/sym9110260
Note that from the first issue of 2016, this journal uses article numbers instead of page numbers. See further details here.