Function-Oriented Networking and On-Demand Routing System in Network Using Ant Colony Optimization Algorithm


1
Department of Computer Engineering, Kyung Hee University, Gyeonggi-do 17104, Korea
2
Humanitas College, Kyung Hee University, Gyeonggi-do 17104, Korea
*
Author to whom correspondence should be addressed.
Symmetry 2017, 9(11), 272; https://doi.org/10.3390/sym9110272
Submission received: 10 October 2017
/
Revised: 2 November 2017
/
Accepted: 3 November 2017
/
Published: 10 November 2017
Abstract
:In this paper, we proposed and developed Function-Oriented Networking (FON), a platform for network users. It has a different philosophy as opposed to technologies for network managers of Software-Defined Networking technology, OpenFlow. It is a technology that can immediately reflect the demands of the network users in the network, unlike the existing OpenFlow and Network Functions Virtualization (NFV), which do not reflect directly the needs of the network users. It allows the network user to determine the policy of the direct network, so it can be applied more precisely than the policy applied by the network manager. This is expected to increase the satisfaction of the service users when the network users try to provide new services. We developed FON function that performs on-demand routing for Low-Delay Required service. We analyzed the characteristics of the Ant Colony Optimization (ACO) algorithm and found that the algorithm is suitable for low-delay required services. It was also the first in the world to implement the routing software using ACO Algorithm in the real Ethernet network. In order to improve the routing performance, several algorithms of the ACO Algorithm have been developed to enable faster path search-routing and path recovery. The relationship between the network performance index and the ACO routing parameters is derived, and the results are compared and analyzed. Through this, it was possible to develop the ACO algorithm.
1. Introduction
As the era of new communication such as 5G era comes, it is expected that there will be a lot of services that cannot be compared with what existed before. Examples include Internet of Things (IoT) [1], in which everything in everyday life is connected to the Internet, such as a refrigerator and a TV that can be remotely controlled, and services such as Tactile Internet. These services have network requirements [2,3].
The term Internet of Things was first introduced by Kevin Ashton in 1999 [4]. IoT network means that things such as sensors are connected to the internet and is freely controllable from the remote. Internet of Things is regarded as one of the emerging technologies in IT. This will enable new services [5]. It requires new network characteristics accessing for a high number of devices.
Tactile Service or Tactile Internet is that providing real-time interactions with low delay that humans cannot recognize [6,7]. If Tactile Service is realized, many novel services will appear: remote health care, virtual reality, robotics, etc. Each service needs a different delay.
The network requirements for these new services are difficult to achieve at once. So, the core technology of future network proposed in 5G is to be able to dynamically and quickly provide the requirements of such a network [2,3]. However, 5G’s core enabling technologies, SDN and Network Functions Virtualization (NFV) [8], are designed exclusively for network administrators or managers. This is a powerful solution to many problems, but there are still problems that cannot be solved at the same time. In this paper, we investigate what these problems are and present functional-oriented networking as a solution and complement.
In Section 2, related works are described. In Section 3, Function-Oriented Networking is proposed and how to implement it is explained. In Section 4, we illustrate how to implement Routing using ant colony optimization as FON Function. In Section 5, the previous FON Function is evaluated and network performance analyzed.
2. Related Works
2.1. OpenFlow
OpenFlow is the most well-known SDN project. It started with the paper [9]. Their initial purpose is providing the testing platform for a new experimental network protocol. These days, many papers focus on network centralization characteristic of OpenFlow. The most popular SDN controller-related projects are ONOS and OpenDaylight [10,11].
2.2. NFV
NFV strands for Network Function Virtualization. Ref. [12] states that “Network Functions Virtualization aims to transform the way that network operators architect networks by evolving standard IT virtualization technology to consolidate many network equipment types onto industry standard high volume servers, switches and storage, which could be located in Datacentres, Network Nodes and in the end user premises”.
2.3. Network Slicing
Network slicing may be comprehended in many ways, but it can be accepted as the concept that the portion of all resources including network switches and routers in networks can be allocated for a specific purpose. Also, the allocated network slicing is designated for a specific service. Many papers and projects said that it is the key to make a network more flexible.
One of the old projects related to network slicing is the GENI Project. According to [13], “GENI (Global Environment for Network Innovations) provides a virtual laboratory for networking and distributed systems research and education”.
2.4. Quagga
According to [15], “Quagga is a routing software suite, providing implementations of OSPFv2, OSPFv3, RIPv1 and v2, RIPng and BGP-4”. Zebra, which is the core module of Quagga, abstracts OS layers and provides many APIs for table-driven routing protocols. If some routing protocols like RIP or BGP is needed, it can be easily run. Also, if it is not needed, it can be stopped. From this point of view, Quagga is called as a “virtual routing system”. Quagga is an open source project distributed under the term of GPL; you can easily acquire the full source code from [15].
3. Function-Oriented Networking
Related-works above SDN and NFV are all researches for network managers. OpenFlow is a technology which separates date-plane from control-plane so that a network manager can easily control the entire network. NFV is a technology that is actively deploying a network function such as Deep Packet Inspection (DPI), Firewall, even mobile communication equipment-eNode B, Mobility Management Entity (MME), and Home Subscriber Service (HSS)—according to a network manager’s requirement. Because such technologies (SDN, NFV) are designed entirely for network managers, some requirements of network users are hard to meet. For instance, Quality of Service (QoS) policies are decided/set by network managers. Thus it could be different from network users’ requirements. In addition, if network users’ requirements are reflected only through network managers, immediate policy change is impossible when needed. In this context, existing technologies have unsolvable problems when these are taken into the network managers’ point of view.
This paper proposes a novel user-centered network to solve the problems mentioned above: Function-Oriented Networking (FON). The network element supporting FON in a network is defined as FON Switch. Assume that the FON Switch can handle such a complex process including OpenFlow and classical functions (sort of Router, L2 Switch). In each FON Switch, FON is being processed as depicted in Figure 1. Multiple FON Functions can be operated. FON Function is defined as a network function which processes something not specific. It can run classic routing protocols such as RIP and OSPF. This aspect is similar with NFV. However, FON enables network users to change network policy; FON Function can be dynamically deployed/deactivated on FON Switch by network users. Figure 2 shows this scenario. Assume that: (1) a network user begins a new service. This new service needs the network policy corresponding to it; (2) this service requires End-to-End Delay to be the lowest. Then, by using FON system, network users can apply new policy that is matched to each Service’s characteristic immediately by deploying New FON Function to each FON Switch.
What follows is each Enabling technology needed to realize such FON. The first one is OpenFlow. As a matter of fact, the network manager is not a critical point in the first article of OpenFlow. Rather, Ref. [9] proposed a 5-Tuple by analyzing common functions need to realize QoS, Firewall for each vendor. It tried to develop a network switch where various experimental policies can be applied by using the open-API OpenFlow. This paper focuses on the early OpenFlow philosophy that could be a useful tool to realize a policy for constructing a Programmable Network. The second one is a Network slicing technology that can fulfill FON. If network users can totally control the network resources on the network, a serious security problem can be caused. This problem can be solved if a certain amount of resources is assigned through network slicing.
To realize the scenario in Figure 2, FON must provide such technologies as below. (1) According to network user requirements, a new network function, FON Function, can be deployed/deleted on/from FON Switch; (2) FON should provide APIs by making network resources abstractive so that FON function can be easily implemented to apply new network policy. Especially, new policy is related directly to Routing policy. Because FON requests direct policy change, On-demand method is more well-matched than the Table-Driven method.
In order to implement the FON proposed in this study to run on real network devices, and additionally to conduct experiments using ACO in FON, we built a physical device-based test bed. The test bed was tested by running a software image that implements the FON function on the Linux operating system on real Raspberry Pi Single Board Computer (SBC). The FON is designed to operate on Layer 3 IP protocols and layer 2 Ethernet, Bluetooth, and WLAN. For this purpose, a function to receive and forward FON messages in layer 2 upper layer and layer 3 upper layer has been developed. The reason for using Raspberry Pi in building a testbed is because you can construct a large-scale real network, and you can directly create network devices that send and receive traffic. However, it is relatively inexpensive and offers the advantage of being able to operate the same as real network equipment. In addition, it supports OVS to support OpenFlow, and it is possible to receive control of the actual SDN controller. In the case of the OpenFlow controller, ONOS was used, and the configuration and performance evaluation of the various shapes considered in the papers were performed through the corresponding test bed. In addition to wired Ethernet, wireless networking has been experimented with.
3.1. FON Identifier
Each Node can have several physical interfaces. To represent these interfaces, the Unique Identifier is needed. So FON Identifier is defined as the Unique Identifier and assigned to each FON Switch. For the compatibility with existing OSPF for IPv4 and IPv6, FON ID have a length of 32 bits, which is the same length of router ID in OSPF.
3.2. FON Forwarding Table
One of FON’s main purposes is to provide FON Function with an API abstracting system’s routing related-resource. Let us take the Linux machine as an example. For communication, ARP table and Routing table have to be controlled in a lump and also Flow table of Virtual Bridge has to be managed as well. In order to do this, FON constructs FON Forwarding Table by using FON ID. It manages various tables uniformly through this. FON manages these tables and provides APIs related with FON Forward Table, and FON Function can change easily network policy by modifying a FON Forwarding Table only; in other words, FON Function does not have to modify ARP, Routing, and Flow tables directly.
3.3. Design and Processing of FON Packet
FON Packet is a packet used in a communication between FON switches. FON is not using IP protocol so FON Packet is encapsulated directly into Ethernet Frame. FON Packet is divided into FON data packet and FON ADV packet by ethertype field in Ethernet header.
For FON Adv packet, its purpose is to synchronize and notify adjoining nodes, which is similar to LLDP. FON Adv packet uses ETH_P_FON_ADV(0xFF03) as a ethertype field. This type of packet is generated and received only through FON, not by FON Function.
3.4. Telecommunication Design between FON and FON Function
There are two communication messages/channels between FON and FON Function. One is Synchronous message/channel, where FON Function asks for FON and FON sends a response. The other one is Asynchronous message/channel, where FON Function is notified when some event occurs.
3.4.1. For Synchronous Message
All kind of messages in this type are messages that request to FON from FON Function. They have a typical Request-Response design. Figure 4 shows the format of Request message. Table 2 represents the definitions of every field. Table 3 lists all message types and describes them. Figure 5 shows the format of response message. Table 4 represents the definitions of response message’s every field.
3.4.2. For Asynchronous Message
All kind of messages in this type are messages which notify FON Functions when some event occurs in FON. In this context, an event is such that: change of FON ID, FON Forward Table, etc. Typical Asynchronous message is passing FON data packets to a FON Function according to func_type filed in FON packet.
3.5. Processing and Exchanging FON Data Packets between FON Switches
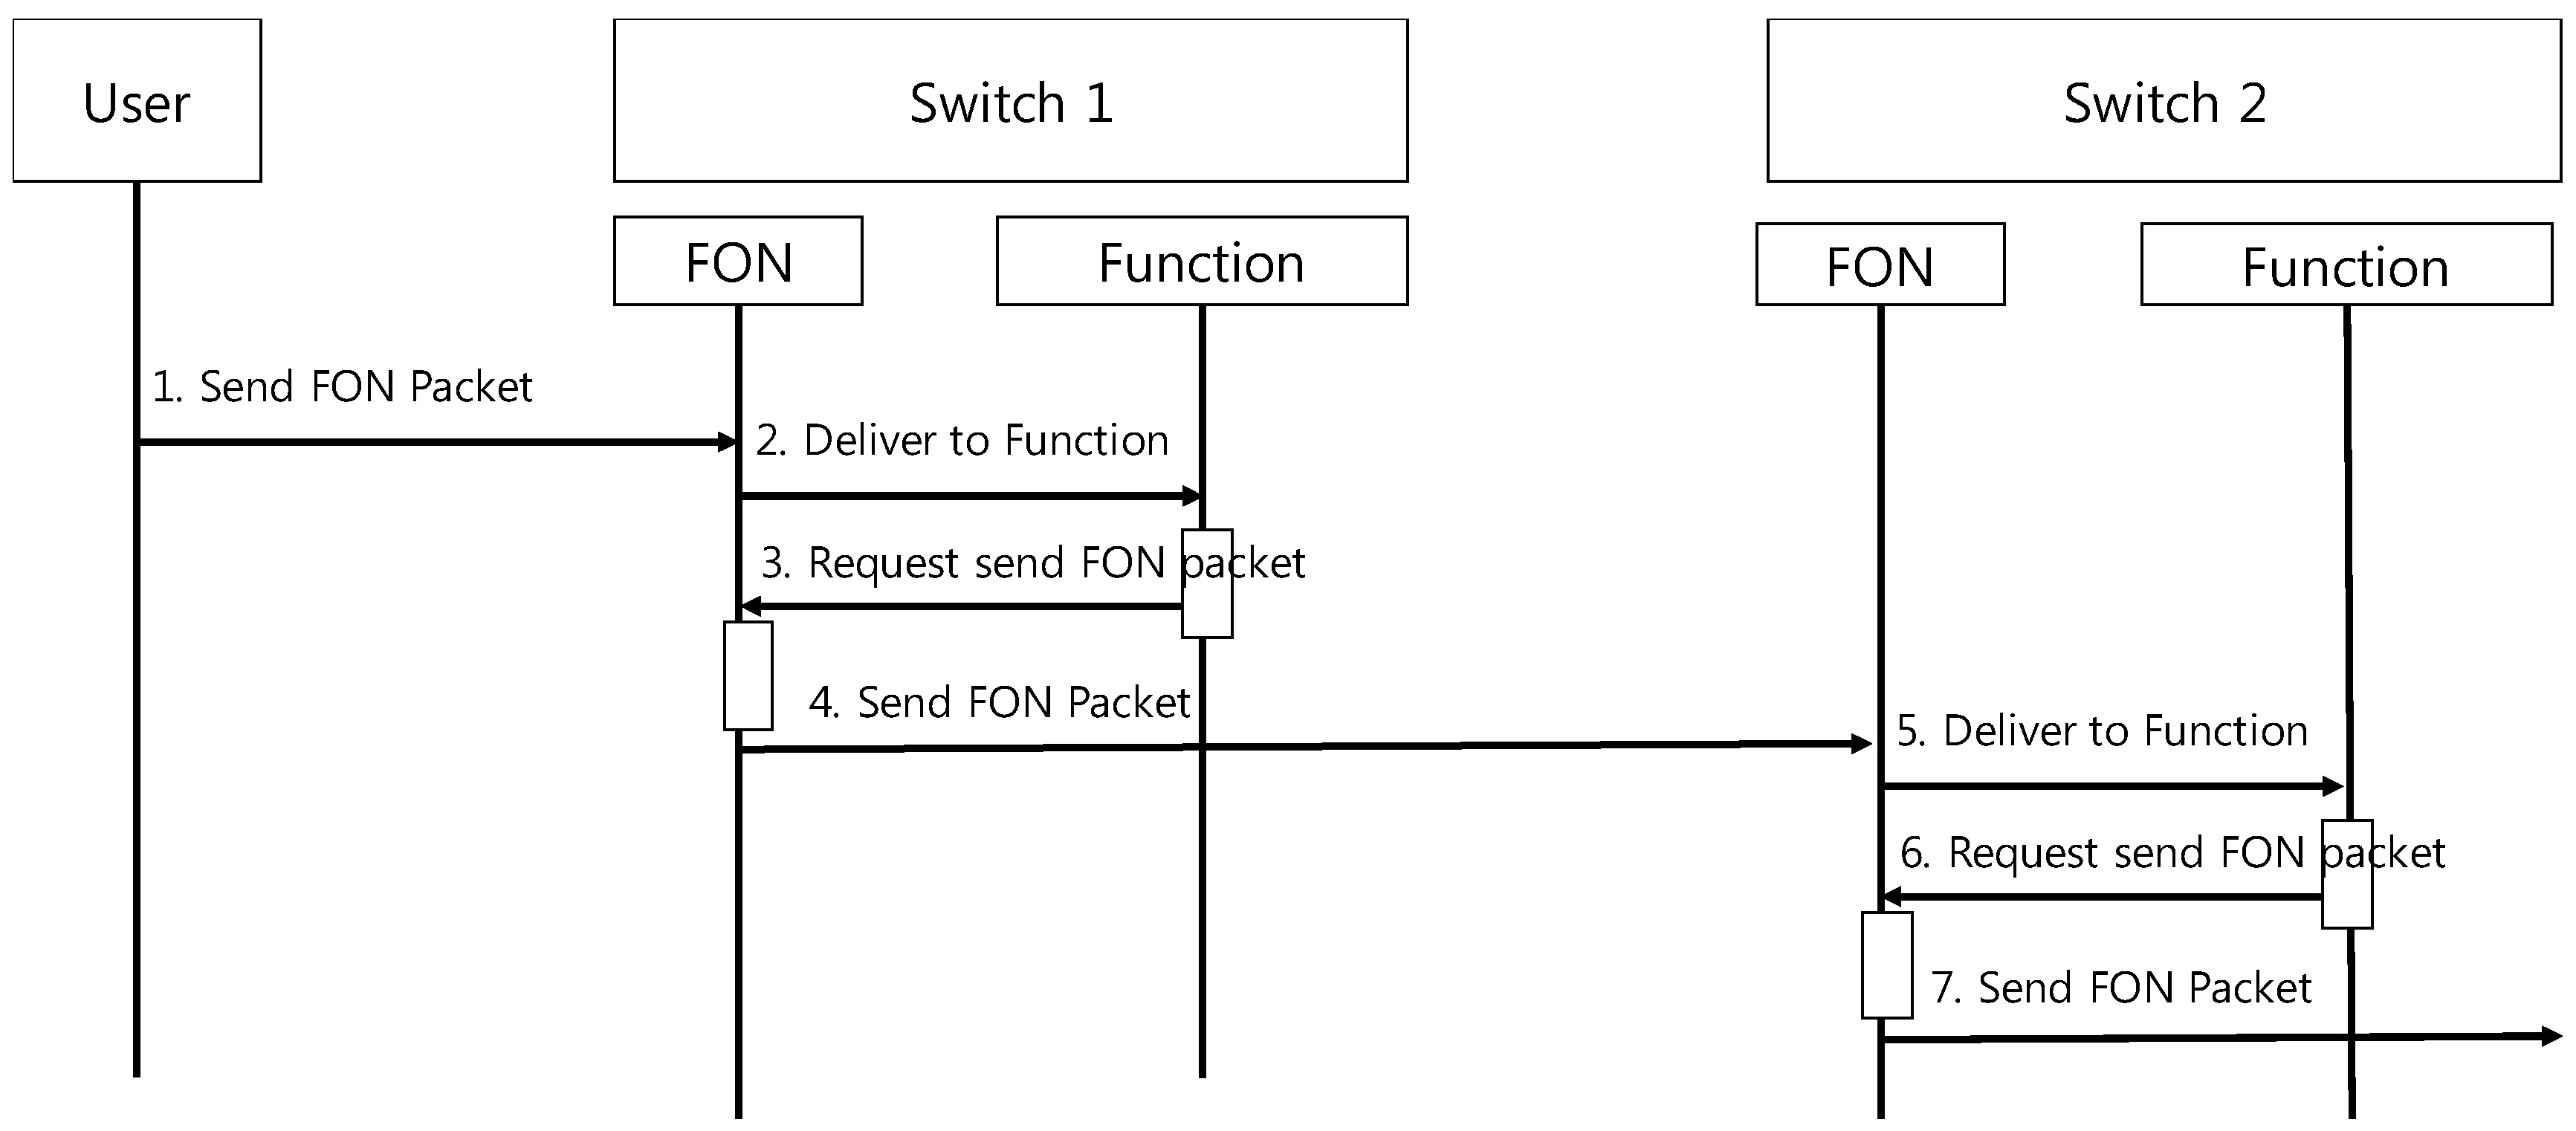
Figure 6 illustrates how FON switches process and exchange the FON Packet.
| (1) | A network user sends a FON packet to FON Switch 1. |
| (2) | FON Switch1 sends it to proper FON Function through func_type of FON Packet. |
| (3) | After proper process, requests FON to send FON Packet. |
| (4) | Deliver packet to FON Switch 2. |
| … | Repeat (2)–(4). |
4. FON Function—Ant Colony Optimization Routing in Network
The previous section explains that OpenFlow is a novel technology and it can do many things such as QoS Policy. But it has a limit; many papers only focus on the perspective of central managing but not the needs of users such as datacenter, game server, etc. To overcome the limit of OpenFlow, this paper proposes and illustrates FON and its architecture. This section will discuss FON function and its implementation in a specific condition.
Assume that a certain network service, such as a real-time game server, needs two requirements: (1) minimum End-To-End Delay; (2) Fast path recovery if a link failure occurs. In this case, it is reasonable to choose ACO algorithm as a routing, because the ACO algorithm has these characteristics.
Actually, ACO routing does not minimize the delay of transmission but the distance (hops) of a source and destination [16,17]. But, if a packet passes though the shortest path, then we can assume that the first sentence is true because if all network elements have same performance, the assume is true.
In the rest of this section, the ACO algorithm background is explained. Then, how to implement ACO routing in the Ethernet network is illustrated.
4.1. Background
ACO was first studied and established by M. Dorigo. It observes ants’ behavior and imitates it. The original study of ACO algorithm was to solve TSP or vehicle routing problems and network routing problems. Especially, ACO is expected to be a good solution for dynamic topology and ad-hoc networks such as mobile ad-hoc network (MANET) [18,19,20,21,22,23,24,25].
Compared to the existing network, MANET has different characteristics. So existing proactive routing protocol has disadvantages in MANET; dynamically forming network, no infrastructure, etc. To overcome these problems, the reactive routing protocol such as DSDV, TORA, and AODV was proposed [26]. However, refs. [18,19,27] showed that novel routing algorithms that applied the ACO algorithm can be more effective than AODV or DSR. According to our research [16,18,19,20,28,29,30,31,32], most of the papers were studied using a simulator, and there is no ACO routing implementation for the real network. But this paper focuses on the real network routing problem, so our first objective is the implementation of ACO routing agent running in the complex enough but not dynamic topology real network. We will propose algorithms which are powerful when the assumption holds, analyze them, and evaluate their performance using our ACO routing agent.
4.1.1. Ant Density
Ant Density model [29] has the characteristic that the pheromone is updated without considering any distance or length concept like the length of the path that an ant passed. Therefore, the pheromones of all nodes an ant passed are increased by the same amount. The model is represented in
where is a constant, is an evaporation rate of the pheromone.
4.1.2. Ant Quality
Ant Quality model [16] considers the distance of neighbors when updating the pheromone. So unlike Ant Density model, the pheromone updating is influenced by the distance, and the pheromones of all nodes an ant passed are increased by each specific amount. But this model does not consider the total length of the path; the optimization is accomplished locally. So in some bad cases, this model cannot find the optimized path. The model is represented in:
where is a constant, is an evaporation rate of the pheromone and is a distance between neighbor nodes i and j.
4.1.3. Ant System
Ant System model [16] is an advanced model of Ant Quality. Unlike Ant Quality model, this model considers the total length of the path that an ant passed. So this model reflects the global information and updates the pheromones using this; the performance is better than the Ant Quality model’s. However, there is a disadvantage. If the pheromones of the nodes are far from a source node, they are very slowly converged. The model is represented in:
where is a constant and is the tour length of the ant, is an evaporation rate of the pheromone.
4.1.4. Ant-Q
Ant-Q model [33] is the Ant Colony Optimization Model applied to the Q-learning algorithm. The significant characteristic of this model is that it does not only consider neighbor nodes, but also next-next nodes. Because of this feature, non-adjacent nodes also must be taken into consideration and this non-adjacent node information should be exchanged to implement this model in real networks. For this, our previous work concluded that it is improper in the real network because exchanging the pheromone tables has a very high cost. The model is represented in:
where is to be visited nodes of the given ant k at node i.
4.1.5. Ant Colony System
Any Colony System [17,34] is a very similar model with Ant System. But it updates the pheromone only when the ant passed the optimized path. With the simple principle, the performance is better than Ant System’s.
Every ant knows that he passed the optimized path or not. So every ant must share the information and the colony (also called node) keeps information as a pheromone table. Ref. [14] called this “communication”.
4.1.6. The Structure of the Pheromone Table
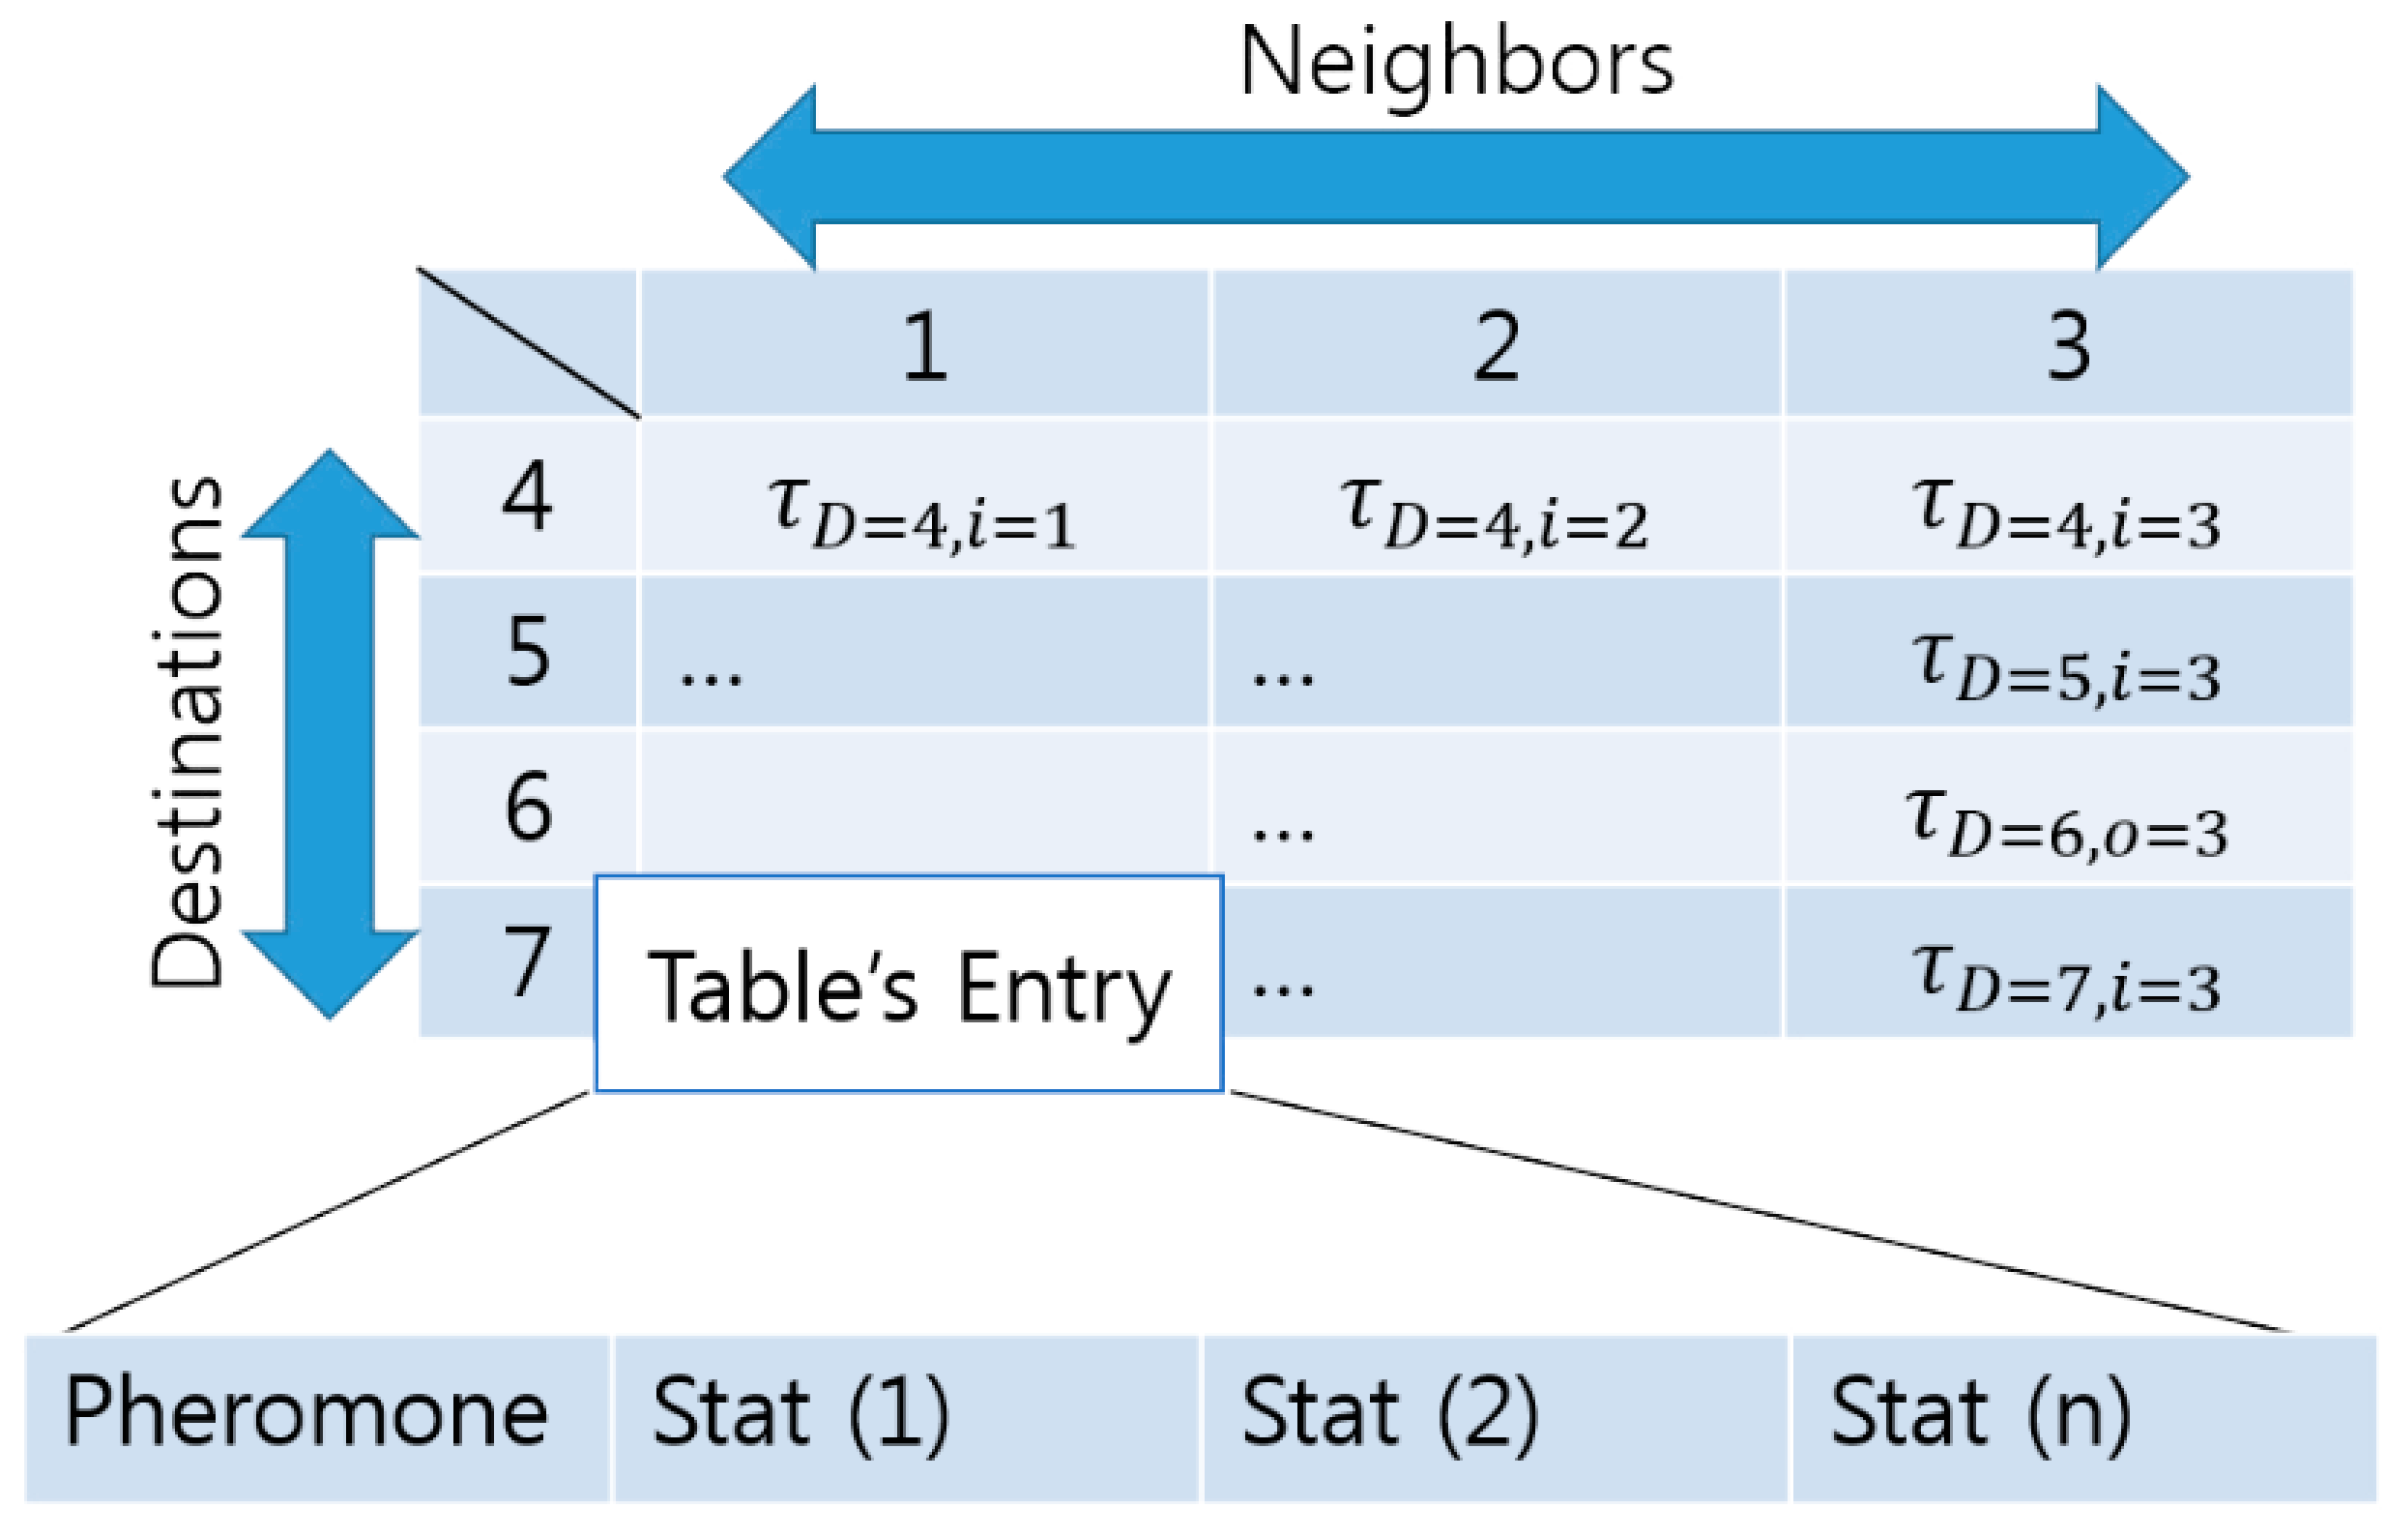
To apply a ACO algorithm into a network routing problem, Ref. [28] suggested a data structure to represent pheromone information—the pheromone table. According to [28], the pheromone table consists of rows—destinations and columns—neighbors. The table structure is depicted in Figure 7. In the rest of this paper, the concentration of a pheromone is represented as when given a destination and a neighbor node .
4.1.7. Source Update
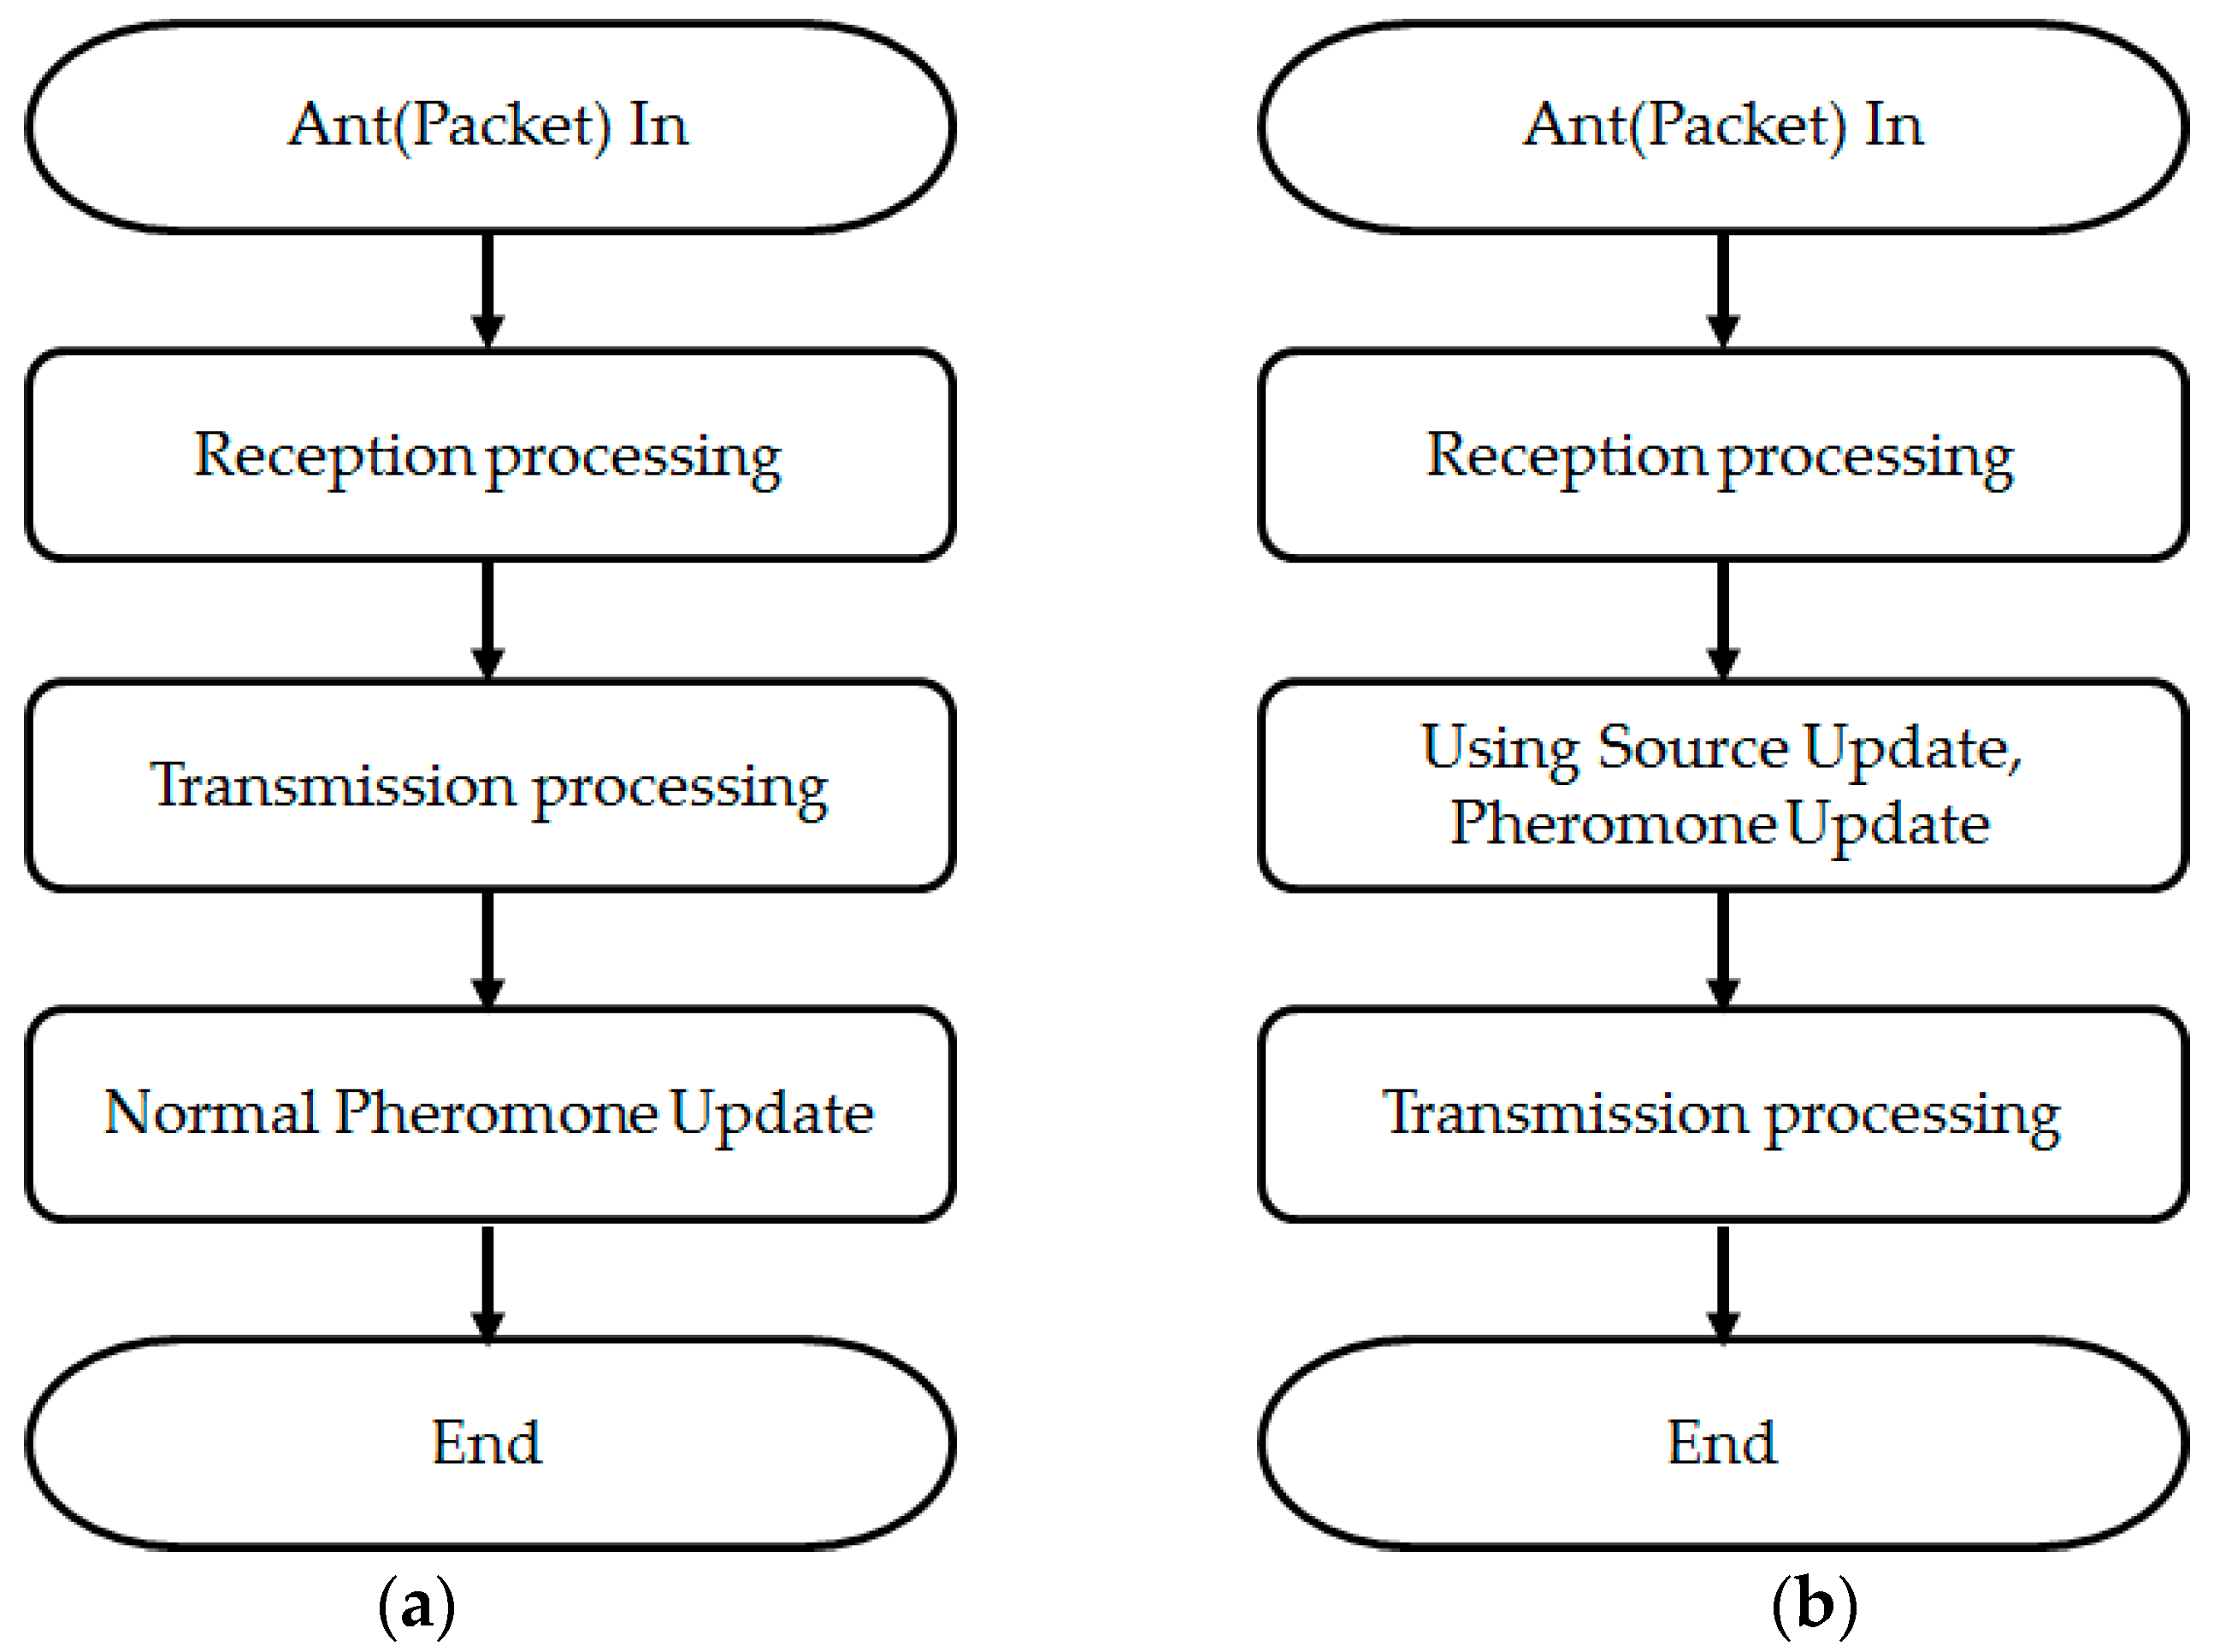
Ref. [20] proposed a Source Update algorithm which suggests new ways to update pheromones. Figure 8a illustrates the way pheromone update in general ACO algorithm. In this paper, the way will be called as Destination Update. Destination Update works this process: (1) select a neighbor node which ant will go through. The selected neighbor node will be called neighbor_out; (2) increase which is a concentration of pheromone in the pheromone table given a pair of destination and neighbor_out. But Source Update works in slightly different ways. Figure 8b illustrates Source Update: (1) when ant come in a node from a neighbor, the neighbor will be called neighbor_in; (2) increase which is a concentration of pheromone in the pheromone table given a pair of source and neighbor_in (in fact, the way of Source Update is widely used already. Network routing protocols, such as RIP and OSPF, calculate the distance and update the routing table when receiving the routing information corresponding to the ant. But [28] is meaningful that this method is applied for the first time).
Source Update is superior to Destination Update; Source update prevents the wrong increment of pheromone concentration. Because Destination Update selects a next node (neighbor_out) and increases the pheromone concentration with no guarantee that an ant will reach a destination, so the ant may not find a destination. It leads to the wrong increment of pheromone concentration. But Source Update increases the pheromone concentration with the guarantee that ant can reach a source through the neighbor, neighbor_in. It makes a huge difference and source update–related experiment will be discussed in the next section.
4.2. Previous Works
4.2.1. Ant Local
Our previous work [35] presented a new perspective about Ant Colony Optimization. Ref. [35] pointed out a problem about classic ACO algorithms: Ant System and Ant Colony System. These ACO models focus on the distance between source and a given node. But in fact, to optimize the path at a given node, the desirable consideration is the distance between a given node and destination. In this reason, we proposed Ant Local model in [35].
4.2.2. Simple Backtracking Update
The ACO algorithm is a kind of depth-first search (DFS) based on probability and also it is called a metaheuristic algorithm. If an ant enters into a wrong node that cannot lead to a destination, it does backtracking. Our previous work proved that if backtracking occurs, that information can be used for pheromone updates for a better search in [35].
All ants are divided into two types: Forward Ant and Backward Ant. Forward Ant is a request packet to find a destination. If it finds a destination, it changes into Backward Ant. Backward Ant is a response packet corresponding to the given Forward Ant. At a node, Forward Ant has three options; changing into Backward Ant, starving (exceeding the given TTL) and backtracking. If a Forward Ant finds a destination, backtracking never happens. Backtracking occurs only when a Forward Ant cannot find the destination D through a neighbor node i. In other words, there is no destination D in any nodes that can be reached through the node i, so we can assert that if a Forward Ant goes to the node i again then it will never find a destination D. So from this analysis, we propose the Simple Backtracking Update algorithm (Algorithm 1):
| Algorithm 1 Simple Backtracking Update |
| 1: Ant packet has been received |
| 2: if Ant is a backtracked from a neighbor node I then |
| 3: Where is the destination of an ant. |
| 4: else |
| 5: Do nothing |
| 6: end if |
4.2.3. The Fast Path Recovery Algorithm
The Fast Path Recovery Algorithm is our past proposed algorithm in [35]. In fact, the ACO algorithm has a mechanism to recover the path even without this algorithm. But without this, it takes a long time to recognize an occurrence of link failure. So this algorithm is used to force to rediscover a new path between a source and destination if a network link failure occurs. This algorithm introduces a new variable called Endurance; this variable has the same concept of Timeout used in existing TCP. Figure 9 and Algorithm 2 explain how this algorithm works.
| Algorithm 2 The Fast Path Recovery Algorithm |
| 1: For all neighbor nodes i |
| 2: Visited ← False |
| 3: Endurance ← MAX Endurance |
| 4: Pheromone ← 0 |
| 5: End for |
4.3. Design of ACO Packet
The packet format is depicted in Figure 10. Each field is described in Table 5. These walks, path, visited are similar in that these fields record an array of nodes but these fields have their own purpose. walks record all nodes so it is useful when debugging. path field is used to know shortest path. visited field comes from [20] and prevents revisit and the graph cycle.
Whenever an ant packet visits a node, the size of the packet increases. So the maximum number of visited nodes depends on the value of init_ttl. init_ttl having an upper bound as (8):
In the Ethernet network, the default MTU is 1500 Bytes. But nwalks, npath, nvisted, ndists are not fixed so init_ttl cannot be calculated. But in the worst case, init_ttl can be calculated. Assume that the ant visits a new node always. Then (9) holds true. Finally, Equation (10) can be obtained:
So in the Ethernet network, the ant packet can visit at least 91 nodes.
4.4. Design of ACO Packet Packet Transmission Process
Figure 11 illustrates how packets (ants) are handled on the ACO algorithm.
| (1) | Packet in |
| (2) | If the ant is not registered in the node’s pheromone table, it registers in the pheromone table. |
| (3) | If the ant is backtracked, perform the Simple Backtracking algorithm. Then proceed to step (5). |
| (4) | Updates RX statistical information of the pheromone table. The received number, the byte, and the shortest distance to the transmission destination. |
| (5) | Update the pheromone concentration for the destination entry in the pheromone table using the Source Update algorithm and the Ant Colony System algorithm. |
| (6) | When you reach the destination, change the ant type from Forward (Request) to Backward (Response). |
| (7) | Decrease TTL. |
| (8) | If TTL is 0, go to step (11) and finish. |
| (9-1) | If it is a Forward type |
| (9-2) | If it is Backward type |
| (10) | And updates the TX information of the pheromone table. |
| (11) | End |
As shown in Figure 11, not only ACS but various models such as AS, ACS, Ant Local, and Ant Normalizing are implemented.
4.5. Decision of Ant Model
Before implementing ACO routing, ACO model must be determined because only one of them, ant system, ant colony system, ant local, ant normalizing, etc., can be used. In fact, the previous section illustrates how to process an ant packet implicitly assuming that ant colony system model and source update are chosen. In the next section, each ant model performance will be shown. It will be the answer to why we chose the combination of ant colony system with simple backtracking update, source update and fast path recovery; this combination showed the best performance.
5. Performance Evaluation and Analysis
In this section, the AS and ACS models are set as the control group because these are typical and representative models of ACO algorithm. The Source Update, Simple Backtracking Update, and Fast Path Recovery algorithm are applied with AS and ACS and these cases were conducted and analyzed. A focus on the destination discovery time (as discrete time) shows how the theoretical performance improves.
In addition, when applying ACO algorithm as on-demand routing into an Ethernet network, two network performance measures are defined based on actual time rather than discrete time and the relationship between them is derived and verified from the experiment.
5.1. Performance Evaluation of Each ACO Model
All experiments were conducted in the topology depicted in Figure 12 using Mininet [37]. The topology came from [28]. The node index was randomly assigned a value from 0 to 54. Common parameters in experiments are listed in Table 6. The reason why we did not build the test bed based on the actual physical equipment mentioned above is that the structure of the network is composed of more than 50 nodes and the complexity of building a test bed based on actual equipment is taken into consideration. However, since all the nodes operating on Mininet are the software created in Section 3 above, they send and receive the actual Ethernet on the virtual machine.
The performance of each case is measured using the frequency distribution and the mean distance. is defined as the average length of nth received ants when repeating the same experiment. is expressed in (11).
where is the number of repeated experiments.
5.1.1. Control Groups
In the control groups, the performance of the pure Ant System and Ant Colony System algorithms with no additional algorithms was measured.
First, this is the experimental result of Ant System. When the pheromone evaporation coefficient was increased from 0.1 to 0.9, it was confirmed that the optimized pheromone evaporation coefficient() was about 0.1. The average path length was 22.740940 when it was repeated 100 times. The time series graph of Figure 13a shows that it is slowly approaching the optimal path. The histogram of Figure 13b shows that the frequency of the path length between 21 and 23 is largest.
Second, this is the experimental result of Ant Colony System. When the pheromone evaporation coefficient was increased from 0.1 to 0.9, it was confirmed that the optimized pheromone evaporation coefficient() was about 0.1. The average path length was 24.748670 when it was repeated 100 times. The time series graph of Figure 14a shows that it is not approaching the optimal path. This result is unexpected because the ACS algorithm is known to have the best performance [14]. This result will be explained in a later section. The histogram of Figure 14b shows that the frequency of the path length between 21 and 23 is largest.
5.1.2. Simple Backtracking Update
In this section, it was measured that the performance of Ant System and Ant Colony System algorithms with Simple Backtracking Update.
First, this is the experimental result of AS with Simple Backtracking Update. When the pheromone evaporation coefficient was increased from 0.1 to 0.9, it was confirmed that the optimized pheromone evaporation coefficient() was about 0.1. The average path length was 20.325750 which is better than the result of Ant System only. The time series graph of Figure 15a shows a similar result but it is approaching the optimal path faster than Ant System only. The histogram of Figure 15b shows a similar result of AS only.
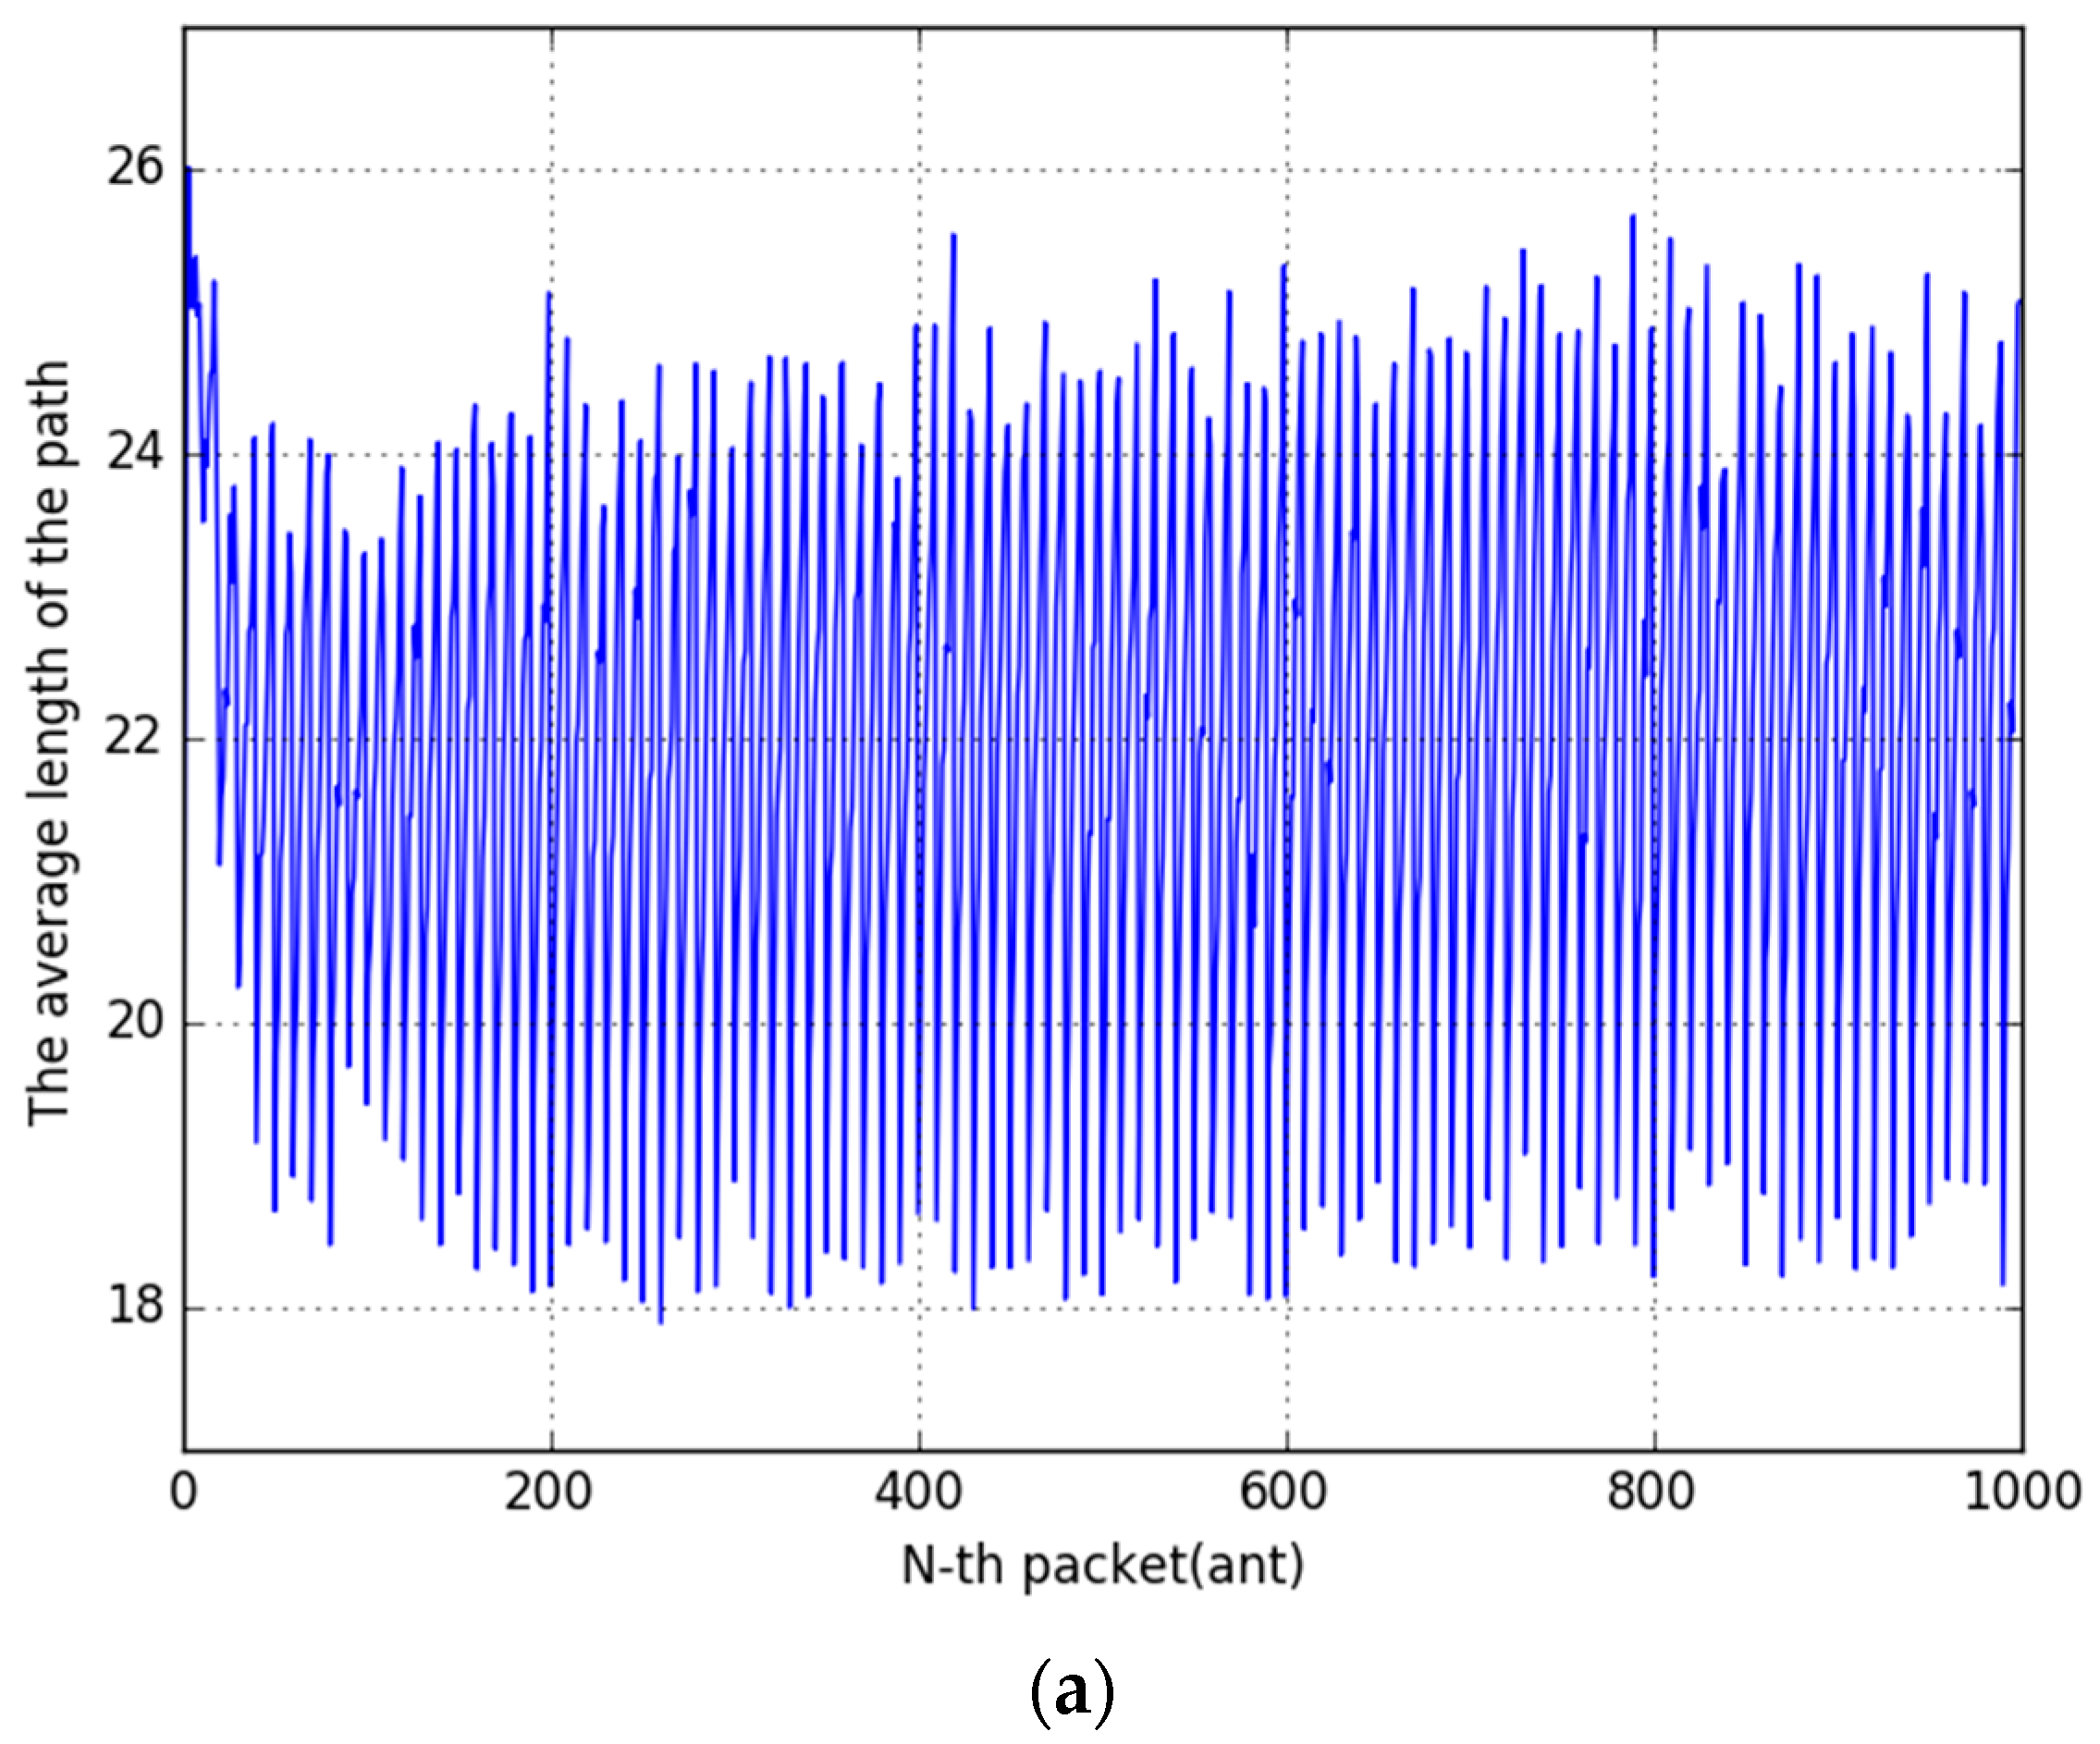
Second, this is the experimental result of ACS with Simple Backtracking Update. When the pheromone evaporation coefficient was increased from 0.1 to 0.9, it was confirmed that the optimized pheromone evaporation coefficient() was about 0.1. The average path length is 22.015080 which was a better result than ACS only. The time series graph of Figure 16a shows that it is not approaching the optimal path and is similar to Figure 14. But the histogram of Figure 16b shows that the frequency of 14 (the optimal path) is 3-times than Figure 14b.
5.1.3. Source Update
In this section, the performance of Ant System and Ant Colony System algorithms with Source Update was measured.
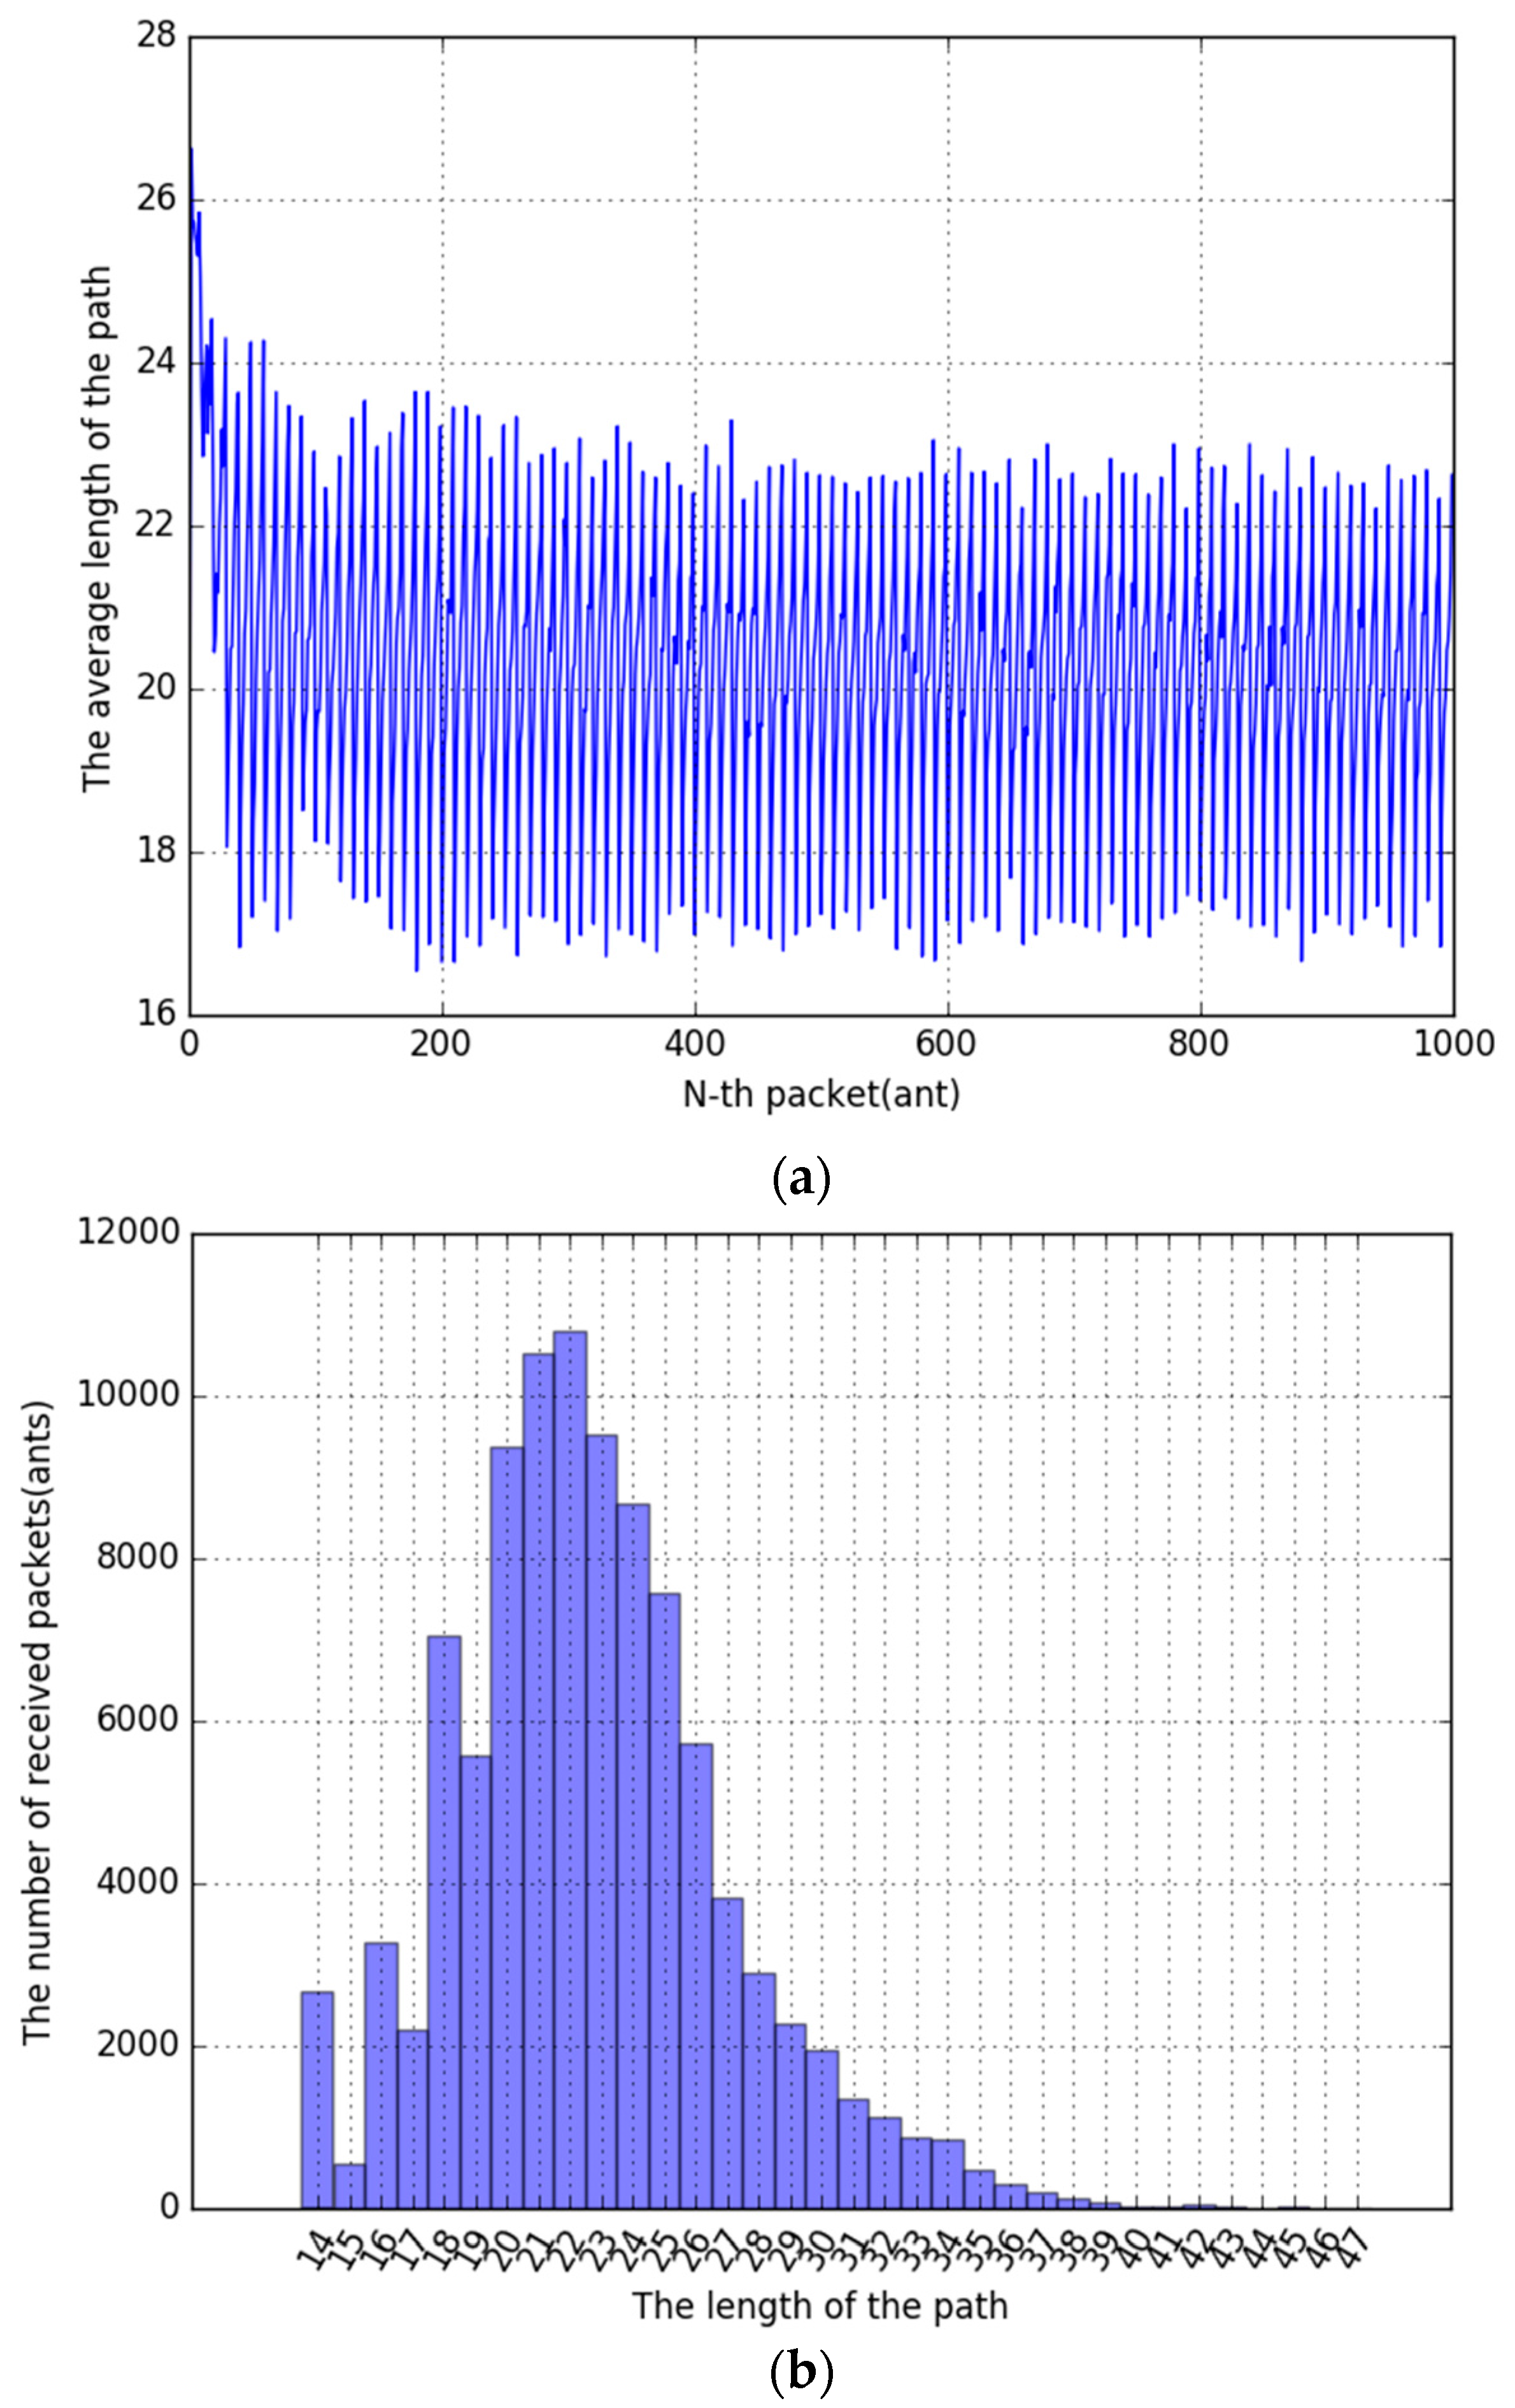
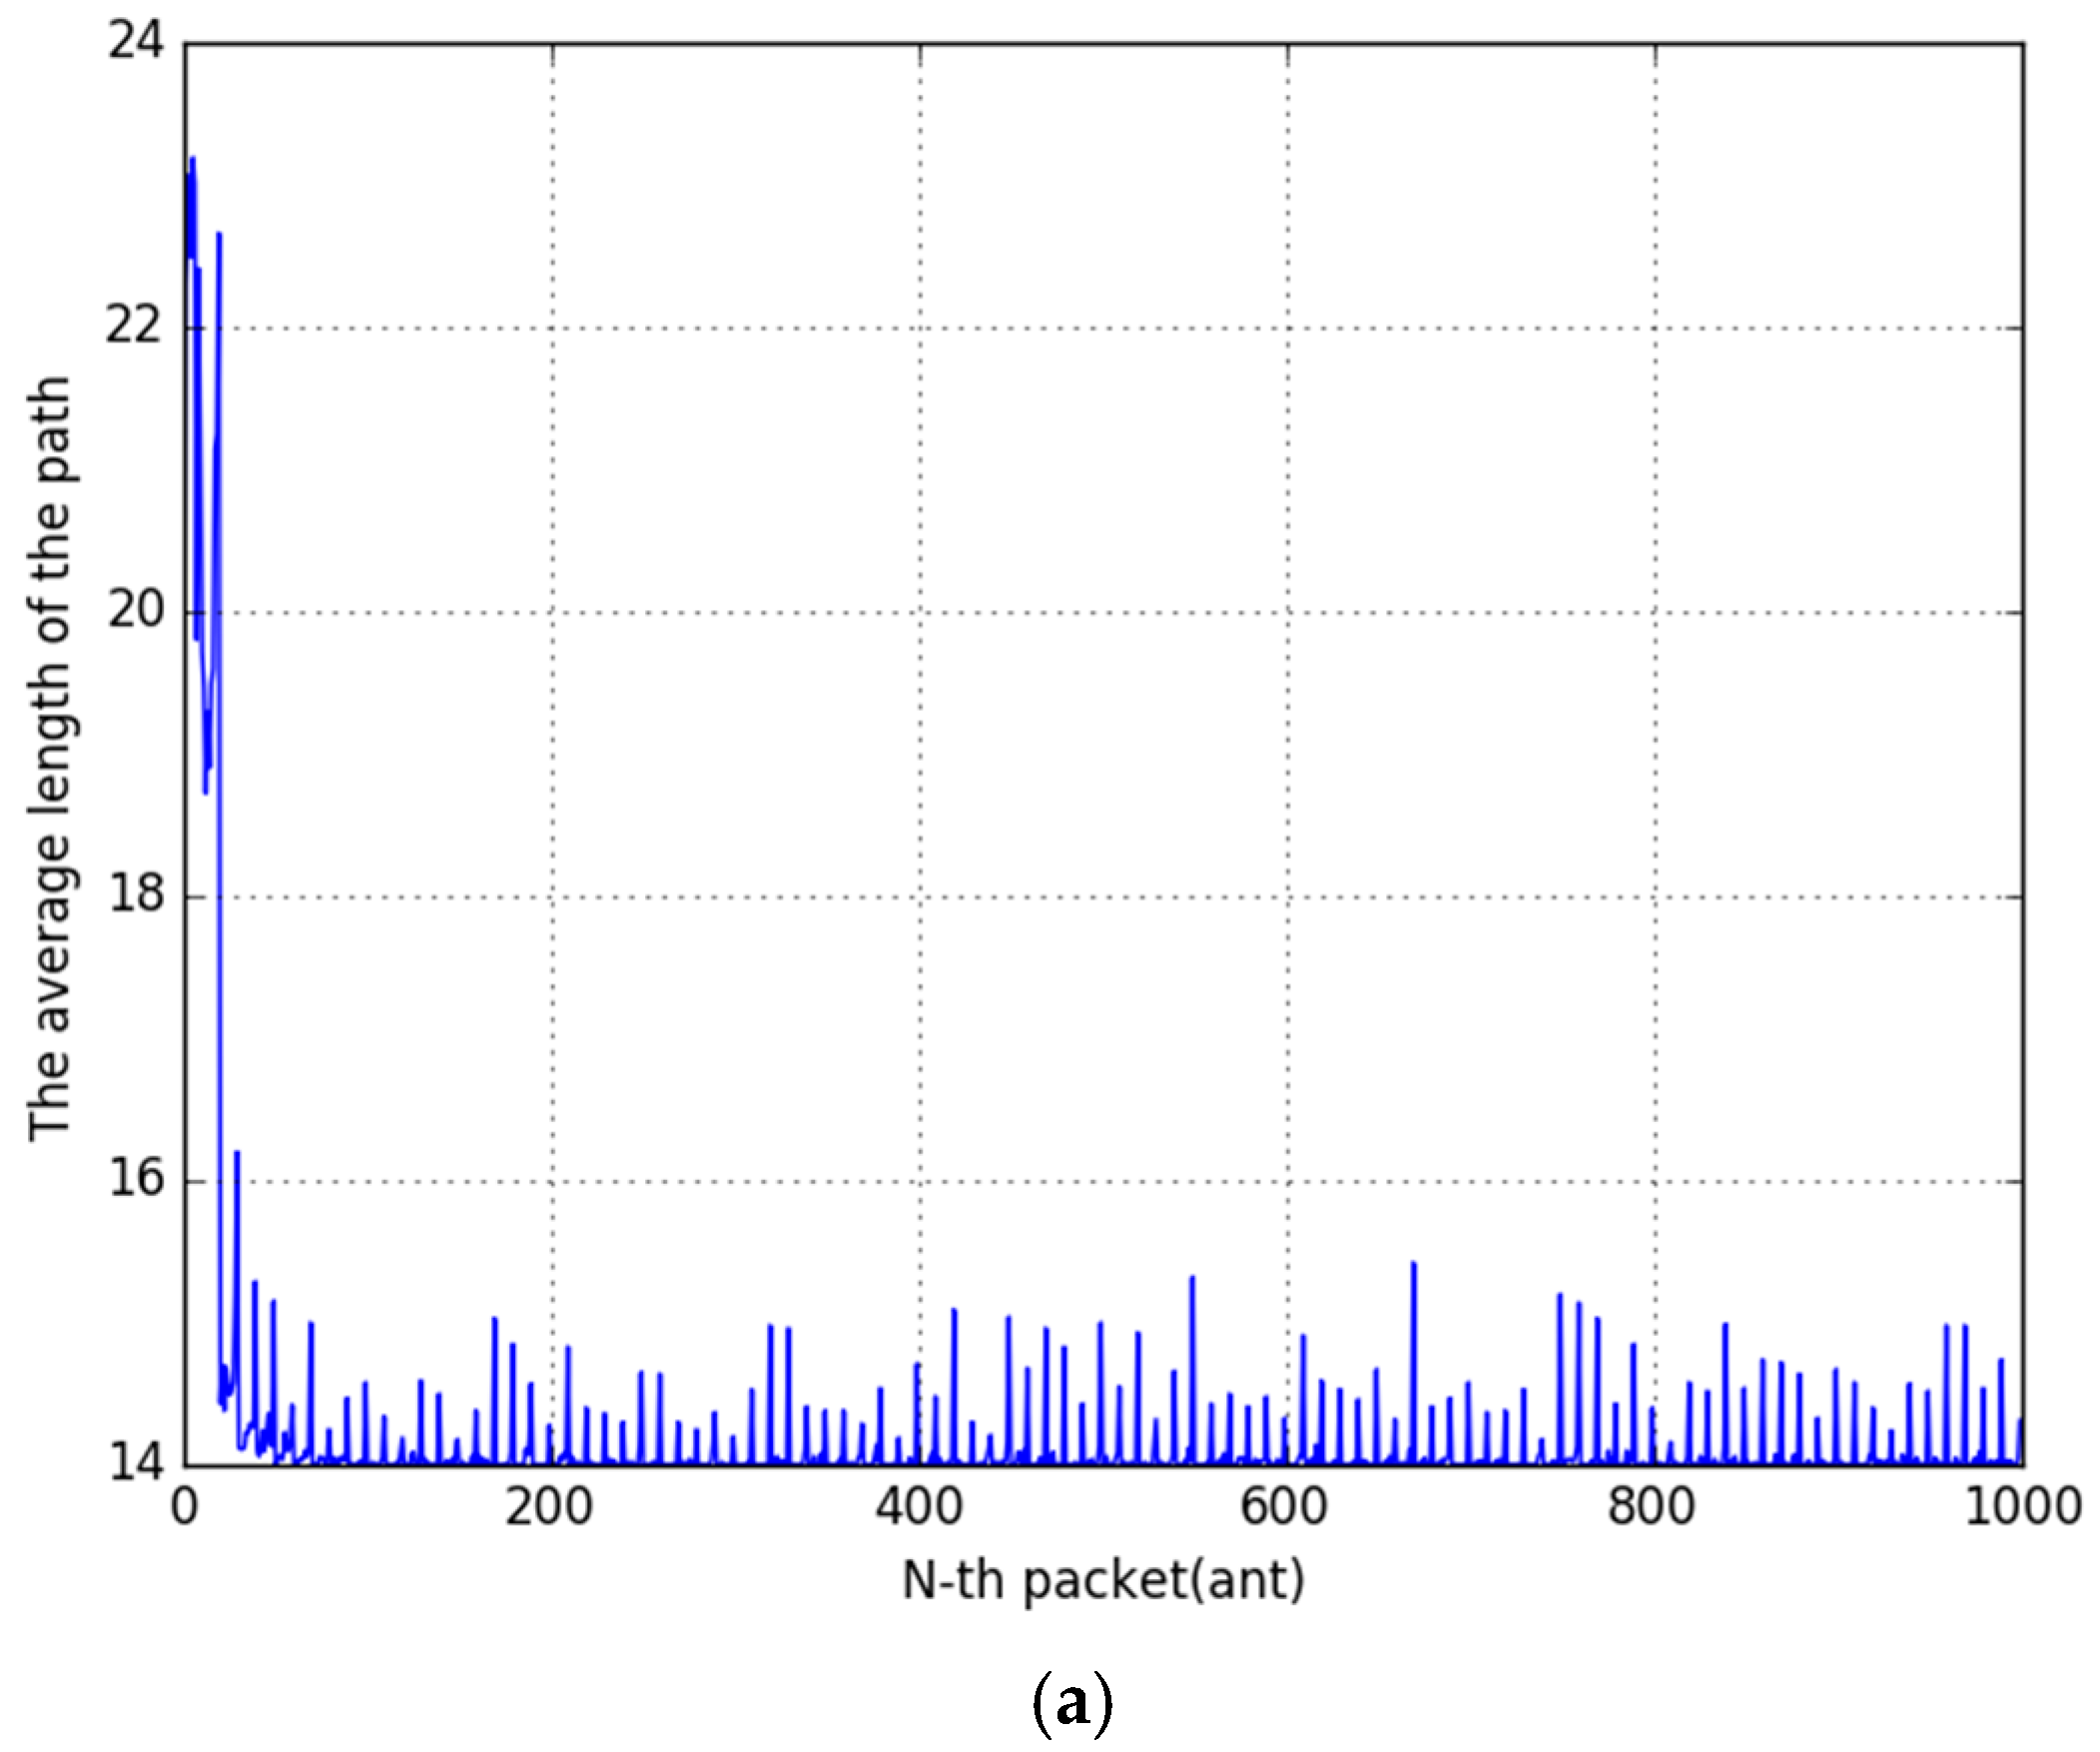
First, this is the experimental result of AS with Source Update. When the pheromone evaporation coefficient was increased from 0.1 to 0.9, it was confirmed that the optimized pheromone evaporation coefficient() was about 0.3. This is a different coefficient() compared with AS only. The average path length was 14.998210. This performance overwhelmed the previous cases. The time series graph of Figure 17a shows that it is very fatly approaching the optimal path than AS only. The histogram of Figure 17b shows a totally different result compared with a result of AS only. Almost ant packets passed the optimized path.
Second, this is the experimental result of ACS with Source Update. When the pheromone evaporation coefficient was increased from 0.1 to 0.9, it was confirmed that the optimized pheromone evaporation coefficient() was about 0.3. It is a different result compared with the previous cases. These results imply that if Source Update is applied, then the optimized pheromone evaporation coefficient() will be larger. The average path length is 14.219080 which was the best result than any other case. The time series graph of Figure 18a shows that it is very fatly approaching the optimal path than ACS only. After about 2 evaporation cycles, the Optimized path was established. The histogram of Figure 18b shows a totally different result compared with the result of ACS only. Almost ant packets passed the optimized path except for a very small number.
5.2. Network-Related Performance Measure
In this paper, we apply the ACO algorithm to network routing. Therefore, it is important how the ACO algorithm affects network performance. One of the main concerns of this paper is the path recovery time in the end-to-end delay and link failure and the link overhead caused by the routing itself. In this section, we analyze how these two network performance indicators can be related to the ACO parameters and how there is a relation between the two values.
5.2.1. Definition of Network Performance Measure
If transmission delay and processing delay can be ignored, the can be expressed as a sum of and . So it is written as (12):
And is defined as Load (bit-per-sec) caused by routing and satisfies these conditions:
- (1)
- All ants travel only through a single path.
- (2)
- There is no loss, so 100% of the response (backward ant) is received.
These two conditions mean the worst case. In other words, means the upper bound of the actual measured load.
5.2.2. Relation of Overhead and Recovery Time
To figure out the relation of Overhead and Recovery Time, we calculate how many messages can pass to a given link. According to the variables definition in Table 7, N ants (packets or messages) occur per cycle. Considering the round trip of the packet and assuming that request packet size and response packet size are the same, the message flows twice in total. So, the number of messages per second can be written as (13):
The Link Overhead can be easily obtained by multiplying by the size of the packet as (14):
It is not easy to calculate (14) because the size of the packet T is variable. But the upper bound of Link Overhead can be easily obtained by substituting MTU from T.
Recovery Time R can be expressed using ACO parameters listed in Table 7. First, Link-error detection time and Shortest Path Search time are random variables. Both Link-error detection time and Shortest Path Search time can be expressed in multiples cycle. This is because the computation time of the ACO algorithm is proportional to the cycle. and are expressed as
Also (14) can be re-expressed as (17) using (15) and (16):
where , are discrete random variables depending on the selected ACO algorithm. Finally, (18) can be obtained by multiplying the (14) by the (17):
Even the values of , are random variables, but they can be treated as constants since they are very small in the measurement. Therefore, the right side of Equation (4) can be treated as a constant. From Equation (4), we can see that the overhead increases exponentially with decreasing Recovery Time.
5.3. Network Performance Measure
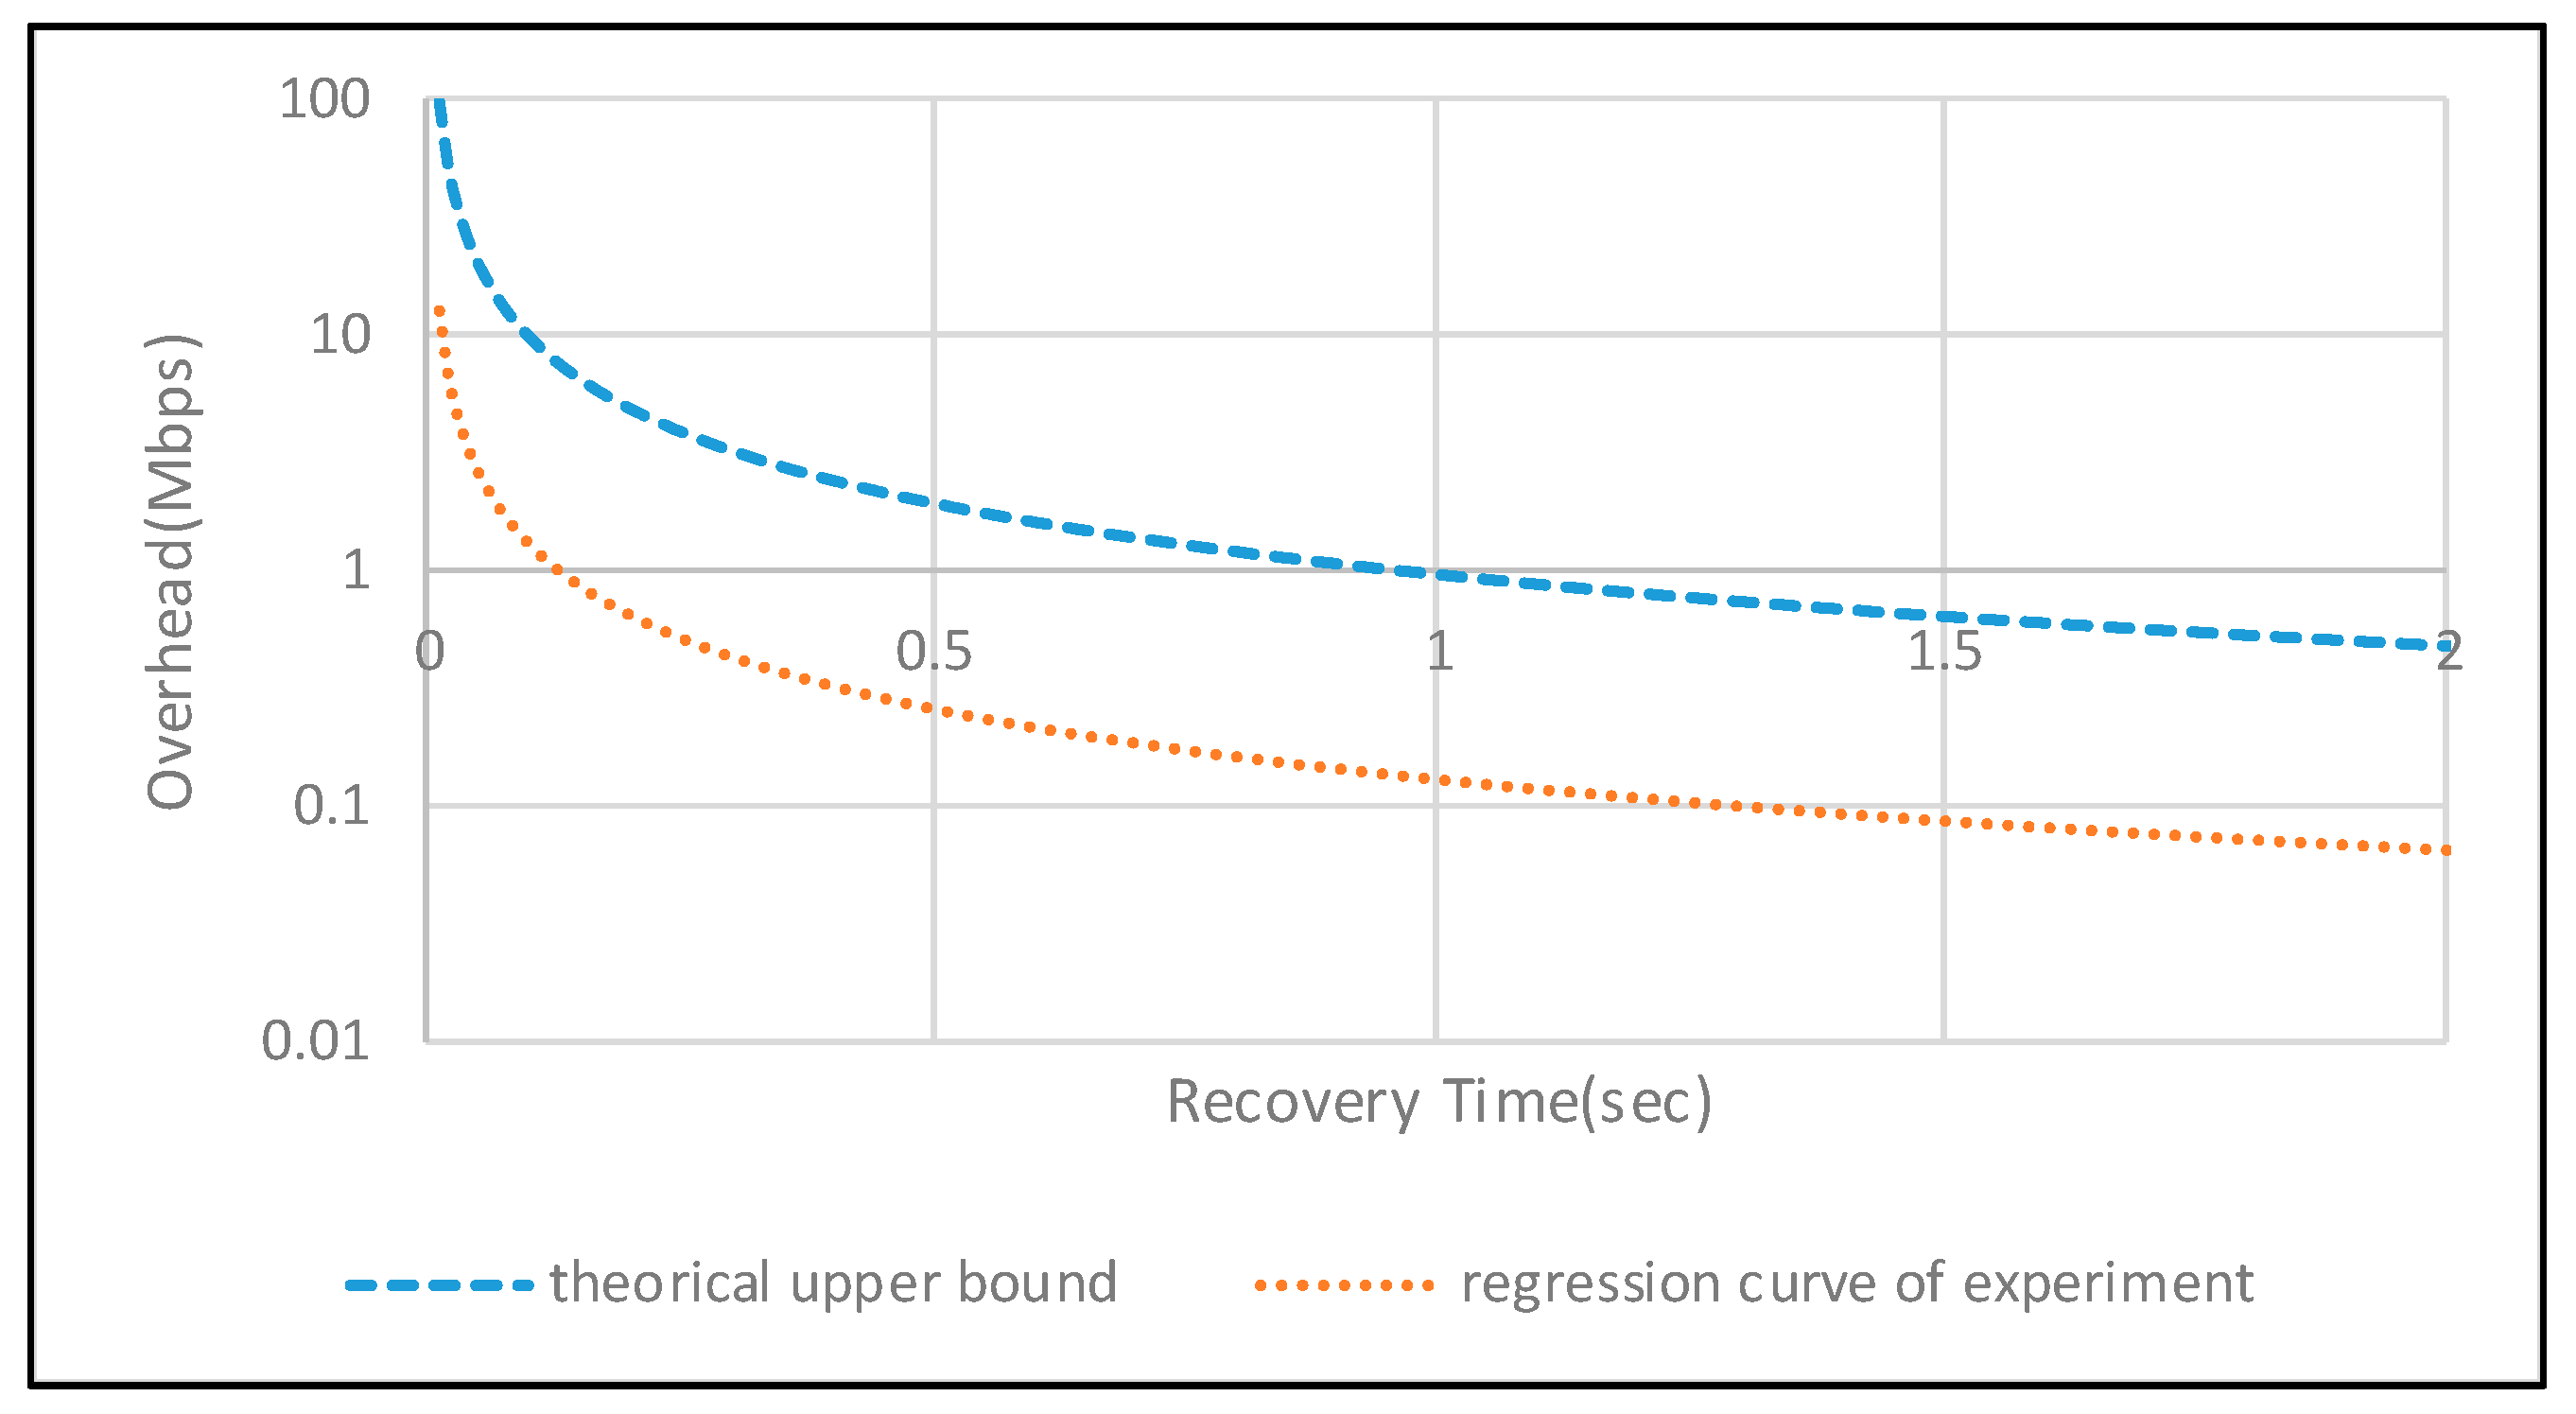
With Ant System; , the average of and was measured to be about 2 and 2, respectively. (Cycle) value is 50 ms, 100 ms, 200 ms 2000 ms, etc., the upper bound value of the overhead is given by (19):
Based on the experimental data, a regression curve was obtained by the regression analysis as (20):
The curve of Equations (1) and (2) are depicted in Figure 19. The X-axis is the Recovery Time in sec. The Y-axis is expressed as overhead in Mbps and expressed in log-scale. Figure 19 shows that the upper bound and actual values are quite different because the packet size is calculated assuming MTU (1500 bytes) when deriving the theoretical value. As a result of the actual measurement, it is analyzed that the packet size is about 10% of the MTU and 20% of the MTU when the packet is transmitted. Also, it shows that if Recovery Time decreases, then Link Overhead increases exponentially. Therefore, there is a limitation in reducing the recovery time in real networks.
6. Conclusions
In this paper, we proposed and developed Function-Oriented Networking, a platform for network users. It has a different philosophy as opposed to technologies for network managers of Software-Defined Networking technology, OpenFlow. It is the technology that can immediately reflect the demands of the network users in the network, unlike the existing OpenFlow and NFV, which do not reflect directly the needs of the network users. It allows the network user to determine the policy of the direct network, so it can be applied more precisely than the policy applied by the network manager. This is expected to increase the satisfaction of the service users when the network users try to provide new services.
In addition, we developed a FON function as a method to demonstrate actual FON. This FON function performs on-demand routing for Low-Delay Required service. We analyzed the characteristics of the ACO algorithm and found that the algorithm is suitable for low-delay required services. It was also the first in the world to implement the routing software using Ant Colony Optimization Algorithm in the real Ethernet network. In order to improve the routing performance, several algorithms of the Ant Colony Optimization Algorithm have been developed to enable faster path search-routing and path recovery. The relationship between the network performance index and the ACO routing parameters is derived, and the results are compared and analyzed. Through this, it was possible to develop the ACO algorithm.
In this paper, we aimed to solve the problems where conventional biology-inspired networking such as ACO algorithm cannot be implemented in actual networks. Although there have been various researches for Biology-Inspired-Networking, it was the goal of this paper to solve the problem that it is almost impossible to send and receive real network traffic by applying technology such as ACO to network equipment. Through this paper, the proposed technology has made a great contribution to enabling traffic sending and receiving based on technologies such as ACO in real networks. Therefore, biology-inspired-networking research such as ACO is being carried out on real networks instead of simulations, and improvement of the Biology-Inspired-Networking algorithm is part of future research.
In the future, based on the Biology-Inspired-Networking algorithm, we will analyze the difference between theory and practice in sending and receiving of the Internet traffic, and we will continue to research the improvement of Biology-Inspired-Networking based on this.
Acknowledgments
This work was supported by Institute for Information & Communications Technology Promotion (IITP) grant funded by the Korea government (MSIT) (2014-0-00547, Development of Core Technology for Autonomous Network Control and Management).
Author Contributions
All the authors contributed equally to this work. All authors read and approved the final manuscript.
Conflicts of Interest
The authors declare no conflict of interest.
References
- Xia, F.; Yang, L.T.; Wang, L.; Vinel, A. Internet of things. Int. J. Commun. Syst. 2012, 25, 1101. [Google Scholar] [CrossRef]
- Alliance, N. NGMN 5G White Paper; NGMN: Frankfurt am Main, Germany, 2015. [Google Scholar]
- METIS 2020. Available online: https://www.metis2020.com (accessed on 1 August 2017).
- Ashton, K. That Internet of Things Thing. Available online: http://www.rfidjournal.com/articles/view?4986 (accessed on 1 August 2017).
- Gubbi, J.; Buyya, R.; Marusic, S.; Palaniswami, M. Internet of things (IoT): A vision, architectural elements, and future directions. Future Gener. Comput. Syst. 2013, 29, 1645–1660. [Google Scholar] [CrossRef]
- Fettweis, G.P. The tactile internet: Applications and challenges. IEEE Veh. Technol. Mag. 2014, 9, 64–70. [Google Scholar] [CrossRef]
- Maier, M.; Chowdhury, M.; Rimal, B.P.; Van, D.P. The tactile internet: Vision, recent progress, and open challenges. IEEE Commun. Mag. 2016, 54, 138–145. [Google Scholar] [CrossRef]
- European Telecommunications Standards Institute. Network Functions Virtualization; ETSI: Sophia Antipolis, France, 2012. [Google Scholar]
- McKeown, N.; Anderson, T.; Balakrishnan, H.; Parulkar, G.; Peterson, L.; Rexford, J.; Shenker, S.; Turner, J. Openflow: Enabling Innovation in Campus Networks. ACM SIGCOMM Comput. Commun. Rev. 2008, 38, 69–74. [Google Scholar] [CrossRef]
- Onos. Available online: http://onosproject.org (accessed on 1 August 2017).
- Opendaylight. Available online: https://www.opendaylight.org (accessed on 1 August 2017).
- NFV White Paper. Available online: https://portal.etsi.org/nfv/nfv_white_paper.pdf (accessed on 1 August 2017).
- GENI. Available online: https://www.geni.net (accessed on 1 August 2017).
- Alliance, N. Description of Network Slicing Concept; NGMN: Frankfurt am Main, Germany, 2016. [Google Scholar]
- Quagga. Available online: http://www.nongnu.org/quagga (accessed on 1 August 2017).
- Dorigo, M.; Maniezzo, V.; Colorni, A. Ant system: Optimization by a colony of cooperating agents. IEEE Trans. Syst. Man Cybern. Part B 1996, 26, 29–41. [Google Scholar] [CrossRef] [PubMed]
- Dorigo, M.; Gambardella, L.M. Ant colony system: A cooperative learning approach to the traveling salesman problem. IEEE Trans. Evol. Comput. 1997, 1, 53–66. [Google Scholar] [CrossRef]
- Wang, J.; Osagie, E.; Thulasiraman, P.; Thulasiram, R.K. HOPNET: A hybrid ant colony optimization routing algorithm for mobile ad hoc network. Ad Hoc Netw. 2009, 7, 690–705. [Google Scholar] [CrossRef]
- Gunes, M.; Sorges, U.; Bouazizi, I. Ara-the ant-colony based routing algorithm for MANETS. In Proceedings of the International Conference on Parallel Processing Workshops, Vancouver, BC, Canada, 21 August 2002; pp. 79–85. [Google Scholar]
- Islam, M.T.; Thulasiraman, P.; Thulasiram, R.K. A parallel ant colony optimization algorithm for all-pair routing in MANETS. In Proceedings of the Parallel and Distributed Processing Symposium, Nice, France, 22–26 April 2003. [Google Scholar]
- Singh, G.; Kumar, N.; Verma, A.K. Oantalg: An orientation based ant colony algorithm for mobile ad hoc networks. Wirel. Pers. Commun. 2014, 77, 1859–1884. [Google Scholar] [CrossRef]
- Prabaharan, S.; Ponnusamy, R. Energy aware ant colony optimization based dynamic random routing strategy for MANET. Energy 2016, 5, 1–5. [Google Scholar]
- Chatterjee, S.; Das, S. Ant colony optimization based enhanced dynamic source routing algorithm for mobile ad-hoc network. Inf. Sci. 2015, 295, 67–90. [Google Scholar] [CrossRef]
- Sutariya, D.; Kamboj, P. A survey of ant colony based routing algorithms for MANET. Eur. Sci. J. 2014, 9, 82–91. [Google Scholar]
- Oranj, A.; Alguliev, R.; Yusifov, F.; Jamali, S. Routing algorithm for vehicular ad hoc network based on dynamic ant colony optimization. Int. J. Electron. Elect. Eng. 2016, 4, 79–83. [Google Scholar] [CrossRef]
- Broch, J.; Maltz, D.A.; Johnson, D.B.; Hu, Y.-C.; Jetcheva, J. A performance comparison of multi-hop wireless ad hoc network routing protocols. In Proceedings of the 4th Annual ACM/IEEE International Conference on Mobile Computing and Networking, Dallas, TX, USA, 25–30 October 1998; pp. 85–97. [Google Scholar]
- Di Caro, G.; Ducatelle, F.; Gambardella, L.M. Anthocnet: An adaptive nature-inspired algorithm for routing in mobile ad hoc networks. Trans. Emerg. Telecommun. Technol. 2005, 16, 443–455. [Google Scholar] [CrossRef]
- Di Caro, G.; Dorigo, M. Antnet: Distributed stigmergetic control for communications networks. J. Artif. Intell. Res. 1998, 9, 317–365. [Google Scholar]
- Maniezzo, A. Distributed optimization by ant colonies. In Toward a Practice of Autonomous Systems: Proceedings of the First European Conference on Artificial Life; MIT Press: Cambridge, MA, USA, 1992; p. 134. [Google Scholar]
- Liu, Z.; Liu, T.; Gao, X. An improved ant colony optimization algorithm based on pheromone backtracking. In Proceedings of the IEEE 14th International Conference on Computational Science and Engineering (CSE), Dalian, China, 24–26 August 2011; pp. 658–661. [Google Scholar]
- Li, W.; Dong, L. Special factor backtracking algorithm for optimizing. In Proceedings of the 2010 International Conference on Intelligent Computing and Integrated Systems (ICISS), Guilin, China, 22–24 October 2010; pp. 27–30. [Google Scholar]
- Yu, Y.; Li, Y.; Li, J. Nonparametric modeling of magnetorheological elastomer base isolator based on artificial neural network optimized by ant colony algorithm. J. Intell. Mater. Syst. Struct. 2015, 26, 1789–1798. [Google Scholar] [CrossRef]
- Dorigo, M.; Gambardella, L. Ant-q: A reinforcement learning approach to the traveling salesman problem. In Proceedings of the Twelfth International Conference on Machine Learning, Tahoe City, CA, USA, 9–12 July 2016; pp. 252–260. [Google Scholar]
- Du, K.-L.; Swamy, M. Ant colony optimization. In Search and Optimization by Metaheuristics; Springer: New York, NY, USA, 2016; pp. 191–199. [Google Scholar]
- Sim, Y.-B.; SeungGwan, L.; SungWon, L. The ACO routing agent implementation for the real network. In Proceedings of the 2016 Eighth International Conference on Ubiquitous and Future Networks (ICUFN), Vienna, Austria, 5–8 July 2016. [Google Scholar]
- Ant Colony Optimization Routing Agent for the Real Network (Ethernet). Available online: https://github.com/MobileConvergenceLab/AntColonyOptimization (accessed on 1 August 2017).
- Mininet. Available online: http://mininet.org (accessed on 1 August 2017).
Figure 1.
Function-Oriented Networking (FON) switch concept.
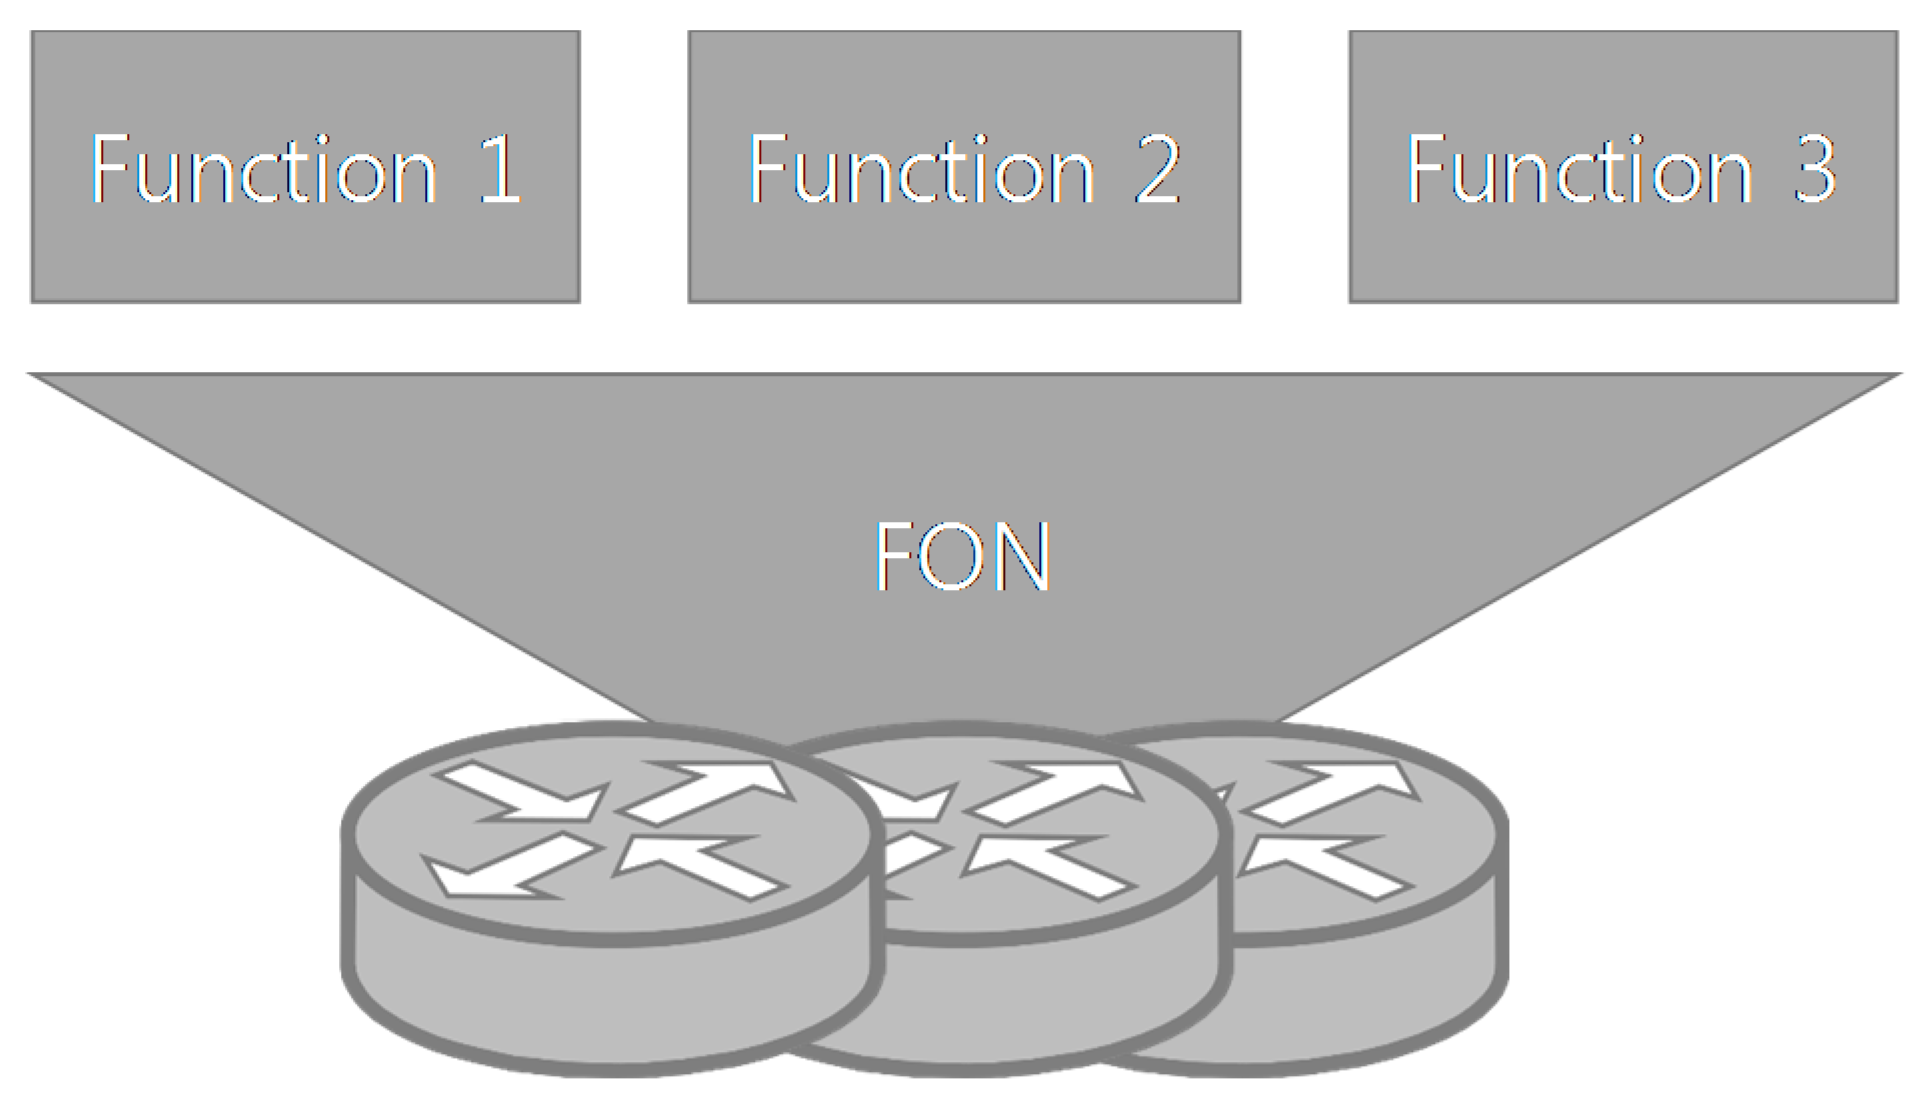
Figure 2.
FON scenario.
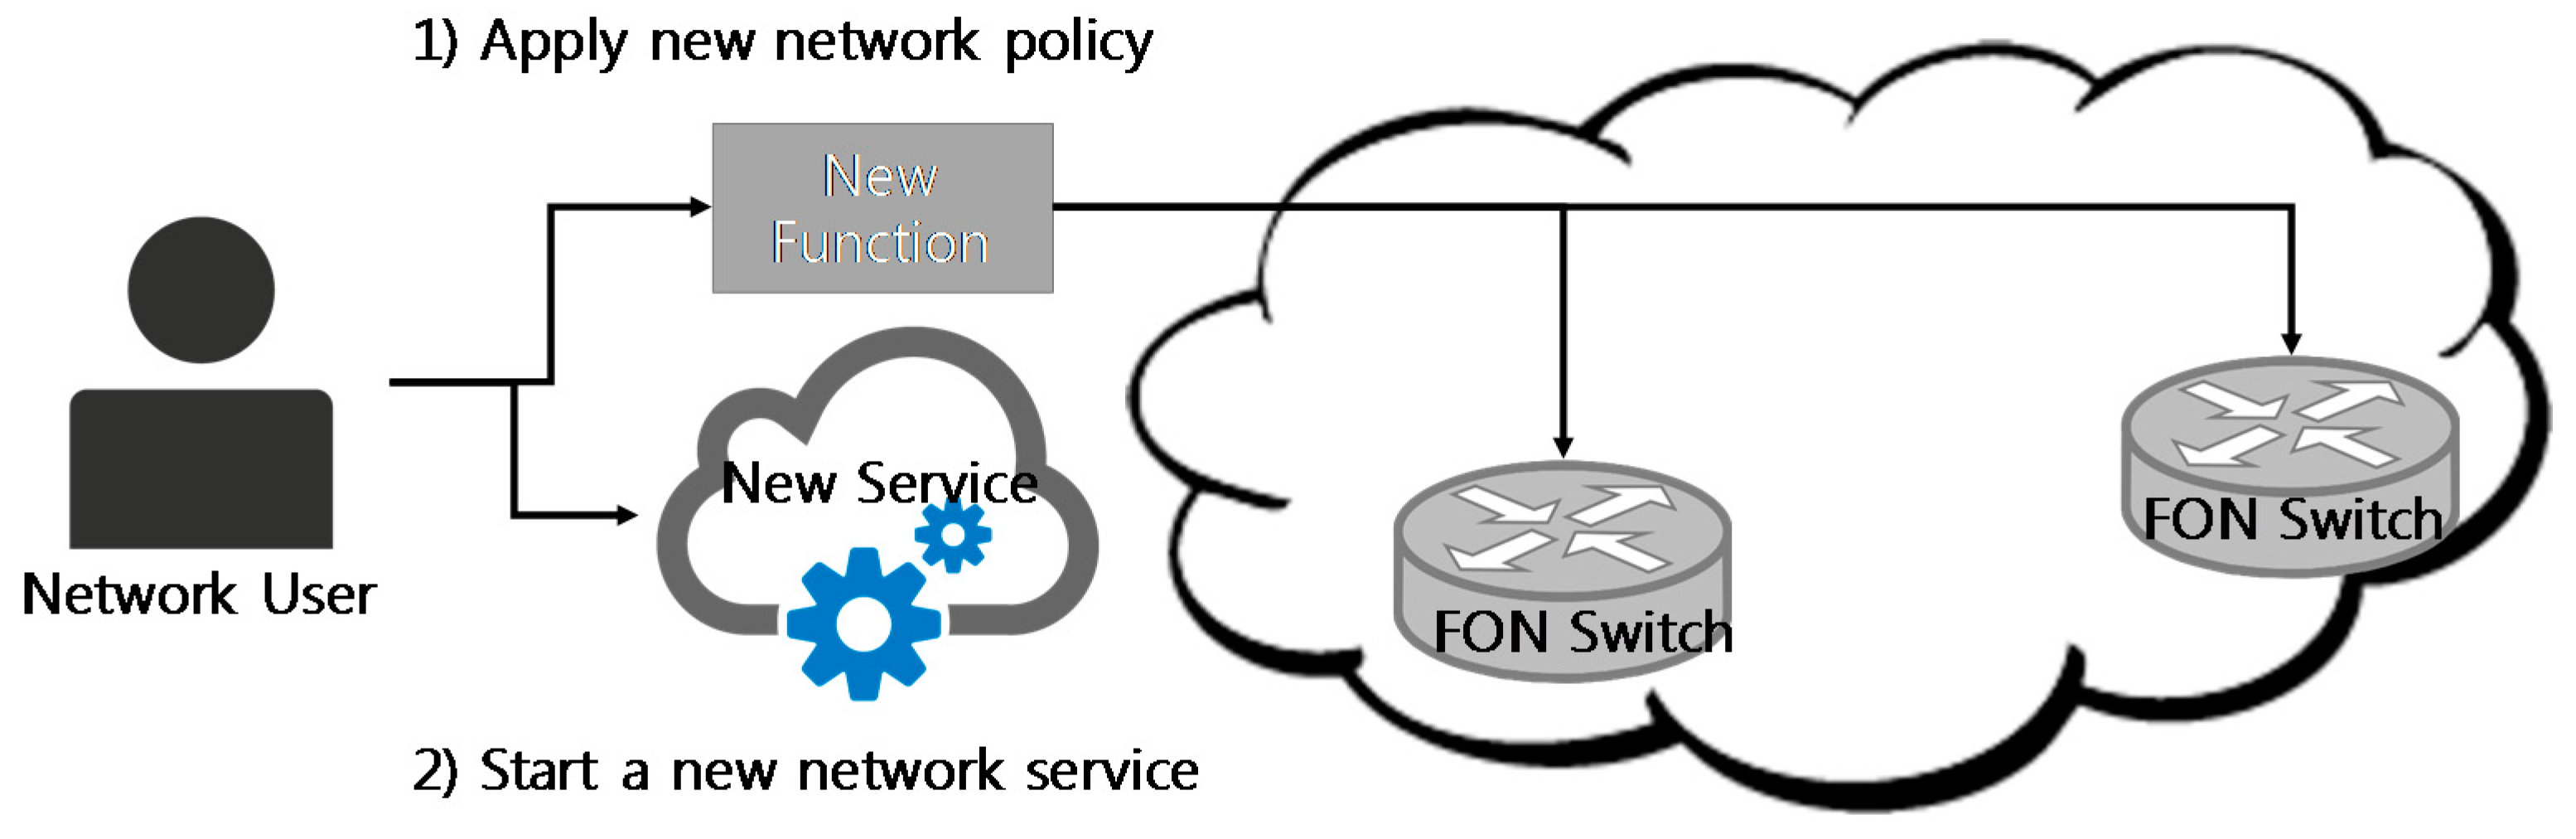
Figure 3.
The FON Packet architecture encapsulated in Ethernet frame.
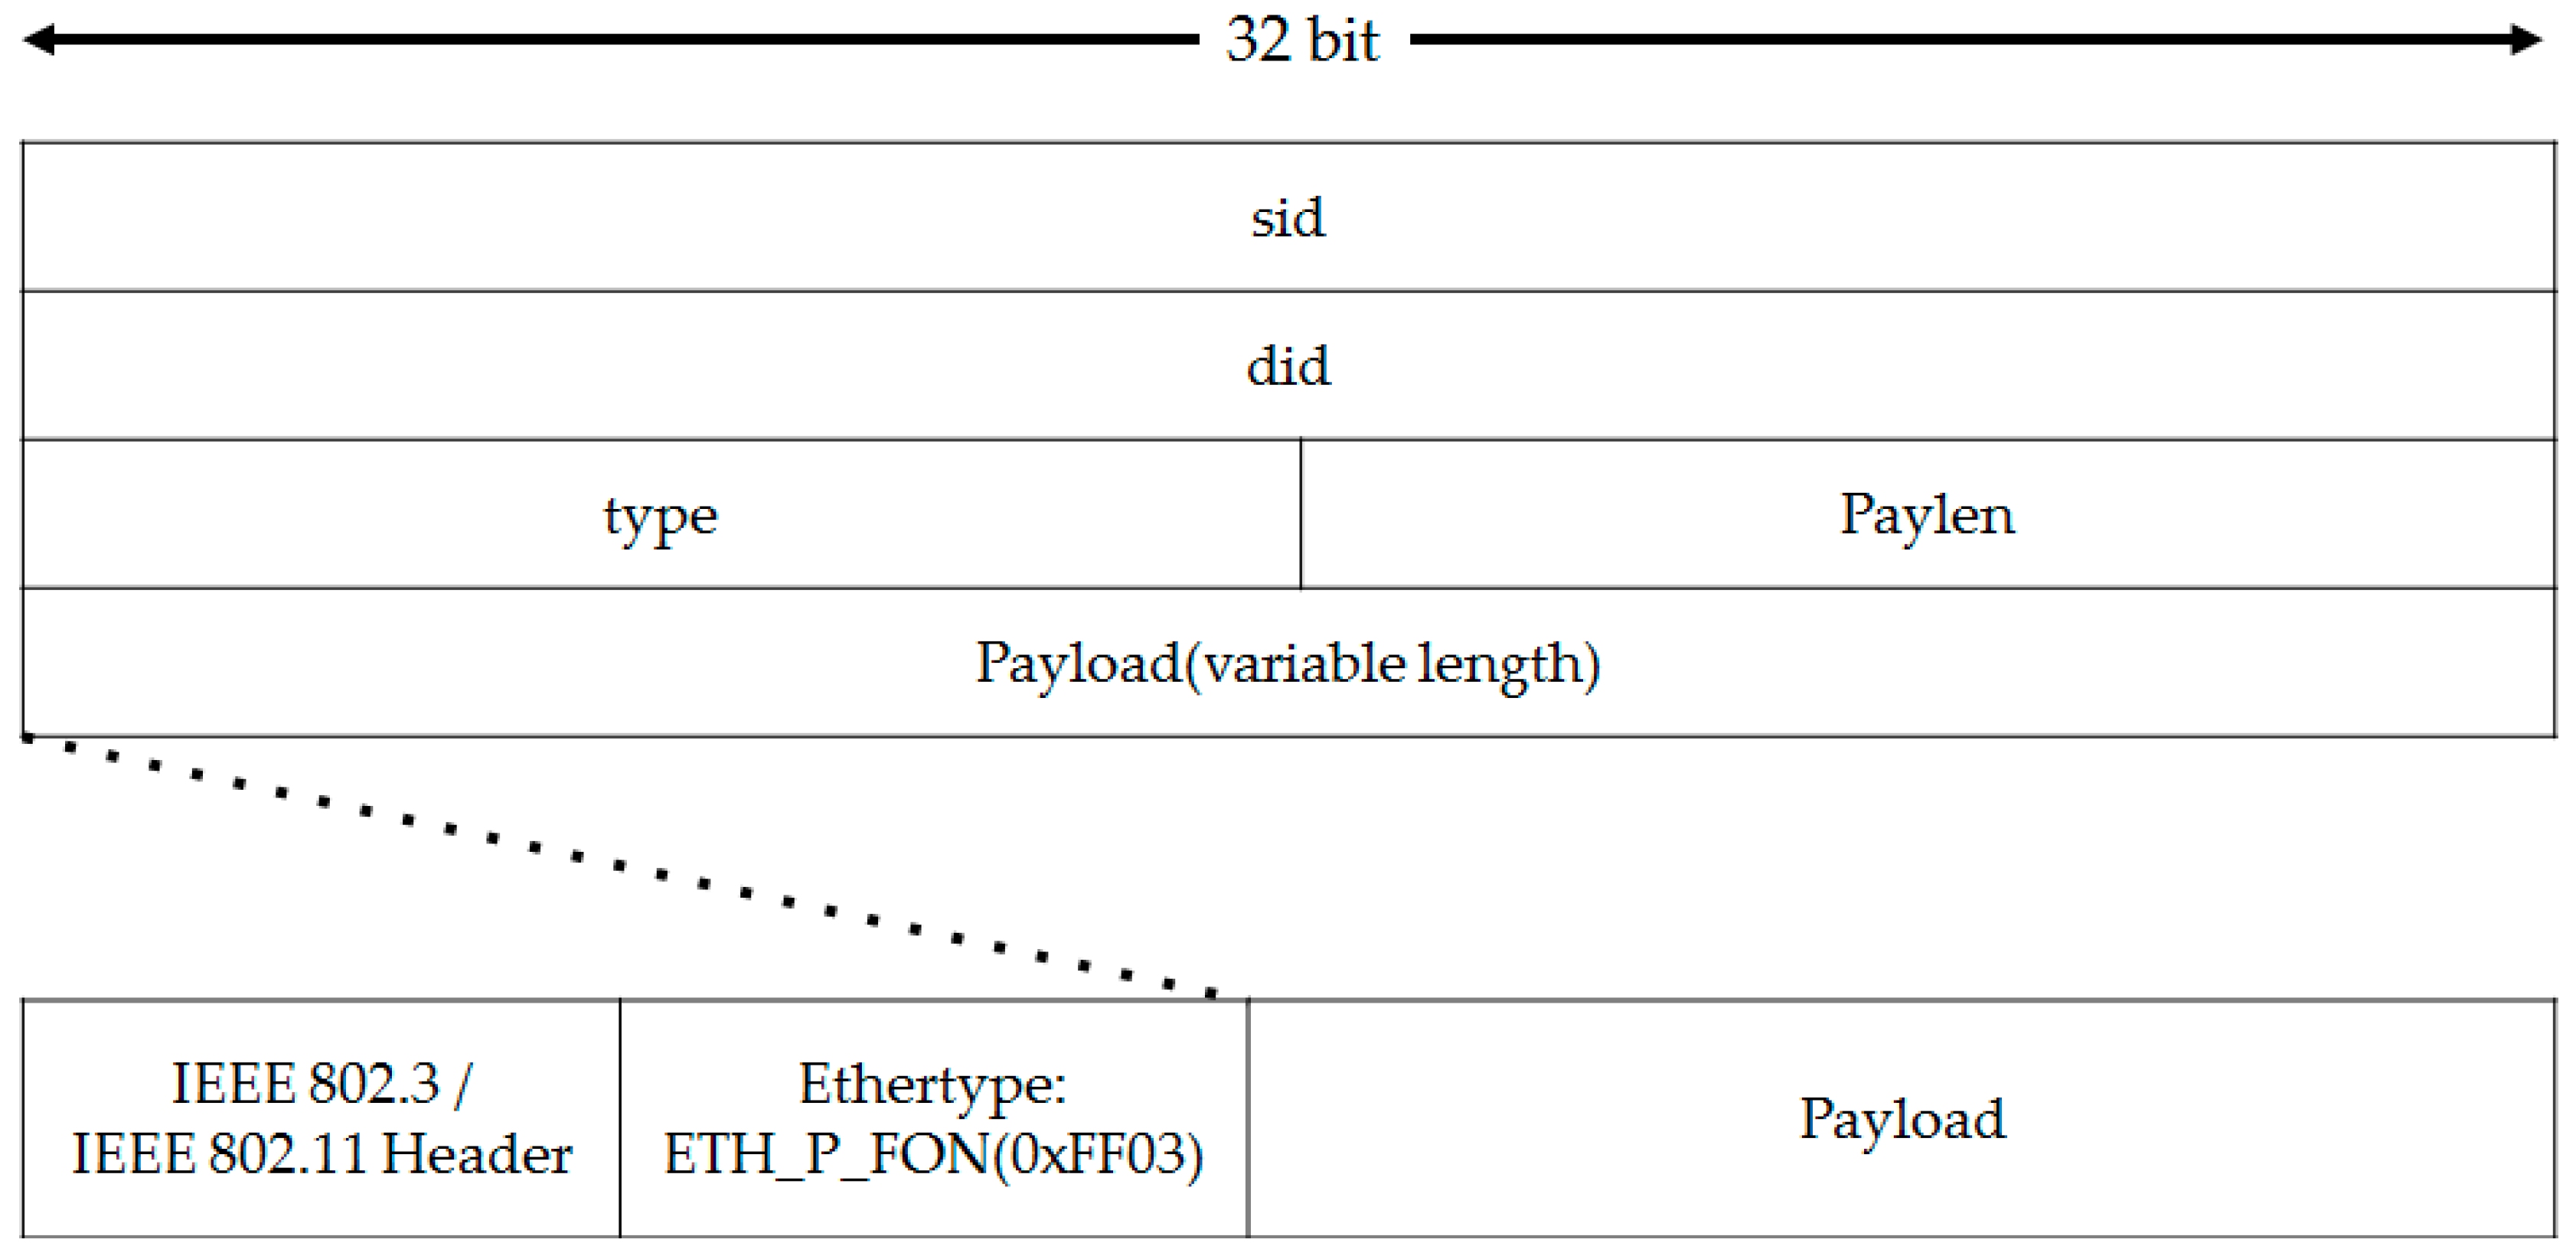
Figure 4.
Format of Synchronous Request Message Header.
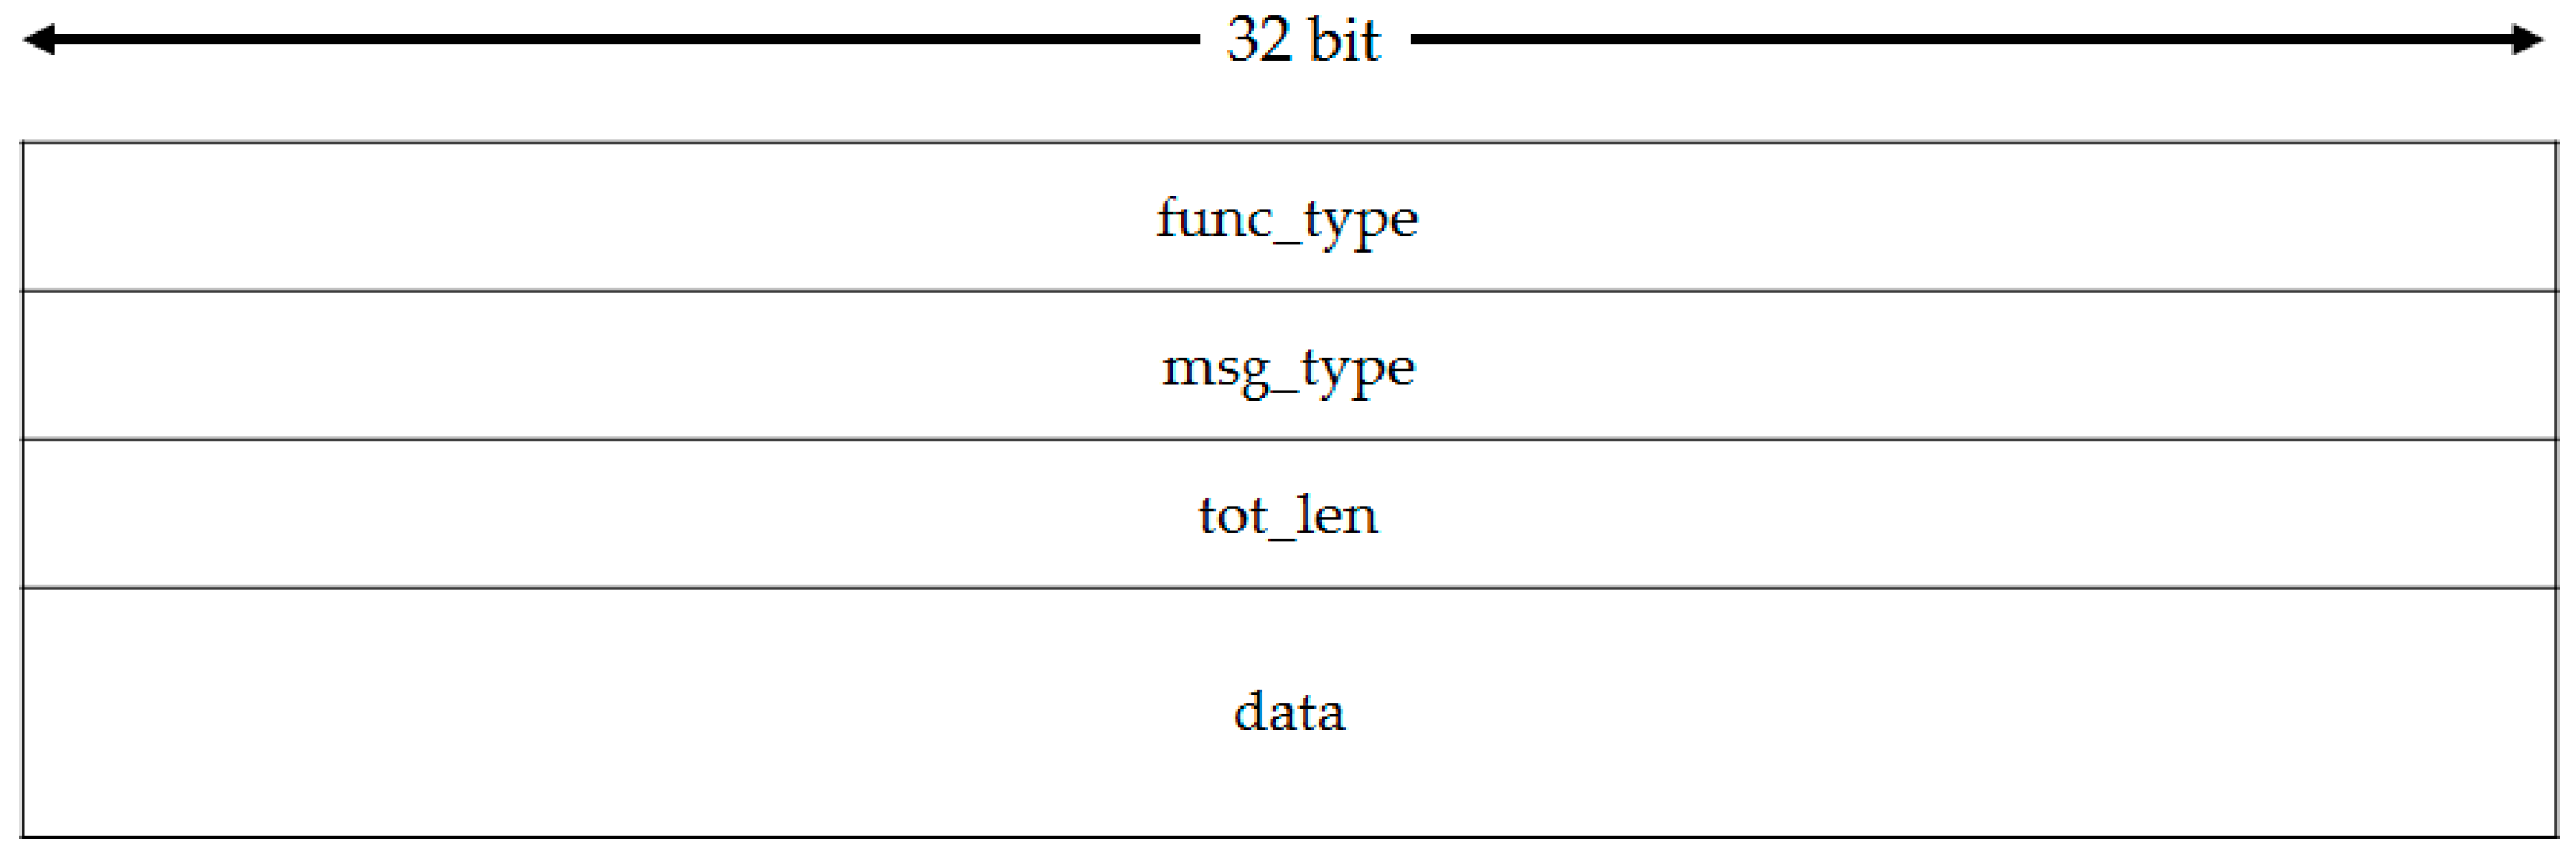
Figure 5.
Format of Synchronous Response Message Header.
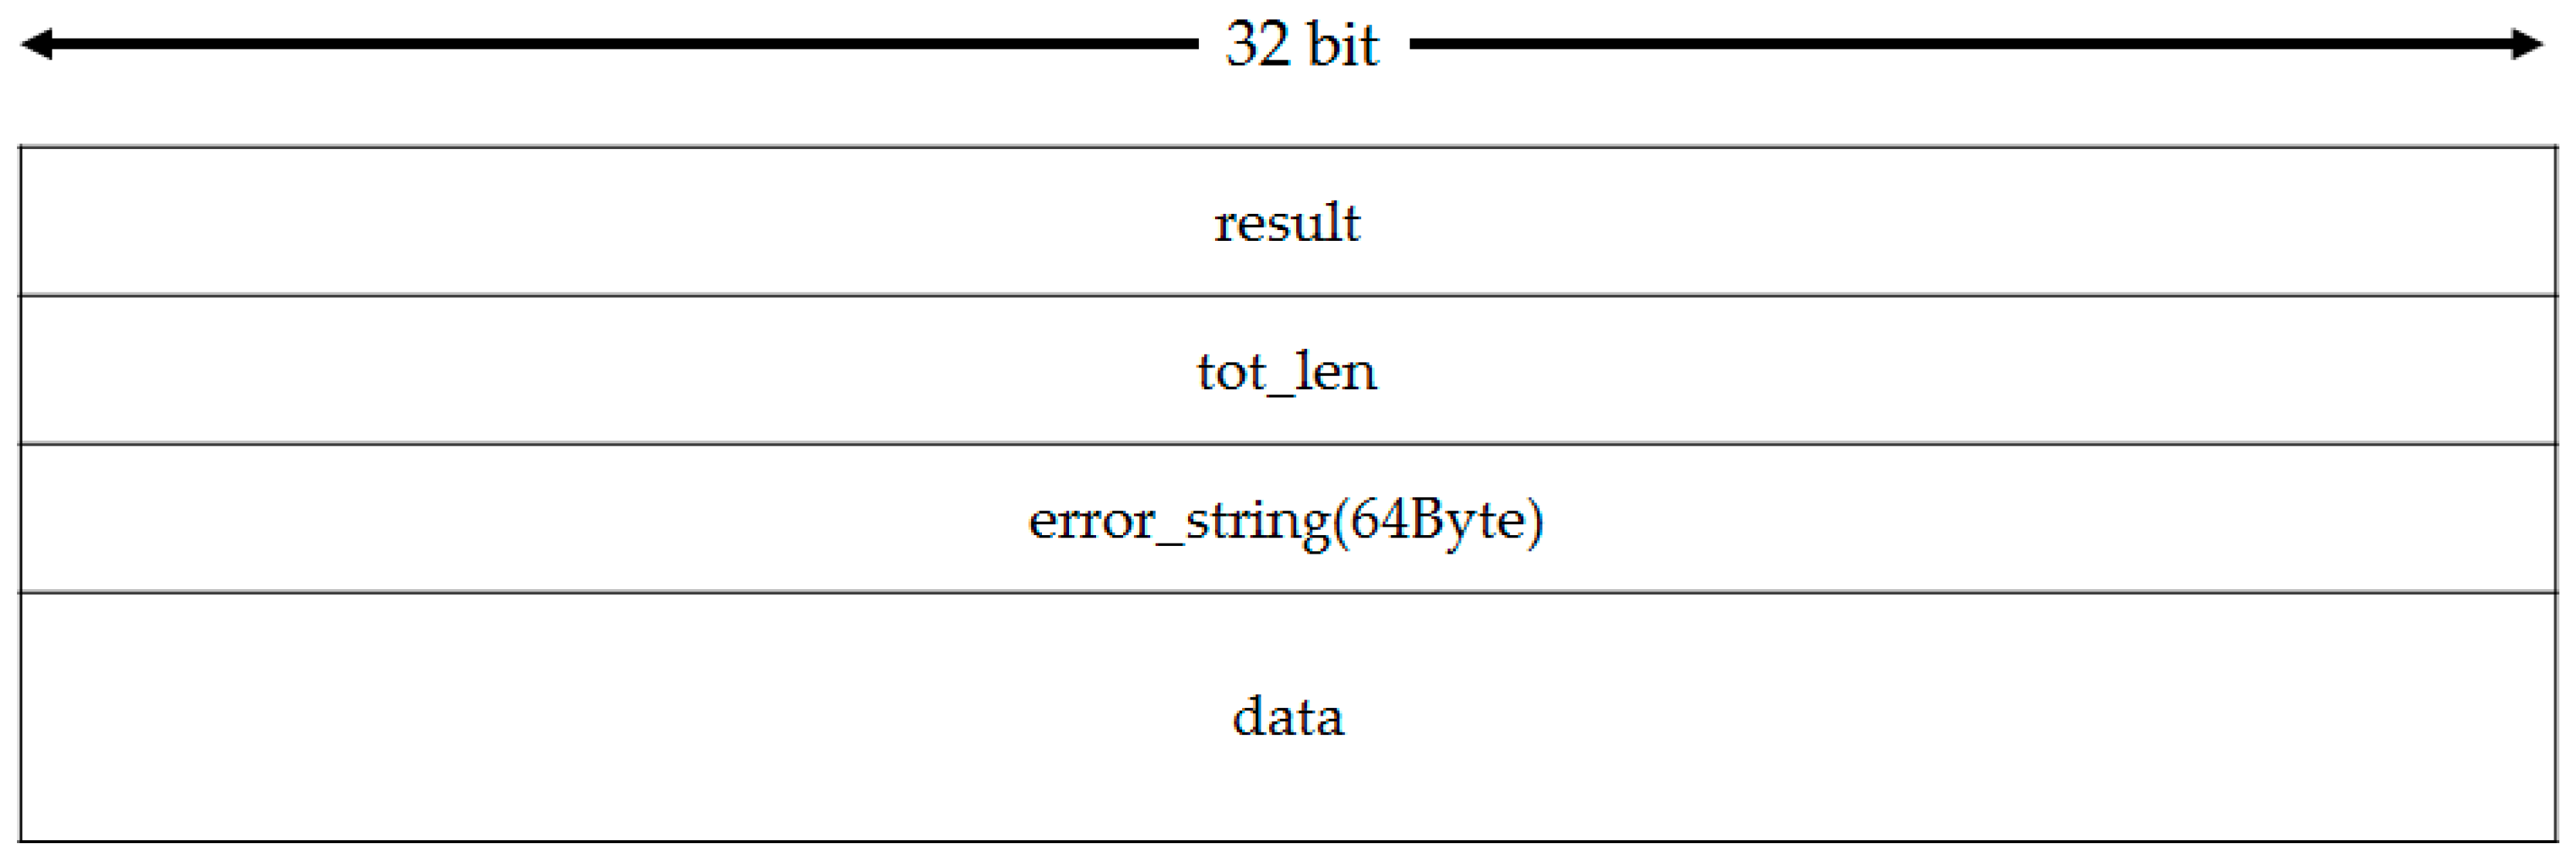
Figure 6.
Sequence diagram of processing and exchanging FON Packet.

Figure 7.
The structure of the pheromone table.

Figure 8.
Flow chart of pheromone update. (a) General ACO algorithm; (b) Source Update algorithm.

Figure 9.
Flow Chart: The Fast Path Recovery Algorithm.
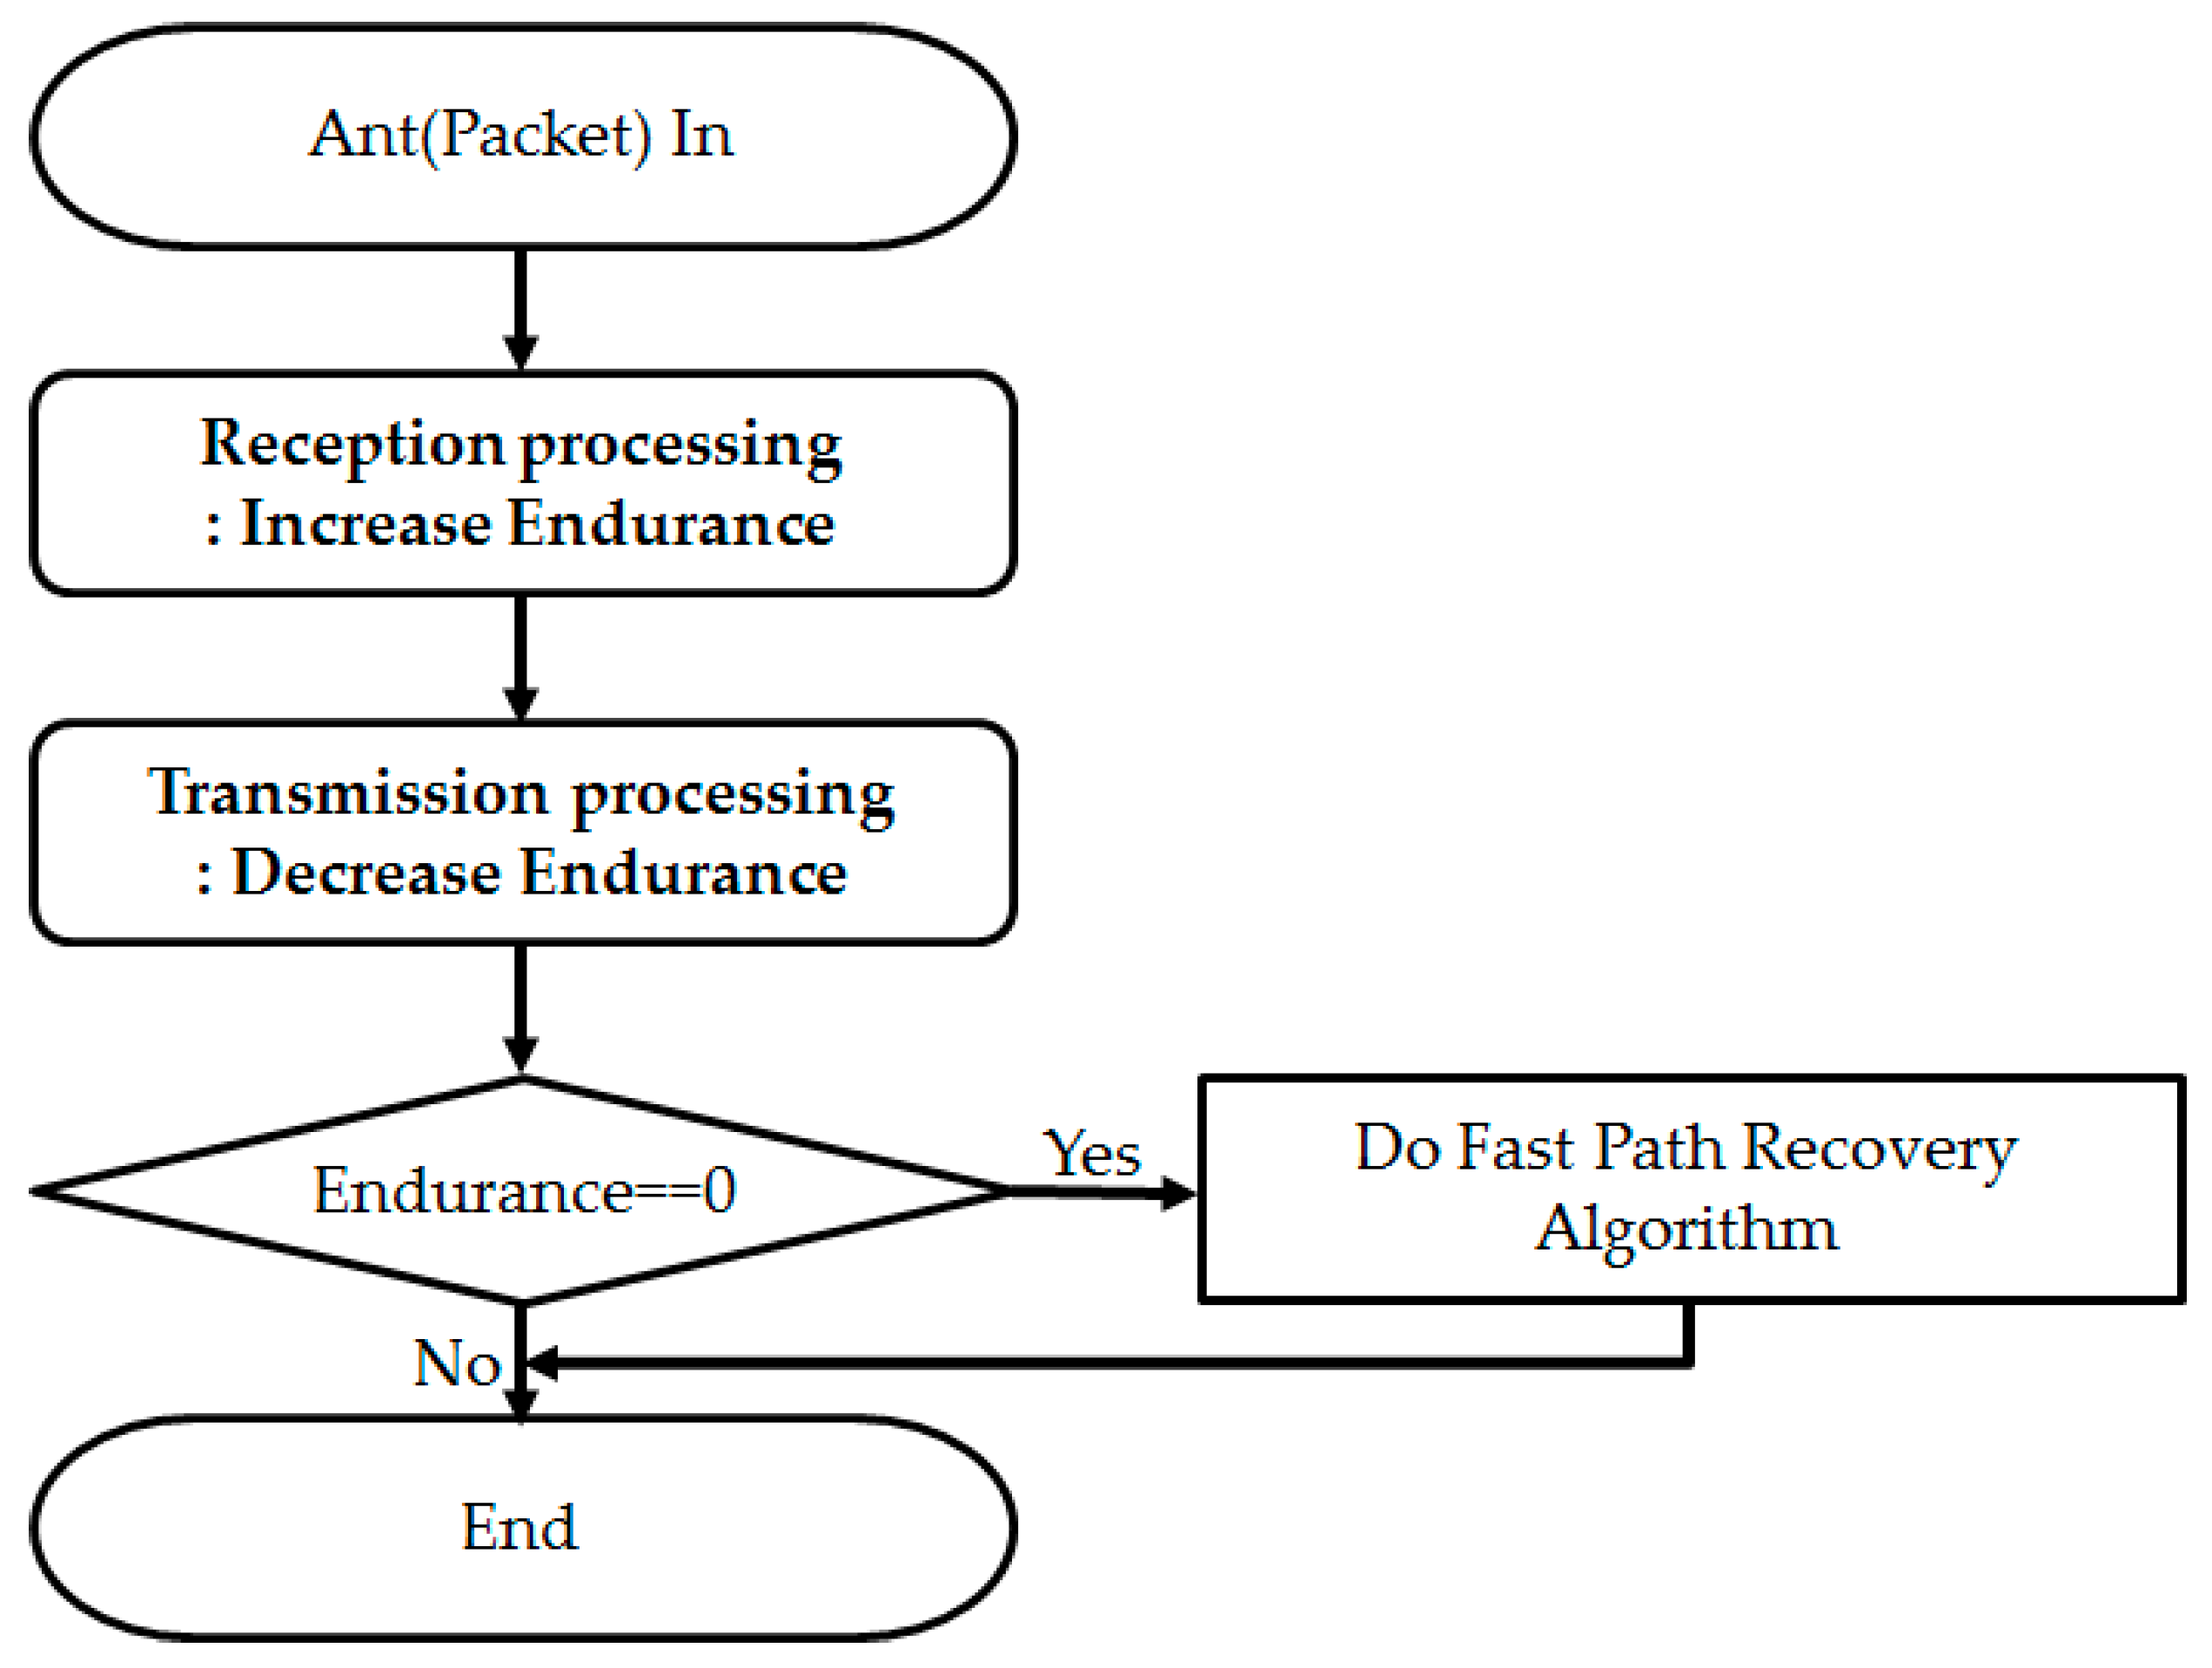
Figure 10.
Format of ant packet.
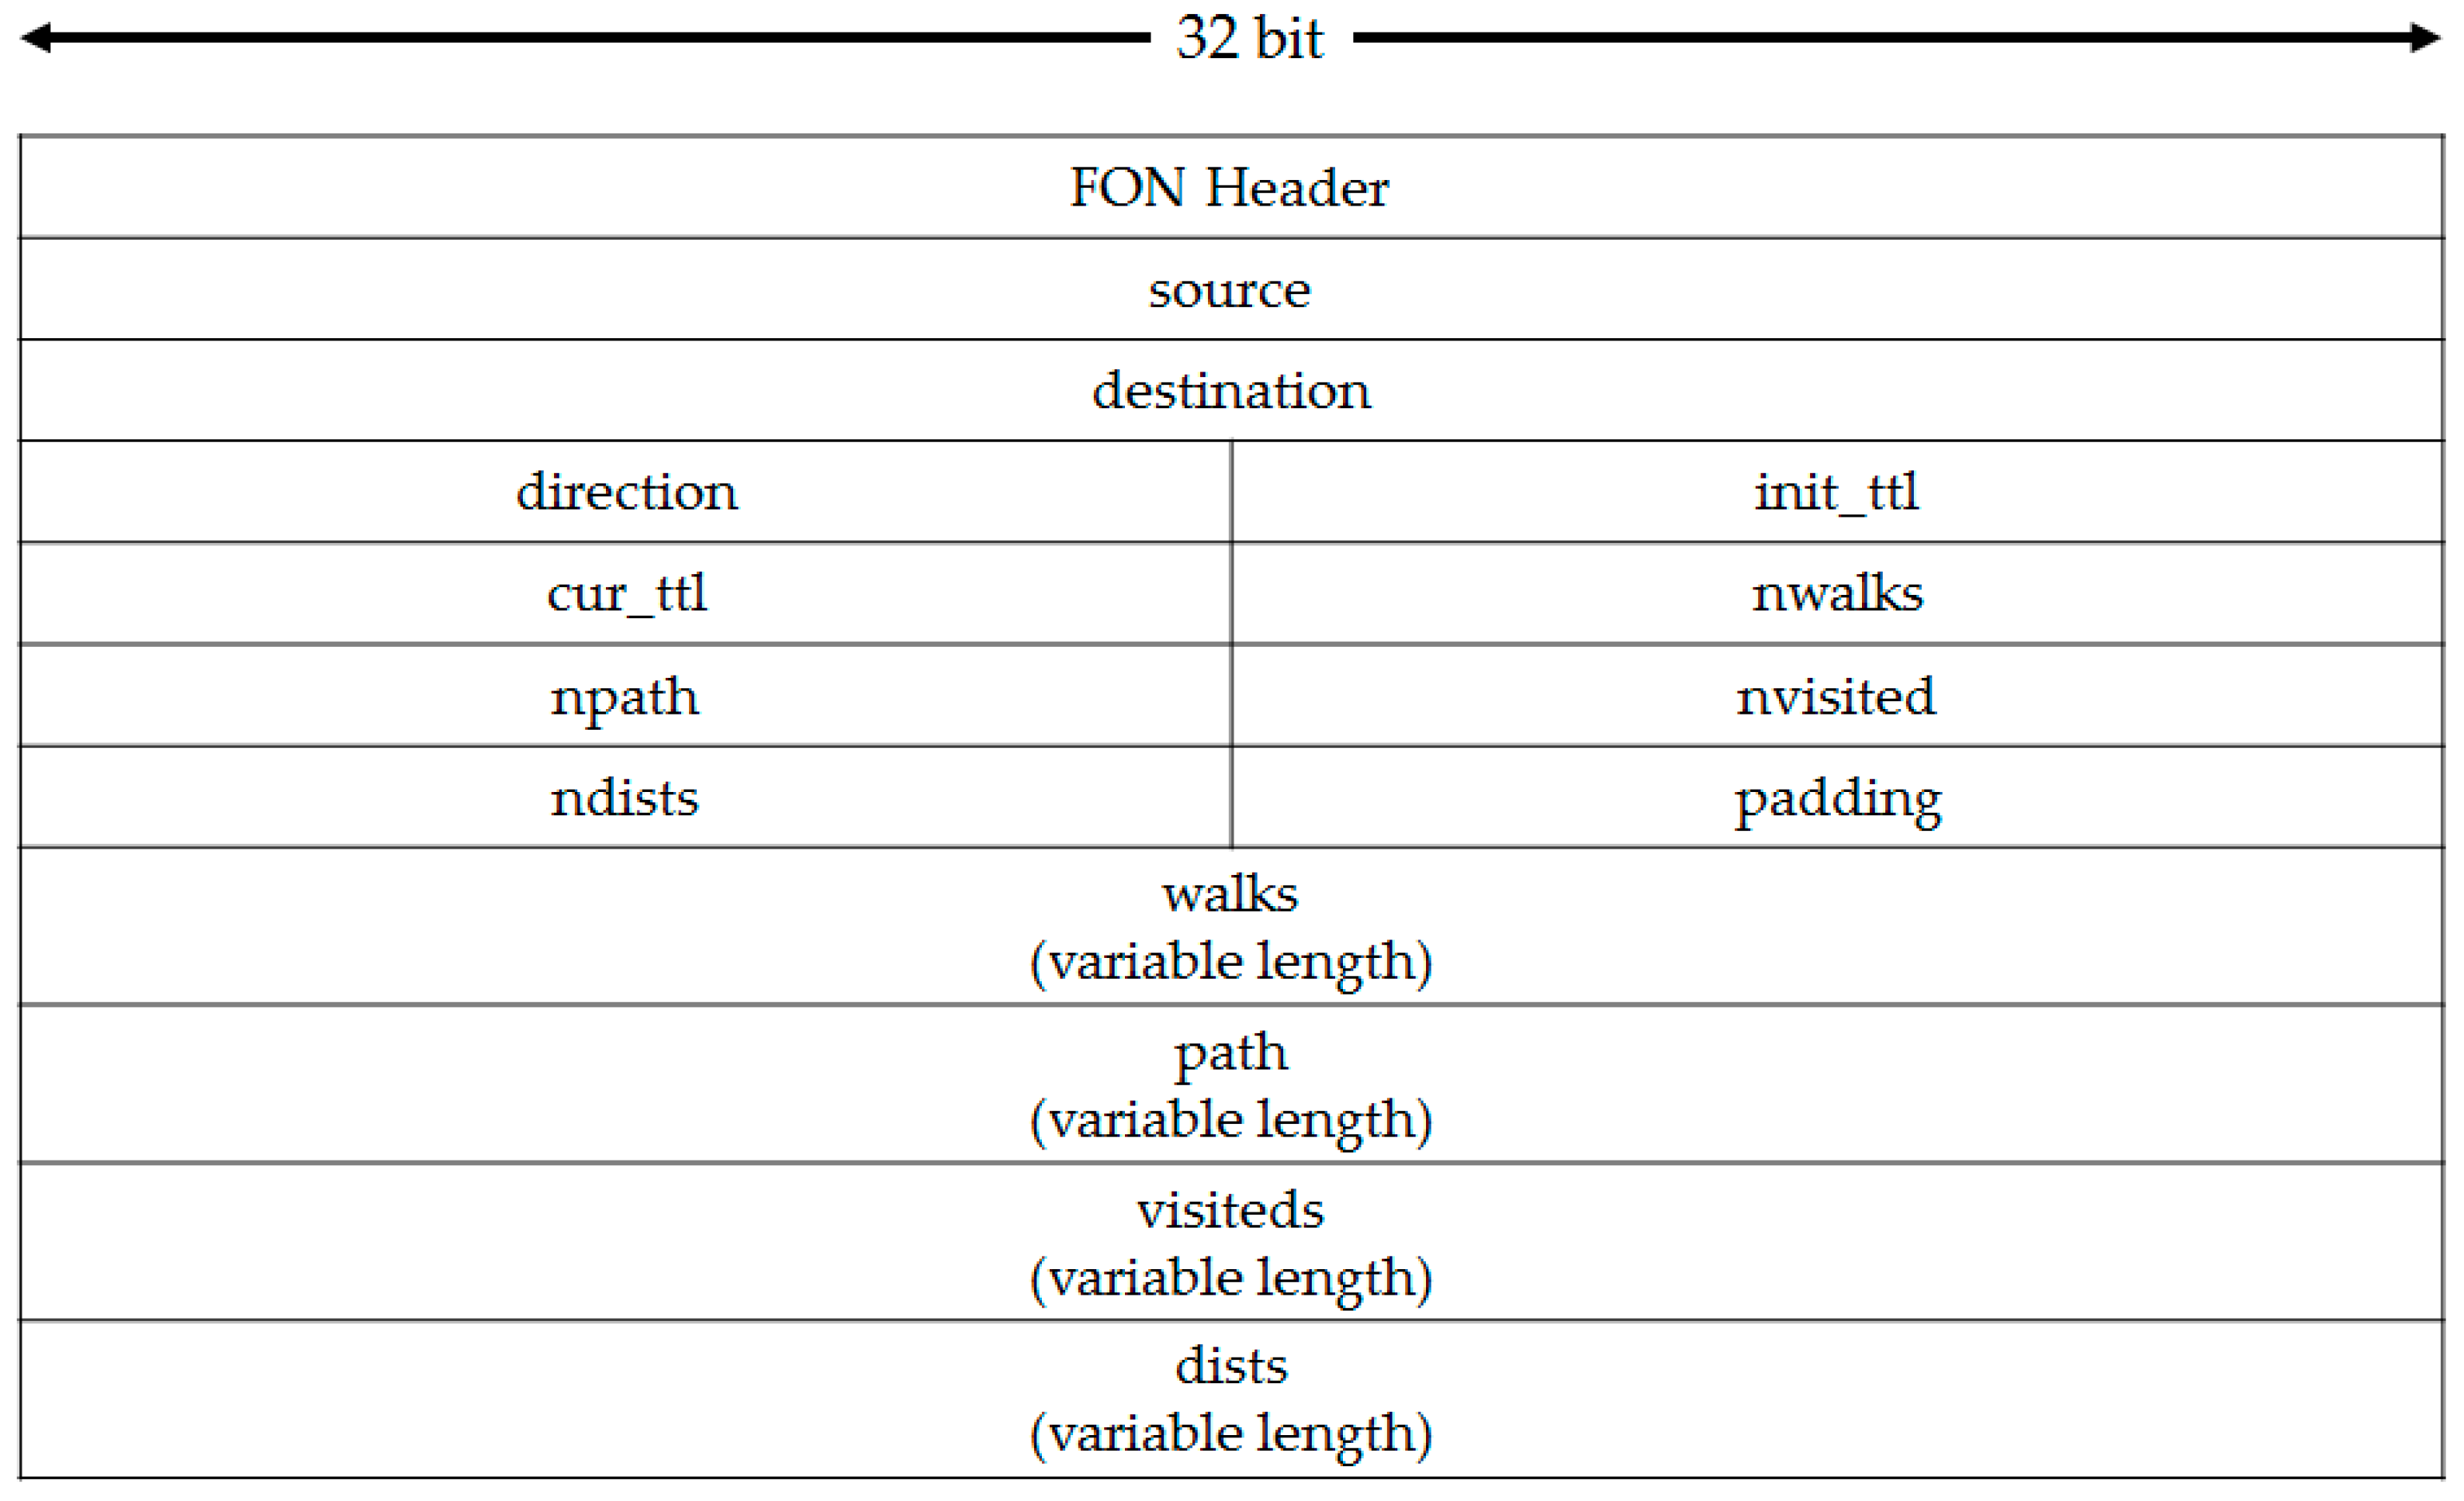
Figure 11.
Flow chart of processing ant packet.
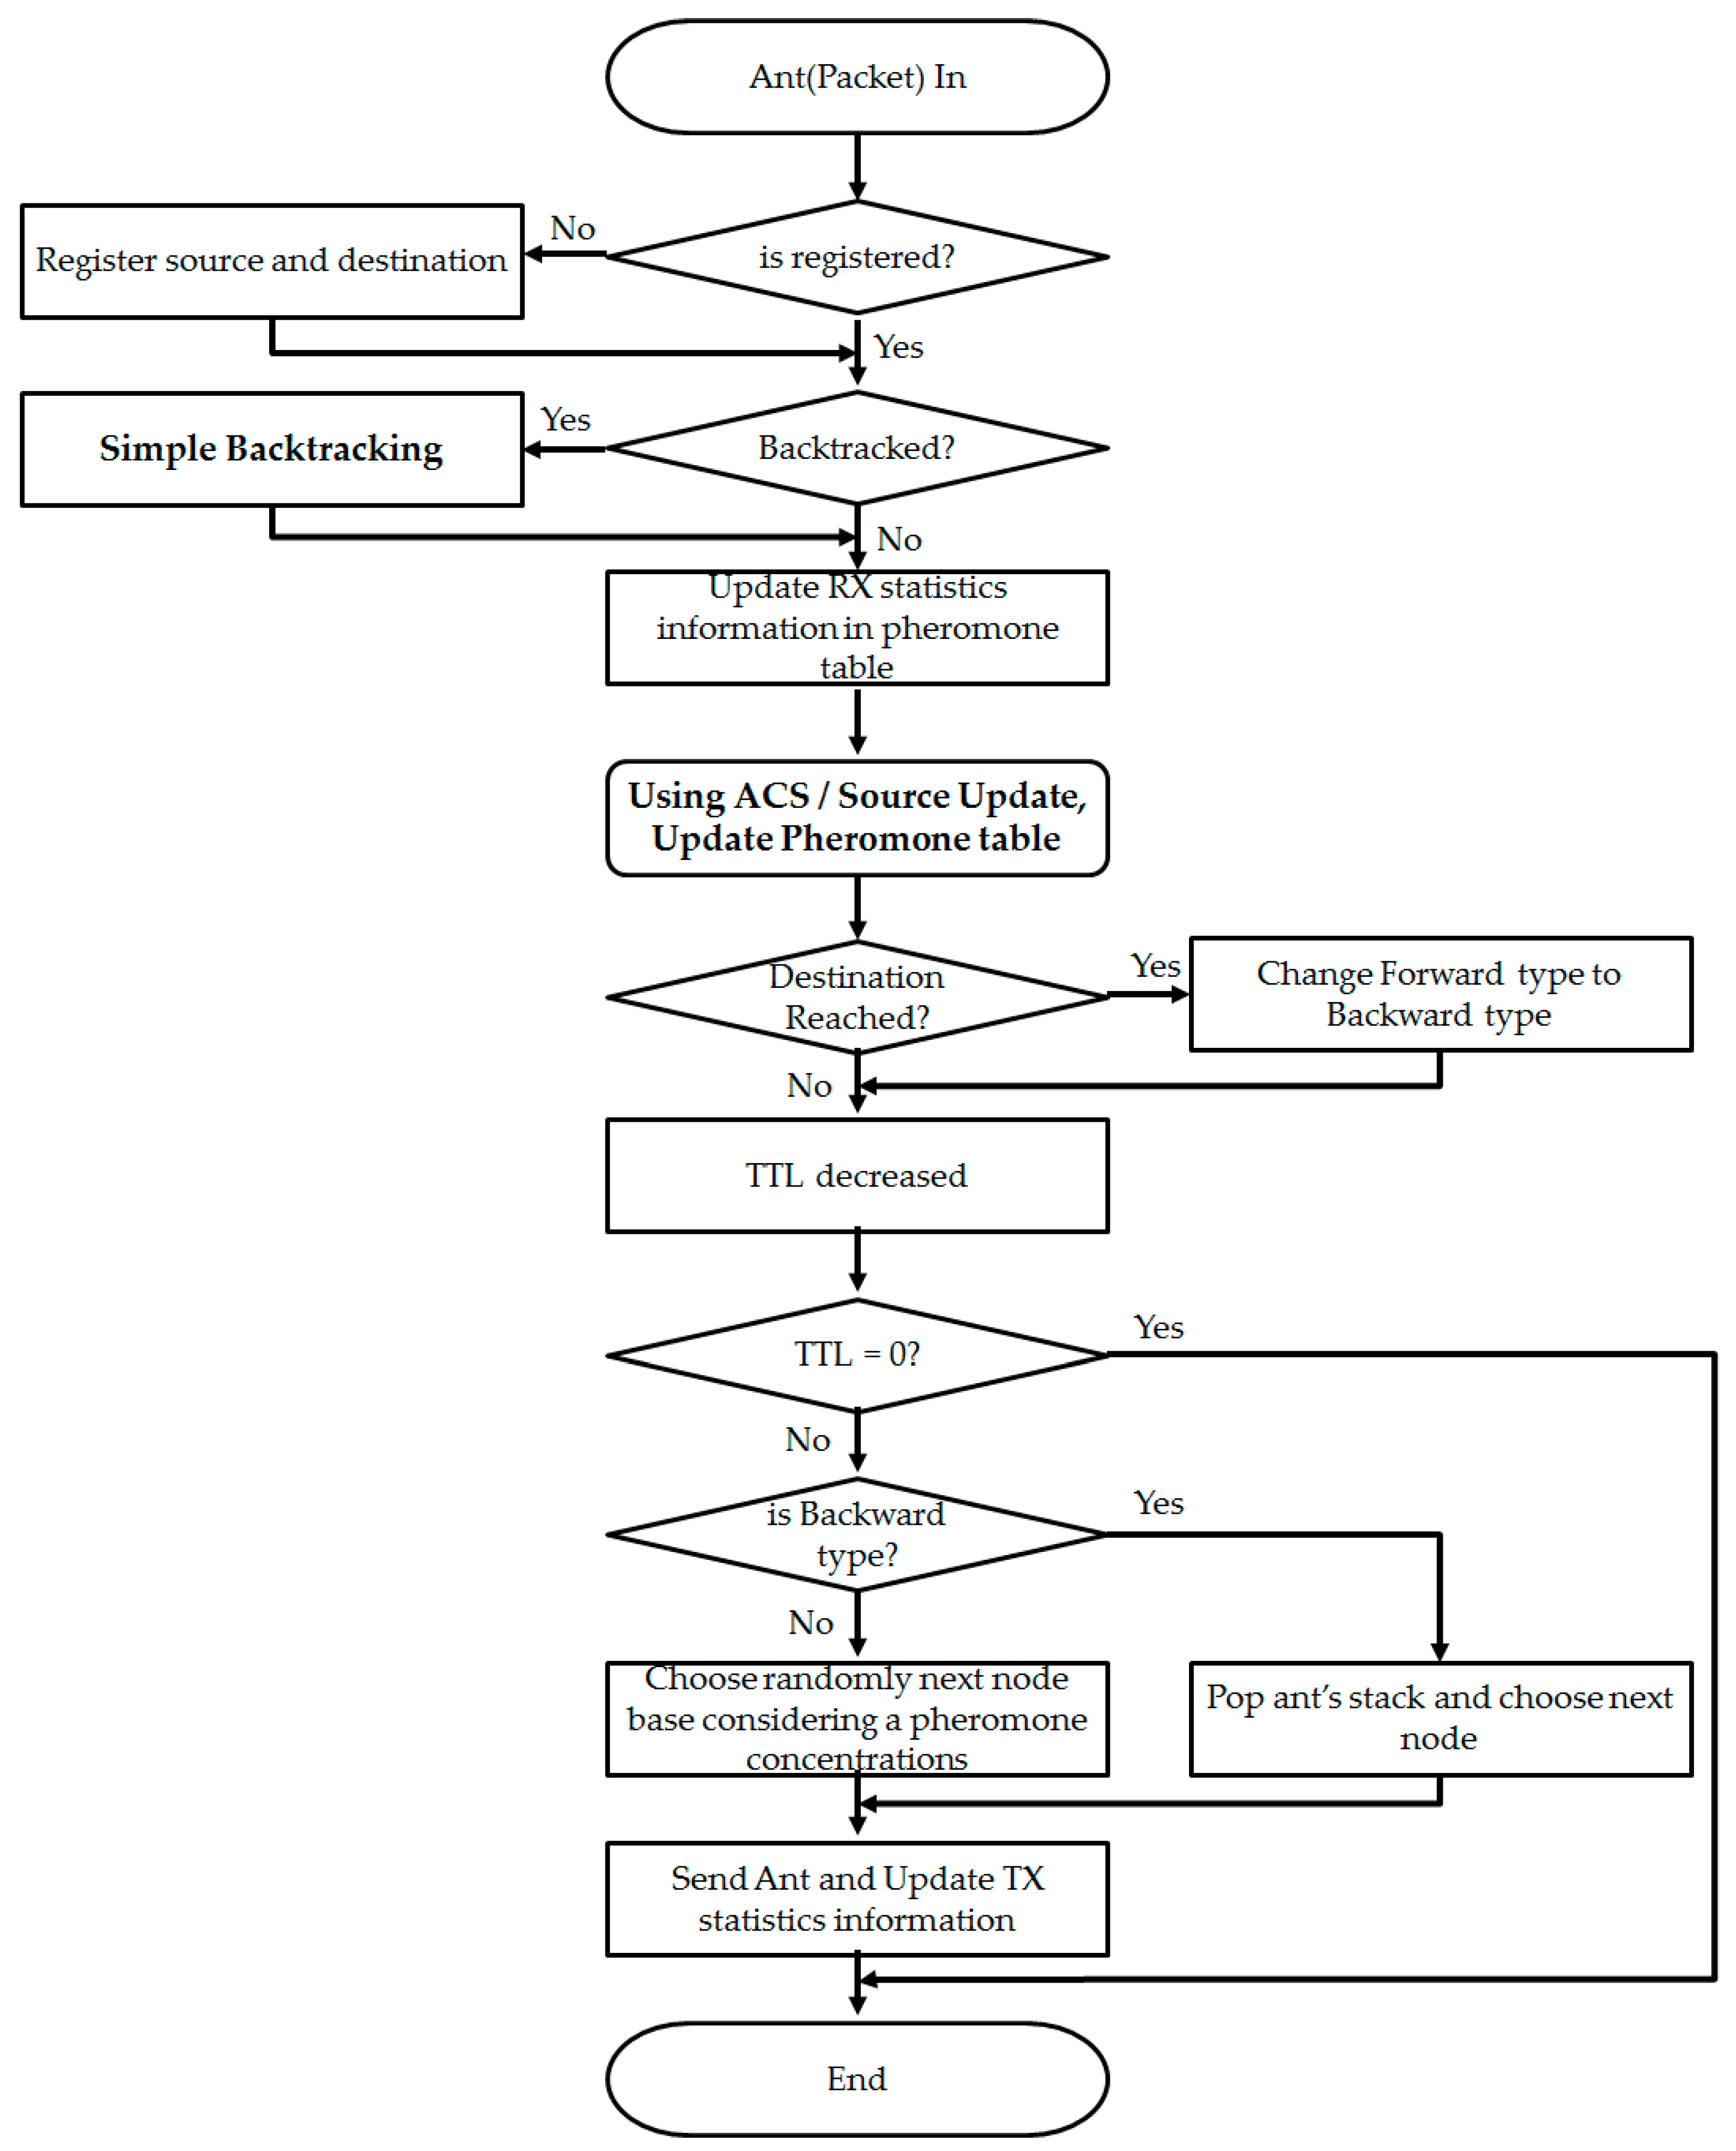
Figure 12.
NTTnet. The topology which was used in experiments.
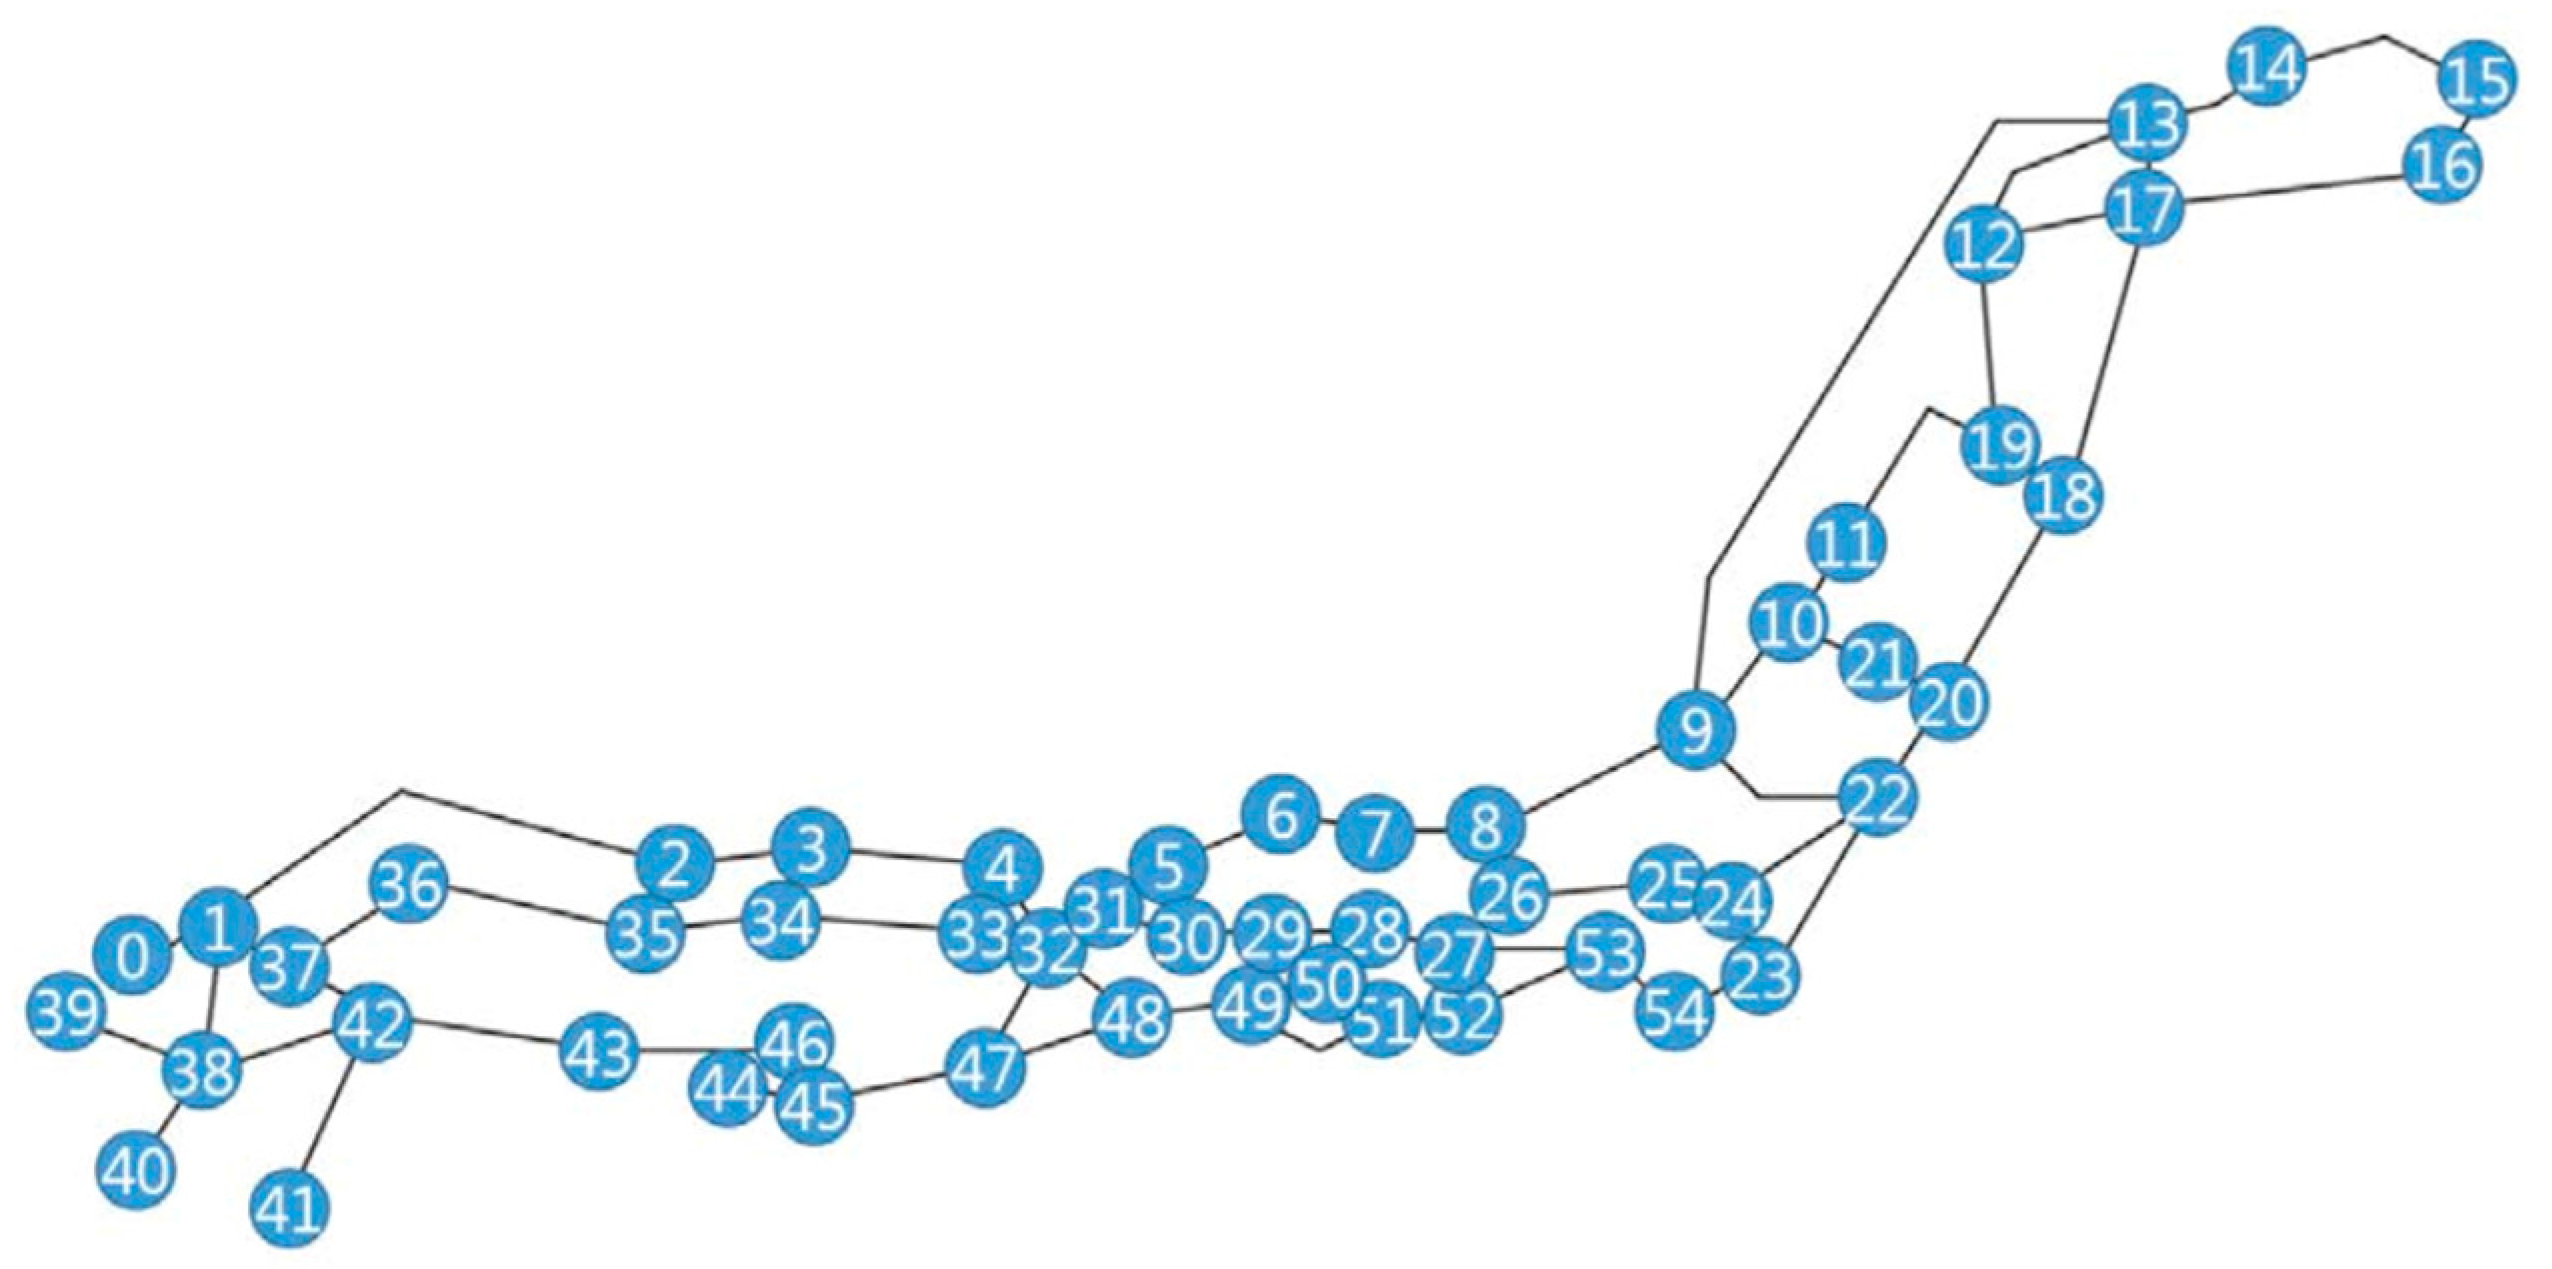
Figure 13.
Ant System. (a) Time series graph; (b) Histogram.

Figure 14.
Ant Colony System. (a) Time series graph; (b) Histogram.
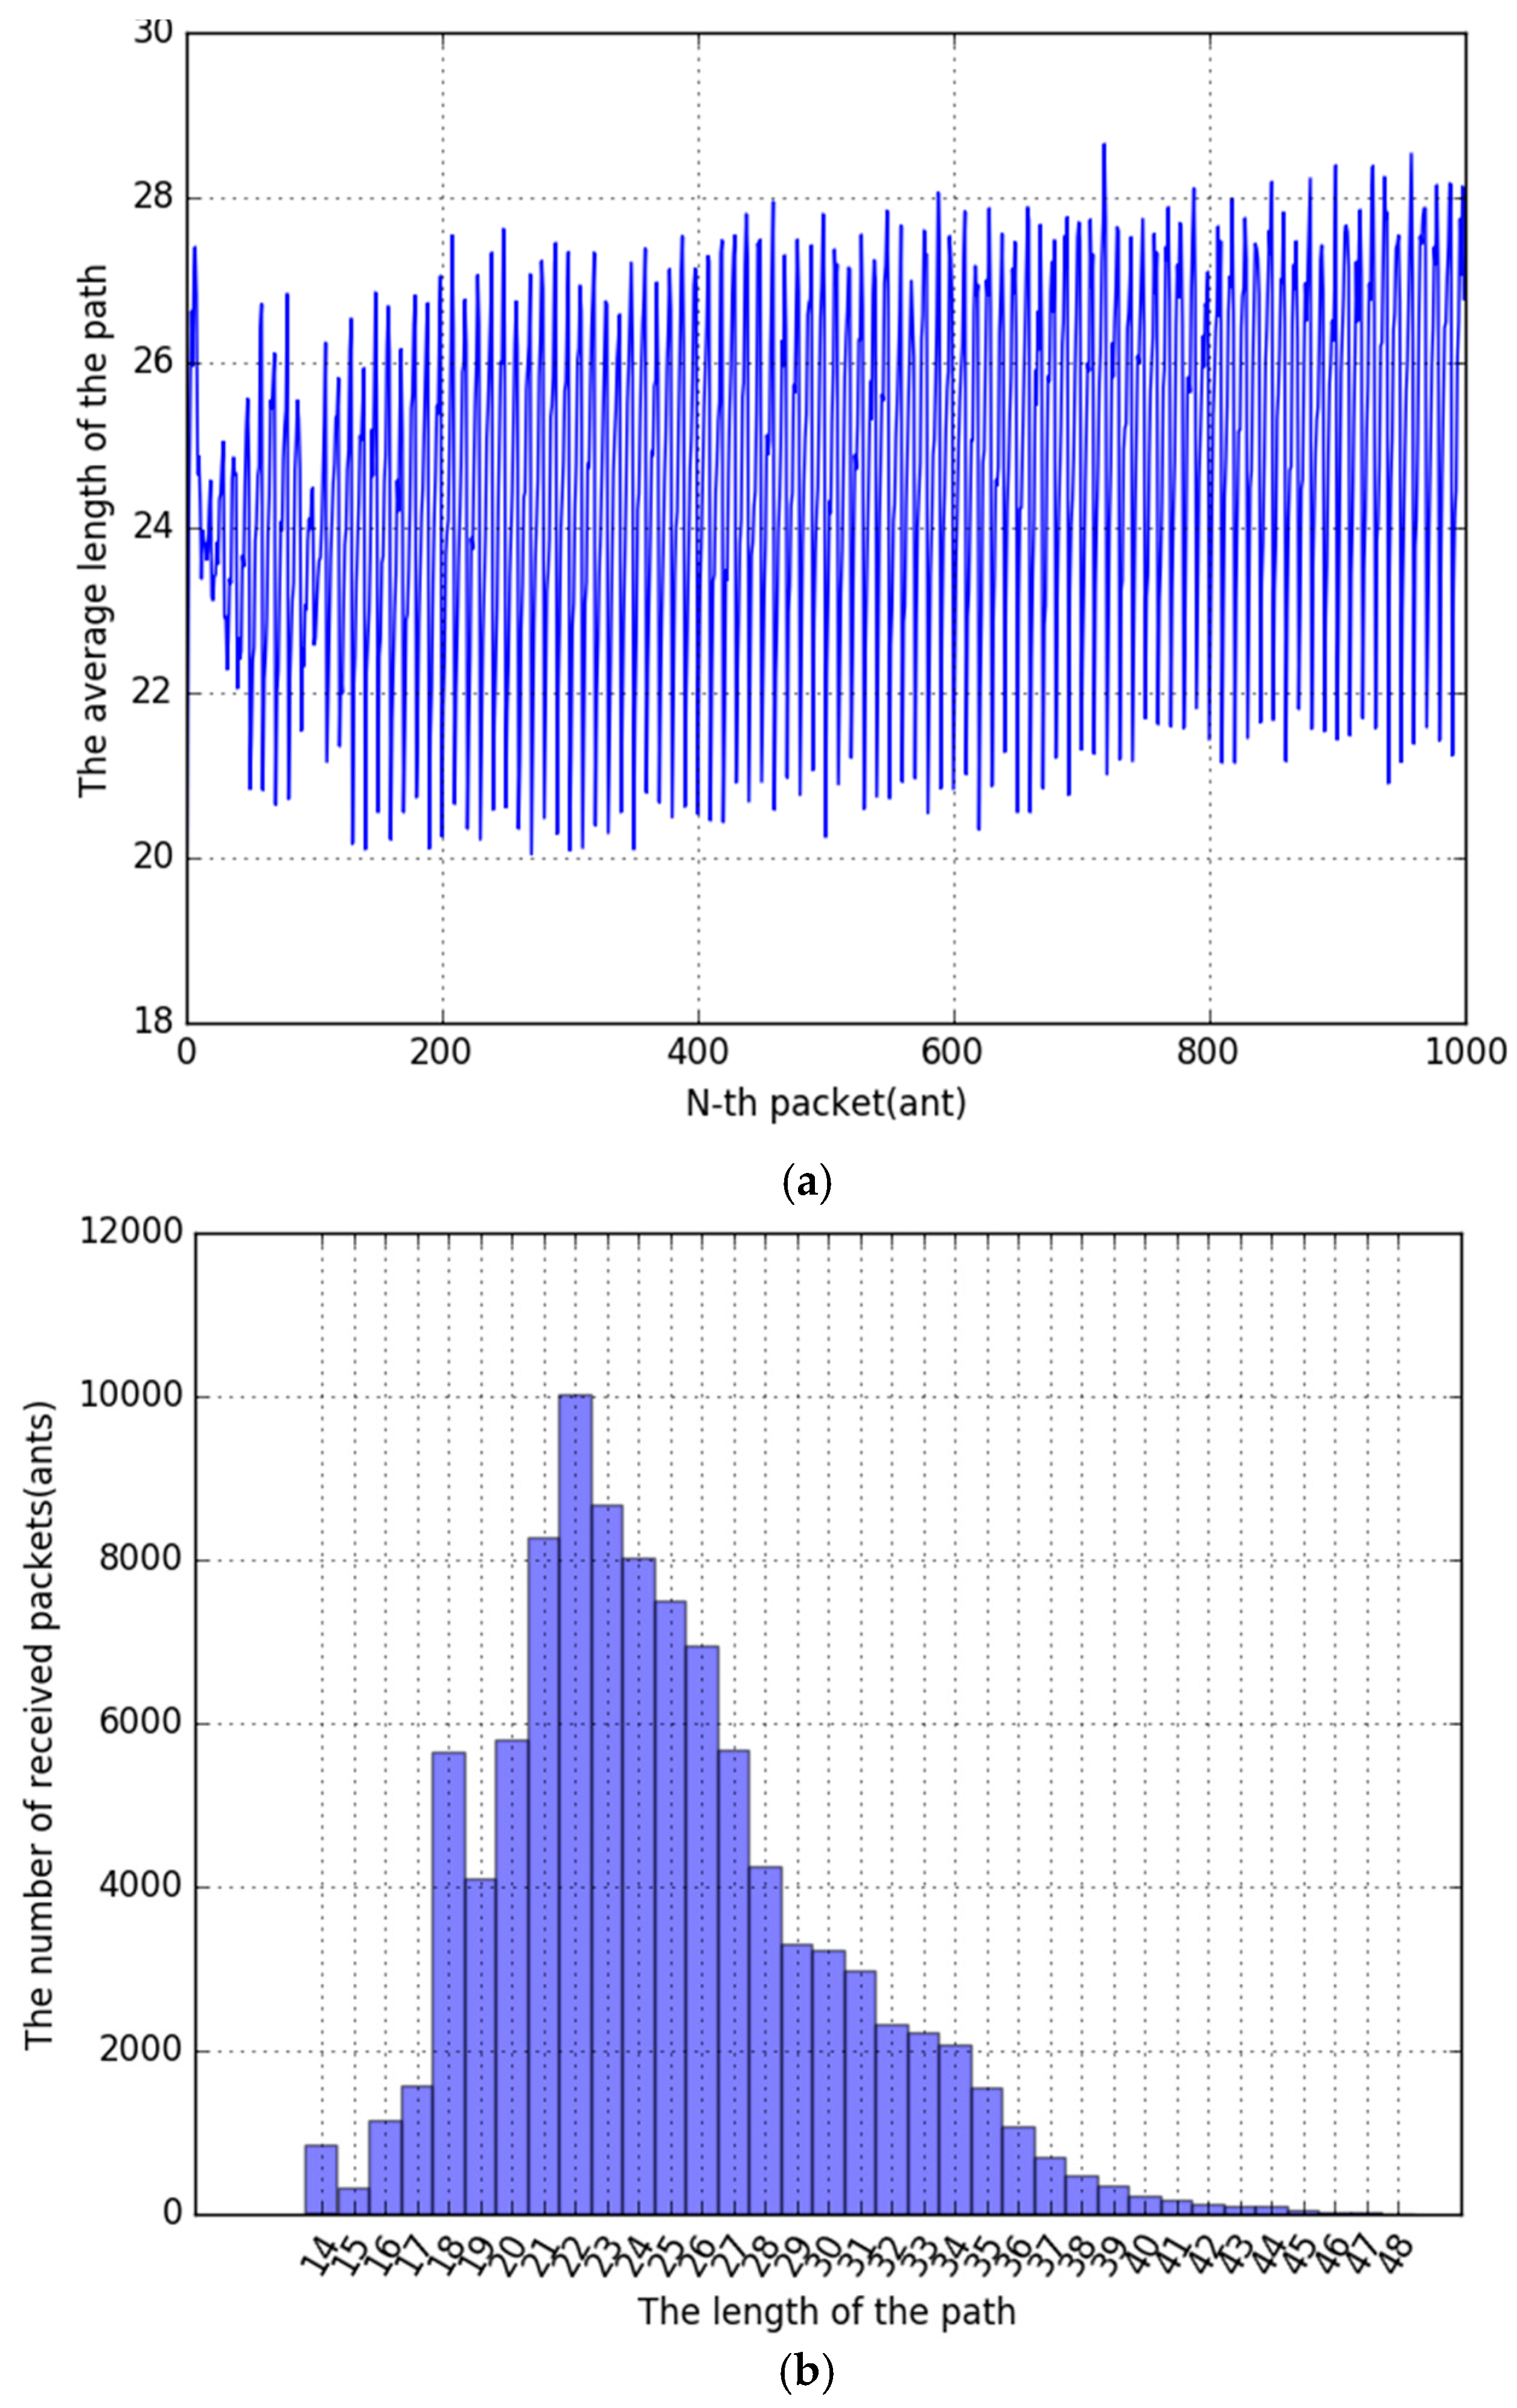
Figure 15.
Ant System with simple backtracking algorithm. (a) Time series graph; (b) Histogram.
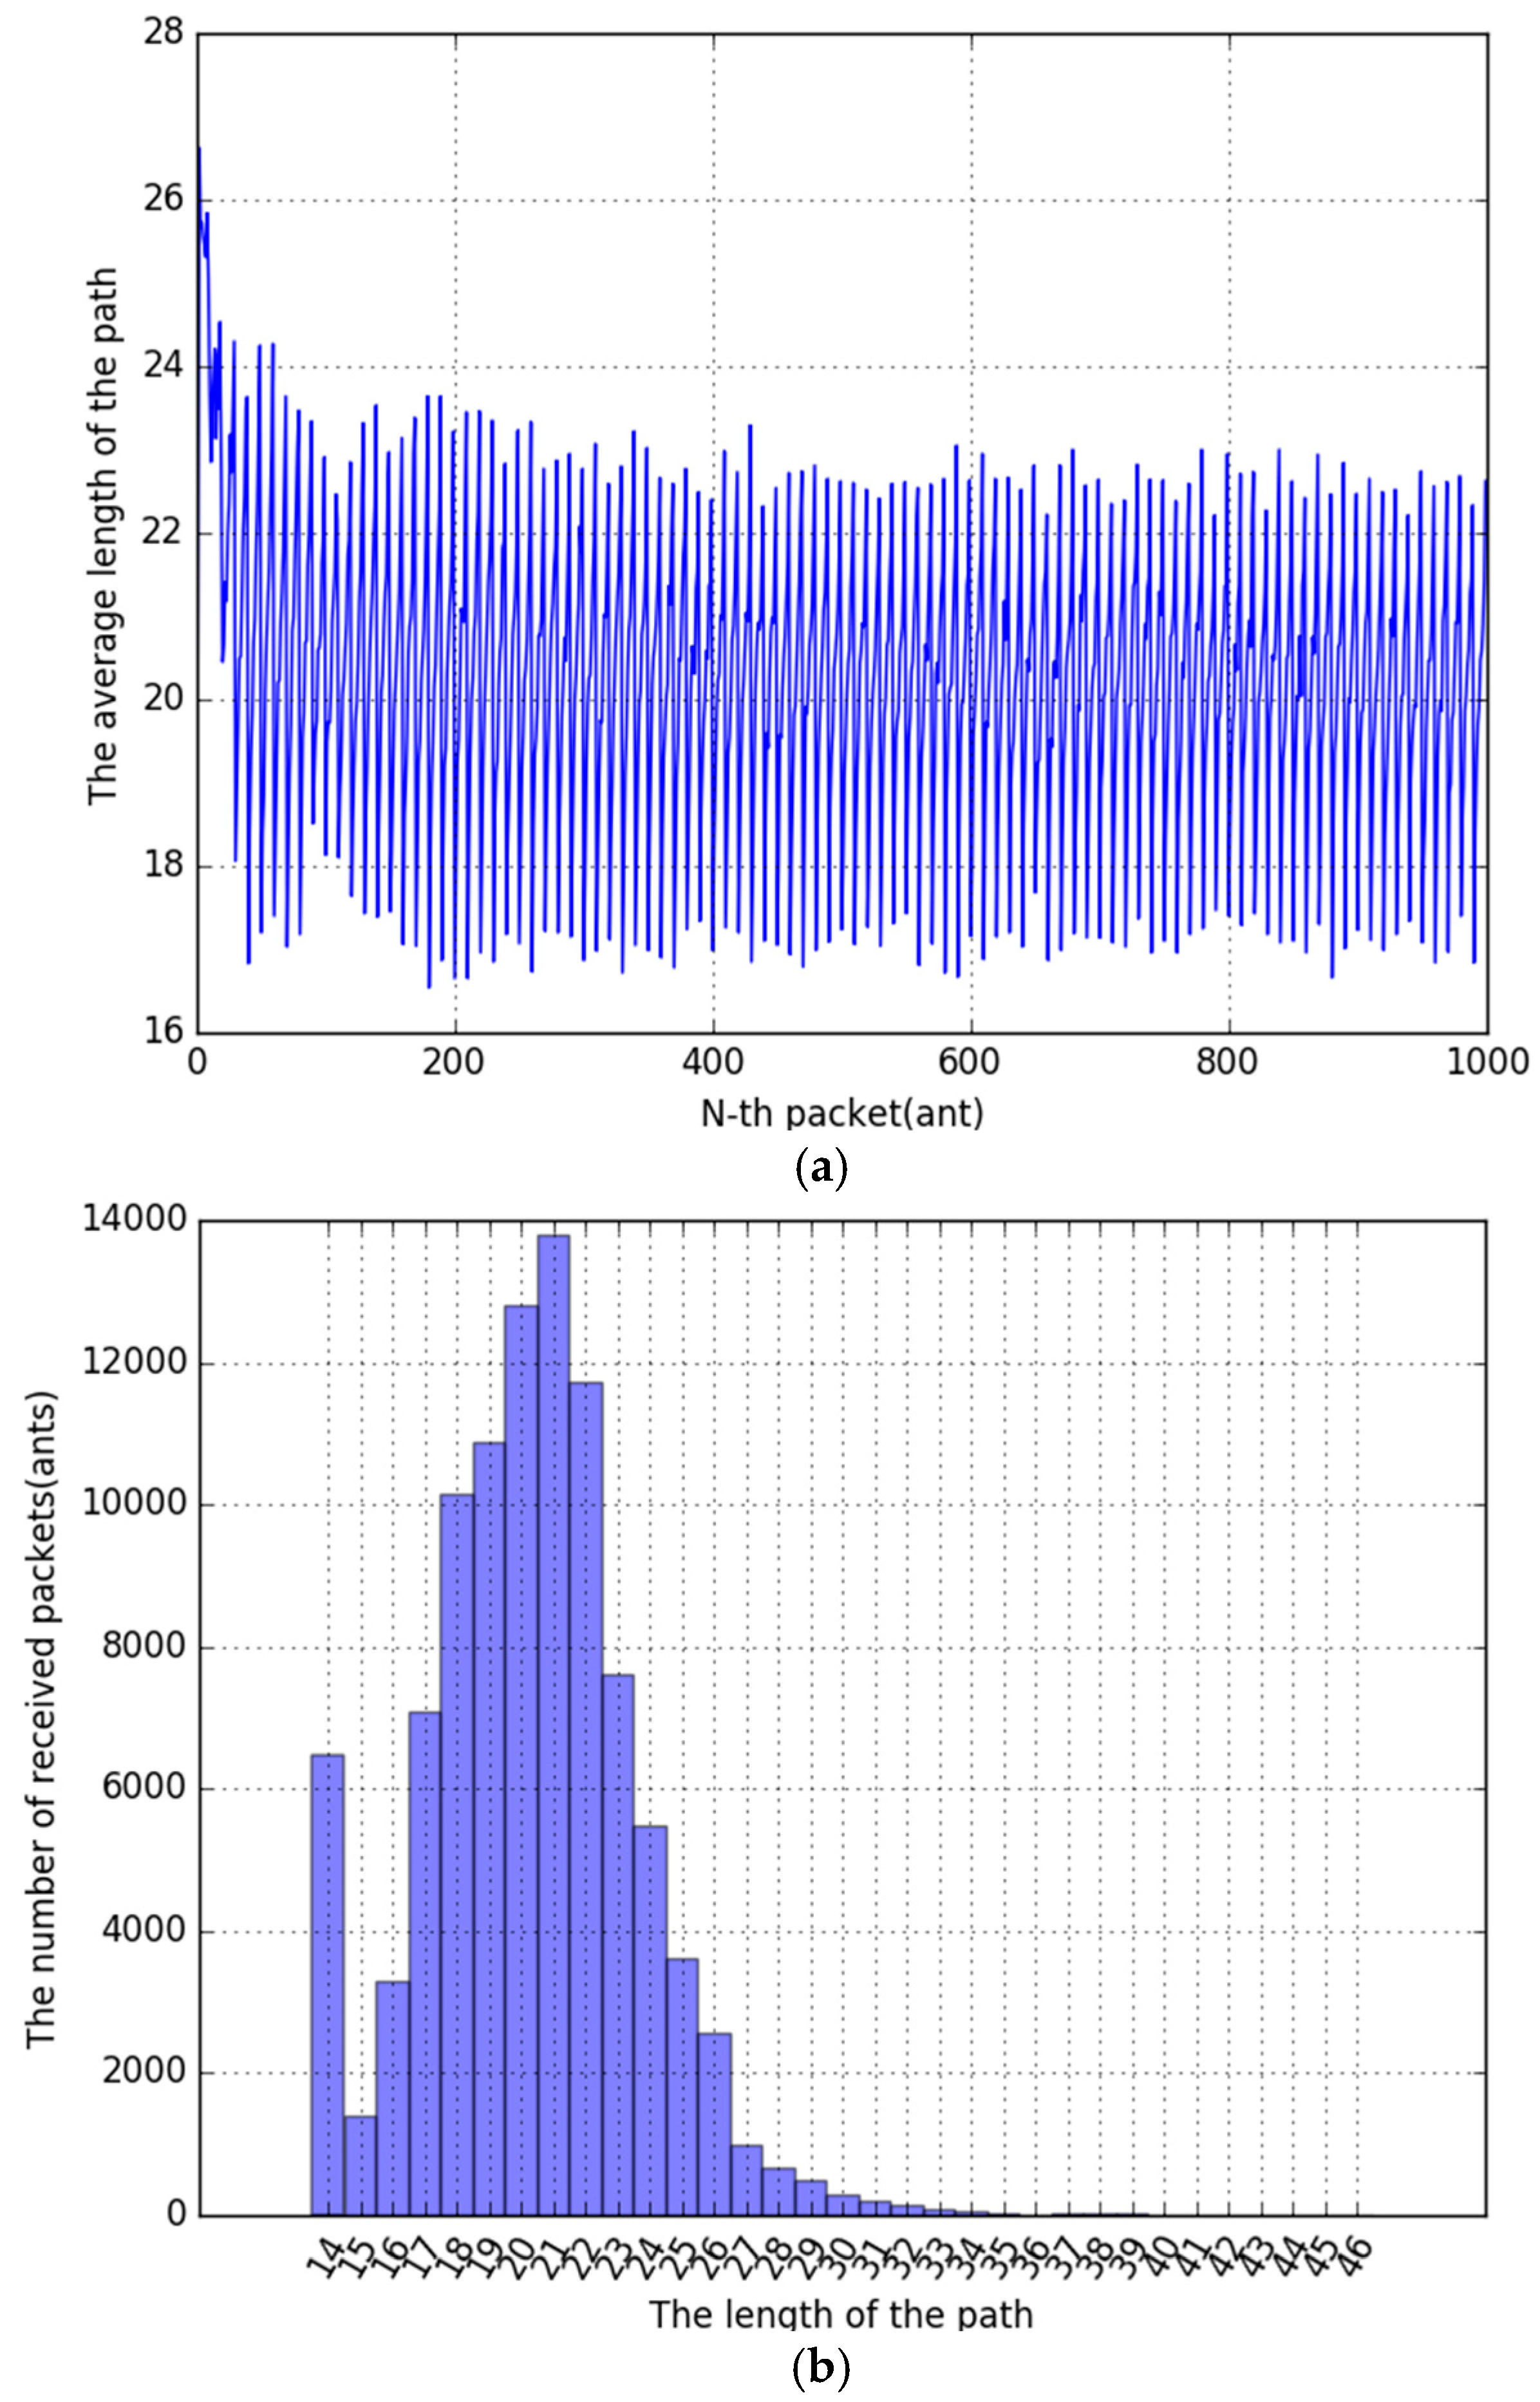
Figure 16.
Ant Colony System with simple backtracking algorithm. (a) Time series graph; (b) Histogram.
Figure 16.
Ant Colony System with simple backtracking algorithm. (a) Time series graph; (b) Histogram.

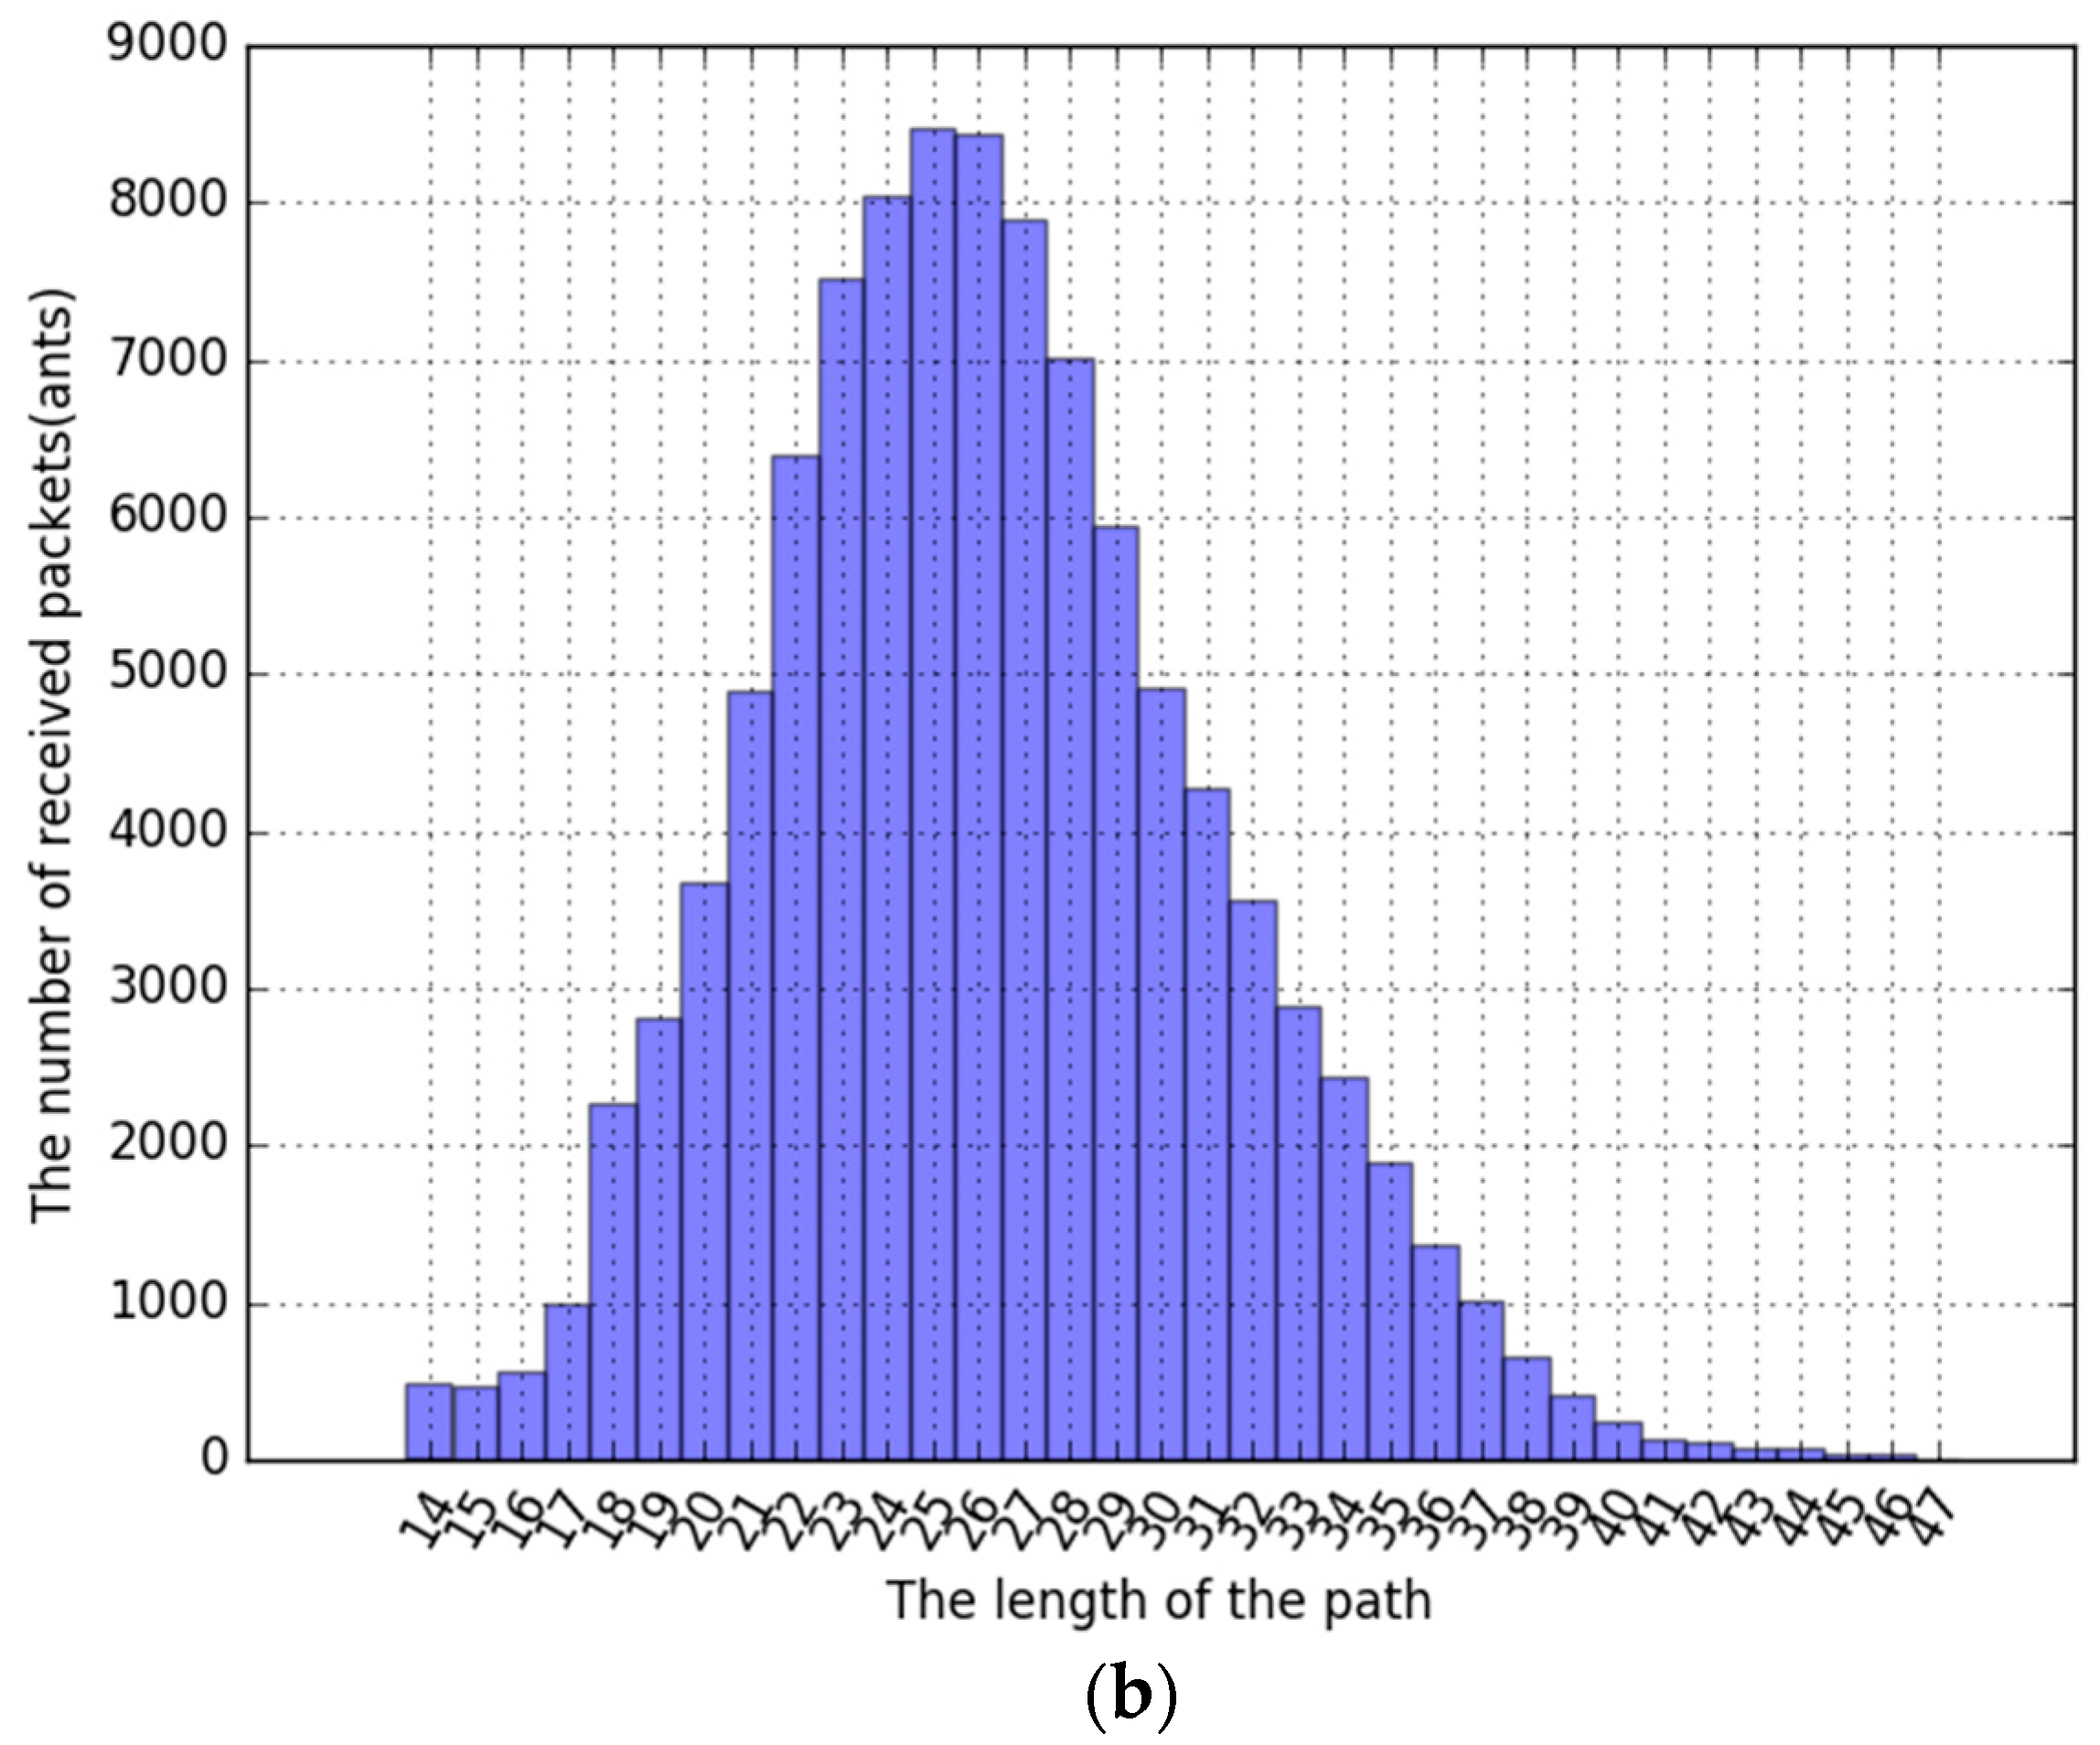
Figure 17.
Ant System, Source Update. (a) Time series graph; (b) Histogram.
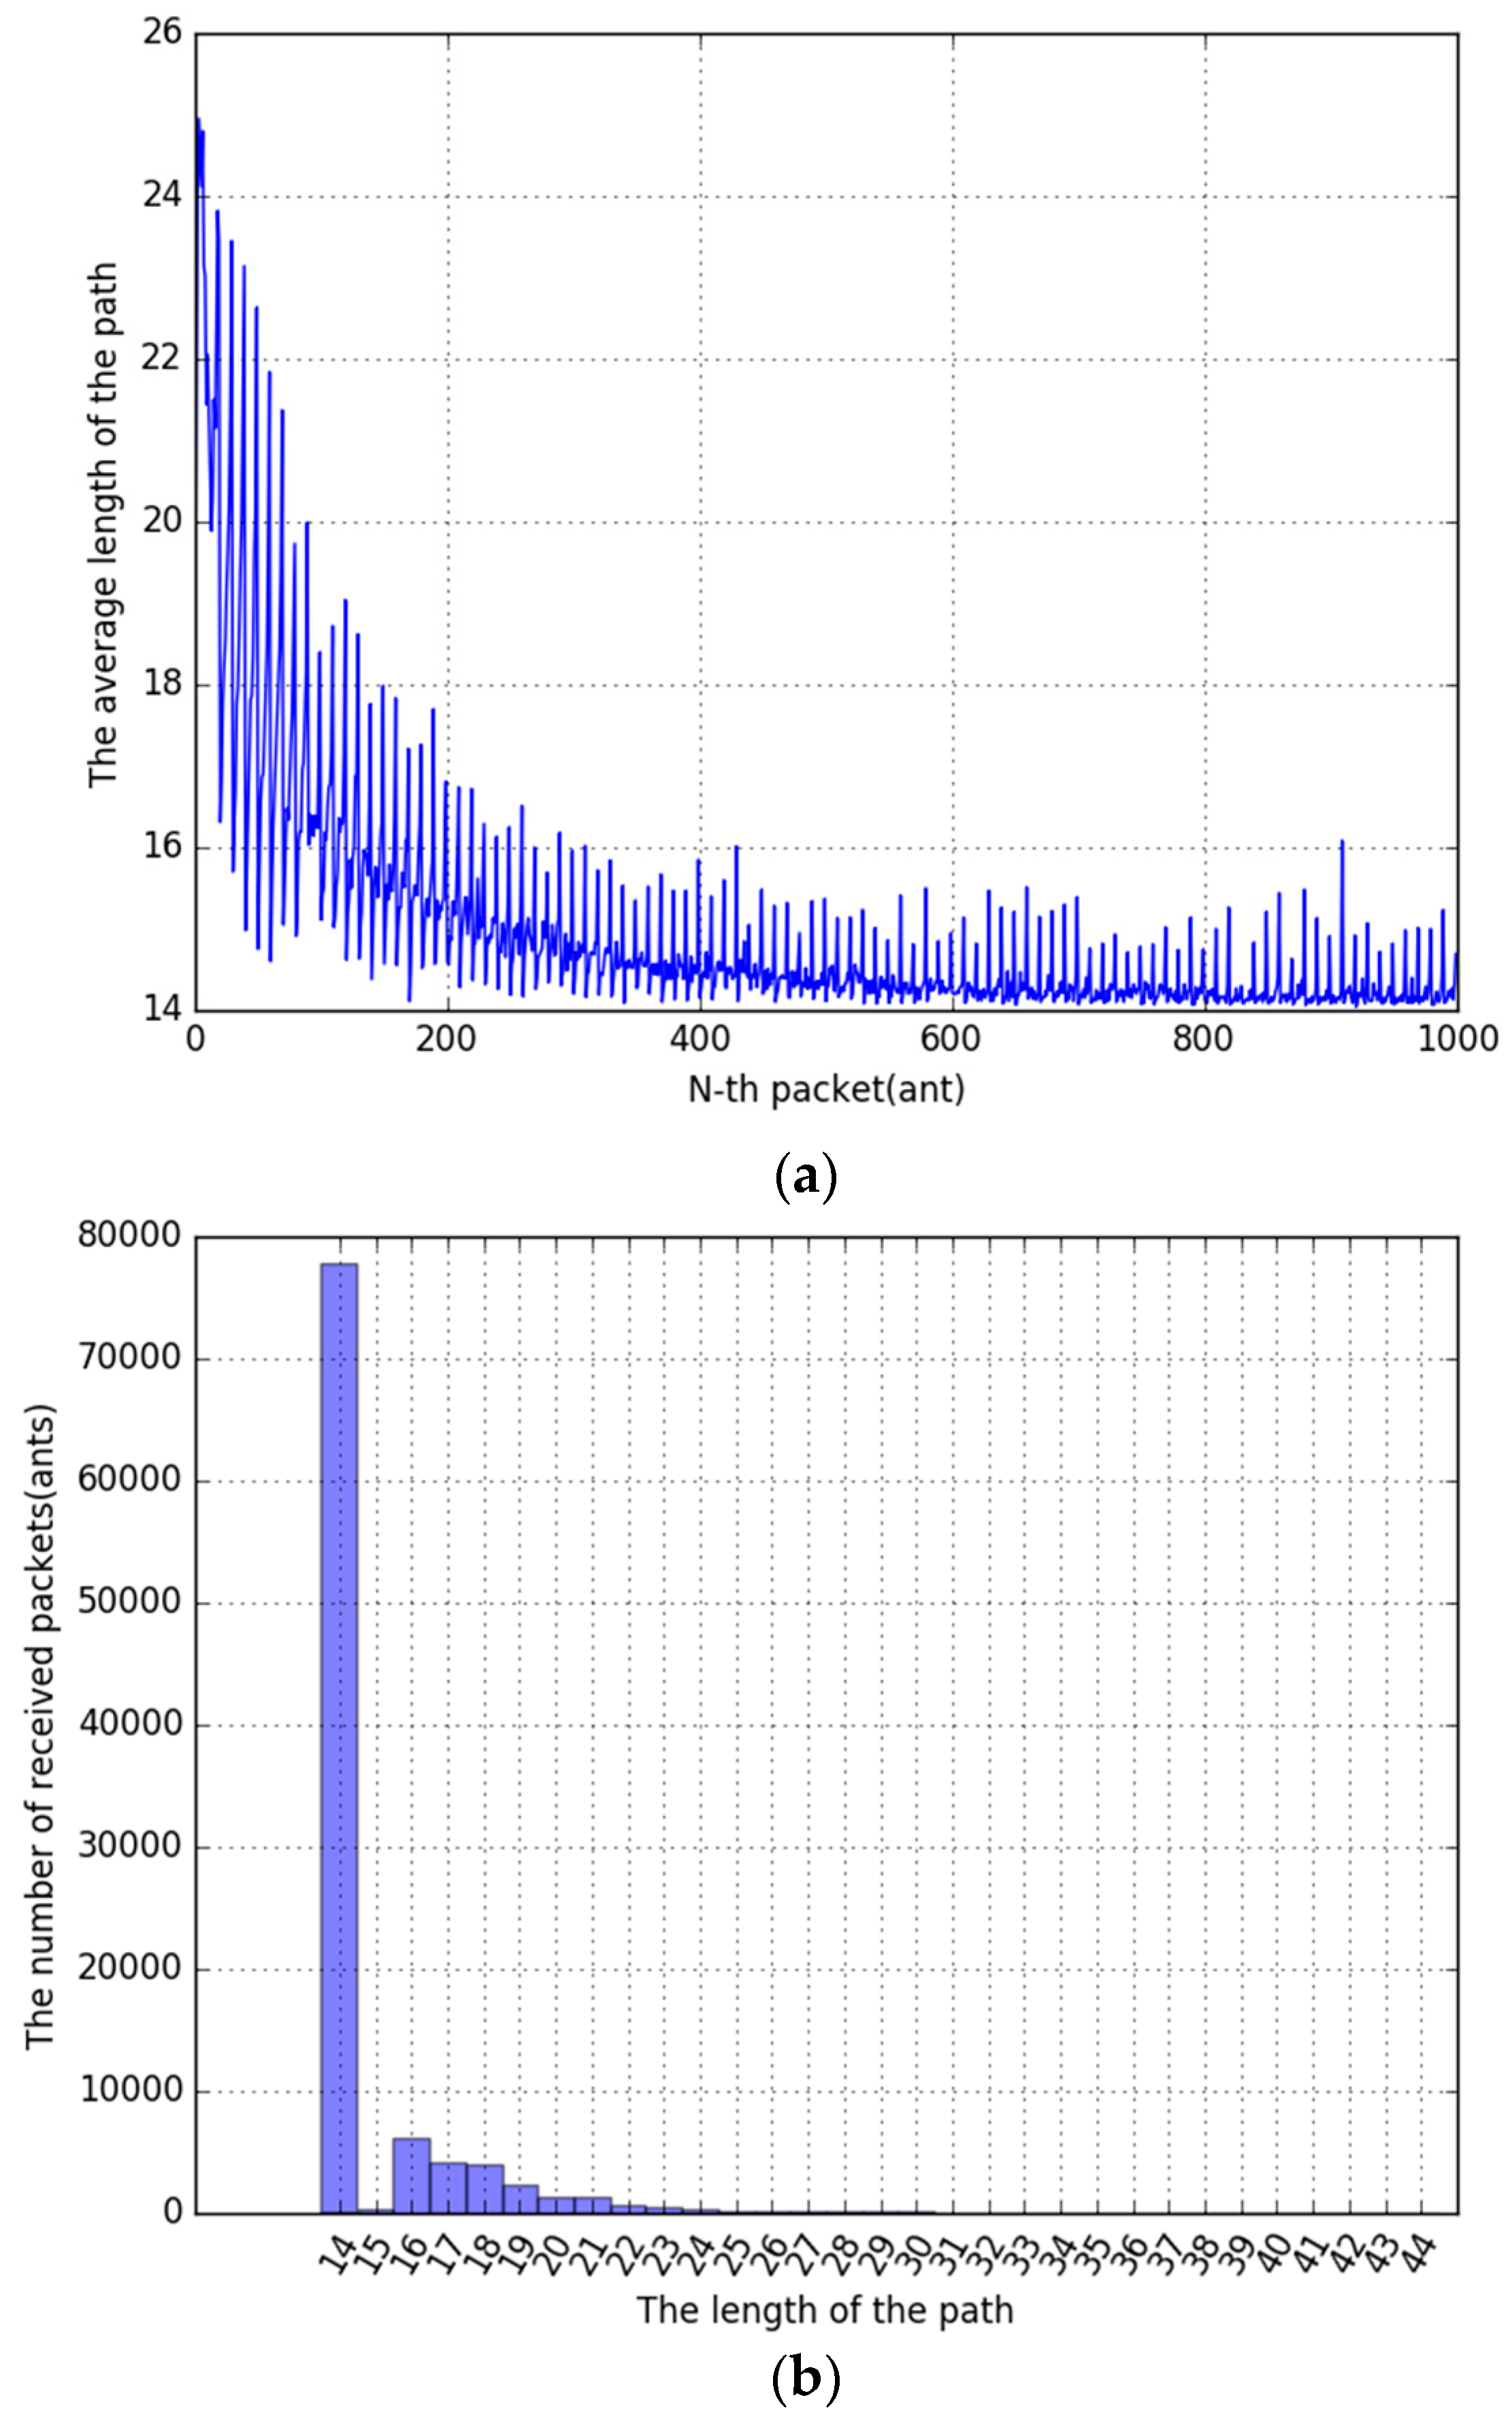
Figure 18.
Ant Colony System, Source Update. (a) Time series graph; (b) Histogram.

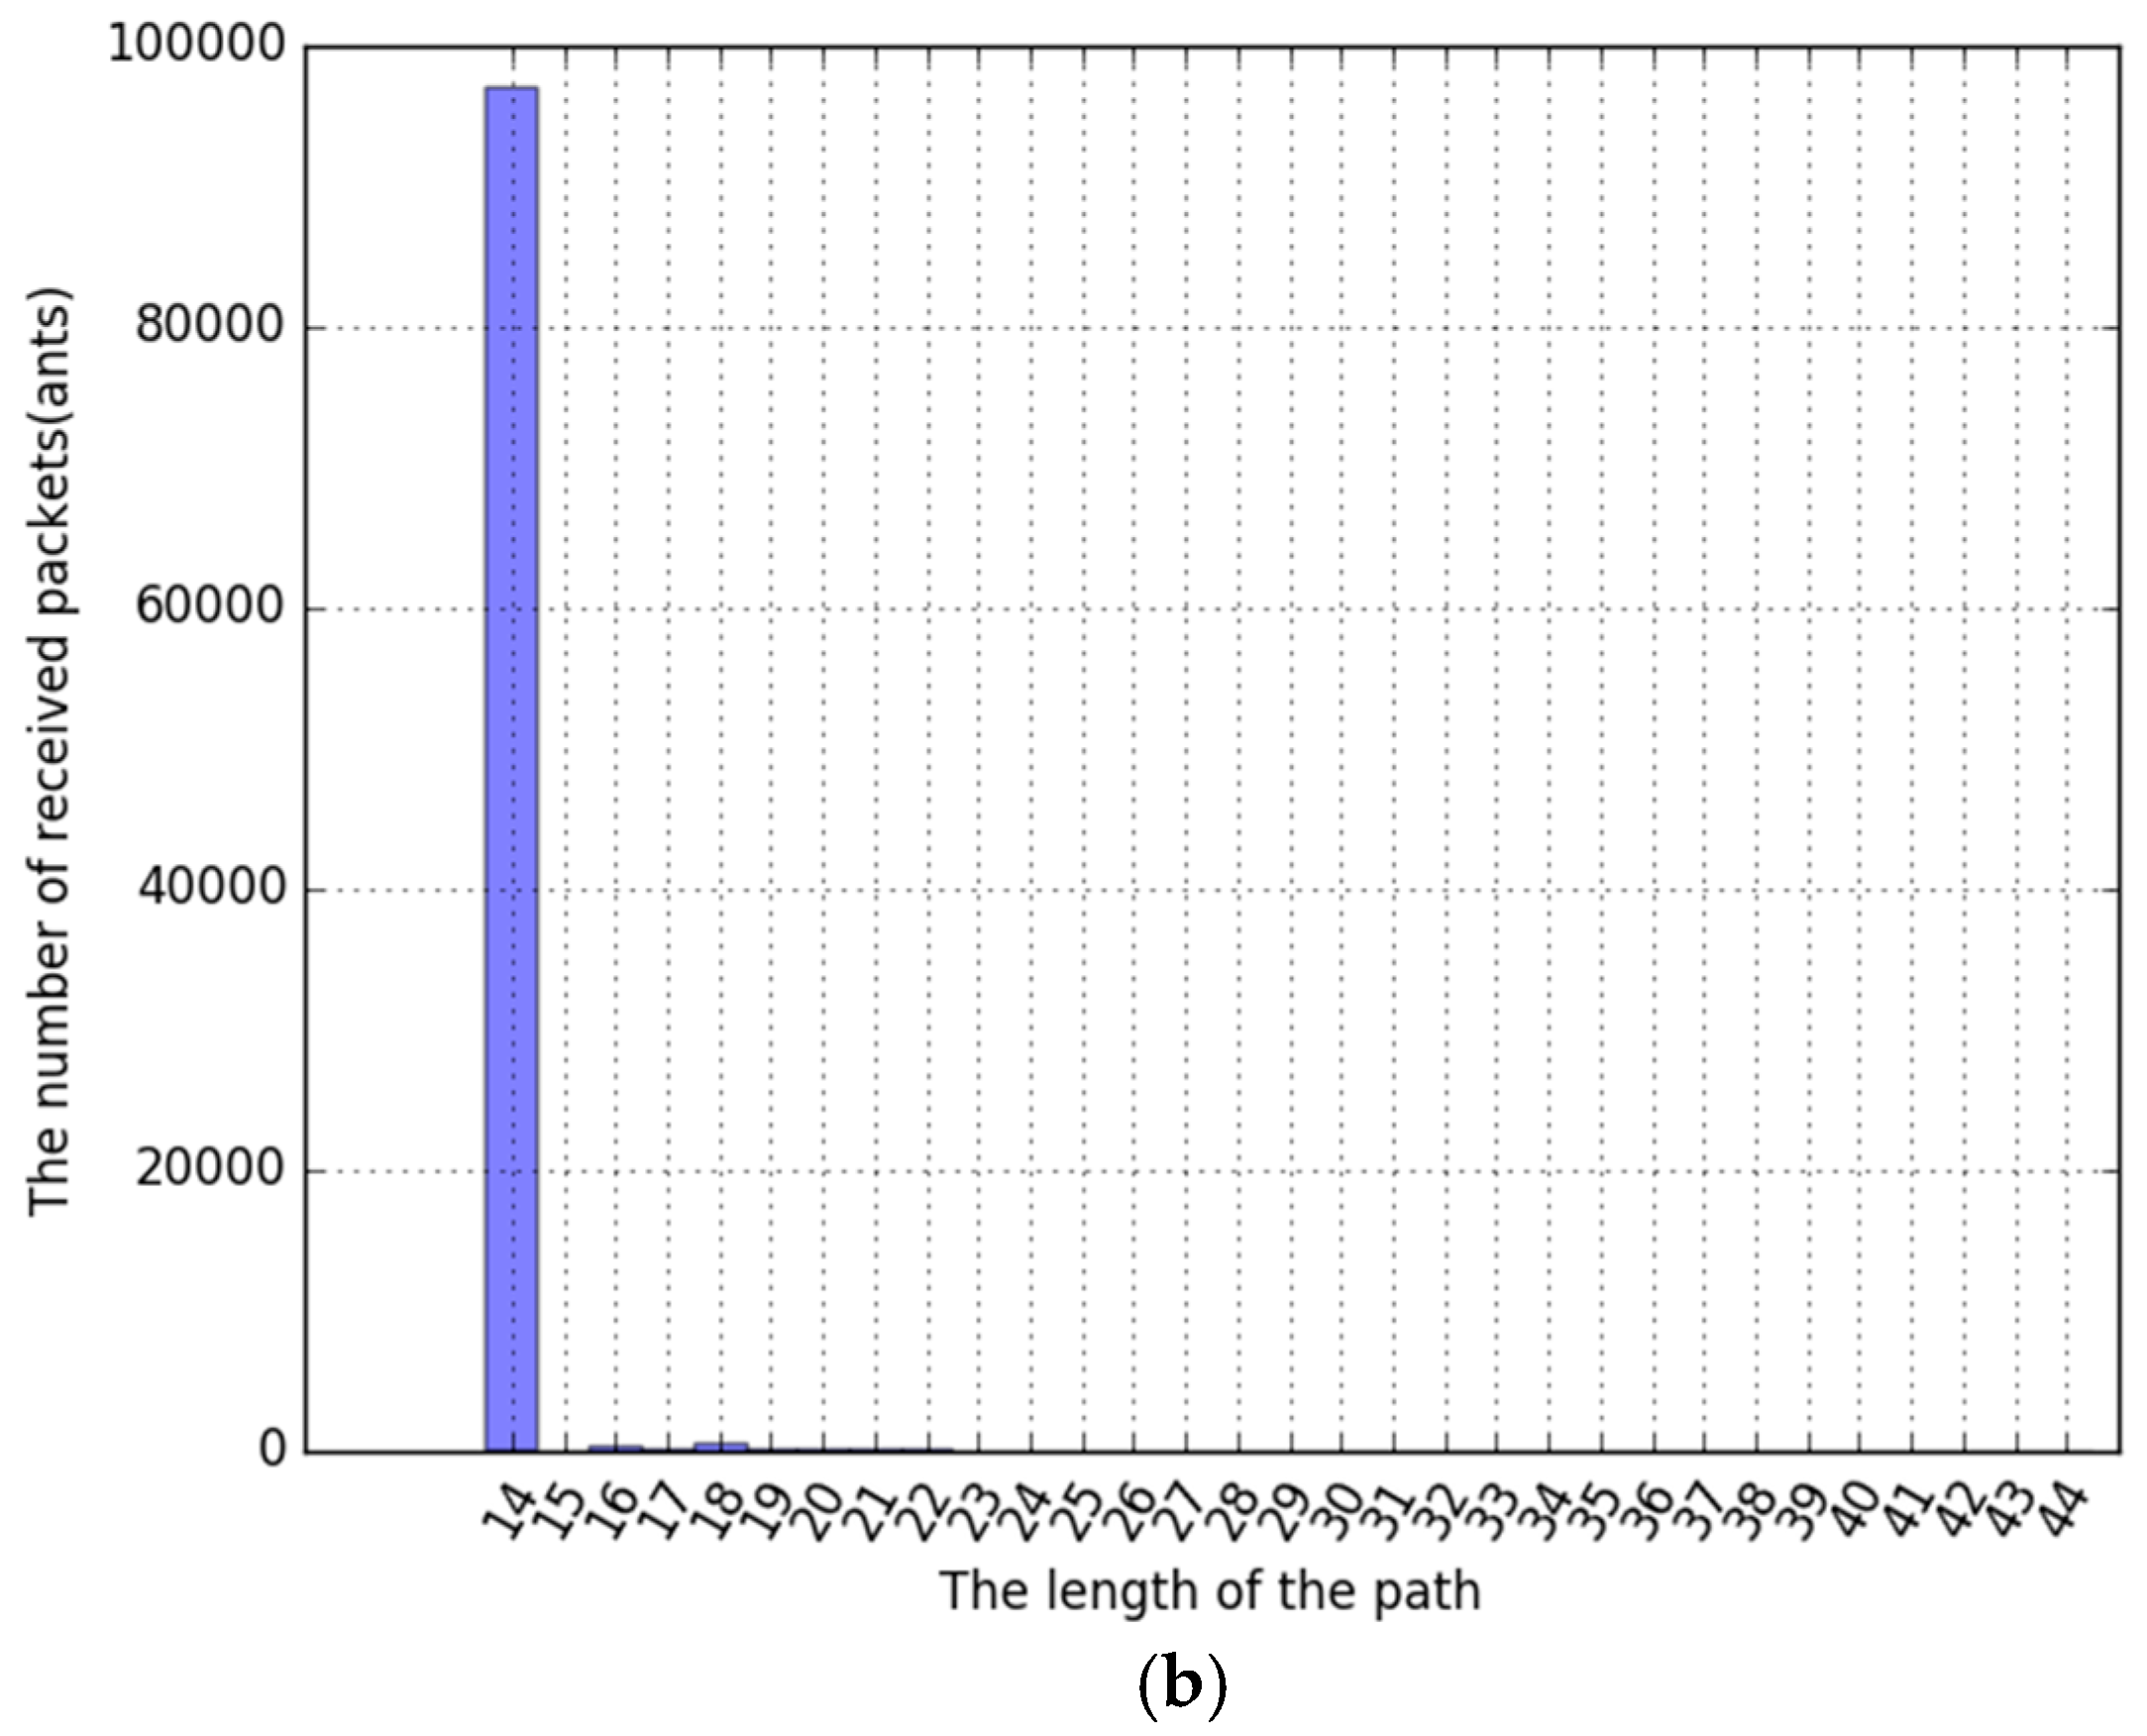
Figure 19.
Curve of recovery-overhead relationship.

Table 1.
Fields of FON data packet.
| Field | Description |
|---|---|
| sid | Source FON identifier |
| did | Destination FON identifier |
| type | Field for identifying FON Function. 2 byte |
| Paylen | Payload length. 2 byte |
| Payload | Variable length |
Table 2.
The fields of Synchronous Request Message Header.
| Field | Description |
|---|---|
| func_type | Represents Identifier in FON Function. FON can recognize in which FON function the message generated through this Field. |
| msg_type | Represents types of message. Refer [Table 1]. |
| tot_len | Represents the length of message including message’s header length in bytes. |
| data | Include Payload matched with given message type (func_type). |
Table 3.
Synchronous Message Type Values.
| Value of msg_type | Description |
|---|---|
| MSG_TYPE_REG = 0 | For registering a new FON Function on FON |
| MSG_TYPE_DEREG = 1 | For deregistering a new FON Function on FON |
| MSG_TYPE_SENDTO = 2 | Request to Request FON for Transmitting FON Packet |
| MSG_TYPE_TABLE_ADD = 3 | Add (modify) Entry to FON’s Forward Table |
| MSG_TYPE_TABLE_DEL = 4 | Remove Entry in FON’s Forward Table |
| MSG_TYPE_TABLE_GET = 5 | Acquire All entries in FON’s Forward Table |
| MSG_TYPE_HOST_GET = 6 | Check current FON ID in FON |
Table 4.
The fields of Synchronous Response Message Header.
| Field | Description |
|---|---|
| result | Inform success of failure to the request. 0 for success, error codes for failure |
| tot_len | Inform entire response length including header |
| error_string | Inform specific error type in text when occurring an error |
| data | notify all other information except success or failure to FON Function (filled in target field) |
Table 5.
Description of ant packet fields.
| Field | Description |
|---|---|
| source | The node that generates an ant packet. |
| destination | The node that an ant packet should reach. |
| direction | It means the type of ant. There are two types of ant; forward is a request packet. backward is a response packet. |
| init_ttl | It is an initial time-to-live. Using this filed, each node can calculate the distance between source and current node. |
| cur_ttl | Current time-to-live. |
| nwalks | The length of walks field. |
| npath | The length of path field. |
| nvisted | The length of visited field. |
| ndists | The length of dists field. |
| padding | This field is a 2 bytes padding for a 4 bytes-align. |
| walks | The array of FON ID. This field records all nodes that ant (packet) dropped by. So, this field includes all nodes that backtracked nodes. |
| path | The array of FON ID. This field records all nodes that ant (packet) dropped by, but does not include backtracked node. Using this field, the shortest path from source to destination can be calculated. |
| visited | Visited field is the array of node IDs and where all visited nodes will be recorded in. It is used to confirm that duplicate visits have been made and to prevent the graph cycle. |
| dists | Visited field is the array of the distance. Each element has 2 byte length. And nth element is the distance between source and nth visited’ element. In other words, dists[i] == Dist(source, visited[i]) where i is the index of array. |
Table 6.
Common parameters in experiments.
| Parameter | Value |
|---|---|
| Source | 0 |
| Destination | 15 |
| The least distance of Source and Destination | 14 hop |
| Probability of packet loss | 0% |
| The number of packets per evaporation cycle | 10 |
| Total cycles per each experiment | 100 |
| Total packets (ants) per each experiment | 1000 |
| The number of repetitions of the same experiment | 100 times |
Table 7.
ACO algorithm variable and network-related variable.
| Variable | Description |
|---|---|
| M | Number of messages per second (Times/s) |
| C | Pheromone evaporation cycle (s/cycle) |
| N | Number of ant per each cycle (Times/cycle) |
| T | Size of the packet (Byte) |
| O | Link overhead (bps or Mbps) |
| R | Recovery time (s) |
| Link-error detection time (s) | |
| Shortest Path Search time (s) |
© 2017 by the authors. Licensee MDPI, Basel, Switzerland. This article is an open access article distributed under the terms and conditions of the Creative Commons Attribution (CC BY) license (http://creativecommons.org/licenses/by/4.0/).
Share and Cite
MDPI and ACS Style
Sim, Y.-B.; Lee, S.; Lee, S. Function-Oriented Networking and On-Demand Routing System in Network Using Ant Colony Optimization Algorithm. Symmetry 2017, 9, 272. https://doi.org/10.3390/sym9110272
AMA Style
Sim Y-B, Lee S, Lee S. Function-Oriented Networking and On-Demand Routing System in Network Using Ant Colony Optimization Algorithm. Symmetry. 2017; 9(11):272. https://doi.org/10.3390/sym9110272
Chicago/Turabian StyleSim, Young-Bo, SeungGwan Lee, and Sungwon Lee. 2017. "Function-Oriented Networking and On-Demand Routing System in Network Using Ant Colony Optimization Algorithm" Symmetry 9, no. 11: 272. https://doi.org/10.3390/sym9110272
Note that from the first issue of 2016, this journal uses article numbers instead of page numbers. See further details here.