1. Introduction
Developmental instability (DI), the inability of an organism to buffer its development against developmental noise [
1], is often measured through random deviations from perfect symmetry (the so called fluctuating asymmetry (FA) [
2]). FA has often been studied for its associations with various estimates of stress, fitness and health, and this in a wide variety of organisms, including plants, invertebrates, and vertebrates including humans [
3]. Overall, it has often been argued that the strengths of associations vary a lot among studies and that it seems impossible to predict if and when FA will show associations with measures of stress, fitness or health. Indeed, in a meta-analysis of the human literature, on average a robust effect was detected, but that variation among studies remained largely unexplained [
3]. Associations between FA and stress were strongest in human fetal studies, although that levels of stress may need to be very high [
3,
4,
5].
While associations between FA and various types of stress, health and fitness have been studied intensively, surprisingly relative little is known about the effects of stress on the changes of FA with age. Indeed, longitudinal studies are very rare, but also cross-sectional studies have not often focused on the associations of FA with age (see, e.g., [
6,
7,
8]). Also in humans, the literature on the changes of FA with age are scarce, especially in fetuses. Nevertheless, such insights can provide valuable information with respect to the mechanisms causing increases of FA with stress. More specifically, the morphogenetic drift model for skeletal asymmetry predicts that effects of stress on FA will accumulate over time, such that associations between stress and FA will emerge later in life [
9]. Under this model, one thus can predict that a higher FA in fetuses experiencing congenital abnormalities serious that affect normal functioning and are potentially lethal, i.e., major congenital abnormalities (as observed earlier, [
10]), will become apparent only at the later developmental stages. One can thus predict an interaction between age and stress. In this study, we combine data from two populations, one with fetuses from spontaneous abortions and still births and the other from elective abortions. While the first population contained many fetuses with major abnormalities, the latter did not. A detailed analysis of the associations between FA and age is presented and comparisons between populations, and between fetuses who did or did not experience developmental perturbations leading to major abnormalities.
2. Materials and Methods
We combine data from two samples in thus study, of which all traits measured in both populations were analyzed here. The first sample was collected in Turku (Finland), the second in Amsterdam (The Netherlands).
Between 1964 and 1974, human fetuses from elective abortions were collected by scientists at the Institute of Dentistry, University of Turku (Finland) to study craniofacial development (further called Turku). For ethical reasons all background information on the mothers had been discarded, leaving data on the age, sex and size for the majority of the fetuses. Patient data and radiographs were used according to the guidelines of the Medical Ethics Committee of the VU University Medical Center and patient anonymity was strictly maintained. Parental written informed consent was obtained for patients and data were handled in a coded and completely anonymous fashion, according to Dutch national ethical guidelines (Code for Proper Secondary Use of Human Data, Dutch Federation of Medical Scientific Societies;
http://www.federa.org/codes-conduct). Ethical approval (approval number 648/32/300/05) to study the human collection of embryos and fetuses owned by the University of Turku was obtained from the National Supervisory Authority for Welfare and Health of Finland (VALVIRA).
Complete fetuses were preserved by the ‘clearing and single staining’ procedure and kept on glycerin. This technique allows us to study skeletal traits by making eviscerated specimens semi-transparent with potassium hydroxide and staining ossified parts with alizarin red. All fetuses were externally evaluated for skeletal malformations (including craniofacial and limb defects) by a pediatric pathologist and no major abnormalities were reported. Major congenital abnormalities (i.e., compromising the normal functioning and sometimes potentially lethal), indicate major disturbances of development starting during the very early organogenesis and include for example the absence of one or both kidneys, skeletal dysplasias, extreme scoliosis, anencephaly, cleft lip/palate, cyclops, dextroposition of the heart, monoventricular or monoarterial heart; atresia of the aorta; chromosomal abnormalities , amnion disruption syndrome, chondrodysplasia and sirenomalia [
10]. In many cases, several (major) congenital abnormalities co-occur, and in a few exceptional fetuses it is not always possibly to identify abnormalities very precisely. It is important to note that the presence of these major abnormalities cannot be missed during medical examinations. As such, we are certain that in this first population did not experience major congenital abnormalities, in contrast to population 2 (see below). A high frequency of cervical ribs and rudimentary 12th ribs was reported [
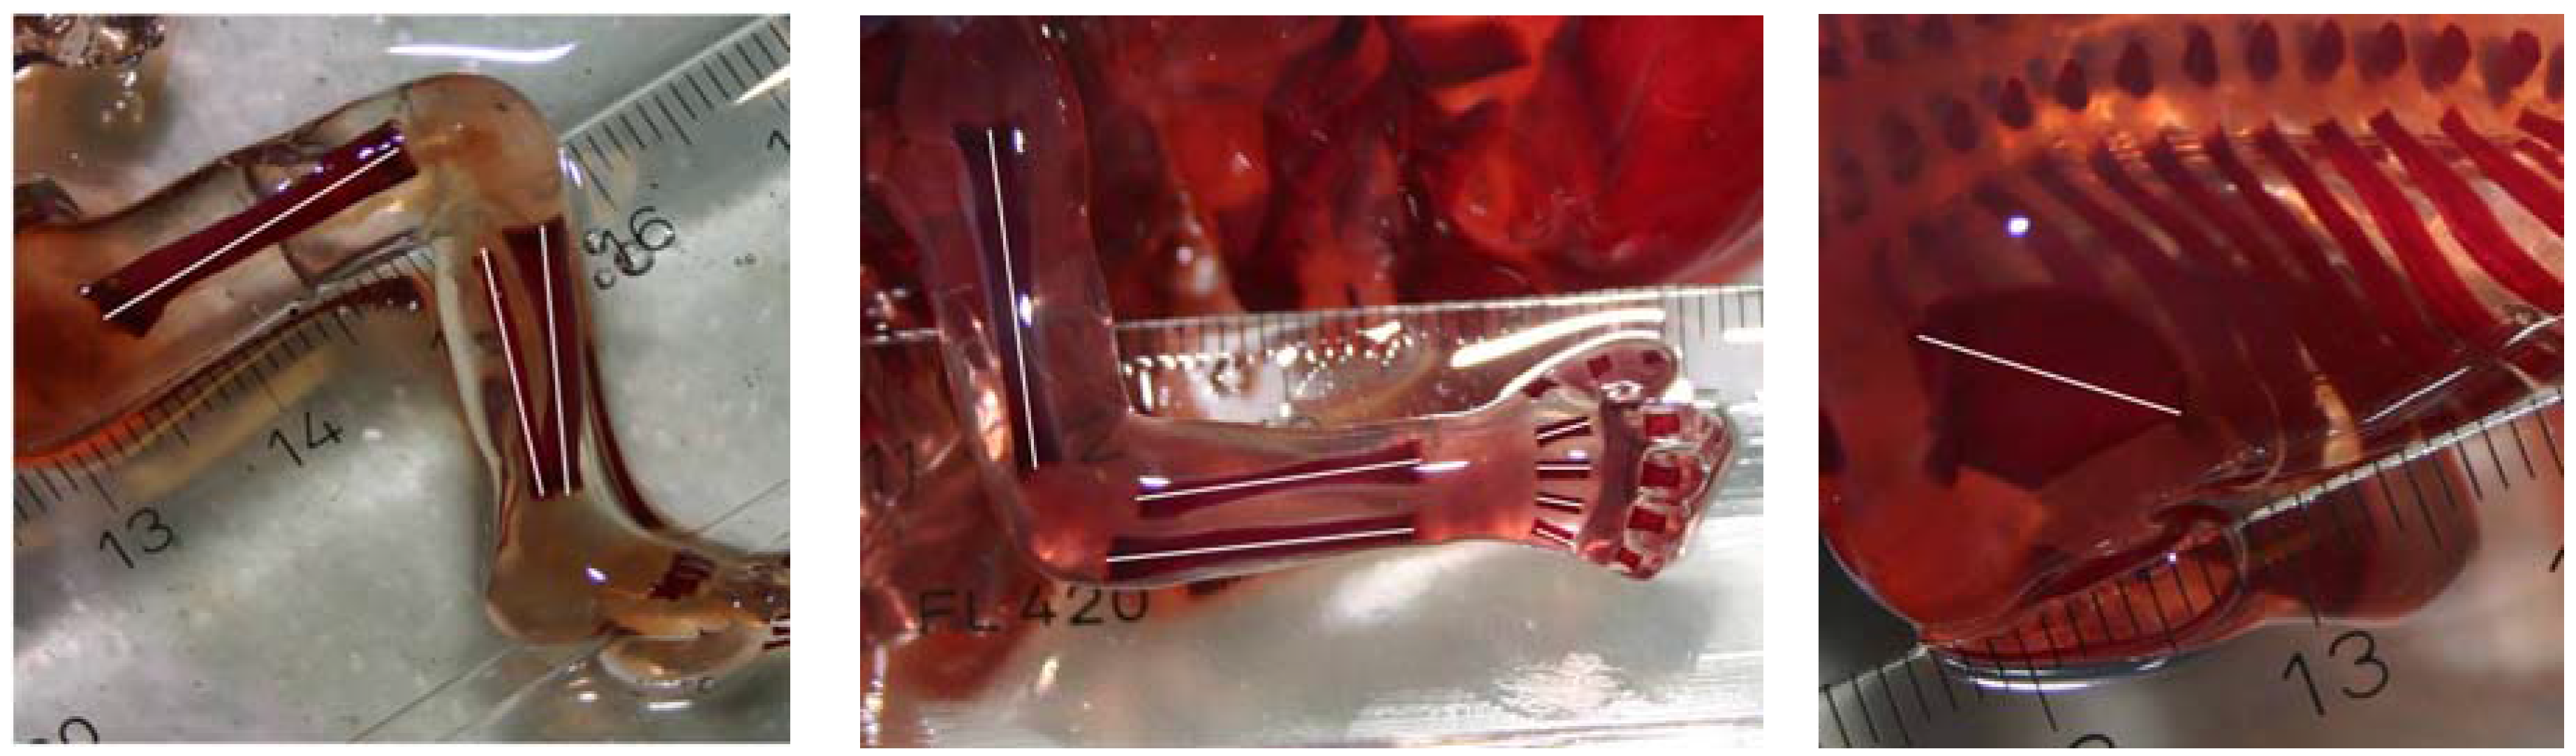
11]. Measurements were collected from 178 individuals, 95 females and 83 males, aged 10–21 weeks (average 15.3 weeks ± 2.1 weeks). Each fetus’ left and right hand, arm, leg and back were photographed twice independently and repeatedly with a Canon 300D digital SLR camera (Canon, Machelen, Belgium). Digital pictures were scaled using a transparent ruler (resolution of 0.1 cm, used for scaling purposes) and analyzed in Image J 1.42q (National Institutes of Health, Bethesda, MA, USA).
Figure 1 provides an overview of the measured traits, which include the size of the humerus, radius, ulna, metacarpal 2, 3, 4 and –5, femur, tibia, fibula, and scapula. For each picture, first, two landmarks were placed on the ruler at a distance of 2 cm to allow scaling measurements on different pictures to the same unit (i.e., in centimeters). Next, landmarks were placed at the center of the proximal and distal ends of the bones, allowing us to calculate the length of each bone on the basis of these two coordinates (i.e., as a Euclidian distance). All landmarks were placed twice independently for each picture to evaluate repeatability. Variation in bone lengths between measurements of repeated pictures of the same bone will allow us to evaluate the degree of measurement error (ME) due to repositioning of the fetus and taking pictures. In addition, variation in bone lengths between repeated measurements within pictures will allow us to evaluate the degree of measurement error due to placing landmarks (see statistical analyses).
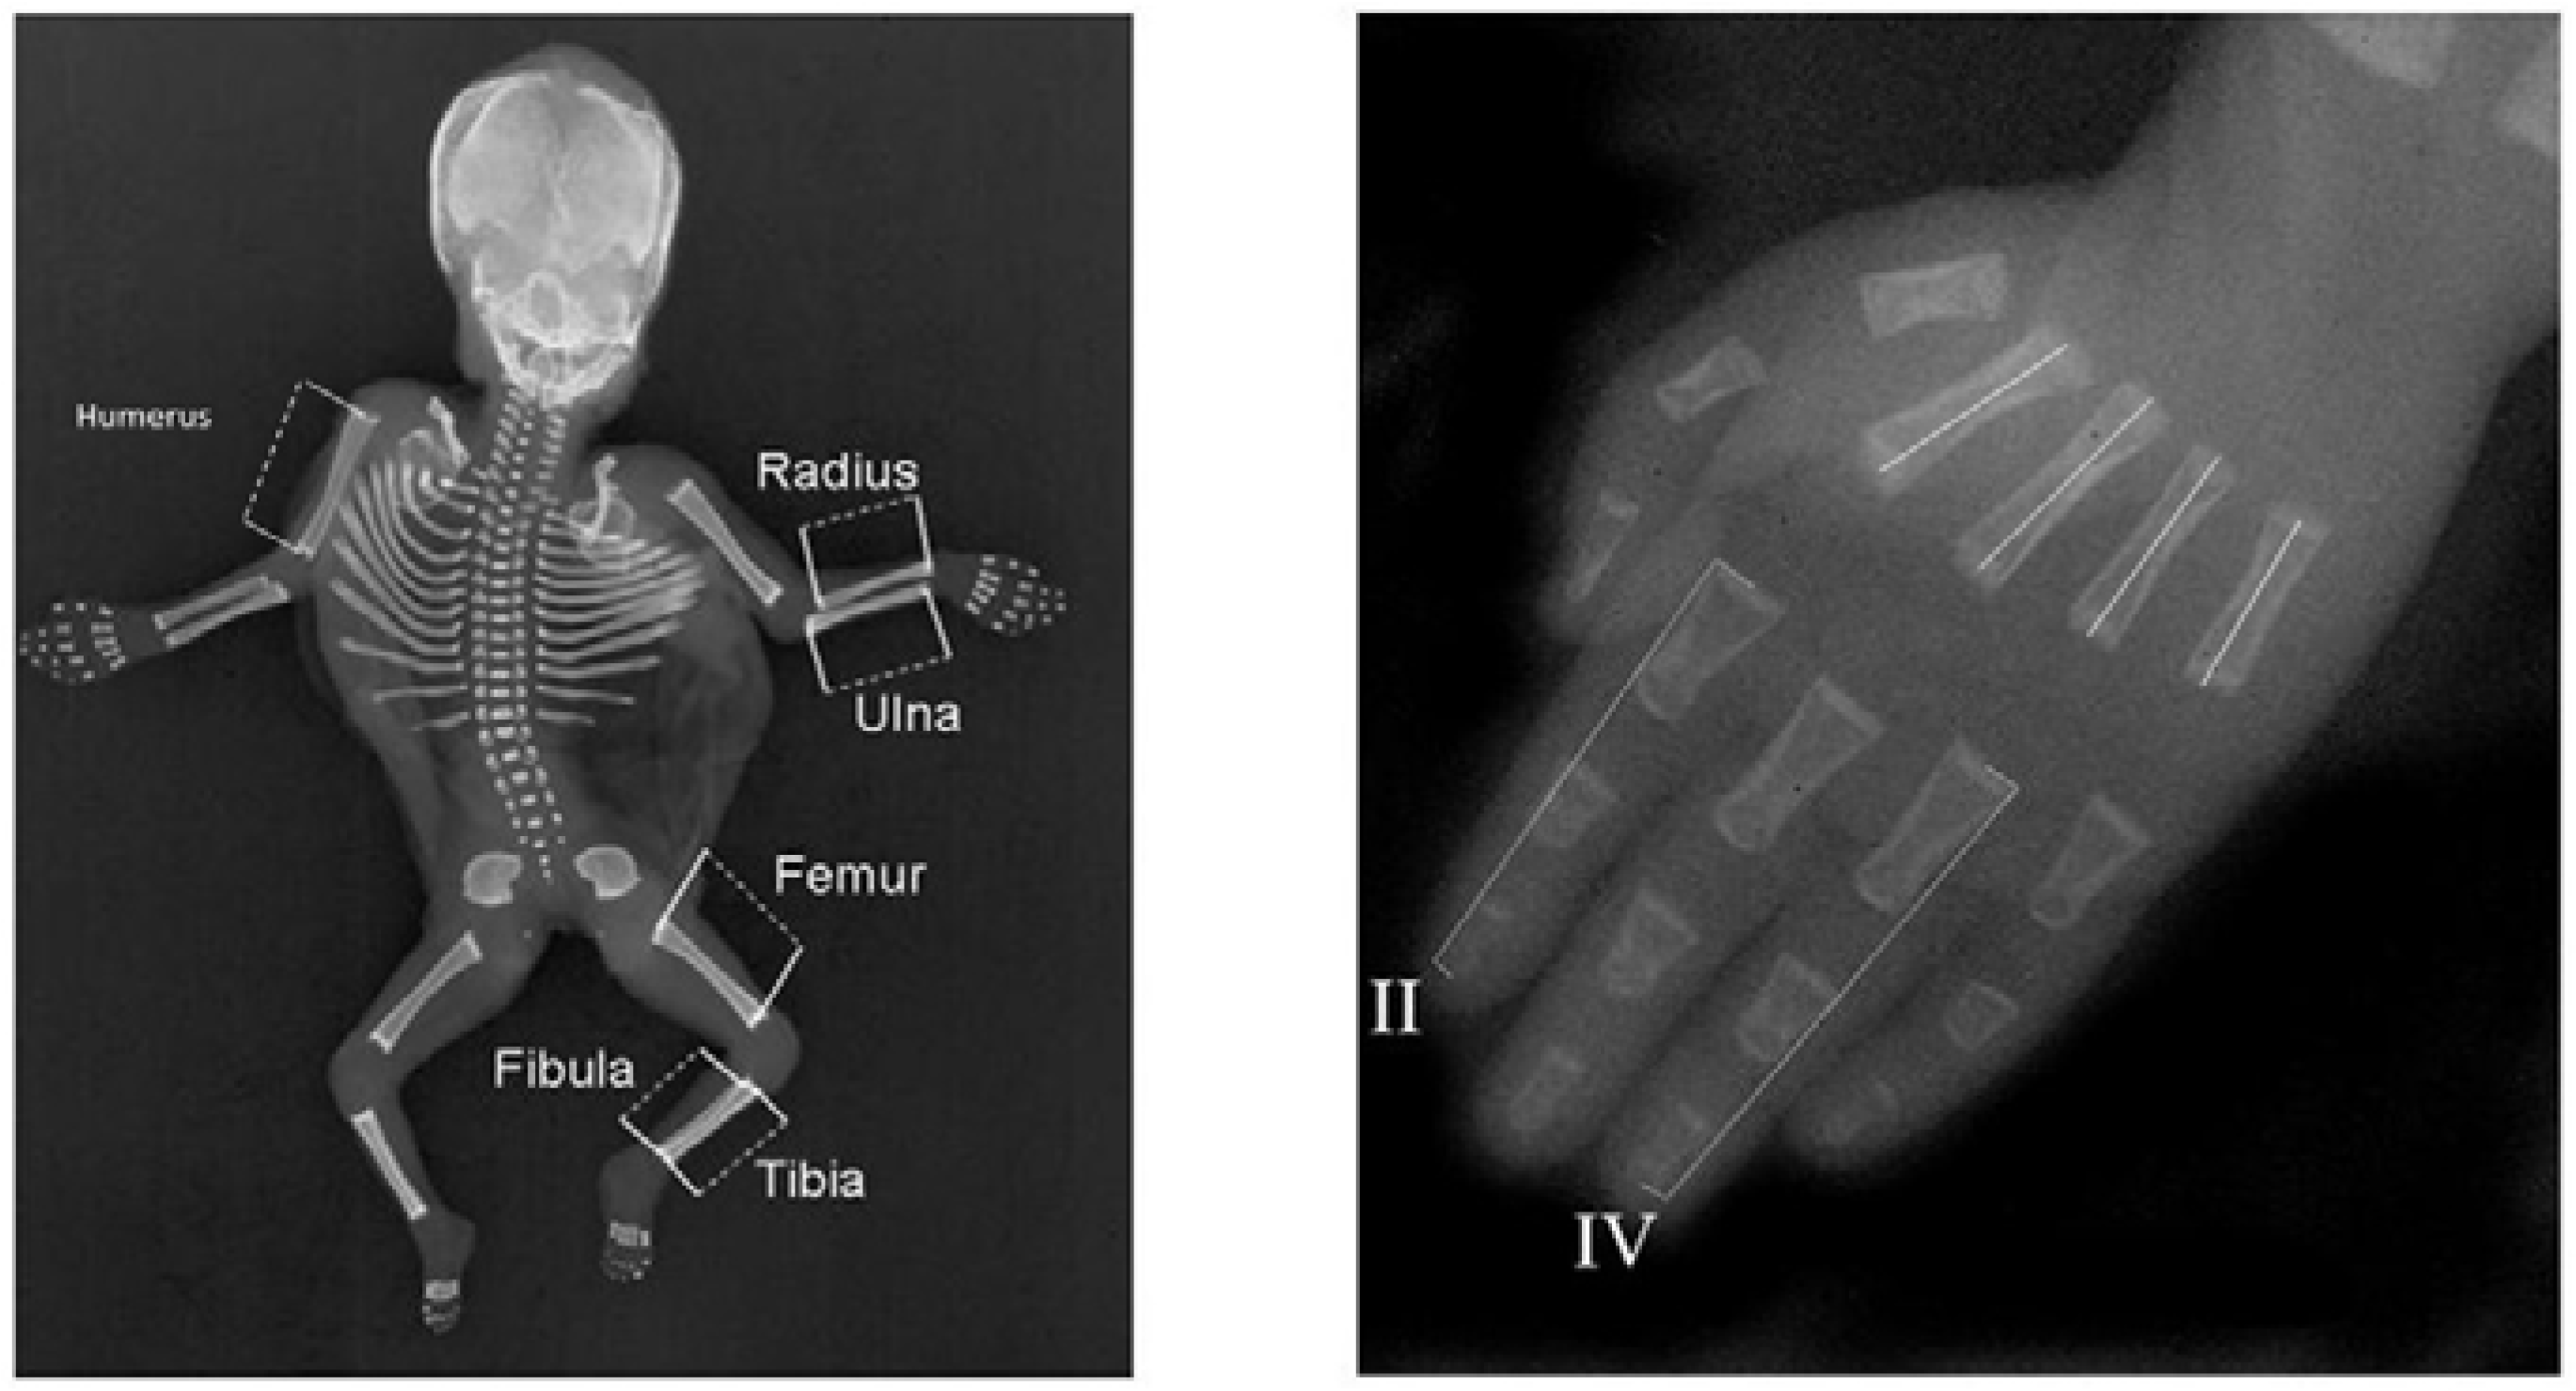
Since 1980, all deceased infants and fetuses have been routinely radiographed both ventrally and laterally, when presented for autopsy at the VU Medical Centre (23 mA, 70–90 kV, 4–12 s, Agfa (Mortsel, Belgium) Gevaert D7DW Structurix films) (further called Amsterdam). This research was carried out on the anterior-posterior projections of 1339 deceased fetuses and infants obtained between 1990 and 2009. In total, we measured 616 male and 487 female fetuses and infants and 4 fetuses of unknown sex (13–49 weeks, mean: 26.1 weeks ± 8.0 weeks). We excluded some fetuses when radiographs had insufficient resolution or limb bones were not properly positioned. The radiographs were digitized using a Canon 30D digital camera in a fixed-distance set-up with a glass plate and a flash underneath. We measured the length of the left and right digits 2 and 4, metacarpals 2, 3, 4 and 5, humerus, femur, fibula, radius, ulna and tibia from the midpoint of the proximal end of the bone to the midpoint of the distal end of the bone in Image J version 1.42q. Digits were measured from the proximal end of the proximal phalanx to the distal end of the distal phalanx. All measurements were obtained with a transparent ruler up to 0.01 cm accurate. We excluded all fetuses that had abnormally developed limbs from analyses, because of the likely direct effect of development on the asymmetry of the limbs. Standard autopsy reports were made by pathologists and filed in a national pathological archive (PALGA), on the basis of which major abnormalities were identified (see above and [
10]).
Figure 2 provides an overview of the measurements obtained.
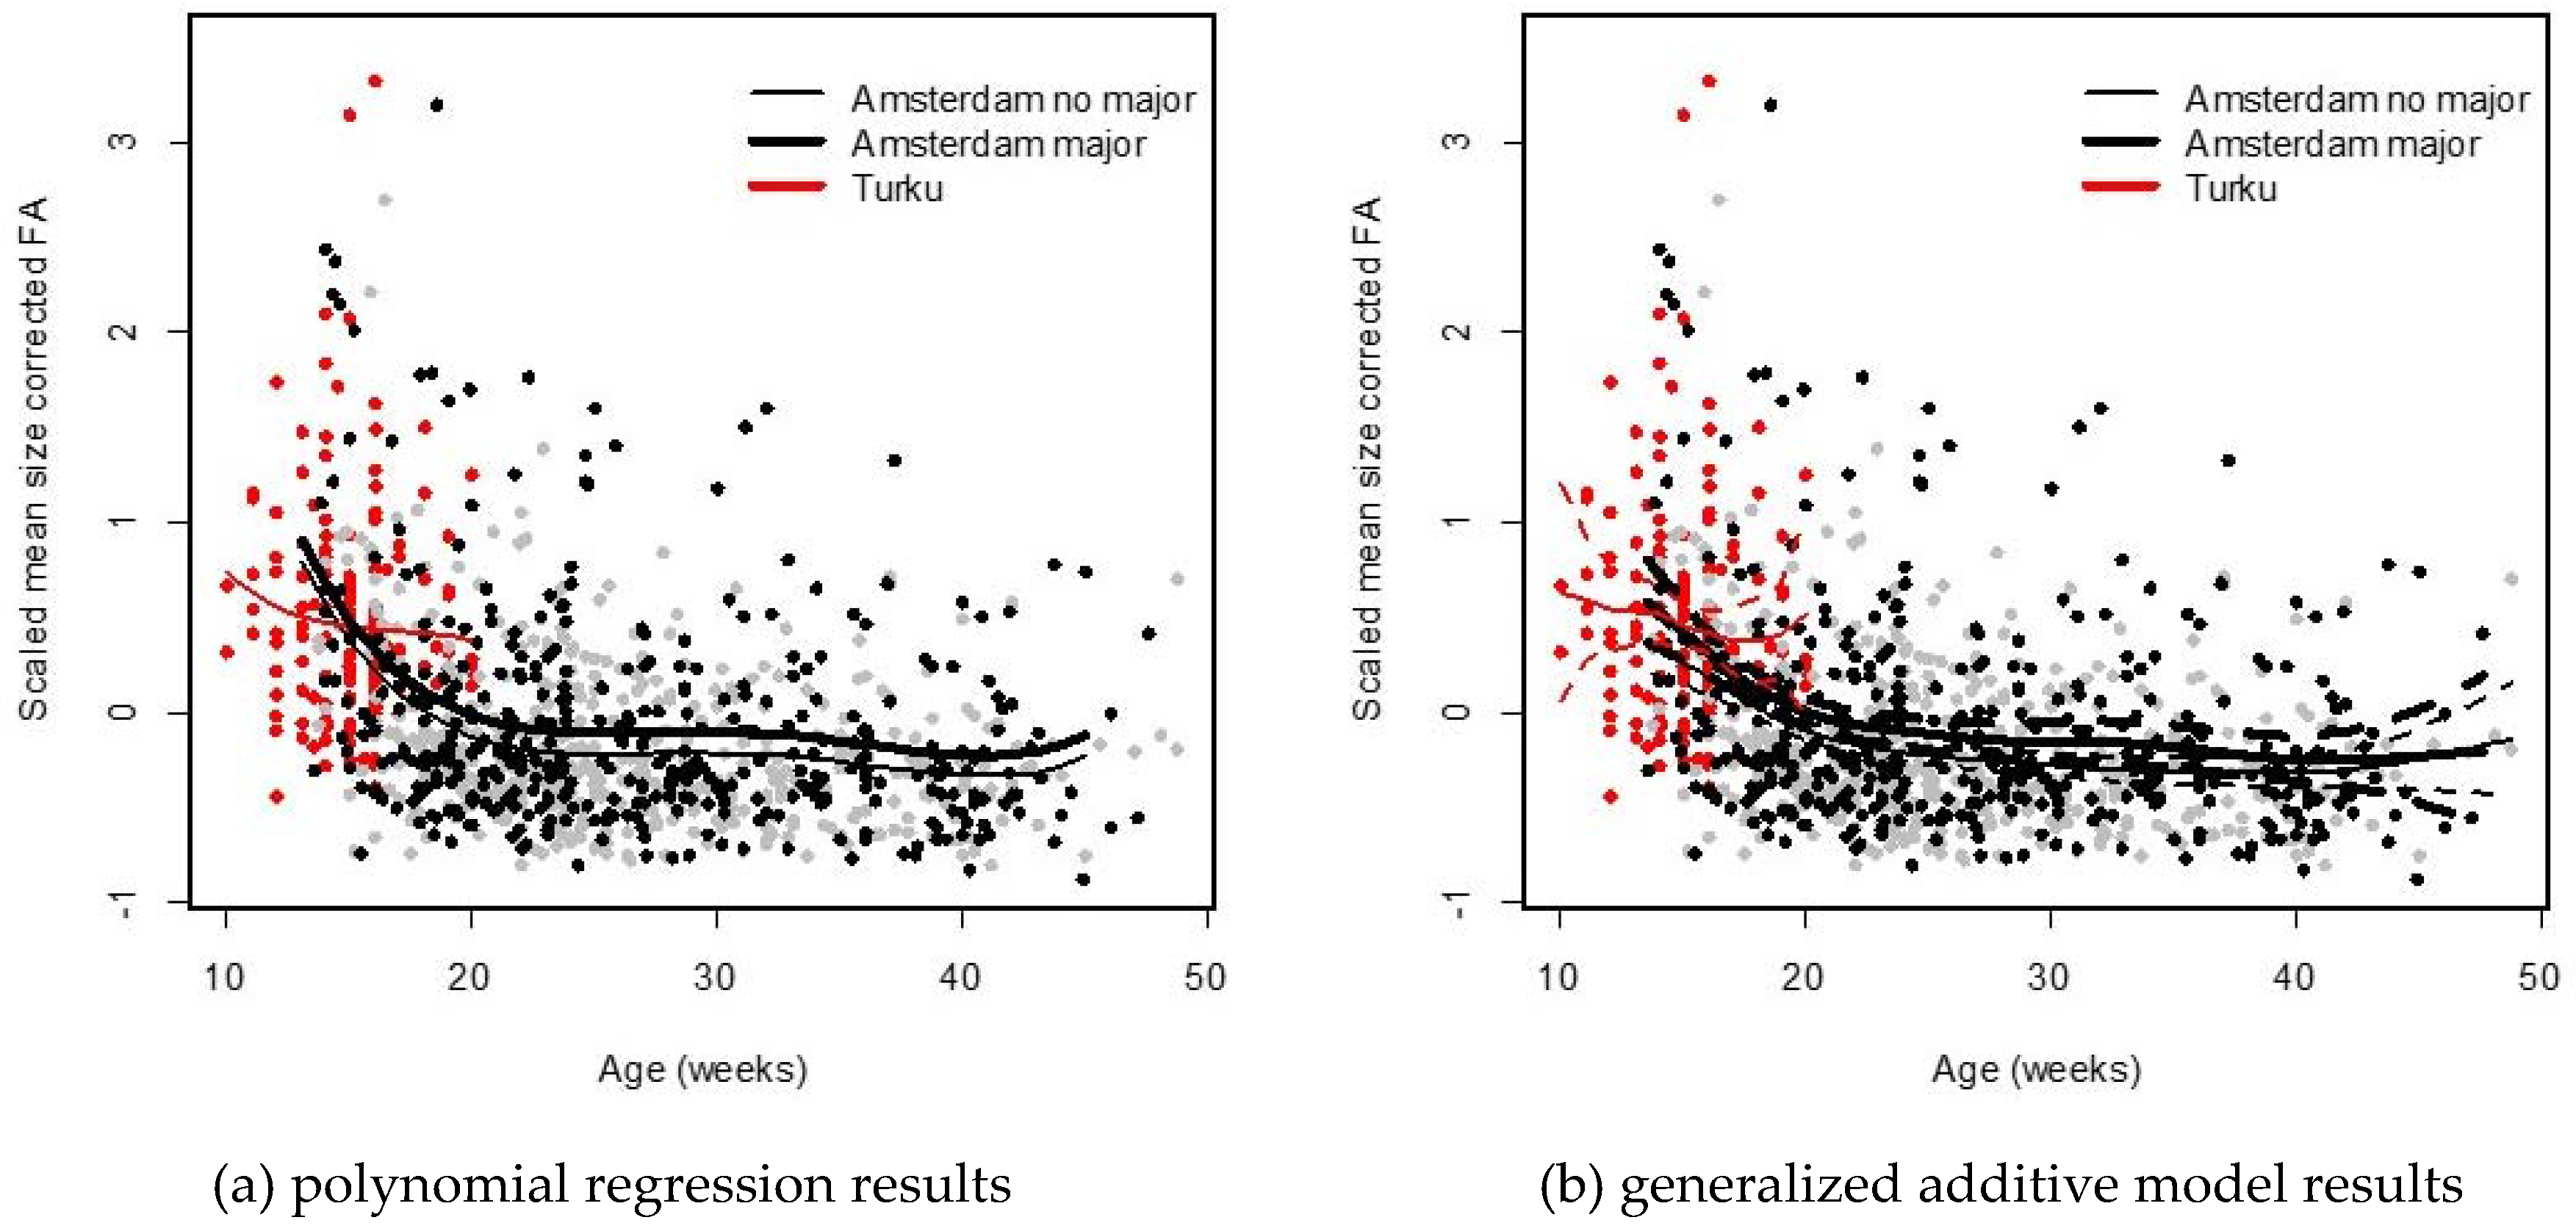
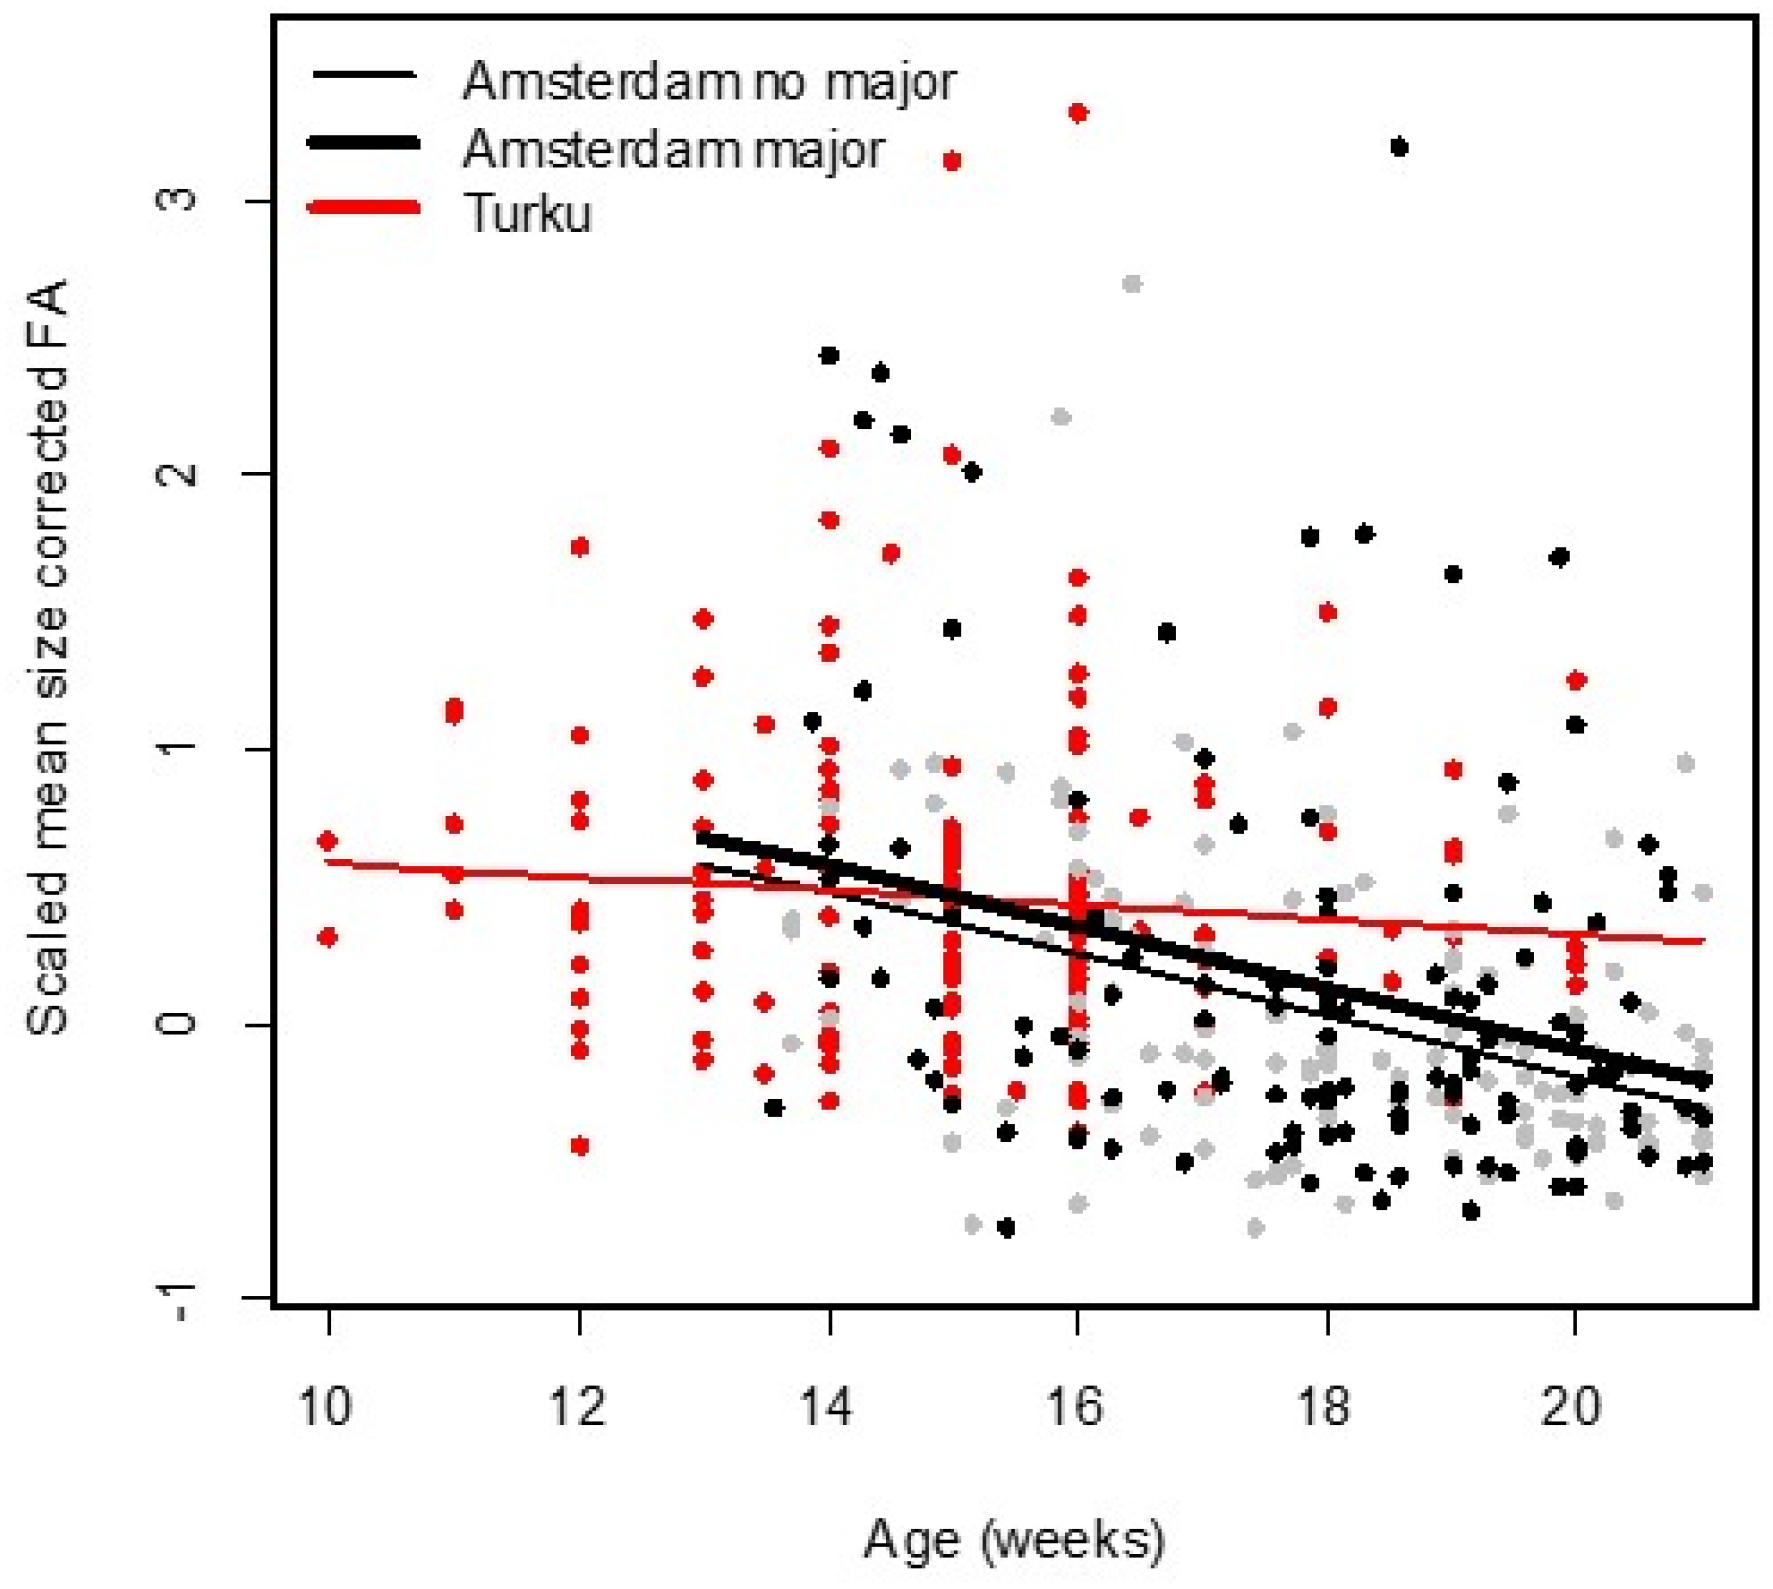
Some traits were not included in our final analyses. Scapula of the Turku population, and digits 2 and 4 of the Amsterdam population were excluded because they were not measured in both populations. In addition, in order to avoid that the metacarpals would be overrepresented in the calculation of the average FA across traits, metacarpals 3 and 5 were omitted from both populations. Of all remaining traits, a mixed regression model analysis [
12] was performed with side as continuous covariate (left = −0.5 and right = 0.5, such that a positive slope would indicate that the right side was lower than the left), and both individual and photograph nested within individual as random effects. Two-way interactions between these random effects and side were also included and their respective variances reflect true FA and measurement error due to taking photographs and positioning the fetus respectively. The residual variance reflects measurement error due to the measurements within single photographs. Unbiased individual and trait specific signed FA values corrected for measurement error and directional asymmetry (DA, as estimated by the fixed side effect) were obtained as the best linear unbiased prediction (BLUP) of the random slopes from the individual × side random effects interaction. These signed FA values showed normal to leptokurtic distributions, showing that there was no antisymmetry. Unsigned FA values, obtained as the absolute value of the signed FA, were divided by trait size because the uncorrected unsigned FA correlated positively with size [
4,
5]. Average unbiased and size corrected FA was obtained as the average of the standardized size corrected unsigned FA’s [
10,
12]. Associations between average FA and age was studied using two approaches. First, a polynomial regression was performed up to the fifth degree. In addition, population and whether or not a fetus experiences a major abnormality were added as factors as well as their interactions with age and the polynomial age terms. The model was simplified using a stepwise backward elimination. Second, a generalized additive model was fitted separately for both populations. For the Amsterdam population, the analysis was done separately for fetuses with or without major abnormalities. The added value of this second approach is that it does not assume any parametrical form of the association between average FA and age. Finally, we also analyzed the FA-age associations for fetuses aged 21 weeks or younger, thus excluding the older fetuses in the Amsterdam population. We also focus on the changes in FA between weeks 10 and 21, a period for which we have data for both populations and with the strongest change in FA (see below). All analyses were performed in the package R (R Core Team, Vienna, Austria) [
13].
4. Discussion
We studied associations between DI, as measured by FA in limbs and hands, and age in human fetuses and infants. FA was on average larger in the Turku population, but this was to some extent due to the age differences between the two populations. Nevertheless, we observed a different change in FA between the youngest (age < 21 weeks) fetuses of both populations, where the decrease was less steep, and not statistically significant for the Turku population. This result is somewhat unexpected given that the fetuses from Turku were obtained from elected abortions and thus reflect fetuses following a relatively normal development compared to those from spontaneous abortions in the Amsterdam population. About the reasons for this difference we can only speculate because both populations may differ in several other aspects. One possible explanation could be our inability to measure very young fetuses in the Amsterdam population, because the bones were not sufficiently ossified to get X-rays of sufficiently high quality at the very young ages. The youngest fetuses in the Turku were 10 weeks old (and the oldest 21 weeks) while in the Amsterdam population, ages ranged between 13 and 49 weeks, and about 70% of them were older than 21 weeks. As the fetuses that die at this very young age (i.e., before week 10 or with insufficient ossification between week 10 and 20) are (partly) missing from our Amsterdam sample, yet, may also reflect those who experience the most severe congenital abnormalities. This may have biased our estimate of FA in the Amsterdam sample downward to some extent. In addition, we cannot exclude differences between the two methods of measuring (X-ray vs. stained fetuses) in spite of the fact that the FA values were corrected for the differences in measurement error. More specifically, shrinkage of tissue due to staining in the Turku population may have biased our FA estimate upward in this population. More research with data from different populations might shed more insights in this potential between-population difference. On the other hand, it is also worth noting that the use of FA as a measure of DI has been questioned and may not be correct generally, as outlines in a recent review [
14]. Nevertheless, we did find higher FA in fetuses and infants with major abnormalities ([
10] and this study), with severe genetic abnormalities and when several organ systems or patterning processes are affected [
5], which does suggest that limb FA does signal developmental perturbations, albeit often only when they are very severe.
In the Amsterdam population, the decrease in FA with age appeared linear for the younger ages (13–21 weeks) and then leveled off around the age of 23 weeks. While fetuses and infants with major abnormalities showed higher FA, as seen previously in a smaller sample from this population [
9], the associations of FA with age were parallel for fetuses and infants with or without major abnormalities. We found no evidence that FA-age associations are affected by major abnormalities which typically emerge during early development, and thus could not demonstrate a significant statistical interaction between age and the occurrence of major abnormalities as predicted by the morphogenetic drift model for skeletal asymmetry [
8]. To what extent the differences in FA between fetuses who did and did not have major congenital abnormalities, would increase later in life, could not be studied here since all fetuses died prematurely or as very young infant. More research should focus on the comparison of changes in FA through development for groups of individuals differing in the amount of developmental perturbations.


