
Rice Leaf Lateral Asymmetry in the Relationship between SPAD and Area-Based Nitrogen Concentration


1
National Key Laboratory of Crop Genetic Improvement, MOA Key Laboratory of Crop Ecophysiology and Farming System in the Middle Reaches of the Yangtze River, College of Plant Science and Technology, Huazhong Agricultural University, Wuhan 430070, Hubei, China
2
Department of Plant Agriculture, University of Guelph, 50 Stone Road East Guelph, Guelph, ON N1G 2W1, Canada
*
Author to whom correspondence should be addressed.
Symmetry 2017, 9(6), 83; https://doi.org/10.3390/sym9060083
Submission received: 26 March 2017
/
Revised: 26 May 2017
/
Accepted: 30 May 2017
/
Published: 2 June 2017
Abstract
:Rice leaves display lateral asymmetry around the midrib, and the narrow side exhibits higher leaf area-based nitrogen concentration (Na) and soil plant analysis development (SPAD) values than the wider side. However, the difference in the relationship between the SPAD of each side and Na of the corresponding lateral half, and the optimal position along the leaf blade for SPAD measurements are not known. In this study, the relationship between SPAD and Na of both sides of the top three leaves was determined with 17 rice varieties grown over three growing seasons in two locations. The relationship between SPAD and Na displayed leaf lateral asymmetry, in which the wide side reflected a higher coefficient of determination than the narrow side. The ability to estimate Na of the whole leaf was slightly improved by averaging SPAD values across the leaf sides and measured points for the top two leaves. Apparently, it was more accurate and easier to measure SPAD readings on the wide side than the narrow side of rice leaf blade with respect to estimating plant N status. Due to the relatively poor relationship of the upper leaf, and the structural limit for SPAD measurements of the base, this study suggests that the most suitable and representative position for SPAD meter measurement on the leaf blade of rice is the lower-middle part from the leaf apex on the wide side.
1. Introduction
Rice (Oryza sativa L.) is one of the most important cultivated crops and is a staple food in the diet of more than three billion people. Over the last 50 years there has been remarkable growth in rice production, providing the foundation for progress towards global food security [1]. Rising crop yields during recent decades can be largely attributed to crop genetic improvement, improved irrigation systems, and widespread application of fertilizers and pesticides, among which increased application of nitrogen (N) fertilizer has been, by far, the most crucial [2,3]. Nitrogen is the nutrient element that is most limiting to the growth and productivity of rice. Conventional farming makes extensive use of N fertilizer to ensure profitability in soils with uncertain fertility levels, and as insurance to achieve high rice yield [4]. Despite being a dominant factor in rice production and quality improvement, the excessive use of N fertilizer has reduced N use efficiency, burdened farmers economically, and harmed the environment [5]. Leaf N status is commonly monitored to determine the requirement for top dressing and as a guide for the proper timing and amount of N fertilizer application to improve rice yield and N use efficiency [6,7].
Photosynthesis is the ultimate basis of crop yield and improving photosynthetic efficiency has recently been recognized as an additional important component of increasing yields [8,9]. There is a close relationship between the single-leaf net photosynthetic rate and leaf N concentration in many plant species [10], reported to be linear or curvilinear in rice [11]. Therefore, maintaining adequate leaf N concentration throughout the growing season is crucial for supporting photosynthetic capacity and achieving high crop yields [12]. Estimating N nutritional status is important for investigating, monitoring, and managing rice production systems [13]. Plant-based diagnostic techniques are required to assess the leaf area-based N concentration (Na) in crop plants for optimum growth. Nevertheless, conventional methods of measuring leaf Na are almost always based on destructive sampling, such as the Kjeldahl procedure [14]. Furthermore, these methods are laborious, time-consuming, and costly [15]. Therefore, there is a need for simple, rapid, and accurate estimation to determine crop N status in the field and make on-site N application decisions.
Chlorophyll is the photosynthetic pigment essential for converting light energy to chemical energy. The majority of leaf N is contained in chlorophyll molecules [16]. Quantification of chlorophyll content, therefore, gives an indirect measure of N nutrient status. One method of measuring N content in plants that are then dried and chemically analyzed using laboratory procedures [12]. This technique is generally laborious, time consuming, and expensive [17]. Fortunately, use of nondestructive handheld sensors, such as a leaf color chart and soil plant analysis development (SPAD), provide an instant indication of leaf chlorophyll that then can be correlated with leaf N [13,18]. A SPAD chlorophyll meter provides a simple, quick, and nondestructive method for estimating the chlorophyll content of leaves and, hence, gives an indication of leaf N content [19]. The SPAD meter estimates relative chlorophyll concentration by measuring differential transmittance of red (650 mm) versus infrared (940 mm) light through part of a leaf held within a small chamber (2–3 mm) [13]. There is a tight linear correlation between SPAD readings and Na [20]. Thus, the SPAD meter has also been utilized as a method to determine crop N status, and judging rice N demand to improve grain yield and N use efficiency over the past two decades [20,21]. However, SPAD meter output can be impacted by several factors, including rice variety, growth stage, leaf position, leaf thickness, and the measured point on the leaf [7,22]. Researchers have adopted many effective measures to account for this variability. For example, correlation between SPAD readings and Na is higher than that between SPAD readings and leaf dry weight-based N concentration (Nw), mainly the result of complications from the effects of specific leaf weight (SLW) [19,23]. When taking SPAD readings from a field, it is essential to ensure that plant samples are representative of the whole crop. Measuring SPAD readings of the uppermost fully-expanded leaf to reveal plant N status is accepted as common practice, although SPAD readings of lower leaf positions were better correlated with the total N in whole leaves in some studies [24,25] and might be more suitable.
We have previously reported leaf lateral asymmetry in leaf width, Na, and SPAD of rice plants—the narrow side of the leaf blade had higher Na and SPAD values than the wide side [26]. Additionally, there have been many studies conducted to determine the most representative measurement position [25] for the evaluation of different SPAD measurement methods [27], and to develop various SPAD-related indices [28]. Nevertheless, to our knowledge, whether there is difference between the lateral leaf halves in relationship between SPAD readings and Na has not yet been investigated. Since SPAD readings show high variability along the leaf blade from the leaf apex to the base (due to uneven distribution of chlorophyll). It is vital to divide the rice leaf into several parts for measurement [29]. However, variation of SPAD measurements along leaf blades between the two lateral sides is also currently unexplored.
In the present study, SPAD readings were recorded at different parts along the leaf blade of each lateral half. Na was also determined for each lateral half. Objectives of this study were (1) to determine the difference between the two lateral halves in the relationship between the SPAD of each lateral half and Na of the corresponding side, and (2) to identify the optimal part of the leaf for SPAD measurements in rice.
2. Materials and Methods
Four field experiments were conducted in Wuxue County and Wuhan City, Hubei Province, China in 2014. In all fields, soil samples were collected from the top 0–20 cm layer before transplanting. Properties of the soils are described in Table 1. At the Wuxue site, three experiments were conducted in the early (from April to July), middle (from May to October), and late (from July to November) rice growing seasons. One experiment was conducted in the middle rice growing season (May to October) in Wuhan. Four and seven varieties were used in the early and late growing seasons, respectively (Table 2). The experiments in the middle growing season had nine and ten varieties in the Wuxue and Wuhan sites, respectively. Thus, there were 30 study cases (variety-season-location combinations) in this study. A complete randomized block design with four replications was used in all four experiments. Twenty eight-day-old and 20-day-old seedlings were transplanted on 3 May and 29 July in the early and late growing seasons, respectively. Twenty five-day-old seedlings were transplanted on 17 June for the middle growing season in Wuxue and Wuhan sites. Two seedlings per hill were transplanted manually in the 5 × 6 m plots in all four experiments. The climate data, including daily temperature, solar radiation, relative humidity, and rainfall during rice growing seasons in Wuxue and Wuhan sites are shown in File S1 and File S2 in the Supplementary Materials, respectively. The climate data were collected from weather stations located near the experimental sites in both Wuxue and Wuhan.
N fertilizer was applied in the form of urea at basal, tillering, and panicle initiation with rates of 84, 46, and 46 kg N ha−1, respectively, for the early rice growing season; 70, 42, and 56 kg N ha−1 for the late rice growing season; and 40, 30, and 30 kg N ha−1 for the middle rice growing season in the two sites. Phosphorus (P) was applied basally, in the form of calcium superphosphate, with rates of 31, 40, and 24 kg P ha−1 in the early, middle, and late growing seasons. Potassium (K), in the form of potassium chloride, was applied at a rate of 37 and 56 kg K ha−1 at basal and panicle initiation, respectively, for the early growing season; 37 and 60 kg K ha−1 for the late growing season; and 50 and 50 kg K ha−1 for the middle growing season. Basal fertilizers were manually broadcasted and incorporated 1 day before transplanting. Weeds, diseases, and insects were intensively controlled throughout the entire rice growth period according to recommended practices, and no noticeable crop damages were observed in any of the four experiments.
SPAD readings of the top three leaves (i.e., the first, second, and third fully-expanded leaves from the top of the plant, designated as LFT1, LFT2, and LFT3, respectively) were taken in situ from three representative subsample plants at the heading stage from each replication. On each lateral side of the midrib, SPAD readings were taken at seven measured points along the leaf blade using a chlorophyll meter (SPAD-502, Soil-Plant Analysis Development, Konika Minolta, Japan), at 1/8, 1/4, 3/8, 1/2, 5/8, 3/4, and 7/8 of the distance from the leaf apex to the base (i.e., the 1st, 2nd, 3rd, 4th, 5th, 6th, and 7th measured points) (Figure 1). After SPAD measurement, the top three leaves of the selected plants were brought to a laboratory for further analysis, where each leaf was sliced manually along its length to remove the midrib. For each leaf, the wide and narrow sides of the leaf blade were separated to measure the rice leaf area, dry weight, and N concentration of each lateral half. A leaf area meter (LI-3200, Li-Cor, Lincoln, NE, USA) was used to measure rice leaf area. Dry weight was determined after oven-drying at 80 °C to constant weight. Nw was determined by an elemental analyzer (Elementar vario MAX CNS/CN, Elementar Trading Co., Ltd., Langenselbold, Germany). Mean SPAD between the two sides (SPADave) at each measured point was calculated as the average reading across the two lateral halves. The Na of each lateral half was defined as the Nw multiplied by the corresponding SLW. SLW was defined as the ratio of leaf dry weight to leaf area. Na of the whole leaf (Na,whole) was calculated with the following equation:
where Na,n and Na,w are the Na of the narrow and wide side of the leaf blade, respectively. An and Aw are leaf area of the narrow and wide side of the leaf blade, respectively.
Data of all 30 study cases were subject to linear regression analyses, with Na and SPAD as the dependent and independent variables, respectively. Significance of difference in the coefficient of determination between the two lateral halves was tested by least significant difference at p = 0.01 (LSD0.01) for each measured point.
3. Results
3.1. Lateral Asymmetry in SPAD Readings
SPAD readings recorded from the wide and narrow leaf sides both increased from the leaf apex to the base for all top three leaves (Figure 2). The SPAD values were significantly higher (p < 0.05) on the narrow side than that of the wide side at all seven measured points for the top three leaves. The difference in SPAD values between the two lateral halves increased from the leaf apex to a position representing 50–80% of the leaf blade, and then decreased to the base.
3.2. Lateral Asymmetry in SPAD Differences across Measured Points
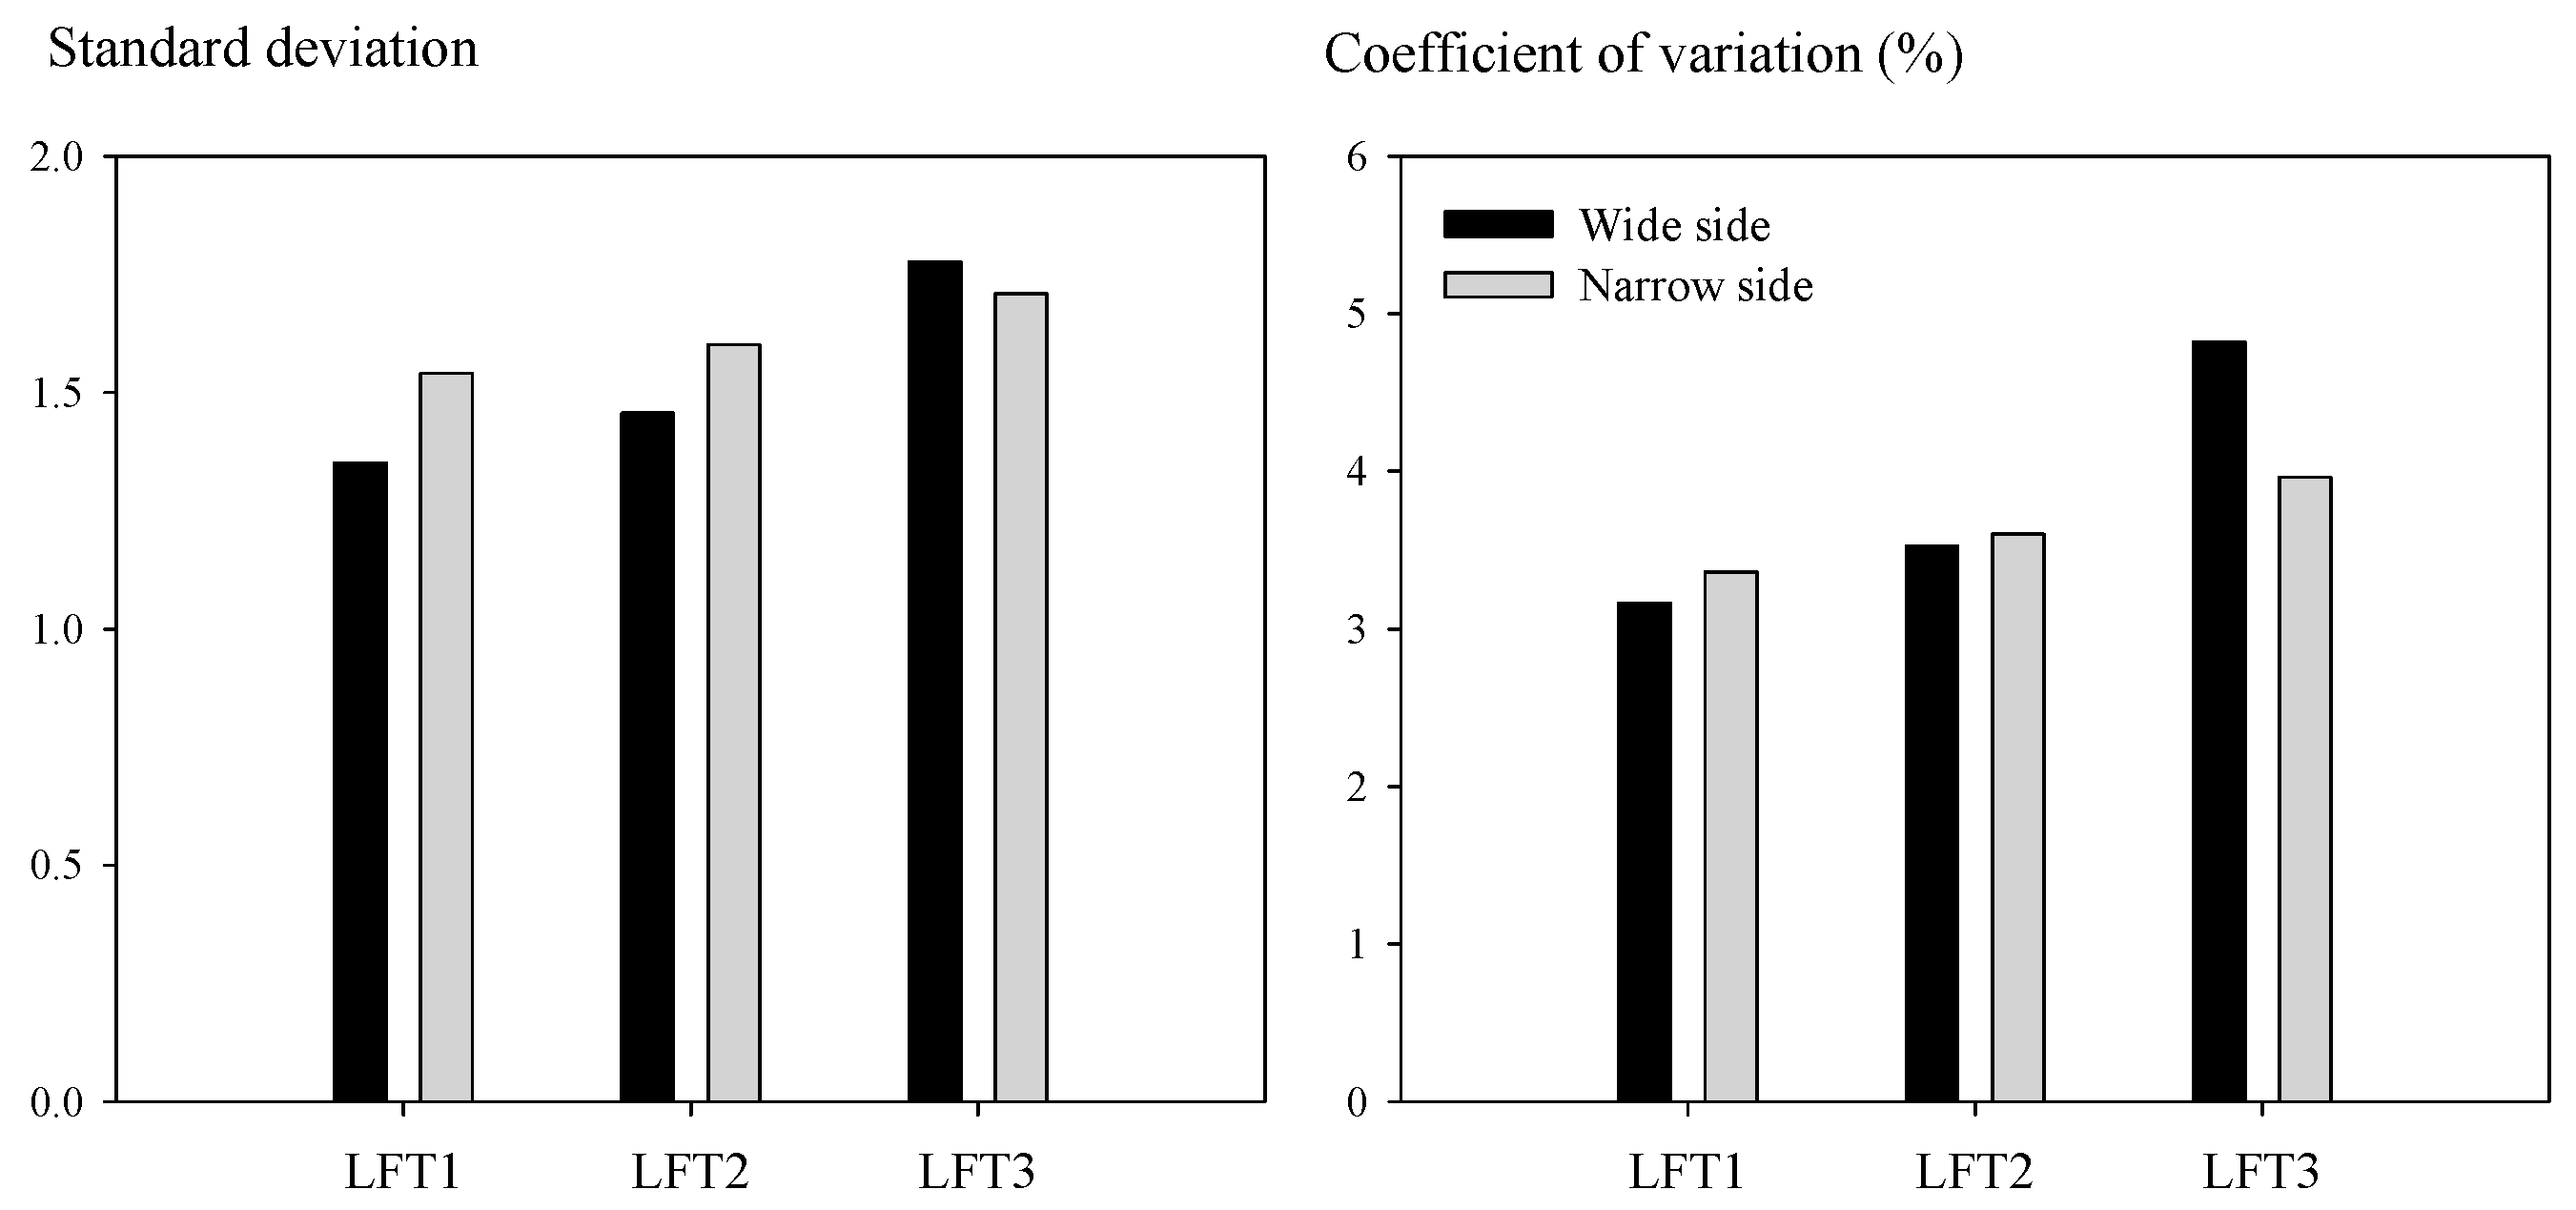
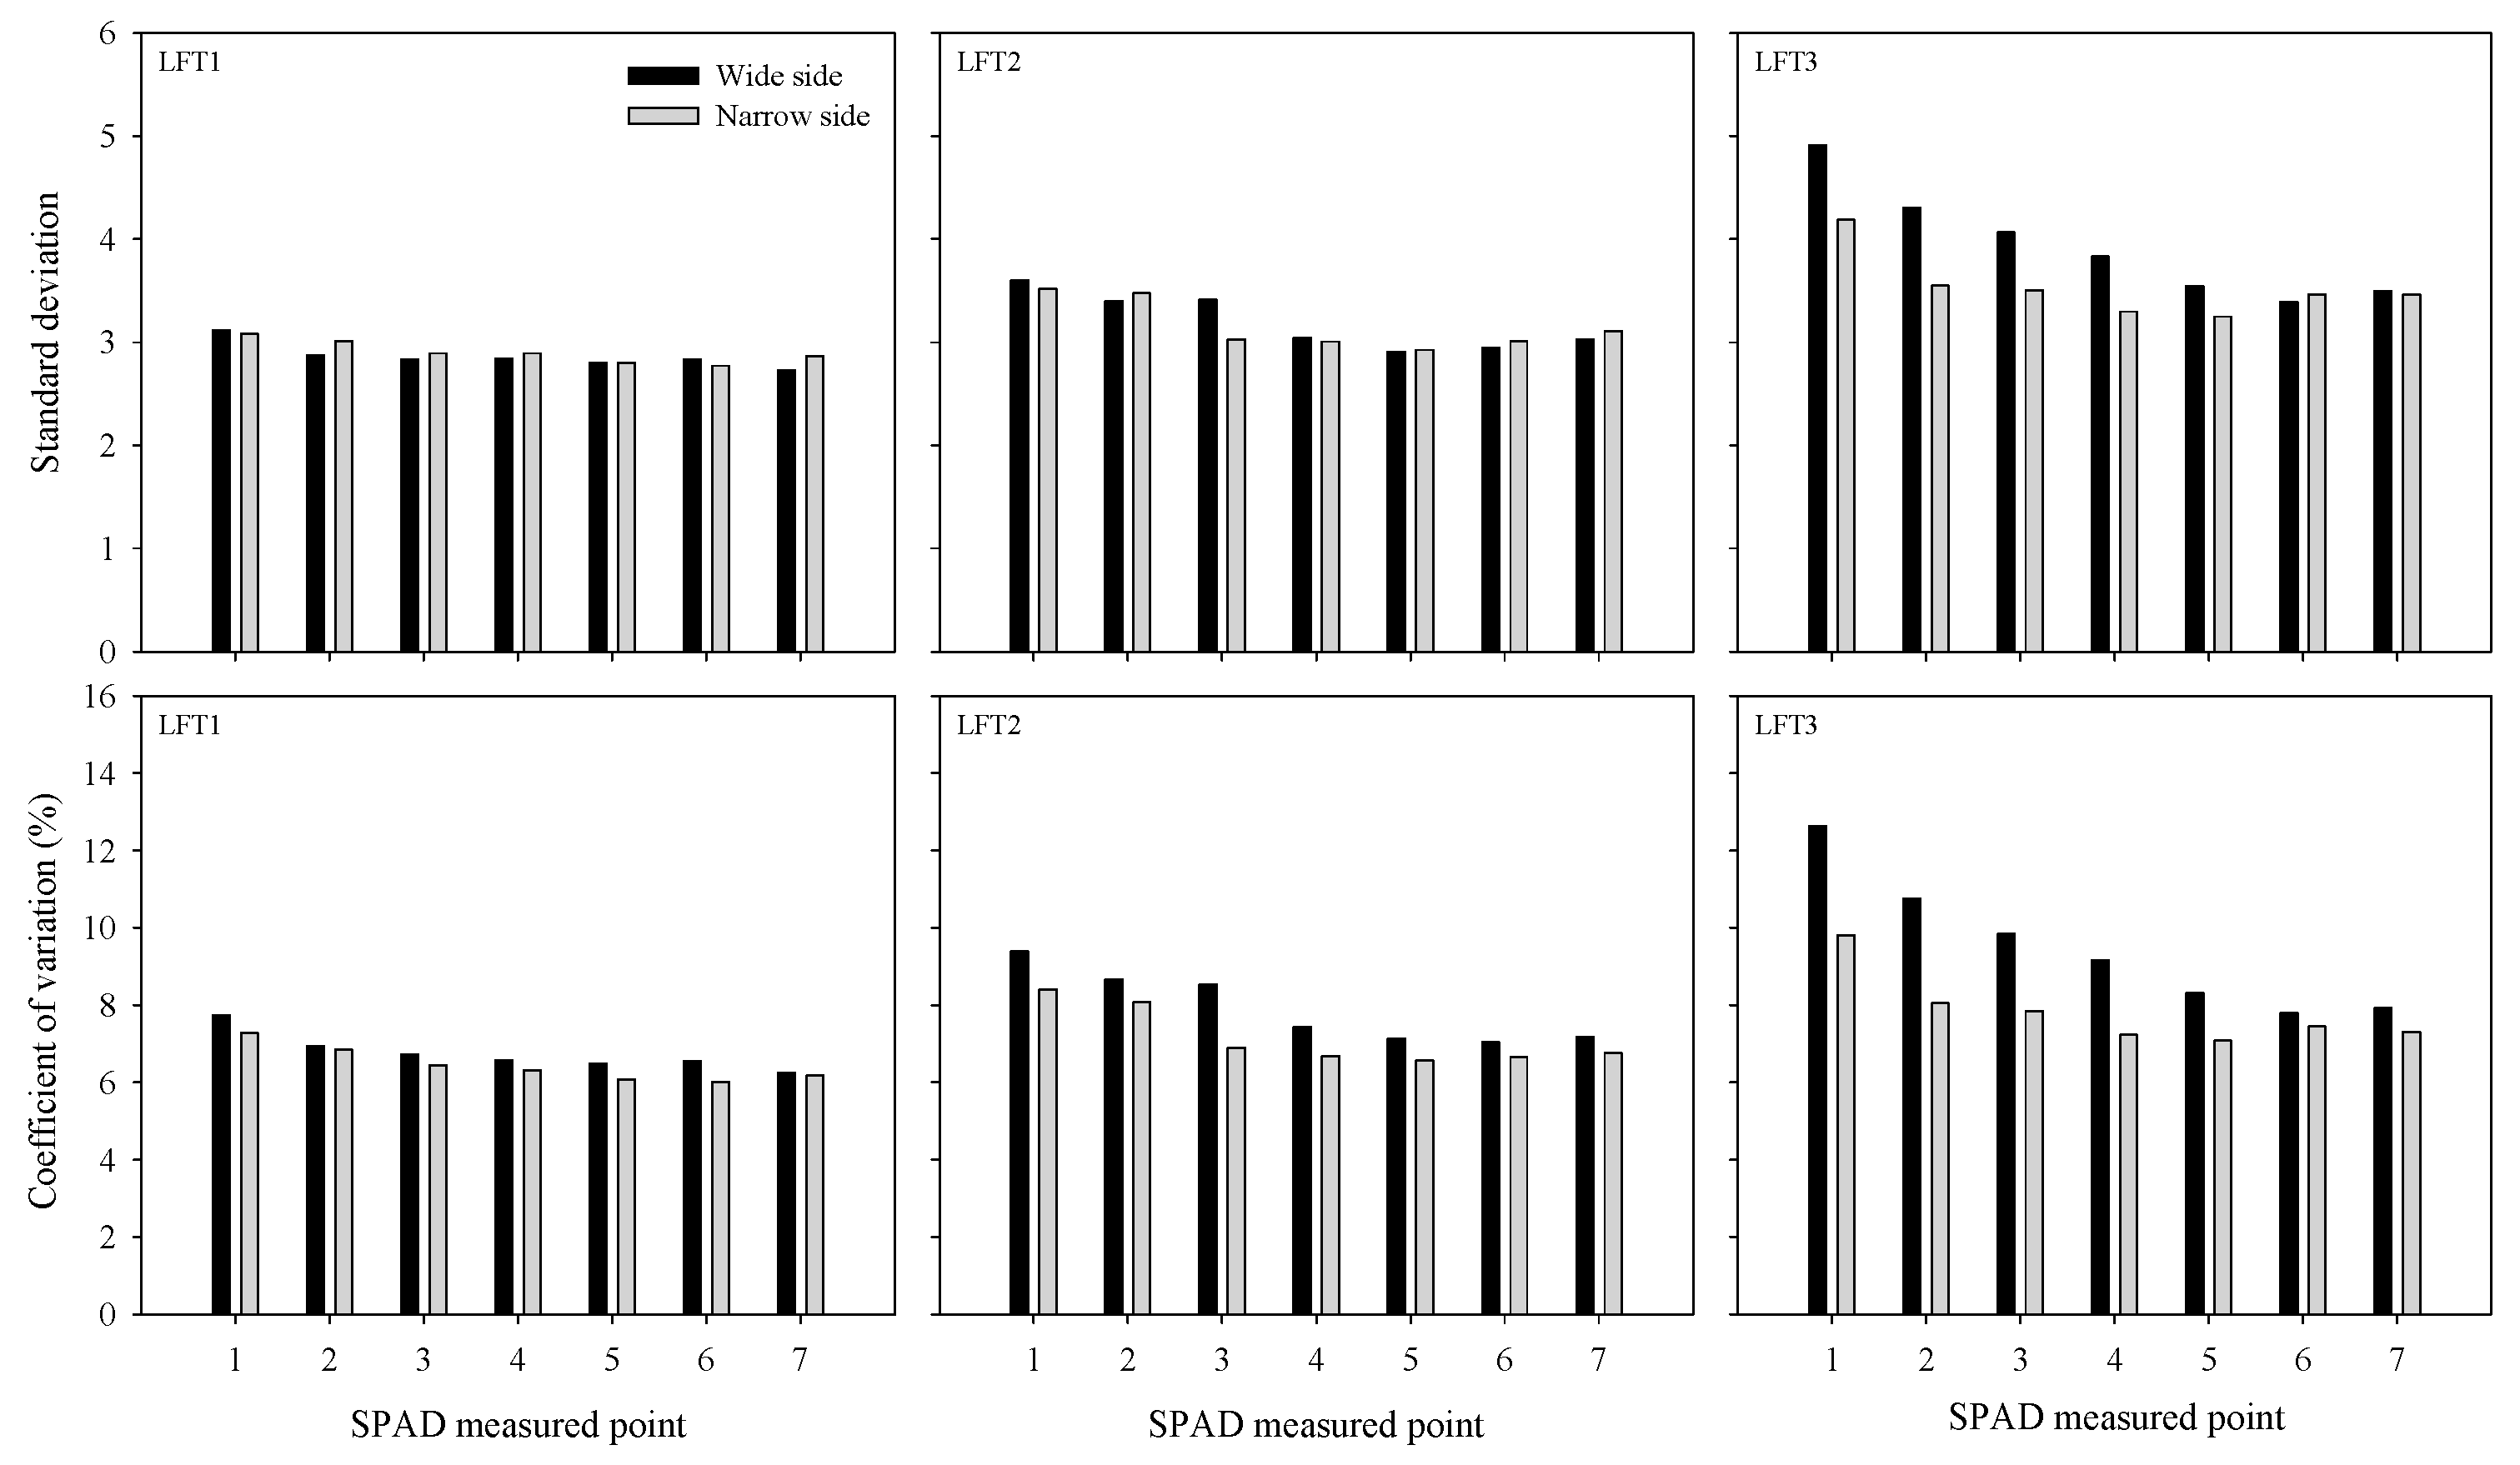
The standard deviations (SD) and coefficients of variation (CV) of the SPAD readings across the seven measured points of each side within a leaf were determined (Figure 3). The SD of the SPAD readings for the wide side across the measured points was the largest in LFT3 (1.8) followed by LFT2 (1.5) and LFT1 (1.4), whereas there were no differences among the measured points of the narrow side in the top three leaves. The trend in the CV of the seven SPAD readings of each lateral half among the top three leaves was similar to that of the SD (Figure 3). LFT3 had the highest CV on both the wide and narrow sides, followed by LFT2 and LFT1. Generally, the wide side had lower SD and CV values than the narrow side for LFT1 and LFT2, while SD and CV were both lower for the narrow side than the wide side for LFT3. The results demonstrated lateral asymmetries in the stability of SPAD readings along the rice leaf. In addition, the wide side had higher SD and CV across different leaves at the same leaf position than the narrow side at all measured points for the top three leaves (Figure 4). The SD ranged from 2.7 to 4.9 for the wide side, and from 2.8 to 4.2 for the narrow side. The CV for the wide and narrow sides was between 6.3% and 12.6%, and between 6.1% and 9.8%, respectively. The SD and CV of SPAD values across different leaves at the same leaf position for all seven measured points increased from the leaf apex to a leaf-specific position (affected by the position from the top of the plant), and then declined to the leaf base.
3.3. Lateral Asymmetry in the Relationship between SPAD and Na
The SPAD readings at different measured points on each side were regressed against the Na of the corresponding lateral half, and a close linear relationship was found between SPAD and Na for both sides. The coefficients of determination (R2) ranged from 0.51 to 0.82 for the wide side, and from 0.41 to 0.73 for the narrow side (Table 3). On average, the results illustrated that the SPAD readings of the wide and narrow sides reflected 68.3% and 60.4% of the variation in Na of the corresponding lateral half for LFT1, respectively; 66.1% and 59.3% for LFT2; and 73.7% and 62.7% for LFT3. As a result, R2 of the relationship between SPAD and Na for the wide side was 13.0%, 11.6%, and 17.5% higher than that for the narrow side for LFT1, LFT2, and LFT3, respectively (Table 3). The results suggested that leaf lateral asymmetries exist in the relationship between SPAD readings and Na for the top three rice leaves at the heading stage, with a closer relationship in the wide side than the narrow side. Furthermore, the R2 of the relationships between SPAD readings and Na of the corresponding lateral half were highest for the 4th, 5th, and 6th points in both lateral halves (Table 3). Therefore, the R2 of the relationship between average SPAD values across the 4th, 5th, and 6th points and Na of the wide side was higher than that of the narrow side for all top three leaves (Table 3).
The relationships between average SPAD (SPADave) across the two sides at each measured point and Na of the whole leaf blade were determined. On average, 70.7%, 66.3%, and 70.7% of the variation in Na of the whole leaf blade were accounted for by SPADave for LFT1, LFT2, and LFT3, respectively (Table 3). There was no difference in R2 between LFT1 and LFT3, and R2 of LFT1 was higher than that of LFT2. Additionally, the R2 of the relationship between SPADave and Na of the whole leaf blade for the upper parts (the 1st, 2nd, and 3rd measured points) was lower than the lower parts, but SPAD measurements taken from the base (the 7th measured point) was limited by structural characteristics of the leaf. Consequently, the relationship between the average SPAD values across the 4th, 5th, and 6th measured points in the lower part and Na of the whole leaf was determined. The average SPAD values across the 4th, 5th, and 6th points reflected 77.2%, 76.9%, and 79.5% of the variation in Na of the whole leaf blade for LFT1, LFT2, and LFT3, respectively. There was a slight improvement in R2 by averaging the SPAD readings across the 4th, 5th, and 6th points, except for LFT3.
Overall, based on the linear equation and R2 (Table 3), it was revealed that the most representative position for SPAD measurements is the lower-middle part of the leaf blade, which represents 55–75% of the leaf blade from the leaf apex. Furthermore, considering the accuracy and operability of SPAD measurement, this study suggests SPAD readings should be made on the wide lateral half of the rice leaf blade to best represent the N status of rice plants.
4. Discussion
4.1. Factors Affecting SPAD Measurement
Chlorophyll meters (e.g., SPAD meters) provide a simple, quick, and nondestructive method for estimating the N status or foliar chlorophyll concentration of many crops [6,30]. They are now popular tools, facilitating research on plant nutrition, crop physiology, and plant eco-physiology [19,31]. However, successful use of SPAD meters is complicated by many factors, such as variety, growth stage, leaf position, leaf thickness, and the measured point on the leaf blade [7,25]. The rice leaf blade is divided by a midrib into two lateral halves, and the width of each lateral half is not equal [32]. The narrow side generally has higher Na and SPAD values than the wide side [26]. SPAD readings are usually taken on one side of the midrib randomly around the midpoint of the leaf length [15,19].
Until the present study the relationship between SPAD readings of each side and Na of the corresponding lateral half, and the relationship between average SPAD and Na of the whole leaf blade had not been determined. Similarly, there has been no research conducted to examine which side is more suitable for SPAD measurement.
4.2. Difference in SPAD along the Longitudinal Direction
SPAD readings at multiple points along the wide and narrow sides both increased from the leaf apex to the base for the top three leaves measured in this study. However, others have reported SPAD values increase from the leaf apex to a position representing 40–50% of the leaf blade, and then decrease towards the base [25]. This difference may have resulted from different measurement methods, as SPAD readings in the current study were taken at seven points along the leaf blade, whereas in other experiments the SPAD distribution in leaf blades was calculated based on quadratic regression [25]. The difference in SPAD readings between the wide and narrow sides increased from the leaf apex to a position representing 50–80% of the leaf blade, and then decreased to the base. Compared with other measured points, the difference in SPAD values among the 4th, 5th, and 6th points (lower part) was relatively small. Moreover, the SD and CV of SPAD reading across different leaves in these measured points were also lower than in others.
4.3. Relationship between SPAD and Na
Since Na is more precisely estimated by SPAD than Nw [15], the relationship between SPAD values at different measured points of each side and Na of the corresponding lateral half was determined. In our study, we found that the R2 of the regression was higher in the wide side than that of the narrow side at all measured points for the top three leaves. To our knowledge, this is the first study to report the leaf lateral asymmetry in the relationship between SPAD and Na of each lateral half. Moreover, SPAD readings of the wide side of LFT1 accounted for more variation in Na than the narrow side.
The analysis of the relationship between SPADave across two sides at each measured point and Na of the whole leaf blade indicated that 70.7% of the variation in Na of the whole leaf blade was accounted for by the SPADave of LFT1. This value was equal to that of LFT3 (70.7%), and higher than that of LFT2 (66.3%), which was in accordance with a previous study [33]. Indeed, many researchers have demonstrated that SPAD measurements should be taken from lower leaves (LFT3 or LFT4) instead of the uppermost fully-expended leaf. However, SD and CV of SPAD readings across different leaves were higher for LFT3 than those for LFT2 and LFT1. In addition, the smaller leaf width of LFT3, compared with LFT1 and LFT2, may limit the application of SPAD measurement on LFT3 [26]. The midrib thickness decreased from the leaf base to the apex [32], while the width of the leaf increased from the leaf base to the midpoint, and then declined toward the apex [34]. The blade of the leaf base is narrow with a thick midrib. As a result, the field-of-view of the chlorophyll meter cannot be covered with leaf tissue at the base, which limits measurement [6].
Moreover, the R2 of the relationship between the SPAD values of each side and Na of the corresponding lateral half, and the relationship between SPADave and Na of the whole leaf blade for the 4th, 5th, and 6th measured points were higher than that of the other points. Therefore, the regression between SPADave and Na of the whole leaf blade was analyzed by averaging the SPAD readings for the 4th, 5th, and 6th measured points and, thus, a slight improvement in R2 of the linear regression was observed for the top two leaves. Remarkably, the relationship between SPAD and Na was better on the wide side than that of the narrow side, consistently, and it was also better than the average, especially for LFT3. Furthermore, it is easier to determine the SPAD on the wide side than the narrow side due to the structural limit [6]. Therefore, this result suggested that SPAD readings should be recorded on the lower-middle part representing 55–75% of the leaf blade from the leaf apex to represent the N status of the whole leaf. The suitable SPAD measurement position (lower-middle part from the apex) suggested in this study was similar to the 2/3 position from the top reported in rice plant [25]. In cereals, depending on the goals of the research, measurements are made at one or more points. Some studies indicated that SPAD values should be measured at various positions on the leaf blade, and others identified a single-point measurement method [6]. The central part of the leaf blade was generally recommended to be used for measuring chlorophyll in wheat [35,36]. Some other studies recommended making SPAD measurements at the middle or at the third quarter of the leaf blade from the tip for maize crops [37,38].
4.4. Conclusions and Future Work
This paper documented a leaf lateral asymmetry in the relationship between SPAD readings and Na of the rice leaf blade, with a closer relationship in the wide side than the narrow side. Our study demonstrated that SPAD readings should be measured on the lower-middle part from the leaf apex on the wide side of the rice leaf blade to represent the N status of the whole leaf because of the higher accuracy and better operability of SPAD measurement on the wide side than the narrow side.
SPAD and Na were studied only on the top three leaves at heading stage as photosynthesis in rice plants from heading contributes to 60–100% of the final grain carbon content [39], and the top three leaves contribute most to yield formation [39,40]. There are several nondestructive methods available that vary in complexity and optimality. In addition to SPAD, leaf color chart (LCC), normalized difference vegetation index (NDVI), and atLEAF sensors are well-documented non-destructive methods that can be easily used for determining N contents in various crops [13,30,41]. These methods have been widely adopted in crop production and research to monitor plant N status. For example, great potential for saving N by managing fertilizer N by using LCC was reported in rice [42], while others found that the SPAD meter and NDVI measurements were superior to LCC in rice because biomass was a factor in the SPAD meter and NDVI measurements, but LCC reading was not closely related to biomass [43,44]. For other crops, like Chrysanthemum, it was indicated that NDVI values exhibited higher correlation with leaf N than SPAD and atLEAF readings [30], which was presumably due to the small leaves making it difficult to accurately determine which part of the leaf was being sensed for SPAD and atLEAF sensors. However, no investigations on the relationship between LCC, NDVI, atLEAF, or other sensor values and leaf N of each lateral half have been performed. Future research will be oriented to determine the relationship between N content and sensor readings on each side of the leaf blade using these non-destructive methods with more crops.
Supplementary Materials
The following are available online at www.mdpi.com/2073-8994/9/6/83/s1, File S1: The climate data during rice growing season in Wuxue in 2014. File S2: The climate data during rice growing season in Wuhan in 2014.
Acknowledgments
This work was supported by the National High Technology Research and Development Program of China (863 Project, no. 2014AA10A605), the Programme of Introducing Talents of Discipline to Universities in China (111 Project, no. B14032), and the Fundamental Research Funds for the Central Universities (Project 2015BQ002).
Author Contributions
S.Y. and F.W. conceived and designed the experiments; S.Y., L.H. and L.W. performed the experiments; S.Y. analyzed the data; F.W. contributed reagents/materials/analysis tools; S.Y., T.G. and F.W. wrote the paper.
Conflicts of Interest
The authors declare no conflict of interest.
References
- Cassman, K.G.; Grassini, P. Can there be a green revolution in Sub-Saharan Africa without large expansion of irrigated crop production? Glob. Food Secur. 2013, 2, 203–209. [Google Scholar] [CrossRef]
- Cassman, K.G. Ecological intensification of cereal production systems: Yield potential, soil quality, and precision agriculture. Proc. Natl. Acad. Sci. USA 1999, 96, 5952–5959. [Google Scholar] [CrossRef] [PubMed]
- Fischer, R.A.; Edmeades, G.O. Breeding and cereal yield progress. Crop Sci. 2010, 50, S85–S98. [Google Scholar] [CrossRef]
- Peng, S.; Buresh, R.J.; Huang, J.; Zhong, X.; Zou, Y.; Yang, J.; Wang, G.; Liu, Y.; Hu, R.; Tang, Q.; et al. Improving nitrogen fertilization in rice by site-specific N management: A review. Agron. Sustain. Dev. 2010, 30, 649–656. [Google Scholar] [CrossRef]
- Zhang, Q.F. Strategies for developing green super rice. Proc. Natl. Acad. Sci. USA 2007, 104, 16402–16409. [Google Scholar] [CrossRef] [PubMed]
- Lin, F.F.; Deng, J.S.; Shi, Y.Y.; Chen, L.S.; Wang, K. Investigation of SPAD meter-based indices for estimating rice nitrogen status. Comput. Electron. Agric. 2010, 71, S60–S65. [Google Scholar] [CrossRef]
- Peng, S.B.; Buresh, R.J.; Huang, J.L.; Yang, J.C.; Zou, Y.B.; Zhong, X.H.; Wang, G.H.; Zhang, F.S. Strategies for overcoming low agronomic nitrogen use efficiency in irrigated rice systems in China. Field Crop. Res. 2006, 96, 37–47. [Google Scholar] [CrossRef]
- Long, S.P.; Zhu, X.G.; Naidu, S.L.; Ort, D.R. Can improvement in photosynthesis increase crop yields? Plant Cell Environ. 2006, 29, 315–330. [Google Scholar] [CrossRef] [PubMed]
- Zhu, X.G.; Long, S.P.; Ort, D.R. Improving photosynthetic efficiency for greater yield. Annu. Rev. Plant Biol. 2010, 61, 235–261. [Google Scholar] [CrossRef] [PubMed]
- Field, C.H.; Mooney, H.A. Photosynthesis-nitrogen relationship in wild plants. In On the Economy of Plant Form and Function; Givnish, T.J., Ed.; Cambridge University Press: Cambridge, UK, 1986; pp. 25–55. [Google Scholar]
- Peng, S.; Cassman, K.G.; Kropff, M.J. Relationship between leaf photosynthesis and nitrogen content of field-grown rice in the tropics. Crop Sci. 1995, 35, 1627–1630. [Google Scholar] [CrossRef]
- Peng, S.; Garcia, F.V.; Laza, R.C.; Sanico, A.L.; Visperas, R.M.; Cassman, K.G. Increased N-use efficiency using a chlorophyll meter on high-yielding irrigated rice. Field Crop. Res. 1996, 47, 243–252. [Google Scholar] [CrossRef]
- Ali, M.M.; Al-Ani, A.; Eamus, D.; Tan, D.K. Leaf Nitrogen Determination Using Non-Destructive Techniques—A Review. J. Plant Nutr. 2016, 40, 928–953. [Google Scholar] [CrossRef]
- Yang, H.; Li, J.; Yang, J.; Wang, H.; Zou, J.; He, J. Effects of nitrogen application rate and leaf age on the distribution pattern of leaf SPAD readings in the rice canopy. PLoS ONE 2014, 9, e88421. [Google Scholar] [CrossRef] [PubMed]
- Peng, S.; García, F.V.; Laza, R.C.; Cassman, K.G. Adjustment for specific leaf weight improves chlorophyll meter’s estimate of rice leaf nitrogen concentration. Agron. J. 1993, 85, 987–990. [Google Scholar] [CrossRef]
- Murchie, E.H.; Yang, J.; Hubbart, S.; Horton, P.; Peng, S. Are there associations between grain-filling rate and photosynthesis in the flag leaves of field-grown rice? J. Exp. Bot. 2002, 53, 2217–2224. [Google Scholar] [CrossRef] [PubMed]
- Sui, R.; Wilkerson, J.B.; Hart, W.E.; Wilhelm, L.R.; Howard, D.D. Multi-spectral sensor for detection of nitrogen status in cotton. Appl. Eng. Agric. 2005, 21, 167–172. [Google Scholar] [CrossRef]
- Dunn, B.L.; Shrestha, A.; Goad, C.; Khoddamzadeh, A.A. Use of optical sensors to assess Gaillardia Foug. nitrogen status. J. Appl. Hortic. 2015, 17, 181–185. [Google Scholar]
- Peng, S.; Laza, M.R.; Garcia, F.V.; Cassman, K.G. Chlorophyll meter estimates leaf area-based nitrogen concentration of rice. Commun. Soil Sci. Plant Anal. 1995, 26, 927–935. [Google Scholar] [CrossRef]
- Esfahani, M.; Abbasi, H.A.; Rabiei, B.; Kavousi, M. Improvement of nitrogen management in rice paddy fields using chlorophyll meter (SPAD). Paddy Water Environ. 2008, 6, 181–188. [Google Scholar] [CrossRef]
- Turner, F.T.; Jund, M.F. Chlorophyll meter to predict nitrogen topdress requirement for semidwarf rice. Agron. J. 1991, 83, 926–928. [Google Scholar] [CrossRef]
- Xiong, D.; Chen, J.; Yu, T.; Gao, W.; Ling, X.; Li, Y.; Peng, S.; Huang, J. SPAD-based leaf nitrogen estimation is impacted by environmental factors and crop leaf characteristics. Sci. Rep. 2015, 5, 13389. [Google Scholar] [CrossRef] [PubMed]
- Godfray, H.C.; Beddington, J.R.; Crute, I.R.; Haddad, L.; Lawrence, D.; Muir, J.F.; Pretty, J.; Robinson, S.; Thomas, S.M.; Toulmin, C. Food security: The challenge of feeding 9 billion people. Science 2010, 327, 812–818. [Google Scholar] [CrossRef] [PubMed]
- Li, J.W.; Yang, J.P.; Fei, P.P.; Song, J.; Li, D.S.; Ge, C.S.; Chen, W.Y. Responses of rice leaf thickness, SPAD readings and chlorophyll a/b ratios to different nitrogen supply rates in paddy field. Field Crop. Res. 2009, 114, 426–432. [Google Scholar]
- Yuan, Z.; Cao, Q.; Zhang, K.; Ata-Ul-Karim, S.T.; Tian, Y.; Zhu, Y.; Cao, W.; Liu, X. Optimal Leaf Positions for SPAD Meter Measurement in Rice. Front. Plant Sci. 2016, 7, 719. [Google Scholar] [CrossRef] [PubMed]
- Yuan, S.; Li, Y.; Peng, S. Leaf Lateral Asymmetry in Morphological and Physiological Traits of Rice Plant. PLoS ONE 2015, 10, e0129832. [Google Scholar] [CrossRef] [PubMed]
- Wang, S.; Zhu, Y.; Jiang, H.; Cao, W. Positional differences in nitrogen and sugar concentrations of upper leaves relate to plant N status in rice under different N rates. Field Crop. Res. 2006, 96, 224–234. [Google Scholar] [CrossRef]
- Yang, H.; Yang, J.; Lv, Y.; He, J. SPAD values and nitrogen nutrition index for the evaluation of rice nitrogen status. Plant Prod. Sci. 2014, 17, 81–92. [Google Scholar] [CrossRef]
- Chapman, S.C.; Barreto, H.J. Using a chlorophyll meter to estimate specific leaf nitrogen of tropical maize during vegetative growth. Agron. J. 1997, 89, 557–562. [Google Scholar] [CrossRef]
- Khoddamzadeh, A.A.; Dunn, B.L. Application of canopy sensors for nitrogen assessment management in chrysanthemum. HortScience 2016, 51, 915–920. [Google Scholar]
- Uddling, J.; Gelang-Alfredsson, J.; Piikki, K.; Pleijel, H. Evaluating the relationship between leaf chlorophyll concentration and SPAD-502 chlorophyll meter readings. Photosynth. Res. 2007, 91, 37–46. [Google Scholar] [CrossRef] [PubMed]
- Ishii, R. Photosynthesis and respiration in a single leaf. In Science of the Rice Plant: Physiology; Matsuo, T., Kumazawa, K., Ishii, R., Ishihara, K., Hirata, H., Eds.; Food and Agriculture Policy Research Center: Tokyo, Japan, 1995; pp. 491–495. [Google Scholar]
- Zhou, Q.; Wang, J. Comparison of upper leaf and lower leaf of rice plants in response to supplemental nitrogen levels. J. Plant Nutr. 2003, 26, 607–617. [Google Scholar] [CrossRef]
- Ata-Ul-Karim, S.T.; Yao, X.; Liu, X.; Cao, W.; Zhu, Y. Development of critical nitrogen dilution curve of Japonica rice in Yangtze River Reaches. Field Crop. Res. 2013, 149, 149–158. [Google Scholar] [CrossRef]
- Matsunaka, T.; Watanabe, Y.; Miyawaki, T.; Ichikawa, N. Prediction of grain protein content in winter wheat through leaf color measurements using a chlorophyll meter. Soil Sci. Plant Nutr. 1997, 43, 127–134. [Google Scholar] [CrossRef]
- Debaeke, P.; Rouet, P.; Justes, E. Relationship between the normalized SPAD index and the nitrogen nutrition index: Application to durum wheat. J. Plant Nutr. 2006, 29, 75–92. [Google Scholar] [CrossRef]
- Fox, R.H.; Piekielek, W.P.; Macneal, K.E. Comparison of late-season diagnostic tests for predicting nitrogen status of corn. Agron. J. 2001, 93, 590–597. [Google Scholar] [CrossRef]
- Víg, R.; Huzsvai, L.; Dobos, A.; Nagy, J. Systematic measurement methods for the determination of the SPAD values of maize (Zea mays L.) canopy and potato (Solanum tuberosum L.). Commun. Soil Sci. Plant Anal. 2012, 43, 684–1693. [Google Scholar] [CrossRef]
- Yoshida, S. Physiological analysis of rice yield. In Fundamentals of Rice Crop Science; International Rice Research Institute: Makita City, Philippines, 1981; pp. 231–251. [Google Scholar]
- Mae, T. Physiological nitrogen efficiency in rice: Nitrogen utilization, photosynthesis, and yield potential. Plant Soil 1997, 196, 201–210. [Google Scholar] [CrossRef]
- Dunn, B.L.; Goad, C. Effect of foliar nitrogen and optical sensor sampling method and location for determining ornamental cabbage fertility status. HortScience 2015, 50, 74–77. [Google Scholar]
- Singh, B.; Singh, V.; Singh, Y.; Thind, H.S.; Kumar, A.; Gupta, R.K.; Kaul, A.; Vashistha, M. Fixed-time adjustable dose site-specific fertilizer nitrogen management in transplanted irrigated rice (Oryza sativa L.) in South Asia. Field Crop. Res. 2012, 126, 63–69. [Google Scholar] [CrossRef]
- Ramesh, K.; Chandrasekaran, B.; Balasubramanian, T.N.; Bangarusamy, U.; Sivasamy, R.; Sankaran, N. Chlorophyll dynamics in rice (Oryza sativa) before and after flowering based on spad (chlorophyll) meter monitoring and its relation with grain yield. J. Agron. Crop Sci. 2002, 188, 102–105. [Google Scholar] [CrossRef]
- Ali, A.M.; Thind, H.S.; Sharma, S.; Singh, V. Prediction of dry direct-seeded rice yields using chlorophyll meter, leaf color chart and greenseeker optical sensor in northwestern India. Field Crop. Res. 2014, 161, 11–15. [Google Scholar] [CrossRef]
Figure 1.
SPAD readings were taken at seven points (i.e., the 1st, 2nd, 3rd, 4th, 5th, 6th, and 7th measured points) from the leaf apex to the base along the leaf blade of each side, which represents 1/8, 1/4, 3/8, 1/2, 5/8, 3/4, and 7/8 of the distance from the leaf apex to the base, respectively.
Figure 1.
SPAD readings were taken at seven points (i.e., the 1st, 2nd, 3rd, 4th, 5th, 6th, and 7th measured points) from the leaf apex to the base along the leaf blade of each side, which represents 1/8, 1/4, 3/8, 1/2, 5/8, 3/4, and 7/8 of the distance from the leaf apex to the base, respectively.
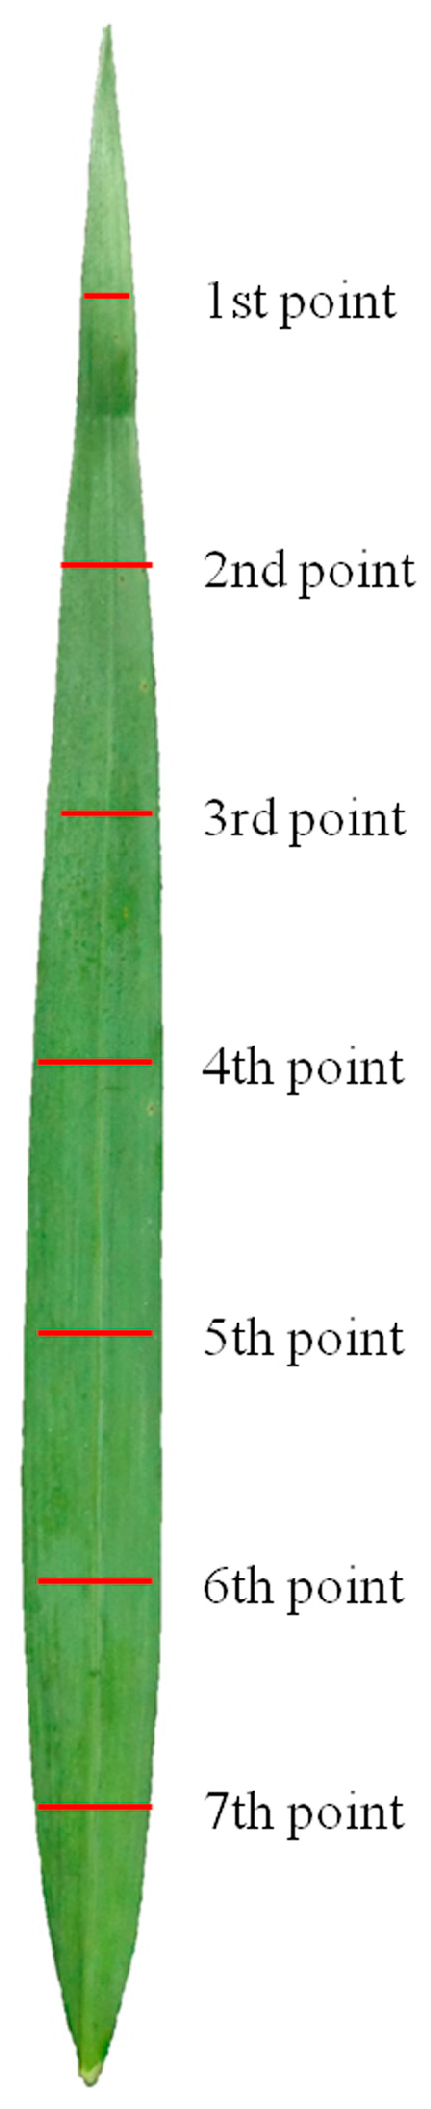
Figure 2.
SPAD readings at different points of top three leaves. SPAD readings of the wide and narrow sides at seven measured points for the top three leaves. Each data point represents the mean of 30 study cases with four replications and three subsamples per replication in 2014. Error bars represent the standard error (SE) across 12 leaves. LFT1–3 represents the first, second, and third fully-expanded leaf from the top, respectively.
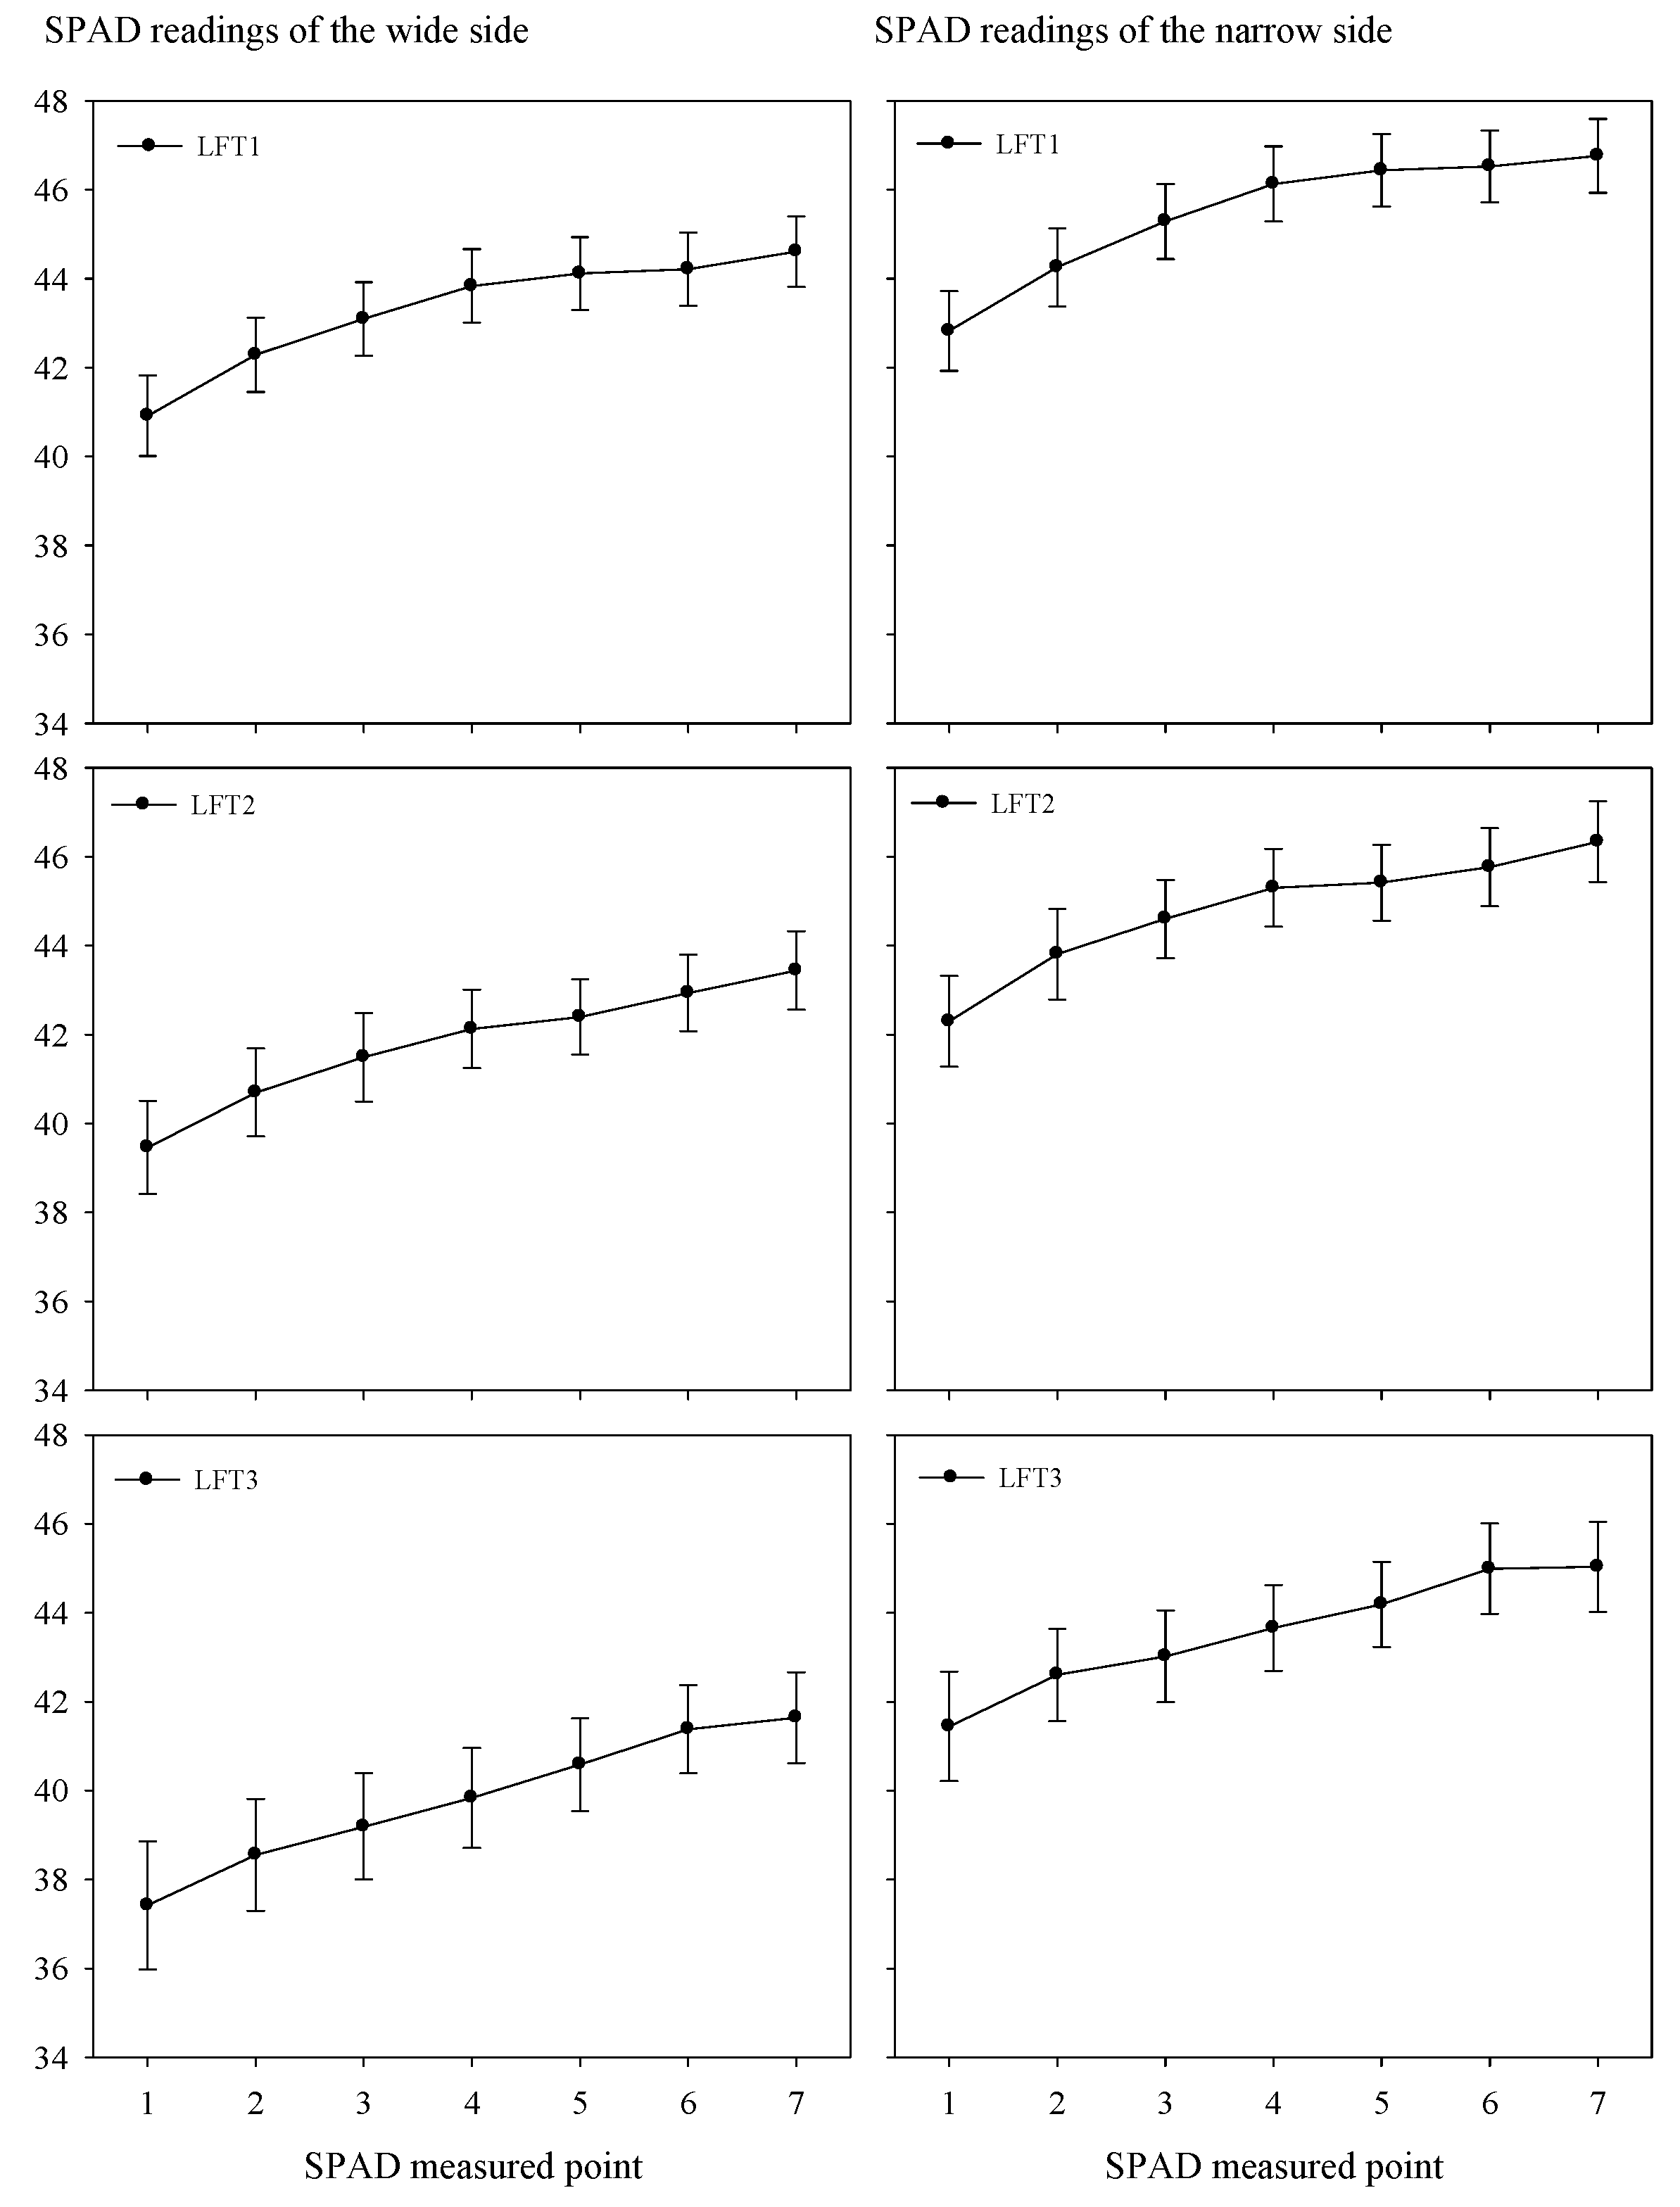
Figure 3.
Standard deviation and coefficient of variation across measured points. Standard deviation and coefficient of variation (%) of the SPAD readings across seven measured points within a leaf (n = 7). The SD and CV values are the average of 30 study cases with four replications and three subsamples per replication (n = 360). LFT1–3 represents the first, second, and third fully-expanded leaf from the top, respectively.

Figure 4.
Standard deviation and coefficient of variation across leaves. Standard deviation and coefficient of variation (%) of the SPAD readings from 12 leaves within a variety (n = 12). The SD and CV values are the average of 30 study cases (n = 30). LFT1–3 represents the first, second, and third fully expanded leaf from the top, respectively.


Table 1.
Soil properties of the top 0–20 cm layer in four experimental fields at Wuxue and Wuhan, Hubei Province, China, in 2014.
Table 1.
Soil properties of the top 0–20 cm layer in four experimental fields at Wuxue and Wuhan, Hubei Province, China, in 2014.
| Location | Season | pH | Organic Matter | Total N | Olsen-P | Available K |
|---|---|---|---|---|---|---|
| g kg−1 | g kg−1 | mg kg−1 | mg kg−1 | |||
| Wuxue | Early | 5.29 | 22.57 | 2.08 | 18.84 | 111.6 |
| Middle | 5.60 | 27.18 | 1.83 | 4.91 | 105.8 | |
| Late | 5.36 | 21.19 | 1.93 | 13.35 | 63.2 | |
| Wuhan | Middle | 6.40 | 10.12 | 0.81 | 7.56 | 146.4 |
Table 2.
Information of rice cultivars grown in the early, middle, and late rice growing seasons in Wuxue and Wuhan, Hubei Province, China, in 2014.
Table 2.
Information of rice cultivars grown in the early, middle, and late rice growing seasons in Wuxue and Wuhan, Hubei Province, China, in 2014.
| Number | Cultivar | Location | Season | Type |
|---|---|---|---|---|
| 1 | Liangyou287 | Wuxue | Early/Late | Hybrid |
| 2 | Zhongjiazao17 | Wuxue | Early/Late | Inbred |
| 3 | Ezao17 | Wuxue | Early/Late | Inbred |
| 4 | Ezao18 | Wuxue | Early/Late | Inbred |
| 5 | Huanghuazhan | Wuxue/Wuhan | Middle | Inbred |
| 6 | Zhuliangyou35 | Wuxue/Wuhan | Middle | Hybrid |
| 7 | Zhongzu14 | Wuxue/Wuhan | Middle | Hybrid |
| 8 | 9you6 | Wuxue/Wuhan | Middle | Hybrid |
| 9 | Guangliangyou5 | Wuxue/Wuhan | Middle | Hybrid |
| 10 | Quanyou982 | Wuxue/Wuhan | Middle | Hybrid |
| 11 | Rongfengyou41 | Wuxue/Wuhan | Middle | Hybrid |
| 12 | Wuyouhang1573 | Wuxue/Wuhan | Middle | Hybrid |
| 13 | Huiliangyou630 | Wuxue/Wuhan | Middle | Hybrid |
| 14 | Huiliangyou858 | Wuhan | Middle | Hybrid |
| 15 | Xiangzao45 | Wuxue | Late | Inbred |
| 16 | Wandao143 | Wuxue | Late | Inbred |
| 17 | Xiangzaoxian6 | Wuxue | Late | Inbred |
Table 3.
Quadratic regression analyses between SPAD readings and leaf area-based nitrogen concentrations (Na) of the corresponding lateral halves at each measured point of the two sides for the top three rice leaves in 2014.
Table 3.
Quadratic regression analyses between SPAD readings and leaf area-based nitrogen concentrations (Na) of the corresponding lateral halves at each measured point of the two sides for the top three rice leaves in 2014.
| Leaf | Point | Regression Equation | R2 | ||||
|---|---|---|---|---|---|---|---|
| Wide | Narrow | Whole | Wide | Narrow | Whole | ||
| 1 | 1 | y = 0.049x − 0.250 | y = 0.050x − 0.259 | y = 0.051x − 0.300 | 0.58 * | 0.44 * | 0.57 * |
| 2 | y = 0.050x − 0.343 | y = 0.050x − 0.347 | y = 0.051x − 0.405 | 0.64 * | 0.53 * | 0.65 * | |
| 3 | y = 0.049x − 0.321 | y = 0.051x − 0.456 | y = 0.050x − 0.409 | 0.67 * | 0.61 * | 0.70 * | |
| 4 | y = 0.051x − 0.454 | y = 0.050x − 0.458 | y = 0.051x − 0.481 | 0.71 * | 0.64 * | 0.74 * | |
| 5 | y = 0.049x − 0.393 | y = 0.047x − 0.361 | y = 0.049x − 0.408 | 0.75 * | 0.66 * | 0.77 * | |
| 6 | y = 0.051x − 0.477 | y = 0.050x − 0.499 | y = 0.052x − 0.567 | 0.74 * | 0.66 * | 0.78 * | |
| 7 | y = 0.053x − 0.579 | y = 0.051x − 0.574 | y = 0.052x − 0.599 | 0.69 * | 0.69 * | 0.74 * | |
| Ave4–6 | y = 0.051x − 0.480 | y = 0.050x − 0.476 | y = 0.051x − 0.512 | 0.75 * | 0.66 * | 0.77 * | |
| 2 | 1 | y = 0.047x − 0.432 | y = 0.039x − 0.067 | y = 0.044x − 0.292 | 0.51 * | 0.41 * | 0.47 * |
| 2 | y = 0.046x − 0.433 | y = 0.046x − 0.461 | y = 0.048x − 0.522 | 0.58 * | 0.47 * | 0.58 * | |
| 3 | y = 0.050x − 0.639 | y = 0.049x − 0.650 | y = 0.051x − 0.694 | 0.68 * | 0.57 * | 0.66 * | |
| 4 | y = 0.057x − 0.956 | y = 0.059x − 1.136 | y = 0.060x − 1.115 | 0.71 * | 0.67 * | 0.73 * | |
| 5 | y = 0.053x − 0.823 | y = 0.051x − 0.782 | y = 0.054x − 0.881 | 0.74 * | 0.69 * | 0.76 * | |
| 6 | y = 0.058x − 1.035 | y = 0.054x − 0.913 | y = 0.057x − 1.061 | 0.72 * | 0.71 * | 0.74 * | |
| 7 | y = 0.054x − 0.919 | y = 0.050x − 0.745 | y = 0.054x − 0.916 | 0.69 * | 0.63 * | 0.70 * | |
| Ave4–6 | y = 0.058x − 1.012 | y = 0.057x − 1.052 | y = 0.059x − 1.100 | 0.75 * | 0.72 * | 0.77 * | |
| 3 | 1 | y = 0.032x + 0.004 | y = 0.031x + 0.063 | y = 0.033x − 0.001 | 0.63 * | 0.53 * | 0.56 * |
| 2 | y = 0.031x + 0.016 | y = 0.033x − 0.062 | y = 0.032x − 0.024 | 0.67 * | 0.52 * | 0.62 * | |
| 3 | y = 0.033x − 0.074 | y = 0.038x − 0.299 | y = 0.036x − 0.196 | 0.72 * | 0.57 * | 0.69 * | |
| 4 | y = 0.036x − 0.223 | y = 0.048x − 0.769 | y = 0.041x − 0.437 | 0.79 * | 0.70 * | 0.76 * | |
| 5 | y = 0.042x − 0.485 | y = 0.051x − 0.918 | y = 0.046x − 0.679 | 0.82 * | 0.69 * | 0.79 * | |
| 6 | y = 0.046x − 0.674 | y = 0.053x − 1.004 | y = 0.049x − 0.852 | 0.79 * | 0.73 * | 0.80 * | |
| 7 | y = 0.048x − 0.781 | y = 0.049x − 0.820 | y = 0.049x − 0.823 | 0.74 * | 0.65 * | 0.73 * | |
| Ave4–6 | y = 0.042x − 0.470 | y = 0.052x − 0.968 | y = 0.046x − 0.675 | 0.81 * | 0.73 * | 0.80 * | |
Wide, Narrow, and Whole represent the regression between SPAD on the wide side and Na of the wide lateral half, between SPAD on the narrow side and Na of the narrow lateral half, and between the average SPAD and Na of the whole leaf, respectively. * significant at the 0.01 probability level.
© 2017 by the authors. Licensee MDPI, Basel, Switzerland. This article is an open access article distributed under the terms and conditions of the Creative Commons Attribution (CC BY) license (http://creativecommons.org/licenses/by/4.0/).
Share and Cite
MDPI and ACS Style
Yuan, S.; Goron, T.L.; Huang, L.; Wu, L.; Wang, F. Rice Leaf Lateral Asymmetry in the Relationship between SPAD and Area-Based Nitrogen Concentration. Symmetry 2017, 9, 83. https://doi.org/10.3390/sym9060083
AMA Style
Yuan S, Goron TL, Huang L, Wu L, Wang F. Rice Leaf Lateral Asymmetry in the Relationship between SPAD and Area-Based Nitrogen Concentration. Symmetry. 2017; 9(6):83. https://doi.org/10.3390/sym9060083
Chicago/Turabian StyleYuan, Shen, Travis Luc Goron, Liying Huang, Lilian Wu, and Fei Wang. 2017. "Rice Leaf Lateral Asymmetry in the Relationship between SPAD and Area-Based Nitrogen Concentration" Symmetry 9, no. 6: 83. https://doi.org/10.3390/sym9060083
Note that from the first issue of 2016, this journal uses article numbers instead of page numbers. See further details here.