Fuzzy System-Based Fear Estimation Based on the Symmetrical Characteristics of Face and Facial Feature Points

Division of Electronics and Electrical Engineering, Dongguk University, 30 Pildong-ro 1-gil, Jung-gu, Seoul 100-715, Korea
*
Author to whom correspondence should be addressed.
Symmetry 2017, 9(7), 102; https://doi.org/10.3390/sym9070102
Submission received: 24 May 2017
/
Revised: 27 June 2017
/
Accepted: 28 June 2017
/
Published: 30 June 2017
Abstract
:The application of user emotion recognition for fear is expanding in various fields, including the quantitative evaluation of horror movies, dramas, advertisements, games, and the monitoring of emergency situations in convenience stores (i.e., a clerk threatened by a robber), in addition to criminal psychology. Most of the existing methods for the recognition of fear involve referring to a single physiological signal or recognizing circumstances in which users feel fear by selecting the most informative one among multiple physiological signals. However, the level of accuracy as well as the credibility of these study methods is low. Therefore, in this study, data with high credibility were obtained using non-intrusive multimodal sensors of near-infrared and far-infrared light cameras and selected based on t-tests and Cohen’s d analysis considering the symmetrical characteristics of face and facial feature points. The selected data were then combined into a fuzzy system using the input and output membership functions of symmetrical shape to ultimately derive a new method that can quantitatively show the level of a user’s fear. The proposed method is designed to enhance conventional subjective evaluation (SE) by fuzzy system based on multi-modalities. By using four objective features except for SE and combining these four features into a fuzzy system, our system can produce an accurate level of fear without being affected by the physical, psychological, or fatigue condition of the participants in SE. After conducting a study on 20 subjects of various races and genders, the results indicate that the new method suggested in this study has a higher level of credibility for the recognition of fear than the methods used in previous studies.
1. Introduction
User emotion recognition is used in a myriad of applications, such as human–robot interface (HRI) and advanced driver assistance systems (ADAS) [1,2]. Among these, the level of need for recognition of fear is increasing [3,4,5,6,7] in applications like the quantitative evaluation of commercial horror movies, dramas, advertisements, games, and the monitoring of emergency situations in convenience stores (i.e., a clerk threatened by a robber), in addition to criminal psychology. The main application of our system is for the quantitative evaluation of the level of fear induced by commercial horror movies.
The existing methods used to recognize fear involve using information on blood pressure variability (BPV), heart rate variability (HRV), respiration rate (RR), skin conductance (SC), and electromyography (EMG) of study subjects by attaching sensors to their bodies or using their electroencephalography (EEG) data. However, in such cases, study subjects are required to have sensors attached to their bodies during studies. To address these issues, methods exist that allow the recognition of fear using contactless sensors such as voice recognition sensors, visible light cameras, and thermal cameras among others. Detailed information on these methods is presented in Section 2.
2. Related Works
There are two major categories of methods for the recognition of emotions including fear: single modality-based methods and multiple modality-based methods. Single modality-based methods include visible light camera-based methods [8,9,10,11,12,13,14,15], thermal camera-based methods [16,17], voice-based methods [2,12,13,14,18,19], physiological signal-based methods [20,21,22,23,24,25], and functional magnetic resonance imaging (fMRI)-based methods [26]. As for visible light camera-based methods, images of subjects’ facial expression at different emotions are captured by a camera and the generated data used to study the information on subjects’ facial expression (changes in facial feature points by comparison between previous image frames and present image frames, etc.) [8,9,10,11,12,13,14,15].
These visible light camera-based methods are advantageous in that the instruments required for data acquisition are much more affordable than those required for thermal camera- and physiological-signal-based methods. In addition, since they use contactless sensors, they are suitable for use in circumstances where study subjects need to be unaware of the ongoing study or where it is difficult to attach contact sensors to subjects. However, when using the visible light camera-based methods, a separate near-infrared (NIR) lighting is required as it is difficult to identify facial feature points of subjects in dark rooms or dark environments. It may also be hard to obtain image data on changes in facial expression of subjects who do not express their emotions through facial expressions.
For thermal camera-based methods, unlike visible light camera-based methods, they are suitable for obtaining data even in dark rooms or dark environments and are able to observe and recognize emotional changes in study subjects by detecting facial temperature changes even if subjects do not express emotions through facial expression change [16,17]. In other words, pixel values obtained from thermal images provide thermal data by recording temperature even in poor lighting conditions (dark rooms and dark environments) and accordingly allow the recognition of subjects’ emotions by detecting facial temperature changes that result from heat generation and absorption by physiologic activities that occur whenever subjects experience emotional change. However, as mentioned earlier, thermal cameras are costlier than visible light cameras. It is also more difficult to obtain accurate data on facial feature points solely by thermal cameras as they are unable to clearly distinguish facial feature points such as the eyes, nose, and mouth from surrounding facial skin in images. Therefore, manual marking has been conducted to identify facial feature points in obtained images by thermal cameras [16,17]. In addition, visible light cameras are jointly used with thermal cameras to identify facial feature points with correlations of changes in location of the two groups of cameras, studied through prior calibration. Based on the data obtained from this calibration, coordinates of the location of facial feature points identified through visible light cameras were mapped onto the images obtained by thermal cameras to identify the facial feature points in them [27].
For voice-based methods, the instruments required for obtaining data are more affordable than those required for visible light cameras or thermal cameras. They also allow for easier operation due to the use of contactless sensors and explicit changes according to subjects’ emotions, observed in input data. They, however, also have a disadvantage in that they are susceptible to surrounding noise [2,12,13,14,18,19]. For physiological-signal-based methods, they are operated based on electrocardiography (ECG), EEG, skin temperature (SKT), HR, RR, etc., and allow the acquisition of real-time data on emotional changes with high levels of accuracy when using high-cost instruments. However, they also have a disadvantage in that the level of accuracy of the instruments varies greatly depending on their price level. Hence, the use of low-cost instruments may undermine the credibility of data in a study [20,21,22,23,24,25,28]. In the case of the fMRI-based method, the anger felt by study subjects was recognized through fMRI, and it was demonstrated that it is possible to analyze the response to fear by studying neural responses to anger [26]. This method indicates accurate measurement value for emotional change, but the required instruments are costly and large in size such that it is difficult to use them in varied environments. In a previous study on the state of fear [27], changes in facial temperature, subjective evaluation, EEG, and eye blinking rate of subjects were measured and a further study was conducted to analyze the modality that best reflected the state of fear among all parameters. However, studies to enhance the accuracy of evaluation of the state of fear by combining the resulting values of each modality have not been conducted. In addition, there are other issues in which the credibility of data obtained through EEG was undermined by the use of low-cost EEG sensors. There have also been issues regarding the accuracy of recognition of the state of fear of study subjects, using eye-blinking rate (EBR) as the only reference among many other changes in feature points that can be observed on subjects’ faces.
Due to such disadvantages of single modality-based methods, studies have been conducted on multiple modality-based methods that involve the use of two or more sensors to measure emotions including fear [29,30]. Cheng et al. conducted a study on emotion recognition using a support vector machine (SVM) that combined data based on photoplethysmography (PPG), EMG, ECG, galvanic skin response (GSR), temperature, etc. [29]. Chun et al. also conducted a study of the same sort by combining data on physiological signals, such as SC, BPV, skin temperature (ST), EMG, respiration, etc. through adaptive boosting (Adaboost), bagging, and boosting-based ensemble learning methods [30]. These multiple modality-based methods allow improvement in the credibility of data by combining data obtained from two or more sources and, accordingly, have a higher recognition accuracy compared to single modality-based methods. However, these studies [29,30] also used multiple contact sensors, with all the aforementioned disadvantages of physiological signal-based methods: discrepancy in the level of accuracy of instruments depending on their price level, user convenience of study subjects, sensor noise generated by movements among others.
In order to address these issues, this study proposes a new method that involves using non-intrusive multimodal sensors to obtain multiple data considering the symmetrical characteristics of face and facial feature points, selecting high-credibility data based on t-tests, combining the selected data into a fuzzy system using the membership functions of symmetrical shape, and ultimately, indicating a quantitative level of users’ fear. The proposed method is designed to enhance conventional subjective evaluation (SE) by fuzzy system based on multi-modalities. By using four objective features except for SE and combining these four features by fuzzy system, our system can produce the accurate level of fear not affected by the physical, psychological or fatigue condition of participants on SE. Our research is novel in the following four ways compared to previous work:
- -
- We observed the changes in multiple facial feature points in users while using a reference image that evokes neutral emotions and other images that evoke fear in subjects, with the use of contactless sensors such as thermal (far-infrared (FIR)) and NIR cameras.
- -
- With images obtained by thermal cameras, two feature values that derive from changes in facial temperature (FT) and facial temperature-based heart rate (HR) were measured. In addition, based on 68 facial feature points that were automatically detected on the faces of subjects using NIR cameras, five feature values of EBR, Euclidean distance change between left and right lip corners (DLRL), Euclidean distance change between upper and lower lips (DULL), eyebrow movement (EM), and nose movement (NM) were measured. The SE by users was also measured as a feature value.
- -
- Through t-tests and Cohen’s d analysis on the aforementioned eight feature values of the state of fear compared to when in the neutral state, four feature values (DLRL, EM, FT, and SE) with p-values <0.05 (95% confidence interval (CI)) and high Cohen’s d values were selected as feature values with credibility. To compare the case only with objective features except for subjective one of SE, the system performance using four feature values (DLRL, EM, FT, and HR) were also evaluated.
- -
- The four selected feature values were combined and used as input data to a fuzzy system to improve the level of accuracy and credibility for recognition of subjects’ fear. At this stage, the level of accuracy for recognition of fear in subjects was improved by applying the weighted values from a fuzzy rule table differently based on correlation sum-based credibility between the four feature values. In addition, the training procedure was minimized by using a fuzzy system instead of other methods such as SVM that require training procedures with lots of data or ensemble learning. Furthermore, the dependence of system performance on training data was minimized.
Table 1 shows a comparison between the proposed and previous methods.
3. Proposed Method
3.1. Overall Procedure of Proposed Method
Figure 1 represents a flowchart of a recognition method for fear based on a fuzzy system proposed in this study. First, in Step 1, pre-subjective evaluation is conducted to identify study subjects’ current state of emotion. Here, subjects are required to respond to a question that asks them to rate their state of fear on a scale of 1 to 5. Detailed information on the question is presented in Section 3.5. In Step 2, the FT and HR of subjects are measured using thermal cameras for 1 min, and at the same time, NIR light cameras are used to measure their EBR, DLRL, DULL, EM, and NM. Then in Step 3, subjects view images that evoke neutral emotion or horror movies that evoke fear for 5 min and the aforementioned seven feature values (FT, HR, EBR, DLRL, DULL, EM, and NM) are measured throughout the process. Then in Step 4, the seven feature values of the subjects are measured once again while they are not subjected to any images or movies. Lastly, in Step 5, a post-subjective evaluation is conducted.
On completion of Step 5, there is a 10-min recess followed by a series of studies conducted in the order of Step 1 through 5: one study in which subjects watch neutral images in Step 3 and three repetitive studies in which they watch horror movies to obtain data. Detailed information on the study protocols is provided in Section 4. Subsequently in Step 6, among the seven feature values measured in the previous steps and eight feature values including SE, four feature values with high credibility are selected based on t-tests [31] and Cohen’s d analysis [32] to be incorporated into a fuzzy system. At this stage, the level of accuracy for recognition of fear is improved by applying the weighted values from a fuzzy rule table differently based on correlation sum-based credibility between the four feature values. It is then possible to identify the final level of recognition of the user’s fear based on output values of the fuzzy system obtained in Step 7.
Figure 2 represents the environmental conditions adopted in this study for the recognition of subjects’ fear. Study subjects were asked to be seated and watch neutral images or horror movies displayed on TV; at the same time, data on the subjects were obtained through NIR and thermal cameras. In this study, a dual camera system of NIR and thermal cameras were used to measure the subjects’ FT. The heat energy generated in the human body and face can be observed at medium-wave IR (MWIR) and long-wave IR (LWIR) sub-bands, so these sub-bands are referred to as thermal sub-bands. The images obtained from these sub-bands are then referred to as thermal images. FLIR Tau2 640 thermal cameras were used in the study. This camera model has a spectral range from 7.5 to 13.5 μm, which corresponds to the MWIR upper range and most of the LWIR range. Thermal image resolution was 640 × 480 pixels and images were stored with 14 bits of data per pixel. The scene range (high gain) was –25 °C to +135 °C [33].
In order to use an NIR camera, the NIR cutting filter integrated in Logitech C600 web-camera [34] was removed and an NIR passing filter was attached in front of the camera lens as an additional component. Images (of size 640 × 480 pixels) were captured at 30 frames/s. In the three repetitive “Currently Watching Horror-video” sub-studies conducted as part of this study, all the lights in the study environment were turned off to maximize the horror atmosphere. Images were obtained through NIR cameras in such dark environments. Additional NIR lighting was required in order to identify facial feature points of the subjects in the captured images, but this lighting had to have no influence on subjects’ emotion or vision. Taking this into consideration, an NIR illuminator consisting of an 8 × 8 NIR light emitting diode (LED) array [35] was additionally used in this study, as depicted in Figure 2. Furthermore, an 850 nm wavelength NIR LED was used to prevent dazzling as well as other effects that may impair subjects’ vision.
3.2. Camera Calibration between NIR and Thermal Cameras
As seen in Figure 3, images obtained by thermal cameras fail to clearly depict facial feature points such as eyes and mouth on average, making it hard to designate regions of interest (ROIs) for FT measurement. Therefore, in this study, facial images obtained by NIR cameras were used to extract facial feature points, which were then used as reference data for location of the points to designate ROIs in the images simultaneously captured by thermal cameras for FT measurement. To do this, a dual camera system in which NIR cameras and thermal cameras were both attached was used as in Figure 3. In our system, the thermal and NIR cameras are attached inside one small box whose size is 9.5 × 5.5 × 3.7 cm3 in width, height, and depth, respectively. Just for visibility, we removed the front, left, right, and upper panels of the box, as shown in Figure 2 and Figure 3.
The locations of ROIs determined based on the facial feature points of the subjects identified in the NIR camera images need to be mapped onto thermal camera images. However, as seen in Figure 3, the viewing angles of the two cameras vary and their optical axes are not consistent either. Therefore, in this study, the geometric transform matrix between the two cameras was calculated through camera calibration and the calculated values were used as a basis for mapping the facial feature points.
As shown in Figure 4, a checker board with four square blocks empty at the four respective corners of the board is attached in front of the monitor that generates heat to obtain images through a dual camera system as in Figure 3. From this, four calibration points ((, ), (, ), (, ), and (, )) of the checker board can be observed on NIR camera images (images on the left) and another set of four calibration points ((, ), (, ), (, ), and (, )), on thermal camera images (images on the right) as heat is generated through the empty holes. These two sets of calibration points are used to create Equations (1) and (2), which are used to calculate a geometric transform matrix consisting of eight unknown parameters: the conversion matrix between the two image sets.
3.3. Measurement of FT and HR by Thermal Camera as Feature Values 1 and 2
Afterwards, as shown in Figure 5, the coordinates of each corner of the ROI (,) designated on the NIR camera images are compared with Equation (3) to obtain the corresponding coordinates () on thermal camera images. These coordinates are then designated as ROI for FT measurement on the thermal camera images.
The ROIs for FT measurement on subjects’ faces were designated with reference to existing studies [16,17]. In the existing studies [16,17], facial feature points and ROIs for FT measurement on thermal camera images were manually selected, and as a result, there were issues such as the designation of ROIs being inconsistent and excessively time-consuming. In this study, however, the five ROIs for the FT measurement were automatically designated by the use of a dual camera system as in Figure 5 and the aforementioned issues were solved. Considering the symmetrical characteristics of face, the five ROIs are determined symmetrically based on the vertical axis of the nostril center, as shown in Figure 5.
Upon study subjects’ viewing of neutral images and horror movies, changes in magnitudes at the five ROIs were observed and compared with one another. As a result, the change of FT before and after watching horror movies was observed to be more significant than the change of FT before and after watching neutral images. The result and analysis details of FT measurement for each ROI are shown in Section 4.
As another feature worth noting, this study also examined HR based on changes in FT. The results of existing studies suggest that cardiac signals determining human HR could be measured based on changes in pixel values of the images obtained by remote cameras [38]. In this study [38], subjects’ HR was measured based on changes in brightness value in facial regions captured in thermal camera images. Heart beats are accompanied by changes in blood flow, which in turn allows thermal cameras to measure temperature changes that follow accordingly. The changing values of FT over time at the five ROIs, as noted in Figure 5b, were measured, converted into discrete Fourier transform (DFT), and used to measure the magnitude of the signal at the bandwidth of 0.7–2.5 Hz. The reason for measuring the bandwidth of 0.7–2.5 Hz is due to the fact that it corresponds to a human heartbeat of 42–150 beats/min [38].
When measuring feature values 1 (FT) and 2 (HR), values calculated based on the average FT value of the five ROIs were used for feature values 1 and 2, respectively, in order to reduce the influence of partial changes in FT in the facial region. In detail, if we use the FT calculated from the specific regions of the five ROIs of Figure 5b, for example, middle of forehead or left cheek, it can be affected by the change of environmental (temperature or humidity, etc.) and user’s physical factors. In addition, these five ROIs are determined based on the detected facial feature points, and there can be small variations in the positions of five ROIs according to the variations of the detected feature points, which can produce small changes in FT. Because the FTs of five ROIs usually show similar trends in experiments of watching horror movies, as shown in Table 5 and Figure 12, we use the average FT values of all the FTs measured from five ROIs in our research to reduce these problems. The results and analysis details are given in Section 4.
3.4. Measurement of EBR, DLRL, DULL, EM, and NM (Feature Values 3–7) by NIR Cameras
In this study, EBR, DLRL, DULL, EM, and NM are used as feature values 3 through 7. For this, facial feature points need to be extracted from the facial region on NIR camera images. For the extraction of feature points, dlib facial feature point tracking code [39]—an open-source code developed based on [40]—was used in this study. This is an enhanced method for facial feature tracking with an ensemble of regression trees compared to the conventional active appearance model (AAM). As in Figure 6, a total of 68 feature points including eyebrows, eyelids, nose, lips, and chin lines were automatically extracted.
The findings of the study suggest that there was a change in movement of facial feature points such as eyes, nose, and mouth in response to various changes in emotions [41]. Therefore, in this study, EBR, DLRL, DULL, and EM were measured based on the extracted 68 feature points as in Figure 6.
In order to measure EBR, the state of eye blink (EB) based on open and closed states must be evaluated first. In this study, whenever the Y distance (vertical distance) of points 38 (point of upper left eyelid) and 40 (point of left-lower eyelid), or points 43 (point of right-upper eyelid) and 47 (point of lower right eyelid) in Figure 6 fell to 1 pixel or below, the state of the eyes was observed to have changed from an open state to a closed state. This was marked as an EB instance. Based on these data, the total number of EB instances observed during measurement was divided by the number of image frames to obtain EBR, calculated as the number of EBs per image frame.
In general, subjects were often frightened or frowning in the state of fear, which led to changes in the shape of their mouths. Based on this, in this study, using the extracted points 48 (left lip corner) and 54 (right lip corner) as in Figure 6a, the average value of the experimental images in Euclidean distance between these two points was calculated to measure DLRL. Considering the symmetrical change of user’s facial feature points in the state of fear, both the points 48 and 54 are used for measuring DLRL.
In addition, based on the extracted points 62 (center point of lower boundary of upper lip) and 66 (center point of upper boundary of lower lip), the average value of the experimental images in Euclidean distance between these two points was calculated to measure DULL. Furthermore, the average value of the Euclidean distance between points 17 and 26, extracted from the eyebrow region of both eyes and the center of nose point 30, was calculated, and the average value of the experimental images was used to calculate EM. Considering the symmetrical change of a user’s facial feature points in the state of fear, points 17 to 21 and 22 to 26 are used for measuring EM.
By referring to a study [15] conducted based on vibraimages that are known to capture subtle movements observed in the body or head when in a state of anxiety or stress, this study also measured NM in order to observe such subtle movements in the subjects’ heads. To do this, the horizontal and vertical movements in two successive images at point 30 were calculated, and the average value of the experimental images was used as NM.
From them, the changes of DLRL, DULL, EM, NM, and EBR between the case of watching neutral images and that of watching horror movies were used as our final features of DLRL, DULL, EM, NM, and EBR. The detailed formulations of DLRL, DULL, EM, NM, and EBR are as follows:
where P is the total number of images for experiments, and i represents the ith image frame. xn,i and yn,i show the x and y positions, respectively, of the nth point of Figure 6a in the ith image frame. “neutral” and “horror” represent the cases of watching neutral images and horror movies, respectively.
3.5. SE Measurement as Feature Value 8
3.6. Combining Feature Values by a Fuzzy Inference System
Among the eight feature values explained in Section 3.3, Section 3.4 and Section 3.5, the top four feature values that showed a statistically significant difference before and after watching neutral images versus before and after watching horror movies were selected. In other word, by t-tests [31] and Cohen’s d analysis [32], the four feature values (DLRL, EM, FT, and SE) with p-values <0.05 (>95% CI) and a high Cohen’s d value were selected as the feature values with credibility. A detailed explanation of this is available in Section 4.
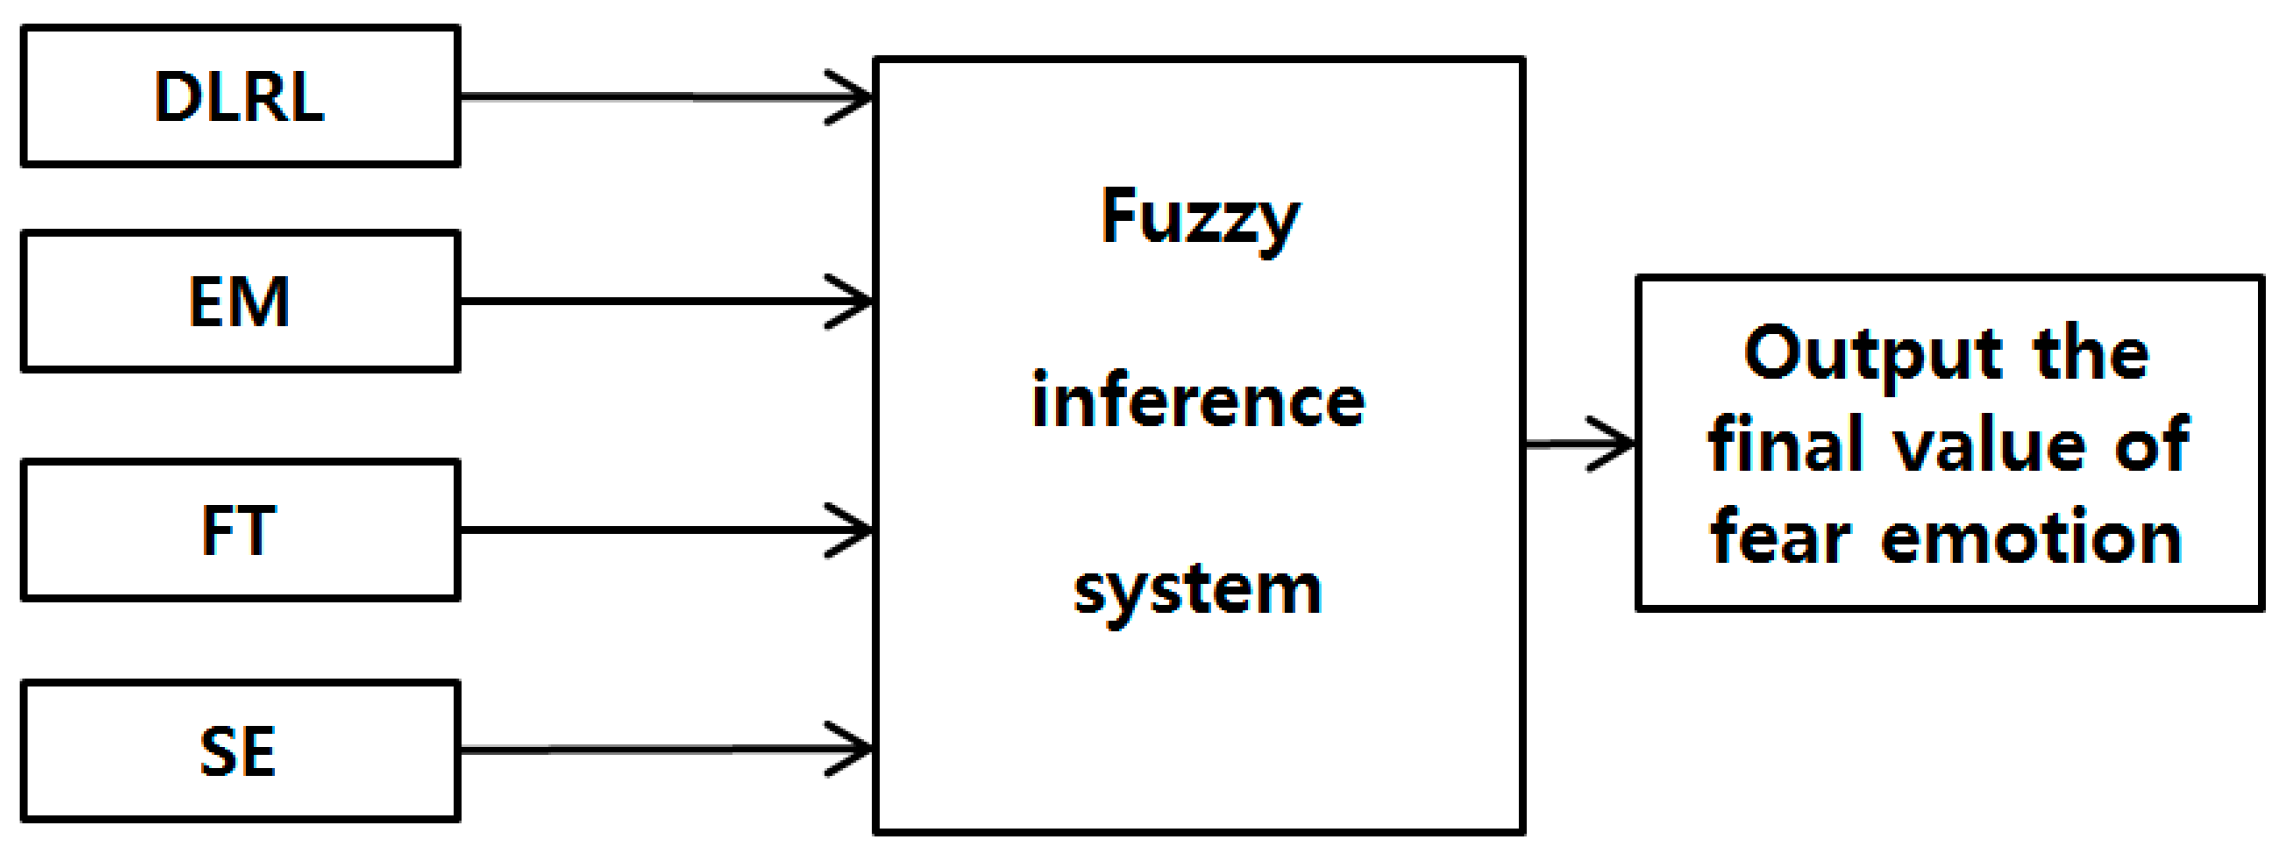
The four feature values selected in the study were then incorporated into a fuzzy system as in Figure 7 to allow a more accurate recognition of fear. Each feature value is expressed in the range of 0 to 1 through min-max normalization to be used as input data to the fuzzy system.
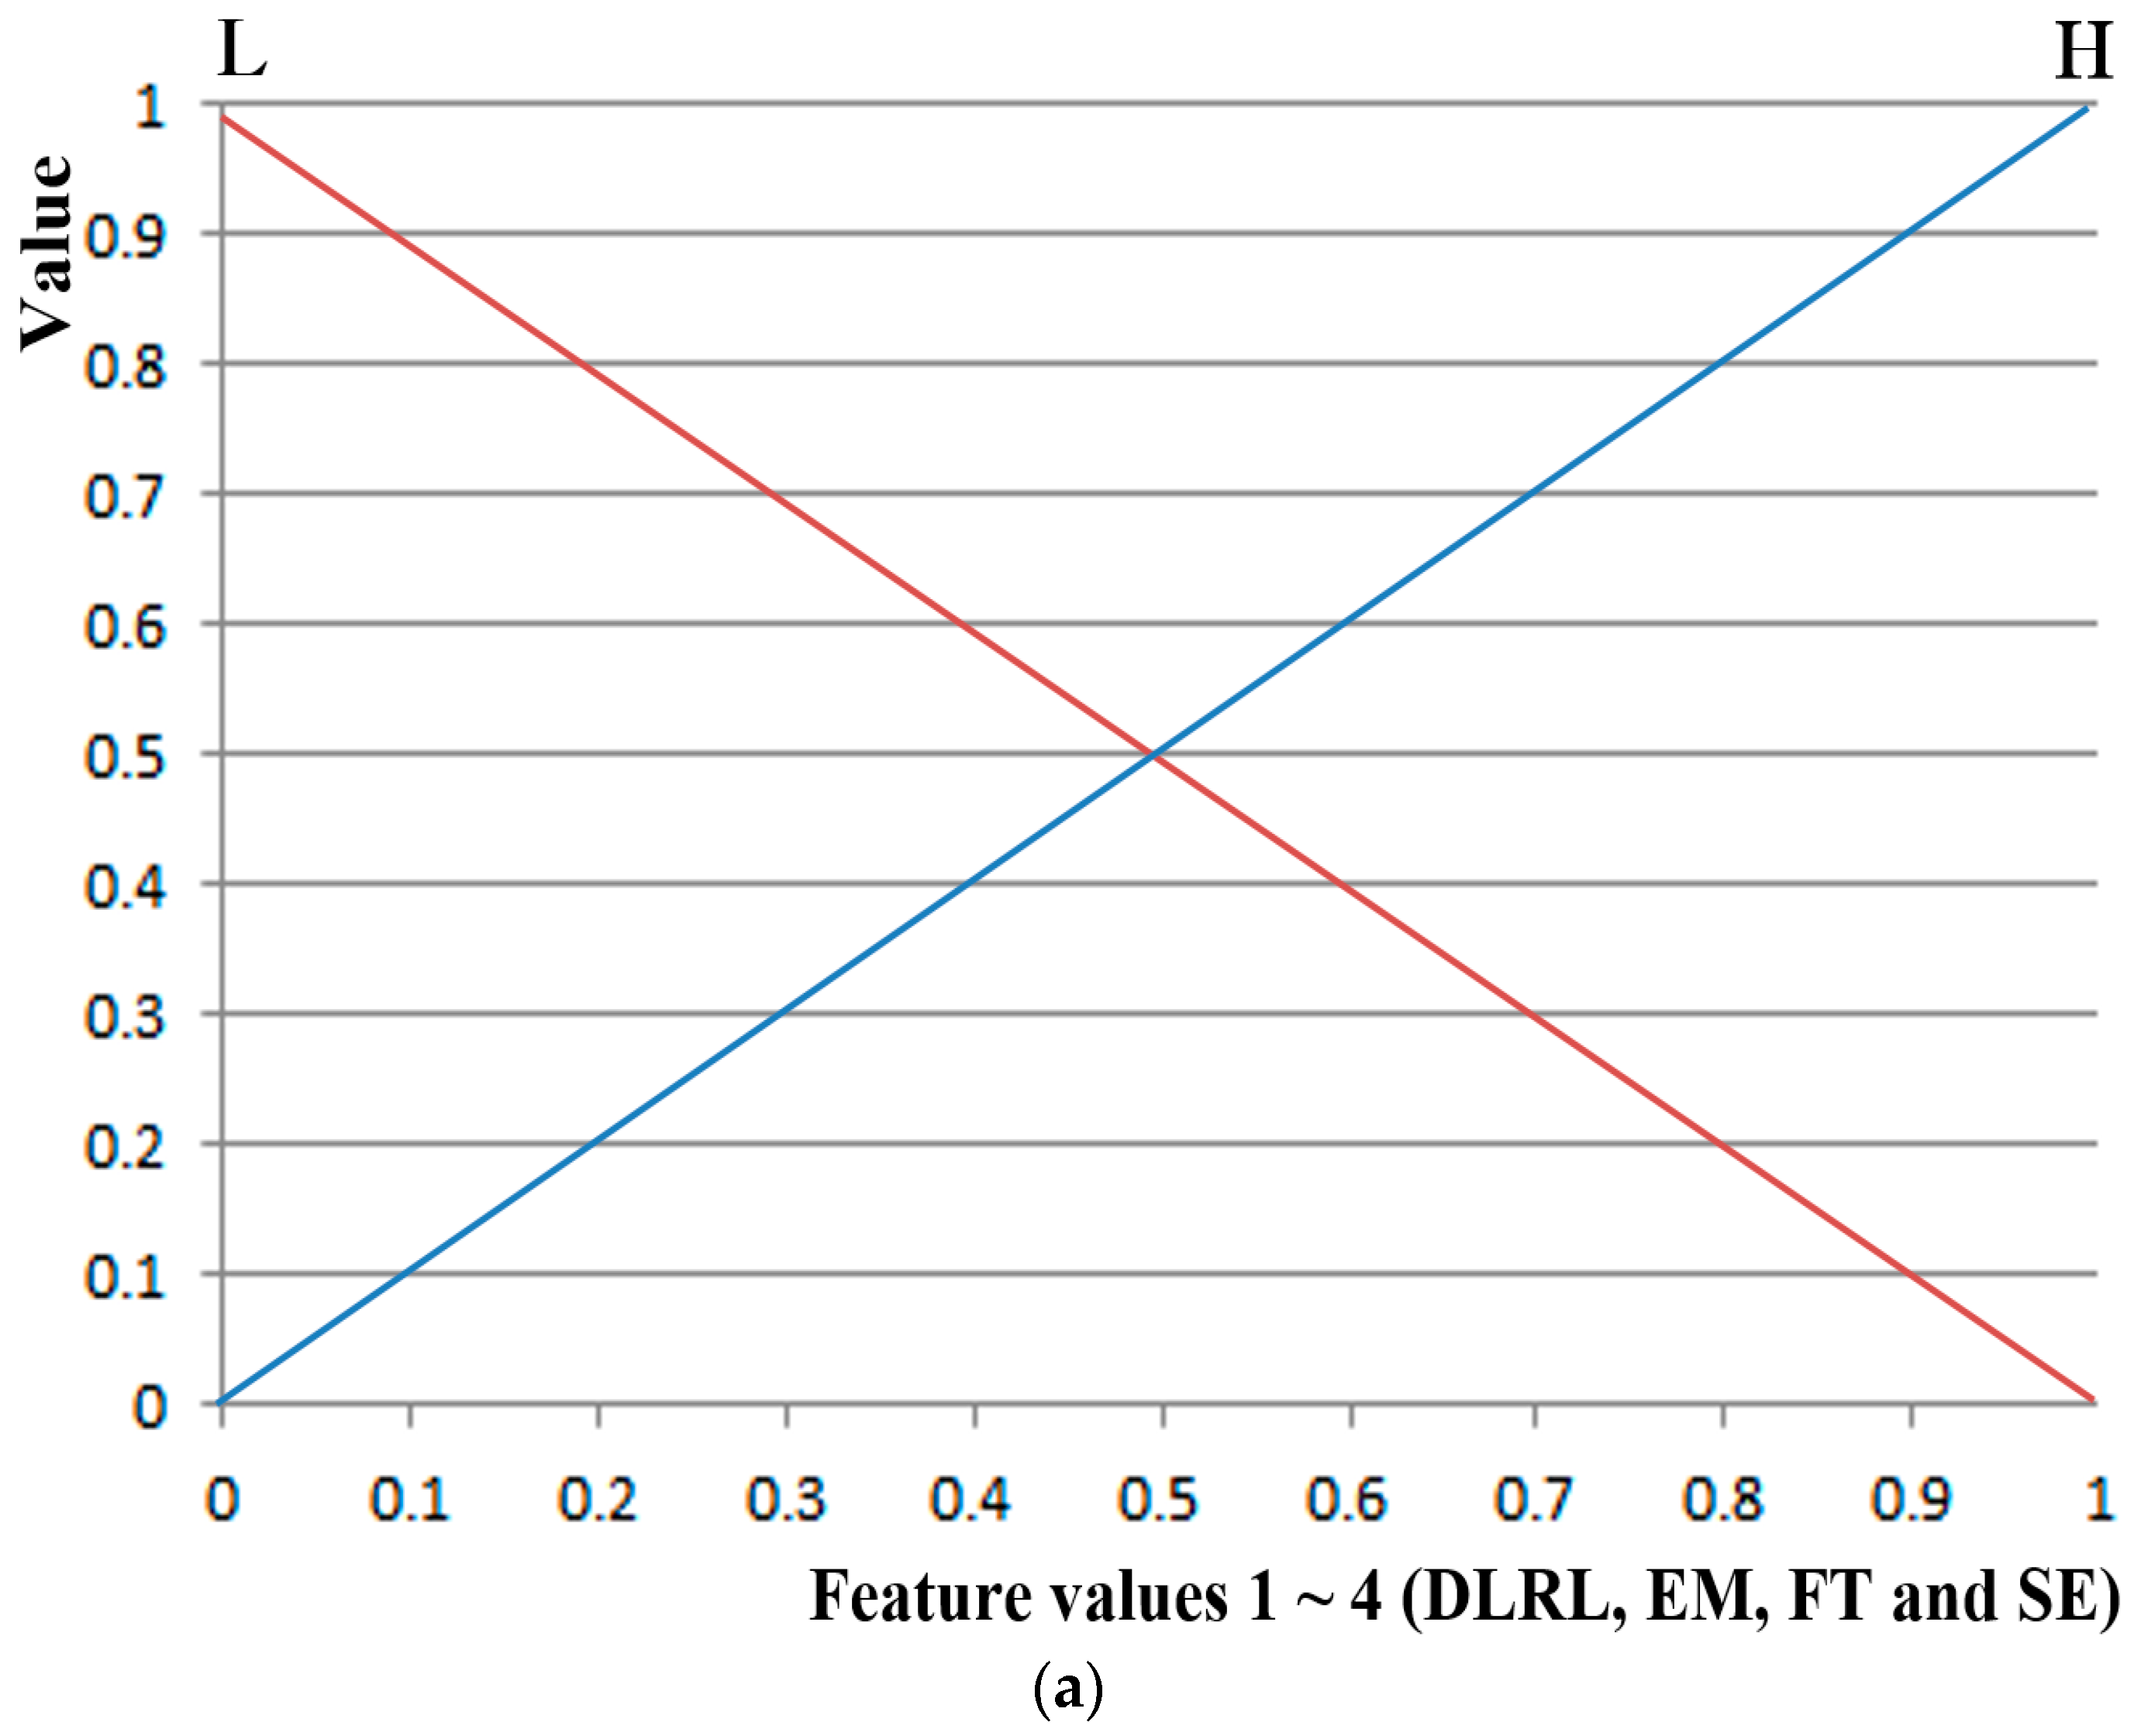
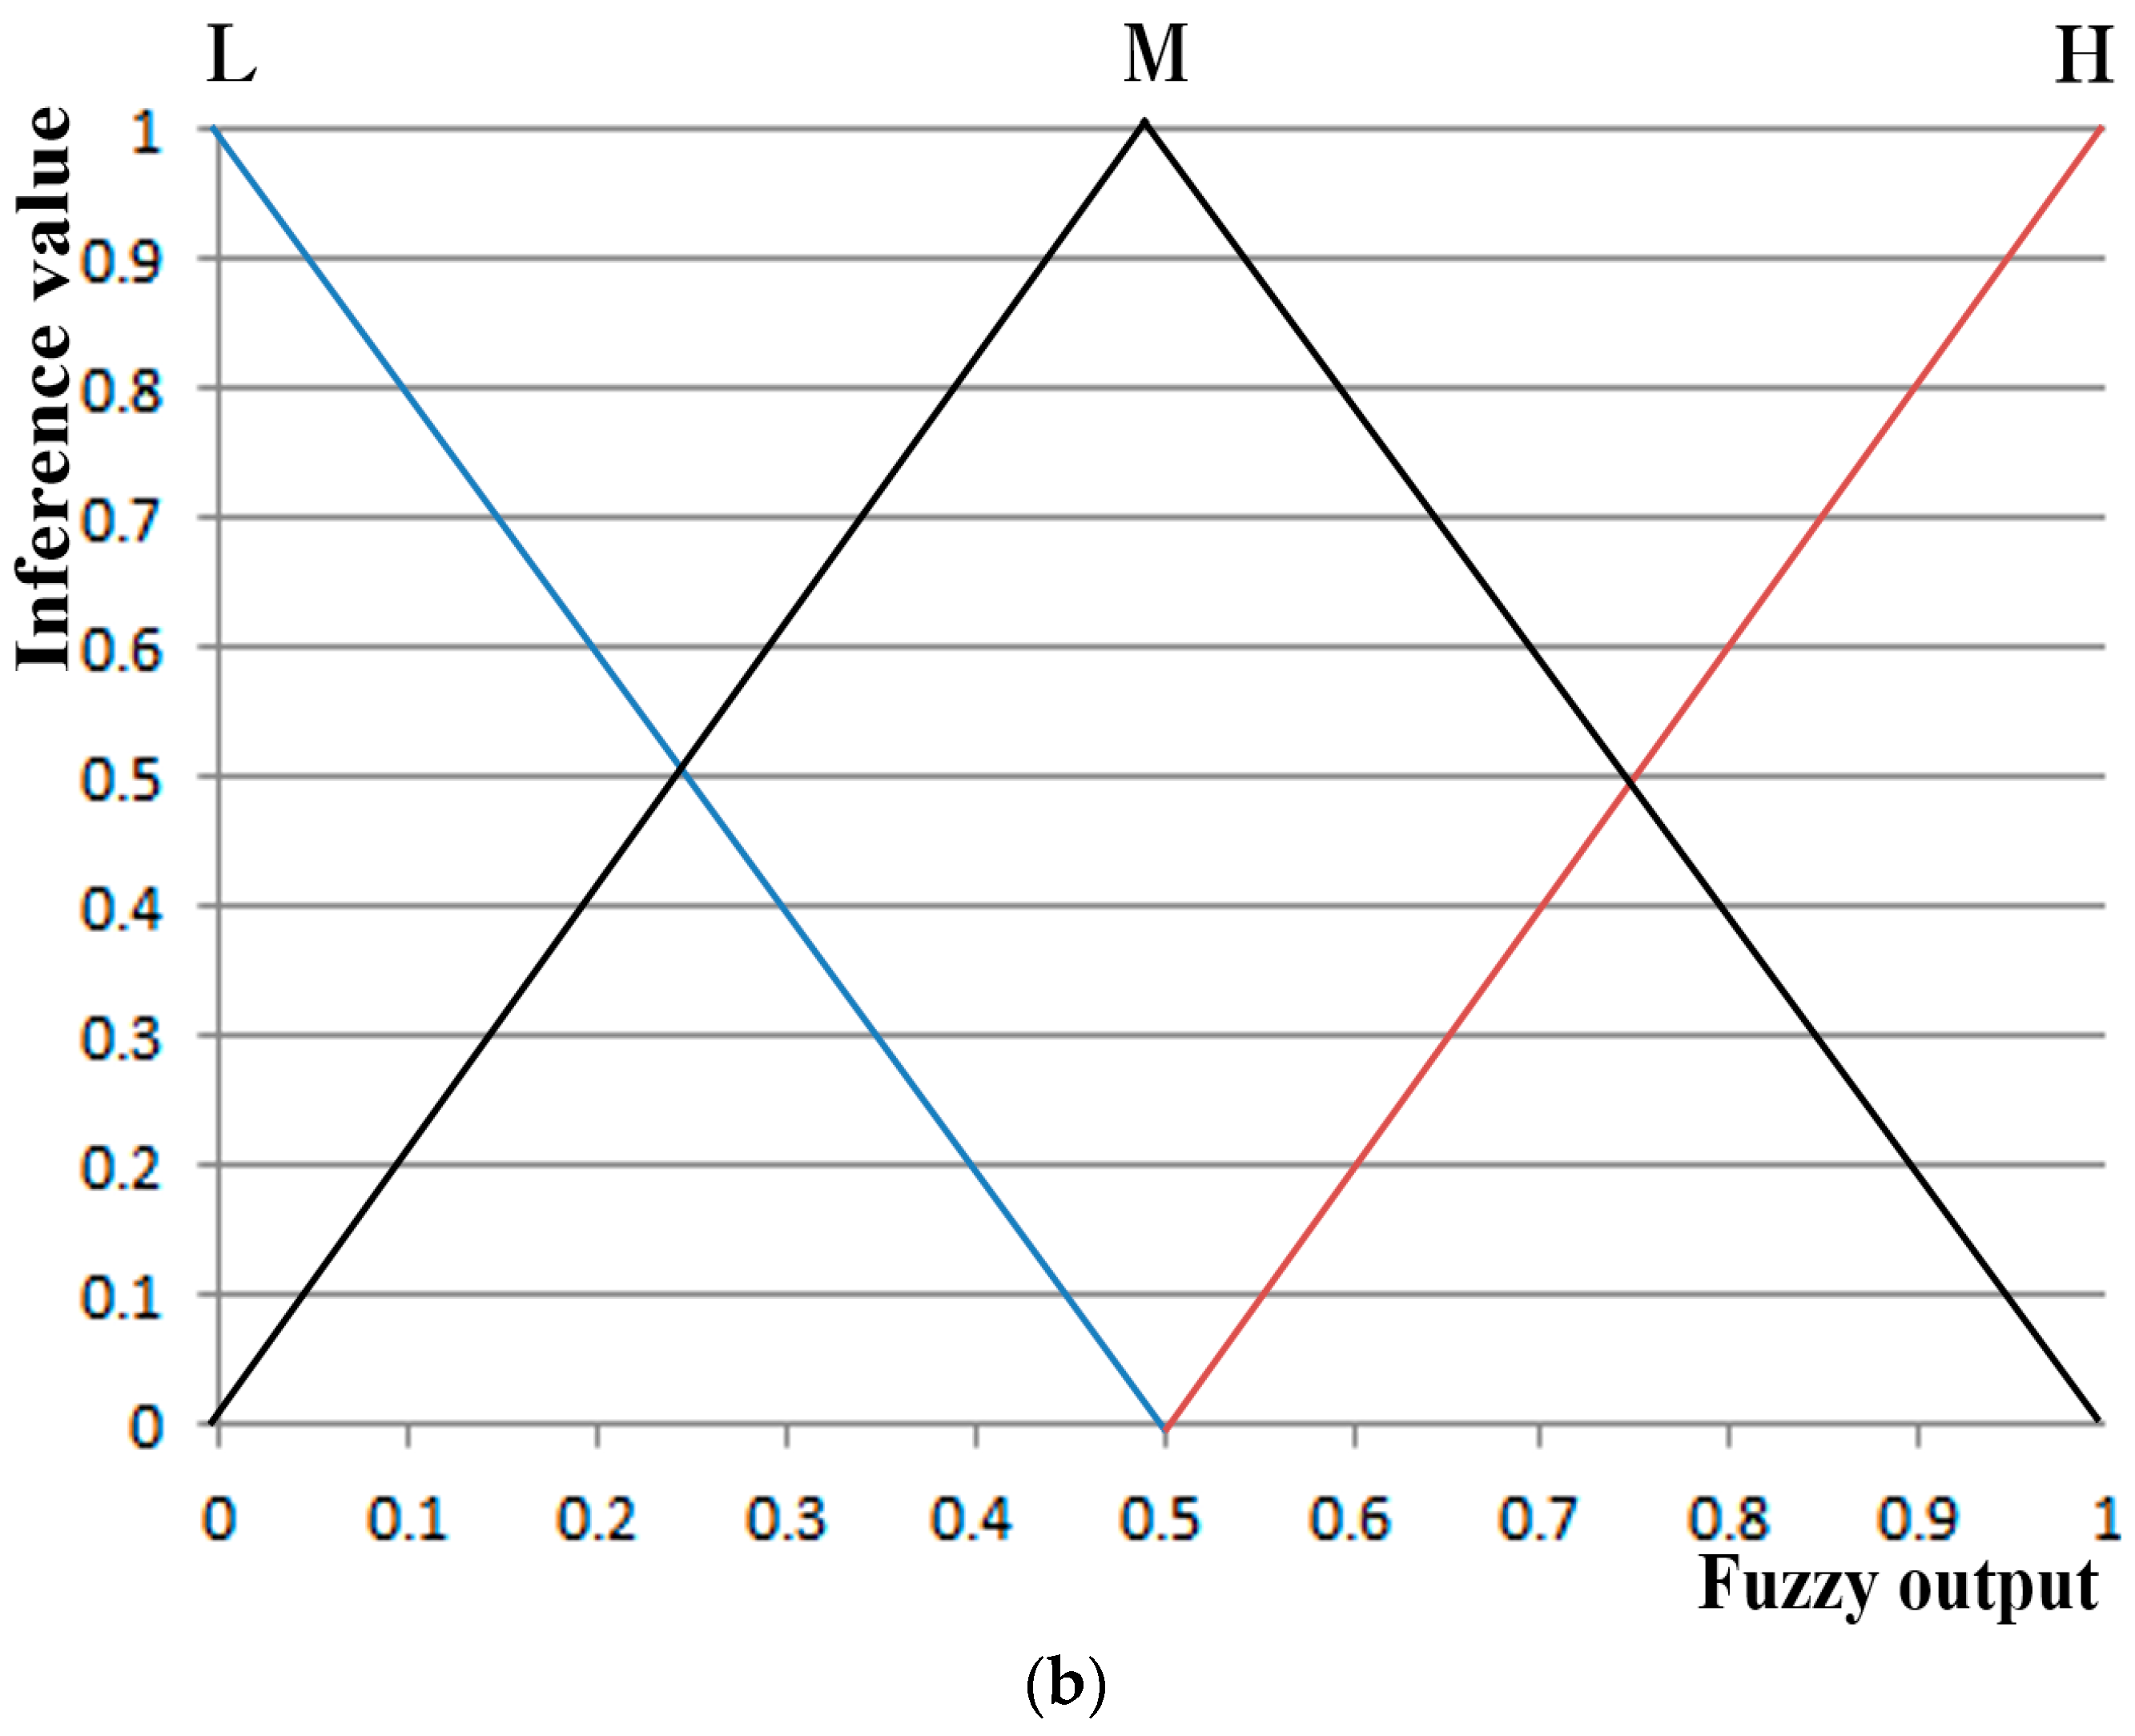
Figure 8 describes the input and output membership functions of symmetrical shape used in the fuzzy system. The system input consists of two linguistic terms: low (L) and high (H); while the output consists of three linguistic terms: low (L), medium (M) and high (H). As for membership functions (connecting the inference values to the feature values over the range of linguistic terms), a linear (triangular) membership function—the most generally used method—was used, factoring in the processing speed and the complexity of the problem [42].
Table 3 represents a rule table between the four input feature values and the fuzzy output. H as a fuzzy output indicates that the value of fear of study subjects is significant, while L as a fuzzy output indicates otherwise. As explained in Section 3.3, Section 3.4 and Section 3.5, the greater the fear of the subjects is, the higher the DLRL, EM, FT, and SE values tend to be.
At this stage, a correlation sum between the DLRL, EM, FT and SE was calculated as in Table 4, and, based on the outcome, the weighted value was applied to them to design a fuzzy rule table. In general, the correlation value ranges from –1 to 1, and the closer it is to 1 the more positively correlated the parameters are [43]. The linear correlation coefficient was calculated in this research.
For example, three correlation values between SE and FT, SE and DLRL, SE and EM are calculated and summed up to be used as the correlation sum of SE. A low correlation sum between the three feature values indicates that they are inconsistent with the other three feature values which are selected through t-tests and Cohen’s d analysis and confirmed to be credible. Therefore, in this study, such inconsistency was addressed by applying a small weight based on the assumption that the values have low credibility.
In other words, if the correlation sum of the four feature values in Table 4 was >0.3 (SE and FT in Table 4), 0 was applied for the input membership function of L and 0.5 was applied for H. In addition, if the correlation sum was less than 0.3 (EM and DLRL in Table 4), the correlation sum was lower than the SE and FT values, which indicated that the credibility of the value was low. Therefore, a small weight was applied with 0 for L and 0.25 for H as in Table 3.
Based on this, the fuzzy output in Table 3 was designed so the output value is L if the summed value of SE, FT, DLRL, and EM is between 0 and 0.75, M if the value is between 0.75 and 1.0, and H if the value is 1.0 or higher. For example, if SE, FT, DLRL, and EM in Table 3 are H, H, L, and L, respectively, the summed value equals 1 (= (0.5 × 1) + (0.5 × 1) + (0 × 1) + (0 × 1)), resulting in a fuzzy output of H. On the other hand, if SE, FT, DLRL, and EM are L, L, H, and H, respectively, the summed value equals 0.5 (= (0 × 1) + (0 × 1) + (0.25 × 1) + (0.25 × 1)), resulting in a fuzzy output of L. As such, in both cases, the four feature values consisted of two Hs and two Ls. However, by applying a greater weight to SE and FT, the fuzzy output can be adjusted to be H when SE, FT, DLRL, and EM are H, H, L, and L, respectively, and L when SE, FT, DLRL, and EM are L, L, H, and H, respectively.
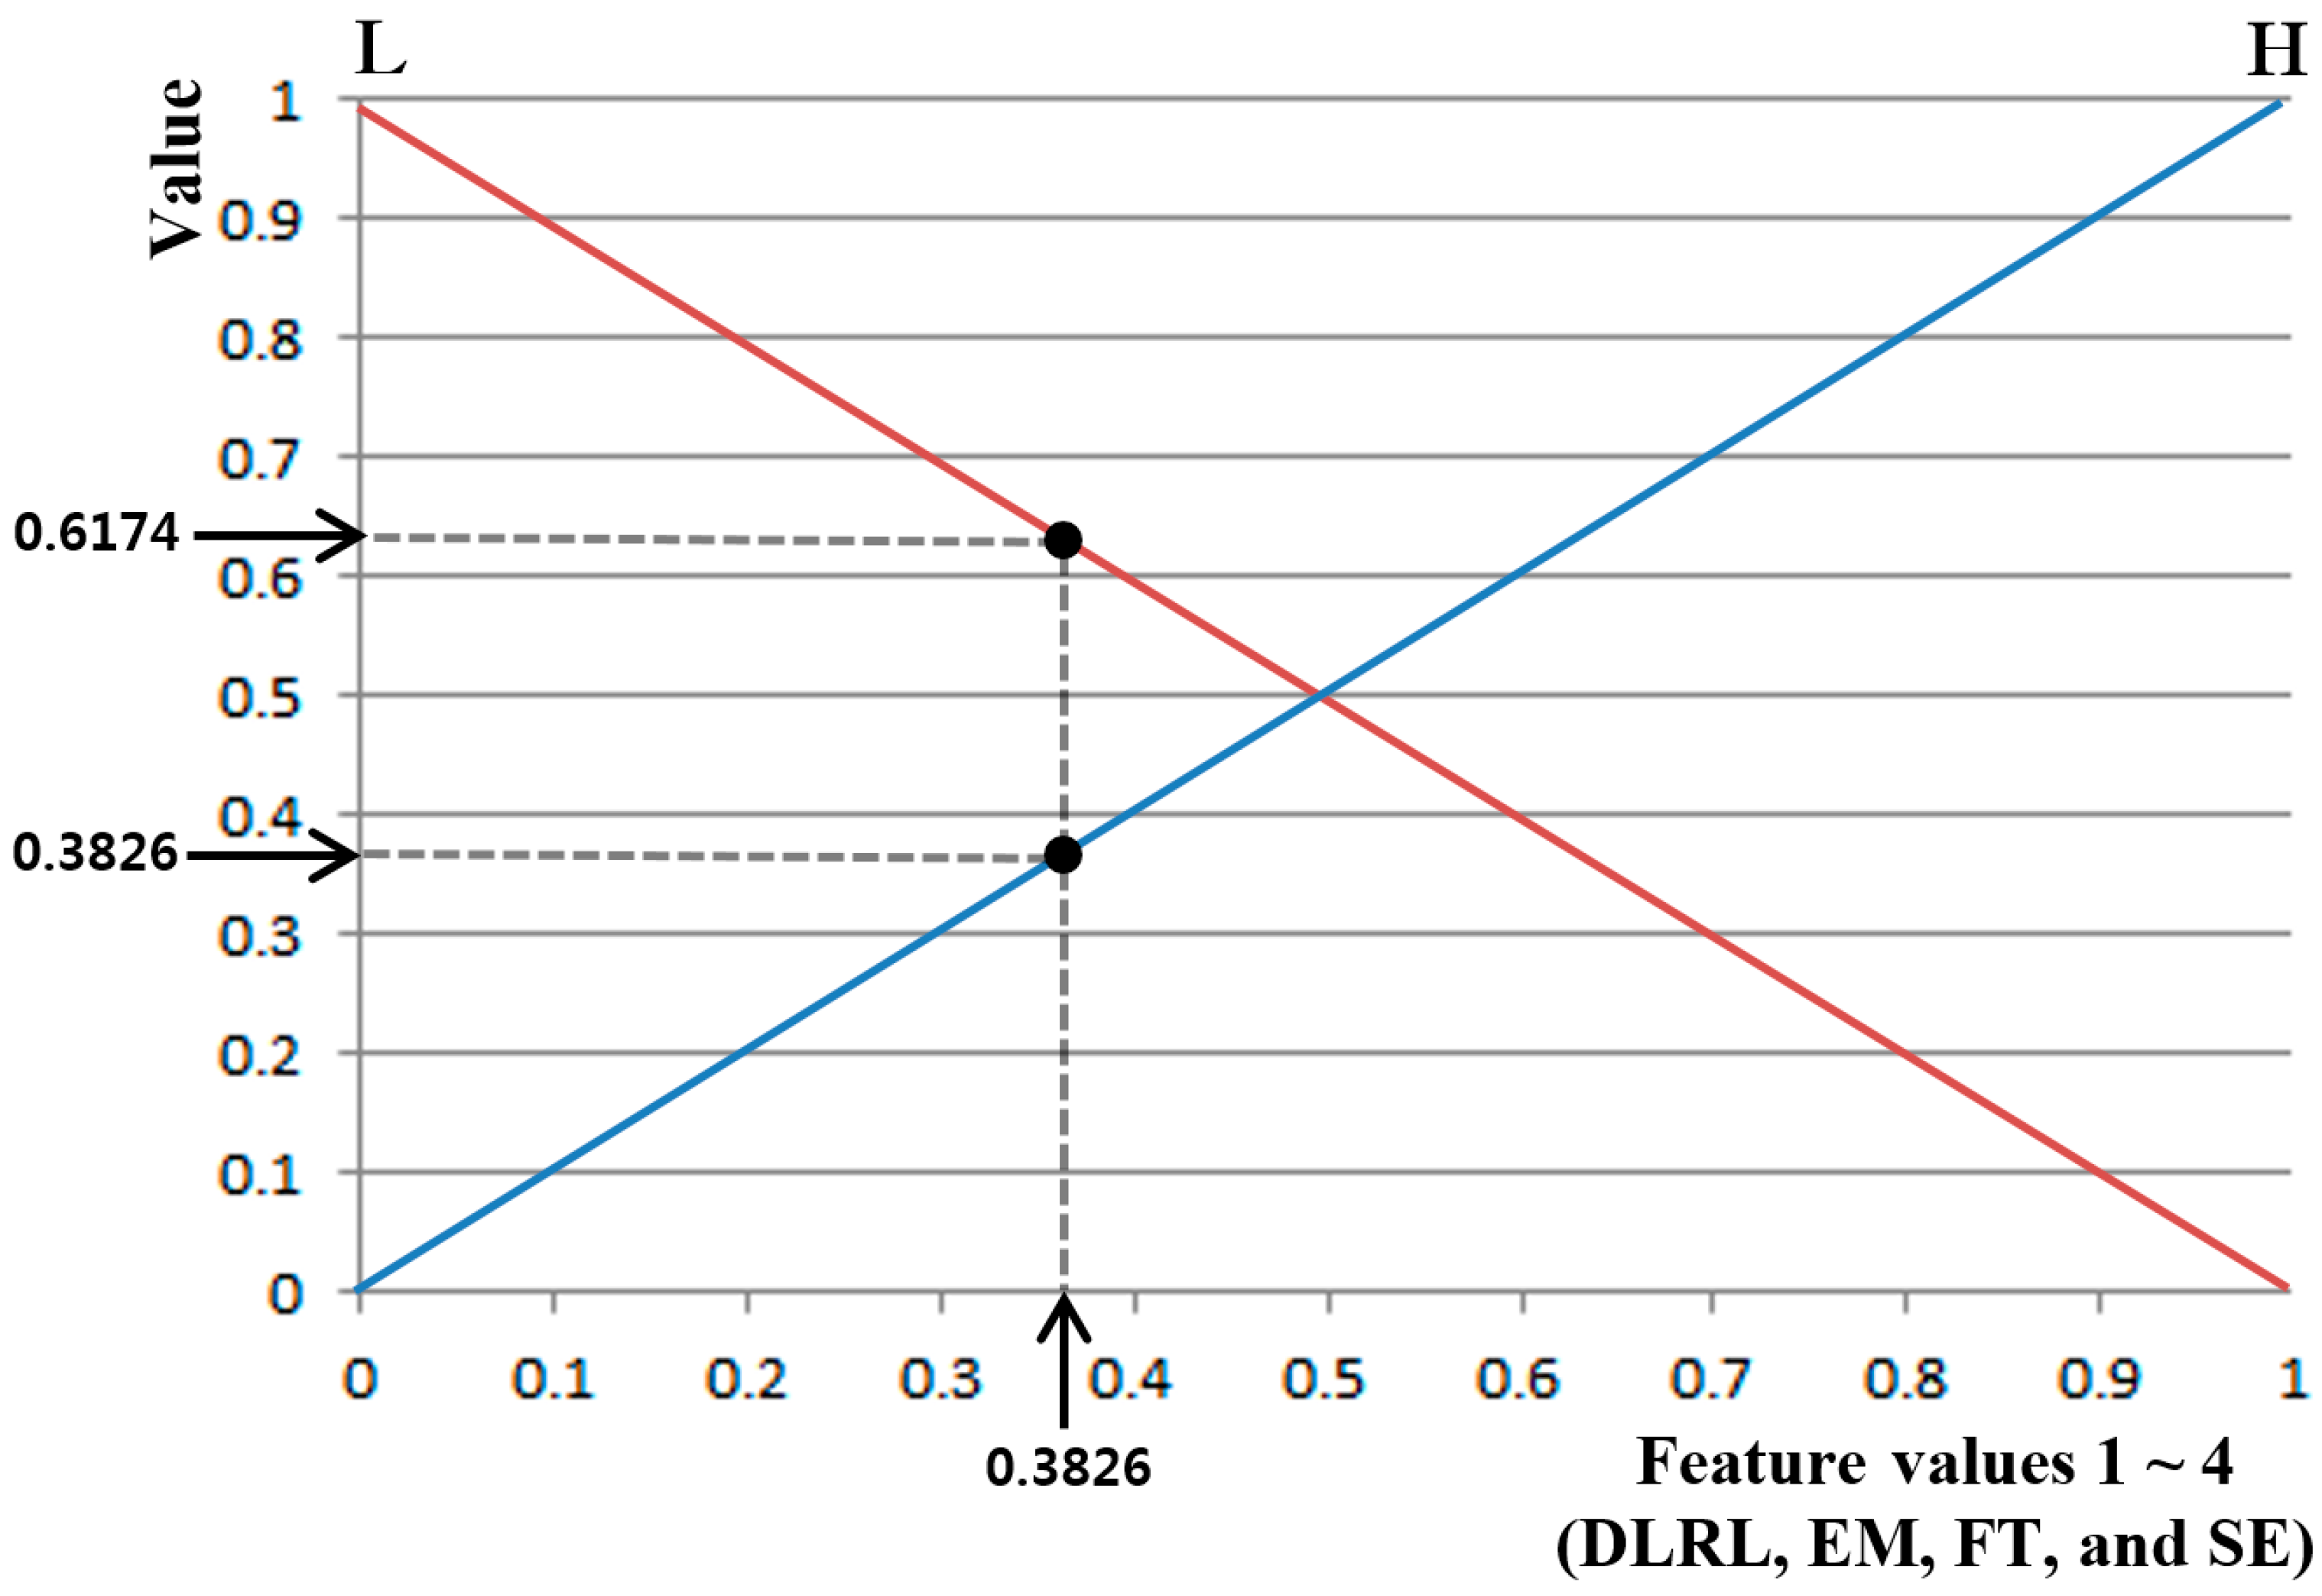
Figure 9 shows an example in which the output value for each input feature value can be obtained by an input membership function. For an input feature value of 0.3826, two values of 0.3826 (H) and 0.6174 (L) can be obtained. As mentioned earlier, four feature values (SE, FT, DLRL and EM) and two input membership functions (L and H) are used as in Figure 8a in this study, ultimately generating eight outputs of input membership functions (, , , , , , , and ). Assuming the feature value is SE in Figure 9, and become 0.6174 (L) and 0.3826 (H), respectively, and 16 combinations can be obtained therefrom: (, , , ), (, , , ), (, , , ), (, , , ), … (, , , ). From these 16 combinations, 16 inference values (IV) can be obtained by applying the fuzzy rule in combination with the Min or Max rule in Table 3. For example, assuming (, , , ) is (0.6174 (L), 0.3456 (L), 0.2948 (H), 0.3196 (H)), the fuzzy output of L can be obtained by the 4th rule (if (L, L, H, and H) then L) in Table 3. The Min and the Max rule select the minimum and maximum values, respectively. Therefore, the IV is obtained as 0.2948 (L) when the Min rule is applied and 0.6174 (L) when the Max rule is applied. The final output can then be obtained through various defuzzification methods that use the obtained 16 IVs as input values.
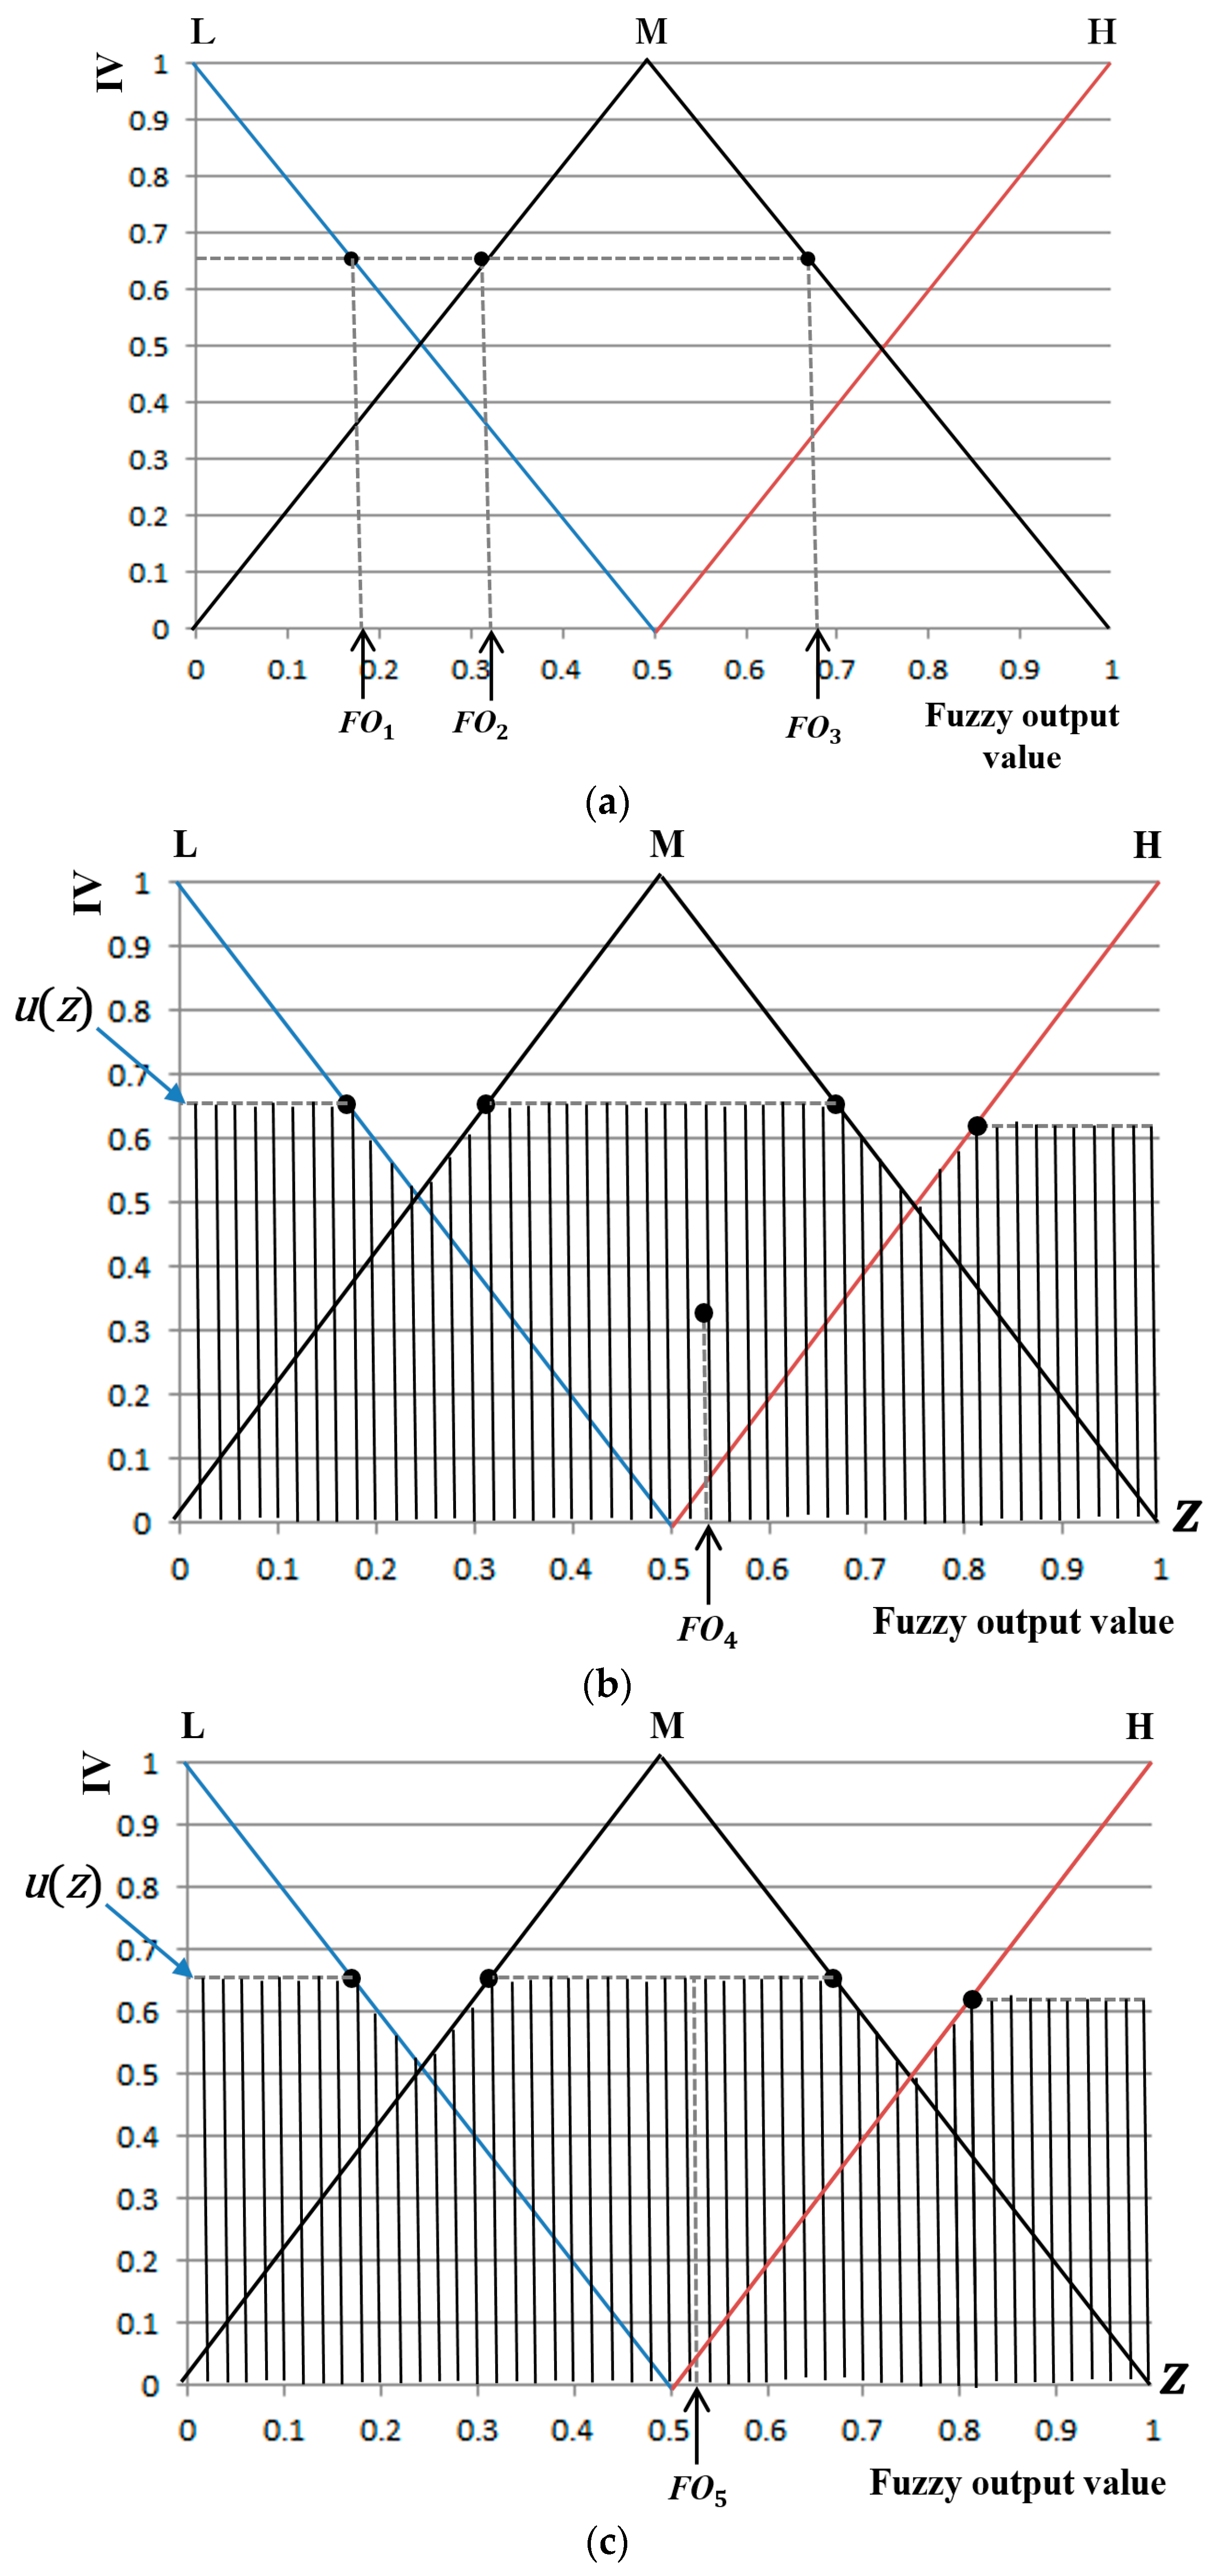
Widely known and used defuzzification methods include the following: first of maxima (FOM), middle of Maxima (MOM), last of maxima (LOM), center of gravity (COG), and bisector of region (BOA) methods. Among these, the FOM method is often referred to as the smallest of maxima (SOM) [44,45,46]. Figure 10 shows an example in which five defuzzification methods are used to obtain the non-fuzzy (or crisp) output value. As shown in Figure 10a, FOM, MOM and LOM are used to calculate the non-fuzzy (or crisp) output value with the maximum IV (0.65 on the y-axis of Figure 10a). Three output values (FO1–FO3) are obtained by the maximum IV, and FOM is used for selecting FO1, which is the first value obtained among the three. Then, LOM is used for selecting FO3, the last value obtained, while MOM is used for selecting (FO1+ FO3)/2, the average value of FO1 and FO3.
Unlike FOM, MOM, and LOM which use only the maximum IV, COG and BOA obtain the output value from regions defined by all IVs. Figure 10b shows an example in which the output value is obtained by COG, with the detailed formula presented in Equation (14) [47]. In Equation (14), z is a function indicating variables, while u(z) is a function indicating regions defined by all IVs (hatched region in Figure 10b).
As shown in Equation (14), the value z (FO4) at the geometric center of the regions defined by all IVs (hatched region in Figure 10b) is selected as the final output value.
Figure 10c shows an example of calculating the final output value by BOA (using Equation (15)):
As shown in Equation (15), the BOA indicates the location of z at the center of the integral region, with two regions divided by it, equal in area. In Figure 10c, FO5 is selected as BOA for Equation (15). Since the BOA divides the total region into two equal areas and the COG indicates the center of gravity, the obtained fuzzy output value may not be consistent all the time.
4. Experimental Results and Analyses
Participants and experimental conditions are as follows. A total of 20 people (of sound mental and physical health, and aged between their twenties and forties) participated in the experiments. For considering the effect of gender on emotion, half of the participants were male and the other half were female. In addition, we had people from various countries (including Asian, Western, and African) participate in the experiments in order to consider the effect of race on emotion.
The room temperature and relative humidity were 26.6 °C and 51.9%, respectively. The participants watched horror movies with no lighting (turning off the light on the ceiling) to maximize the horror atmosphere. The maximum level of illumination in the room was 13 lux. Participants chose three horror movies that they had not watched before, out of the following four: Epitaph [48], The Conjuring [49], Dead Silence [50], and Insidious [51]. They watched 5-min edited clips of the three chosen movies that centered on fear-evoking scenes. (We will make these video clips available to other researchers if they request them by e-mail. Therefore, they can perform comparative experiments with our experimental video clips.)
We allowed the experimental participants to be in natural postures without any occlusion, and made sure all the participants had sufficient rest before experiments. From that, the natural emotion of fear could be measured by preventing any discomfort and guaranteeing that the emotion was spontaneous.
In addition, the neutral emotional state of the participants was measured using images for neutral emotion from the international affective picture system (IAPS) [52] that are widely used as an emotion stimulus. According to the instruction in [52], the image of IAPS is not allowed to be shown in the paper. All studies and data acquisition were conducted using a single desktop computer of the following specifications: 3.00 GHz CPU (Intel ® Core TM) i5 2526) with 4 GB RAM (Samsung Electronics, Suwon, Republic of Korea), Microsoft visual studio 2012 C++ (Microsoft Corporation, Redmond, WA, USA), and OpenCV (version 2.3.9) library. Figure 11 represents the experimental procedure.
As indicated in Figure 11, each participant watched neutral images before being exposed to three horror movie clips. The data measured during this process were used as reference values for the neutral emotional state of each participant. For example, among the differences in values of eight feature values (FT, HR, EBR, DLRL, DULL, EM, NM, and SE) based on Equations (16) and (17) or (18), four feature values (DLRL, EM, FT, and SE) with p-values <0.05 (95% CI) and high Cohen’s d value were selected as feature values with credibility through t-tests and Cohen’s d analysis.
DFVi_wn = FVi_bwn − FVi_awn
DFVi_wh = FVi_bwh − FVi_awh
DFVj_wnh = FVj_wn − FVj_wh
In Equations (16) and (17), DFVi_wn represents the difference of ith feature value before and after watching neutral images. FVi_bwn, and FVi_awn respectively represent the ith feature values before and after watching neutral images. DFVi_wh represents the difference of ith feature value before and after watching horror movie. FVi_bwh, and FVi_awh respectively represent the ith feature values before and after watching horror movie. In Equations (16) and (17), i = 0 ~ 2, which represent FT, HR, and SE, respectively.
DFVj_wnh represents the difference of jth feature value of watching neutral images and horror movie. FVj_wn, and FVj_wh respectively represent the jth feature values of watching neutral images and horror movie. In Equation (18), j = 0 ~ 4, which represent EBR, DLRL, DULL, EM, and NM, respectively. We performed the t-tests and Cohen’s d analysis with these two values of DFVi_wn and DFVi_wh in case of FT, HR, and SE. In addition, we performed the t-tests and Cohen’s d analysis with these two values of FVj_wn, and FVj_wh in case of EBR, DLRL, DULL, EM, and NM.
In our research, we performed independent t-test based on unequal variance and two-sample [31]. For t-tests, a null hypothesis has to be set [31]. In this study, the null-hypothesis was set as: there was no difference in feature values measured for neutral images and horror movies. If the p-value obtained through t-tests is <0.05, the null hypothesis is rejected based on the confidence level of 95%, which in turn indicates that there is a discrepancy in the feature values measured when watching horror movies compared to watching neutral images based on the confidence level of 95%. In addition, if the p-value obtained through t-tests is <0.01, the null hypothesis is rejected based on the confidence level of 99%, which in turn indicates that there is a discrepancy in the feature values measured when watching horror movies compared to watching neutral images based on the confidence level of 99%. Based on these findings, it is suggested that the lower the p-value is, the greater the difference is between the two sets of data measured, at a statistically significant level.
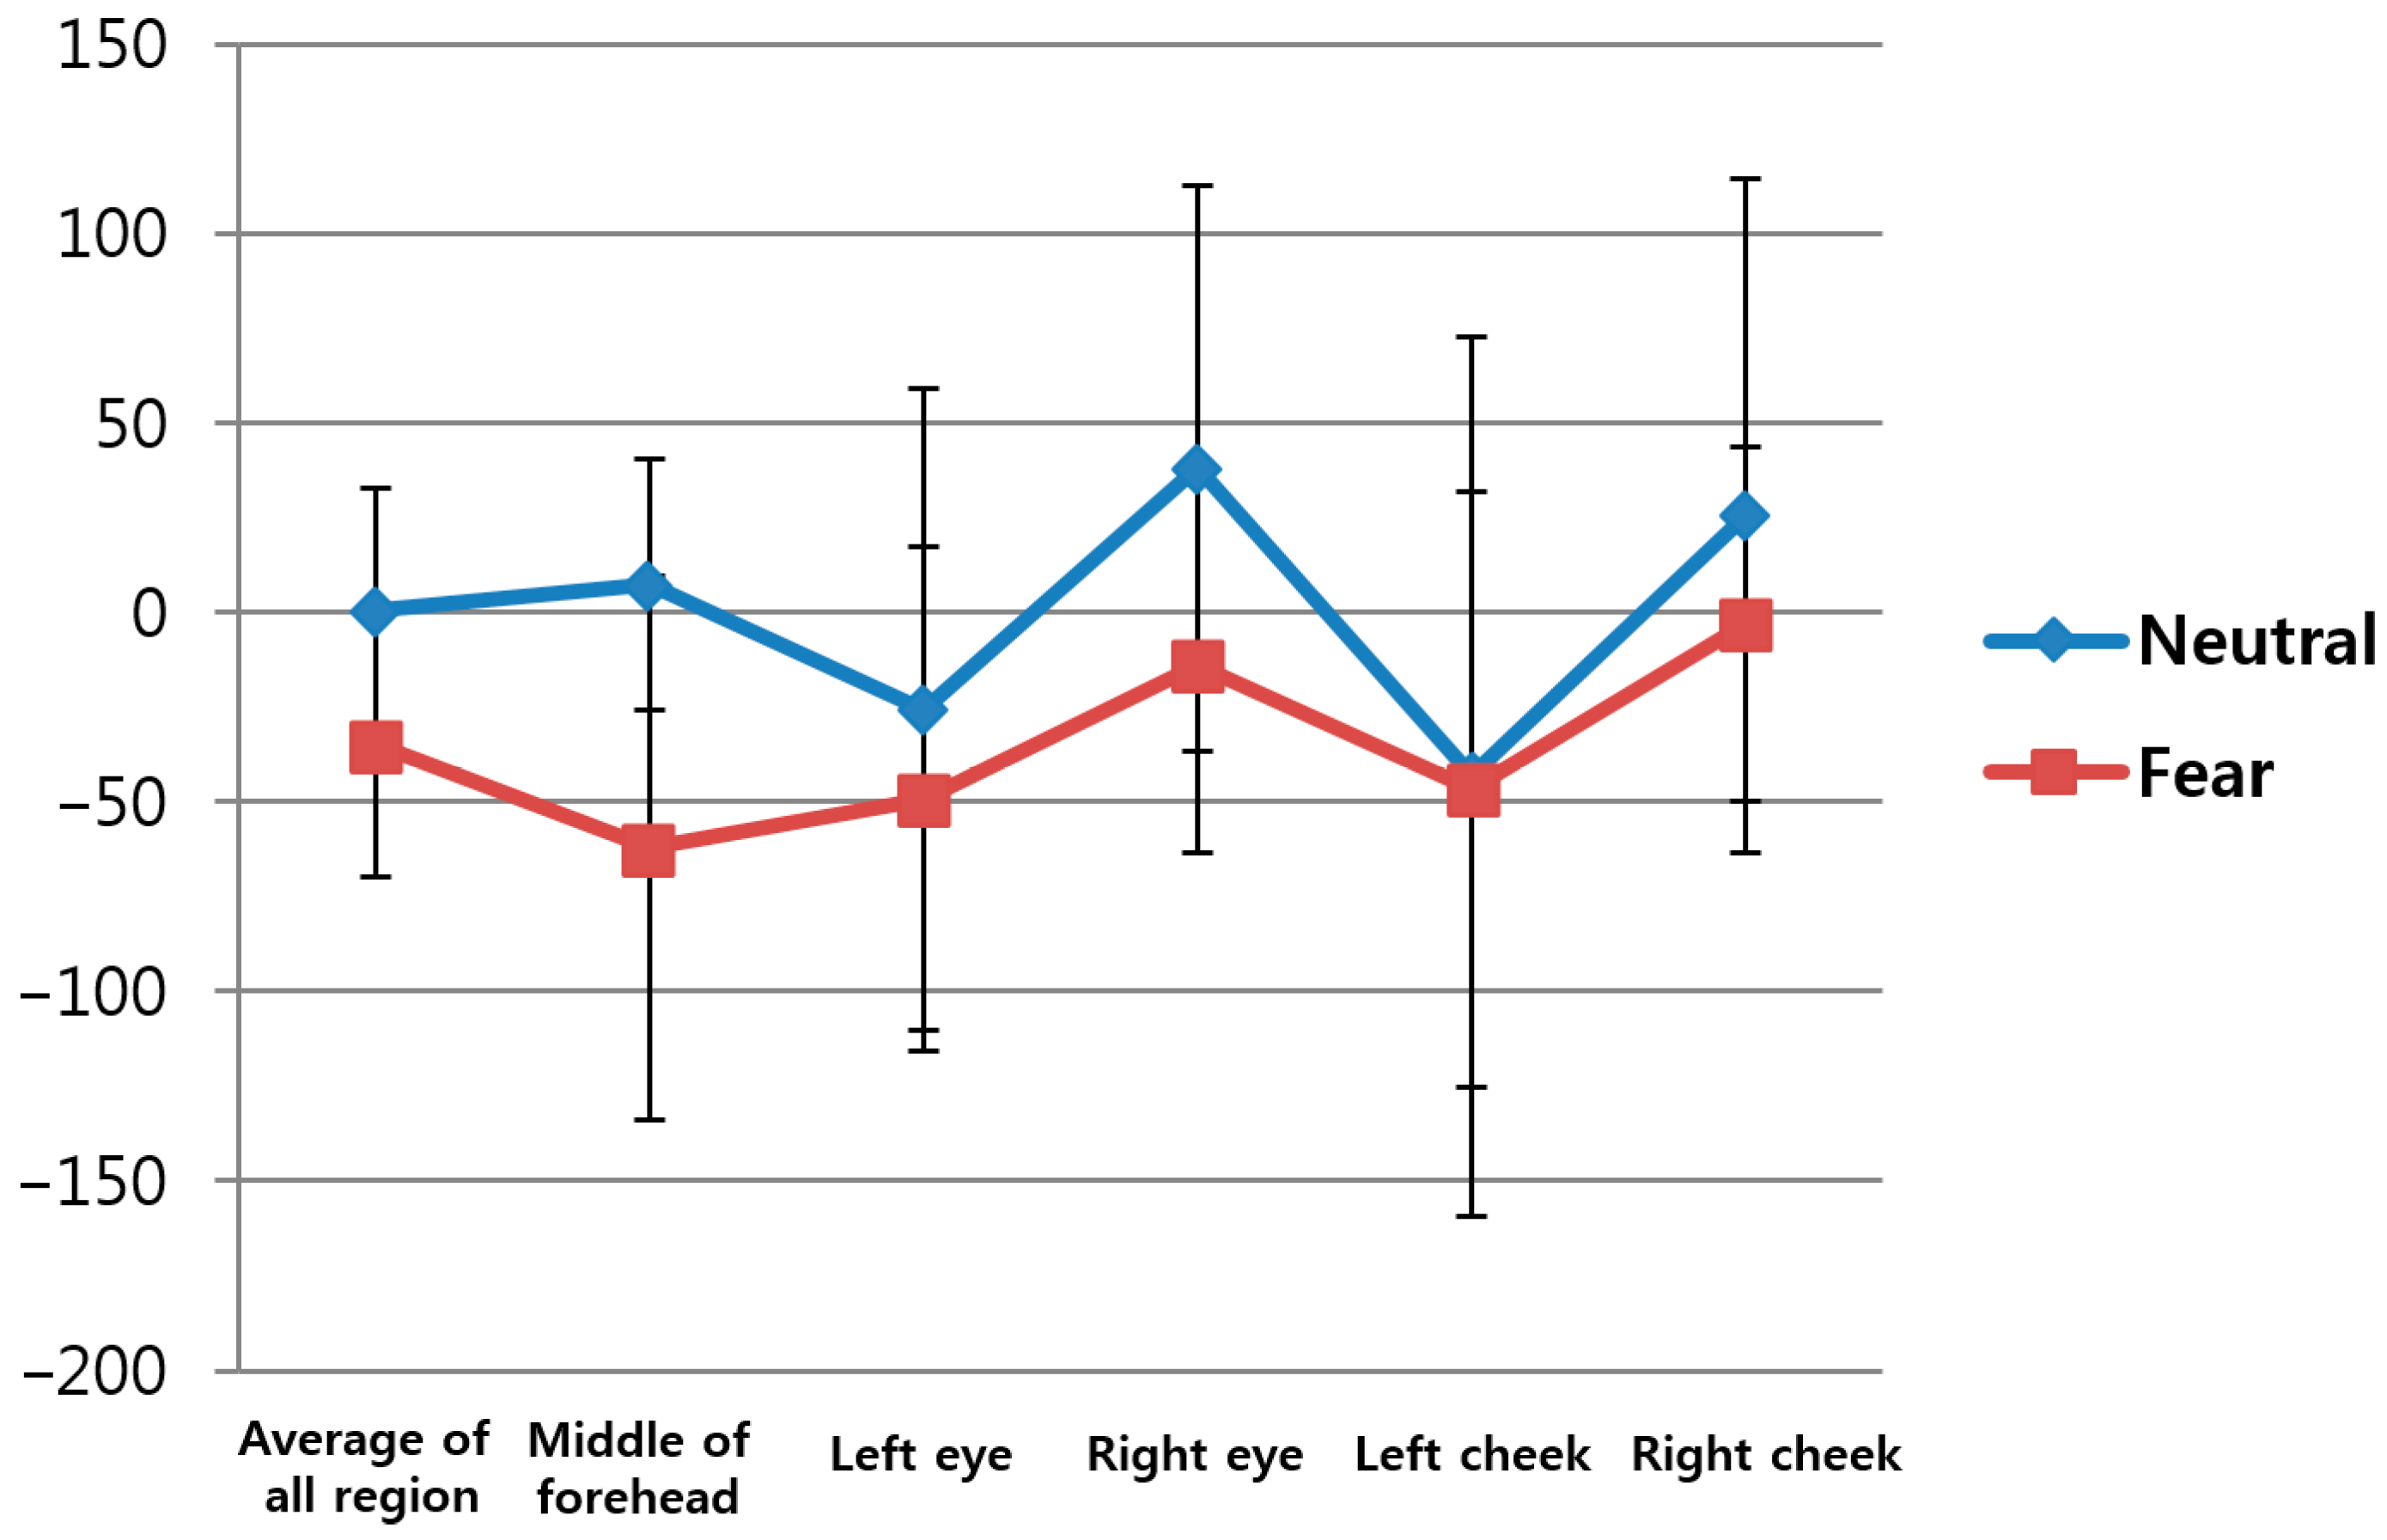
Based on the foregoing data, the p-value for the eight feature values (FT, HR, DLRL, DULL, EM, EBR, NM, and SE) was obtained. Table 5 shows the change of FT from facial region before and after watching neutral images versus before and after watching horror movies based on Equations (16) and (17) in the five ROIs (middle of forehead, left eye, right eye, left cheek, right cheek) on the face indicated in Figure 5 and in the overall regions.
Figure 12 represents the average values and standard deviations in Table 5. In this study, the average FT values of the five ROIs were used as the first feature value to reduce the influence of the partial changes in FT. The p-value for the average FT of the five regions was 0.006994, which is lower than 0.05, indicating that the change in FT before and after watching horror movies was more significant than before and after watching neutral images at the confidence level of 95%.
The second feature value was FT-based HR, as explained in Section 3.3. As shown in Table 6 and Figure 13, this study measured the change in HR before and after watching neutral images versus before and after watching horror movies. Here, again, the HR calculated based on the average FT value of the five ROIs indicated in Figure 5 was used as the second feature value in order to reduce the influence of the partial changes in FT. As shown in Table 6 and Figure 13, the p-value for HR was 0.054867, which is higher than 0.05, indicating that the change in HR before and after watching horror movies was less significant than the change in HR before and after watching neutral images at the confidence level of 95%. In other words, it is assumed that feature value 2 did not show a statistically significant result to be used in the fuzzy system.
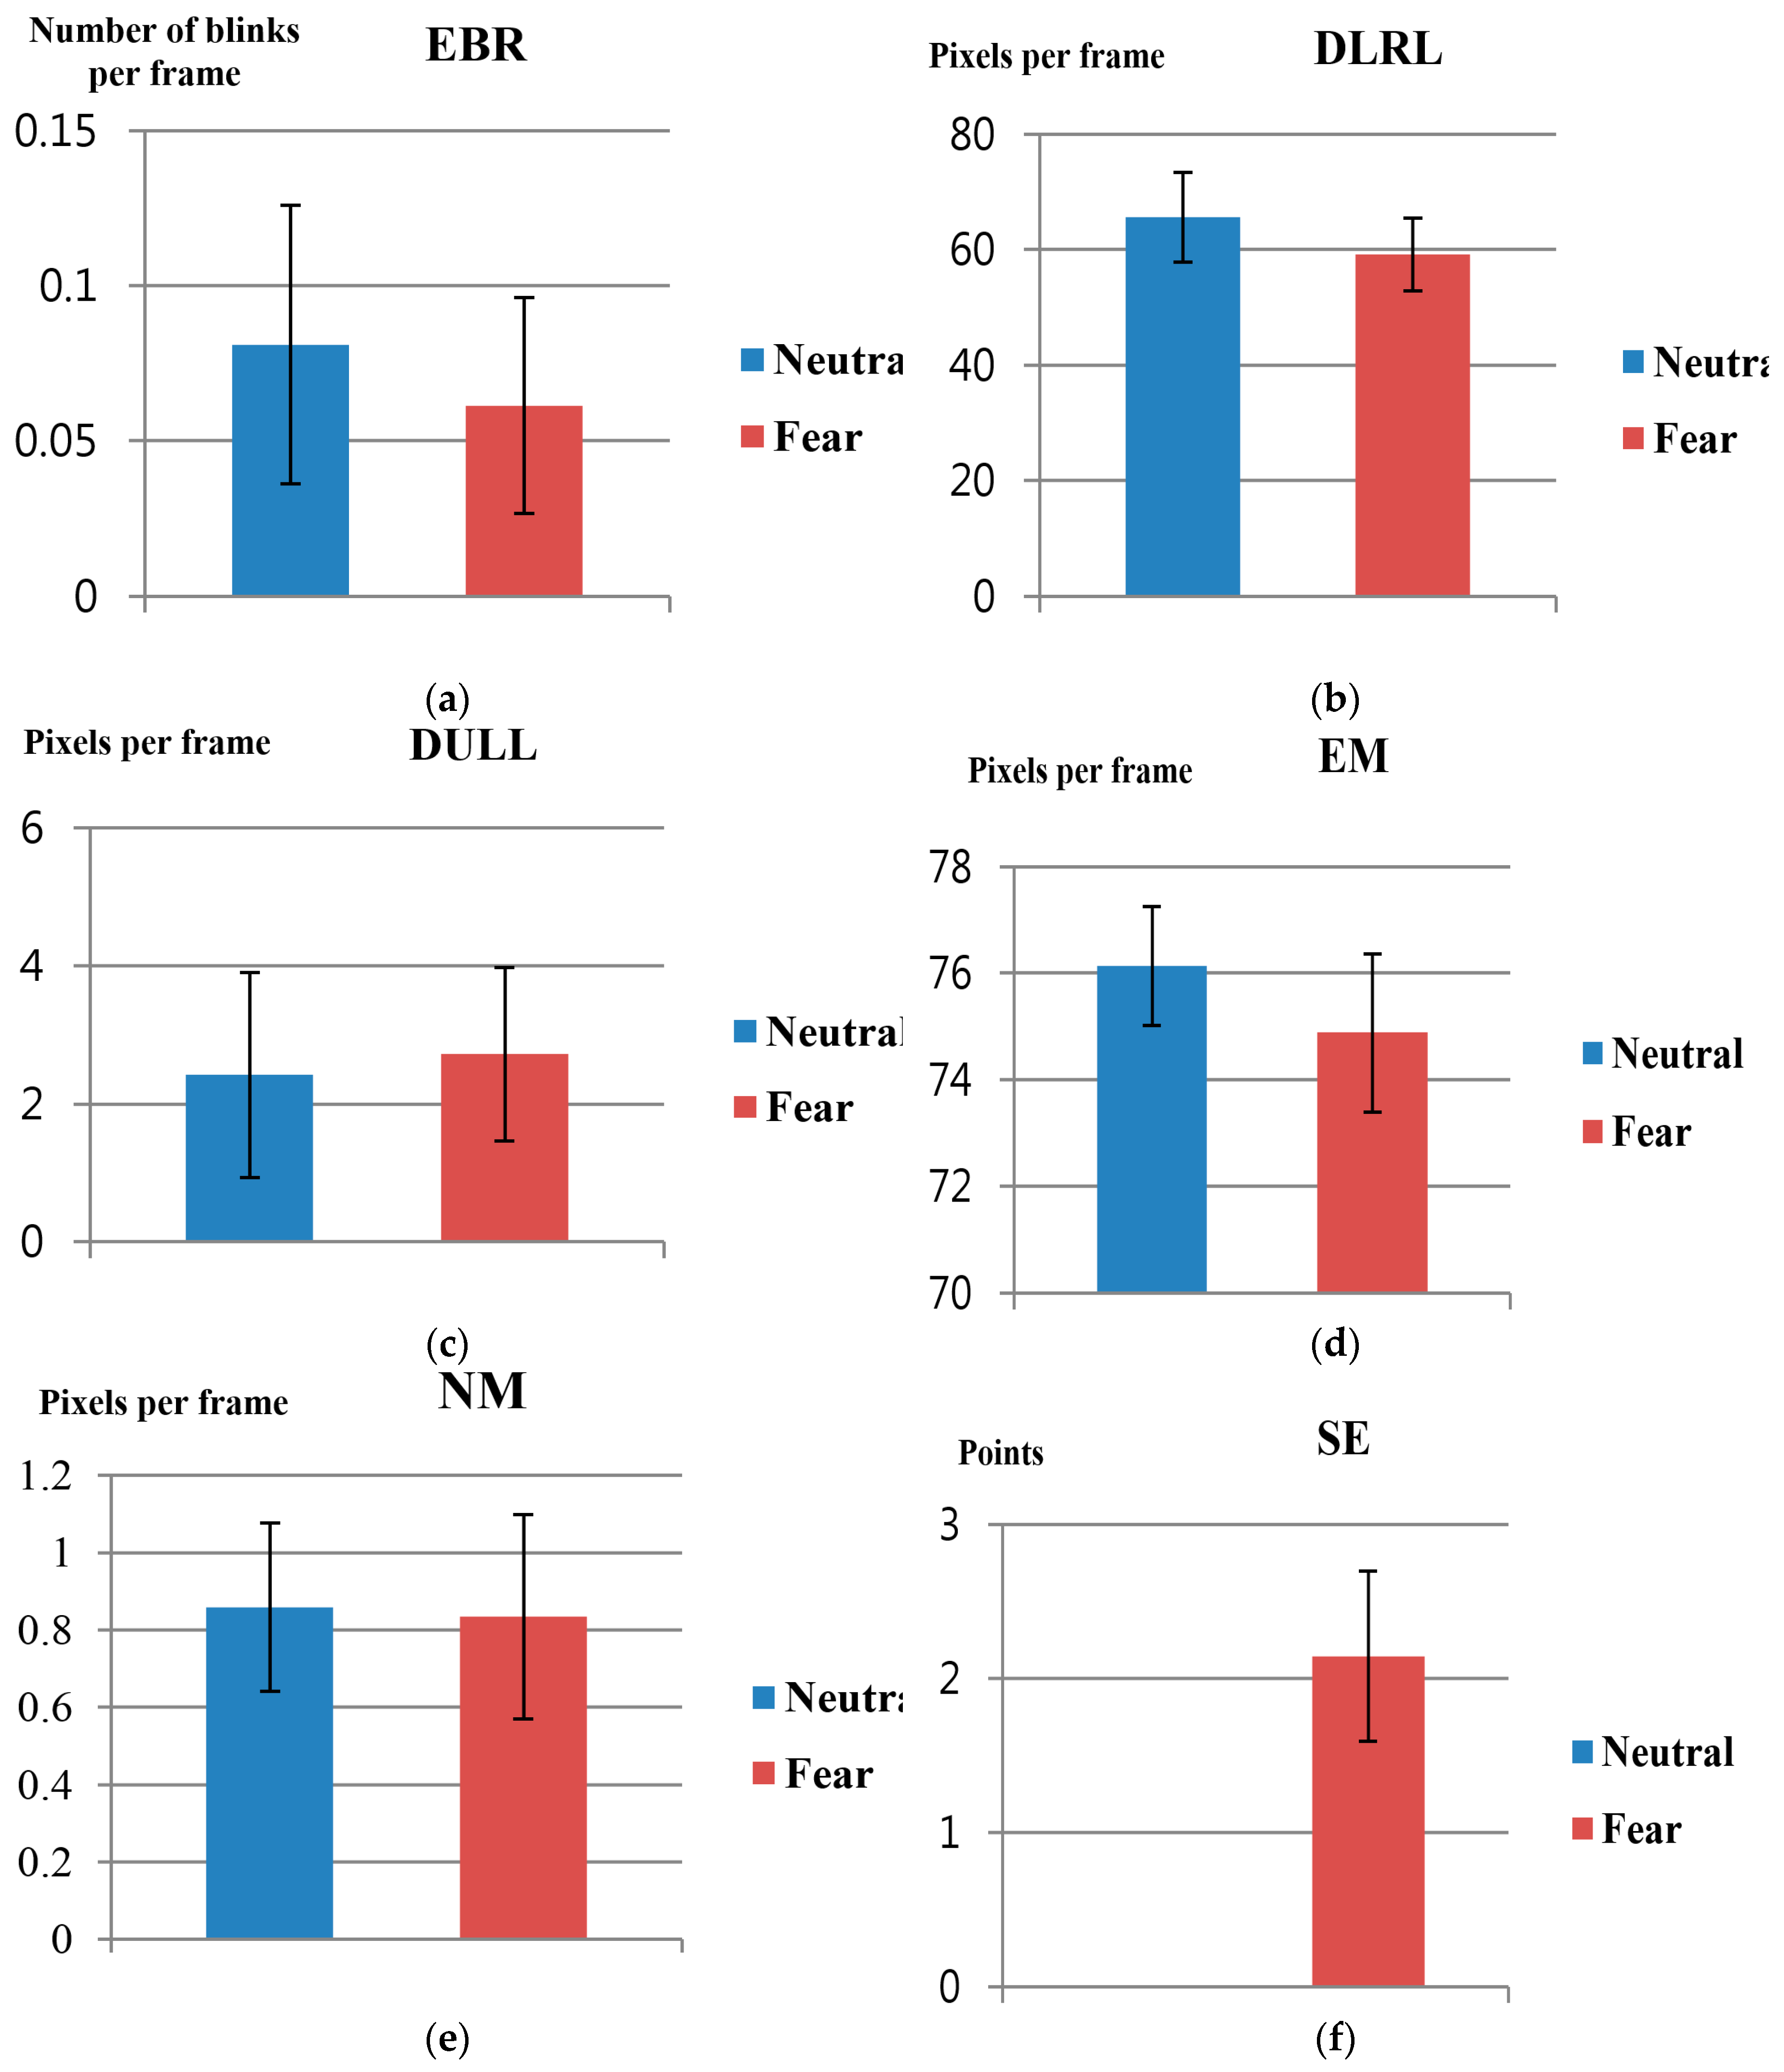
As a subsequent step, t-tests for feature values 3 to 8 (EBR, DLRL, DULL, EM, NM, and SE) explained in Section 3.4 and Section 3.5, were conducted. Here, the p-value for changes in feature value before and after watching neutral images versus before and after watching horror movies were also measured, as in Table 7 and Figure 14. As for SE, the average and standard deviation values were 0 since there was no difference in fear before and after watching neutral images.
In Table 7, as for SE (p-value: 1.97 × 10⁻⁹), it can be assumed that it indicates the confidence level of 99% since p < 0.01. In addition, as for DLRL (p-value = 0.021694) and EM (p-value = 0.013202), it can be assumed that it indicates the confidence level of 95% since p < 0.05. As for the rest: EBR, DULL and NM, it can be assumed that the results have lower confidence levels compared to SE, DLRL, and EM since the p-values are higher than 0.05 and also higher than those of SE, DLRL, and EM. From these findings, it can be inferred that FT, SE, DLRL, and EM are the most significant feature values as they show differences in values before and after watching neutral images vs. those before and after watching horror movies, based on confidence levels of 95%.
In addition, in this study, the confidence level of the feature values was double-checked through Cohen’s d analysis. The effect size obtained through the analysis is a descriptive statistic method used to indicate the confidence level of the observed phenomenon. In general, Cohen’s d values of 0.2, 0.5, and 0.8 are defined as small, medium, and large effect sizes, respectively [32,53]. Cohen’s d value shows the difference between two average values (before and after watching neutral images versus before and after watching horror movies), divided by the standard deviation of the data. Therefore, medium and large effect sizes suggest higher confidence levels for the difference between the two observed values than small effect sizes [32,53].
Table 8 shows Cohen’s d value and effect sizes of 8 feature values before and after watching neutral images versus before and after watching horror movies. For example, the Cohen’s d values for FT and EM are closer to 0.5 than to 0.8, thus falling into the category of medium effect size. For SE and DLRL, the values are closer to 0.8, thus falling into the category of large effect size. As shown in Table 8, since the Cohen’s d values for SE, FT, EM, and DLRL are greater than those of the rest of the four feature values (HR, EBR, DULL, and NM), while at the same time, corresponding to large effect sizes, it is suggested that the difference in values have a higher confidence level when watching horror movies than when watching neutral images.
Based on the results of the t-tests and Cohen’s d analysis, the four feature values (FT, SE, EM, and DLRL) with high confidence levels are used as input data to the fuzzy system in this study.
As a subsequent study, the accuracy level of fear recognition by the five defuzzification methods and Min or Max rule explained in Section 3.6 was measured. Since there was no ground-truth data on fear, the accuracy level was measured based on the correlation average between the value obtained by the proposed fuzzy system method and eight individual feature values (SE, FT, DLRL, EM, HR, EBR, DULL, and NM). As shown in Table 9, the average correlation value was the highest when the BOA method was used together with the Min rule. As for the COG, BOA, and MOM with Max rule, the average correlation values were not available (N/A) due to the final output values obtained by COG, BOA, and MOM with Max rule being 0.5 in all instances, thus resulting in 0 standard deviation and an inability to obtain correlation values.
Table 10 shows the average correlation values with the rest of feature values when each feature value was used individually and when the fuzzy system was used. We do not use any assumption that calculated correlation is positive or negative. Therefore, some correlation values are positive whereas others are negative. When we calculate the correlation average (sum), the original positive or negative correlation values are used (instead of the absolute value). From the study, it is seen that using output values from the fuzzy system—which uses four feature values (SE, FT, DLRL, and EM) selected through t-tests and Cohen’s d analysis as input data—higher average correlation values are observed compared to when using the other individual feature values. Based on this finding, it is suggested that the level of fear measured by the proposed methods has a higher confidence level. In addition, as shown in Table 10, the proposed method in this study was more accurate than the existing method [21], which uses SE, FT, and EBR individually. The existing study [27] also showed results where the average correlation values decrease in the following order: FT, SE, and EBR. The results derived from Table 10 indicate the same order, showing consistency with the existing study results. In terms of machine learning, more correlation can mean more redundancy. However, ground-truth value (ground-truth fear value in our research) is necessary to reduce the redundant features. For example, the optimal (reduced) number of features (eigenvectors) can be determined in principal component analysis (PCA) based on the minimum error between the ground-truth value and predicted one of training data [54]. In our research, we do not have ground-truth fear value. Therefore, we use the average correlation value as the selection criterion, with the assumption that all the feature values can be used as good predictors of fear.
We measured the average detection errors of 68 feature points of Figure 6a with experimental images. The average detection errors are 1.39 pixels, 1.81 pixels, and 2.73 pixels in the x-axis, y-axis, and diagonal directions, respectively. The detection error is measured based on the distance between the ground-truth position manually marked and that detected by our algorithm. To evaluate the impact of the error in the localization of feature points on the overall accuracy, we consider the eight cases that the errors (artificially and randomly generated) are reflected on the positions of detected feature points with some probability as shown in Table 11. The first one is that the maximum error of ±1 pixel is included in the detected feature positions with the probability of 30%, whereas the second one is that the maximum error of ±2 pixels is included in the detected positions with the probability of 30%. The third and fourth cases are that the same errors are reflected with a probability of 50%. The fifth one is that the maximum error of ±3 pixels is included in the detected positions with the probability of 30%, whereas the sixth is that the maximum error of ±4 pixels is reflected on the detected positions with the probability of 30%. The seventh and eighth cases are that the same errors are included with the probability of 50%. Because these errors are included in the x and y positions of the detected feature points, the maximum error of ±1 corresponds to about 55.2% ~ 71.9% of the average detection errors (1.39 pixels and 1.81 pixels in x-axis and y-axis directions, respectively), whereas the maximum error of ±2 corresponds to about 110.5% ~ 143.9% of the average detection errors. In addition, the maximum errors of ±3 and ±4 correspond to about 165.7% ~ 215.8% and 221% ~ 287.8% of the average detection errors.
As shown in Table 10, the accuracy of our system is shown based on the correlation average with the rest of feature values (SE, FT, EBR, DLRL, DULL, NM, HR, and EM), and the higher correlation average represents the higher accuracy of fear evaluation. As shown in Table 11, in the first, second and third cases, the correlation average is 0.2651 which is same to our original result (where no error is included). In the fourth case (maximum error of ±2 pixels with probability of 50%), the correlation average is a little reduced, but the decrement is very small (0.0001) compared to our original result of 0.2651. However, in case the maximum error is increased to ±3 pixels or ±4 pixels (from the fifth to the eighth cases), the decrement of correlation average is increased, as shown in Table 11. From that, we can confirm that the impact of error in the localization of the facial feature points on the overall accuracy is low until the error reaches a maximum of ±2 pixels (110.5% ~ 143.9% of the average detection errors).
As shown in Table 5 and Table 7, the p-values of FT and SE are lower than 0.01 (confidence level of 99%) whereas those of DLRL and EM belongs to the range from 0.01 to 0.05 (confidence level of 95%). Therefore, the credibility of FT and SE is regarded as being higher than that of DLRL and EM. Based on that, we used the threshold of 0.3 in order to separate the four feature values of Table 4 into two groups: FT with SE, and DLRL with EM. From them, we assigned the higher values for the first group (FT with SE) than the second group (DLRL with EM) in case of “H”, as shown in Table 3. The other parameters of 0.5 and 0.25 for “H” (of the first and second groups) in Table 3 were heuristically determined. By observing the small (preliminary) experimental data, we tried to find the optimal parameters, and these data were not used for our testing of Section 4 for fair experiments. We evaluated the robustness of our method with respect to the parameters as shown in Table 12. For example, the first case of Table 12 shows that the values of 0.5 and 0.15 are assigned to “H” in Table 3 for the first (FT and SE) and second (DLRL and EM) groups, respectively. The sixth case of Table 12 shows that the threshold of 0.2 is used for Table 4, that is, SE, FT, and EM become the first group whereas DLRL is the second group. As shown in Table 12, the correlation average with our original parameters is higher than other cases. From that, we can confirm that our parameters can be regarded as optimal, and the accuracy can be reduced with other parameters.
As the last experiment, we compared the performance in case of using seven features (without SE) and eight features (with SE). In Figure 7, we replaced SE by HR which was selected in terms of smaller p-value of Table 5, Table 6 and Table 7 and higher Cohen’s d value of Table 8, and these four objective feature values of DLRL, EM, FT, and HR are combined by our fuzzy system. As shown in Table 13, experimental results showed that the proposed method was more accurate than other methods, and its accuracy was higher than those in the case of using eight feature values including SE of Table 10. From that, we can find that the accurate evaluation of fear can be possible only with four objective features values of DLRL, EM, FT, and HR based on our fuzzy system.
In order to measure the performance based on the machine learning approach (as a support vector machine), the ground-truth (desired) output is required for all the training data. However, in our case, there is no ground-truth (desired) output of level of fear, and it is difficult to manually determine the output value. For example, with one horror movie, we cannot determine the ground-truth level of fear, which can be different in different people. Therefore, a comparison with machine learning approaches cannot be performed. In contrast, our fuzzy system-based evaluation method of fear produces a level of fear in the range of 0 to 1, which does not require a training procedure with the ground-truth (desired) output of level of fear.
The main application of our system is for the quantitative evaluation of the level of fear induced by commercial horror movies. When a moviemaker makes horror movies, it is very difficult to quantitatively and objectively evaluate the level of fear that audiences would feel. Therefore, it has been evaluated based only on subjective tests using audience questionnaires. However, the results can be highly affected by the physical, psychological, or fatigue condition of participants, so these questionnaires cannot show the accurate and objective measurement of the level of fear. Therefore, we propose the multimodalities-based fear evaluation method using 4four features such as DLRL, EM by near-infrared (NIR) light camera, FT by thermal camera, and SE. In addition, by using four objective features except for SE and combining them in a fuzzy system, our system can produce the accurate level of fear not affected by the physical, psychological or fatigue condition of participants on SE. Therefore, we performed various tests with four commercial horror movies [48,49,50,51] with the prototype of our system as shown in Section 4. This kind of evaluation of the level of fear can be actually performed with some participants before final production and release of horror movie. For example, if a movie scene cannot cause a high level of fear of participants, the moviemaker can revise the scene by including additional sound effects or lighting, etc., while doing the post-processing. This can be feasible considering the conventional procedures of moviemaking. Therefore, our system cannot be attached to the ceiling or walls at a great distance from the audience. Instead, our system can be used at a distance of about 70 cm in front of the audience (not obscuring the line of sight) as shown in Figure 2, and experiments were performed according to the scenarios of Figure 11 considering the situation of evaluation of the level of fear with some participants before final production and release of a horror movie. Our system can also be used for quantitative evaluation of the level of fear of a horror drama, advertisement, or game before final production and release. In addition, we can consider a scenario of using our system for monitoring the clerk in a convenience store. By attaching our system on a low ceiling in front of the clerk at the counter (at a distance of about 70 cm), based on the evaluated level of fear, our system can perceive an emergency situation that the clerk cannot report to the police although he or she is being threatened by a robber. In this case, our system can automatically call the police.
Because our fuzzy system produces an output in the range of 0 to 1, 0 represents no fear and 1 shows the highest level of fear. Therefore, our system can evaluate the intensity (continuous level) of fear. Ekman defined the emotions and the activation of action unit. According to his research [55], fear is related to the movement of action units of eyebrow and lip, etc. Because our experimental results showed that EM and DLRL are more affected by fear, as shown in Table 8, our results are consistent with the studies by Ekman. However, he did not define the changes in facial temperatures or heart rate in case of fear, so we also measured these features of changes in FT and HR by thermal camera. Fear can be confused with anger in many cases. Also in our experiments, the measured emotion can be a mixture of fear and anger instead of only fear. However, separating fear alone from mixed emotions was not attempted in our research, as it can be regarded as very challenging work. Nevertheless, just for the applications mentioned above, the fear confused with other emotions measured by our system can be useful. In addition, DLRL is only affected by fear (not by other emotions such as happiness, sadness, surprise, anger, disgust, and contempt), as shown in the studies by Ekman [55]. Because we use DLRL and SE with a questionnaire only about fear (as shown in Table 2) for two inputs to fuzzy system as shown in Figure 7, we can guess that fear is the largest component of the measured emotion. In future work, we would do more intensive research on measuring only fear by separating it from other emotions.
5. Conclusions
This study proposes a new method of fear recognition based on combined multi-modalities, by a fuzzy system, which uses contactless thermal and NIR cameras. Four feature values are selected through t-tests and Cohen’s d analysis out of a total of eight feature values and used as input data to the fuzzy system. The accuracy level of fear recognition is improved by applying the weighted value of a fuzzy rule table differently, based on the confidence level of the correlation sum between the selected four feature values. The feature values measured when study subjects were watching standard neutral images from IAPS before watching horror movies are also used as reference values to compensate for individual differences regarding fear. From the study, it is shown that the level of accuracy and confidence in fear recognition is improved using the proposed fuzzy system method with combined multi-modalities, compared to using single modality-based or other existing methods. The potential application of the proposed method in the recognition of other emotions (apart from fear) as well as in real-life situations (e.g., automotive environments for the measurement of driver anxiety or impatience) will form the basis of future studies. In addition, we would research a method to project fear by its coordinates on two scales, valence and arousal, in future work.
Acknowledgments
This research was supported by the Basic Science Research Program through the National Research Foundation of Korea (NRF) funded by the Ministry of Education (NRF-2015R1D1A1A01056761), in part by the Bio & Medical Technology Development Program of the NRF funded by the Korean government, MSIP (NRF-2016M3A9E1915855), and in part by the Basic Science Research Program through the National Research Foundation of Korea (NRF) funded by the Ministry of Education (NRF-2017R1D1A1B03028417).
Author Contributions
Kwan Woo Lee and Kang Ryoung Park designed the fuzzy system-based fear evaluation, and wrote the paper. Hyung Gil Hong helped to implement the algorithm of facial feature detection and experiments.
Conflicts of Interest
The authors declare no conflict of interest.
References
- Kwon, D.-S.; Kwak, Y.K.; Park, J.C.; Chung, M.J.; Jee, E.-S.; Park, K.-S.; Kim, H.-R.; Kim, Y.-M.; Park, J.-C.; Kim, E.H.; et al. Emotion interaction system for a service robot. In Proceedings of the 16th IEEE International Conference on Robot and Human Interactive Communication, Jeju, Korea, 26–29 August 2007; pp. 351–356. [Google Scholar]
- Machot, F.A.; Mosa, A.H.; Dabbour, K.; Fasih, A.; Schwarzlmüller, C.; Ali, M.; Kyamakya, K. A novel real-time emotion detection system from audio streams based on Bayesian quadratic discriminate classifier for ADAS. In Proceedings of the Joint 3rd International Workshop on Nonlinear Dynamics and Synchronization and 16th International Symposium on Theoretical Electrical Engineering, Klagenfurt, Austria, 25–27 July 2011; pp. 1–5. [Google Scholar]
- Corden, B.; Critchley, H.D.; Skuse, D.; Dolan, R.J. Fear recognition ability predicts differences in social cognitive and neural functioning in men. J Cogn Neurosci. 2006, 18, 889–897. [Google Scholar] [CrossRef] [PubMed]
- Roy, S.; Gosselin, N.; Gosselin, F.; Peretz, I. On the neural mechanism of fear recognition. J. Vis. 2009, 9, 470. [Google Scholar] [CrossRef]
- Skuse, D. Fear recognition and the neural basis of social cognition. Child Adolesc. Ment. Health 2003, 8, 50–60. [Google Scholar] [CrossRef]
- Visser-Keizer, A.C.; Westerhof-Evers, H.J.; Gerritsen, M.J.J.; van der Naalt, J.; Spikman, J.M. To fear is to gain? The role of fear recognition in risky decision making in TBI patients and healthy controls. PLoS ONE 2016, 11, e0166995. [Google Scholar] [CrossRef] [PubMed]
- De Gelder, B.; Pourtois, G.; Weiskrantz, L. Fear recognition in the voice is modulated by unconsciously recognized facial expressions but not by unconsciously recognized affective pictures. Proc. Natl. Acad. Sci. USA 2002, 99, 4121–4126. [Google Scholar] [CrossRef] [PubMed]
- Facial Recognition Software SHORE™: Fast, Reliable and Real-time Capable. Available online: http://www.iis.fraunhofer.de/en/ff/bsy/tech/bildanalyse/shore-gesichtsdetektion.html (accessed on 17 October 2016).
- Strupp, S.; Schmitz, N.; Berns, K. Visual-based emotion detection for natural man-machine interaction. Lect. Notes Artif. Intell. 2008, 5243, 356–363. [Google Scholar]
- Sun, Y.; Sebe, N.; Lew, M.S.; Gevers, T. Authentic emotion detection in real-time video. Lect. Notes Comput. Sci. 2004, 3058, 94–104. [Google Scholar]
- Cohen, I.; Sebe, N.; Garg, A.; Chen, L.S.; Huang, T.S. Facial expression recognition from video sequences: Temporal and static modeling. Comput. Vis. Image Underst. 2003, 91, 160–187. [Google Scholar] [CrossRef]
- Cowie, R.; Douglas-Cowie, E.; Tsapatsoulis, N.; Votsis, G.; Kollias, S.; Fellenz, W.; Taylor, J.G. Emotion recognition in human-computer interaction. IEEE Signal Process. Mag. 2001, 18, 32–80. [Google Scholar] [CrossRef]
- Pal, P.; Iyer, A.N.; Yantorno, R.E. Emotion detection from infant facial expressions and cries. In Proceedings of the IEEE International Conference on Acoustics Speech and Signal Processing, Toulouse, France, 14–19 May 2006; pp. II-721–II-724. [Google Scholar]
- De silva, L.C.; Miyasato, T.; Nakatsu, R. Facial emotion recognition using multi-modal information. In Proceedings of the International Conference on Information, Communications and Signal Processing, Singapore, 9–12 September 1997; pp. 397–401. [Google Scholar]
- Minkin, V.A.; Nikolaenko, N.N. Application of vibraimage technology and system for analysis of motor activity and study of functional state of the human body. Biomed. Eng. 2008, 42, 196–200. [Google Scholar] [CrossRef]
- Pavlidis, I.; Levine, J.; Baukol, P. Thermal image analysis for anxiety detection. Proceedings of IEEE International Conference on Image Processing, Thessaloniki, Greece, 7–10 October 2001; pp. 315–318. [Google Scholar]
- Eom, J.-S.; Sohn, J.-H. Emotion recognition using facial thermal images. J. Ergon. Soc. Korea 2012, 31, 427–435. [Google Scholar] [CrossRef]
- Bedoya-Jaramillo, S.; Belalcazar-Bolaños, E.; Villa-Cañas, T.; Orozco-Arroyave, J.R.; Arias-Londoño, J.D.; Vargas-Bonilla, J.F. Automatic emotion detection in speech using mel frequency cesptral coefficients. In Proceedings of the XVII Symposium of Image, Signal Processing, and Artificial Vision, Medellín, Colombia, 12–14 September 2012; pp. 62–65. [Google Scholar]
- Sanchez, M.H.; Tur, G.; Ferrer, L.; Hakkani-Tür, D. Domain adaptation and compensation for emotion detection. In Proceedings of the Interspeech 2010, Makuhari, Japan, 26–30 September 2010; pp. 2874–2877. [Google Scholar]
- Agrafioti, F.; Hatzinakos, D.; Anderson, A.K. ECG pattern analysis for emotion detection. IEEE Trans. Affect. Comput. 2012, 3, 102–115. [Google Scholar] [CrossRef]
- Lin, Y.-P.; Wang, C.-H.; Wu, T.-L.; Jeng, S.-K.; Chen, J.-H. EEG-based emotion recognition in music listening: a comparison of schemes for multiclass support vector machine. In Proceedings of the IEEE International Conference on Acoustics, Speech and Signal Processing, Taipei, Taiwan, 19–24 April 2009; pp. 489–492. [Google Scholar]
- Cheemalapati, S.; Gubanov, M.; Vale, M.D.; Pyayt, A. A real-time classification algorithm for emotion detection using portable EEG. In Proceedings of the 14th International Conference on Information Reuse and Integration, San Francisco, CA, USA, 14–16 August 2013; pp. 720–723. [Google Scholar]
- Schutter, D.J.L.G.; van Honk, J. Electrophysiological ratio markers for the balance between reward and punishment. Cogn. Brain Res. 2005, 24, 685–690. [Google Scholar] [CrossRef] [PubMed]
- Putman, P.; van Peer, J.; Maimari, I.; van der Werff, S. EEG theta/beta ratio in relation to fear-modulated response-inhibition, attentional control, and affective traits. Biol. Psychol. 2010, 83, 73–78. [Google Scholar] [CrossRef] [PubMed]
- Kim, K.H.; Bang, S.W.; Kim, S.R. Emotion recognition system using short-term monitoring of physiological signals. Med. Biol. Eng. Comput. 2004, 42, 419–427. [Google Scholar] [CrossRef] [PubMed]
- Hermans, E.J.; Ramsey, N.F.; van Honk, J. Exogenous testosterone enhances responsiveness to social threat in the neural circuitry of social aggression in humans. Biol. Psychiatry 2008, 63, 263–270. [Google Scholar] [CrossRef] [PubMed]
- Choi, J.-S.; Bang, B.J.; Heo, H.; Park, K.R. Evaluation of fear using nonintrusive measurement of multimodal sensors. Sensors 2015, 15, 17507–17533. [Google Scholar] [CrossRef] [PubMed]
- Baumgarter, T.; Esslen, M.; Jäncke, L. From emotion perception to emotion experience: Emotions evoked by pictures and classical music. Int. J. Psychophysiol. 2006, 60, 34–43. [Google Scholar] [CrossRef] [PubMed]
- Cheng, K.-S.; Chen, Y.-S.; Wang, T. Physiological parameters assessment for emotion recognition. In Proceedings of the IEEE EMBS International Conference on Biomedical Engineering and Sciences, Langkawi, Malaysia, 17–19 December 2012; pp. 995–998. [Google Scholar]
- Chun, J.; Lee, H.; Park, Y.S.; Park, W.; Park, J.; Han, S.H.; Choi, S.; Kim, G.H. Real-time classification of fear/panic emotion based on physiological signals. In Proceedings of the Eighth Pan-Pacific Conference on Occupational Ergonomics, Bangkok, Thailand, 17–19 October 2007. [Google Scholar]
- Moser, B.K.; Stevens, G.R.; Watts, C.L. The two-sample test versus Satterthwaite’s approximate f-test. Commun Statist Theory Meth. 1989, 18, 3963–3975. [Google Scholar] [CrossRef]
- Nakagawa, S.; Cuthill, I.C. Effect size, confidence interval and statistical significance: a practical guide for biologists. Biol. Rev. 2007, 82, 591–605. [Google Scholar]
- Tau®2 Uncooled Cores. Available online: http://www.flir.com/cores/display/?id=54717 (accessed on 14 October 2016).
- Webcam C600. Available online: http://www.logitech.com/en-us/support/5869 (accessed on 14 October 2016).
- SFH 4550. Available online: http://www.osram-os.com/Graphics/XPic3/00116140_0.pdf (accessed on 14 October 2016).
- Samsung Smart TV. Available online: http://www.samsung.com/us/system/consumer/product/un/60/es/un60es8000fxza/7654_SlimLED_60_8000_V14.pdf (accessed on 14 October 2016).
- Sugawara, M.; Masaoka, K.; Emoto, M.; Matsuo, Y.; Nojiri, Y. Research on human factors in ultrahigh-definition television (UHDTV) to determine its specifications. SMPTE Motion Imaging J. 2008, 117, 23–29. [Google Scholar] [CrossRef]
- Suh, K.H.; Lee, E.C. Face liveness detection for face recognition based on cardiac features of skin color image. Proc. SPIE 2016, 10011, 100110C-1–100110C-5. [Google Scholar]
- Dlib C++ Library (Real-time face pose estimation). Available online: http://blog.dlib.net/2014/08/real-time-face-pose-estimation.html (accessed on 3 November 2016).
- Kazemi, V.; Sullivan, J. One millisecond face alignment with an ensemble of regression trees. In Proceedings of the IEEE Conference on Computer Vision and Pattern Recognition, Columbus, OH, USA, 23–28 June 2014; pp. 1867–1874. [Google Scholar]
- Suh, K.H.; Kim, Y.; Lee, E.C. Facial feature movements caused by various emotions: differences according to sex. Symmetry-Basel 2016, 8, 86. [Google Scholar] [CrossRef]
- Barua, A.; Mudunuri, L.S.; Kosheleva, O. Why trapezoidal and triangular membership functions work so well: Towards a theoretical explanation. J. Uncertain Syst. 2014, 8, 164–168. [Google Scholar]
- Dowdy, S.; Wearden, S. Statistics for Research; John Wiley & Sons: Somerset, United States, 1983. [Google Scholar]
- Amindoust, A.; Ahmed, S.; Saghafinia, A.; Bahreininejad, A. Sustainable supplier selection: A ranking model based on fuzzy inference system. Appl. Soft. Comput. 2012, 12, 1668–1677. [Google Scholar] [CrossRef]
- Aboelela, E; Douligeris, C. Fuzzy temporal reasoning model for event correlation in network management. In Proceedings of the IEEE International Conference on Local Computer Networks, Lowell, MA, USA, 18–20 October 1999; pp. 150–159. [Google Scholar]
- Leekwijck, W.V.; Kerre, E.E. Defuzzification: Criteria and classification. Fuzzy Sets Syst. 1999, 108, 159–178. [Google Scholar] [CrossRef]
- Broekhoven, E.V.; Baets, B.D. Fast and accurate center of gravity defuzzification of fuzzy system outputs defined on trapezoidal fuzzy partitions. Fuzzy Sets Syst. 2006, 157, 904–918. [Google Scholar] [CrossRef]
- Epitaph (2007 Film). Available online: https://en.wikipedia.org/wiki/Epitaph_(2007_film) (accessed on 21 October 2016).
- The Conjuring. Available online: https://en.wikipedia.org/wiki/The_Conjuring (accessed on 21 October 2016).
- Dead Silence. Available online: https://en.wikipedia.org/wiki/Dead_Silence (accessed on 21 October 2016).
- Insidious (Film). Available online: https://en.wikipedia.org/wiki/Insidious_(film) (accessed on 21 October 2016).
- Lang, P.J.; Bradley, M.M.; Cuthbert, B.N. International Affective Picture System (IAPS): Affective Ratings of Pictures and Instruction Manual; Technical Report A-8; University of Florida: Gainesville, FL, USA, 2008. [Google Scholar]
- Cohen, J. A power primer. Psychol. Bull. 1992, 112, 155–159. [Google Scholar] [CrossRef] [PubMed]
- Turk, M.; Pentland, A. Eigenfaces for recognition. J. Cogn. Neurosci. 1991, 3, 71–86. [Google Scholar] [CrossRef] [PubMed]
- Friesen, W.V.; Ekman, P. EMFACS-7: Emotional Facial Action Coding System; University of California: San Francisco, CA, USA, 1984; unpublished manuscript. [Google Scholar]
Figure 1.
Flow chart of proposed method.
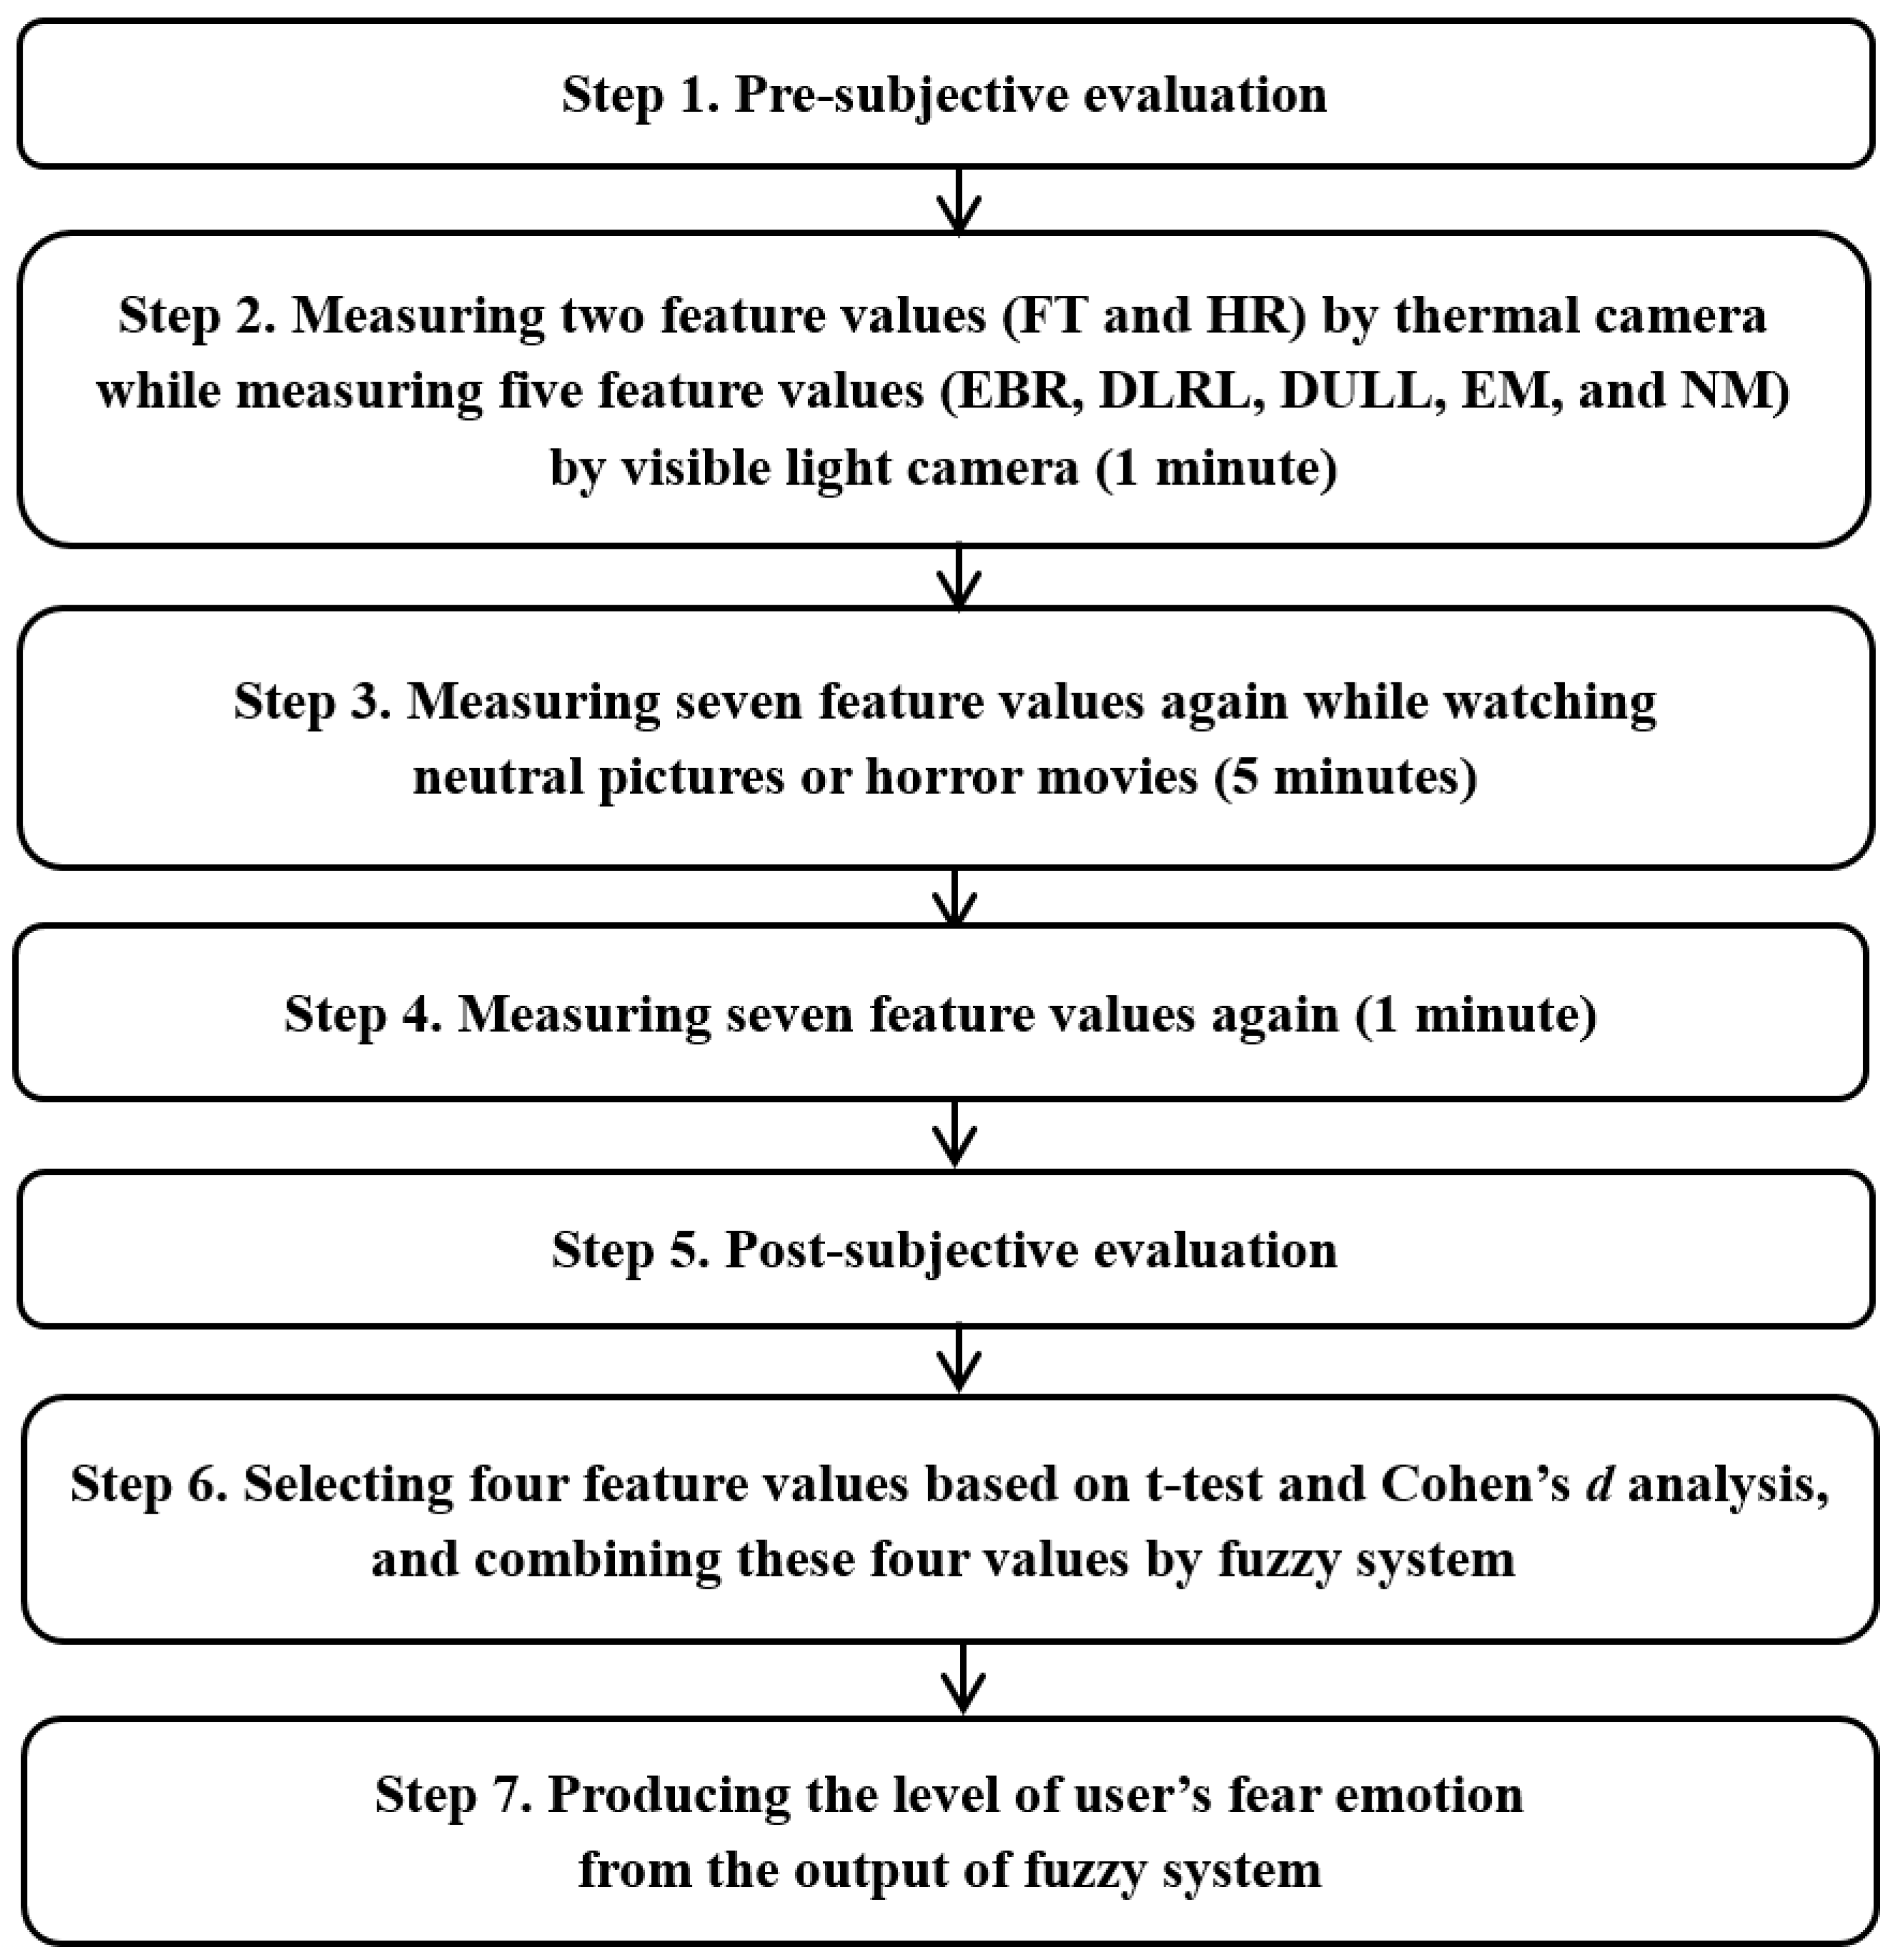
Figure 2.
Thermal and NIR camera-based environmental conditions adopted in this study for the recognition of subjects’ fear.
Figure 2.
Thermal and NIR camera-based environmental conditions adopted in this study for the recognition of subjects’ fear.
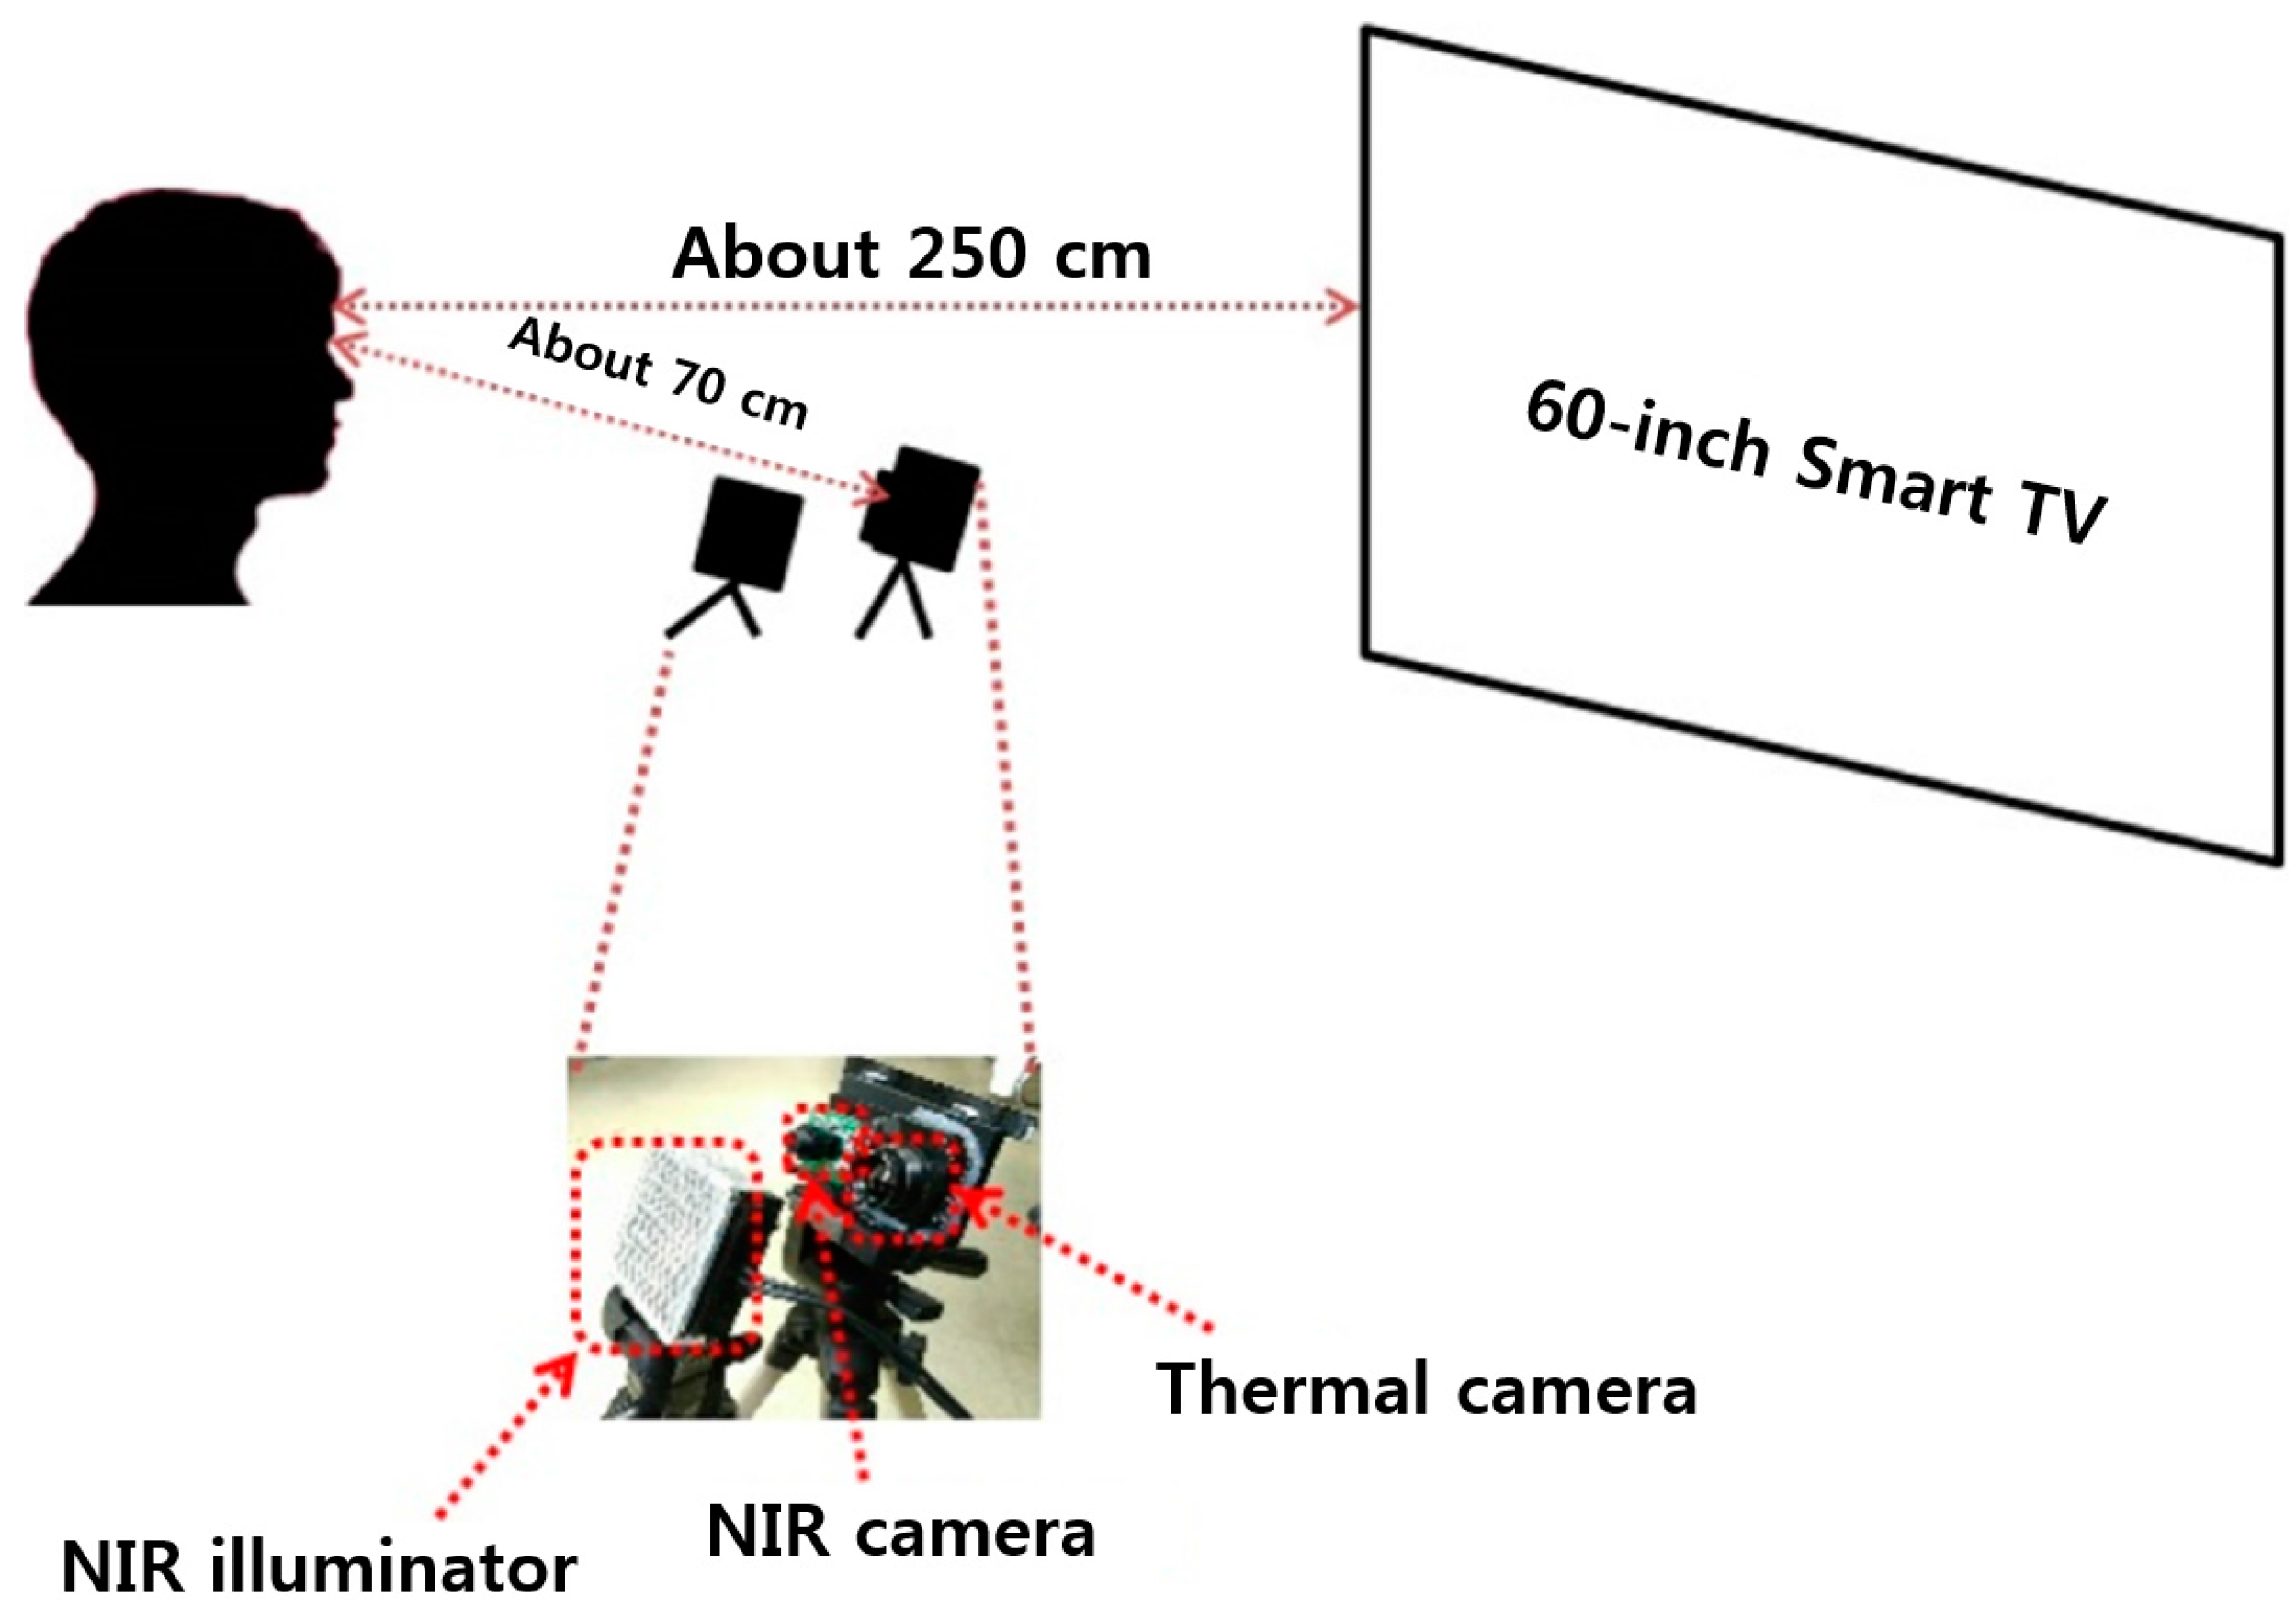
Figure 3.
Face images captured by dual camera system of near-infrared (NIR) and thermal cameras.
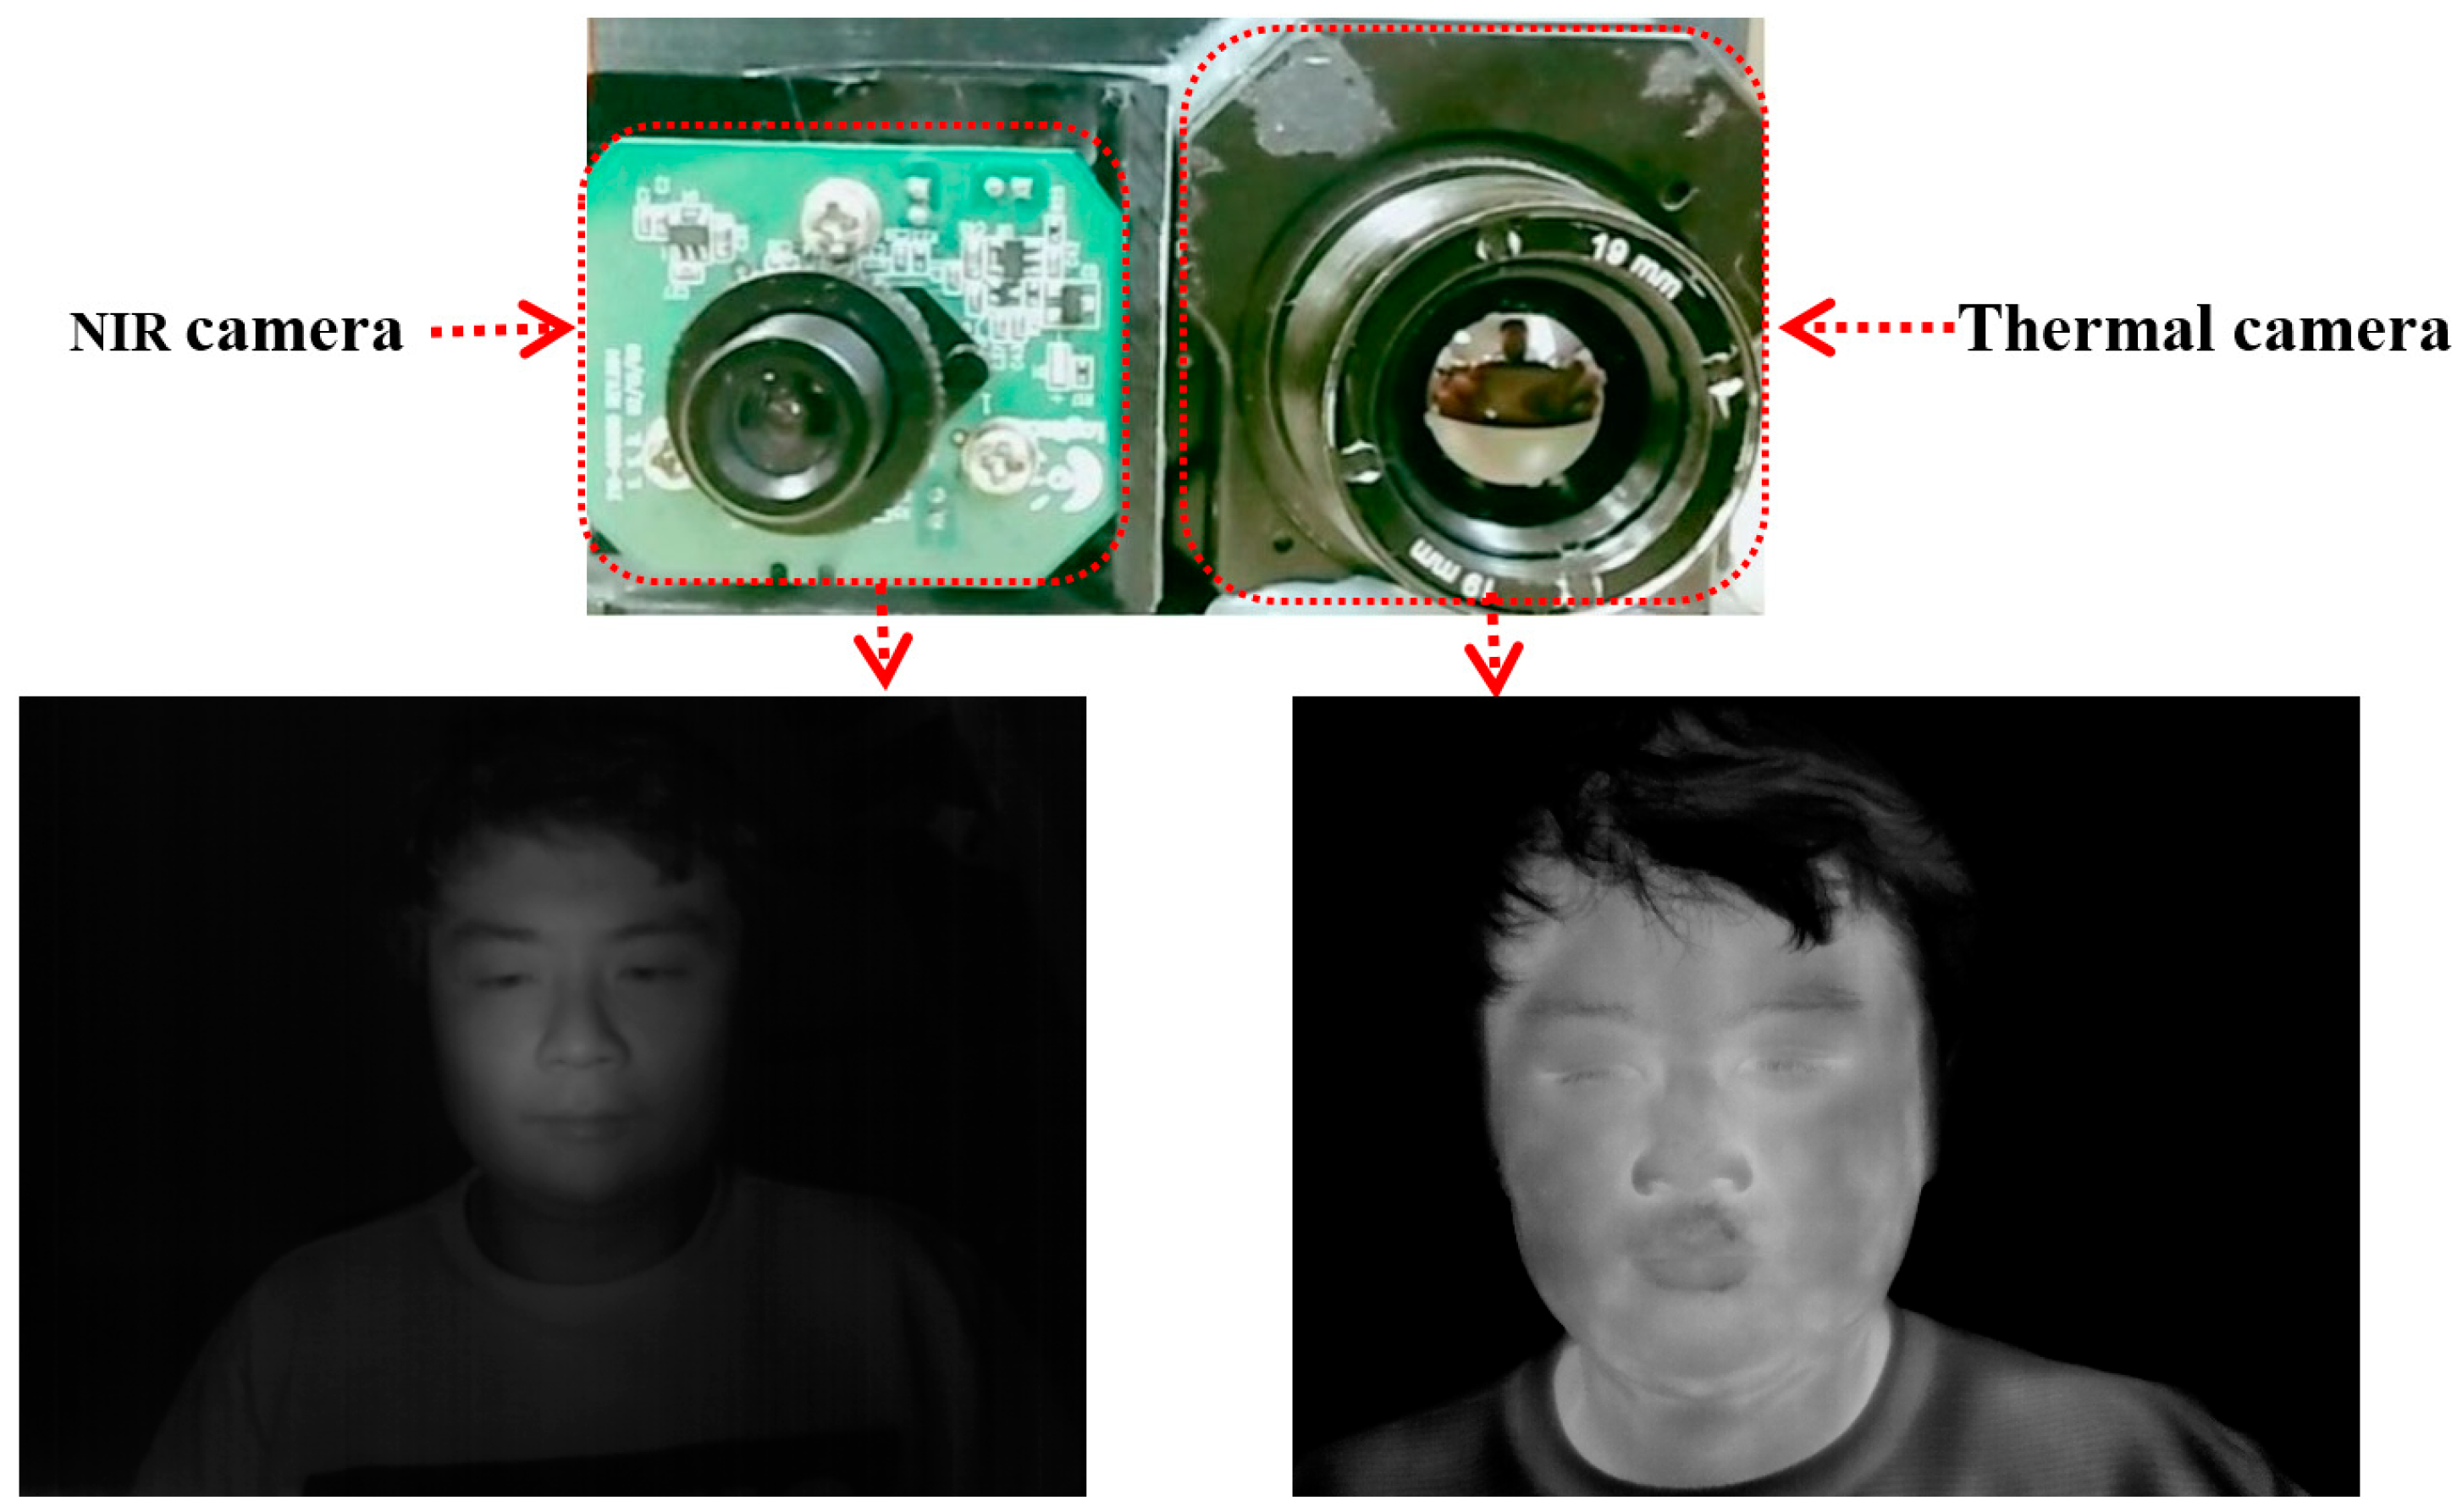
Figure 4.
Calibration between NIR and thermal camera images using a checker board.

Figure 5.
Symmetrical ROIs for FT measurement on thermal camera images determined by geometric transform matrix: (a) ROIs on NIR camera images; (b) ROIs on thermal camera images.
Figure 5.
Symmetrical ROIs for FT measurement on thermal camera images determined by geometric transform matrix: (a) ROIs on NIR camera images; (b) ROIs on thermal camera images.
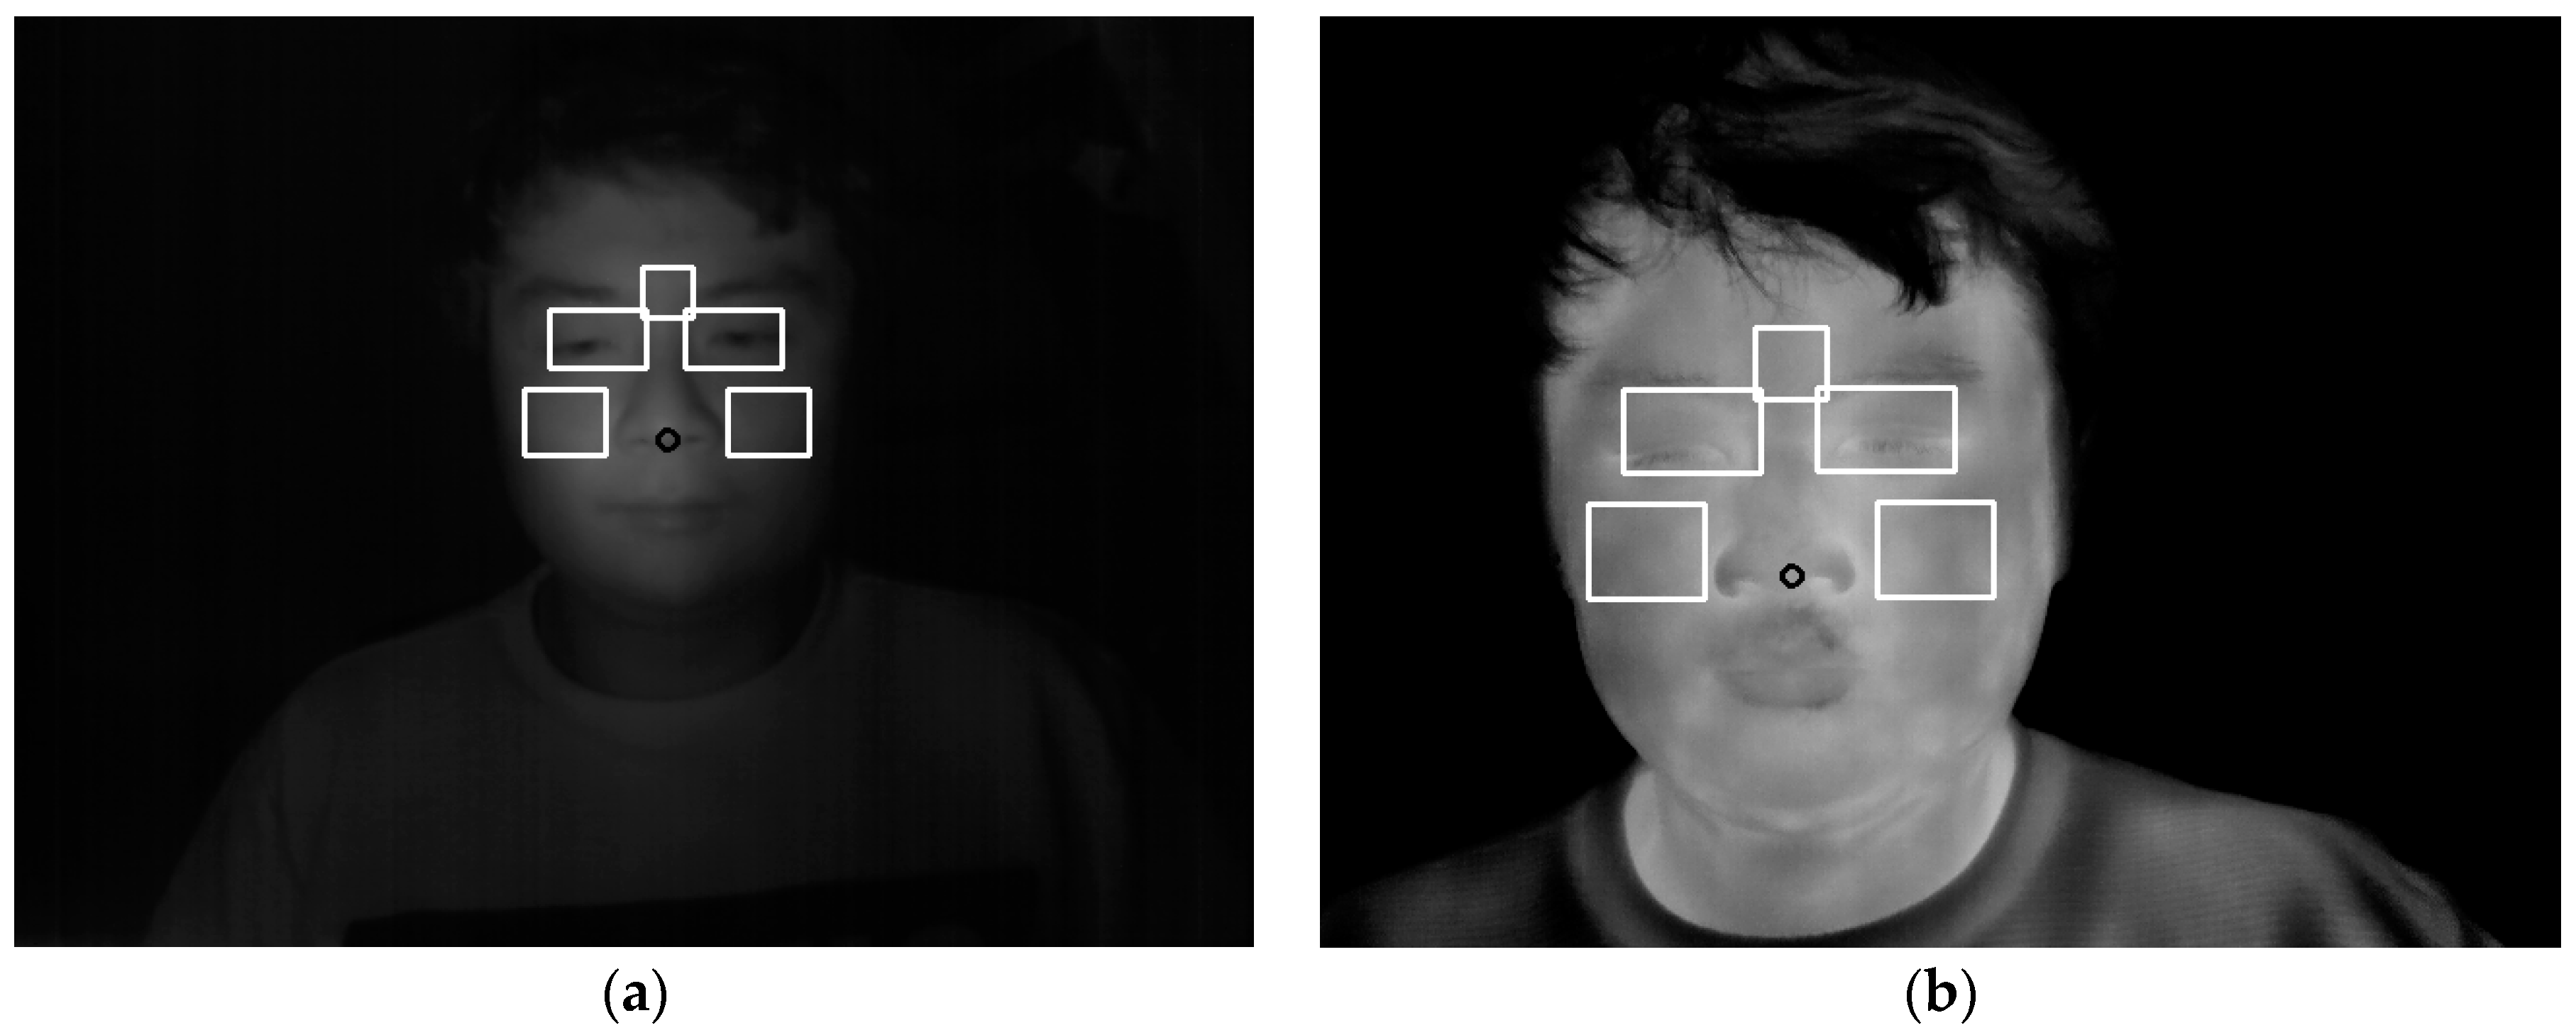
Figure 6.
Examples of the 68 feature points extracted from the facial region on the NIR camera image (each no. indicates the index no. of feature points): (a) an example of the extracted 68 feature points; (b) an example of the feature points on an NIR camera image.
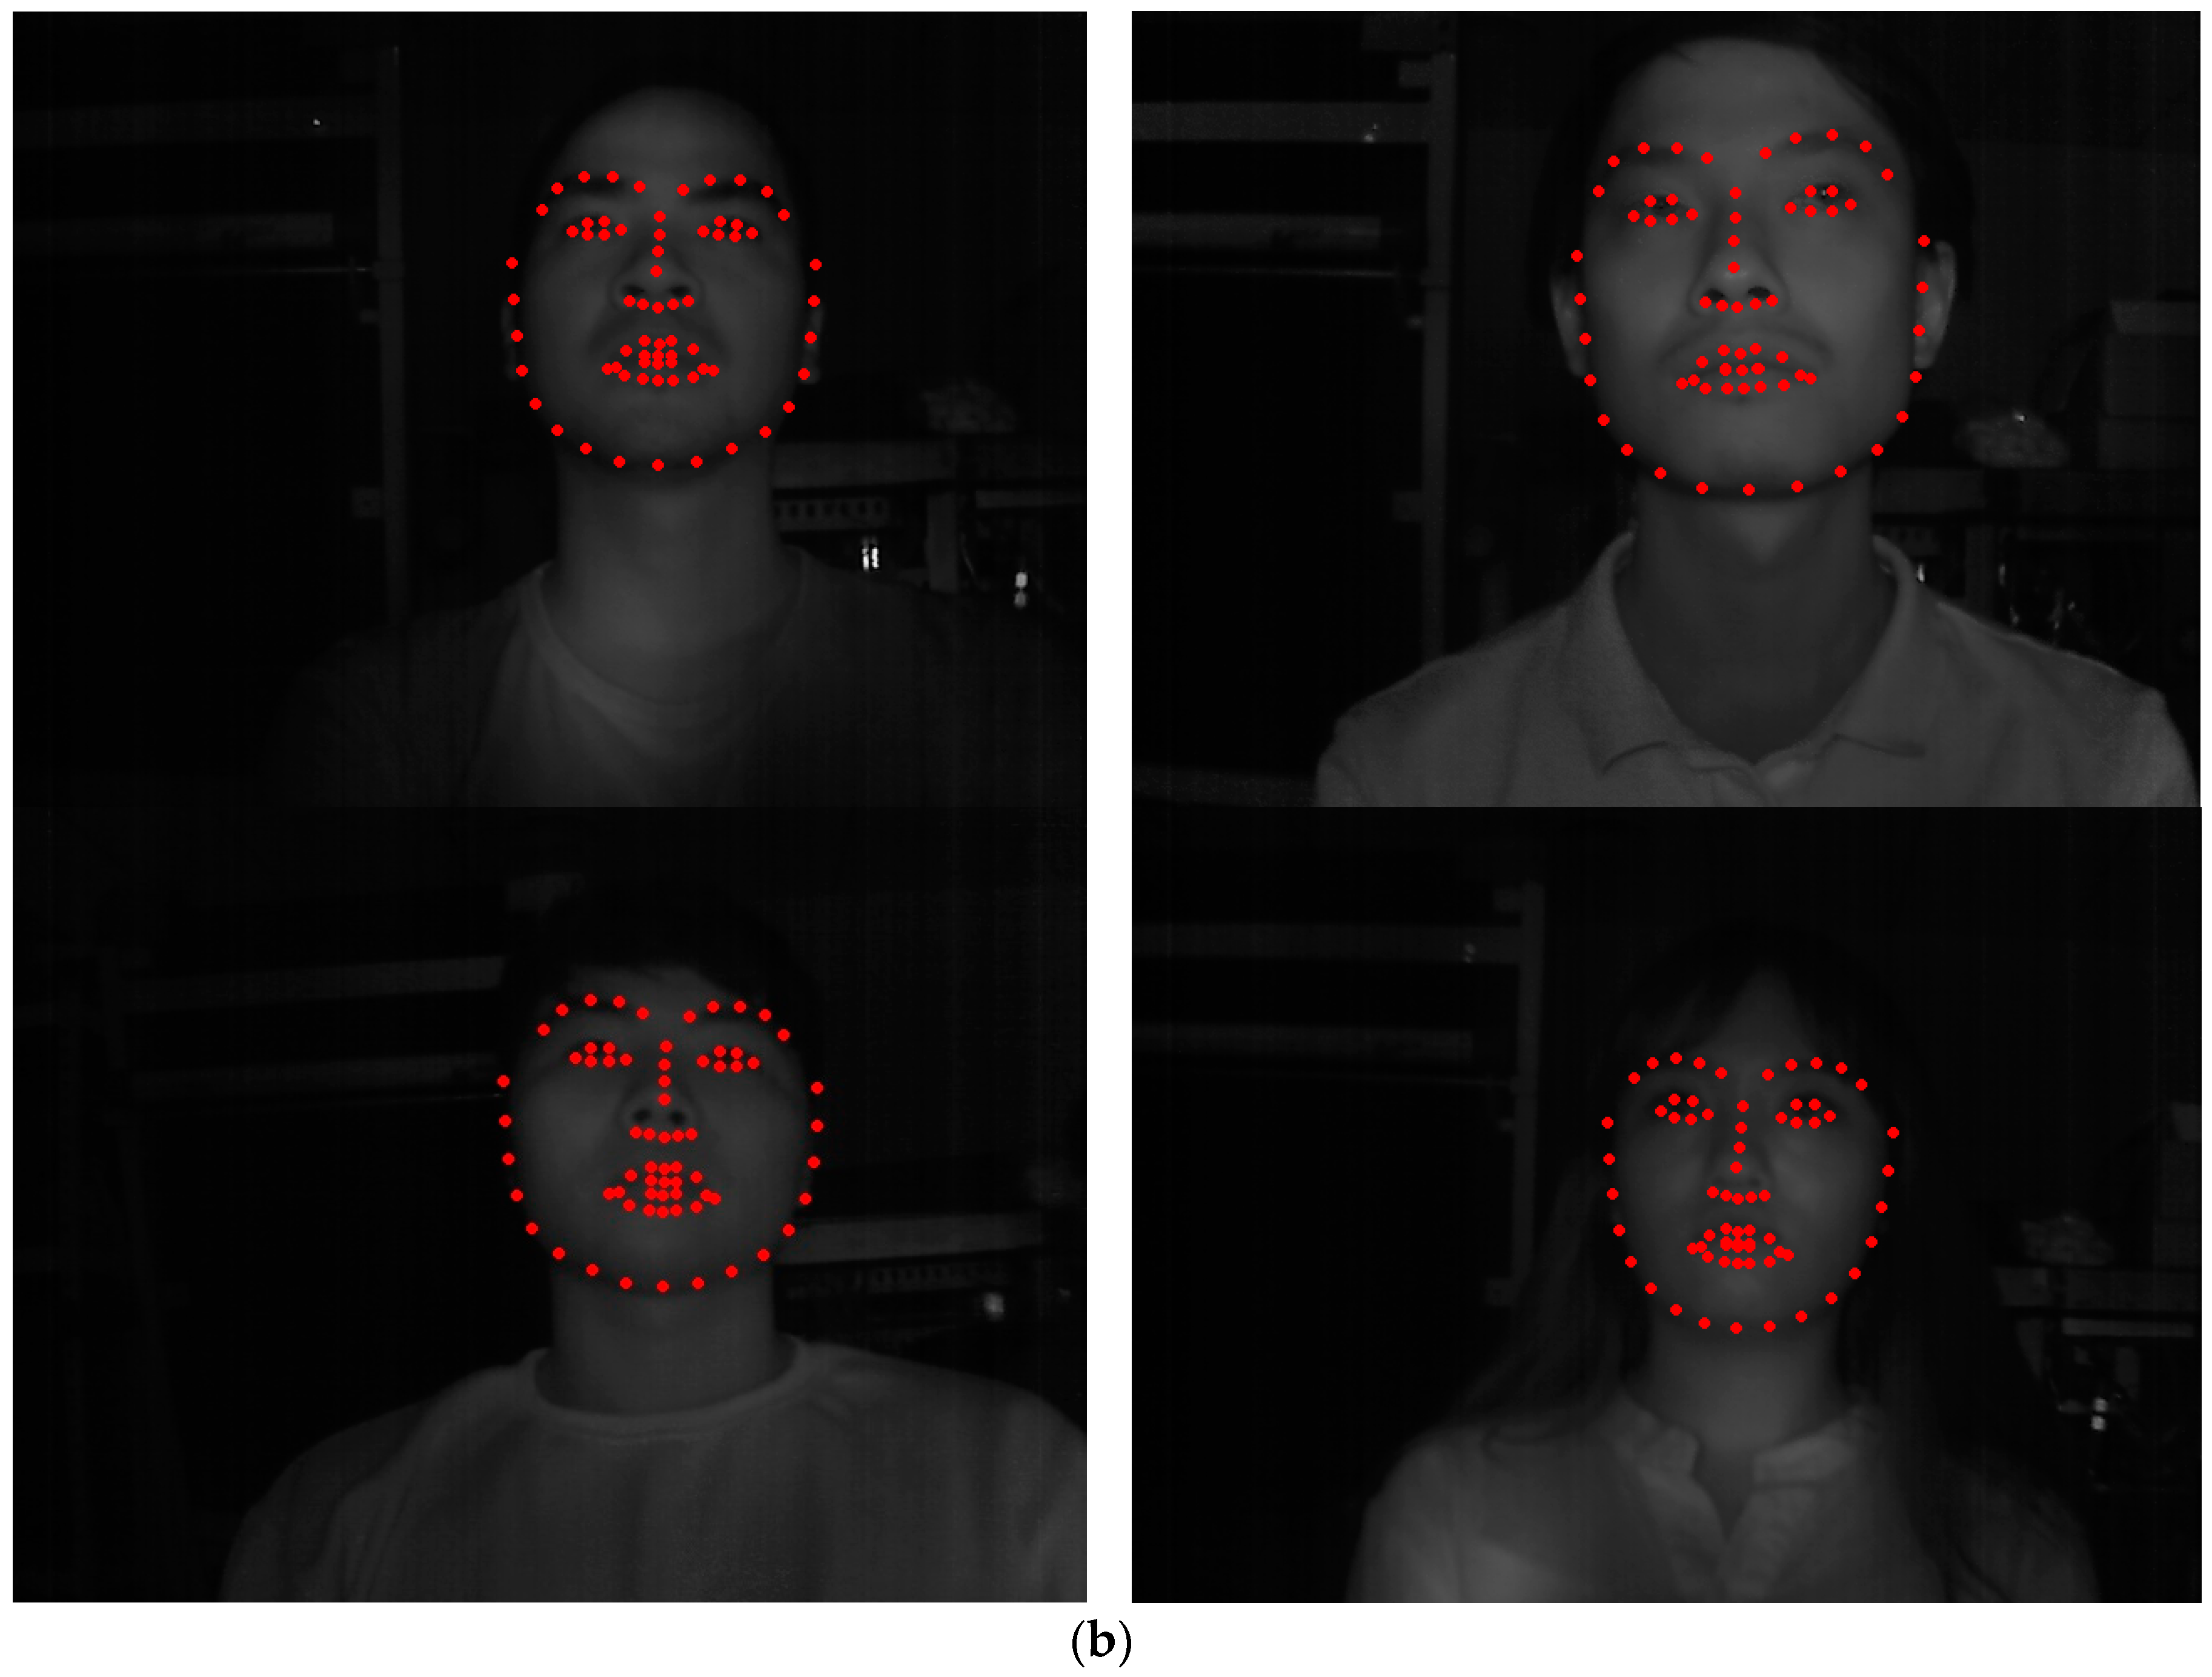
Figure 6.
Examples of the 68 feature points extracted from the facial region on the NIR camera image (each no. indicates the index no. of feature points): (a) an example of the extracted 68 feature points; (b) an example of the feature points on an NIR camera image.
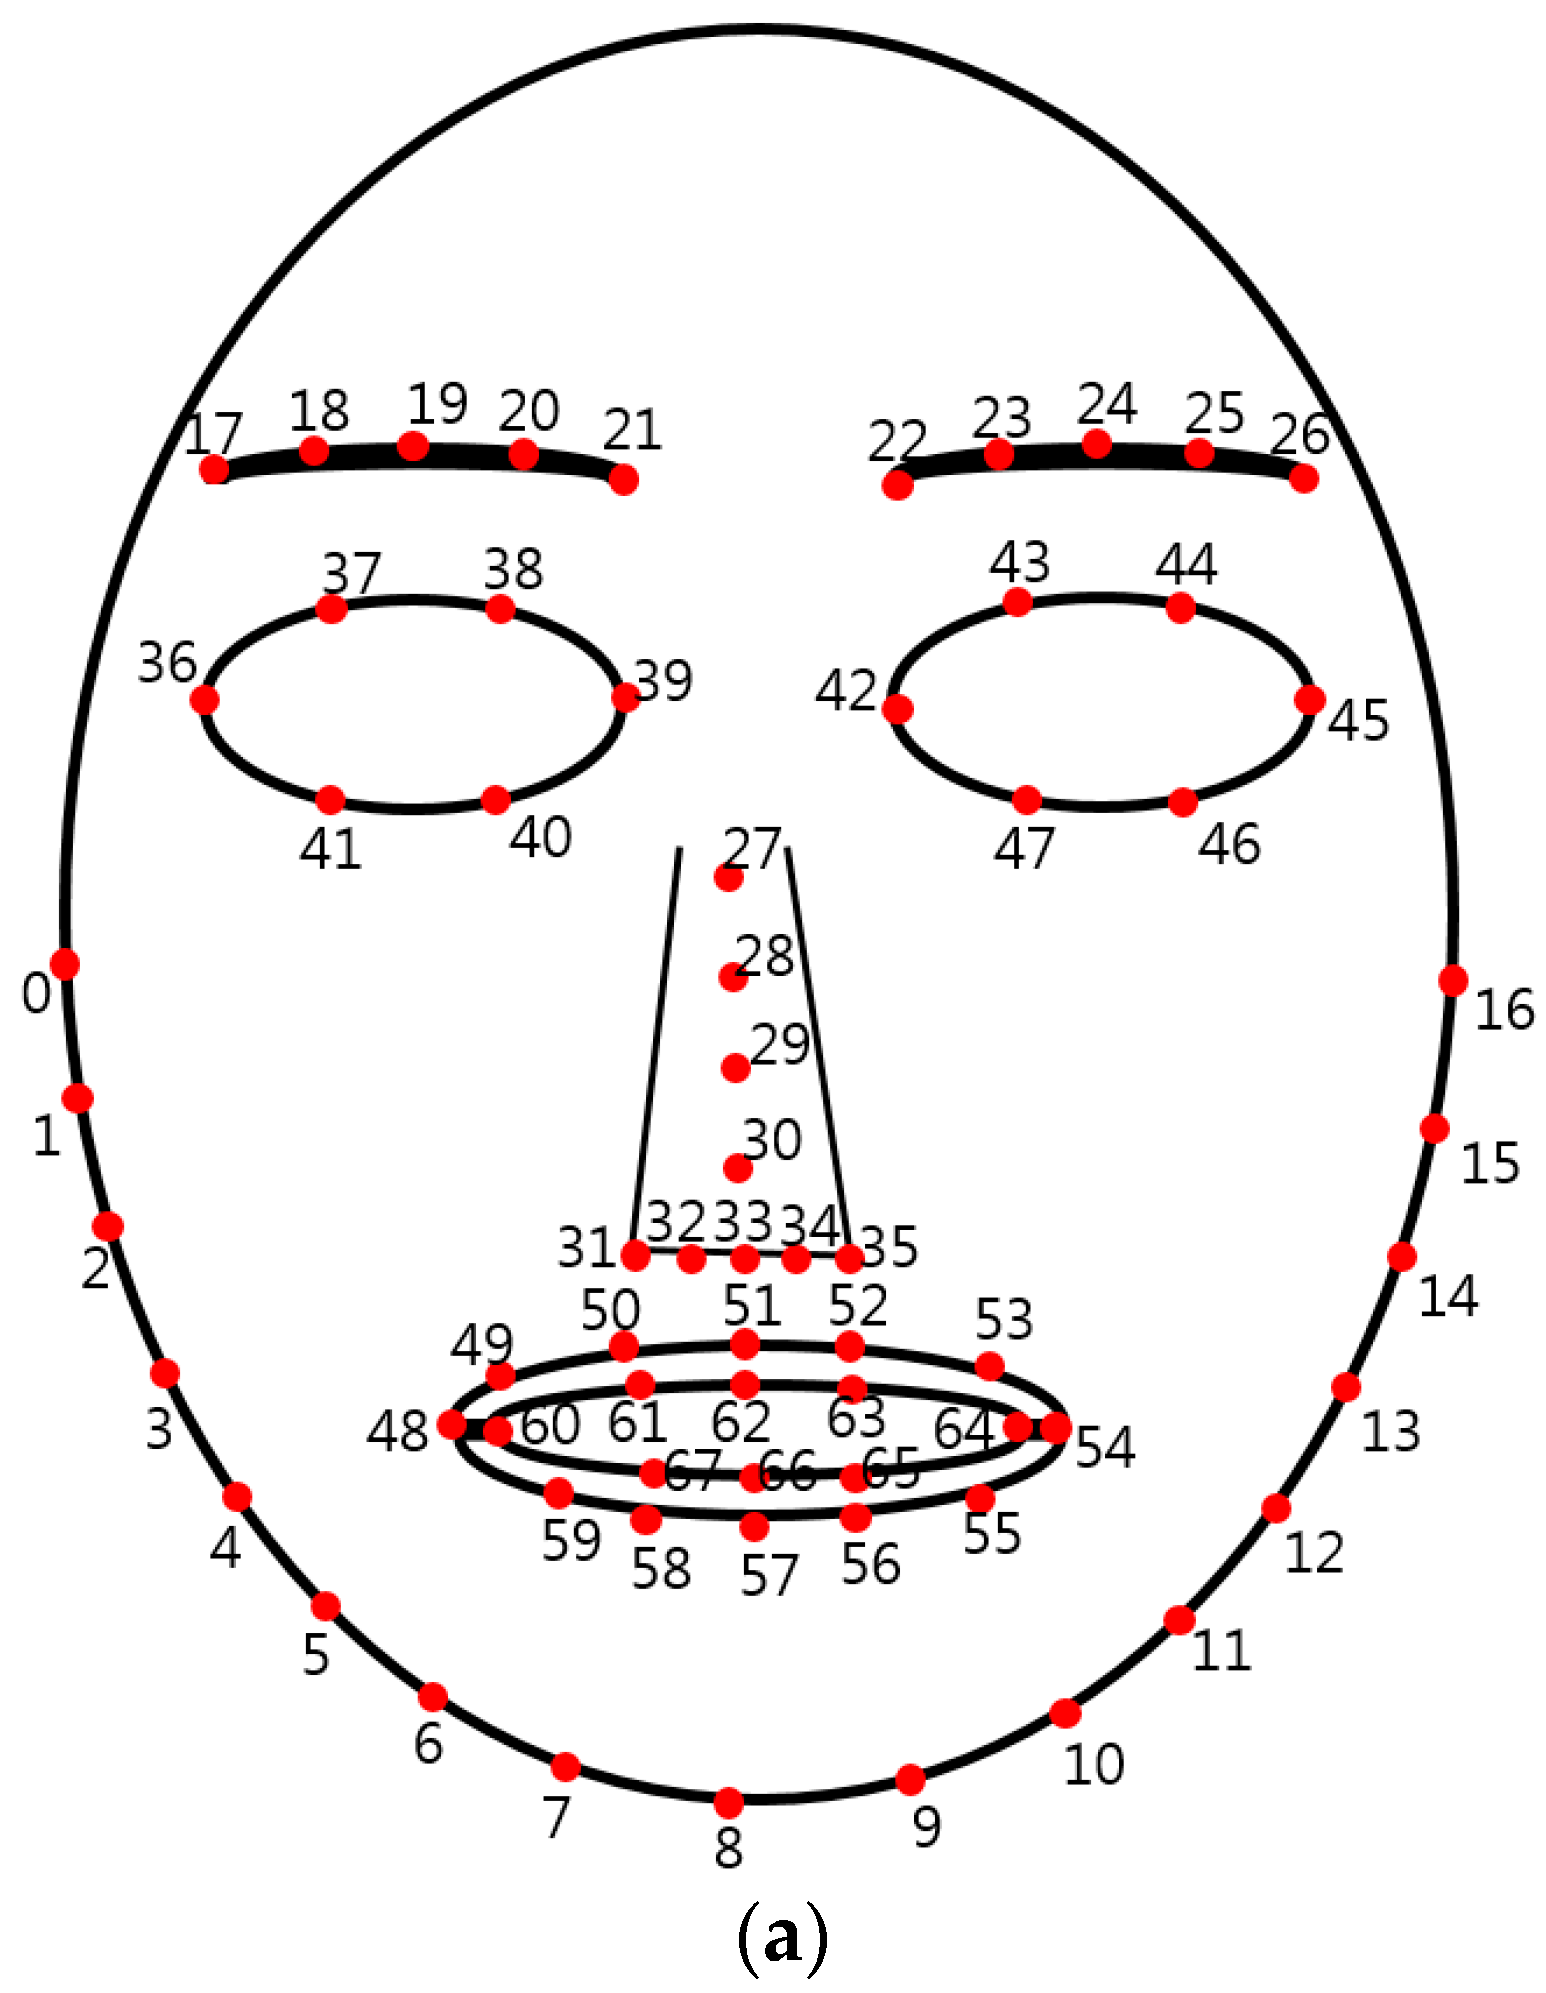

Figure 7.
Proposed fuzzy system-based fusion of four modalities of DLRL, EM, FT, and SE.

Figure 8.
Input and output membership function of symmetrical shape used in a fuzzy system. (a) Input membership function; (b) output membership function.
Figure 8.
Input and output membership function of symmetrical shape used in a fuzzy system. (a) Input membership function; (b) output membership function.


Figure 9.
An example of calculating the output value for each input feature value through an input membership function.
Figure 9.
An example of calculating the output value for each input feature value through an input membership function.

Figure 10.
Example of obtaining the final output value by various defuzzification methods such as (a) FOM, LOM, and MOM; (b) COG; and (c) BOA.
Figure 10.
Example of obtaining the final output value by various defuzzification methods such as (a) FOM, LOM, and MOM; (b) COG; and (c) BOA.

Figure 11.
Experimental procedure.

Figure 12.
Change in FT before and after watching neutral images vs. before and after watching horror movies.
Figure 12.
Change in FT before and after watching neutral images vs. before and after watching horror movies.

Figure 13.
Change in HR before and after watching neutral images vs. before and after watching horror movies.
Figure 13.
Change in HR before and after watching neutral images vs. before and after watching horror movies.
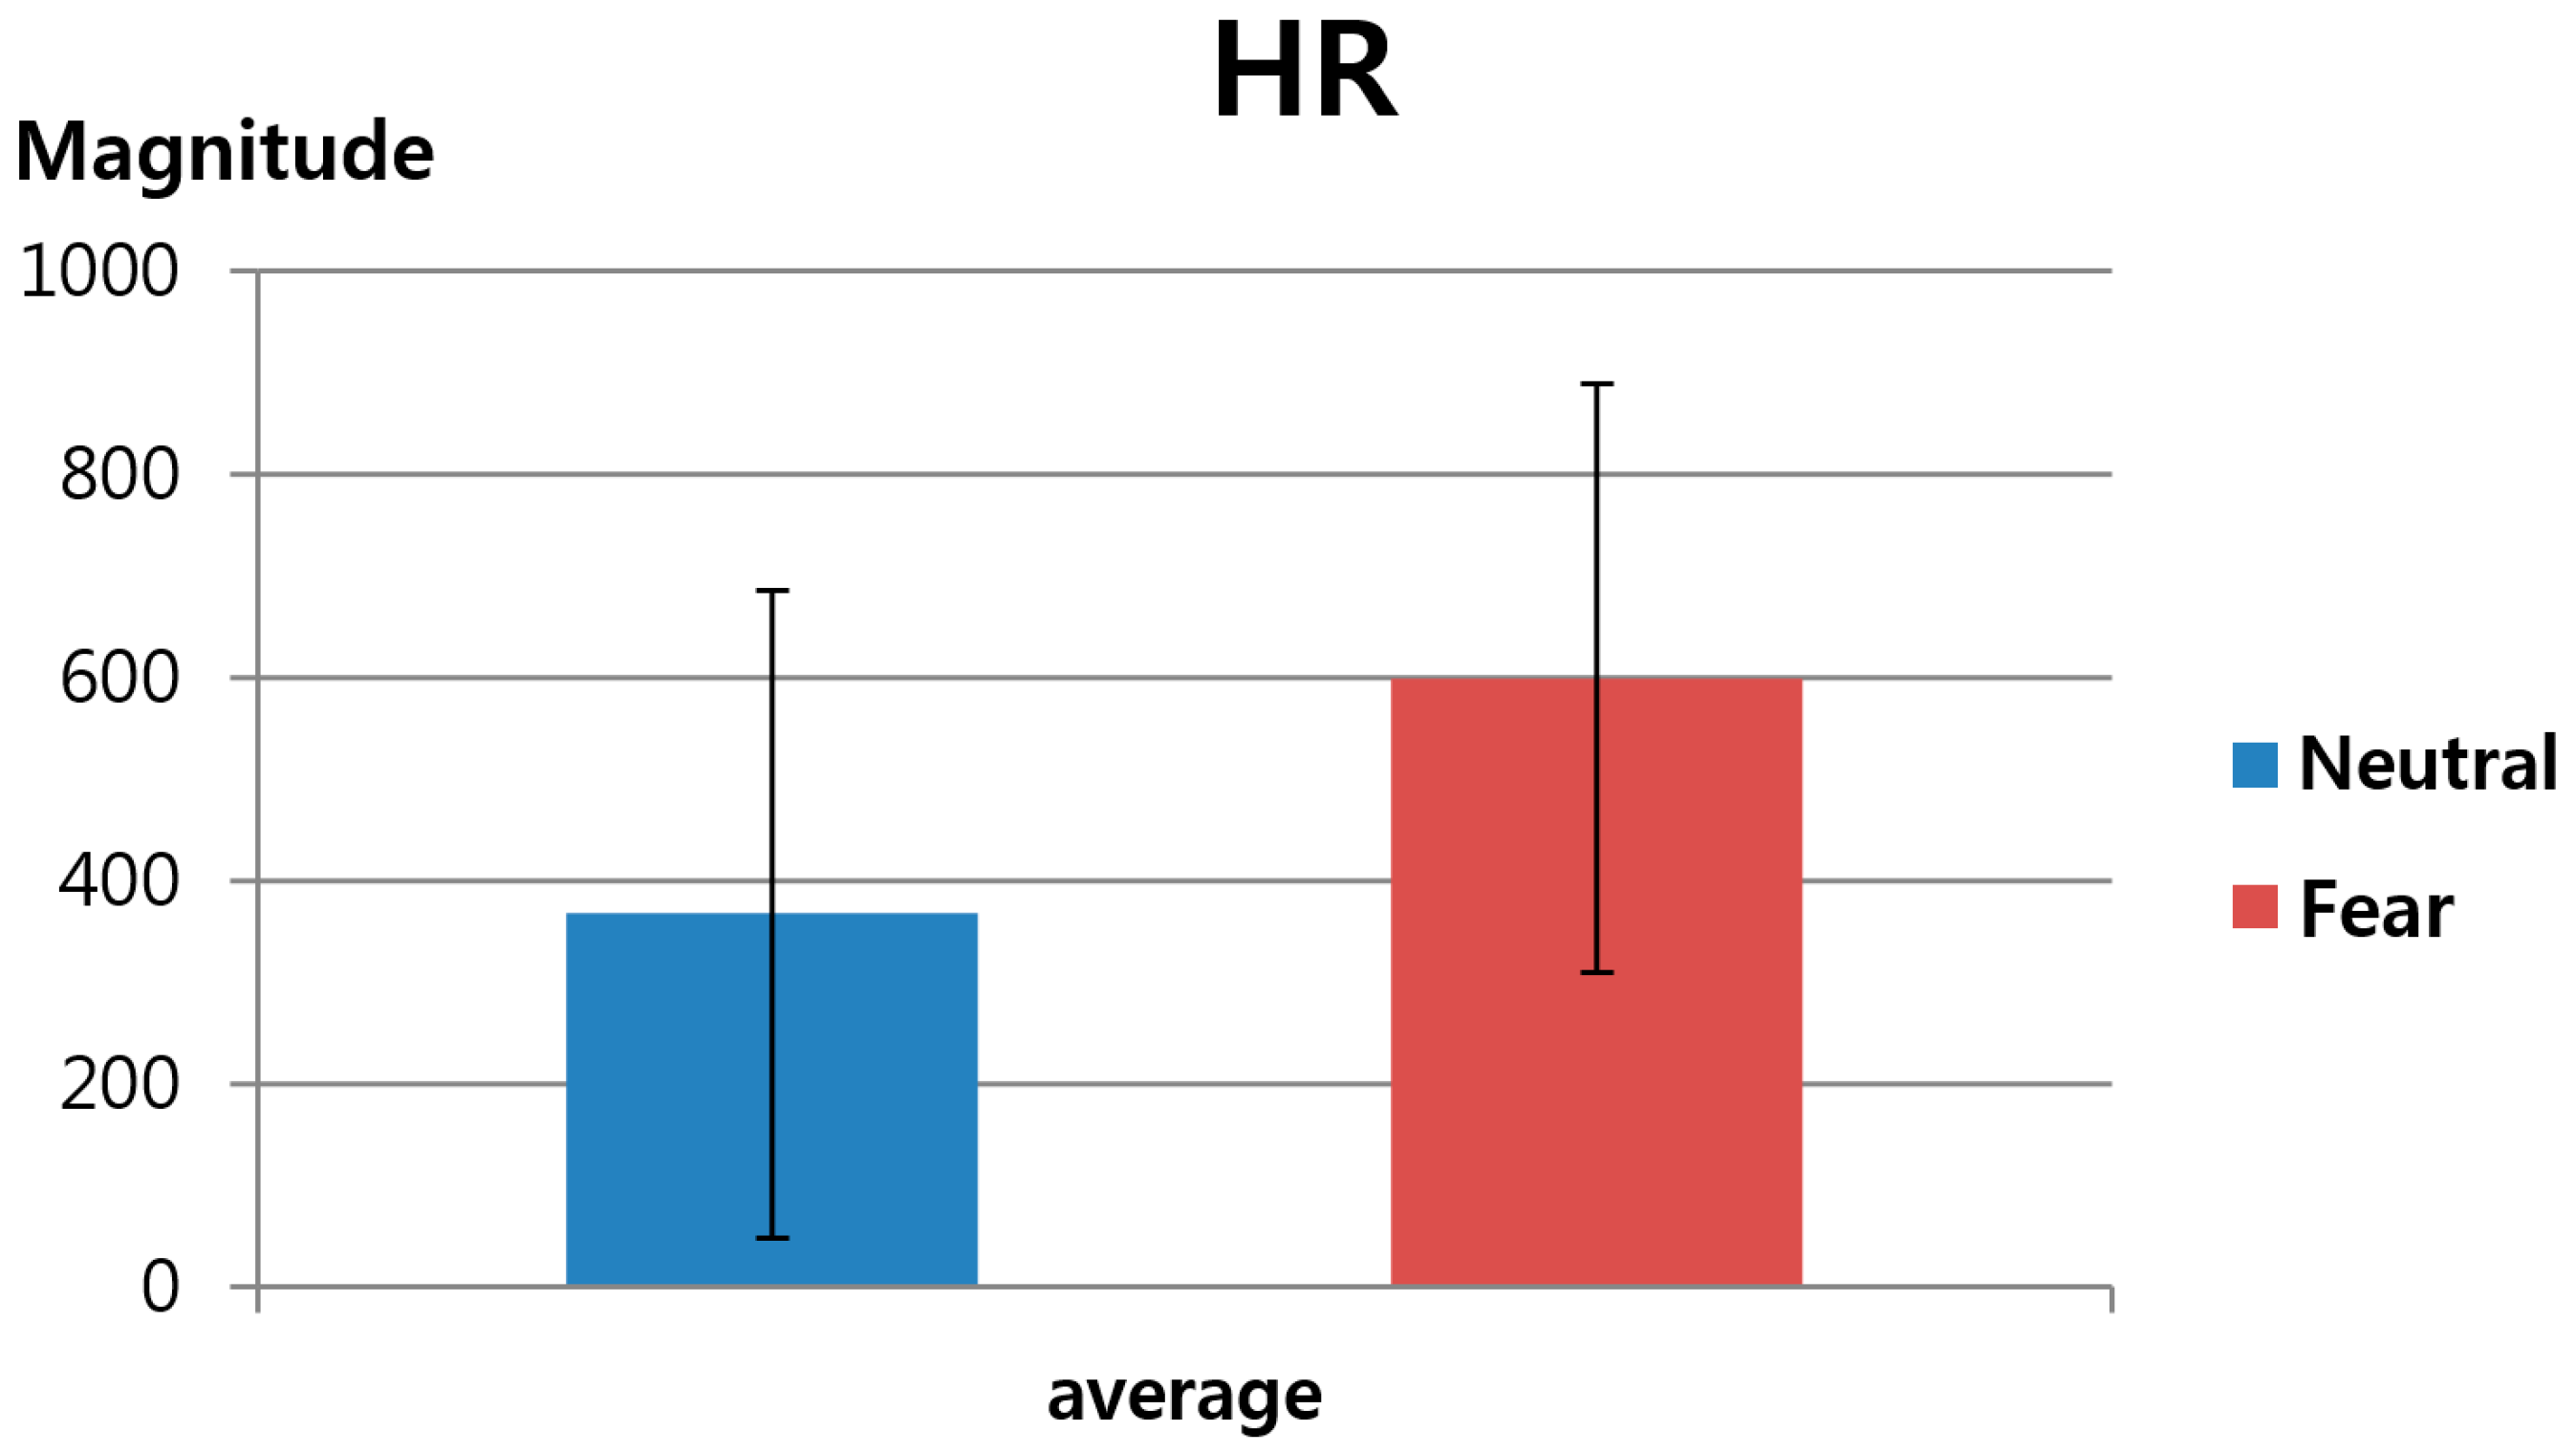
Figure 14.
The change in feature values 3–8 before and after watching neutral images vs. before and after watching horror movies: (a) EBR; (b) DLRL; (c) DULL; (d) EM; (e) NM; (f) SE.
Figure 14.
The change in feature values 3–8 before and after watching neutral images vs. before and after watching horror movies: (a) EBR; (b) DLRL; (c) DULL; (d) EM; (e) NM; (f) SE.


Table 1.
Comparison of proposed and previous research on emotion recognition.
| Category | Methods | Advantage | Disadvantage | |
|---|---|---|---|---|
| Using single modality | Visible light camera-based methods [8,9,10,11,12,13,14,15] | Obtain images of subjects’ facial expression according to emotion using cameras, and use the obtained image data to interpret the subjects’ facial expressions, with respect to fear |
|
|
| Thermal camera-based methods [ 16,17] | Recognize subjects’ emotions by studying their facial temperature changes with thermal cameras |
|
| |
| Voice-based methods [ 2,12,13,14,18,19] | Recognize emotions by studying data on changes in subjects’ voice according to emotional changes | More affordable compared to using cameras and other sensors | Highly susceptible to surrounding noise. | |
| Physiological signal-based methods [ 20,21,22,23,24,25,28] | Recognize subjects’ emotions based on physiological signals measured by attaching sensors to their bodies or heads | Can obtain data with higher accuracy compared to data obtained by camera- and voice-based methods |
| |
| fMRI-based methods [ 26] | Measure subjects’ anger through fMRI | Extremely-accurate recognition of emotion | Instruments are high-cost and so large in size that they are difficult to use in varied environments | |
| Selecting best modality-based methods [ 27] | Measure facial temperature (FT), subjective evaluation (SE), electroencephalography (EEG), and eye-blinking rate (EBR), respectively, and analyze the modality that best reflects the state of fear | Can analyze feature values measured from different modalities regarding fear to choose the most appropriate modality for its recognition |
| |
| Combining multiple modalities | Combining by training-based methods |
|
| Uses multiple contact sensors, and therefore has all the disadvantage of physiological signal-based methods |
| Combining by fuzzy system (Proposed method) | Incorporate the four feature values measured using NIR and thermal cameras into a fuzzy system for recognition of fear |
| The use of multiple camera-based modalities impedes the speed of data acquisition compared to contact sensor-based methods | |
Table 2.
Questionnaire for SE.
| Five Questions | Score |
|---|---|
| Not scared and very bored | 1 |
| A little bored | 2 |
| Normal | 3 |
| A little scared | 4 |
| Very scared | 5 |
Table 3.
Fuzzy rule table.
| SE | FT | DLRL | EM | Summed Value of SE, FT, DLRL, and EM | Fuzzy Output |
|---|---|---|---|---|---|
| L (0) | L (0) | L (0) | L (0) | 0 | L |
| L (0) | L (0) | L (0) | H (0.25) | 0.25 | L |
| L (0) | L (0) | H (0.25) | L (0) | 0.25 | L |
| L (0) | L (0) | H (0.25) | H (0.25) | 0.5 | L |
| L (0) | H (0.5) | L (0) | L (0) | 0.5 | L |
| L (0) | H (0.5) | L (0) | H (0.25) | 0.75 | M |
| L (0) | H (0.5) | H (0.25) | L (0) | 0.75 | M |
| L (0) | H (0.5) | H (0.25) | H (0.25) | 1 | H |
| H (0.5) | L (0) | L (0) | L (0) | 0.5 | L |
| H (0.5) | L (0) | L (0) | H (0.25) | 0.75 | M |
| H (0.5) | L (0) | H (0.25) | L (0) | 0.75 | M |
| H (0.5) | L (0) | H (0.25) | H (0.25) | 1 | H |
| H (0.5) | H (0.5) | L (0) | L (0) | 1 | H |
| H (0.5) | H (0.5) | L (0) | H (0.25) | 1.25 | H |
| H (0.5) | H (0.5) | H (0.25) | L (0) | 1.25 | H |
| H (0.5) | H (0.5) | H (0.25) | H (0.25) | 1.5 | H |
Table 4.
Correlation sum between SE, FT, EM, and DLRL.
| Feature Value | Correlation Sum |
|---|---|
| SE | 0.523 |
| FT | 0.341 |
| EM | 0.263 |
| DLRL | 0.148 |
Table 5.
Change of FT from facial region before and after watching neutral images versus before and after watching a horror movie.
Table 5.
Change of FT from facial region before and after watching neutral images versus before and after watching a horror movie.
| Region | Middle of Forehead | Left Eye | Right Eye | |||
| Neutral | Fear | Neutral | Fear | Neutral | Fear | |
| Average | 7.3173 | –62.2234 | –25.7570 | –49.2841 | 37.9673 | –14.0712 |
| Standard deviation | 32.9501 | 71.6459 | 84.5969 | 66.3650 | 74.5900 | 49.3677 |
| p-value | 0.003986 | 0.420387 | 0.038764 | |||
| Region | Left Cheek | Right Cheek | Average of the Five Regions | |||
| Neutral | Fear | Neutral | Fear | Neutral | Fear | |
| Average | –43.2851 | –46.6826 | 25.5691 | –3.2615 | 0.3623 | –35.1046 |
| Standard deviation | 115.8524 | 78.6982 | 89.0196 | 46.8497 | 32.5571 | 34.9255 |
| p-value | 0.928373 | 0.296328 | 0.006994 | |||
Table 6.
Change in HR before and after watching neutral images vs. before and after watching horror movies.
Table 6.
Change in HR before and after watching neutral images vs. before and after watching horror movies.
| Feature Value | HR | |
|---|---|---|
| Neutral | Fear | |
| Average | 367.0828 | 598.7385 |
| Standard deviation | 318.8631 | 290.1911 |
| p-value | 0.054867 | |
Table 7.
The change in feature values 3–8 before and after watching neutral images versus before and after watching horror movies.
Table 7.
The change in feature values 3–8 before and after watching neutral images versus before and after watching horror movies.
| Feature Value | EBR | DLRL | DULL | |||
| Neutral | Fear | Neutral | Fear | Neutral | Fear | |
| Average | 0.0810 | 0.0614 | 65.5976 | 59.0962 | 2.4154 | 2.7182 |
| Standard deviation | 0.0445 | 0.0347 | 7.7157 | 6.2978 | 1.4797 | 1.2512 |
| p-value | 0.207059 | 0.021694 | 0.563869 | |||
| Region | EM | NM | SE | |||
| Neutral | Fear | Neutral | Fear | Neutral | Fear | |
| Average | 76.1278 | 74.8806 | 0.8587 | 0.8349 | 0 | 2.1429 |
| Standard deviation | 1.1124 | 1.4585 | 0.2175 | 0.2639 | 0 | 0.5503 |
| p-value | 0.013202 | 0.796151 | 1.97 × 10⁻⁹ | |||
Table 8.
Cohen’s d value and effect size of eight feature values before and after watching neutral images versus before and after watching horror movies.
Table 8.
Cohen’s d value and effect size of eight feature values before and after watching neutral images versus before and after watching horror movies.
| Cohen’s d Value & Effect Size | SE | FT | EM | DLRL | HR | EBR | DULL | NM |
|---|---|---|---|---|---|---|---|---|
| Cohen’s d value | 5.5071 | 1.0505 | 0.9478 | 0.9232 | 0.7599 | 0.4891 | 0.2210 | 0.0904 |
| Effect size | Large | Large | Large | Large | Large | Medium | Small | Small |
Table 9.
Average correlation value between the final output and eight feature values (SE, FT, DLRL, EM, HR, EBR, DULL, and NM) using various defuzzification methods with Min or Max rule.
Table 9.
Average correlation value between the final output and eight feature values (SE, FT, DLRL, EM, HR, EBR, DULL, and NM) using various defuzzification methods with Min or Max rule.
| Min & Max Rules | COG | BOA | MOM | LOM | FOM |
|---|---|---|---|---|---|
| Min rule | 0.2314 | 0.2651 | 0.2584 | –0.2009 | 0.23442 |
| Max rule | N/A | N/A | N/A | –0.0959 | 0.0959 |
Table 10.
Average correlation value by proposed method versus eight individual feature values (SE, FT, EBR, DLRL, DULL, NM, HR, and EM).
Table 10.
Average correlation value by proposed method versus eight individual feature values (SE, FT, EBR, DLRL, DULL, NM, HR, and EM).
| Method | Correlation Average |
|---|---|
| SE [27] | 0.1301 |
| FT [27] | 0.1435 |
| EBR [27] | 0.0579 |
| DLRL | 0.1069 |
| DULL | −0.044 |
| NM | 0.1234 |
| HR | 0.2105 |
| EM | −0.0426 |
| Fuzzy system (proposed method) | 0.2651 |
Table 11.
The impact of the error in the localization of facial feature points on the overall accuracy.
Table 11.
The impact of the error in the localization of facial feature points on the overall accuracy.
| Method | Correlation Average | |
|---|---|---|
| No error | 0.2651 | |
| The probability of 30% | Maximum error of ±1 pixel | 0.2651 |
| Maximum error of ±2 pixels | 0.2651 | |
| The probability of 50% | Maximum error of ±1 pixel | 0.2651 |
| Maximum error of ±2 pixels | 0.2650 | |
| The probability of 30% | Maximum error of ±3 pixel | 0.2478 |
| Maximum error of ±4 pixels | 0.2327 | |
| The probability of 50% | Maximum error of ±3 pixel | 0.2326 |
| Maximum error of ±4 pixels | 0.2099 | |
Table 12.
The robustness of our method with respect to the various parameters in fuzzy system.
| Method | Correlation Average | |
|---|---|---|
| Assigned values for “H” in Table 3 | 0.5 and 0.15 | 0.2473 |
| 0.5 and 0.2 | 0.2471 | |
| 0.5 and 0.25 (original parameters) | 0.2651 | |
| 0.6 and 0.25 | 0.2468 | |
| 0.7 and 0.25 | 0.2462 | |
| Threshold for Table 4 | 0.2 | 0.2484 |
| 0.3 (original parameters) | 0.2651 | |
| 0.4 | 0.2482 | |
Table 13.
Average correlation value by proposed method (without SE) versus seven individual feature values (FT, EBR, DLRL, DULL, NM, HR, and EM).
© 2017 by the authors. Licensee MDPI, Basel, Switzerland. This article is an open access article distributed under the terms and conditions of the Creative Commons Attribution (CC BY) license (http://creativecommons.org/licenses/by/4.0/).
Share and Cite
MDPI and ACS Style
Lee, K.W.; Hong, H.G.; Park, K.R. Fuzzy System-Based Fear Estimation Based on the Symmetrical Characteristics of Face and Facial Feature Points. Symmetry 2017, 9, 102. https://doi.org/10.3390/sym9070102
AMA Style
Lee KW, Hong HG, Park KR. Fuzzy System-Based Fear Estimation Based on the Symmetrical Characteristics of Face and Facial Feature Points. Symmetry. 2017; 9(7):102. https://doi.org/10.3390/sym9070102
Chicago/Turabian StyleLee, Kwan Woo, Hyung Gil Hong, and Kang Ryoung Park. 2017. "Fuzzy System-Based Fear Estimation Based on the Symmetrical Characteristics of Face and Facial Feature Points" Symmetry 9, no. 7: 102. https://doi.org/10.3390/sym9070102
Note that from the first issue of 2016, this journal uses article numbers instead of page numbers. See further details here.