Combining the Technology Acceptance Model and Uses and Gratifications Theory to examine the usage behavior of an Augmented Reality Tour-sharing Application


1
Graduate Institute of Mass Communication, National Taiwan Normal University, Taipei 106, Taiwan, R.O.C.
2
Chunghwa Telecom Laboratories, Chunghwa Telecom Co., Ltd., Taoyuan 326, Taiwan, R.O.C.
3
Department of Electrical and Computer Engineering, National Chiao Tung University, Hsinchu 300, Taiwan, R.O.C.
4
Department of Industrial Engineering and Engineering Management, National Tsing Hua University, Hsinchu 300, Taiwan, R.O.C.
*
Author to whom correspondence should be addressed.
Symmetry 2017, 9(7), 113; https://doi.org/10.3390/sym9070113
Submission received: 12 April 2017
/
Revised: 28 June 2017
/
Accepted: 3 July 2017
/
Published: 9 July 2017
Abstract
:An intelligent tour service system including an augmented reality (AR) tour-sharing Application (APP) and a query-answering server was developed in this study to promote tourist attractions involving local Hakka culture in Thailand. Subsequently, use of this APP to navigate Hakka culture tourist attractions in Thailand was observed. The novel random neural networks (RNNs) were proposed to obtain query-answering services, and the practical experimental results showed that the accuracy of RNNs was 99.51%. This study also integrated the Technology Acceptance Model with Uses and Gratifications Theory to predict the gratification, usage intention, and user attitudes toward marketed attractions of the AR tour-sharing APP. A questionnaire survey was conducted, and 446 valid questionnaires were returned. The following results were obtained: (a) self-presentation and perceived usefulness (PU) directly influenced gratification; (b) perceived entertainment indirectly influenced gratification through perceived ease of use and PU, and information sharing indirectly influenced gratification through PU; and (c) gratification was significantly and positively related to usage intention and attitude toward attractions. Based on these results, suggestions that new technology marketing can be used to promote causes other than Hakka tourist attractions established in Thailand can be contrived. For example, the tour-sharing APP developed in this study could be applied to emphasize the characteristics of Thai Hakka culture; users’ fondness for self-presentation and information sharing can be used for word-of-mouth marketing to attract additional visitors. In addition, this research provides a reference for enterprises and marketers regarding the use of AR tour-sharing APPs to market tourist attractions, and also for future related studies.
1. Introduction
In recent years, the usage and improvement of mobile techniques have been growing for a variety of mobile applications (APPs). For instance, several mobile APPs were developed to provide the guidance information for culture tourism. The techniques of augmented reality (AR) and query-answering service (QAS) are useful tools to support these guidance APPs [1]. The interactive multimedia can be obtained through AR techniques to provide 3D models and videos for the introduction of guidance information. Moreover, QAS techniques embedded in mobile phones can provide human–computer interaction, and users can use their mobile phones to query some questions about culture in natural language and get the answers through QAS techniques. Therefore, an intelligent tour service system including an AR tour-sharing APP and a query-answering server is developed in this study for promoting tourist attractions of Thai Hakka culture.
The Hakka people, a subgroup of the Han Chinese, originally lived in the Central Plain. Due to chaos caused by the years of the wars and change of the regime, during the Ming and Qing dynasties, the Hakka people in the Guangdong and Fujian regions began to cultivate the idea of migration and overseas development in response to the lack of arable fields in the mountainous area. During that period, Thailand exported rice to the Qing government, and the trade transactions provided opportunities for numerous Hakka people to migrate to and settle in Thailand. Currently, approximately two million Hakka people live in Thailand. In order to assist the Thai Hakka people in promoting local Hakka tourist attractions and Hakka culture, this study developed a tour-sharing application (APP) using augmented reality (AR) and further conducted a questionnaire to examine the effectiveness of the APP design based on Uses and Gratifications Theory (UGT) and the Technology Acceptance Model (TAM). The design principles were described as follows.
This study adopted tablet computers and smartphones as the design platform to develop the AR application. AR denotes three-dimensional (3D) stereoscopic technology that superimposes computer-generated information on the real world (i.e., geographic locations or objects; Berryman, 2012). The principles of AR and virtual reality (e.g., Second Life) differ. In virtual reality, everything is virtual, digital, and simulated; the real world is replaced with virtual images. People can experience, explore, and interact with each other through visual perceptions in the artificial and virtual space. This study employed the principle of AR to design the tour-sharing APP to promote the tourist attractions of Thai Hakka culture.
Using the pamphlets of the tourist attractions of Thai Hakka culture as an example, this study employed a tablet computer to identify the photos in the pamphlets and present them as a video clip. More specifically, a scenario in which international tourists traveled to Thailand and obtained pamphlets, such as tourist booklets, was presented. When tourists intended to visit the local Hakka attractions mentioned in the pamphlets or participate in the local Hakka cultural festivals, they could scan the pamphlets by using a tablet computer or a mobile phone, which then played the introductory video clips of the attractions. When tourists reached the attractions and captured video clips, they could link the video clips that they captured with the pamphlets. In the future, they could view the video clips by scanning the pamphlet using a tablet computer. After returning to their home countries, the tourists could recall the tours by using this APP, and the pamphlets become a Thai Hakka tour book. This APP was also equipped with a sharing function that enabled users to scan a photo and view the video clips of that particular attraction previously captured by others. The user-generated content enhanced the flexibility of the AR APP.
This idea was based on the newspaper principle in the Harry Potter movies, in which static photos transformed into dynamic video clips. In this manner, each attraction can be introduced more vividly. Users visiting the attractions can film travel video clips and replay the clips afterward by scanning the travel booklet by using a mobile phone or a tablet computer. This booklet then becomes a personal travel record, which also provides a sharing function that enables other users to view the travel experiences of previous tourists at the attractions. This study assisted in promoting Thai Hakka culture by using this APP.
The following literature review introduces Thai Hakka culture and the local tourist attractions, and then reviews literature related to AR, TAM, and UGT.
2. Literature Review
The literature related to AR, TAM, and UGT is discussed as follows. The hypotheses are also listed afterwards.
2.1. Augmented Reality
AR denotes the embedding of computer-generated 3D virtual objects into real environments to enable virtual objects to coexist with real environments to enhance users’ perception, of and interaction with, the real world [2]. AR involves three characteristics: (a) combination of virtual objects and real environments; (b) instant interaction; and (c) 3D registration that accurately aligns the data of virtual objects and real environments to enable the objects to appear in the environments appropriately, or stated simply, aligns virtual images with real objects [3].
Milgram and Kishino (1994) indicated that between the virtual and real worlds exists a virtual continuum called a mixed reality, where the virtual world is situated on the extreme right, the real world is located on the extreme left, and AR falls between the middle and the extreme left [4]. Therefore, unlike virtual reality, which focuses on the interaction with, and presentation of, virtual environments, AR combines the real and virtual worlds [5]. Although AR is based on the virtual reality technology, it is applied according to the real world to complement what the real world is lacking, rather than creating a completely artificial world. Consequently, physical realities are crucial in AR because AR superimposes digital information on reality to integrate the digital and the real, as well as to blur the boundary between the virtual and the real [2]. More specifically, users merge virtual 3D images with the real world by using a webcam or other mobile device (e.g., mobile phone). Users can thus simultaneously remain in the real world and interact with virtual objects, blurring the virtual–real boundary and creating an immersive experience. This study investigated the application of AR to the marketing of tourist attractions. Attractions can be promoted when users scan pamphlets by using a mobile phone and view the official video introductions and visitors’ self-made video clips of the attractions.
2.2. Query-Answering Service
QAS is designed to analyze the natural languages semantics of user’s query and response the answer of the query to user. For instance, expert systems were proposed to retrieve keywords and analyze grammars based on rules (i.e., rule-based reasoning (RBR) algorithm) for supporting QAS in the 20th century [6]. However, the corpus of words and grammars in several questions is very large, so the cost of building an expert system is expensive. Therefore, machine learning methods (e.g., k-nearest neighbor (kNN) algorithm (Chang and Kim, 2006), naïve Bayes classifier [7], linear regression [8], logistic regression [9], latent semantic analysis (LSA) [10], neural network (NN) [11], etc.) have been applied to QAS for discovering semantic relationships between words.
For designing a QAS based on machine learning methods, the QAS is expressed as a classification model [12]. In this model, the top n frequently asked questions (FAQs) are collected and classified as n classes (i.e., the output of machine learning method). The question and answer of each frequently asked question are predefined in a database. The processes of QAS based on machine learning methods include: (1) receiving a query sentence; (2) using segmentation tool to retrieve words; (3) computing term frequency and inverse document frequency (TF-IDF) for transforming sentences and words into a vector space model (VSM); (4) using a machine learning method (i.e., a classifier) to analyze question for getting a suitable class; and (5) replying the answer of user’s query in accordance with the suitable class [1].
The evolutions and comparisons among machine learning methods for supporting QAS are discussed as follows. Although a kNN algorithm can measure the distance between the VSMs of user’s query and each predefined frequently asked question for classification [13], the relations among words are not analyzed by the kNN algorithm. Furthermore, the algorithms of naïve Bayes classifier, linear regression, and logistic regression can estimate the weight of each word for each class [7,8,9], but these algorithms assume that the vectors of these words are independent variables. Semantic relationships between words cannot be estimated by k-nearest neighbor (kNN) algorithm, naïve Bayes classifier, linear regression, and logistic regression. Therefore, some studies combined these algorithms with LSA to analyze semantic relationships based on singular value decomposition for the improvement of classification accuracy [10]. Although the LSA could support to estimate the semantic relationships between words, the LSA only estimates the linear semantic relationships. If the semantic relationships between words were nonlinear, the error of classification would be large. Therefore, some study proposed using neural network to analyze the dependency of words though hidden layers, and the neural network could estimate the linear and nonlinear semantic relationships [11]. However, the problem of overfitting may exist in such neural networks. Therefore, some studies proposed ensemble machine learning [14] and dropout [15] methods to enhance the performance of classification algorithms. In this study, the random neural networks based on ensemble machine learning and dropout methods are proposed to generate several neural networks for estimating the linear and nonlinear semantic relationships and preventing the problem of overfitting.
2.3. Technology Acceptance Model
Proposed by Davis in 1986, TAM mainly explains and predicts users’ information technology usage behaviors. According to TAM, personal intention to adopt and use novel information technology is determined by perceived usefulness (PU) and perceived ease of use (EOU) [16]. PU denotes the subjectively assessed practicality of technology [16]. Based on the purpose of this study, PU was conceptually defined as users’ belief in the usefulness of the AR tour-sharing APP for providing tour information. EOU denotes the effort required to learn to use technology perceived by an individual [16]. In this study, EOU was defined as users’ belief in the ease of learning and using the proposed APP. TAM has been widely applied in studies on mobile services (e.g., [17,18]). Therefore, this study introduced this model to test the acceptance of this tour-sharing APP.
2.4. Uses and Gratifications Theory
UGT was first proposed by Katz in 1959, and consecutive relevant studies were conducted by Katz, Blumler, and Gurevitch in 1974. UGT states that the audience selects media based on personal needs and knows which media can satisfy their needs. Blumler further proposed the concept of the active audience in 1979, emphasizing that an active audience possesses the following characteristics: utility, intention, selectivity, and imperviousness to influence. In other words, whether an audience uses a medium is determined by its usefulness for providing information, and is influenced by the audience’s motives. Therefore, media behavior reflects previous interests and hobbies without being easily affected. The uses and gratifications of novel media technology were not considered in traditional UGT until Rosengren, Wenner, and Rayburn (1985) expanded the application of the theory to new communications technology [19]. They indicated that the characteristics of new media such as satellite, Internet, and interactive television influenced audience behavior in selecting and controlling media. With the development of novel media and technology, studies have applied UGT in research on new communications technology. In recent years, UGT has been applied in studies on the motives of using social media. For example, Lampe, Wash, Velasquez, and Ozkaya (2010) employed UGT to interpret the motives of a content-generation online community, and determined that the motives were related to content generated by the site members and the willingness to engage in content generation in the future [20]. In addition, another study examined the extent of user expectations for Facebook to satisfy individual needs [21]. Williams, Philips, and Lange (1994) stated that compared with other theories, UGT is more suitable for explicating audience’s interest in new communications technology [22]. Therefore, based on UGT, this study investigated AR tour-sharing usage behavior from the perspective of audience’s usage motives and levels of satisfaction.
In addition, UGT assumes that the use of media and technology is determined by users’ needs or motives [23]. Users’ practical motives for using mobile services are similar to PU in TAM [24]. Therefore, in addition to PU, this study included information sharing and EOU in the model. The happiness motives in UGT include needs such as entertainment, pleasure, and enjoyment [25]. According to previous studies, consumers’ motives for using mobile services involve entertainment, pleasure, enjoyment, passing time, social interaction, sociability, and expressiveness [26,27,28]. Self-presentation and perceived entertainment (PE) were integrated into the conceptual model of this study. Furthermore, information sharing was also a crucial function of the APP and was thus incorporated into the model. The literature on self-presentation, PE, and information sharing was reviewed to develop research hypotheses.
2.5. Self-Presentation
Self-presentation denotes the creative expression that requires both target audiences and contexts of social interaction to determine which information to present and which to eliminate [29,30]. Self-presentation is the process of packaging and editing that decides which information to reveal and the methods for presenting the information to obtain favorable impressions [31]. Self-presentation is one of the main motives for people to use social network services, because users can clearly express and present interests and experiences through these networks [32,33].
Studies have explored the concept of self-presentation in social networks (e.g., [32,34]). They identified exhibitionist or self-presentational behavior as a noteworthy facet in social networks because social network service users can almost completely control the presentation of information. Compared with traditional face-to-face interactions, social network service users are increasingly strategic regarding self-presentation. For example, they can present themselves through self-generated content such as personal photos or status updates. By inferring the use scenario of the AR tour-sharing APP based on the literature, this study investigated if using the APP to upload personal tour videos to Facebook and present travel experiences by using these videos could enhance the PE, EOU, and PU of and the satisfaction with the APP. Therefore, Hypotheses 1–4 were developed:
Hypothesis 1 (H1):
Self-presentation positively influences PE.
Hypothesis 2 (H2):
Self-presentation positively influences EOU.
Hypothesis 3 (H3):
Self-presentation positively influences PU.
Hypothesis 4 (H4):
Self-presentation positively influences APP satisfaction.
2.6. Perceived Entertainment
Sung and Yun (2010) determined that perceived enjoyment is positively correlated with EOU [35]. PU represents an external motive that accounts for the practicality of a system, and EOU serves as an internal motive. PE is mainly explained as the internal pleasure generated by a system or the enjoyment derived from the APP. If users can manage the APP with ease, they become increasingly satisfied with the APP, which further increases intention to use the APP and enhances the attitude toward the attractions introduced in the APP. Therefore, Hypotheses 5 and 6 were inferred:
Hypothesis 5 (H5):
PE positively influences EOU.
Hypothesis 6 (H6):
PE and positively influences APP user satisfaction.
2.7. Information Sharing, Perceived Usefulness, and Perceived Ease of Use
Information sharing and searching are major activities in online communities. Information sharing denotes providing information to people who require it [36]. Information includes opinions, suggestions, and answers to others’ questions [37]. According to the prosocial motivation theory, sharing information to assist strangers presents a person’s professionalism, which is a means of expressing one’s self-identity [38].
PU and EOU are key factors that motivate users to use and adapt to new technology [16]. In the technological scenario of knowledge sharing, Jarvenpaa and Staples (2000) stated that user-friendly systems can increase the amount of information sharing because they can reduce the psychological cost incurred during sharing [39]. The AR tour-sharing APP designed in this study can share information and video clips with other APPs (e.g., Facebook). This study investigated whether the PU generated when using the tour-sharing APP resulted in satisfaction with the APP and further increased use intention. Therefore, Hypothesis 7 was proposed:
Hypothesis 7 (H7):
Information sharing positively influences PU.
PU denotes the level to which technology is considered easy to use by users. When technology is increasingly easy to use, the level of work completion increases and the usability of the system is enhanced. In other words, ease of use can affect usability [40]. Therefore, this study hypothesized the following:
Hypothesis 8 (H8):
EOU positively influences PU.
2.8. APP Satisfaction, Attitude Toward Attractions, and Intention to Use the APP
According to the expectation confirmation theory, users’ intention to continually use a particular information technology mainly depends on previous satisfaction with the use of that technology [41]. Satisfaction denotes psychological feelings or affect that originate from the cognitive discrepancy between expectations for and actual use of an object [42]. Affect has been identified as one of the key factors for using technology in TAM; therefore, satisfaction is crucial in the process of usage behavior. When using a medium, the audience reflects on the time spent using that medium and the form of media content [43]. Users continue to use the medium if they are satisfied with the media behavior, and cease use when they are no longer satisfied [43]. If users can easily achieve self-presentation by using an APP, they feel satisfied with the APP, which further raises use intention and enhances attitude toward the attractions introduced. Hence, Hypotheses 9–12 were inferred:
Hypothesis 9 (H9):
EOU positively influences satisfaction with using the APP.
Hypothesis 10 (H10):
PU positively influences satisfaction with using the APP.
Hypothesis 11 (H11):
Satisfaction with using the APP positively influences use intention.
Hypothesis 12 (H12):
Satisfaction with using the APP positively influences the attitude toward the attractions introduced in the APP.
3. Design and Evaluation of the Intelligent Tour Service System
An intelligent tour service system is proposed and evaluated in this section.
3.1. System Architecture
The proposed intelligent tour service system includes an augmented-reality (AR) tour-sharing APP and a query-answering server (shown in Figure 1) [1].
3.1.1. AR Tour-Sharing APP
Based on user memories and records of travel, this study designed an AR tour-sharing APP to provide users relevant tour information, guide users through the use of AR technology, and enable users to record visits to each attraction for future reminiscence. Figure 1 presents the flowchart of the tour-sharing APP; the steps include: (1) pamphlets for tourist attractions; (2) query-answering services (QASs); (3) AR guide services; (4) AR self-recording services; (5) AR community sharing; and (6) AR tour memories. These steps are detailed in the following.
3.1.1.1. Pamphlets for Tourist Attractions
This study adopted the topic of Hakka attractions in Thailand, designed a tour introduction flyer titled Tour of Hakka Attractions in Thailand, and printed the introduction to provide relevant tour information to tourists. Users can obtain the pamphlet for the Tour of Hakka Attractions in Thailand (shown in Figure 2), download the mobile tour-sharing APP, and subsequently experience tour-guide and other relevant AR services.
3.1.1.2. Query-Answering Services
The QASs are obtained in the AR tour-sharing APP for the introduction of Hakka culture. Users can click the button of QAS to ask some questions (e.g., “請問客家人的由來與分佈? What are the origin and the population distribution of Hakka?”) in Chinese natural language. The QASs can recognize and transfer the voices to texts though Google Cloud Speech APIs, and these texts are sent to query-answering server via web services. Furthermore, the query-answering server can analyze user’s query and reply the answer of this query in text format to QASs in the AR tour-sharing APP. Then QASs can speak the answer by using text-to-speech application programming interface (APIs) for user.
3.1.1.3. AR Guide Services
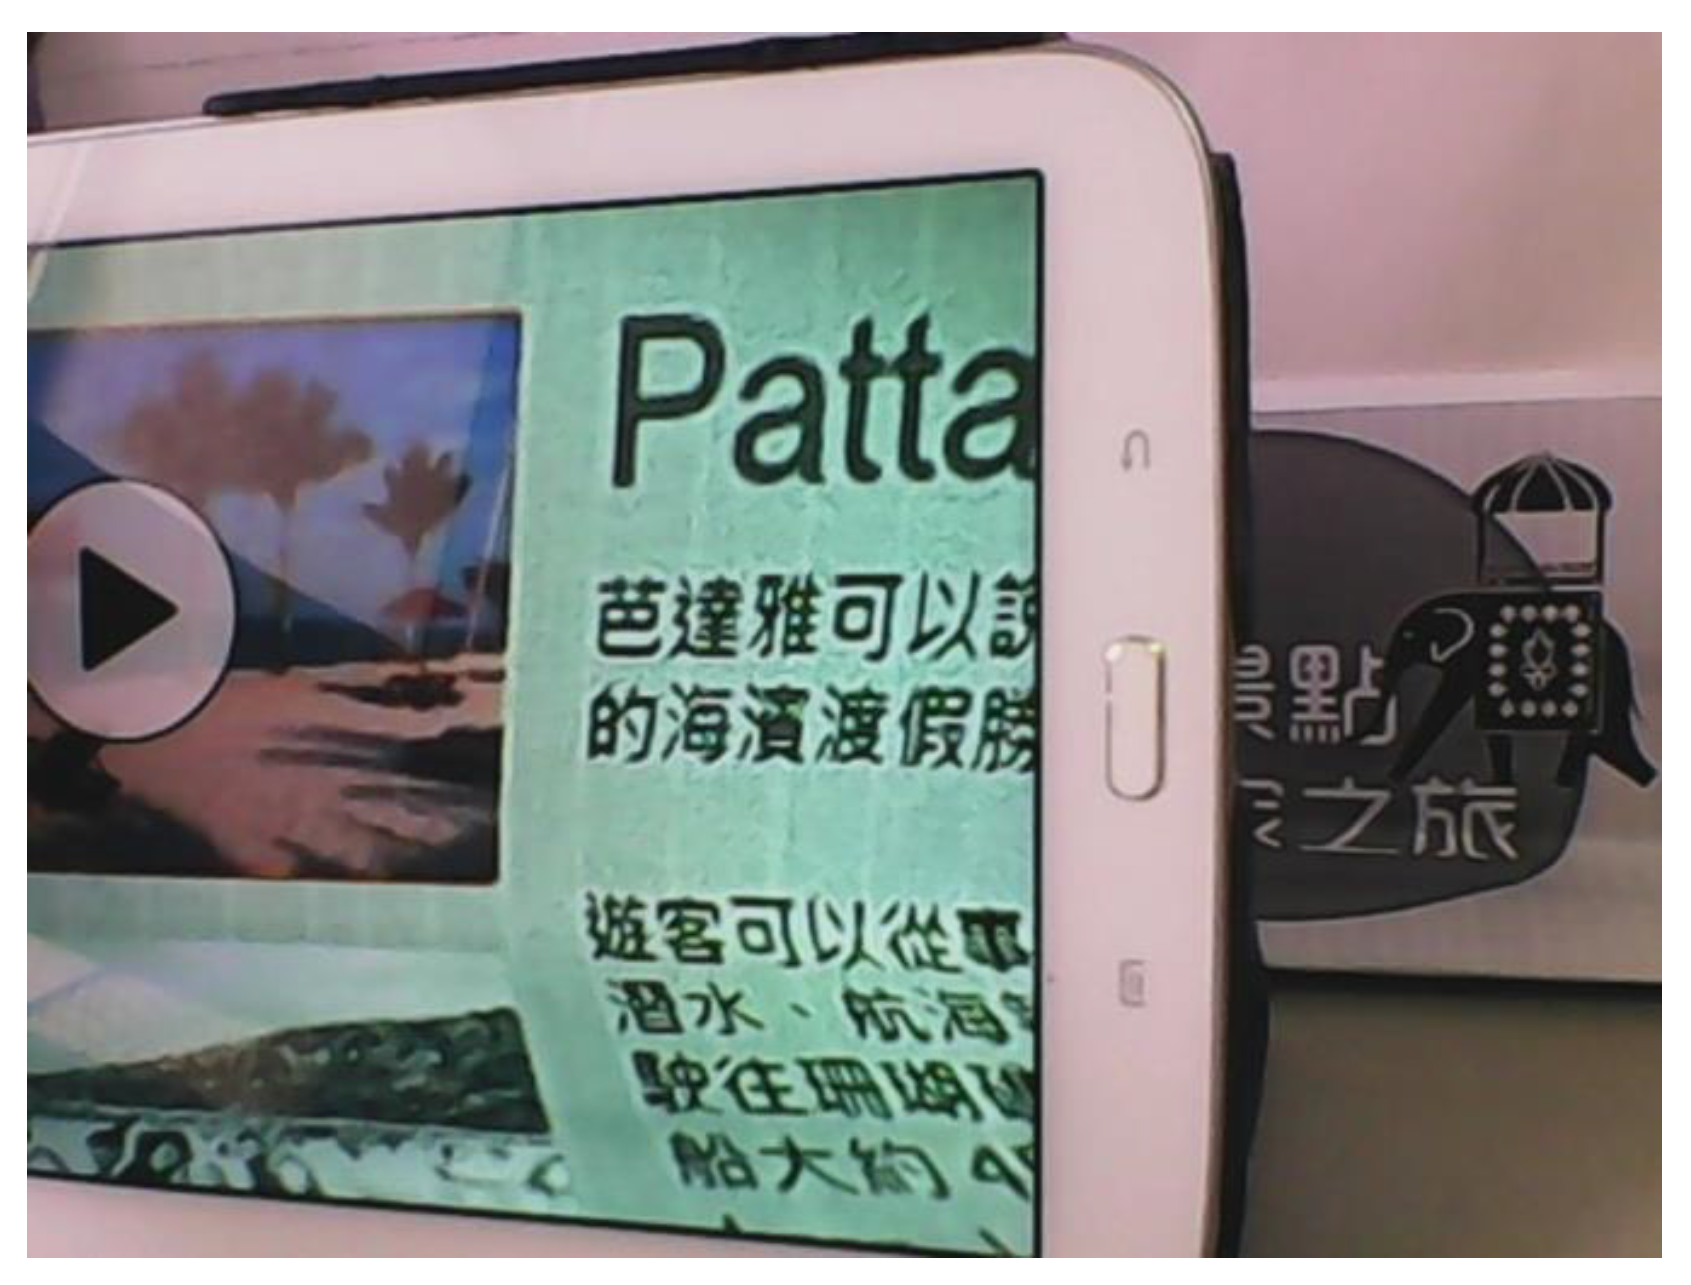
After users initialize the tour-sharing APP on their smartphones and point the phone camera at the attraction photos on the tour introduction, the mobile APP automatically identifies the photos in the introduction, converts the static photos into dynamic videos, and begins the video introductions when users tap the play sign (upper-left corner of Figure 3). AR guide services provide dynamic introductions for users, enable users to browse a large amount of information on local attractions, and provide users with guide services.
3.1.1.4. AR Self-Recording Services
When users visit the attractions in the introduction, they can record tour videos at the attractions by double-tapping the play sign. After recording is complete, the tour-sharing APP automatically links the new videos with the corresponding ones (shown in Figure 4).
3.1.1.5. AR Community Sharing
After users record videos of the attractions, the tour-sharing APP also provides the function of sharing videos on social networking sites such as Facebook. Thus, users can share self-recorded tour videos to social networking sites, adjust privacy settings to permit other tourists or only friends to view the videos, and interact and discuss the tours in online communities.
3.1.1.6. AR Tour Memories
When users desire to review tour memories, they can return to the pamphlet, turn on the tour-sharing APP on their smartphones, use the phone camera to scan the photos in the introduction, and play the videos that they recorded at the attractions to re-experience the enjoyment of previous tours.
3.1.2. Query-Answering Server
A query-answering server is proposed with the proposed novel random neural networks (RNNs) [44] to analyze the query from users and classify the query into question class for searching answers. The processes of query-answering server include: (1) receiving a query sentence; (2) using segmentation tool to retrieve words; (3) computing term frequency and inverse document frequency (TF-IDF); (4) using RNNs to analyze question and answer; and (5) replying the answer of user’s query. This study considers the advantages of ensemble machine learning and dropout methods to design RNNs for estimating the linear and nonlinear semantic relationships and preventing the problem of overfitting.
3.1.2.1. Receiving a Query Sentence
The proposed query-answering server provides web services (e.g., representational state transfer (REST) APIs) to an AR tour-sharing APP for receiving user’s query sentence in text format.
3.1.2.2. Using Segmentation Tool to Retrieve Words
After receiving a query sentence, a segmentation mechanism which is combined with a Chinese knowledge information processing (CKIP) tool (Ma and Chen, 2004) is performed to retrieve each word in the query sentence.
3.1.2.3. Computing Term Frequency and Inverse Document Frequency
A TF-IDF mechanism [45] is APPlied to calculate the weighting value of each word in sentence. When a word occurs frequently, the word is important; when a word occurs in serval sentence, the word is unimportant. The TF-IDF mechanism can consider these two factors to measure the weighting value of each word and transfer these weighting values into a vector space model for each query sentence.
3.1.2.4. Using Random Neural Networks to Analyze Question and Answer
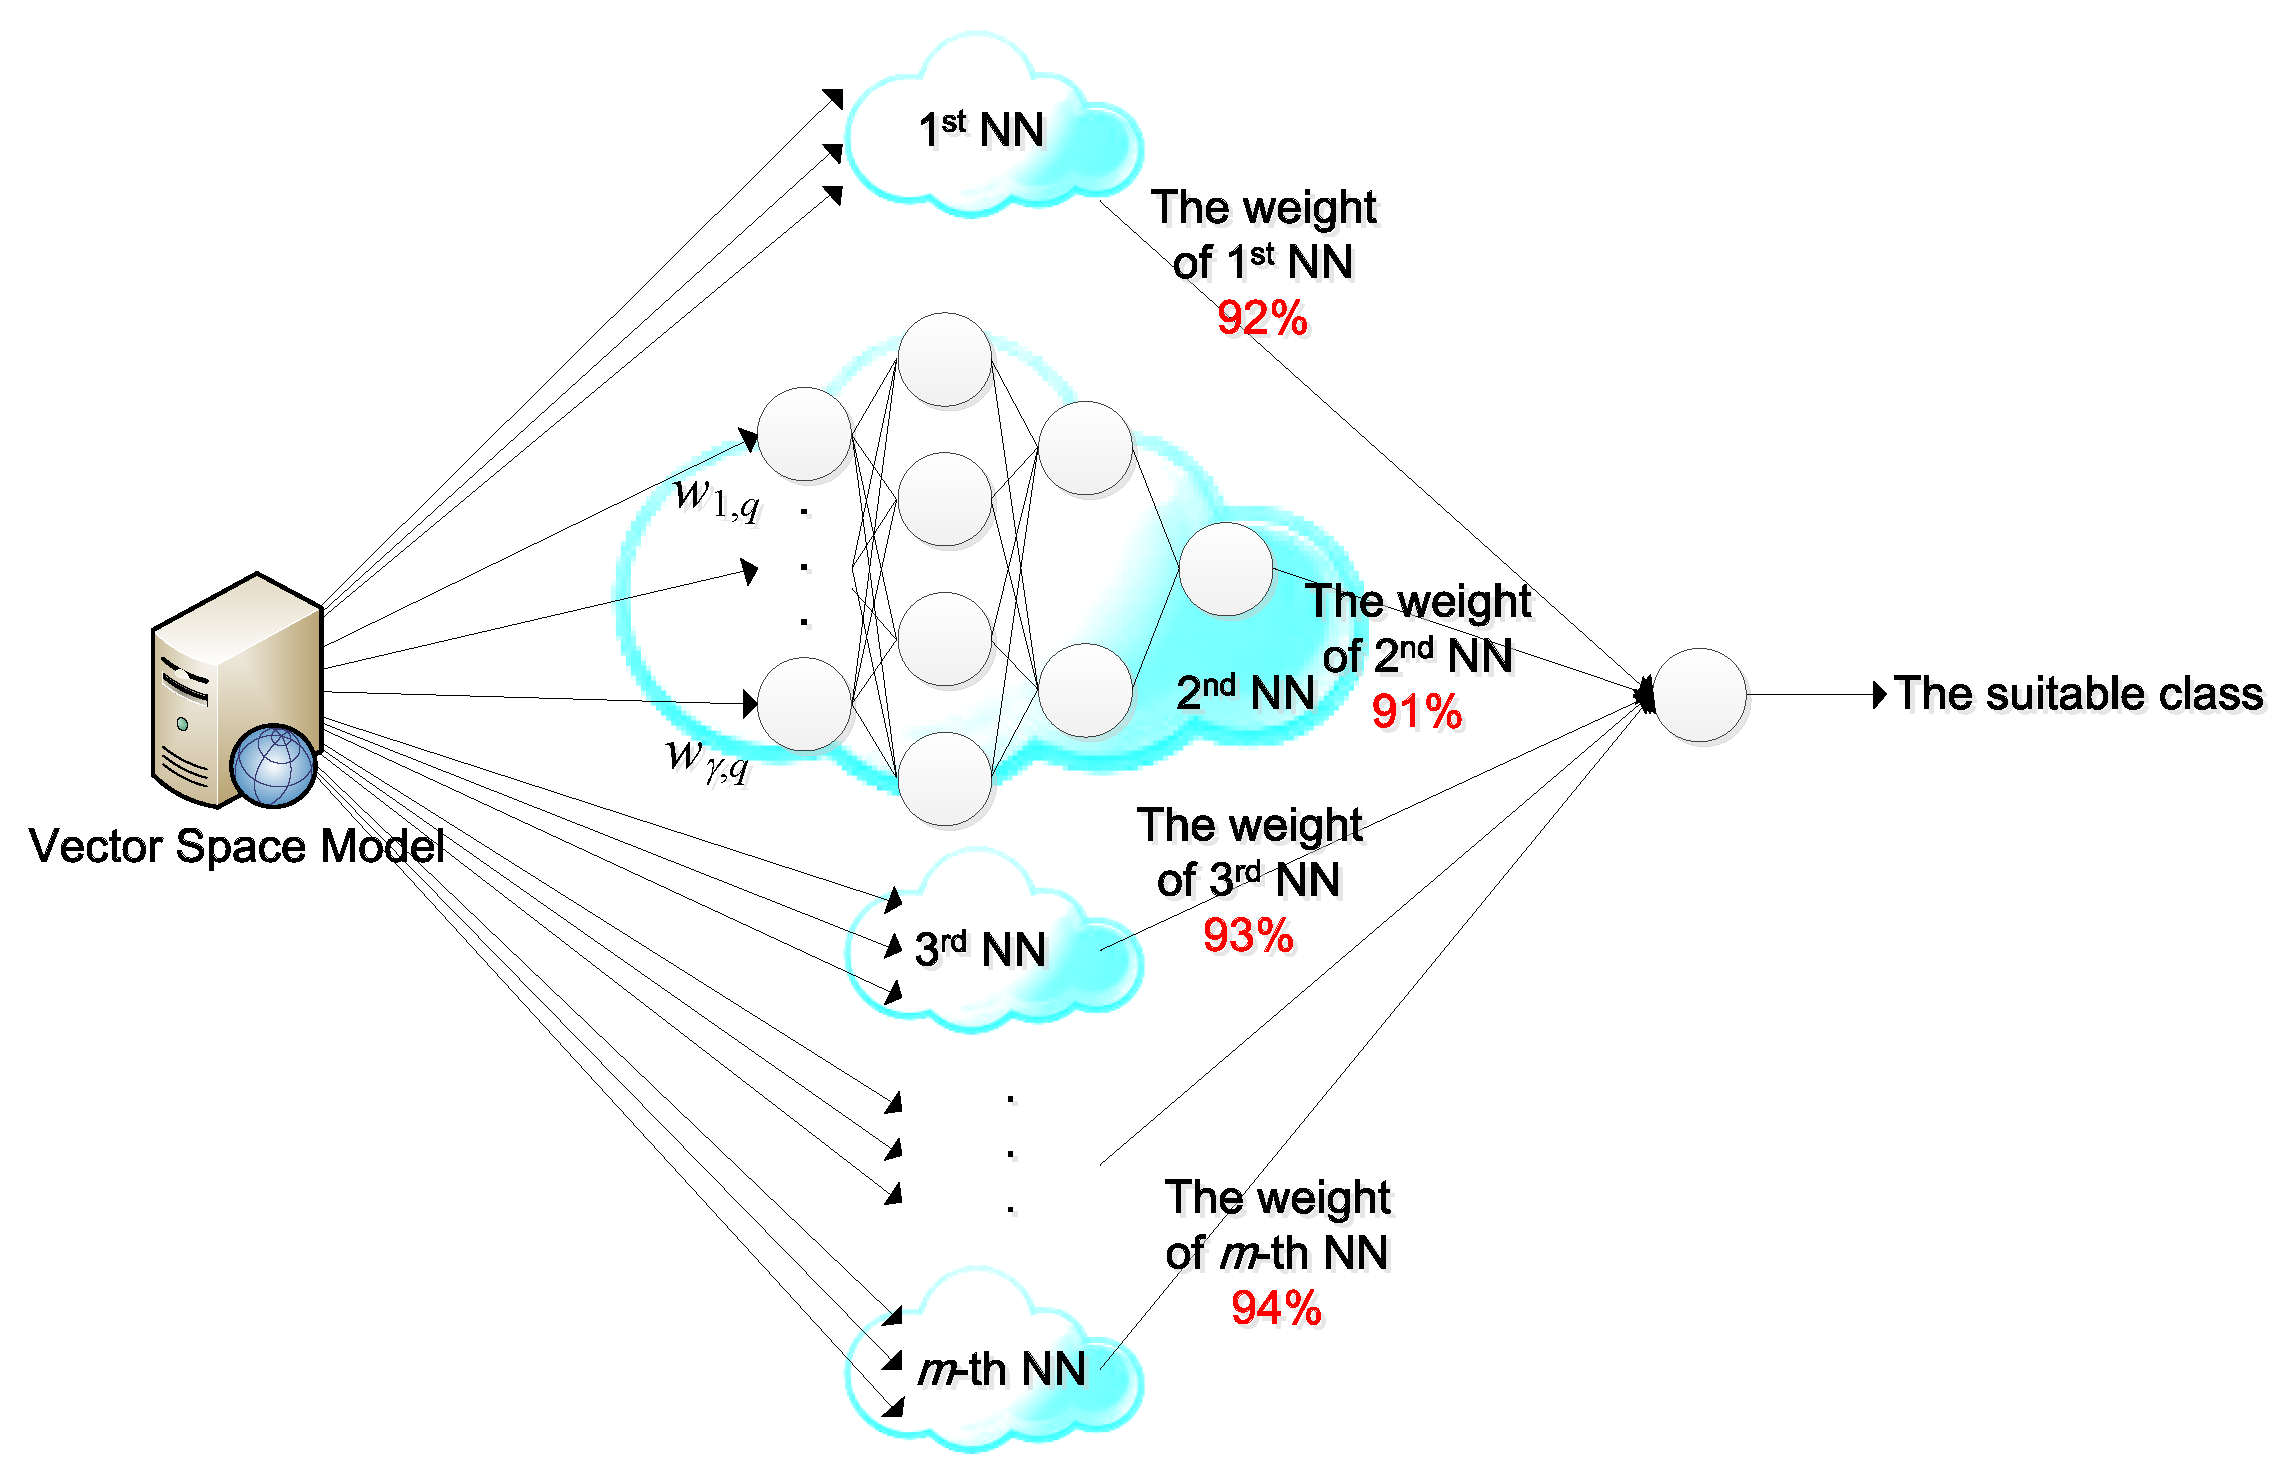
This study proposed RNNs that include two stages: (1) training stage; and (2) runtime and testing stage (shown in Figure 5) for the classification of questions. The details of both stages are presented in the following subsections.
Stage 1: Training Stage
The four steps in Stage 1 (i.e., training stage) include: (1) setting the parameters in RNNs; (2) retrieving the vector set of TF-IDF in each sentence in the historical database; (3) generating m neural network models randomly; and (4) filtering k NN models whose accuracies are higher than the threshold.
(1) Setting the parameters in RNNs
In the training stage, the developers should set the parameters, including the number of NN models (i.e., the parameter m), the maximum number of hidden layers in each NN model (i.e., the parameter hmax), the maximum number of neurons in each hidden layer (i.e., the parameter cmax), the ratio of training data to all data in the training stage (i.e., the parameter r%), and the accuracy threshold of each NN model (i.e., the parameter wthreshold). Five datasets in Table 1 are considered and grouped in this study.
(2) Retrieving the vector set of TF-IDF in each sentence in the historical database
The query sentences can be retrieved and stored in a historical database, and each sentence can be transformed into the vector set of TF-IDF. For example, the TF-IDF value of the α-th word in the β-th sentence is wα, β, and there are γ distinct words in the historical database. Then, the vector set of TF-IDF for the the β-th sentence is defined as {w1,β, w2,β, …, wγ,β}. These vector sets of sentences in the historical database are the input data for RNNs.
(3) Generating m NN models randomly
In accordance with the parameters in RNNs, m NN models are randomly generated for arrival time prediction. r% of dTR (i.e., the parameter dTRTR,i) for the i-th NN model is randomly selected for training in Stage 1, and the remaining (100% − r%) of dTR (i.e., the parameter dTETR,i) for the i-th NN model is selected for testing and obtaining the weighting value (i.e., accuracy) of each NN model in Stage 1. Furthermore, the number of hidden layers is randomly generated between 0 and hmax for each NN model, and the number of neurons is randomly generated between 0 and cmax for each hidden layer. Suppose the composition of hidden layers, neurons, and training dataset is different for each NN model. Each NN model can then be trained by using different training datasets. For instance, the dataset dTRTR,i is used to train the i-th NN model. Moreover, each NN model can be trained by using different remaining datasets. For example, the dataset dTETR,i is used to test the i-th NN model and evaluate the accuracy of this model. The accuracy of the NN model is presented as a weighting value in the runtime and testing stage (i.e., Stage 2).
(4) Filtering k NN models with accuracies higher than the threshold
These accuracies of NN models in Step (3) are compared with the accuracy threshold wthreshold, and the NN models with lower accuracies are filtered out. The remaining k NN models with higher accuracies are filtered for using in Stage 2.
Stage 2: Runtime and Testing Stage
The three steps in Stage 2 (i.e., runtime and testing stage) include: (1) retrieving the vector set of TF-IDF in query sentence in runtime data or testing data in Stage 2; (2) inputting the data into the k NN models from Stage 1 to estimate the question class; and (3) retrieving the answer according to the estimated question class.
(1) Retrieving the vector set of TF-IDF in query sentence in runtime data or testing data in Stage 2
In the runtime and testing stage, the vector set of TF-IDF of query sentence, which is defined as {w1,q, w2,q, …, wγ,q}, is retrieved using the methods mentioned in Section 3.1.2.
(2) Inputting the data into the k NN models from Stage 1 to estimate the question class
The dataset of {w1,q, w2,q, …, wγ,q} in the runtime dataset or dataset dTE is adopted into k NN models from Stage 1. The question class can be estimated by each NN model, and the corresponding weighting value of each NN model can be summarized for each question class. For instance, there are three NN models (i.e., the value of k is 3) in Stage 2, and the weighting values of these three NN models are 0.92, 0.91 and 0.93, respectively. The estimation results of these NN models are Class 1, Class 2, and Class 1. Then the summarized weighting values of Class 1 and Class 2 are 1.85 and 0.91.
(3) Retrieving the answer according to the estimated question class
The weighting value of each question class can be compared, and the estimated question class with the highest weighting value can be obtained. Then, the corresponding answer can be retrieved according to the estimated question class.
3.1.2.5. Replying the answer of user’s query
The retrieved answer in Section 3.1.2.4 can be replied to the AR tour-sharing APP via web services (e.g., REST APIs).
3.2. Evaluation and Experimental Results
This subsection describes the experimental environment and gives some practical results for the evaluation of the proposed query-answering system.
3.2.1. Experimental Environment
In this study, thirty question classes (i.e., the top 30 frequently asked questions) (shown in Table 2) were defined and 36 users participated in experiments. Therefore, 1080 query sentences (i.e., 1080 = 30 × 36) were collected for the evaluation of query-answering system. The k-fold cross-validation method was adopted, and training stage and test stage were performed 1080 times (i.e., the value of k is 1080). For instance, the i-th query sentence was selected as the testing data, and the other query sentences (i.e., remaining 1079 query sentences) were selected as the training data in the i-th run; the total of 1080 runs was performed in experiments. For implementation, an AR tour-sharing APP was deployed in Samsung Note 8.0, and Google Cloud Speech APIs and Samsung text-to-speech engine are used for QASs.
3.2.2. System Evaluation
For the evaluation of query-answering system, RBR algorithm, kNN algorithm, back-propagation NN, and the proposed RNNs were implemented and compared. The corpus of words in this study included 293 words, so the dimension of input data was 293; the total of 30 classes was output data. This study used the Package “class” [46] to implement kNN and adopt the value of k as 1 in experiments. The package “neuralnet” [47] was used to implement back-propagation neural networks (BPNNs), and RNNs extended the package “neuralnet” [47] to randomly generate several NNs and estimate the classification results. In experiments, RNNs method generated two BPNNs (i.e., the value of m was equal to two) which included one input layer, one hidden layer, and one output layer. The input layer included 293 neurons, and the output layer included 30 neurons; the SoftMax function [48] was adopted to analyze the output layer for determining the suitable class. The hidden layer of the first BPNN included two neurons, and the hidden layer of the second BPNN included four neurons. Therefore, the structures of the first BPNN and the second BPNN were expressed as “293-2-30” and “293-4-30”, respectively. These NNs were used to evaluate the classification performances of single BPNN and RNNs for QAS.
Table 3 showed the classification accuracies of RBR algorithm, kNN algorithm, BPNN, and RNNs. In the practical results, the RBR algorithm could not support homophones and synonyms, so the accuracy of using the RBR algorithm is lower. Although the accuracies of using the traditional machine learning methods (e.g., kNN algorithm and back-propagation NN) were about 93%, these methods could not analyze from different viewpoints of datasets. Furthermore, the problem of overfitting might exist in single BPNN, so the accuracies of BPNN “293-2-30” and BPNN “293-4-30” were lower. The proposed RNNs could support the analyses of homophones, synonyms, and semantics according to different viewpoints of datasets, and the accuracy of this method was 99.51%. Therefore, this study applies RNNs to support QASs in the intelligent tour service system.
3.3. A Case Study of QAS
The steps of QAS include: (1) user’s query in natural language; (2) speech recognition; (3) segmentation; (4) TF-IDF; (5) VSM; (6) RNNs; (7) getting the suitable class (i.e., FAQ); (8) finding the predefined answer of the FAQ; and (9) performing text to voice (shown in Figure 6). For instance, a user uses the AR tour-sharing APP in Samsung Note 8.0 and asks a question (e.g., “請問客家人的由來與分佈? What are the origin and the population distribution of Hakka?”) in Chinese natural language. The AR tour-sharing APP can perform speech recognition based on Google Cloud Speech API to get the texts of the query sentence (i.e., question) and send these texts to the query-answering server. The words of “請問”, “客家人”, “的”, “由來”, “與”, and “分佈” are retrieved from the query sentence by the segmentation process in the query-answering server. The vectors of these words are measured by TF-IDF method to generate a VSM for classification. This study adopts the proposed RNNs method as a classifier, and two NNs are pre-trained in RNNs mentioned in Section 3.2.2. In this case, the classification results of the 1st NN and the 2nd NN are both Class 1 (i.e., Question 1). Therefore, the suitable class is Class 1, and the predefined answer of Question 1 is found from database. Finally, the answer can be sent to the AR tour-sharing APP, and the APP performs Samsung text-to-speech engine and speaks the answer for user.
4. User Attitudes and Behavioral Intentions toward an Intelligent Tour Service System
This study conducted a questionnaire survey by using convenience sampling among national universities in Northern Taiwan. Before answering the questionnaire, every respondent was required to operate the proposed tour-sharing APP. A flyer for promoting the tourist attractions of Hakka culture in Thailand was designed. The flyer included introductions of Pattaya, the Chinese Cultural Garden, the Temple of Emperor Guan, and Thai Hakka cuisine. Each attraction included two photos, which could be scanned by a mobile phone to see the official video introduction and previous tourists’ videos of that attraction, each lasting for approximately 30 s. During the questionnaire survey, respondents were initially required to read a textual description and imagine a situation. The description was as follows: “Please imagine that you are traveling in Thailand and encounter an introduction about the tourist attractions of local Hakka culture in Thailand. Now, please use your mobile phone to scan the photos on the introduction. The photos will show you not only the official video introductions of the attractions but also the videos recorded by previous tourists who visited these attractions. Moreover, when you visit the attractions, you can also record your own travel experiences for the reference of other tourists by using this introduction, which demonstrates the function of the tour-sharing APP. In summary, the tour-sharing APP gathers the travel experiences recorded by fellow tourists for the reference of those who want to visit these attractions. Try it out, record your own travel video by using this tour-sharing APP, and add a traveler video to the introduction!” After reading this textual description, the respondents operated the tour-sharing APP with the assistance of the survey performers and answered the questionnaire after operation. The overall survey time lasted approximately 30–40 min.
Based on TAM and UGT, this study explored users’ satisfaction with and willingness to use the tour-sharing APP equipped with an AR function. Figure 7 illustrates the framework of this study. Regarding framework verification, this study adopted structural equation modeling to analyze and compare the returned data as well as to verify the model.
4.1. Variables
4.1.1. Self-Presentation
Self-presentation is defined as presenting personal thoughts by using a creative manner of expression [32,33]. The items of expressiveness proposed by Herbjørn, Per, and Helge (2005) were modified to measure this variable [49]. The modified items included the following: “This tour-sharing APP enables me to present tour experiences to others”, “this tour-sharing APP enables me to present my tour experiences to obtain others’ feedback”, and “this tour-sharing APP enables me to try new APP functions to remain updated on the latest technological trends.” A 7-point Likert scale was adopted for measurement, with scores ranging from 1 (strongly disagree) to 7 (strongly agree); Cronbach’s α was 0.89.
4.1.2. Perceived Entertainment
4.1.3. Information Sharing
Information sharing refers to the level of willingness to share information with others [36]. The items for this variable were formulated based on the items related to sharing proposed by Santosa, Wei, and Chan (2005) [52]. The modified items read, “For me, the probability of using the tour-sharing APP to share tour information is high”, “I am willing to use the tour-sharing APP to share tour information”, and “I want to use the tour-sharing APP to share tour information.” A seven-point Likert scale was employed to measure these items, with scores ranging from 1 (strongly disagree) to 7 (strongly agree). The scores of all items were totaled and averaged to measure information sharing (Cronbach’s α = 0.93).
4.1.4. Perceived Usefulness
PU is defined as the level to which an individual believes in the ability of a particular system to enhance job performance [53]. A seven-point Likert scale was adopted for measurement, with scores ranging from 1 (strongly disagree) to 7 (strongly agree). The items for this variable were formulated based on the relevant items proposed by Vrechopoulos et al. (2004) [54]. The modified items read, “This tour-sharing APP is useful for seeking information related to Hakka cultural attractions in Thailand”, “this tour-sharing APP enhances my effectiveness in seeking information related to Hakka cultural attractions in Thailand”, and “I would like to use the tour-sharing APP to seek information on Hakka cultural attractions in Thailand.” The scores of all items were totaled and averaged to measure PU (Cronbach’s α = 0.88).
4.1.5. Perceived Ease of Use
EOU denotes the level to which an individual believes in the ability of a particular system to reduce effort [16]. Based on the operational definition, the scale of this variable was modified from the EOU scale proposed by Davis, Bagozzi, and Warshaw (1989) [53]. The items included, “Learning to operate the tour-sharing APP is easy for me”, “I feel that using the tour-sharing APP to execute the task I want it to complete is easy”, “improving my ability to use the tour-sharing APP is easy”, and “I find the tour-sharing APP easy to use.” The items were measured using a seven-point Likert scale, with scores ranging from 1 (strongly disagree) to 7 (strongly agree). The scores of all items were totaled and averaged to evaluate EOU (Cronbach’s α = 0.93).
4.1.6. Satisfaction
According to UGT, the target audience possesses specific needs to be fulfilled by the use of media. Therefore, this study defined satisfaction as the gratification obtained from using the tour-sharing APP. Satisfaction was measured using the satisfaction scale proposed by Luo (2002) [55] in the study on the usage behavior of Internet media. The modified items included: “I feel satisfied with the ease of use in this tour-sharing APP”, “I feel satisfied with the information provided by the tour-sharing APP”, and “overall, I am satisfied with the tour-sharing APP.” The reliability analysis indicated that the fourth item only achieved a reliability of 0.64, which was lower than 0.7. Therefore, this item was abandoned, and the scores of the first three items were totaled and averaged to evaluate satisfaction (Cronbach’s α = 0.89).
4.1.7. Attitude toward the Hakka Tourist Attractions in Thailand
This study measured users’ attitude toward the Hakka attractions in Thailand introduced by the tour-sharing APP according to the criteria of negative or positive, unfavorable or favorable, and bad or good (Lee and Aaker, 2004; p. 215). A seven-point Likert scale was adopted for measurement, with scores ranging from 1 (strongly disagree) to 7 (strongly agree). The average score of the attitude toward the attractions was calculated (Cronbach’s α = 0.92).
4.1.8. Intention for Use
The items for intention for use were modified from the items proposed by Kuo and Yen (2009) [56]. The modified items included, “I will try to use this tour-sharing APP if I need the information of the Hakka tourist attractions in Thailand”, “if possible, I will try to use this tour-sharing APP again”, and “I plan to use this tour-sharing APP in the future” (Cronbach’s α = 0.92).
5. Data Analysis and Results
Descriptive statistics indicated that the percentages of male and female respondents in the 466 valid samples were close (217 men and 229 women), and 81.8% of all respondents were aged 16–35 years. Structural equation modeling (Amos 20.0) was adopted to verify the causal relations between the variables and the hypotheses of this study. Initially, confirmatory factor analysis was conducted to test the convergent validity and discriminant validity of all the constructs in the model. Regarding the test of convergent validity, the estimates of variance extracted must be tested (i.e., calculating the variance that an item can be explained by its measuring variable). All of the average variances extracted (AVEs) of the eight variables examined in this study were above the standard value of 50% and the threshold of 0.5 suggested by Fornell and Larcker (1981) [57], indicating that indicators effectively represented the latent variables and possessed convergent validity. Discriminant validity was tested using the method proposed by Fornell and Larcker (1981) [57]. When the square root of the AVE of a construct was greater than the correlation coefficients of the other constructs, the test results indicated that the AVEs of all constructs were greater than the square between all constructs. Therefore, this study met the test criterion of discriminant validity. Cronbach’s α was adopted as the determination criteria for reliability analysis. The results indicated that each construct achieved a Cronbach’s α above 0.7, ranging from 0.88 to 0.94, demonstrating high reliability (Table 4).
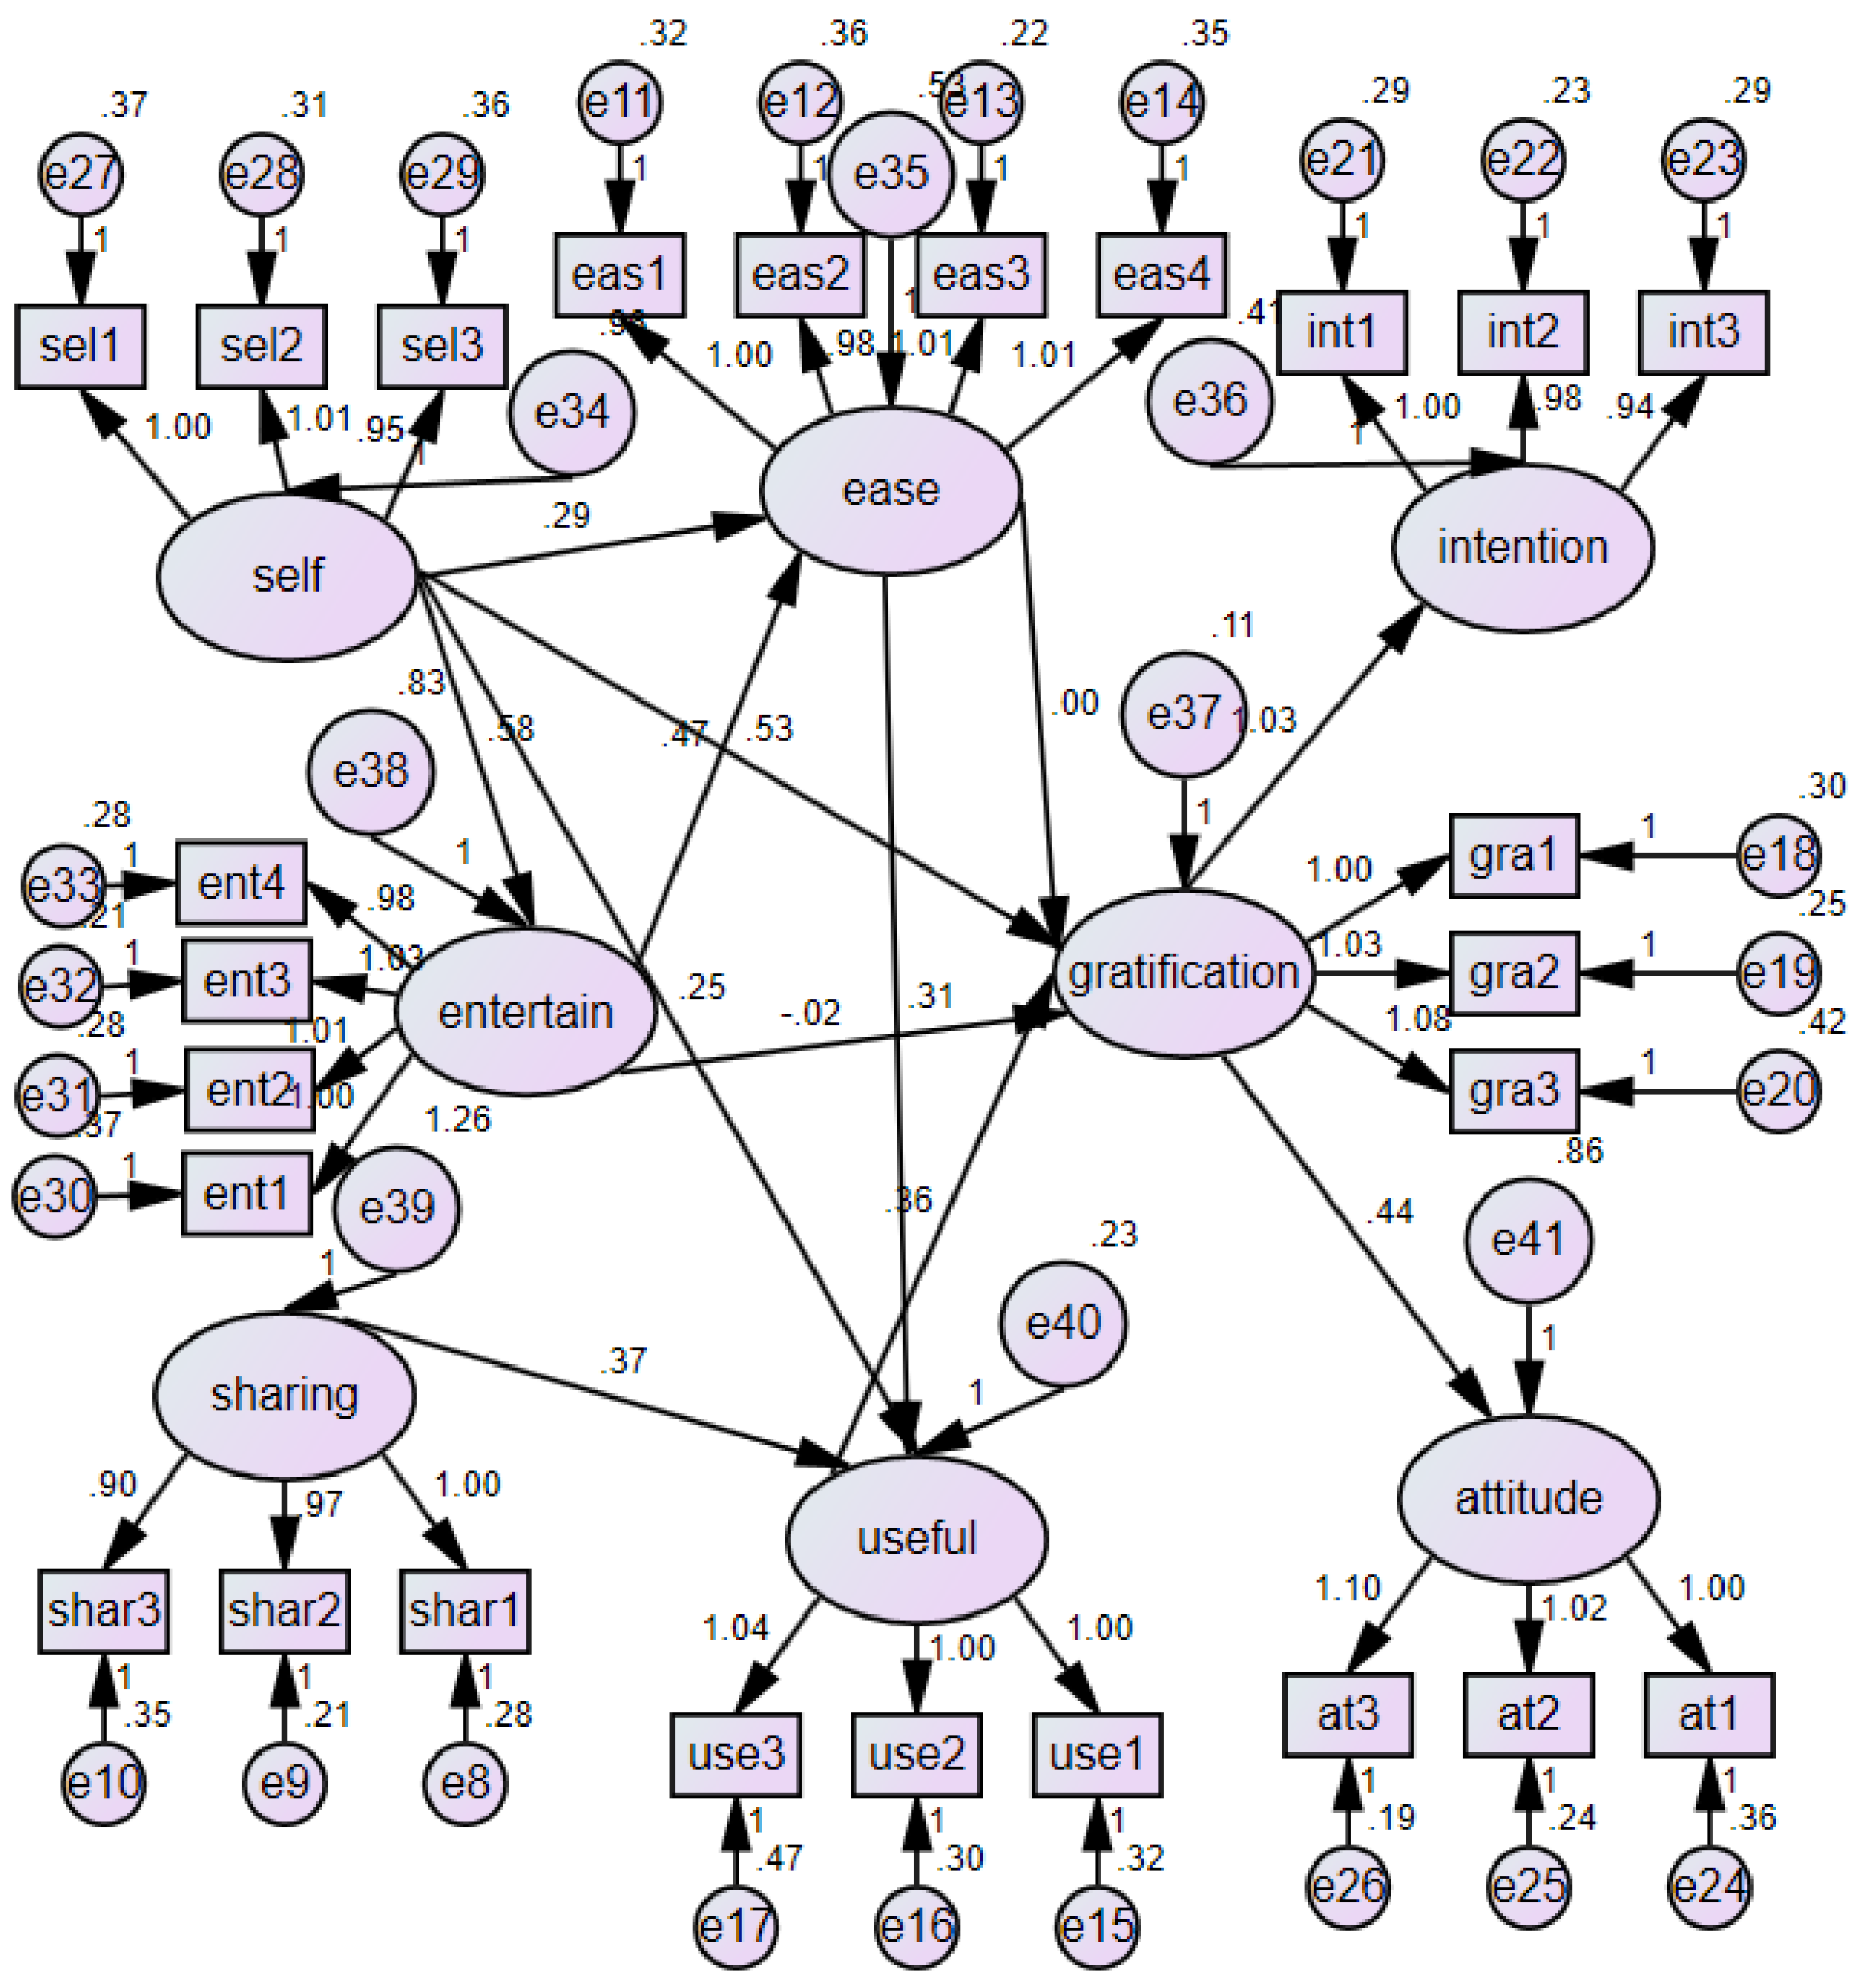
Subsequently, in the overall goodness-of-fit test, the chi-square values must be smaller than the tripled threshold of the degree of freedom (Bagozzi and Yi, 1988) [58]. The residual estimate (root mean square error of approximation) was 0.076, which satisfied the test criterion of <0.08. Furthermore, both the goodness-of-fit index (GFI; 0.858) and the adjusted GFI (0.826) of this study were greater than 0.8 and therefore acceptable because they met Jöreskog and Sörbom’s (1988) criterion [59], which stated that GFI and adjusted GFI range between 0.8 and 0.9. Finally, both the comparative fit index (0.93) and the incremental fit index (0.93) satisfied the determination criterion of >0.9. The analytical results indicated that the theoretical model of this study was within the acceptable range. Figure 8 presents the linear structural relations model.
After confirming that the goodness of fit reached the acceptable range, this study individually explained the coefficients of the causal relations between all variables (Table 5). H1 (standardized coefficients = 0.53, p < 0.001), H2 (standardized coefficients = 0.28, p < 0.001), H3 (standardized coefficients = 0.30, p < 0.001), H4 (standardized coefficients = 0.67, p < 0.001), H5 (standardized coefficients = 0.50, p < 0.001), H7 (standardized coefficients = 0.52, p = 0.330), H8 (standardized coefficients = 0.39, p < 0.001), H10 (standardized coefficients = 0.37, p < 0.001), H11 (standardized coefficients = 0.78, p < 0.001), and H12 (standardized coefficients = 0.35, p < 0.001) were confirmed. H6 (standardized coefficients = −0.02, p = 0.63) and H9 (standardized coefficients = 0.00, p = 0.96) were rejected.
6. Conclusions and Suggestions
This study designed an intelligent tour service system including an AR tour-sharing APP and a query-answering server and used the APP to guide tourists through the Hakka cultural attractions in Thailand to further examine the APP’s practical effectiveness by conducting empirical research. For the development of query-answering server, the novel random neural networks (RNNs) were proposed and evaluated. In practical experimental results, the accuracy of RNNs was 99.51%, and it was higher than previous methods. Furthermore, this study adopted TAM and UGT to investigate the acceptance behavior of the AR tour-sharing APP. The results and discussions are presented in this section.
First, this study determined that this APP satisfied users’ needs for self-presentation. In other words, when users considered this APP a source of self-presentation, they tended to feel satisfied with the usage behavior of this APP. This result corresponded with Yang’s (2013) [60] argument that not all APPs exhibit influences of perceived expressiveness, and attitude toward APPs, on usage behavior; rather, APPs involving interaction (e.g., social networking APPs) are more likely to exert such influence than are APPs that do not involve interaction. In addition to influencing satisfaction directly, self-presentation exerted indirect influence on satisfaction through PU. This indicated that the more that users regarded self-recorded tour videos as helpful information to others, the more that they were satisfied with this APP. This result corresponded with the finding of Hayashi et al. (2004) that PU and satisfaction were positively correlated in three different online training environments [61].
Second, this study determined that PE did not directly influence satisfaction but exerted indirect influence through EOU and PU, probably because an APP that is overly complex to operate and not user-friendly reduces user satisfaction. Therefore, APPs that possess high PE, feature easy operation, and provide useful information are likely to obtain high user satisfaction. In addition to the indirect influence PE exerted on satisfaction through EOU and PU, information sharing indirectly influenced satisfaction through PU.
Third, this study confirmed that self-presentation, PE, information sharing, and PU directly or indirectly affected the intention to use the APP through satisfaction with the APP. These results partially supported the finding of Herbjørn and Helge (2005) that the intention to use mobile services is significantly influenced by expressiveness, PE, usefulness, EOU, attitude, normative pressure, and perceived control [49]. Moreover, Herbjørn and Helge (2005) demonstrated that the attitude toward mobile services is influenced by PE, usefulness, and EOU [49]. The attitude discussed in this study referred to the attitude toward the attractions introduced in the APP. The results indicated that satisfaction with using the APP affected users’ attitude toward the tourist attractions marketed by the APP. Therefore, this study identified satisfaction as the predictor for intention for use and the attitude toward the attractions introduced in the APP.
Regarding theoretical and practical implications, this study proved that the new model integrating TAM and UGT can be applied in studies on AR APPs. UGT has been widely applied in media studies and has extended to research on user motivations for broadcasting, television, Internet, and mobile phones [24]. Gratification is generally defined as the self-reported gratification experienced by a media user after media use. The user-centric approach of UGT provided a suitable theoretical framework for the AR tour-sharing APP because users actively scanned photos or uploaded recorded videos to the APP. Unlike the media effects derived from “what media do to people”, UGT can be regarded as a general direction of thinking (i.e., “what people do with media”) to analyze the reactions and interpretations of media users [41]. This study determined that this APP can satisfy users’ needs for self-presentation, PE, and information sharing. Particularly, self-presentation is the most significant variable for predicting satisfaction with the APP. This result differed from those of the studies on other media: self-presentation becomes one of the most crucial motives for the uses and gratifications of modern new media technology. This also explained why this study combined UGT and TAM to investigate the usage behavior of this APP. Such expansion is particularly meaningful to the research on the convergence of communications technology and media.
AR is currently widely applied in fields such as marketing, entertainment, and tourism. AR becomes an appealing technology mainly because of the prevalent location-based services provided by smartphones. However, AR still experiences several challenges partly because of the complex technological devices and non-standardized specifications, which require every AR-related device and platform to be developed individually [2]. Therefore, the acceptance behavior of new AR technology also requires additional empirical research and investigation.
Research limitations and the suggestions for future studies are discussed in this paragraph. Before answering the questionnaire, respondents operated the APP not on personal mobile phones but on phones specifically designed for the test. Therefore, the skill with handling the smartphone may have been affected by the use of an unfamiliar smartphone. This study suggested that future studies consider installing APPs on respondents’ smartphones for respondents to operate APPs on personal phones. Convenience sampling was adopted in this study because of the relatively longer test time required, which resulted in unwillingness to answer the questionnaire and thus a low recovery rate. Convenience sampling, although the most convenient and economical sampling method, may generate sampling errors. Therefore, this study suggests that random sampling be adopted in the future. After examining the effectiveness evaluation of the APP in tour-guide marketing, this study suggested that the APP be applied in product marketing as well in the future. When formulating marketing strategies, businesses can add videos displaying consumers personally using products to perform word-of-mouth marketing and further strengthen the persuasive effects.
Acknowledgments
This study was supported by the National Science Council of Taiwan under Grant Nos. 104-2628-H-003-003-MY2 and 105w947.
Author Contributions
Hui-Fei Lin and Chi-Hua Chen conceived and designed the experiments; Hui-Fei Lin and Chi-Hua Chen performed the experiments; Hui-Fei Lin and Chi-Hua Chen analyzed the data; Hui-Fei Lin and Chi-Hua Chen contributed reagents/materials/analysis tools; and Hui-Fei Lin and Chi-Hua Chen wrote the paper.
Conflicts of Interest
The authors declare no conflict of interest.
References
- Lin, H.F.; Chen, C.H. Design and application of augmented reality query-answering system in mobile phone information navigation. Expert Syst. Appl. 2015, 42, 810–820. [Google Scholar] [CrossRef]
- Berryman, D.R. Augmented reality: A review. Med. Ref. Serv. Q. 2012, 31, 212–218. [Google Scholar] [CrossRef] [PubMed]
- Azuma, R.; Baillot, Y.; Behringer, R.; Feiner, S.; Julier, S.; MacIntyre, B. Recent advances in augmented reality. IEEE Comput. Gr. Appl. 2001, 21, 34–47. [Google Scholar] [CrossRef]
- Milgram, P.; Kishino, F. A Taxonomy of Mixed Reality Visual Displays. IEICE Trans. Inf. Syst. 1994, 77, 1321–1329. [Google Scholar]
- Normand, J.M.; Servieres, M.; Moreau, G. A new typology of augmented reality applications. In Proceedings of the 3rd Augmented Human International Conference, Megève, France, 8–9 March 2012; ACM: New York, NY, USA, 2012. [Google Scholar]
- Ahmad, H.; Rahimi, S. A perception based, domain specific expert system for question-answering support. In Proceedings of the 2006 IEEE/WIC/ACM International Conference on Web Intelligence, Hong Kong, China, 18–22 December 2006. [Google Scholar]
- Kaur, J.; Gupta, V. Comparative analysis of question answering system in Indian languages. Int. J. Adv. Res. Comput. Sci. Softw. Eng. 2013, 3, 584–592. [Google Scholar]
- Zhang, T.; Oles, F.J. Text categorization based on regularized linear classification methods. Inf. Retr. 2001, 4, 5–31. [Google Scholar] [CrossRef]
- Wang, J.; Man, C.; Zhao, Y.; Wang, F. An answer recommendation algorithm for medical community question answering systems. In Proceedings of the 2016 IEEE International Conference on Service Operations and Logistics, and Informatics, Beijing, China, 10–12 July 2016. [Google Scholar]
- Deerwester, S.; Dumais, S.T.; Furnas, G.W.; Landauer, T.K.; Harshman, R. Indexing by latent semantic analysis. J. Am. Soc. Inf. Sci. 1990, 41, 391–407. [Google Scholar] [CrossRef]
- Wu, Q.; Shen, C.; Wang, P.; Dick, A.; Hengel, A. Image captioning and visual question answering based on attributes and external knowledge. IEEE Trans. Pattern Anal. Mach. Intell. 2017. accepted manuscript. [Google Scholar] [CrossRef] [PubMed]
- Hong, L.; Davison, B.D. A classification-based approach to question answering in discussion boards. In Proceedings of the 32nd International ACM SIGIR Conference on Research and Development in Information Retrieval, Boston, MA, USA, 19–23 July 2009. [Google Scholar]
- Chang, J.W.; Kim, Y.K. Materialization-Based range and k-nearest neighbor query processing algorithms. In Proceedings of the 7th International Conference on Flexible Query Answering Systems, Milan, Italy, 7–10 June 2006. [Google Scholar]
- Khemmarat, S.; Gao, L. Predictive and personalized drug query system. IEEE J. Biomed. Health Inform. 2017. accepted manuscript. [Google Scholar] [CrossRef] [PubMed]
- Srivastava, N.; Hinton, G.; Krizhevsky, A.; Sutskever, I.; Salakhutdinov, R. Dropout: A simple way to prevent neural networks from overfitting. J. Mach. Learn. Res. 2014, 15, 1929–1958. [Google Scholar]
- Davis, F.D. Perceived usefulness, perceived ease of use, and user acceptance of information technology. MIS Q. 1989, 13, 319–340. [Google Scholar] [CrossRef]
- Jiang, G.; Deng, W. An empirical analysis of factors influencing the adoption of mobile instant messaging in China. Int. J. Mob. Commun. 2011, 9, 563–583. [Google Scholar] [CrossRef]
- Lin, J.C.; Hsu, C. A multi-facet analysis of factors affecting the adoption of multimedia messaging service (MMS). Int. J. Technol. Hum. Interact. 2009, 5, 18–36. [Google Scholar] [CrossRef]
- Palmgreen, P.; Wenner, L.A.; Rayburn, J.D. Uses and Gratification Research: The Past Ten Years. In Media Gratifications Research: Current Perspectives; Rosengren, K.E., Wenner, L.A., Palmgreen, P., Eds.; Sage: Newbury Park, CA, USA, 1985. [Google Scholar]
- Lampe, C.; Wash, R.; Velasquez, A.; Ozkaya, E. Motivations to participate in online communities. In Proceedings of the 28th International Conference on Human Factors in Computing Systems, Atlanta, GA, USA, 10–15 April 2010; ACM: New York, NY, USA, 2010; pp. 1927–1936. [Google Scholar]
- Papacharissi, Z.; Mendelson, A. Toward a new(er) sociability: Uses, gratifications and social capital on Facebook. In Media Perspectives for the 21st Century; Papathanassopoulos, S., Ed.; Routledge: New York, NY, USA, 2011; pp. 212–230. [Google Scholar]
- Williams, F.; Philips, A.; Lange, P. Gratification associated with new communication technologies. In Media Gratifications Research: Current Perspectives; Rosengren, K., Winner, L.A., Palmgreen, P., Eds.; Sage: Beverly Hills, CA, USA, 1994; pp. 241–252. [Google Scholar]
- Blumler, J.G.; Katz, E. The Uses of Mass Communications: Current Perspectives on Gratifications Research; Sage Publications: Beverly Hills, CA, USA, 1974. [Google Scholar]
- Leung, L.; Wei, R. More than just talk on the move: Uses and gratifications of cellular phone. J. Mass Commun. Q. 2000, 77, 308–320. [Google Scholar] [CrossRef]
- Huang, E. Use and Gratification in e-consumers. Internet Res. 2008, 18, 405–426. [Google Scholar] [CrossRef]
- Choi, Y.K.; Kim, J.; McMillan, S.J. Motivators for the intention to use mobile TV. Int. J. Adv. 2009, 28, 147–167. [Google Scholar] [CrossRef]
- LaRue, E.M.; Mitchell, A.M.; Terhorst, L.; Karimi, H.A. Assessing mobile phone communication utility preferences in a social support network. Telemat. Inform. 2010, 27, 363–369. [Google Scholar] [CrossRef]
- Wei, R. Motivations for using the mobile phone for mass communications and entertainment. Telemat. Inform. 2008, 25, 36–46. [Google Scholar] [CrossRef]
- Schlenker, B.R. Self-presentation. In Handbook of Self and Identity; Leary, M.R., Tangney, J.P., Eds.; Guilford: New York, NY, USA, 2002; pp. 492–518. [Google Scholar]
- Schlenker, B.R.; Pontari, B.A. The strategic control of information: Impression management and self-presentation in daily life. In Perspectives on Self and Identity; Tesser, A., Felson, R., Suls, J., Eds.; American Psychological Association: Washington, DC, USA, 2000; pp. 199–232. [Google Scholar]
- Baumeister, R.F. A self-presentational view of social phenomena. Psychol. Bull. 1982, 91, 3–26. [Google Scholar] [CrossRef]
- Krämer, N.C.; Winter, S. Impression management 2.0: The relationship of self-esteem, extraversion, self-efficacy, and self-presentation within social networking sites. J. Media Psychol. 2008, 20, 106–116. [Google Scholar] [CrossRef]
- Pempek, T.A.; Yermolayeva, Y.A.; Calvert, S.L. College students’ social networking experiences on Facebook. J. Appl. Dev. Psychol. 2009, 30, 227–238. [Google Scholar] [CrossRef]
- Buffardi, L.E.; Campbell, W.K. Narcissism and social networking web sites. Pers. Soc. Psychol. Bull. 2008, 34, 1303–1314. [Google Scholar] [CrossRef] [PubMed]
- Sung, J.; Yun, Y. Toward a more robust usability concept with perceived enjoyment in the context of mobile multimedia service. Int. J. Human Comput. Interact. 2010, 1, 12–32. [Google Scholar]
- Gardoni, M.; Spadoni, M.; Vernadat, F. Harnessing non-structured information and knowledge and know-how capitalization in integrated engineering: Case study at Aerospatiale matra. Concurr. Eng. 2000, 8, 281–296. [Google Scholar] [CrossRef]
- Rafaeli, S.; Raban, D.R. Information sharing online: A research challenge. Int. J. Knowl. Learn. 2005, 1, 62–79. [Google Scholar] [CrossRef]
- Shamir, B. Meaning, self and motivation in organizations. Organ. Stud. 1991, 12, 405–424. [Google Scholar] [CrossRef]
- Jarvenpaa, S.L.; Staples, D.S. The use of collaborative electronic media for information sharing: An exploratory study of determinants. J. Strateg. Inf. Syst. 2000, 9, 129–154. [Google Scholar] [CrossRef]
- Moon, J.W.; Kim, Y.G. Extending the TAM for a world-wide-web context. Inf. Manag. 2001, 38, 217–230. [Google Scholar] [CrossRef]
- Shin, D.H. Understanding e-book users: Uses and gratification expectancy model. New Media Soc. 2011, 13, 260–278. [Google Scholar] [CrossRef]
- Mondi, M.; Woods, P.; Rafi, A. A uses and gratification expectancy model to predict students’ perceived e-learning experience. Educ. Technol. Soc. 2008, 11, 241–261. [Google Scholar]
- Rosengren, K.E. Uses and gratifications: A paradigm outlined. In The Uses of Mass Communications: Current Perspective on Gratifications Research; Blumler, J.G., Katz, E., Eds.; Sage: Beverly Hills, CA, USA, 1974; pp. 269–286. [Google Scholar]
- Kung, H.Y.; Kuo, T.H.; Chen, C.H.; Tsai, P.Y. Accuracy analysis mechanism for agriculture data using the ensemble neural network method. Sustainability 2016, 8, 735. [Google Scholar] [CrossRef]
- Basile, P.; Gemmis, M.D.; Lops, P.; Semeraro, G. Solving a complex language game by using knowledge-based word associations discovery. IEEE Trans. Comput. Intell. AI Games 2016, 8, 13–26. [Google Scholar] [CrossRef]
- Ripley, B.; Venables, W. Package ‘Class’. The Comprehensive R Archive Network. 2015. Available online: https://cran.r-project.org/web/packages/class/ (accessed on 28 June 2017).
- Fritsch, S.; Guenther, F.; Suling, M.; Mueller, S.M. Package Neuralnet. The Comprehensive R Archive Network. 2016. Available online: https://cran.r-project.org/web/packages/neuralnet/ (accessed on 28 June 2017).
- Wang, L.; Yang, B.; Chen, Y.; Zhang, X.; Orchard, J. Improving neural-network classifiers using nearest neighbor partitioning. IEEE Trans. Neural Netw. Learn. Syst. 2017. accepted manuscript. [Google Scholar] [CrossRef] [PubMed]
- Herbjørn, N.; Per, E.P.; Helge, T. Intentions to use mobile services: Antecedents and cross-service comparisons. J. Acad. Mark. Sci. 2005, 33, 330–346. [Google Scholar]
- Chen, Q.; Wells, W. Attitude toward the Site. J. Adv. Res. 1999, 39, 27–37. [Google Scholar]
- Ducoffe, R.H. Advertising value and advertising on the web. J. Adv. Res. 1996, 36, 21–35. [Google Scholar]
- Santosa, P.I.; Wei, K.K.; Chan, H.C. Student Involvement with Online Forum and its Effects on Intention to Seek and Intention to Share: An Exploratory Study. Available online: http://www.yorku.ca/yciss/whatsnew/documents/WP30-Lee_and_Rao.pdf (accessed on 10 January 2016).
- Davis, F.D.; Bagozzi, R.P.; Warshaw, P.R. User acceptance of computer technology: A comparison of two theoretical models. Manag. Sci. 1989, 35, 982–1002. [Google Scholar] [CrossRef]
- Vrechopoulos, A.P.; O’keefe, R.M.; Doukidis, G.I.; Siomkos, G.J. Virtual store layout: An experimental comparison in the context of grocery retail. J. Retailing 2004, 80, 13–22. [Google Scholar] [CrossRef]
- Luo, X. Uses and gratifications theory and e-commerce behaviors: A structural equation modeling study. J. Interact. Adv. 2002, 2, 34–41. [Google Scholar] [CrossRef]
- Kuo, Y.-F.; Yen, S.-N. Towards an understanding of the behavioral intention to use 3G mobile value-added services. Comput. Human Behav. 2009, 25, 103–110. [Google Scholar] [CrossRef]
- Fornell, C.; Larcker, D.F. Evaluating structural equation models with unobservable variables and measurement error. J. Mark. Res. 1981, 18, 39–50. [Google Scholar] [CrossRef]
- Bagozzi, R.P.; Yi, Y. On the evaluation of structural equation models. J. Acad. Mark. Sci. 1988, 16, 74–94. [Google Scholar] [CrossRef]
- Jöreskog, K.G.; Sörbom, D. LISREL 7: A Guide to the Program and Application; SPSS Inc.: Chicago, IL, USA, 1988. [Google Scholar]
- Yang, H.C. Bon APPétit for APPS: Yong American consumers’ acceptance of mobile applications. J. Comput. Inf. Syst. 2013, 53, 85–95. [Google Scholar] [CrossRef]
- Hayashi, A.; Chen, C.; Ryan, T.; Wu, J. The role of social presence and moderating role of computer self efficacy in predicting the continuance usage of e-learning systems. J. Inf. Syst. Educ. 2004, 15, 139–154. [Google Scholar]
Figure 1.
Architecture of the proposed intelligent tour service system.
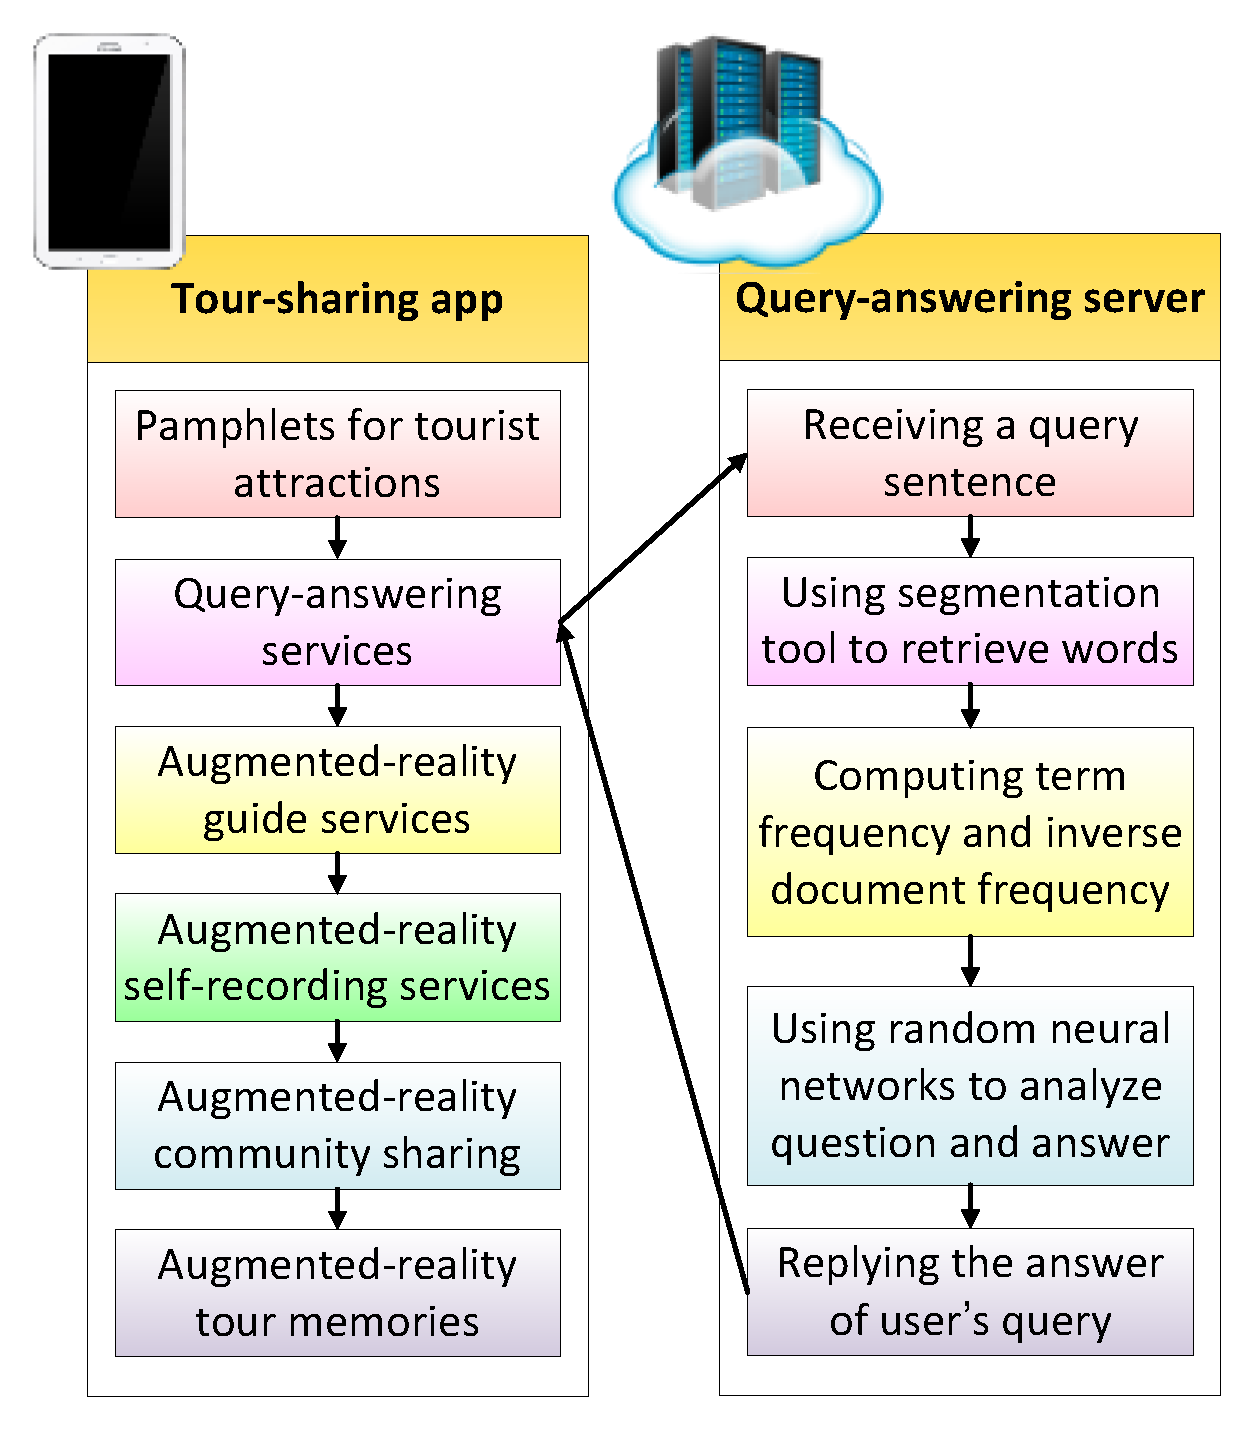
Figure 2.
Pamphlet: Tour of Hakka Attractions in Thailand.
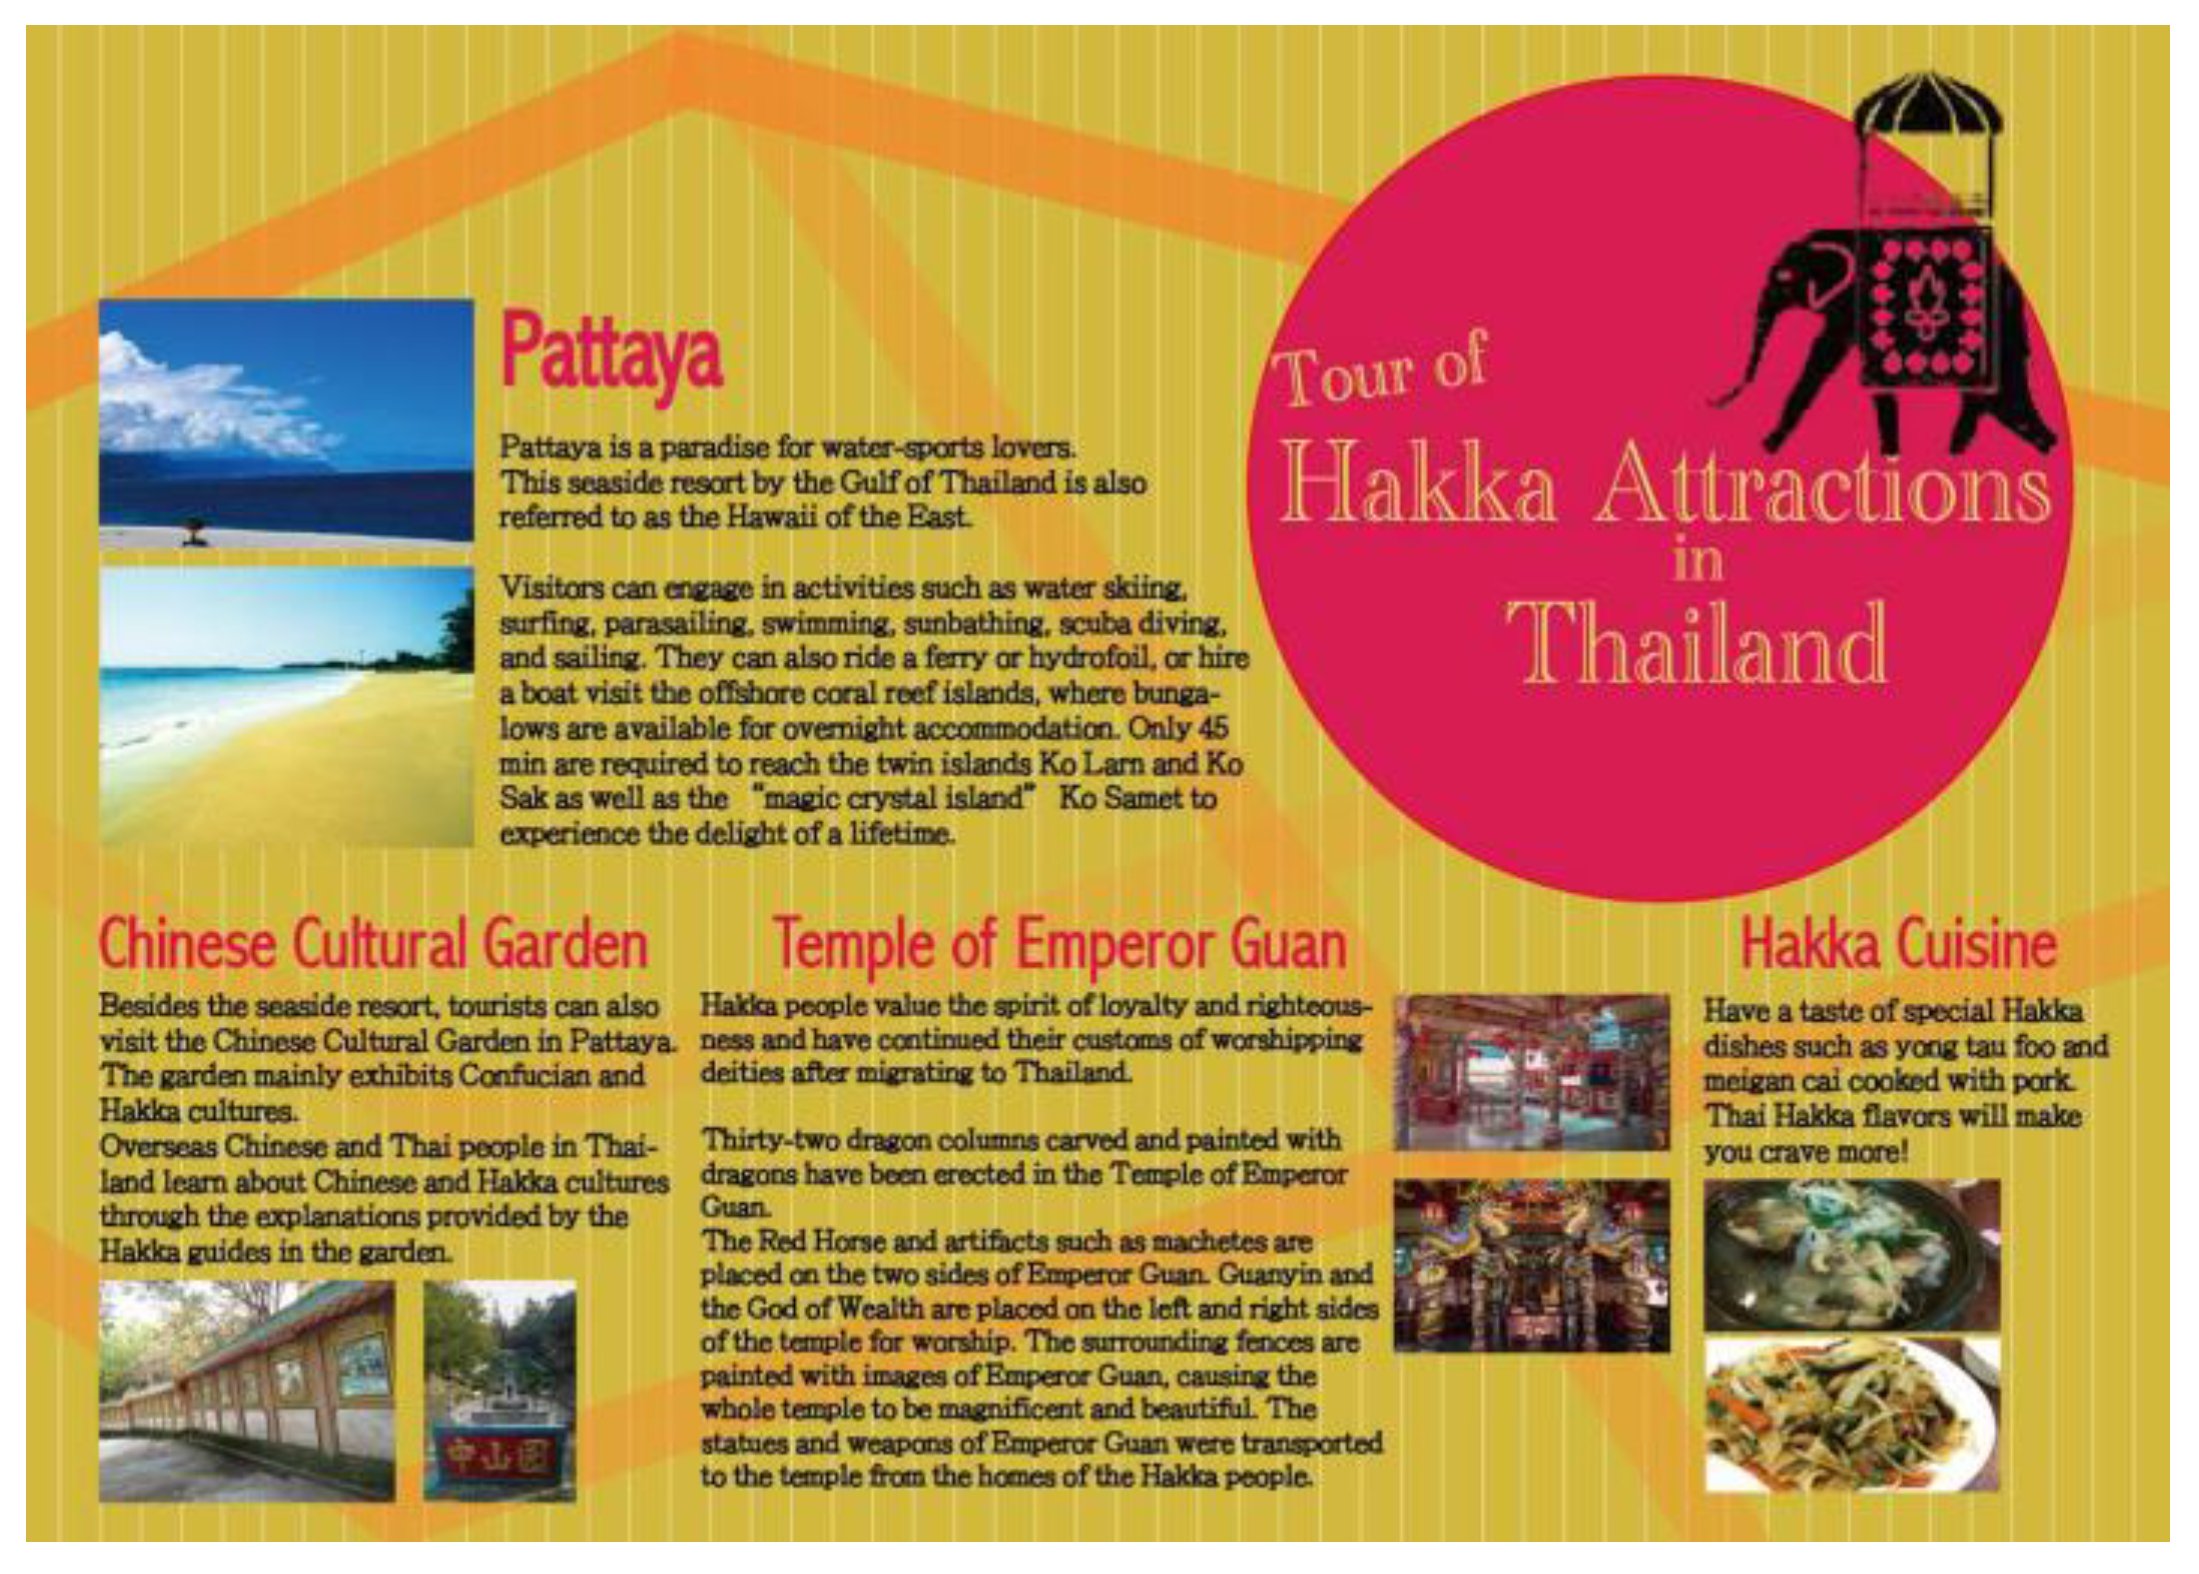
Figure 3.
AR guide service.

Figure 4.
Augmented reality (AR) self-recording service.
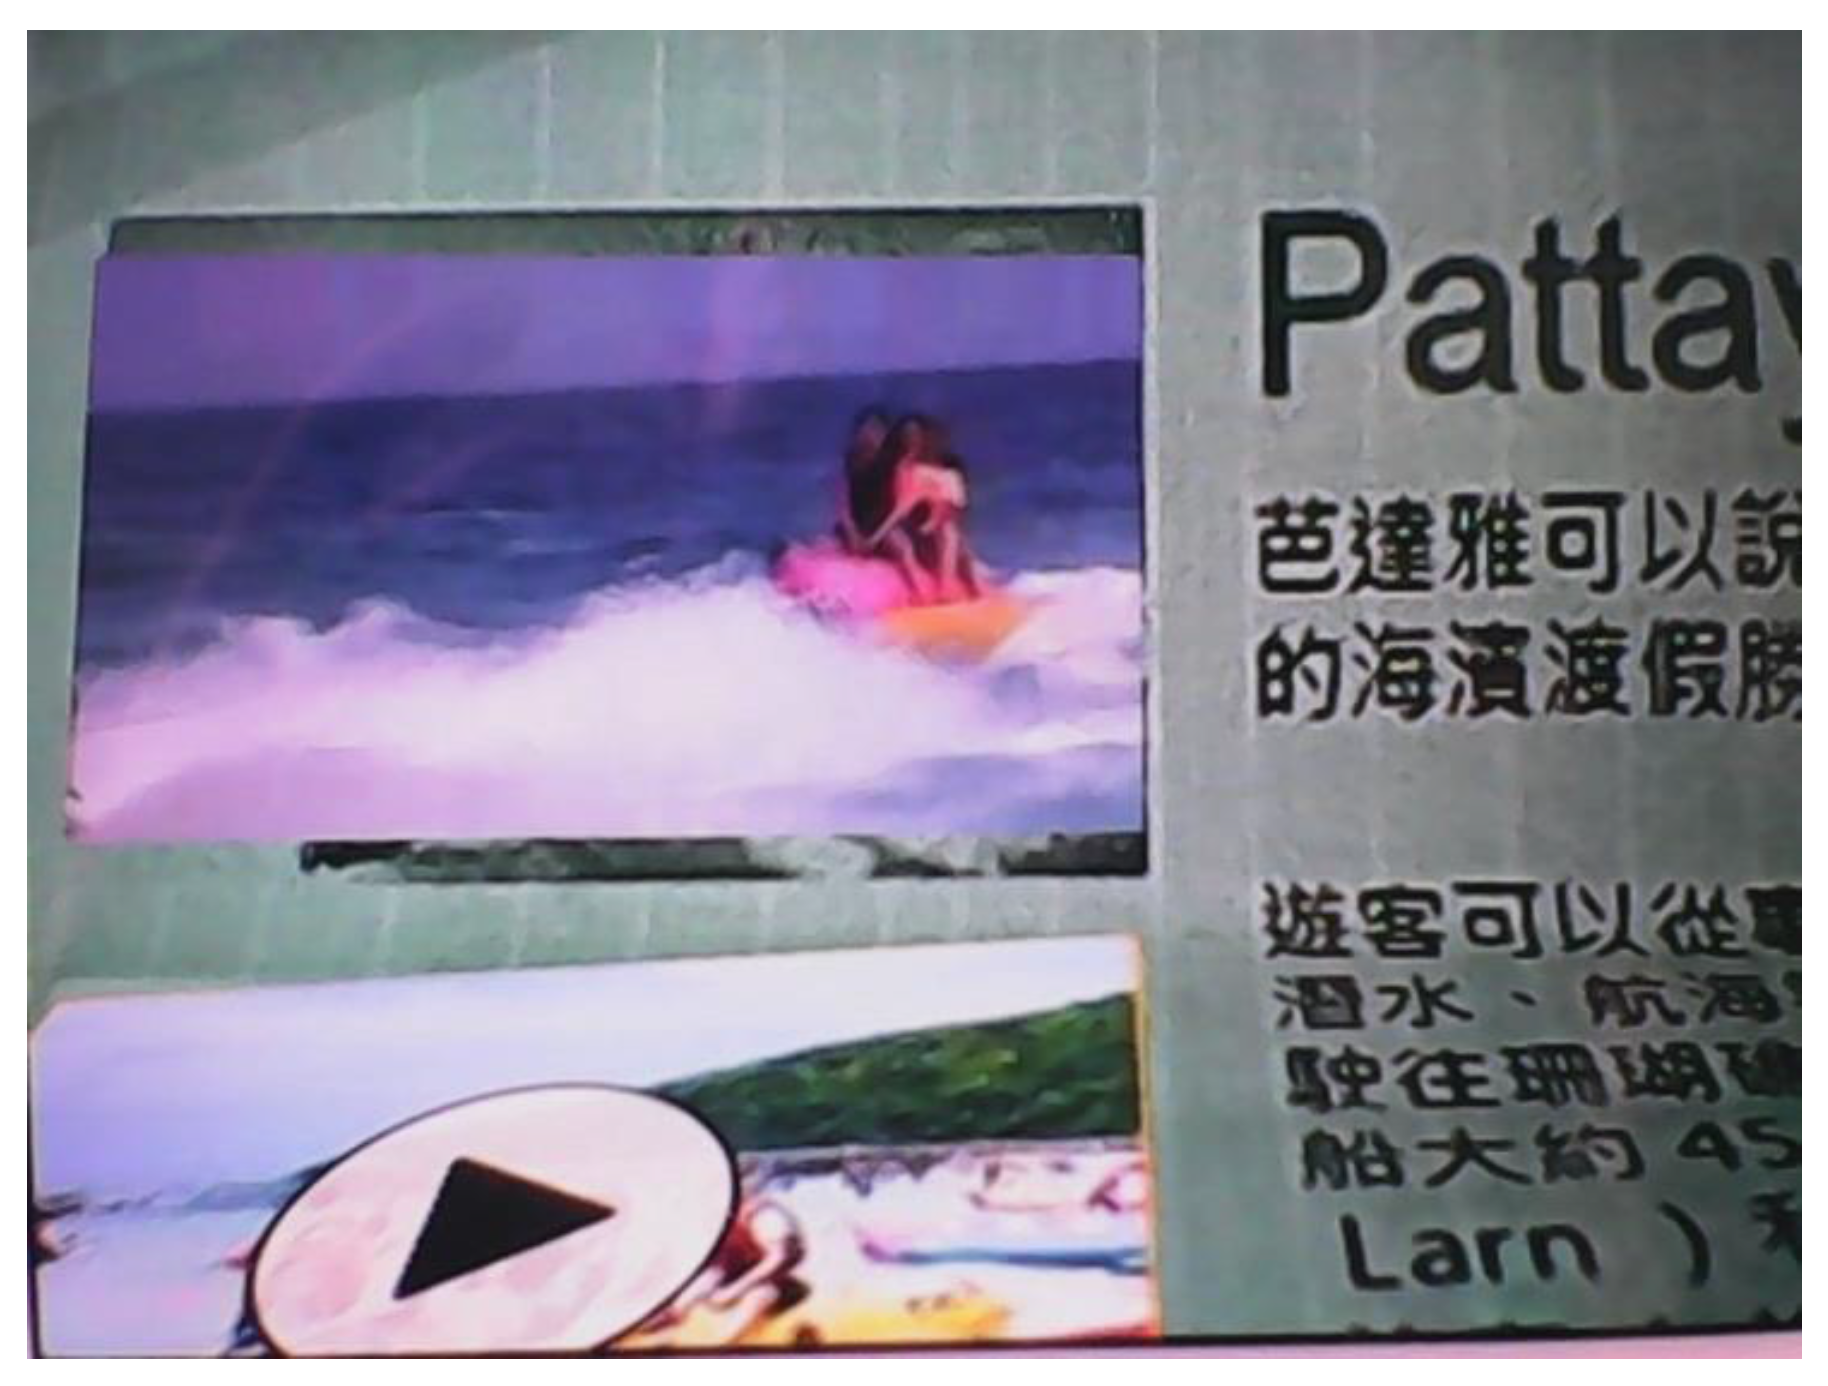
Figure 5.
The proposed random neural networks (RNNs).

Figure 6.
The process of query-answering service (QAS).
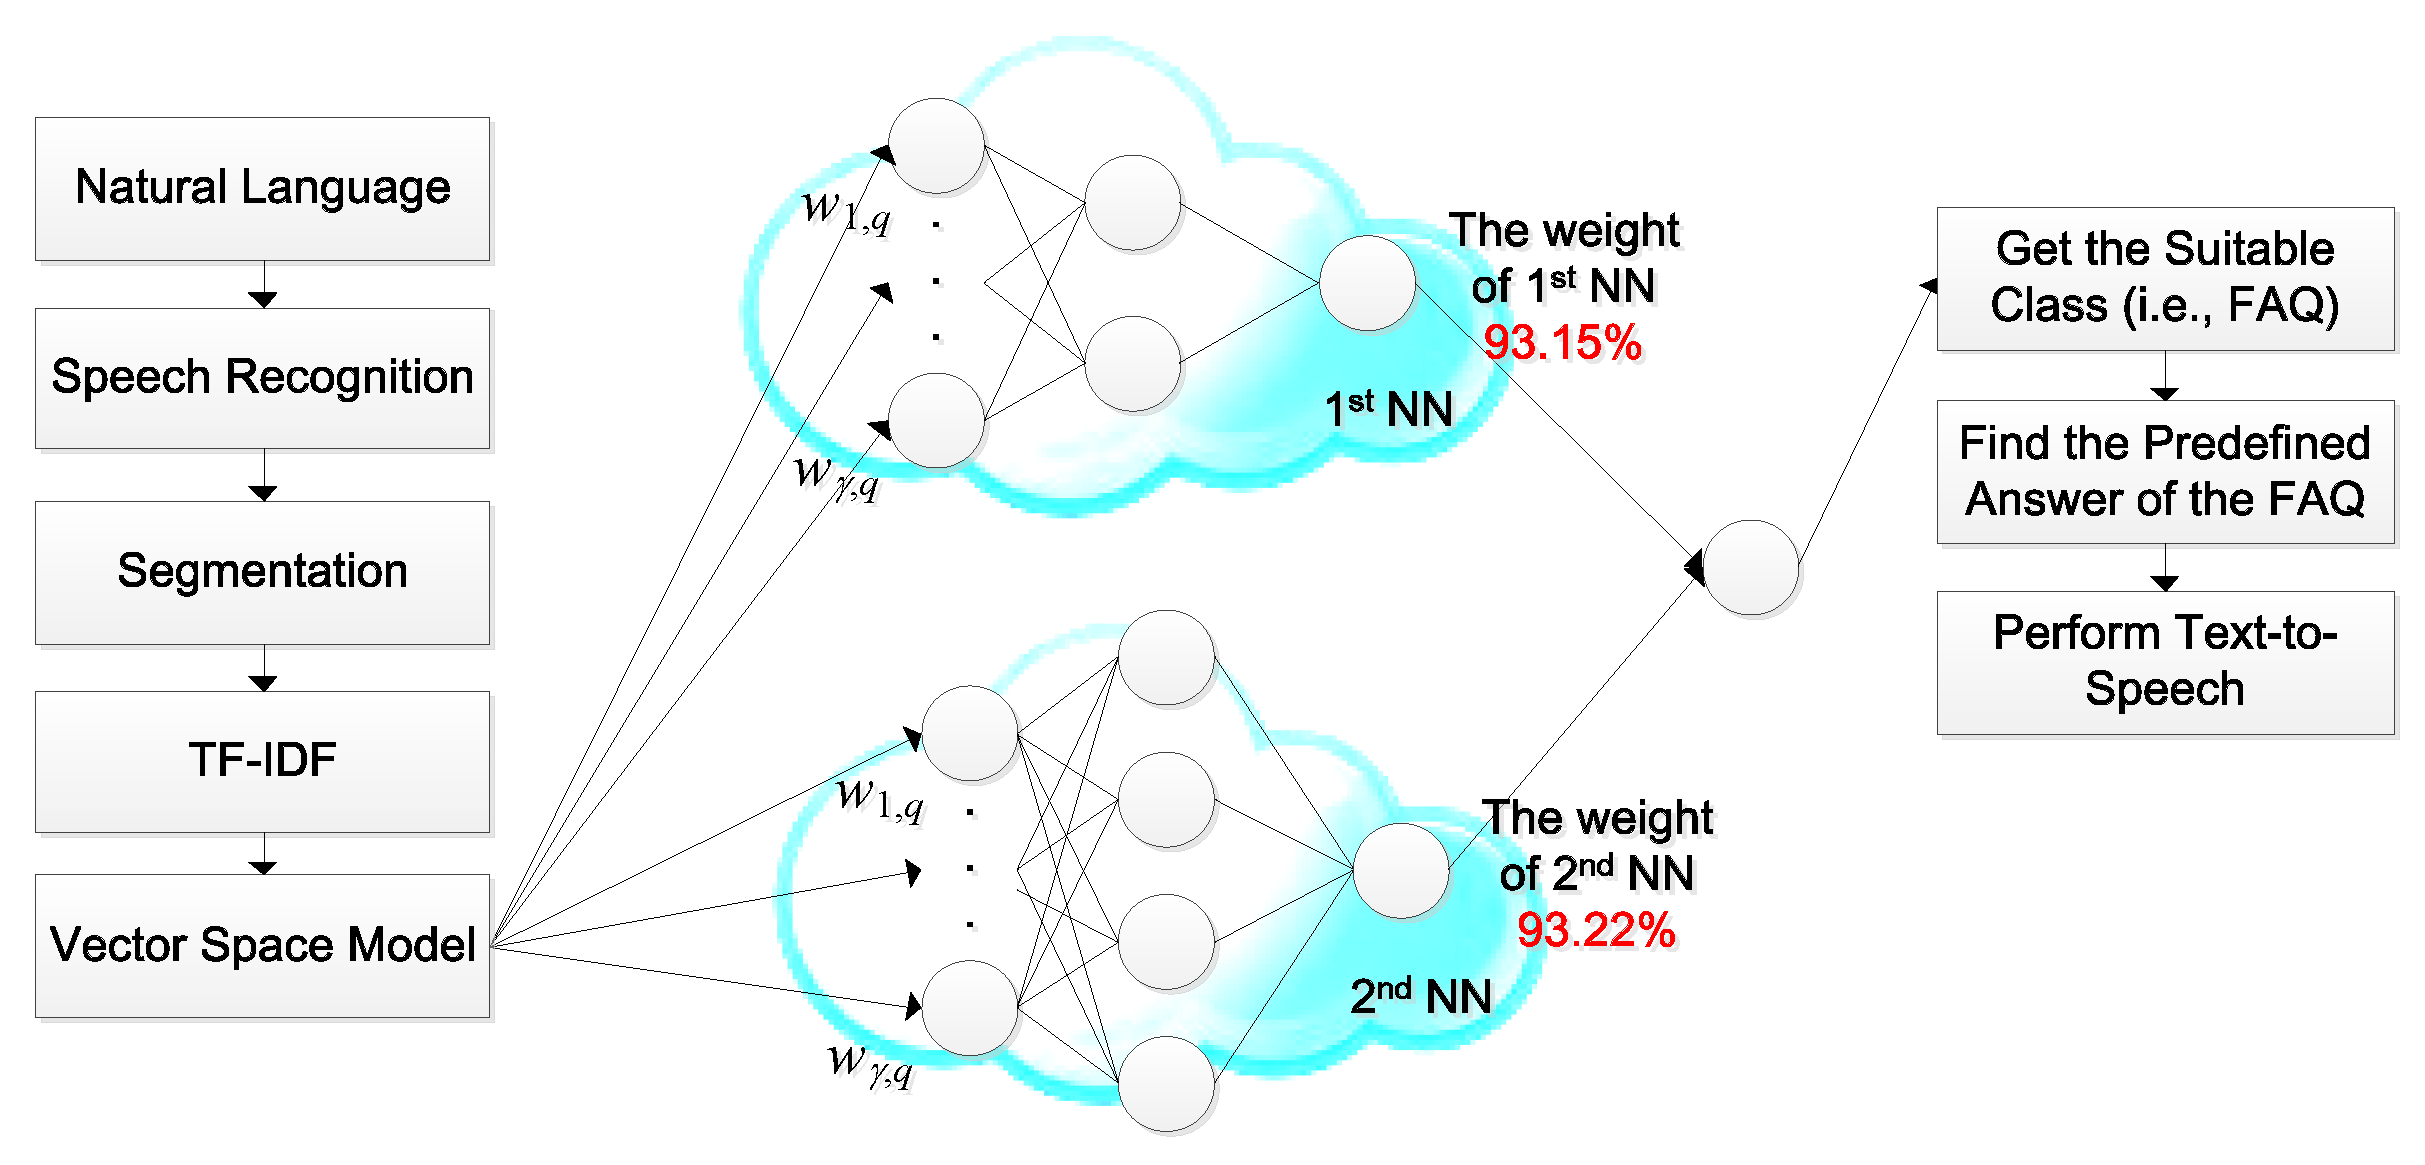
Figure 7.
Research framework.
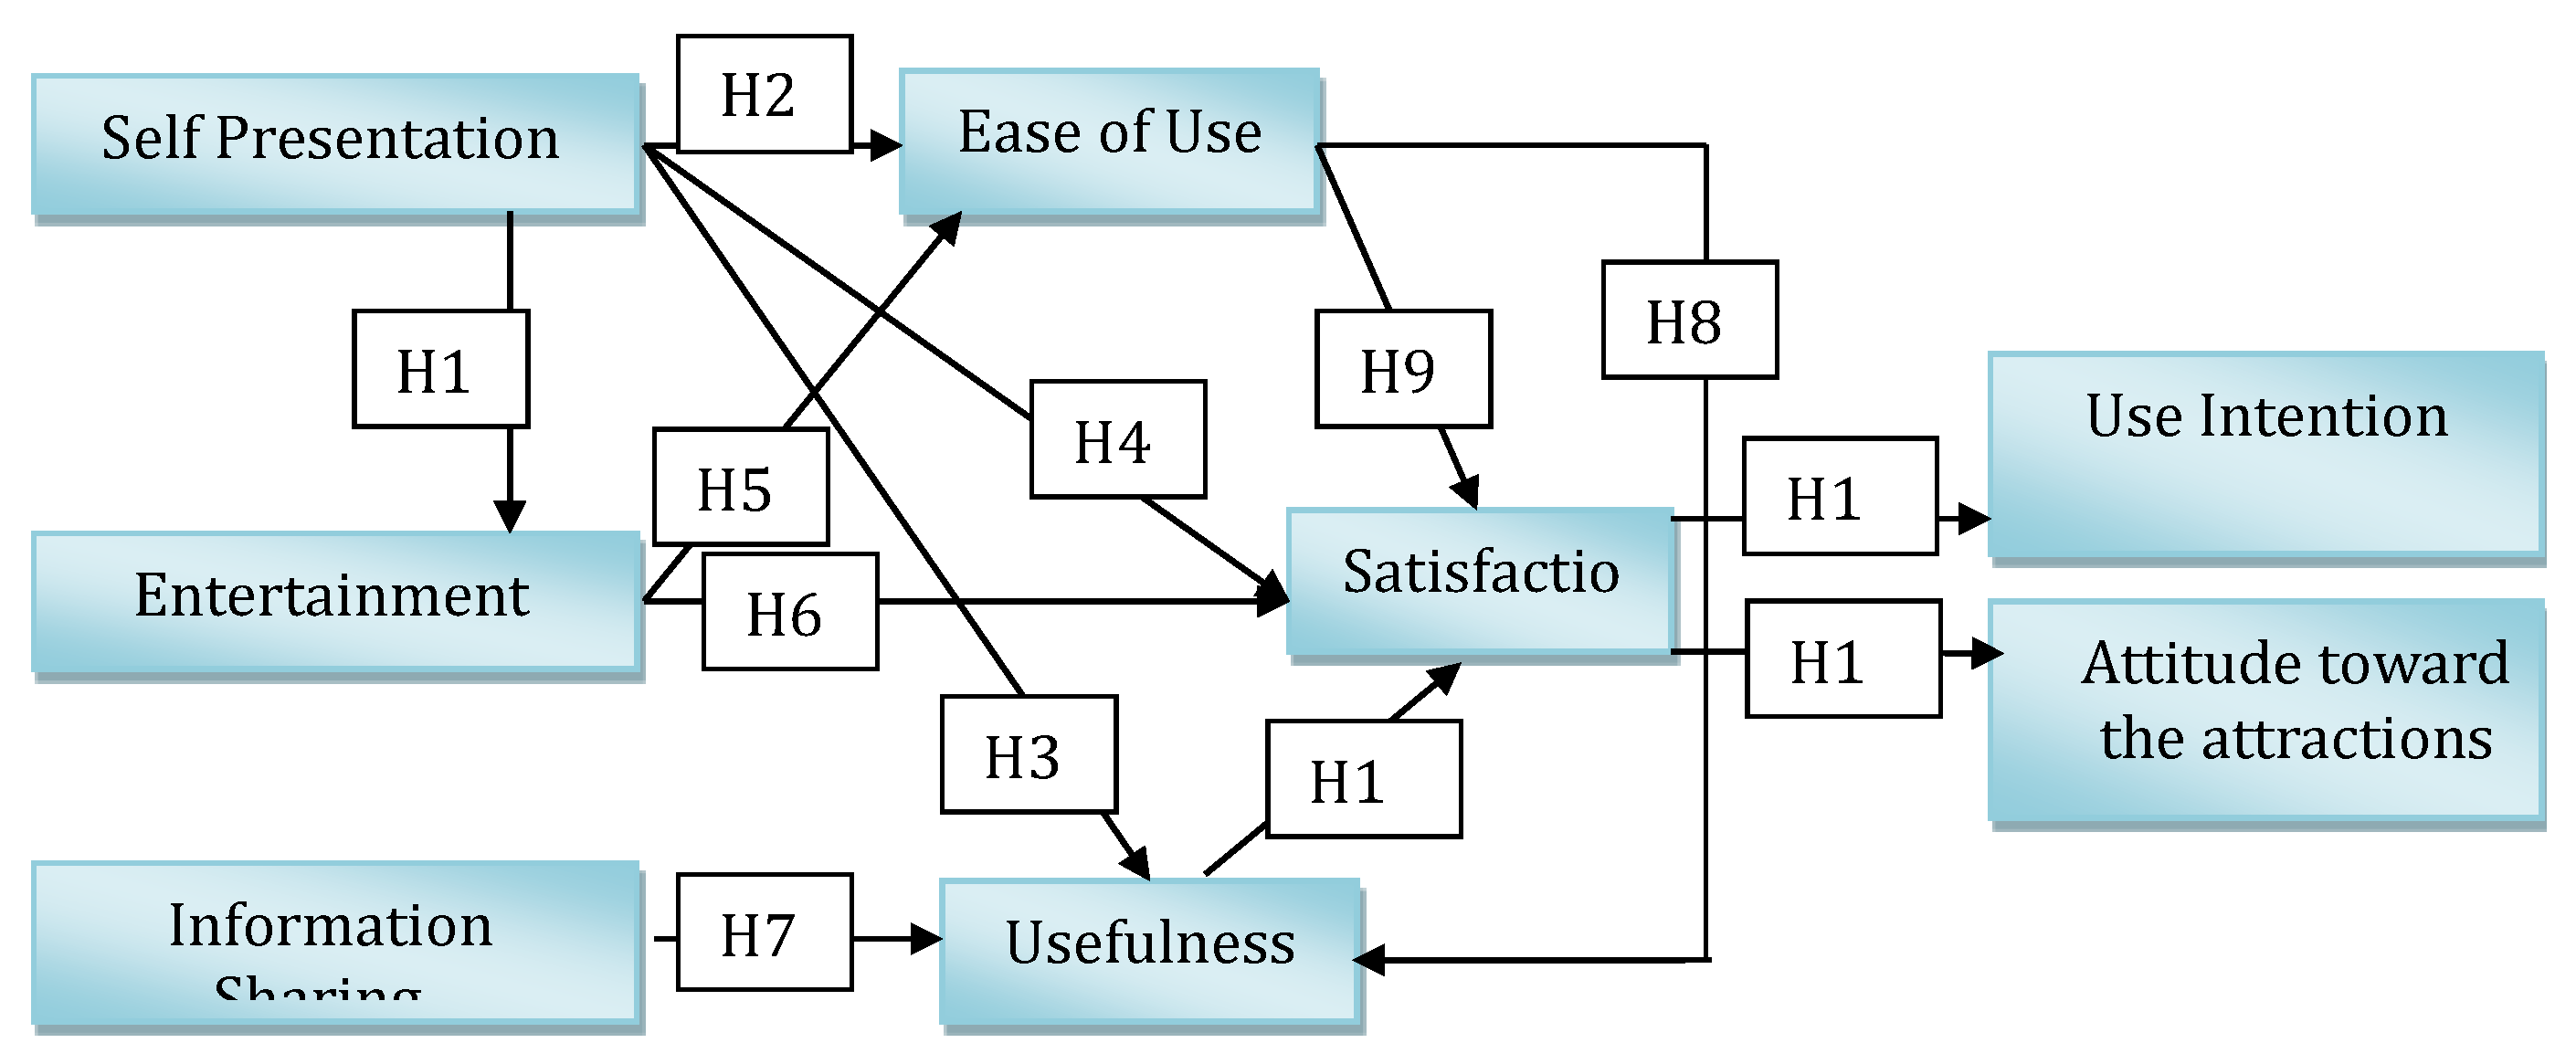
Figure 8.
Linear structural relations model and unstandardized coefficients.


Table 1.
The ratio of each dataset in this study.
| The Definition of Dataset | The Ratio of Dataset to Total Data in the Historical Database |
|---|---|
| Total data in training stage (Stage 1) (i.e., the parameter dTR) | a% |
| Training dataset in training stage (Stage 1) for the i-th NN model (i.e., the parameter dTRTR,i) | r% × a% |
| Testing dataset in training stage (Stage 1) for the i-th NN model (i.e., the parameter dTETR,i) | (100% − r%) × a% |
| Testing dataset in testing stage (Stage 2) (i.e., the parameter dTE) | 100% − a% |
| Runtime dataset in runtime stage (Stage 2) (i.e., the parameter dRT) | Runtime |
Table 2.
Question classes in the proposed query-answering server.
| Class ID | Question in Chinese | Question in English |
|---|---|---|
| 1 | 請問客家人的由來與分佈? | What are the origin and the population distribution of Hakka? |
| 2 | 海外客家人分布在那些國家地區呢? | Where do Hakkas reside around the world? |
| 3 | 客家人名稱是如何來的呢? | What are the origins of the word “Hakka”? |
| 6 | 客家人為什麼遷徙到泰國? | Why did Hakkas migrate to Thailand? |
| 7 | 泰國有多少客家人? | How many Hakkas are there in Thailand? |
| 8 | 什麼是半山客? | What is the meaning of “Half-Hakka?” |
| 9 | 泰國客家人在泰國的現況如何? | How are the Hakka doing in Thailand? |
| 10 | 泰國客家人如何在泰國奮鬥? | How do the Hakkas earn a living in Thailand? |
| 11 | 何謂中華文化園? | What is the Garden of Chinese Culture? |
| 12 | 中華文化園第一個景點有何特色? | What are the special characteristics of the first attraction in the Garden of Chinese Culture? |
| 13 | 中華文化園第二個景點有何特色? | What are the special characteristics of the second attraction in the Garden of Chinese Culture? |
| 14 | 中華文化園第三個景點介紹有何特色? | What are the special characteristics of the third attraction in the Garden of Chinese Culture? |
| 15 | 中華文化園第四個景點介紹有何特色? | What are the special characteristics of the fourth attraction in the Garden of Chinese Culture? |
| 16 | 中華文化文創辦人是誰呢? | Who founded the Garden of Chinese Culture? |
| 17 | 泰國客家總會在哪呢? | Where is The Hakka Association of Thailand located? |
| 18 | 泰國客家總會成員來自何方呢? | Where do the members of The Hakka Association of Thailand come from? |
| 19 | 泰國客家總會的客家資產有哪些? | What Hakka properties do The Hakka Association of Thailand possess? |
| 20 | 客家總會在客家文化推廣的活動有哪些? | What activities did The Hakka Association of Thailand organize to promote Hakka culture? |
| 21 | 泰國客家婦女聯合會成立的目的為何? | What is the purpose of founding the Hakka Women's Association in Thailand? |
| 22 | 泰國關帝廟的特色為何呢? | What are the special characteristics of the Guan Yu Shrine in Thailand? |
| 23 | 客家人在泰國發展什麼樣出的信仰? | What faiths do the Hakka in Thailand practice? |
| 24 | 泰國如何推廣中華文化教育? | How does Thailand promote the education of Chinese culture? |
| 25 | 泰國中華文化學校的特色為何? | What characteristics do Thai-Chinese Culture Schools have? |
| 26 | 泰國中華文化師資來源為何? | Where do the teachers in Thai-Chinese Culture Schools come from? |
| 27 | 泰國客家文化的推廣有哪些活動? | What activities did Thailand hold to promote Hakka culture? |
| 28 | 泰國相關的中華文化客家圖書館有哪些藏書呢? | What kinds of books do the Chinese and Hakka cultural libraries hold? |
| 29 | 客家人在泰國如何推廣泰國當地客家文化的觀光景點以融合當地文化與傳承客家文化? | How do Hakka in Thailand promote local Hakka tourist attractions to integrate with the local culture and sustain the Hakka cultural heritage? |
| 30 | 泰國客家人勉勵自己的信念為何? | What faiths do the Hakka in Thailand practice for inspiration? |
Table 3.
Classification accuracy of each method.
| Method | Accuracy |
|---|---|
| Rule-based reasoning | 59.19% |
| k-nearest neighbors | 93.47% |
| Back-propagation neural network (“293-2-30”) | 93.15% |
| Back-propagation neural network (“293-4-30”) | 93.22% |
| Random neural networks (BPNN “293-2-30” and BPNN “293-4-30”) | 99.51% |
Table 4.
Confirmatory factor analysis (CFA) results.
| Construct | Indicator | Standardized Factor Loadings | Composite Reliability | AVE |
|---|---|---|---|---|
| Self Presentation | Sel1 | 0.823 | 0.89 | 0.73 |
| Sel2 | 0.989 | |||
| Sel3 | 0.427 | |||
| Entertainment | Ent1 | 0.86 | 0.94 | 0.80 |
| Ent2 | 0.90 | |||
| Ent3 | 0.93 | |||
| Ent4 | 0.89 | |||
| Information Sharing | Shar1 | 0.91 | 0.93 | 0.80 |
| Shar2 | 0.92 | |||
| Shar3 | 0.86 | |||
| Perceived Usefulness | Pu1 | 0.87 | 0.88 | 0.72 |
| Pu2 | 0.89 | |||
| Pu3 | 0.76 | |||
| Perceived Ease of Use | Eas1 | 0.88 | 0.93 | 0.76 |
| Eas2 | 0.86 | |||
| Eas3 | 0.91 | |||
| Eas4 | 0.86 | |||
| Satisfaction | Sat1 | 0.81 | 0.89 | 0.73 |
| Sat2 | 0.94 | |||
| Sat3 | 0.81 | |||
| Attitude | At1 | 0.85 | 0.92 | 0.80 |
| At2 | 0.90 | |||
| At3 | 0.93 | |||
| Intention | Int1 | 0.89 | 0.92 | 0.80 |
| Int2 | 0.91 | |||
| Int3 | 0.89 |
Table 5.
Proposed structural model estimation results (linear structural relation analysis).
| Hypotheses | Unstandardized Coefficients | Standardized Coefficients | Standard Error | p |
|---|---|---|---|---|
| H1: self → entertain | 0.579 | 0.529 | 0.054 | *** |
| H2: self → ease | 0.286 | 0.280 | 0.051 | *** |
| H3: self → useful | 0.248 | 0.304 | 0.045 | *** |
| H4: self → satisfaction | 0.529 | 0.669 | 0.045 | *** |
| H5: entertain → ease | 0.466 | 0.497 | 0.047 | *** |
| H6: entertain → satisfaction | −0.015 | −0.021 | 0.032 | 0.634 |
| H7: sharing → useful | 0.369 | 0.519 | 0.036 | *** |
| H8: ease → useful | 0.309 | 0.388 | 0.039 | *** |
| H9: ease → satisfaction | 0.002 | 0.002 | 0.038 | 0.962 |
| H10: useful → satisfaction | 0.358 | 0.369 | 0.052 | *** |
| H11: satisfaction → intention | 1.031 | 0.780 | 0.059 | *** |
| H12: satisfaction → attitude | 0.442 | 0.347 | 0.060 | *** |
Note: *** p < 0.001.
© 2017 by the authors. Licensee MDPI, Basel, Switzerland. This article is an open access article distributed under the terms and conditions of the Creative Commons Attribution (CC BY) license (http://creativecommons.org/licenses/by/4.0/).
Share and Cite
MDPI and ACS Style
Lin, H.-F.; Chen, C.-H. Combining the Technology Acceptance Model and Uses and Gratifications Theory to examine the usage behavior of an Augmented Reality Tour-sharing Application. Symmetry 2017, 9, 113. https://doi.org/10.3390/sym9070113
AMA Style
Lin H-F, Chen C-H. Combining the Technology Acceptance Model and Uses and Gratifications Theory to examine the usage behavior of an Augmented Reality Tour-sharing Application. Symmetry. 2017; 9(7):113. https://doi.org/10.3390/sym9070113
Chicago/Turabian StyleLin, Hui-Fei, and Chi-Hua Chen. 2017. "Combining the Technology Acceptance Model and Uses and Gratifications Theory to examine the usage behavior of an Augmented Reality Tour-sharing Application" Symmetry 9, no. 7: 113. https://doi.org/10.3390/sym9070113
Note that from the first issue of 2016, this journal uses article numbers instead of page numbers. See further details here.