A Case Study on Iteratively Assessing and Enhancing Wearable User Interface Prototypes
by
 , and
, and
Hyoseok Yoon
1,2 ,
,
Se-Ho Park
1,2,
Kyung-Taek Lee
1,2,
Jung Wook Park
3,4,
Anind K. Dey
2,3 and
SeungJun Kim
3,5,* 
1
Contents Convergence Research Center, Korea Electronics Technology Institute, Seoul 03924, Korea
2
KETI-CMU Research Laboratory, Carnegie Mellon University, Pittsburgh, PA 15213, USA
3
Human-Computer Interaction Institute, School of Computer Science, Carnegie Mellon University, Pittsburgh, PA 15213, USA
4
Georgia Institute of Technology, Atlanta, GA 30308, USA
5
Institute of Integrated Technology, School of Integrated Technology, Gwangju Institute of Science and Technology, Gwangju 61005, Korea
*
Author to whom correspondence should be addressed.
Symmetry 2017, 9(7), 114; https://doi.org/10.3390/sym9070114
Submission received: 18 May 2017
/
Revised: 4 July 2017
/
Accepted: 6 July 2017
/
Published: 10 July 2017
(This article belongs to the Special Issue Emerging Approaches and Advances in Big Data)
Abstract
:Wearable devices are being explored and investigated as a promising computing platform as well as a source of personal big data for the post smartphone era. To deal with a series of rapidly developed wearable prototypes, a well-structured strategy is required to assess the prototypes at various development stages. In this paper, we first design and develop variants of advanced wearable user interface prototypes, including joystick-embedded, potentiometer-embedded, motion-gesture and contactless infrared user interfaces for rapidly assessing hands-on user experience of potential futuristic user interfaces. To achieve this goal systematically, we propose a conceptual test framework and present a case study of using the proposed framework in an iterative cyclic process to prototype, test, analyze, and refine the wearable user interface prototypes. We attempt to improve the usability of the user interface prototypes by integrating initial user feedback into the leading phase of the test framework. In the following phase of the test framework, we track signs of improvements through the overall results of usability assessments, task workload assessments and user experience evaluation of the prototypes. The presented comprehensive and in-depth case study demonstrates that the iterative approach employed by the test framework was effective in assessing and enhancing the prototypes, as well as gaining insights on potential applications and establishing practical guidelines for effective and usable wearable user interface development.
1. Introduction
Wearable devices such as smartwatches and smart glasses offer new forms of interaction on a compact but computationally equivalent platform. Wearable devices, coherently coupled with the Internet of Things, empower end-users to seamlessly connect and communicate with other users and devices on the go. As a computing platform, wearable devices also serve as a constantly connected and user-centered source of personal big data, generating voluminous raw data from various wearable and on-device sensors, as well as high-level interaction events. Most commonly, multiple embedded sensors contribute to capturing and identifying instantaneous user interaction in-situ through a presented user interface (UI). This unique spatio-temporal bond between users and their wearable devices enables abundant applications for self-quantifying [1,2], self-tracking [3], self-care [4], activity recognition [5], peripheral interaction monitoring [6], healthcare [7] and health informatics [8].
With rapid advances in wearable sensors and the wide and growing availability of commercial wearable products, an increased number of researchers are experimenting with novel interaction techniques to discover and explore future potentials for such wearable devices. When developing a novel wearable UI, researchers and developers have to build a wearable system that can internally sense, process and analyze multiple sensor data. At the same time, a series of user interactions occurs external to the system. While both internal and external treatments to the system are essential for improving an end-product, integrating the latter significantly polishes the user experience. However, these external user interactions are often not captured or studied, due to the additional monitoring or observation required. Thus, it is still technically difficult and time-consuming for researchers to identify the exact factors that affect performance of the novel wearable device and quality of the user experience. When such factors and attributes are discovered in advance, more specific goals can be set to accelerate the development and more objectively measure interim progress. By closely assessing the personal big data of wearable devices and monitoring user interaction states, more naturalistic user interaction can be elicited and incrementally integrated into novel wearable UIs.
In this paper, in an effort to deal with the aforementioned challenge, we present a case study involving 44 participants to assess and enhance multiple wearable UI prototypes through a proposed iterative test framework. We start with four initial versions of advanced-concept wearable UI prototypes and demonstrate improvements in overall usability based on a cyclic process of prototyping, testing, analyzing and refining the prototypes. Our contributions are as follows:
- Advanced wearable UI prototypes—We design and introduce four wearable UI prototypes including a joystick-embedded UI, a potentiometer-embedded UI, a motion-gesture UI and an infrared (IR) based contactless UI to cover both contact and contactless modalities (Section 3).
- Conceptual test framework—We present a conceptual framework for testing and evaluating futuristic wearable devices. The presented test framework is designed to iteratively test, evaluate, and improve the usability of target prototypes (Section 4).
- Design implications and recommendations—We identify strengths and weaknesses of each prototype to suggest design implications for a more usable UI and recommend user-interaction methods for future work (Section 5.3).
2. Related Work
Current commercially available wearable UIs offer only a limited form of interaction. The most popular wearable device is a wrist-worn smartwatch that uses touch as the primary input modality while only a handful of devices support distinctive interaction alternatives. For commercially available wrist worn wearables, Motti and Caine investigated interaction design challenges [9] and identified problems of ten popular products in general by analyzing online user comments and reviews [10]. Since employing a single interaction modality limits input expressivity of the device, several novel attempts have been made to combine multiple interaction modalities in order to make UIs more advanced, expressive and useful for complicated tasks such as text entry on wearables.
Contact-based interaction is the standard and preferred modality for smartphones, tablets, touchscreen PCs and information kiosks alike. It refers to a family of interaction techniques operated by a user making physical contact with the body or peripherals of the device. Examples include, using a touchscreen, detecting user contact via sensors on the device, manipulating a mechanical peripheral, and making user inputs on a wristband. This type of interaction is effective and useful when there is enough interaction space for user contact. However, contact-based interaction for wearables is limited and degraded by wearables’ smaller physical form. For example, two known usability problems are Small Display and the Fat Finger [11] (abbreviated as SDFF hereafter) during interaction. These problems mean that the user cannot accurately distinguish and activate the intended user input on the touchscreen. An obvious workaround to these problems is to enlarge the size of the touchscreen, but this reduces the comfort and aesthetic appeal of the device.
Current approaches to improving contact-based interaction for wearable devices can be categorized into two directions: interaction enrichment by sensor augmentation and intelligent use of the touchscreen. The first direction explores use of multiple sensors or repurposing of existing sensors for sensor-based interaction. The second direction investigates alternative ways to maximize the use of a small touchscreen through customized layouts and interaction patterns.
An alternative to these options, however, is to employ a different type of interaction altogether that does not depend on direct physical contact with the device. Such interaction methods are referred as contactless interaction. Typical examples of contactless interaction include voice-based UI and gesture-based UI.
In this section, we review and categorize recent interaction methods for wearables into contact-based approaches as shown in Figure 1a that use direct and physical contact with the device or contactless approaches as shown in Figure 1b that capture user gestures with various sensors for triggering an interaction event.
2.1. Contact-Based Interaction
Consumer wearable devices such as Android Wear smartwatches and the Apple Watch use touchscreen UIs similar to that of a smartphone. The touchscreen is used for both input and output on the smartwatch. Whenever a user makes contact with the touchscreen, the SDFF issues can cause considerable inconvenience. Therefore, to use an inherently small touchscreen more efficiently, a number of touchscreen based gestures and soft keyboards have been developed. Furthermore, to expand the interaction area beyond the small touchscreen, other parts of a wearable device have been made touch-sensitive as well.
Touchscreen-based Gestures. Different sets of touchscreen-based gestures have been explored by varying touch areas and contact duration. For example, Oakley et al. developed “beats”, which are gestures that use simultaneous and rapid sequential taps to facilitate eyes-free interaction and mitigate the SDFF problem [12]. Lafreniere et al. proposed multi-touch-based WristTap and TwoTap which are based on a combination of sequential taps, to support fast command selection on touchscreen watches [13]. Yeo et al. developed WatchMI [14], which uses both a touchscreen and a built-in Inertial Measurement Unit of a smartwatch for sensing omni-directional pressure touch, bi-directional twist and omni-directional panning.
Touchscreen-Based Soft Keyboards. Most soft keyboard UIs attempt to manage the limitation of a small screen through coarse-to-fine approaches where the text entry task is spread across multiple, yet less space-occupying interaction steps. Hong et al. developed SplitBoard [15], which provides a soft QWERTY keyboard layout divided into left and right halves. Chen et al. developed Swipeboard [16], which uses a series of two swipes to first select a region and then locate a character in the selected region for text entry. Oney et al. presented Zoomboard [17], which uses iterative zooming to enlarge a QWERTY layout to a comfortable size. Leiva et al. demonstrated a callout-based keyboard to separately display a prepared character in a non-occluded location, and ZShift to zoom in a selection area and provide visual feedback on a soft key being touched [18].
Alternatively, Xia et al. take a different approach to mitigate the SDFF problem. Instead of modifying the soft keyboard itself, they introduced a finger-mounted fine-tip stylus, called the NanoStylus [19], to minimize the size of the tip considerably.
Other Contact-Based Parts. Other parts of wearable devices, such as wristbands and bezels have also been considered as alternative UIs where user interaction is enriched by sensor augmentation. Funk et al. developed a soft potentiometer-embedded and touch-sensitive wristband where the user can enter text by using the wristband as a keypad [20]. Similarly, Ahn et al. proposed BandSense for enabling multitouch interaction on a wristband [21], while Yoon et al. presented the N-ary UI to increase input expressivity by presenting N input subareas with different exerted force levels [22]. Perrault et al. developed WatchIt [23] which integrates potentiometers on a wristband in order to extend the interaction space. Yu et al. also explored a concept for embedding multiple force sensors on a wristband to enter passwords on a smartwatch [24]. Grossman et al. modified Swipeboard [16] for use on a smart eyewear platform. This modified version, called SwipzeZone, uses a side touchpad for entering text [25]. Kubo et al. enriched the input vocabulary of a smartwatch with B2B-Swipe [26], which detects a swipe gesture from a start bezel, across the touchscreen, to an end bezel. Oakley and Lee developed the EdgeTouch prototype [27] where capacitive sensors are embedded on the edges of the prototype to sense user interaction. Darbar et al. developed PressTact [28] to enable side pressure-based input by incorporating two pressure sensors on the left and right sides.
2.2. Contactless Interaction
In recent studies, many wearable UI prototypes have widely employed contactless interaction in the form of gesture recognition. For good summaries of possible gestures, see Shimon et al.’s elicitation study, which explores non-touchscreen gestures with both hands for various smartwatch tasks [29], or Kerber et al.’s elicitation study, which explores same-side interaction or one-handed gestures for smartwatch tasks [30]. In general, these gesture recognition UIs typically use sensors to capture user motions and then recognize patterns in the sensed data with various machine learning classifiers. Additionally, several studies have explored a user’s skin as a potential gestural UI.
Gestures Using Both Hands. Paudyal et al. proposed SCEPTRE [31], which can classify the gestures of a user wearing wrist-worn devices using accelerometer, gyroscope and electromyography data. Laput et al. developed ViBand [32] where they used a custom smartwatch kernel to increase the sampling rate of an accelerometer for recognizing high-fidelity bio-acoustic data for both gestures and objects recognition. Lee et al. developed AirTouch [33], where IR proximity sensors are used to capture a user’s in-air hand gestures above the wrist. Withana et al. have presented zSense [34] prototypes using IR sensors and emitters to enable shallow depth gesture recognition on smart wearables.
One-Handed and Same-Sided Gestures. Gong et al. developed the WristWhirl prototype [35], which consists of an array of proximity sensors on the watchband for recognizing one-handed gestures made with a user’s wrist. Guo and Paek explored AnglePoint and ObjectPoint interactions which are tilt-based, no-touch and wrist-only smartwatch interactions that uses gravity sensors [36]. Zhang and Harrison developed a wearable prototype Tomo [37] that uses Electrical Impedance Tomography to monitor and classify gestures. Hong et al. developed Serendipity [38], which uses the integrated motion sensors of an off-the-shelf smartwatch to distinguish fine-motor gestures. Paudyal et al. developed the DyFAV algorithm [39] for fingerspelling recognition with the Myo armband.
Skin as Gestural Interface. Zhang et al. presented TapSkin [40], which can recognize distinct tap gestures made on the skin using the built-in inertial sensors and microphone of a commercial smartwatch. Laput et al. presented SkinButtons [41], which uses a tiny projector integrated into the smartwatch to display icons on a user’s skin and captures touch events with IR proximity sensing. Ogata and Imai developed SkinWatch [42], where multiple IR photo-reflective distance sensors are used to sense and recognize skin deformations as gestural inputs.
3. Design and Development of Advanced Wearable UI Prototypes
We prototyped four representative wearable UIs adopting a set of design recommendation from previous work [43] as well as reflecting our previous experience and literature review on Section 2. We have explored and developed several contact-based wearable prototypes using a built-in light sensor [44], an external joystick [45] and force sensitive linear potentiometer [22]. We have also explored contactless interaction using an accelerometer and gyroscope sensor on a commercial smartwatch and an IR-based gesture recognizer. Since we cannot exhaustively cover various approaches (i.e., reviewed in Section 2 and depicted in Figure 1), we designed and developed four advanced UI prototypes that include three contact-based UIs and one contactless UI to cover most recent and highly referenced approaches presented at the prestigious HCI conferences (i.e., CHI, UIST, IUI). The proposed prototypes were designed not to rely on a touch-based screen, thereby reducing the risk of the SDFF issues for end-users. Instead, we employed new contact-based and contactless input modalities for the proposed prototypes, as their usability has not been rigorously tested in traditional designs of wearable devices. We describe the four advanced wearable UI prototypes we developed for the case study in more detail in the following sections.
3.1. Joystick-Embedded UI
The joystick-embedded UI is a contact-based UI that integrates a joystick module either as an external secondary input interface or by embedding it under a display as in [46]. With this type of input interface, a user can generate four directional inputs (i.e., up, down, right and left) and a click. Figure 2 shows the different versions of joystick-embedded UI prototypes we developed.
Combining four directional inputs and a click (as well as a non-click state (NC)), various user-interaction events can be created and used in different applications as shown in Table 1. With four basic directional inputs, a ’click’ is interpreted as either a long click or a short click by timing the duration of the click. Additionally, a repeated ’down’ input is used to trigger different levels of an undo or delete function.
The first version of our joystick-embedded UI prototype was built on an Arduino UNO board with a joystick and Bluetooth module. These separate modules were connected with an Android Wear smartwatch via Bluetooth SPP (Serial Port Profile). Through the iterative process, we developed an integrated and improved prototype comprised of a TinyDuino processor, a joystick, a 9-axis inertial measurement unit, Bluetooth, a 1.5 inch OLED, and USB debugging modules. The latest version is a standalone watch-like device to wear on one’s wrist.
3.2. Potentiometer-Embedded UI
We have previously explored a concept for a potentiometer-based UI [22]. Approaches that use pressure sensors [21,24] and potentiometers [20,23,28] have shown potential in wearable UIs. In this prototype, we use a similar approach where user inputs on the potentiometer are sensed in the form of position and/or force-level, which can be transferred through Bluetooth SPP.
This prototype is a contact-based UI, since a user can press on the force-sensitive linear potentiometer enclosed in the wristband to make an input. Physical contact with the potentiometer outputs the position of the contact point and the exerted force at that position. By varying contact positions and levels of user-exerted force, a wide range of input is possible even with a single force-sensitive linear potentiometer. Figure 3 shows the different versions of the potentiometer-embedded prototypes we developed.
The developed potentiometer-embedded UI provides configurable and expandable input expressivity based on a number of subareas and force levels. For example, when the UI prototype employs 10 subareas with only one force level, it can instantly input 10 unique inputs. Moreover, a sequence of detected positions can be used to trigger scroll up or down by comparing a former position and latter position (i.e., scroll up when the latter position is greater than the former position). In this prototype, a timer can be used to measure the duration of a press. An initial version of this prototype was developed on the EFM32 Wonder Gecko platform with a 10 cm force-sensing linear potentiometer by Interlink Electronics. For the latest version of the prototype, we integrated the potentiometer sensor into a bracelet-type accessory.
3.3. Motion-Gesture Based UI
The motion-gesture based UI uses built-in sensors such as an accelerometer and gyroscope, readily available in a commercial wearable device, as in [38]. This is unlike other sensor-augmented wearable UIs, which require additional sensors and hardware modification. Using this motion-gesture prototype, a user can gently tap on four sides of the device and make wrist gestures inward and outward. Since this UI prototype relies both on user contact (tap on four sides) and contactless gesture (flicking the wrist), the motion-gesture based UI is considered a hybrid contact-based/contactless UI. Figure 4 shows the developed motion-gesture based UI prototypes in action.
The motion-gesture UI supports four direction-oriented taps. The user can tap gently on the right edge of the display to input ’left’ direction-oriented input or tap on the left edge of the display to input ’right’ direction-oriented input. Similarly, a tap on the bottom of the display triggers ’up’ input and a tap on the top of the display triggers ’down’ input. Along with these four directional inputs, a user can rotate one’s wrist outward and toward the user. During the case study, a similar wrist-rotating gesture application programming interface (API) was introduced in the Android Wear API, and we also integrated these gestures into later versions of our motion-gesture UI prototype.
We used the accelerometer and gyroscope sensors on a commercial smartwatch (Sony Smart Watch 3) to develop the motion-gesture UI. In this prototype, as previously mentioned, a user can either tap on four sides of the watch face or rotate their wrist outward or inward. Internally, Google Android’s SensorManager and SensorEvent are used to sense changes in both sensors. For connecting with other Android devices such as a tablet, GoogleService is used to store and retrieve sensor data and user events.
3.4. IR-Based UI
The IR-based UI is a contactless UI prototype where a user wears a smartwatch-like device to make an input on the back of a user’s hand, similar to [40,41]. The concept is to provide either an invisible or visible projection menu on the back of a user’s hand where the user can make certain gestures. Our research partner, Celluon Inc., developed an IR-based hardware module used for this prototype. However, the projector module was not ready to be integrated at the time of this case study; therefore we added a physical keypad proxy for intended experiments. Figure 5 shows the developed contactless IR-based UI prototypes with a physically visualized keypad proxy.
In the IR-based UI, we designated an input area as a numerical keypad. Using this area on the back of a user’s hand, numbers from 0 to 9 and a few additional special keys can be entered by occluding the pre-specified area with the user’s finger. The IR-based UI detects the positions of a user’s finger on the back of the user’s hand. The IR detector module itself is very small (17 mm in height), responsive (5 Hz+) and supports a wide view for recognition (95 degree) that can be integrated into a compact product. With this prototype, a user can enter numbers or select menus without touching the device. Whenever the UI prototype detects positions, Bluetooth profiles (Human Interface Device or SPP) are used to send them to a paired Bluetooth device for enabling various applications.
4. A Case Study with UI Prototypes
In this section, we describe a complete walk-through of our case study with four UI prototypes. To illustrate our case study, specifics of our test framework, experiments, study design, UI/UX assessment, and usability principle evaluation are presented in the following subsections.
4.1. Test Framework
We designed a conceptual test framework as shown in Figure 6 aiming to iteratively test, evaluate, and improve the usability of novel wearable UI prototypes. We have previously investigated the limitations of UIs and user interaction in existing wearable devices through an online survey, based on experience sampling methods (ESM) (➊ in Figure 6); identified human factors and usability principles that affect user experience (UX) (➌ in Figure 6); and then presented a sample test application, based on the Android platform, for UI usability testing and UX evaluation [43]. Based on these previous results, we developed a set of three test applications. These applications allowed study participants to perform three interactive tasks: Text Entry Task, Scrolling Task and Swipe Task (➋ in Figure 6). The test applications were built on a touch-based screen and were used as baseline conditions in our main experiments (➎ and ➏ in Figure 6). Test applications are replicated on the developed UI prototypes (➍ in Figure 6, aforementioned in Section 3) to test the usability of the prototypes by using the replicated test applications in the main experiments (➎ and ➏ in Figure 6).
4.2. Experimental Section
The goal of the main experiment was to test, evaluate and then improve the usability of the proposed prototypes based on an iterative design process. The main experiment was comprised of two phases:
- In the first phase of the experiment (➎ in Figure 6), participants used the test applications to perform the series of interactive tasks with the given prototypes three times. Then we collected participant comments, refined the prototypes based on these usability test results and again had study participants test and evaluate the newer versions. This process was performed for each experiment session of more than five participants (M = 13, SD = 7 per UI version).
- In the second phase of the experiment (➏ in Figure 6), we recruited a smaller population of new human subjects. In this phase, the study participants were asked to perform comparative evaluations of the initial and final versions of given prototypes, aiming to demonstrate the improvements to the UI and of the UX.
In order to assess end-users’ experience with the prototypes in the task protocols, we included two additional subjective assessment methods, in addition to the usability principle evaluation method used in [43] (➏ in Figure 6): ➀ the NASA Task Load Index method (NASA Task Load Index, https://humansystems.arc.nasa.gov/groups/TLX/), which is a multi-dimensional rating procedure that derives an overall workload score based on a weighted average of ratings on a series of subscales; and ➁ a UX assessment questionnaire that employs a psychometric scale to capture in-situ UX immediately after performing the given tasks. In addition, we slightly modified the forms of specific question items for each human-subject group according to the goal of each experiment phase (e.g., more comparative forms of the same question items in the second phase). Test frameworks for each experiment phase were designed as shown in Figure 7 and Figure 8, and we include details of them in the following sections.
4.3. Study Design
Anyone aged 20–90 who could wear apparel or accessories (e.g., armband, ring, glove, watch, etc.) and had a valid driver’s license was eligible to participate in our study. We sent out an invitation email to members of various campus organizations for distribution and posted study advertisement flyers on bulletin boards around the campus. All subjects gave their informed consent for inclusion before they participated in the study. The study was conducted in accordance with the Declaration of Helsinki, and the protocol was approved by the Carnegie Mellon University Institutional Review Board (IRBSTUDY2015_00000195, Date of Approval: 2 April 2015).
We provided the following information to our participants prior to their actual participation in the study as illustrated in Figure 9: You (=participants) will be asked to:
- Complete three interactive tasks by using the provided tablet and UI prototypes for smartwatches. The tasks will involve number entry, scrolling and swiping. The UI prototypes are a touchscreen-based baseline on the tablet, joystick-embedded, potentiometer-embedded, motion-gesture based and contactless IR-based UIs. The expected duration of this study, including the questionnaire sessions following the task execution, will take approximately 2.5 h in total.
- Fill out a variety of questionnaires following these conditions:
- The main user experience survey after completing each task trial. The expected duration of this survey is no longer than 30 s.
- The NASA task load index survey after completing a task three times. The expected duration of this survey is no longer than five minutes.
- The usability principle evaluation after completing all tasks for the UI prototype. The expected duration of this survey is no longer than two minutes.
- Participate in a post-experiment interview about your experience with the different UI prototypes and the multi-touch gestures. The expected duration of the interview session will be no longer than 45 min. We will be taking an audio recording of the interview for evaluation purposes with your permission.
To conduct the usability testing of the proposed UI prototypes and UX evaluation, we developed an Android-based test-bed that provides a set of test applications (Figure 10). The applications include a pre-determined set of test contents for Number or Text Entry, Scrolling and Swiping Tasks, which were identified as some of the most fundamental and frequent user interactions with existing smartwatches in the previous study [43]. The test applications include software components for Bluetooth communication, data storage and synchronization. We refined the components to be compatible with each platform of our UI prototypes, in order to have the test applications provide the most reliable and accurate measures of participants’ task performance (e.g., measures of response time, task execution time and answer accuracy) by minimizing system latency between participant input activities and system responses.
Our participants used the test applications to test and evaluate the usability of the proposed UI prototypes. Details of the test contents and performance metrics provided by the test applications are as follows:
- For the Number Entry Task, we presented our participants with a tablet (baseline UI, joystick-embedded UI; See Figure 10a), an EFM 32 Wonder Gecko (potentiometer-embedded UI), and a custom-built mockup (contactless IR-based UI) that provided a simulated proxy of a number keypad for smartwatches. For the number keypad, we adopted the exact size and layout of either a smartwatch or a smartphone from the most-often sold models since their releases (i.e., iPhone 6, Apple Watch 38 mm). At the top of the screen, the numbers from 0 to 9 were displayed one at a time. Each number was displayed three times in a random sequence, for a total of 30 numbers. Participants were asked to use their index fingertip to enter the number they saw on the number keypad shown on the tablet. For subjects who completed all tasks, we collected the number of errors and the area of contact (cm) between the fingertip and touch panel.
- For the Scrolling Task, participants saw the simulated proxies similar to those described above, but these displayed a list that consisted of 48 items taken from the menu, function and app list of a mobile device (e.g., Figure 10b). For each trial, the order of the items in the list was randomized. Target items (items participants were asked to select) appeared on the 12th, 20th, 28th, 36th and 44th lines. At the top of the screen, a target item (e.g., “Timer” in Figure 10b) was displayed and participants were asked to search for and then tap the same item from the provided list by scrolling through the list with the tip of their index finger (See Figure 10b). If a participant succeeded in tapping the correct target from the list, a new target showed up at the top. The target item appeared three times at each of the 12th, 20th, 28th, 36th and 44th rows, while the order of the target item location was randomized. The total number of scrolls, number of wrong target selections and task completion time (time between touch interaction with target items shown on the top and from within the lists) were collected as performance measures.
- For the Swiping Task, our participants used the same proxies used for the scrolling tasks, but the given task here was to swipe rows (from left to right) indicated by the red box (See Figure 10c). Our test applications registered that swiping was successfully conducted when participants maintained contact with the touch screen for longer than half the length of the row. After a trial of swiping, the red box moved to another row in random sequence, with the red box appearing three times per row. The number of swiping errors, number of target selection errors and task completion time were collected as performance measures.
- The Text Entry Task was designed for the joystick-based UI prototype and given to 15 Korean participants only as an additional task after all task trials for number entry, scrolling and/or swiping were completed. At the top of a tablet screen, our test application displayed one of four Korean proverbs at a time. Our participants were then asked to manipulate the joystick input device to move around the circular menus for vowels or consonants in order to compose one Korean character and then confirm the composed character , as shown in Figure 10d. The total number of error clicks and execution time (ms) were collected as performance measures.
4.4. UI/UX Assessment
In the study, we presented each participant with a series of survey sessions as shown in Figure 11: ➀ pre-questionnaire session, ➁ interim self-assessment session and ➂ post-interview. The goal of the multiple sessions was to understand the usability of the proposed UI prototypes, improve UX for proposed user interaction methods and then suggest advanced UIs that can resolve the issues with conventional smartwatch UIs.
For this, we collected our participants’ biographical backgrounds and daily usage patterns of smart devices in the pre-questionnaire session. We also tracked in-situ user experience at every task trial; assessed participants’ workloads for the given basic user interaction tasks; and evaluated our prototypes on the aspect of usability principles in the interim self-assessment session, which was structured with three sub-sections. We then interviewed participants to collect their opinions about the strengths and weaknesses of our UI prototypes and identify areas for improvement for use in the iterative design process.
UX Assessment. The goal of this interim session was to understand UX per task trial in our Phase 1 experiment. Therefore, it helped us understand task-specific trends in UX with the use of the provided UI prototype. Its modified versions, on the other hand, helped us to understand task-specific UX with the given version of the UI prototype in our Phase 2 experiment, which involved comparative evaluation. The detailed question items were as follows:
- Usability—I think the interface is usable for performing the task.
- Performance—I think I performed the task well.
- Workload—I think it was easy to perform the task.
- Adaptability—I think I’m getting used to using the interface to perform the task.
- Eliminates the SDFF problem—I think the interface allows me to explore the entire touch screen.
- Willing to Switch—I think I might consider using the UI prototype to perform the task.
- Competitiveness—I think the interface is fairly competitive with traditional smartwatch interfaces.
Task Workload Assessment (NASA-TLX). The goal of this interim session was to understand the subjective task workload of a given task after a participant completed all trials of a given task with the use of the provided UI prototype. In the Phase 2 experiment, we administered these questionnaires (Mental Demand, Physical Demand, Temporal Demand, Own Performance, Effort, and Frustration as shown in Figure 12a) after each of the two trials of the task with the earliest and then latest versions of the UI prototype.
This session consisted of two parts: (1) clicking on each scale at the point that best indicates participants’ experience of the given task (Part 1 rating process—Figure 12a (NASA-TLX in HTML and JavaScript, https://www.keithv.com/software/nasatlx/)), and then (2) clicking on the scale title that represents the more important contributors to workload for the given task (Part 2 weighting process—Figure 12b). In Part 2, 15 screens were shown by turns according to the total number of the binary combination of the factors . For this session, we built a JavaScript-based questionnaire test-bed that allowed us to electronically store and manage participant responses.
4.5. Usability Principle Evaluation
The goal of this interim session was to understand the overall usability of a provided UI prototype in terms of four usability principles after completion of all task trials. These principles are Information Display, Control, Learnability and Preference and the question items are listed in Table 2. Therefore, this session helped us compare the usability of the series of provided UIs.
In Phase 2 of the main experiment (i.e., comparative evaluation), we provided our participants with a structured overview of the two versions of the proposed UI prototypes. This was in order to draw their attention to the major differences between the initial and improved versions, as recommended and implemented based on feedback from 30 participants in the Phase 1 experiment (Table 3).
After the overview session, participants were asked to perform the given tasks with the use of each of the two versions of each UI prototype. Participants then compared the two versions on each task and across all three tasks for their usability as smartwatch UIs. In this comparative evaluation, our participants used the questionnaire forms with modified scale names in the user experience assessment and the usability principle evaluation. Example rating scales include: “Initial version—Much better (1)”, “Initial version—Better (2)”, “Similar (3)”, “Latest version—Better (4)” and “Latest version—Much better (5)”, instead of the “Strongly Disagree (1)”, “Moderately Disagree (2)”, “Neutral (3)”, “Moderately Agree (4)” and “Strongly Agree (5)” scales used in the Phase 1 experiment.
Post-interview. After completing the interim assessment session, our participants were asked to attend an audio-recorded post-interview session, which consisted of two stages. We structured the first stage of the interviews to collect participants’ opinions about the strengths and weaknesses of each UI prototype. In this stage, we also collected participants’ ideas for improvements, potential use scenarios, real-world applications and potential user groups who would prefer the UI, as well as open comments.
In the second stage of the interviews, we collected participants’ opinions about how our UI prototypes could be used for potential multi-touch gestures that may have been beyond the scope of the current stage of the study. For example, our participants were asked to provide their opinions about which of the five UIs (baseline + four prototypes) they had just experienced would be best suited for pan, pinch, rotate and wrist flick gestures as shown in Figure 13 or how the UIs could be combined to recreate the gestures. We then also collected their suggestions about potential use scenarios and real-world applications.
5. Results
Demographic information: This case study includes the results from 44 total participants (age range: 18–48, M = 21.8, SD = 6.28, Male: 22.7%, Female: 77.3%). Thirty participated in the Phases 1 experiment and 10 participated in the Phase 2 experiment. A total of 15 participants completed the Korean Text Entry task, including 11 Korean subjects from the Phase 1 and 2 experiments as well as four Korean subjects recruited for this task only (see Figure 14 for the participant breakdown).
All participants reported that they did not have any physical or mental handicaps that might affect their use of the prototype devices. All participants were using a smartphone, and 9.1% of them used or had used a smartphone and a smartwatch together in their daily lives.
Statistical analysis method: To analyze continuous measures (e.g., response time and response accuracy rate), we conducted a univariate ANOVA by using a general model. As a post-hoc test, we then used either Tukey HSD or Games-Howell after checking for homogeneity of variances (i.e., the Levene Statistic), where was examined as effect size. For ordinal measures (e.g., parts of the NASA-TLX data), we conducted the Kruskal Wallis Test followed by a post-hoc Mann-Whitney U test, where r was examined as effect size. For Likert-scale data (e.g., participant responses in the UX assessment and usability principle evaluation), we conducted Friedman and post-hoc Wilcoxon Signed Rank tests. Table 4 shows the number of data points that we used in the final analysis after filtering out any missing and erroneous data.
In the pre-questionnaire session, we surveyed our participants on how often they performed the three most basic gestural tasks (revealed in [43] to be task entry, scrolling and swiping), on their smartphones, with a UI based on a touch-based screen. In general, the frequency of each task was high (approximately 80% or more for each), which echoes our results from [43]. Additionally, we found that our participants thought they least frequently performed the Swiping Task, as shown in Table 5.
In the same session, we also asked our participants to rank the basic gestural tasks by importance when using a smartphone or a smartwatch. As shown in Table 6, while our participants thought that the Text Entry Task was the most important task when using a smartphone, the task was the least important when using a smartwatch (lowest rank of 2.55). Furthermore, the Scrolling Task and the Swiping Task were almost 1.5 times more important than the Text Entry Task. The pre-questionnaire results suggest that our potential end-users did not expect to use a smartwatch for the Text Entry Task (lowest rank of 2.55). Instead, demand for the Swiping Task could significantly increase (1.75), and the importance of the Scrolling Task would likely remain high for both the smartwatch and the smartphone.
5.1. Iterative Design (Phase 1)
UX Assessment. Figure 15 shows the rating score results from the UX assessment session.
In this session, our participants were asked to consecutively perform each of the tasks three times, and we sampled their experience at every trial. Thus, this session allowed us to understand how our participants’ experience changed throughout the multiple trials. Our findings and discussion are summarized below.
- Finding and Discussion 1: The Adaptability results show that our participants thought they were getting used to using the interface to perform the task, over repeated trials (F(2, 1127) = 24.9, p = 0.000, = 0.042). We saw this across all UI types, including the conventional touch-based screen UI, as well as across all three given tasks. However, we saw the most salient increase in the Number Entry Task using Contactless, Joystick and Potentiometer UIs; the Scrolling Task using the Contactless and Motion UIs; and the Swiping Task using the Joystick and Motion UIs.
- Finding and Discussion 2: The results in the Eliminates SDFF Problem category show that the Contactless UI was the best for the Number Entry Task; the Joystick UI was the best for the Scrolling Task; and the Baseline UI was the best for the Swiping Task. The issue of SDFF was the most problematic when using the Baseline UI, especially for performing the Number Entry Task (F(3, 117) = 4.10, p = 0.008, = 0.095 after the last 3rd trial; e.g., p = 0.028 vs. Contactless UI, p = 0.097 vs. Joystick UI at the post-hoc test). In addition, the results of this UX element suggest the need for improvements to the Potentiometer UI for performing the Number Entry Task and to the Contactless UI for performing the Scrolling Task.
- Finding and Discussion 3: The results across all UX elements show that the touch-based screen is still indispensable for future wearable devices, since the existing touch-based approach can offer our end-users reliable usability and assure task performance without necessarily being fully replaced by any novel UI. Our results also suggest that integrating the proposed UIs with touch-based screens could significantly improve end-users’ experience of exploring various gestural tasks, especially by mitigating the SDFF issue with conventional touch-based screens.
Task Workload Assessment. Figure 16 shows the rating score results of the NASA-TLX session. Each chart is organized by task and displays the average overall task workload score for a given UI followed by the average scores for the individual versions of that UI. The x-axes in the charts show the average score for a UI over the general UI name, followed by the average scores for the individual versions of that UI. For example, in the chart for the Number Entry Task in Figure 16, the sequence of Joystick—V1—V2—V3 in the middle of the x-axis indicates the average scores for the use of V1 (i.e., 45.8), V2 (i.e., 54.2), V3 (i.e., 44.3), following the average across all three versions of the UI (i.e., 46.2 above the Joystick label in the x-axis). In addition, we bolded the data points for the specific UI versions that showed the lowest task workload (see the chart area). In the same Number Entry Task example, the results for V3 of the Joystick UI (i.e., 44.3) show that this version most reduced our participants’ workload for the particular task, more so than V1 or V2, for the particular UI prototype.
- Finding and Discussion. In performing the Number Entry Task, the Contactless UI was the best for reducing our participants’ overall task workloads. The Joystick UI was the best for the Scrolling Task, while the Baseline UI was the best for the Swiping Task. This confirms our findings from the UX assessment in the previous section. In general, the later versions of UIs significantly reduced our participants’ task workloads across all three tasks, as compared to their initial versions (p = 0.010 between the initial and the latest version; and also F(2, 368) = 4.48, p = 0.012 among all three UI versions across all tasks and all UI types). However, some results also showed that the initial or middle versions could be more effective at reducing task workload than the latest versions. For example, V2 of the Potentiometer UI and of the Joystick UI were better than their V3s for the Number Entry Task and for the Scrolling Task, respectively, and V1 of the Motion UI and of the Joystick UI were better than their V2s for the Swiping Task.
Usability Principle Evaluation. Figure 17 shows the average scores on each usability principle (columns under the names of ID1 to Pref3) per each UI (cells filled in grey) and per each UI version (the left-most column). The names of UI versions are labeled with ’_’ between the versions used for each of the given tasks. In Figure 17, we include a green check to indicate the cells that contain scores higher than 4.0 (i.e., Moderately Agree) and a red circle for the cells that contain scores lower than 3.0 (i.e., Neutral). The following analysis focuses on the results shown in the boxes with thickened borders. Within these boxes, green-checked cells are also filled in green and red-circled cells are also filled in red for easier tracking. Labels (1–10 on the right-most side of the table) point to a box with thickened borders located in the given row.
- Finding and Discussion 1. For almost all usability principles, the Contactless UI, the Joystick UI and the Potentiometer UI demonstrated their usability regardless of task type (See Box 1, 4 and 10, respectively). In particular, our participants rated these UIs as consistently usable on Information Display, which is associated with the SDFF issue in the UX assessment (e.g., ID1 scores, M = 4.48, SD = 0.68, p = 0.232 for Contactless UI; M = 4.20, SD = 0.85, p = 0.832 for Joystick UI; M = 4.03, SD = 1.03, p = 0.388) and Learnability, which is associated with Adaptability in the UX assessment (e.g., Lrn1 scores, M = 4.65, SD = 0.58, p = 0.149 for Contactless UI; M = 4.60, SD = 0.56, p = 0.209 for Joystick UI; M = 4.27, SD = 0.74, p = 0.631 for Potentiometer UI), across the multiple versions produced through our iterative design process.
- Finding and Discussion 2. Our participants found the Controllability of the later version set of the Contactless UI to be worse than the initial version (e.g., 2.22 point difference for Ctrl, F(1, 38) = 41.6, p = 0.000; 1.66 point difference for Pref, F(1, 38) = 17.3, p = 0.000), which decreased their preference for it (see Box 2 and Box 3). Specifically, they still liked the look and the feel of the Contactless UI and felt that completing the task with the UI was not intolerable (Pref and Ctrl). However, they did not find the UI to be sufficiently comfortable or satisfactory (Pref and Pref). In particular, they thought that the UI did not react to their inputs precisely and accurately (Ctrl), and they found it was difficult to reach a target function and to undo or redo a task whenever they made an error (Ctrl and Ctrl, respectively).
- Finding and Discussion 3. Interestingly, we observed similar patterns in other proposed UIs, especially when we presented UIs whose versions for both Scrolling and Swiping tasks were upgraded at the same time (See Box 5, 6 to 9). In addition, we found that the results in Preference were highly correlated with those in Controllability (e.g., Motion UI’s NA_V2_V1, r = 0.85 at the 0.05 level of significance; Motion UI’s NA_V3_V2, r = .89 at the 0.01 level of significance, see Box 2 & 3 and 7 & 8), which implies that user preference for wearable devices is influenced by Controllability, perhaps more so than other aspects like Information Display or Learnability.
This section on Iterative Design (Phase 1) provided our findings and discussion for some of the comparative results between the versions of each of the UIs. However, note that comparisons between the versions of a particular UI, each of which was evolved through an iterative design process, can be more adequately examined by a within-subject experiment (e.g., participants used both the initial and the latest versions of each UI in the Phase 2 experiment) than a between-subject experiment (e.g., participants used only one version of each prototype UI in the Phase 1 experiment). These will allow us to convincingly confirm how effective our recommendations were and if we improved UI usability and UX through the use of the latest versions of the proposed UIs.
5.2. Comparative Evaluation (Phase 2)
UX Assessment. Figure 18 shows our participants’ rating results from the UX assessment session. The graphs show how much our participants’ experiences were improved or diminished by using the latest versions of our advanced-concept UI prototypes, compared with their experiences using the UIs’ initial versions, across the seven UX aspects we investigated. In the graphs, if a data point of a UX aspect is higher than 100% (i.e., above the black horizontal line on the chart area), it indicates that our participants’ overall UX of using the UI prototype has improved and that the usability of the UI was successfully improved through our iterative design process.
- Finding and Discussion 1. The overall rating results across all three tasks confirmed that our participants’ experience of using our UI prototypes significantly improved from the initial versions, through our iterative design (19.7% of improvement on average across all seven UX aspects; t(79) = 6.87, p = .000). The only exception was that our participants did not think they performed the Number Entry Task well with the latest versions of the Joystick UI (see the 1st chart of Figure 18). Their reaction time during the Number Entry Task increased with progressive versions of the Joystick UI, even as their task performance accuracy was consistently good across various versions (95.4% on average). One of the biggest changes between the initial and latest versions of the UI was its platform—i.e., from a simulated smartwatch on a tablet screen to a real smartwatch (Sony SmartWatch 3). We hypothesized that the changes in form factor could explain the UX reduction for the latest versions of the Joystick UI. However, we did not see a similar UX reduction for the Scrolling and Swiping Tasks. In fact, our participants’ experience using the latest Joystick UI was significantly higher than 120% across all UX aspects we examined (see the blue lines with square markers in the 2nd and 3rd charts in Figure 18; 22.7% of improvement on average across all seven UX aspects; t(29) = 4.96, p = 0.000). Our post hoc analysis for this reversal effect suggests the hypothetical implication that the distance and the orientation between the screen and the Joystick UI module could be an important UI/UX factor, especially during key entry tasks, which may require more continuous cognitive engagement and attention than scrolling/swiping tasks.
- Finding and Discussion 2. The rating results also confirmed that our iterative design process successfully increased our participants’ experience up to 120% or higher across most of our UIs and on most UX aspects. However, when using the latest versions of the Motion UI and the Potentiometer UI, our participants’ rating scores did not sufficiently improve (reference of 20% improvement), even if their experience improved compared to their initial experience. For example, we found that the Motion UI for the Swiping Task might need some improvement to better help end-users explore the entire touch screen. In addition, we found that our participants’ experience improved more slowly when performing either the Number Entry Task or the Scrolling Task with a Potentiometer UI installed in a wrist-worn mockup (i.e., the latest version), rather than on a flat board surface (i.e., the initial version). Figure 19 and Figure 20 show the proportions of participant rating results for each scale category, represented per UI (cells filled in grey) and then per UI × Task pair. In the left of each cell, we include a graphical icon according to the range of its value: a green circle icon if value ≥ 50%, an upwards green arrow icon if 40% ≤ value < 50%, a yellow arrow icon if 30% ≤ value < 40%, a flat yellow icon if 20% ≤ value < 30% and a grey circle icon if value < 20%.
- Finding and Discussion 3. Our participants evaluated the latest versions of the proposed UIs as more usable or much more usable for performing the given tasks than the initial UI versions—e.g., the Joystick UI (53.3% voted for the latest vs. 13.3% for the initial; t(29) = 3.63, p = 0.001), the Motion UI (55.0% vs. 10.0%; t(19) = 3.04, p = 0.007) and Potentiometer UI (50.0% vs. 20.0%; t(29) = 2.54, p = 0.017) (see the grey rows of Figure 19 and Figure 20). For example, more than 80% of participants voted for the latest versions of the Joystick UI and Baseline UI for the Scrolling Task (see the two boxes with thick borders in the right-hand side of Figure 19 and Figure 20). In particular, the latest version of the Joystick UI was assessed as significantly superior to its initial version on most aspects, including Performance (t(29) = 3.07, p = 0.005), Workload (t(29) = 4.32, p = 0.000), Adaptability (t(29) = 4.81, p = 0.000), Willing to Switch (t(29) = 4.94, p = 0.000), and Competitiveness (t(29) = 4.63, p = 0.000). For the Scrolling Task, the latest version of the Motion UI was also highly appreciated as it helped our participants more easily adapt to using the UI to perform the task (see the boxes with thickened borders in the right-hand side of Figure 19 and Figure 20). The Potentiometer UI, on the other hand, was evaluated as not much improved from its initial version for this particular task on Competitiveness.
- Finding and Discussion 4. The detailed results also suggest the hypothetical implication that the comparative usability of different versions of a UI prototype designed for smartwatches could be more dominantly evaluated in terms of Performance and Workload, prior to other UX aspects, such as Adaptability or Eliminating the SDFF Problem. For example, our participants thought that both the initial version and the latest version of the Joystick UI were similar in their usability for the Number Entry Task (t(9) = 0.32, p = 0.758). Similar patterns were also demonstrated in the Performance results, where only 20% of our participants voted for the latest version of the Joystick UI for the Number Entry Task (t(9) = −0.318, p = 0.758). Additionally, our participant responses showed that they felt similar degrees of workload when performing the Number Entry Task with the different versions of the Joystick UI (t(9) = 0.36, p = 0.726; 60% voted similar and 20% identical each for the initial version and for the latest version of the UI). This finding suggests a need for a more structured assessment of task workload and task performance measurement, as in the following sessions.
Task Workload Assessment (NASA-TLX). This section shows our participants’ rating results from the task workload assessment session. The bar graphs in Figure 21 shows how much participants’ task workloads were reduced through the use of the latest version of a UI, as compared to the use of the initial version, per each task. The line graph in Figure 21 shows participants’ average rating scores when they performed each of the given tasks with the latest (fluorescent green line with square markers) and the initial versions (dark red line with round markers) of the provided UIs. The data tables at the bottom provide the actual values of the average rating scores. The x-axes in Figure 21 display the name of a UI followed by the names of specific tasks. For example, Joystick—Number Entry—Scrolling—Swiping shows that overall participant task workloads were reduced by 25.4% when they used a series of the latest versions of the Joystick UI (by normalizing the task workloads when using the initial versions of the UI to 100%)—specifically, by 22.2% for the Number Entry Task, 23.9% for the Scrolling Task and 31.6% for the Swiping Task.
- Finding and Disucssion 1. The results of the Task Workload Assessment showed that our participants’ overall task workload when using the latest versions of provided UIs were significantly lower than when using the initial versions of them—by an approximately 12.2 point difference on average (SD difference = 3.86) across all UI and task combinations, which corresponds to a 25.6% task workload reduction (t(178) = 3.17, p = 0.002).
- Finding and Discussion 2. The overall results strongly suggest that users can best perform the Number Entry Task by using the latest version of the Contactless UI, the Scrolling Task by using the latest version of the Joystick UI and the Swiping Task by using a touch-based screen. These findings were clearly evident across most specific workload aspects (Mental Demand, Physical Demand, Temporal Demand, Effort and Frustration).
- Finding and Discussion 3. Interestingly, if a developer aims to help end-users evaluate their performance on the Number Entry Task as satisfactory, a touch-based screen is slightly more effective than the Contactless UI (i.e., Own Performance aspect). In addition, the Potentiometer UI and the Joystick UI were revealed to be the best alternatives to touch-based screens in the Swiping Task, if the goal is to reduce mental and perceptual workload, respectively.
The detailed results for specific aspects of task workload are depicted in Figure 22, Figure 23, Figure 24, Figure 25, Figure 26 and Figure 27.
Usability Principle Evaluation. This section shows our participants’ rating score results from the usability principle evaluation session. Bar graphs in Figure 28 shows how much our iterative design process increased our participants’ appreciation from the initial to the latest versions of our proposed UIs, according to the four usability principle categories that we explored in this study. On our 5-point Likert scale questions, 1 is the lowest score (i.e., Initial Much Better), 3 is the middle score (i.e., Similar) and 5 is the highest score (i.e., Latest Much Better). Therefore, improvement rates were estimated as percentages by setting the lowest score to 0% and the middle score to 100% (i.e., Similar), and then linearly normalizing it up to the highest score.
- Finding and Discussion 1. In terms of quantitative evaluation, the latest versions of the UIs significantly reduced participants’ reaction time while maintaining their answer accuracy as shown in Figure 29 (e.g., Reaction Time and Answer Accuracy for the Joystick UI, t(58) = 2.17, p = 0.034 and t(58) = −0.848, p = 0.400, respectively). The improvement in reaction time corresponds to an approximately 41.9% reduction for the Joystick UI, a 19.7% reduction for the Motion UI, and an 11.0% reduction for the Potentiometer UI. However, there was also a reversal for the touch-based screen, with a 14.0% increase in the Baseline UI. Both qualitative and quantitative results in the usability principle evaluation confirm that our iterative design process significantly improved the usability of our proposed UIs, as compared to the initial versions across all three tasks given in our experiment (see the horizontal dashed lines in red in Figure 28).
- Finding and Discussion 2. The results also identified the aspects of usability principles that showed steady or marginal improvement (i.e., the Controllability of the Motion UI and the Potentiometer UI)—specifically, Ctrl & Ctrl of the Motion UI and Ctrl & Ctrl of the Potentiometer UI. Interestingly, in the case of the Potentiometer UI, the latest versions, which were incorporated into a wrist-worn mockup, resulted in steady improvement (M = 3.35, SD = 0.667, t(9) = 1.64, p = 0.135, across all aspects of usability principles). This confirms the results we observed in our previous UX assessment section. This also suggests the hypothetical implication that improvement in the usability of a UI can be slower if the UI increasingly requires users to control the UI with both hands.
5.3. Design Implications and Recommendations
The results generally suggest incorporating the proposed UIs on a conventional touch-based screen rather than replacing wholesale all existing functions triggered by touch-based figure gestures. More specifically, our participants’ comments about the general potential of the proposed UI prototypes and potential applications in real-world situations recommend following integration and improvements.
- The Joystick UI module, which provides appealing tactile feedback, can be integrated for tasks requiring a naturalistic exploration of an information space larger than the screen area, such as menu scrolling or map navigation. Overall, participants appreciated the intuitiveness and simplicity of the Joystick UI, which enable an easily accessible eyes-free interaction by presenting explicit tactile feedback. Two potential applications of the Joystick UI, such as playing games and providing enhanced accessibility for handicapped users, were elicited by multiple participants. Subject 19 deemed this availability of tactile feedback useful for people with a medical disability who may have difficulties performing tasks that require high hand-eye coordination. Moreover, 12 subjects found the naturalistic exploration with the Joystick UI (i.e., four directional movements) potentially useful for playing games. However, participants expressed conflicting preferences for the operating speed and controllability of the Joystick UI. For example, Subject 20 suggested, “... make the scrolling speed just a little bit faster. It just needs to not stay on one item for as long as it does”. On the contrary, Subject 12 complimented, “... it’s easy to control how fast and how slow you want to go”. Therefore, an option for personalizing operating speed and controllability is a possible remedy for this issue.
- The Potentiometer UI module, which can be installed on a smartwatch’s strap or bezel, is recommended for tasks that end-users want to less explicitly perform and as the best alternative extension to touch-based interaction. Five participants valued the Potentiometer UI for providing discreet watch interaction, which is a unique feature not mentioned for other UIs. For example, Subject 4 liked the privacy secured by the wristband, “... you could just [interact with the smartwatch] casually and people would not even know what you’re doing”. Other participants found the Potentiometer UI can help maximize uses of the touchscreen. Subject 1 valued that the Potentiometer UI is useful for mitigating the SDFF problem by using extra space on the wrist strap. Subject 5 described this advantage, “just an extension of using your screen” and envisioned a use scenario for the Potentiometer UI, “It will be useful when you needed software that needed more space on the screen”. However, using different pressure levels in the Potentiometer UI was viewed as problematic and demanding by many participants. Subject 7 expressed frustrations, “The different pressure was kind of hard to remember [for the numbers]. I found it confusing”. Subject 4 too elaborated on this shortcoming, “... I did not like how you had to put a certain amount of pressure on it because that’s too much effort”. Therefore, the Potentiometer UI can be made more usable by reducing pressure levels to a single level, complementing by a double-tap and providing visual feedback on the pressure being exerted.
- The Motion-gesture UI module, which allows wrist gestural input, will be effective for simple tasks requiring less precision or attention. Examples of such task include performing a quick confirmation task while jogging, typing on a keyboard, or using a mouse, where end-users do not want to necessarily move their fingers to touch the screen or where other proxies force them disengage from their primary task. Eighteen participants found the Motion-gesture UI very suitable for hands-free/multitasking/active uses (e.g., running, driving). Subject 2 stated that “... I think that would just be easy when you only have one hand available”. Subject 20 too found the Motion-gesture UI handy, “Maybe your one hand is full so you need to just shake [the watch] to move ...” Other participants emphasized use case scenarios for handicapped/disabled users where more sensitive and haptic feedback could make the Motion-gesture UI easier for people with limited mobility. Subject 19 noted, “... this could actually be useful for blind people, because [the motion] provides non-visual feedback through the vibrations”. Subject 35 too found the Motion-gesture UI more feasible for disabled users who can benefit from using alternative and sensitive modalities. However, participants reported that the flicking motion is physically demanding and socially awkward. Subject 12 complained, “I think just having to scroll through so many times was why my arms were getting so tired”. Subject 4 summarized his/her frustration, “... it seems exhausting”. Therefore, the Motion-gesture UI would be more usable and effective when less-demanding micro-gestures are registered and recognized responsively.
- The Contactless UI module, which offers a reconfigurable smartphone-like UI based on the projection of a virtual keyboard layout with an IR light and an embedded sensor, has great potential for tasks requiring end-users’ continuous engagement in cognition and attention, such as number or text entry tasks. Overall, many participants appreciated that the Contactless UI provides an enlarged interaction space while providing a UI/UX that is intuitive and similar to that of the touchscreen baseline. Ten participants in our case study were impressed that the Contactless UI offers a familiar and continuous smartphone experience on a smartwatch. For example, Subject 6 commented, “It does seem pretty easy, since it’s basically just like a [touch screen] just not visible”. Participants noted that the Contactless UI has the advantages of providing a bigger-size user interaction space that can allow for higher accuracy. For example, Subject 16 expressed, “... so if there’s something that’s kind of hard to see on the screen, then you could project it and make it easier for people who can’t see something that small”. On the other hand, multiple participants expressed concerns about integrating the projection module and providing feedback on user interaction. Subject 18 commented on the current prototype, “I guess get the projections working—it’s hard to say since that’s not working”. Subject 33 saw a need for feedback, “I think feedback is necessary because I know there were a lot of errors for mine, but I wasn’t sure where the errors were”. Therefore, the Contactless UI still has room for improvement integrating both visual and haptic feedback.
- There are other types of wearable UI/UX that we did not cover in this paper, but worth considering for future work. For example, a wearable device may employ a minimalist interface or may not provide any physical apparatus for user interaction at all. In this scenario, the device attempts to automatically infer intentions and predict next possible actions of users based on previous behavior patterns. To include such intelligence or context-awareness, we need to quantify and learn from personal big data generated via user interaction. In this aspect, it is an interesting direction to study how the likes of voice-based virtual assistants (i.e., Cortana, Siri, Google Assistant, Alexa and Bixby) can be integrated and cooperated to overcome limitations of current wearable UIs for better user experience.
6. Conclusions
In this case study, we demonstrated that our conceptual test framework can be used to iteratively identify, remove and avoid potential problems in developing advanced-concept wearable UI prototypes. In the first phase of the test framework, we successfully improved the usability of the UI prototypes through an iterative design process. In the second phase, we conducted a comparative evaluation and demonstrated that the overall results of a usability assessment, task workload assessment and UX evaluation of the prototypes show over 20% improvement in most categories. As a result of studying the four prototypes of representative wearable UIs, several important topics and design recommendations are elicited for future work, which include personalization of controllability, designs of effortless micro-interactions and integration of visual/haptic feedback. We hope that findings of our case study help build more usable and effective personal big data systems, especially in the context of wearable UI and UX.
Acknowledgments
This research was financially supported by the Ministry of Trade, Industry and Energy (MOTIE) and Korea Institute of Advancement of Technology (KIAT) through the International Cooperative R&D program [N0001228, Development of UI/UX Technology to Overcome the Limitations of Wearable Device UIs]. The authors would like to thank Saet-Byeol Yu and Ji-Eun Lee for their support in improving prototypes presented in this paper. Figure 1 icons are Smart Watch by m, accelerometer by Kevin Schumacher, Gyroscope by Anusha Narvekar, muscles by lastspark, infrared by Fatahillah and Sound Sensor by Randolph Novino all from the Noun Project, respectively.
Author Contributions
H.Y., S.-H.P. and K.-T.L designed and developed initial versions of the prototypes; S.J.K. and A.K.D. designed and performed the experiments; S.J.K. and A.K.D. analyzed the experiment results; J.W.P developed the initial versions of the test applications when he was a visiting researcher at Human-Computer Interaction Institute, Carnegie Mellon University. H.Y., S.-H.P. and S.J.K. iteratively improved and developed final versions of the prototypes; H.Y. and S.J.K. wrote the paper.
Conflicts of Interest
The authors declare no conflict of interest.
Abbreviations
The following abbreviations are used in this manuscript:
| UI | User Interface |
| UX | User Experience |
| SDFF | Small Display and Fat Finger |
| SPP | Serial Port Profile |
| API | Application Programming Interface |
| IR | Infrared Radiation |
| ESM | Experience Sampling Method |
| ANOVA | Analysis of Variance |
| HSD | Honest Significant Difference |
References
- Swan, M. Sensor Mania! The Internet of Things, Wearable Computing, Objective Metrics, and the Quantified Self 2.0. J. Sens. Actuator Netw. 2012, 1, 217–253. [Google Scholar] [CrossRef]
- Yoon, H.; Doh, Y.Y.; Yi, M.Y.; Woo, W. A Conceptual Framework for Augmented Smart Coach Based on Quantified Holistic Self. In Proceedings of the 2nd International Conference on Distributed, Ambient, and Pervasive Interactions, Crete, Greece, 22–27 June 2014; pp. 498–508. [Google Scholar]
- Crawford, K.; Lingel, J.; Karppi, T. Our Metrics, Ourselves: A Hundred Years of Self-tracking from the Weight Scale to the Wrist Wearable Device. Eur. J. Cult. Stud. 2015, 18, 479–496. [Google Scholar] [CrossRef]
- Schüll, N.D. Data for Life: Wearable Technology and the Design of Self-care. BioSocieties 2016, 11, 317–333. [Google Scholar] [CrossRef]
- Lara, O.D.; Labrador, M.A. A Survey on Human Activity Recognition using Wearable Sensors. IEEE Commun. Surv. Tut. 2013, 15, 1192–1209. [Google Scholar] [CrossRef]
- Kim, S.; Chun, J.; Dey, A.K. Sensors Know When to Interrupt You in the Car: Detecting Driver Interruptibility Through Monitoring of Peripheral Interactions. In Proceedings of the 33rd Annual ACM Conference on Human Factors in Computing Systems, Seoul, Korea, 18–23 April 2015; pp. 487–496. [Google Scholar]
- Piwek, L.; Ellis, D.A.; Andrews, S.; Joinson, A. The Rise of Consumer Health Wearables: Promises and Barriers. PLOS Med. 2016, 13, 1–9. [Google Scholar] [CrossRef] [PubMed]
- Zheng, Y.L.; Ding, X.R.; Poon, C.C.Y.; Lo, B.P.L.; Zhang, H.; Zhou, X.L.; Yang, G.Z.; Zhao, N.; Zhang, Y.T. Unobtrusive Sensing and Wearable Devices for Health Informatics. IEEE Trans. Biomed. Eng. 2014, 61, 1538–1554. [Google Scholar] [CrossRef] [PubMed]
- Motti, V.G.; Caine, K. Micro Interactions and Multi Dimensional Graphical User Interfaces in the Design of Wrist Worn Wearables. In Proceedings of the Human Factors and Ergonomics Society 59th Annual Meeting, Los Angeles, CA, USA, 26–30 October 2015; pp. 1712–1716. [Google Scholar]
- Motti, V.G.; Caine, K. Smart Wearables or Dumb Wearables? Understanding How Context Impacts the UX in Wrist Worn Interaction. In Proceedings of the 34th ACM International Conference on the Design of Communication, Silver Spring, MD, USA, 23–24 September 2016. [Google Scholar]
- Siek, K.A.; Rogers, Y.; Connelly, K.H. Fat Finger Worries: How Older and Younger Users Physically Interact with PDAs. In Proceedings of the IFIP TC13 Conference on Human-Computer Interaction, Rome, Italy, 12–16 September 2005; pp. 267–280. [Google Scholar]
- Oakley, I.; Lee, D.; Islam, M.R.; Esteves, A. Beats: Tapping Gestures for Smart Watches. In Proceedings of the 33rd Annual ACM Conference on Human Factors in Computing Systems, Seoul, Korea, 18–23 April 2015; pp. 1237–1246. [Google Scholar]
- Lafreniere, B.; Gutwin, C.; Cockburn, A.; Grossman, T. Faster Command Selection on Touchscreen Watches. In Proceedings of the 34th Annual ACM Conference on Human Factors in Computing Systems, Santa Clara, CA, USA, 7–12 May 2016; pp. 4663–4674. [Google Scholar]
- Yeo, H.S.; Lee, J.; Bianchi, A.; Quigley, A. WatchMI: Pressure Touch, Twist and Pan Gesture Input on Unmodified Smartwatches. In Proceedings of the 18th International Conference on Human-Computer Interaction with Mobile Devices and Services, Florence, Italy, 6–9 September 2016; pp. 394–399. [Google Scholar]
- Hong, J.; Heo, S.; Isokoski, P.; Lee, G. SplitBoard: A Simple Split Soft Keyboard for Wristwatch-sized Touch Screens. In Proceedings of the 33rd Annual ACM Conference on Human Factors in Computing Systems, Seoul, Korea, 18–23 April 2015; pp. 1233–1236. [Google Scholar]
- Chen, X.A.; Grossman, T.; Fitzmaurice, G. Swipeboard: A Text Entry Technique for Ultra-small Interfaces That Supports Novice to Expert Transitions. In Proceedings of the 27th Annual ACM Symposium on User Interface Software and Technology, Honolulu, HI, USA, 5–8 October 2014; pp. 615–620. [Google Scholar]
- Oney, S.; Harrison, C.; Ogan, A.; Wiese, J. ZoomBoard: A Diminutive Qwerty Soft Keyboard Using Iterative Zooming for Ultra-small Devices. In Proceedings of the 31st Annual ACM Conference on Human Factors in Computing Systems, Paris, France, 27 April–2 May 2013; pp. 2799–2802. [Google Scholar]
- Leiva, L.A.; Sahami, A.; Catala, A.; Henze, N.; Schmidt, A. Text Entry on Tiny QWERTY Soft Keyboards. In Proceedings of the 33rd Annual ACM Conference on Human Factors in Computing Systems, Seoul, Korea, 18–23 April 2015; pp. 669–678. [Google Scholar]
- Xia, H.; Grossman, T.; Fitzmaurice, G. NanoStylus: Enhancing Input on Ultra-Small Displays with a Finger-Mounted Stylus. In Proceedings of the 28th Annual ACM Symposium on User Interface Software & Technology, Charlotte, NC, USA, 11–15 November 2015; pp. 447–456. [Google Scholar]
- Funk, M.; Sahami, A.; Henze, N.; Schmidt, A. Using a Touch-sensitive Wristband for Text Entry on Smart Watches. In Proceedings of the Extended Abstracts of the 32nd Annual ACM Conference on Human Factors in Computing Systems, Toronto, ON, Canada, 26 April–1 May 2014; pp. 2305–2310. [Google Scholar]
- Ahn, Y.; Hwang, S.; Yoon, H.; Gim, J.; Ryu, J.H. BandSense: Pressure-sensitive Multi-touch Interaction on a Wristband. In Proceedings of the 33rd Annual ACM Conference Extended Abstracts on Human Factors in Computing Systems, Seoul, Korea, 18–23 April 2015; pp. 251–254. [Google Scholar]
- Yoon, H.; Lee, J.E.; Park, S.H.; Lee, K.T. Position and Force Sensitive N-ary User Interface Framework for Wrist-worn Wearables. In Proceedings of the Joint 8th International Conference on Soft Computing and Intelligent Systems and 17th International Symposium on Advanced Intelligent Systems, Sapporo, Japan, 25–28 August 2016; pp. 671–675. [Google Scholar]
- Perrault, S.T.; Lecolinet, E.; Eagan, J.; Guiard, Y. WatchIt: Simple Gestures and Eyes-free Interaction for Wristwatches and Bracelets. In Proceedings of the 31st Annual ACM Conference on Human Factors in Computing Systems, Paris, France, 27 April–2 May 2013; pp. 1451–1460. [Google Scholar]
- Yu, S.B.; Jung, D.H.; Park, Y.S.; Kim, H.S. Design and Implementation of Force Sensor based Password Generation. In Proceedings of the 2016 Asia Workshop on Information and Communication Engineering, Cheonan-si, Korea, 25 August 2016; pp. 61–64. [Google Scholar]
- Grossman, T.; Chen, X.A.; Fitzmaurice, G. Typing on Glasses: Adapting Text Entry to Smart Eyewear. In Proceedings of the 17th International Conference on Human-Computer Interaction with Mobile Devices and Services, Copenhagen, Denmark, 24–27 August 2015; pp. 144–152. [Google Scholar]
- Kubo, Y.; Shizuki, B.; Tanaka, J. B2B-Swipe: Swipe Gesture for Rectangular Smartwatches from a Bezel to a Bezel. In Proceedings of the 34th Annual ACM Conference on Human Factors in Computing Systems, Santa Clara, CA, USA, 7–12 May 2016; pp. 3852–3856. [Google Scholar]
- Oakley, I.; Lee, D. Interaction on the Edge: Offset Sensing for Small Devices. In Proceedings of the 32nd Annual ACM Conference on Human Factors in Computing Systems, Toronto, ON, Canada, 26 April–1 May 2014; pp. 169–178. [Google Scholar]
- Darbar, R.; Sen, P.K.; Samanta, D. PressTact: Side Pressure-Based Input for Smartwatch Interaction. In Proceedings of the 34th Annual ACM Conference Extended Abstracts on Human Factors in Computing Systems, Santa Clara, CA, USA, 7–12 May 2016; pp. 2431–2438. [Google Scholar]
- Arefin Shimon, S.S.; Lutton, C.; Xu, Z.; Morrison-Smith, S.; Boucher, C.; Ruiz, J. Exploring Non-touchscreen Gestures for Smartwatches. In Proceedings of the 34th Annual ACM Conference on Human Factors in Computing Systems, Santa Clara, CA, USA, 7–12 May 2016; pp. 3822–3833. [Google Scholar]
- Kerber, F.; Löchtefeld, M.; Krüger, A.; McIntosh, J.; McNeill, C.; Fraser, M. Understanding Same-Side Interactions with Wrist-Worn Devices. In Proceedings of the 9th Nordic Conference on Human-Computer Interaction, Gothenburg, Sweden, 23–27 October 2016; pp. 1–10. [Google Scholar]
- Paudyal, P.; Banerjee, A.; Gupta, S.K. SCEPTRE: A Pervasive, Non-Invasive, and Programmable Gesture Recognition Technology. In Proceedings of the 21st International Conference on Intelligent User Interfaces, Sonoma, CA, USA, 7–10 March 2016; pp. 282–293. [Google Scholar]
- Laput, G.; Xiao, R.; Harrison, C. ViBand: High-Fidelity Bio-Acoustic Sensing Using Commodity Smartwatch Accelerometers. In Proceedings of the 29th Annual Symposium on User Interface Software and Technology, Tokyo, Japan, 16–19 October 2016; pp. 321–333. [Google Scholar]
- Lee, S.C.; Li, B.; Starner, T. AirTouch: Synchronizing In-air Hand Gesture and On-body Tactile Feedback to Augment Mobile Gesture Interaction. In Proceedings of the 15th Annual International Symposium on Wearable Computers, San Francisco, CA, USA, 12–15 June 2011; pp. 3–10. [Google Scholar]
- Withana, A.; Peiris, R.; Samarasekara, N.; Nanayakkara, S. zSense: Enabling Shallow Depth Gesture Recognition for Greater Input Expressivity on Smart Wearables. In Proceedings of the 33rd Annual ACM Conference on Human Factors in Computing Systems, Seoul, Korea, 18–23 April 2015; pp. 3661–3670. [Google Scholar]
- Gong, J.; Yang, X.D.; Irani, P. WristWhirl: One-handed Continuous Smartwatch Input using Wrist Gestures. In Proceedings of the 29th Annual Symposium on User Interface Software and Technology, Tokyo, Japan, 16–19 October 2016; pp. 861–872. [Google Scholar]
- Guo, A.; Paek, T. Exploring tilt for no-touch, wrist-only interactions on smartwatches. In Proceedings of the 18th International Conference on Human-Computer Interaction with Mobile Devices and Services, Florence, Italy, 6–9 September 2016; pp. 17–28. [Google Scholar]
- Zhang, Y.; Harrison, C. Tomo: Wearable, Low-Cost Electrical Impedance Tomography for Hand Gesture Recognition. In Proceedings of the 28th Annual ACM Symposium on User Interface Software and Technology, Charlotte, NC, USA, 11–15 November 2015; pp. 167–173. [Google Scholar]
- Wen, H.; Ramos Rojas, J.; Dey, A.K. Serendipity: Finger Gesture Recognition using an Off-the-Shelf Smartwatch. In Proceedings of the 34th Annual ACM Conference on Human Factors in Computing Systems, Santa Clara, CA, USA, 7–12 May 2016; pp. 3847–3851. [Google Scholar]
- Paudyal, P.; Lee, J.; Banerjee, A.; Gupta, S.K. DyFAV: Dynamic Feature Selection and Voting for Real-time Recognition of Fingerspelled Alphabet Using Wearables. In Proceedings of the 22nd International Conference on Intelligent User Interfaces, Limassol, Cyprus, 13–16 March 2017; pp. 457–467. [Google Scholar]
- Zhang, C.; Bedri, A.; Reyes, G.; Bercik, B.; Inan, O.T.; Starner, T.E.; Abowd, G.D. TapSkin: Recognizing On-Skin Input for Smartwatches. In Proceedings of the 2016 ACM on Interactive Surfaces and Spaces, Niagara Falls, ON, Canada, 6–9 November 2016; pp. 13–22. [Google Scholar]
- Laput, G.; Xiao, R.; Chen, X.A.; Hudson, S.E.; Harrison, C. Skin buttons: Cheap, small, low-powered and clickable fixed-icon laser projectors. In Proceedings of the 27th Annual ACM Symposium on User Interface Software and Technology, Honolulu, HI, USA, 5–8 October 2014; pp. 389–394. [Google Scholar]
- Ogata, M.; Imai, M. SkinWatch: Skin Gesture Interaction for Smart Watch. In Proceedings of the 6th Augmented Human International Conference, Singapore, 9–11 March 2015; pp. 21–24. [Google Scholar]
- Chun, J.; Kim, S.; Dey, A.K. Usability Evaluation of Smart Watch UI/UX using Experience Sampling Method (ESM). Int. J. Ind. Ergonom. 2017. submitted for publication. [Google Scholar]
- Yoon, H.; Park, S.H.; Lee, K.T. Lightful User Interaction on Smart Wearables. Pers. Ubiquit. Comput. 2016, 20, 973–984. [Google Scholar] [CrossRef]
- Lee, J.E.; Yoon, H.; Park, S.H.; Lee, K.T. Complete as You Go: A Constructive Korean Text Entry Method for Smartwatches. Proceedings of 2016 International Conference on Information and Communication Technology Convergence, Jeju Island, Korea, 19–21 October 2016; pp. 1185–1187. [Google Scholar]
- Xiao, R.; Laput, G.; Harrison, C. Expanding the Input Expressivity of Smartwatches with Mechanical Pan, Twist, Tilt and Click. In Proceedings of the 32nd Annual ACM Conference on Human Factors in Computing Systems, Toronto, ON, Canada, 26 April–1 May 2014; pp. 193–196. [Google Scholar]
Figure 1.
An overview of recent wearable UI approaches categorized as (a) Contact points in contact-based approaches; (b) Gesture sensing in contactless approaches.
Figure 1.
An overview of recent wearable UI approaches categorized as (a) Contact points in contact-based approaches; (b) Gesture sensing in contactless approaches.
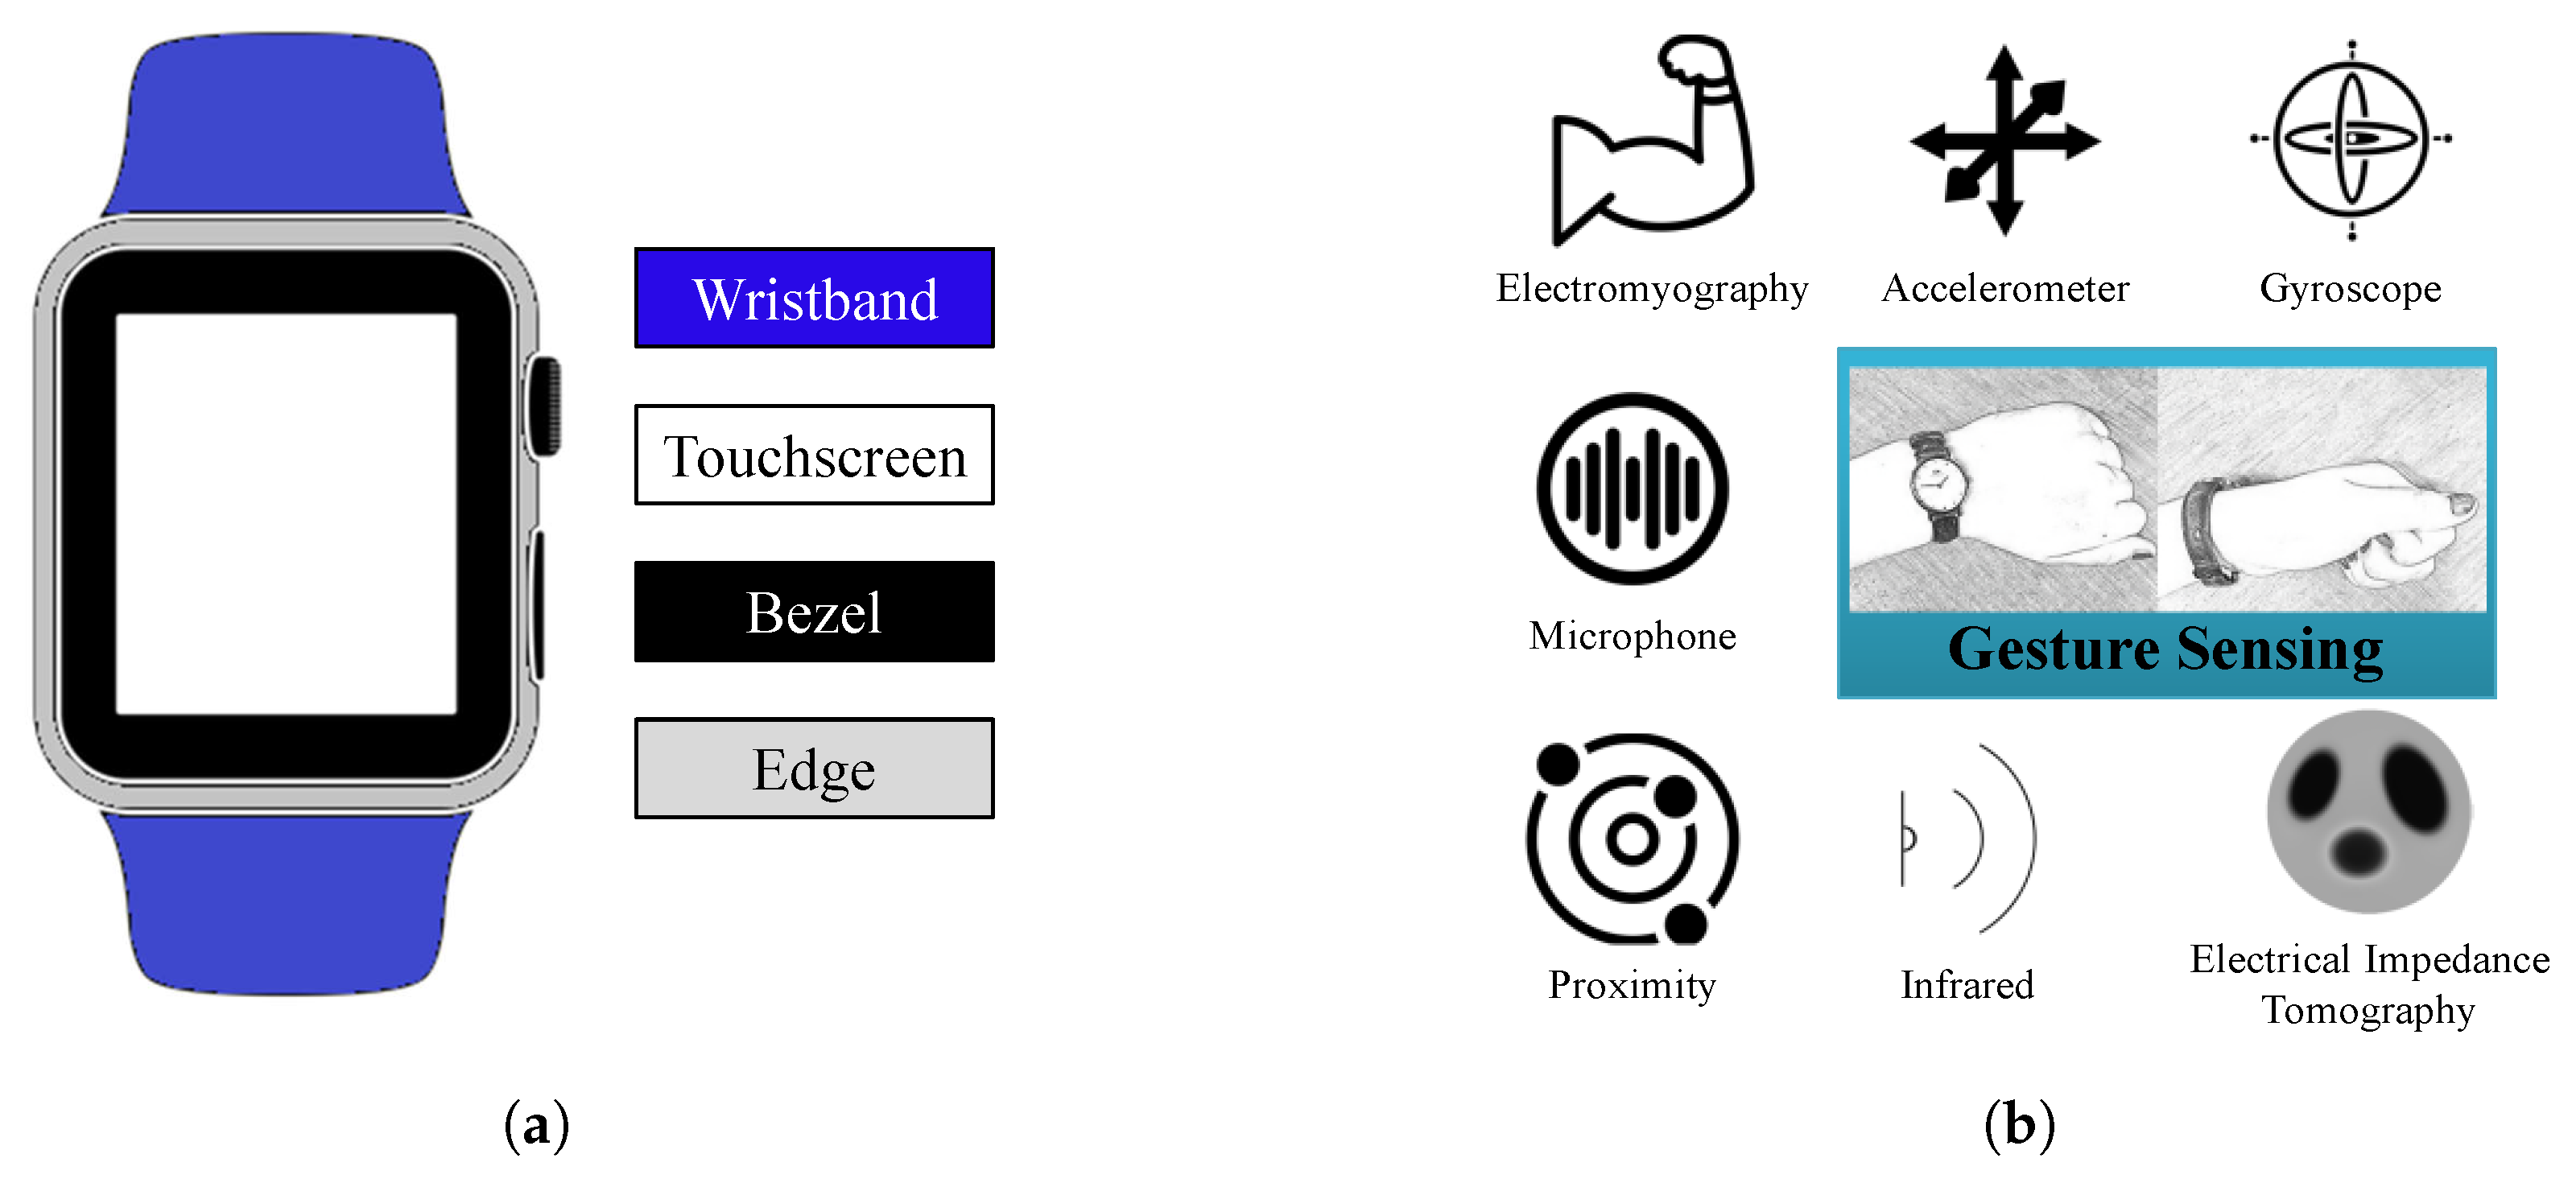
Figure 2.
Developed joystick-embedded prototypes.
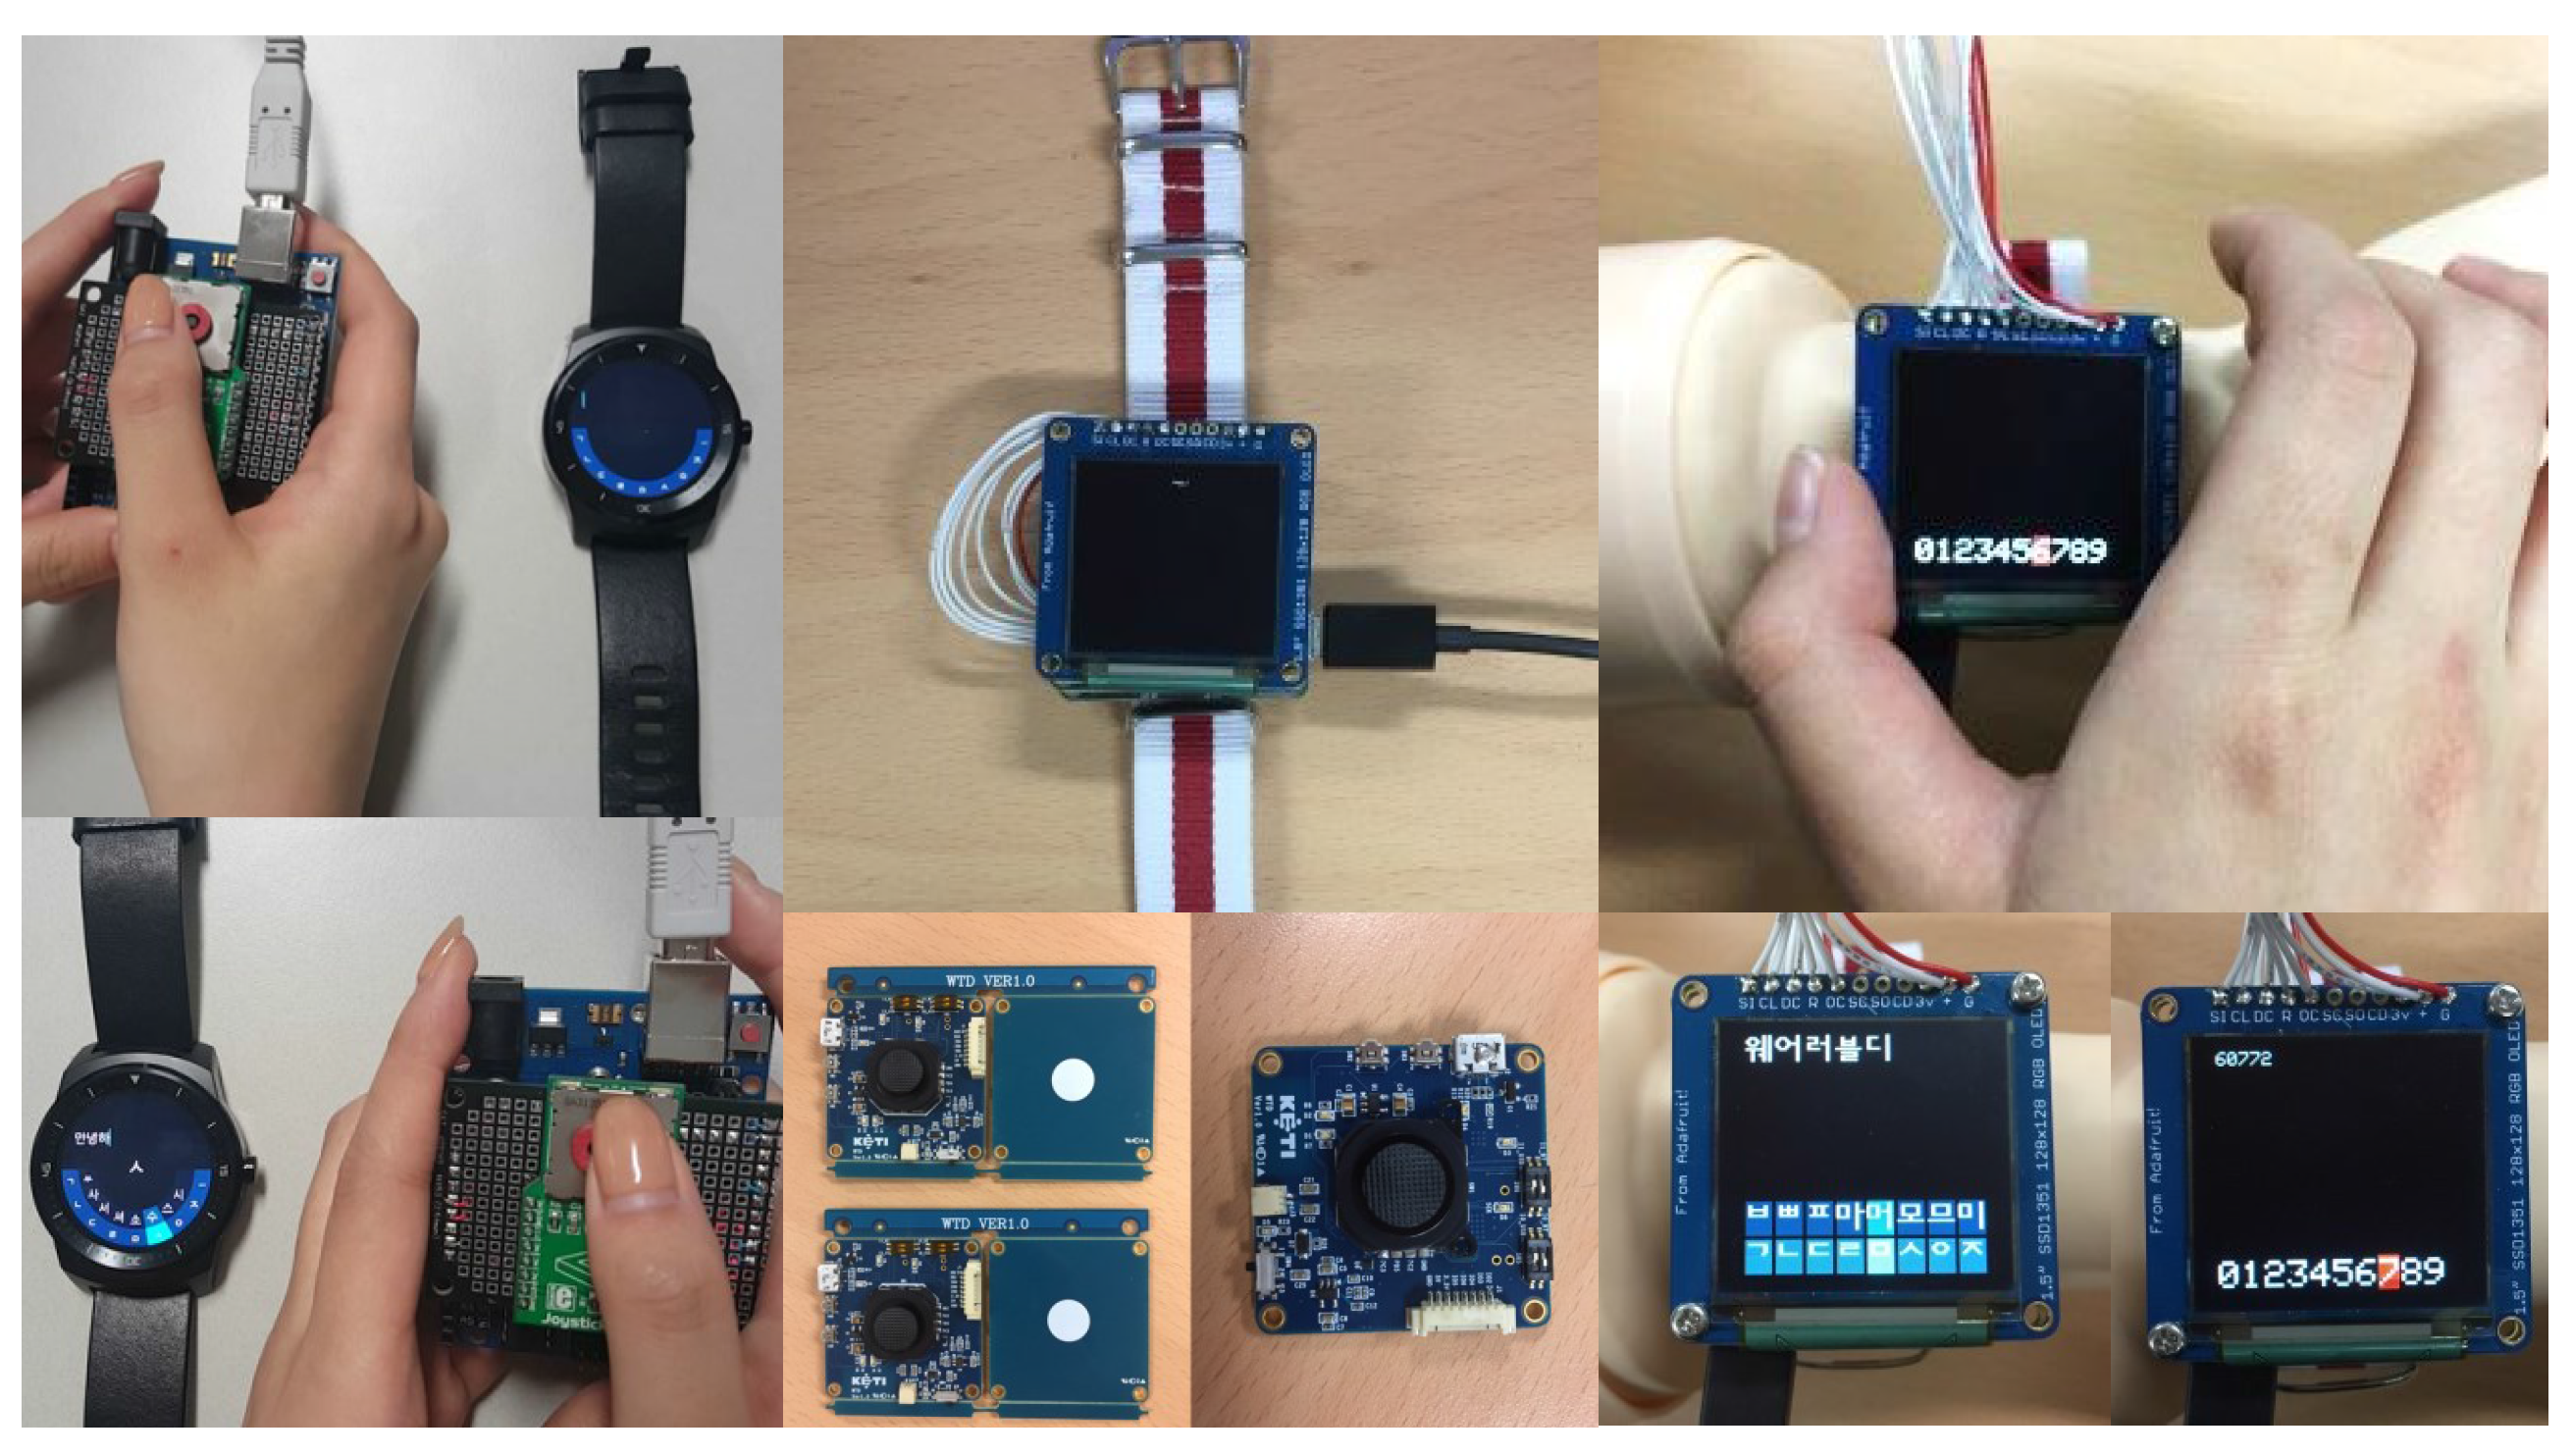
Figure 3.
Developed potentiometer-embedded prototypes.

Figure 4.
Developed motion-gesture based UI prototypes.
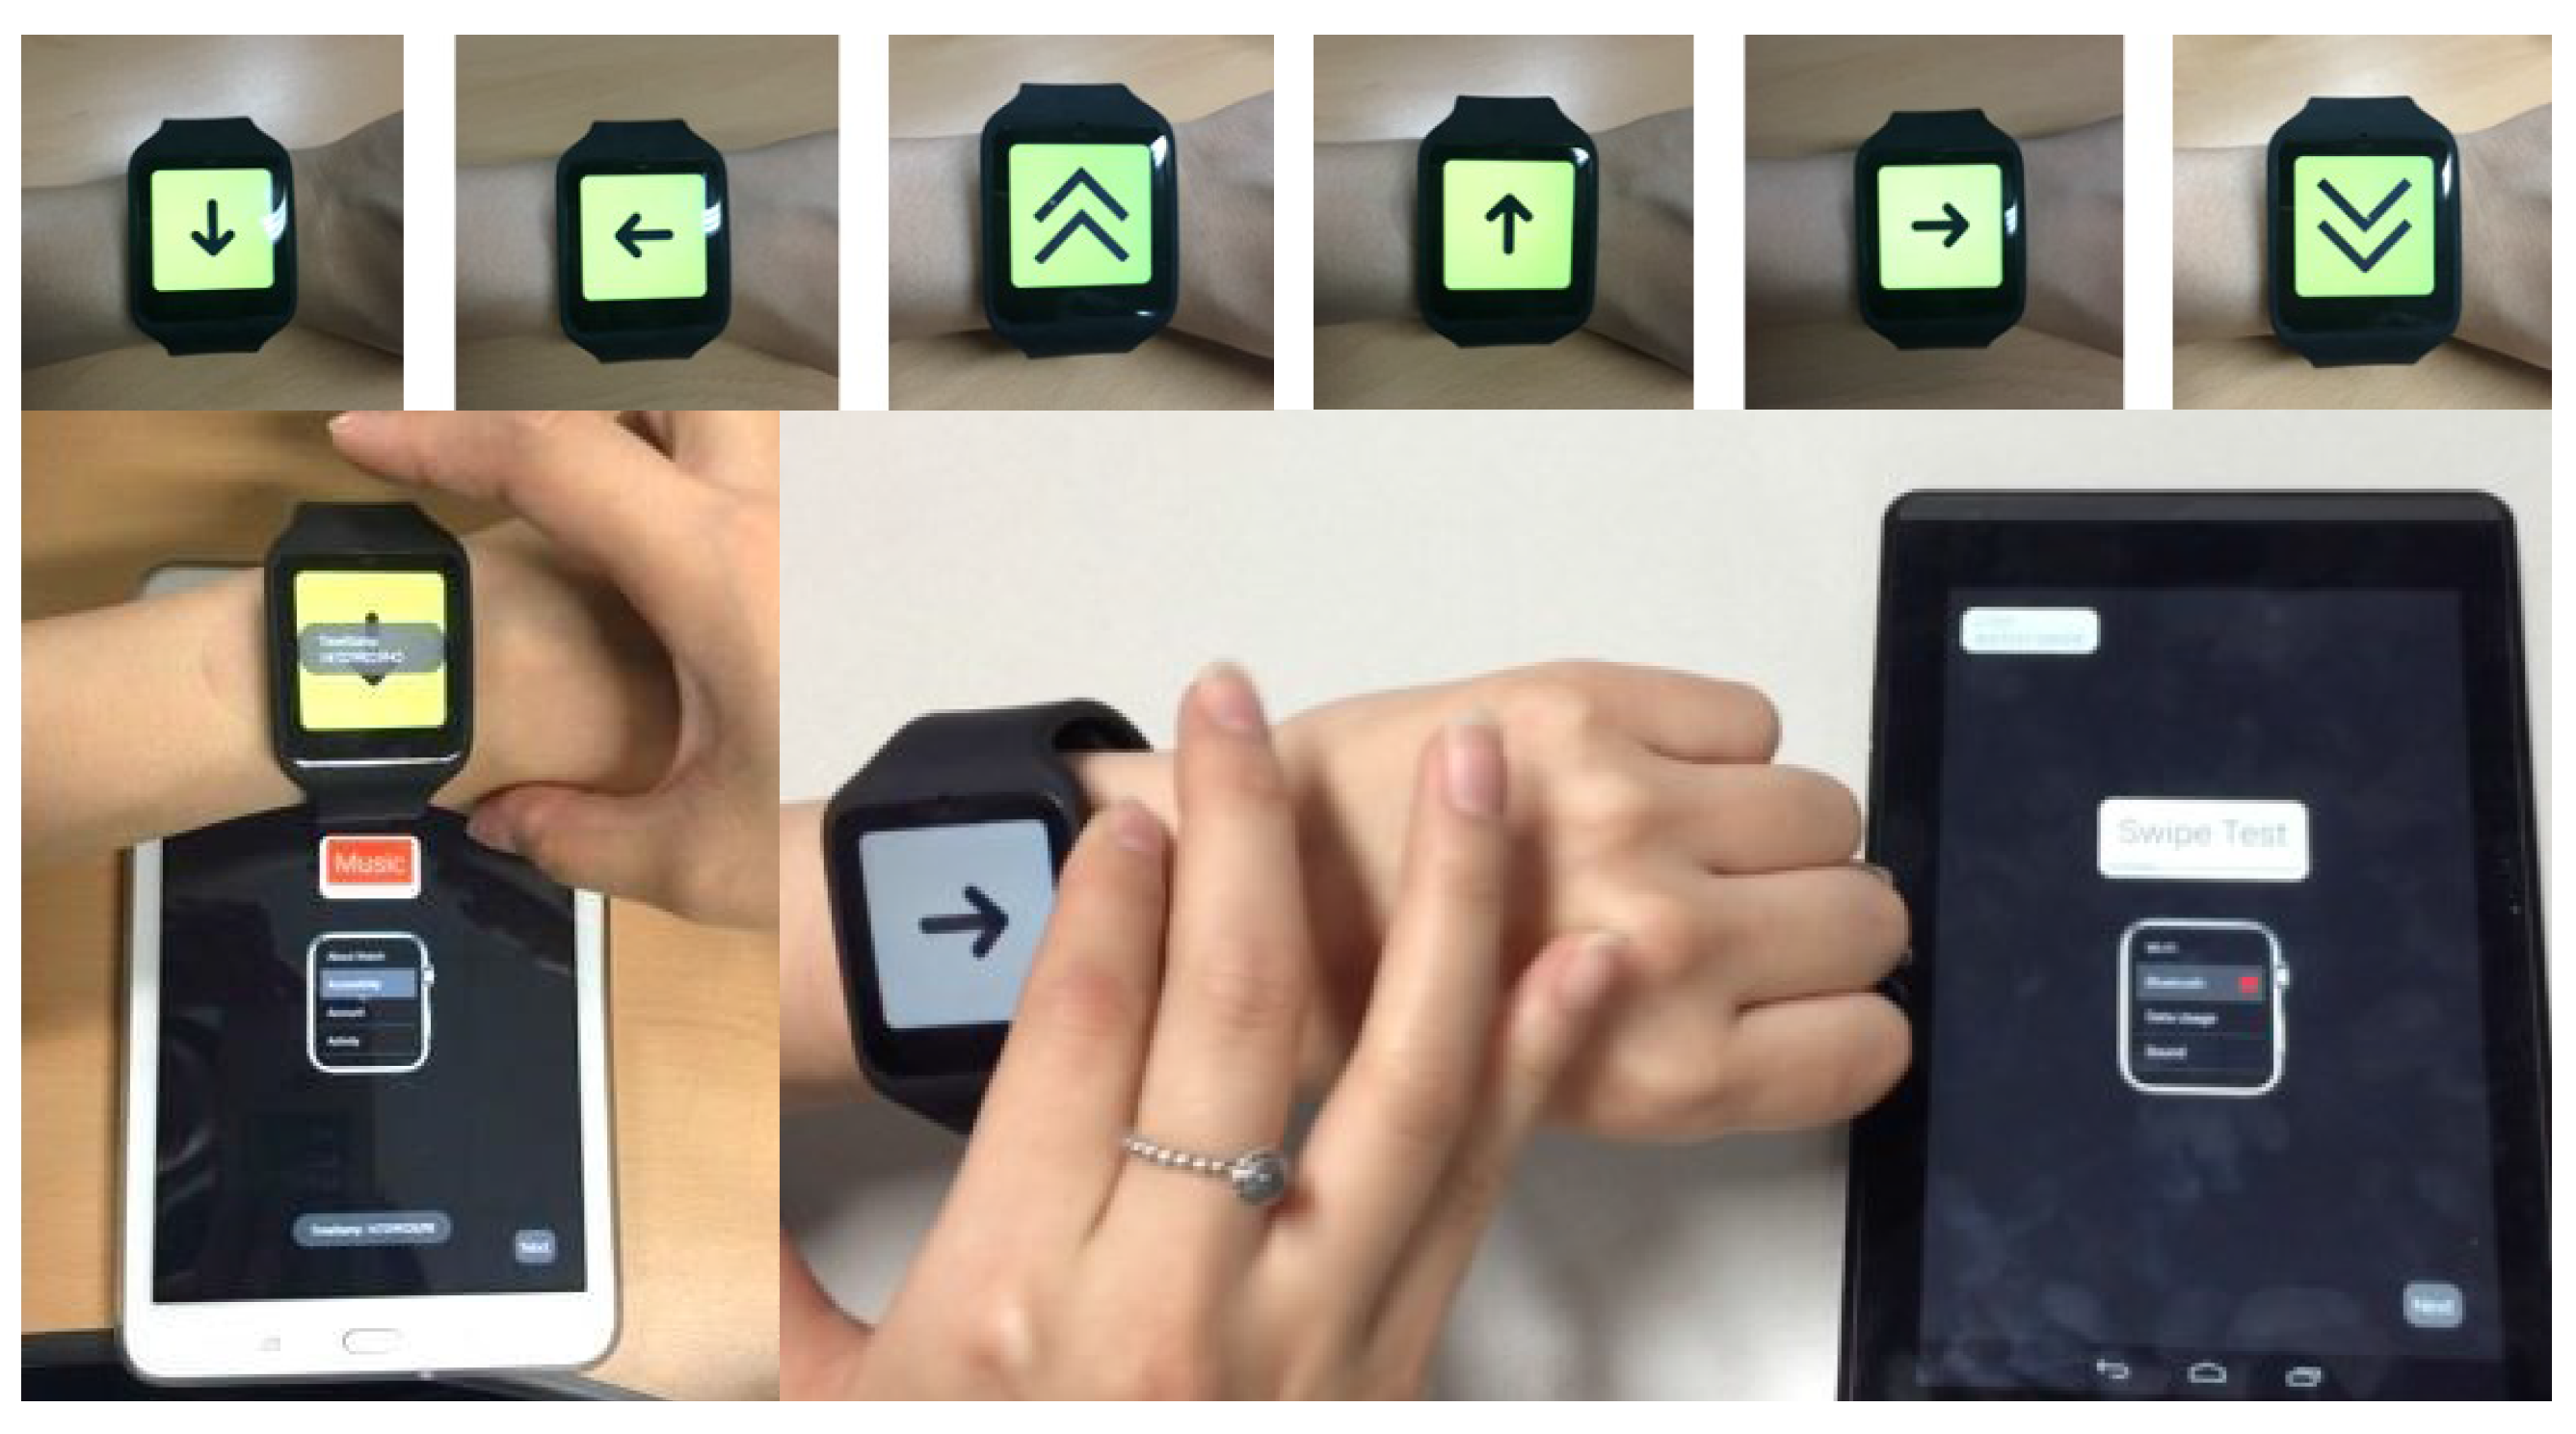
Figure 5.
Developed contactless IR-based prototypes.
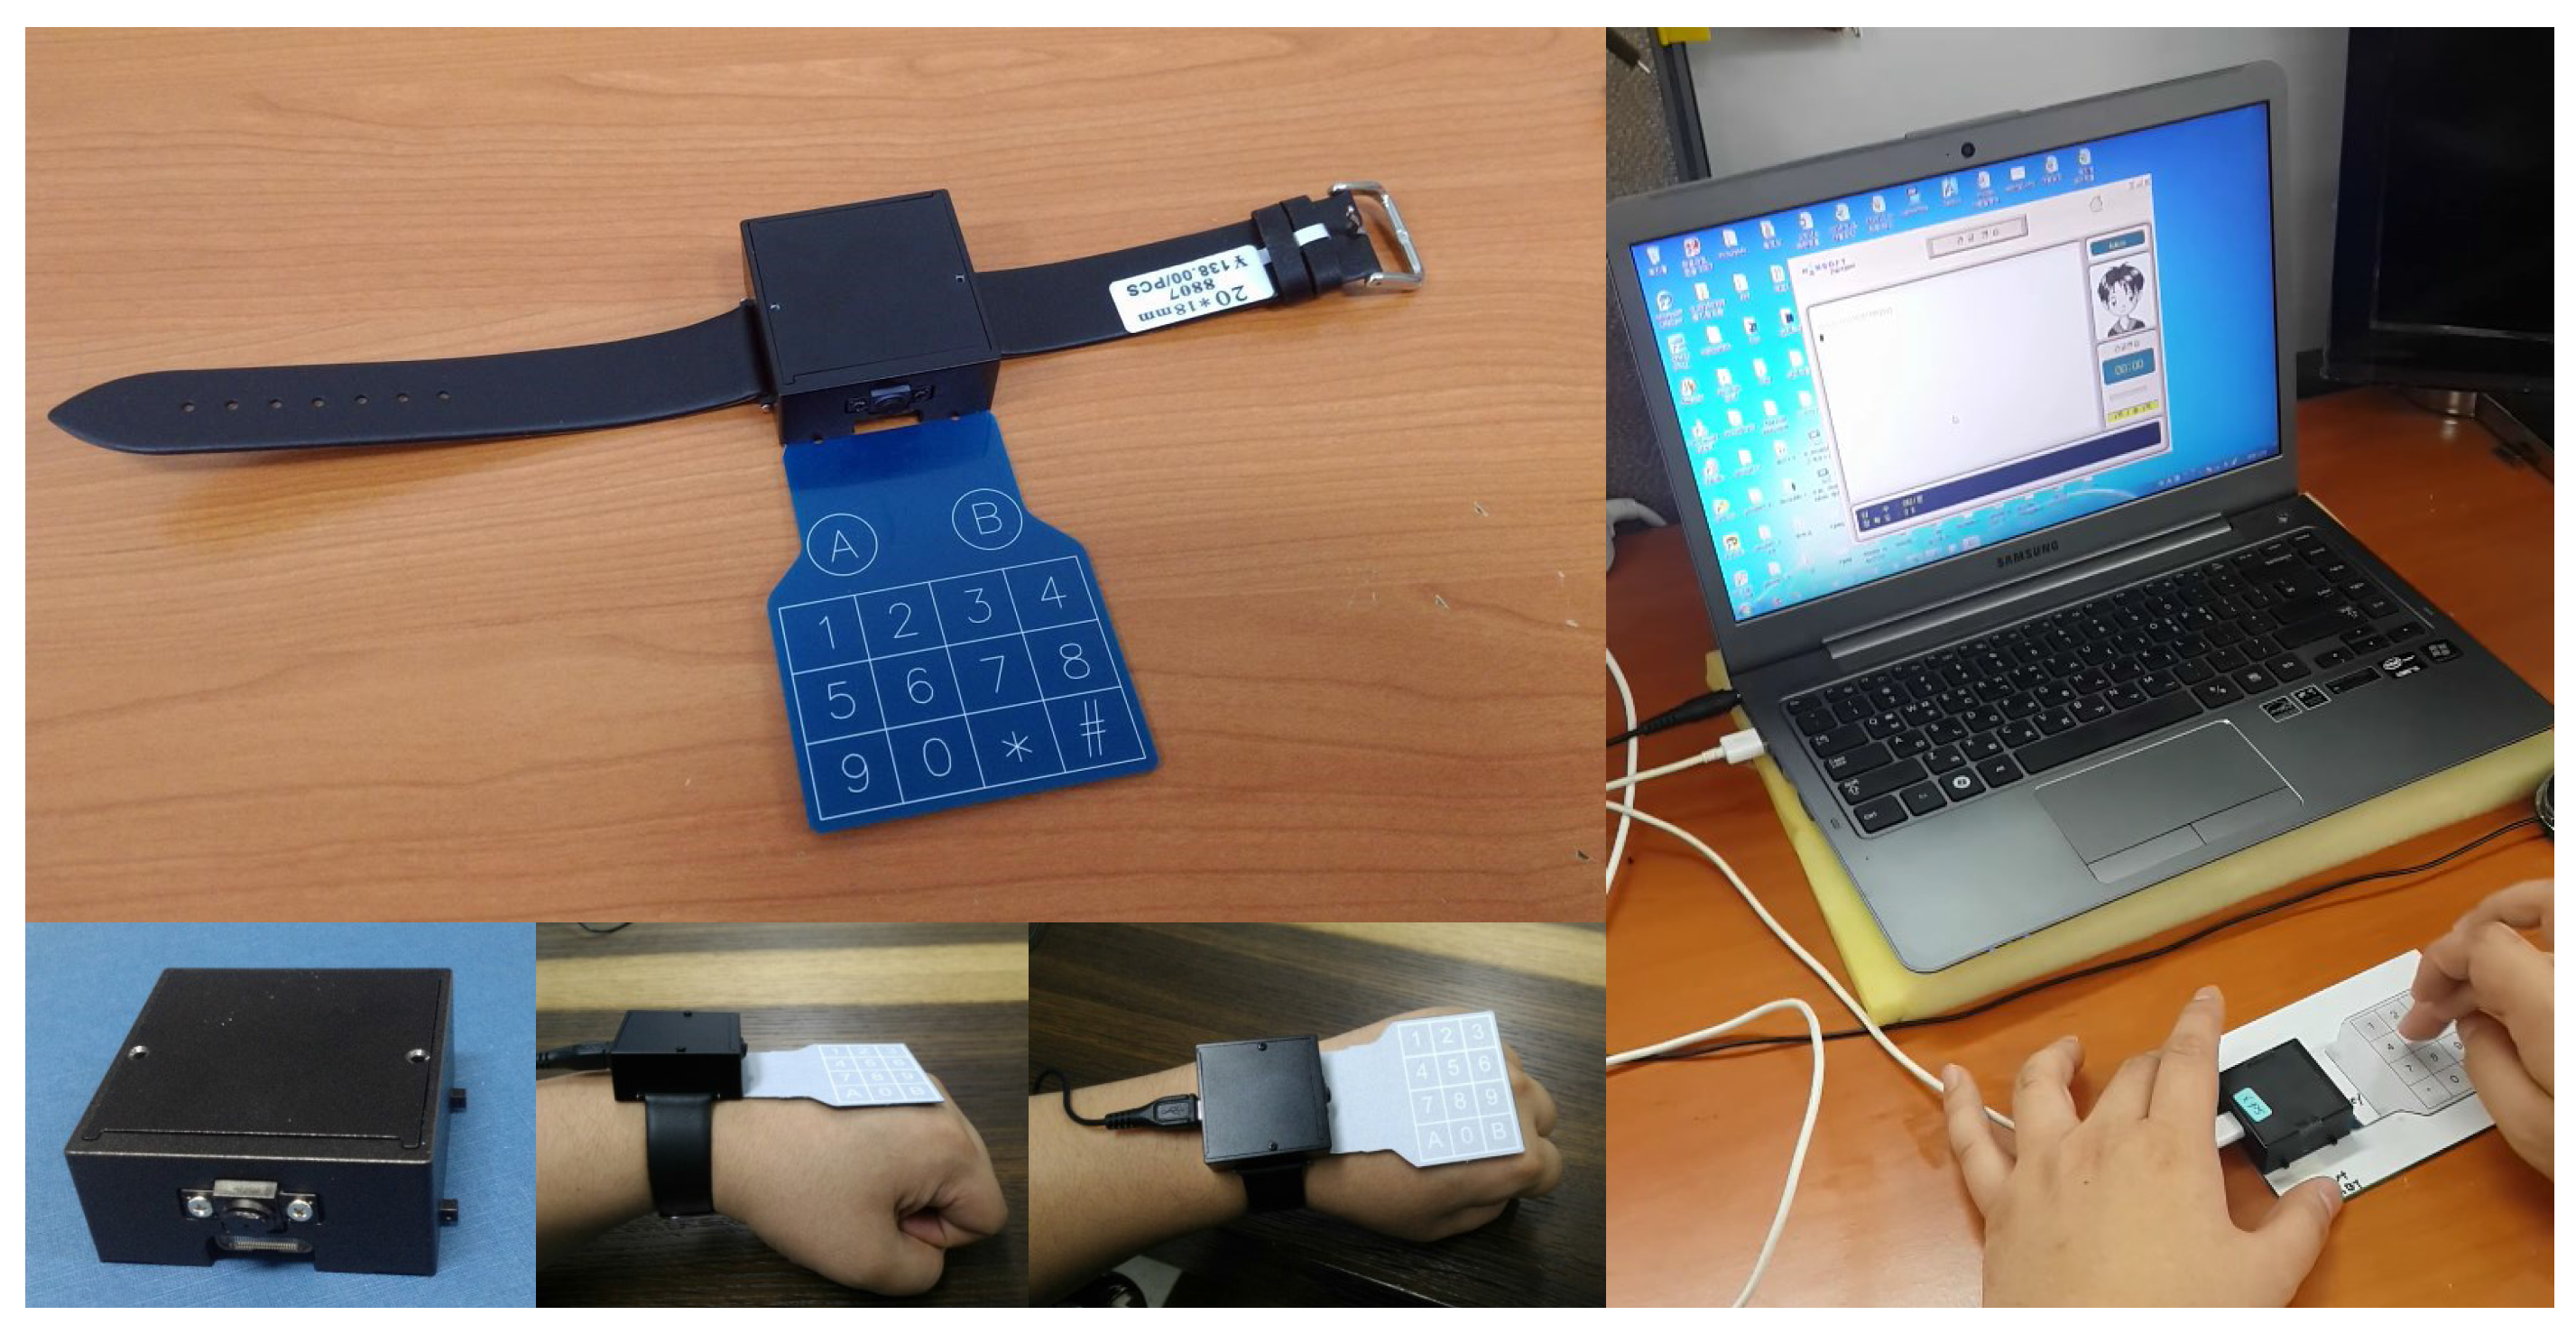
Figure 6.
The conceptual test framework to conduct the usability testing for wearable UI prototypes.
Figure 6.
The conceptual test framework to conduct the usability testing for wearable UI prototypes.
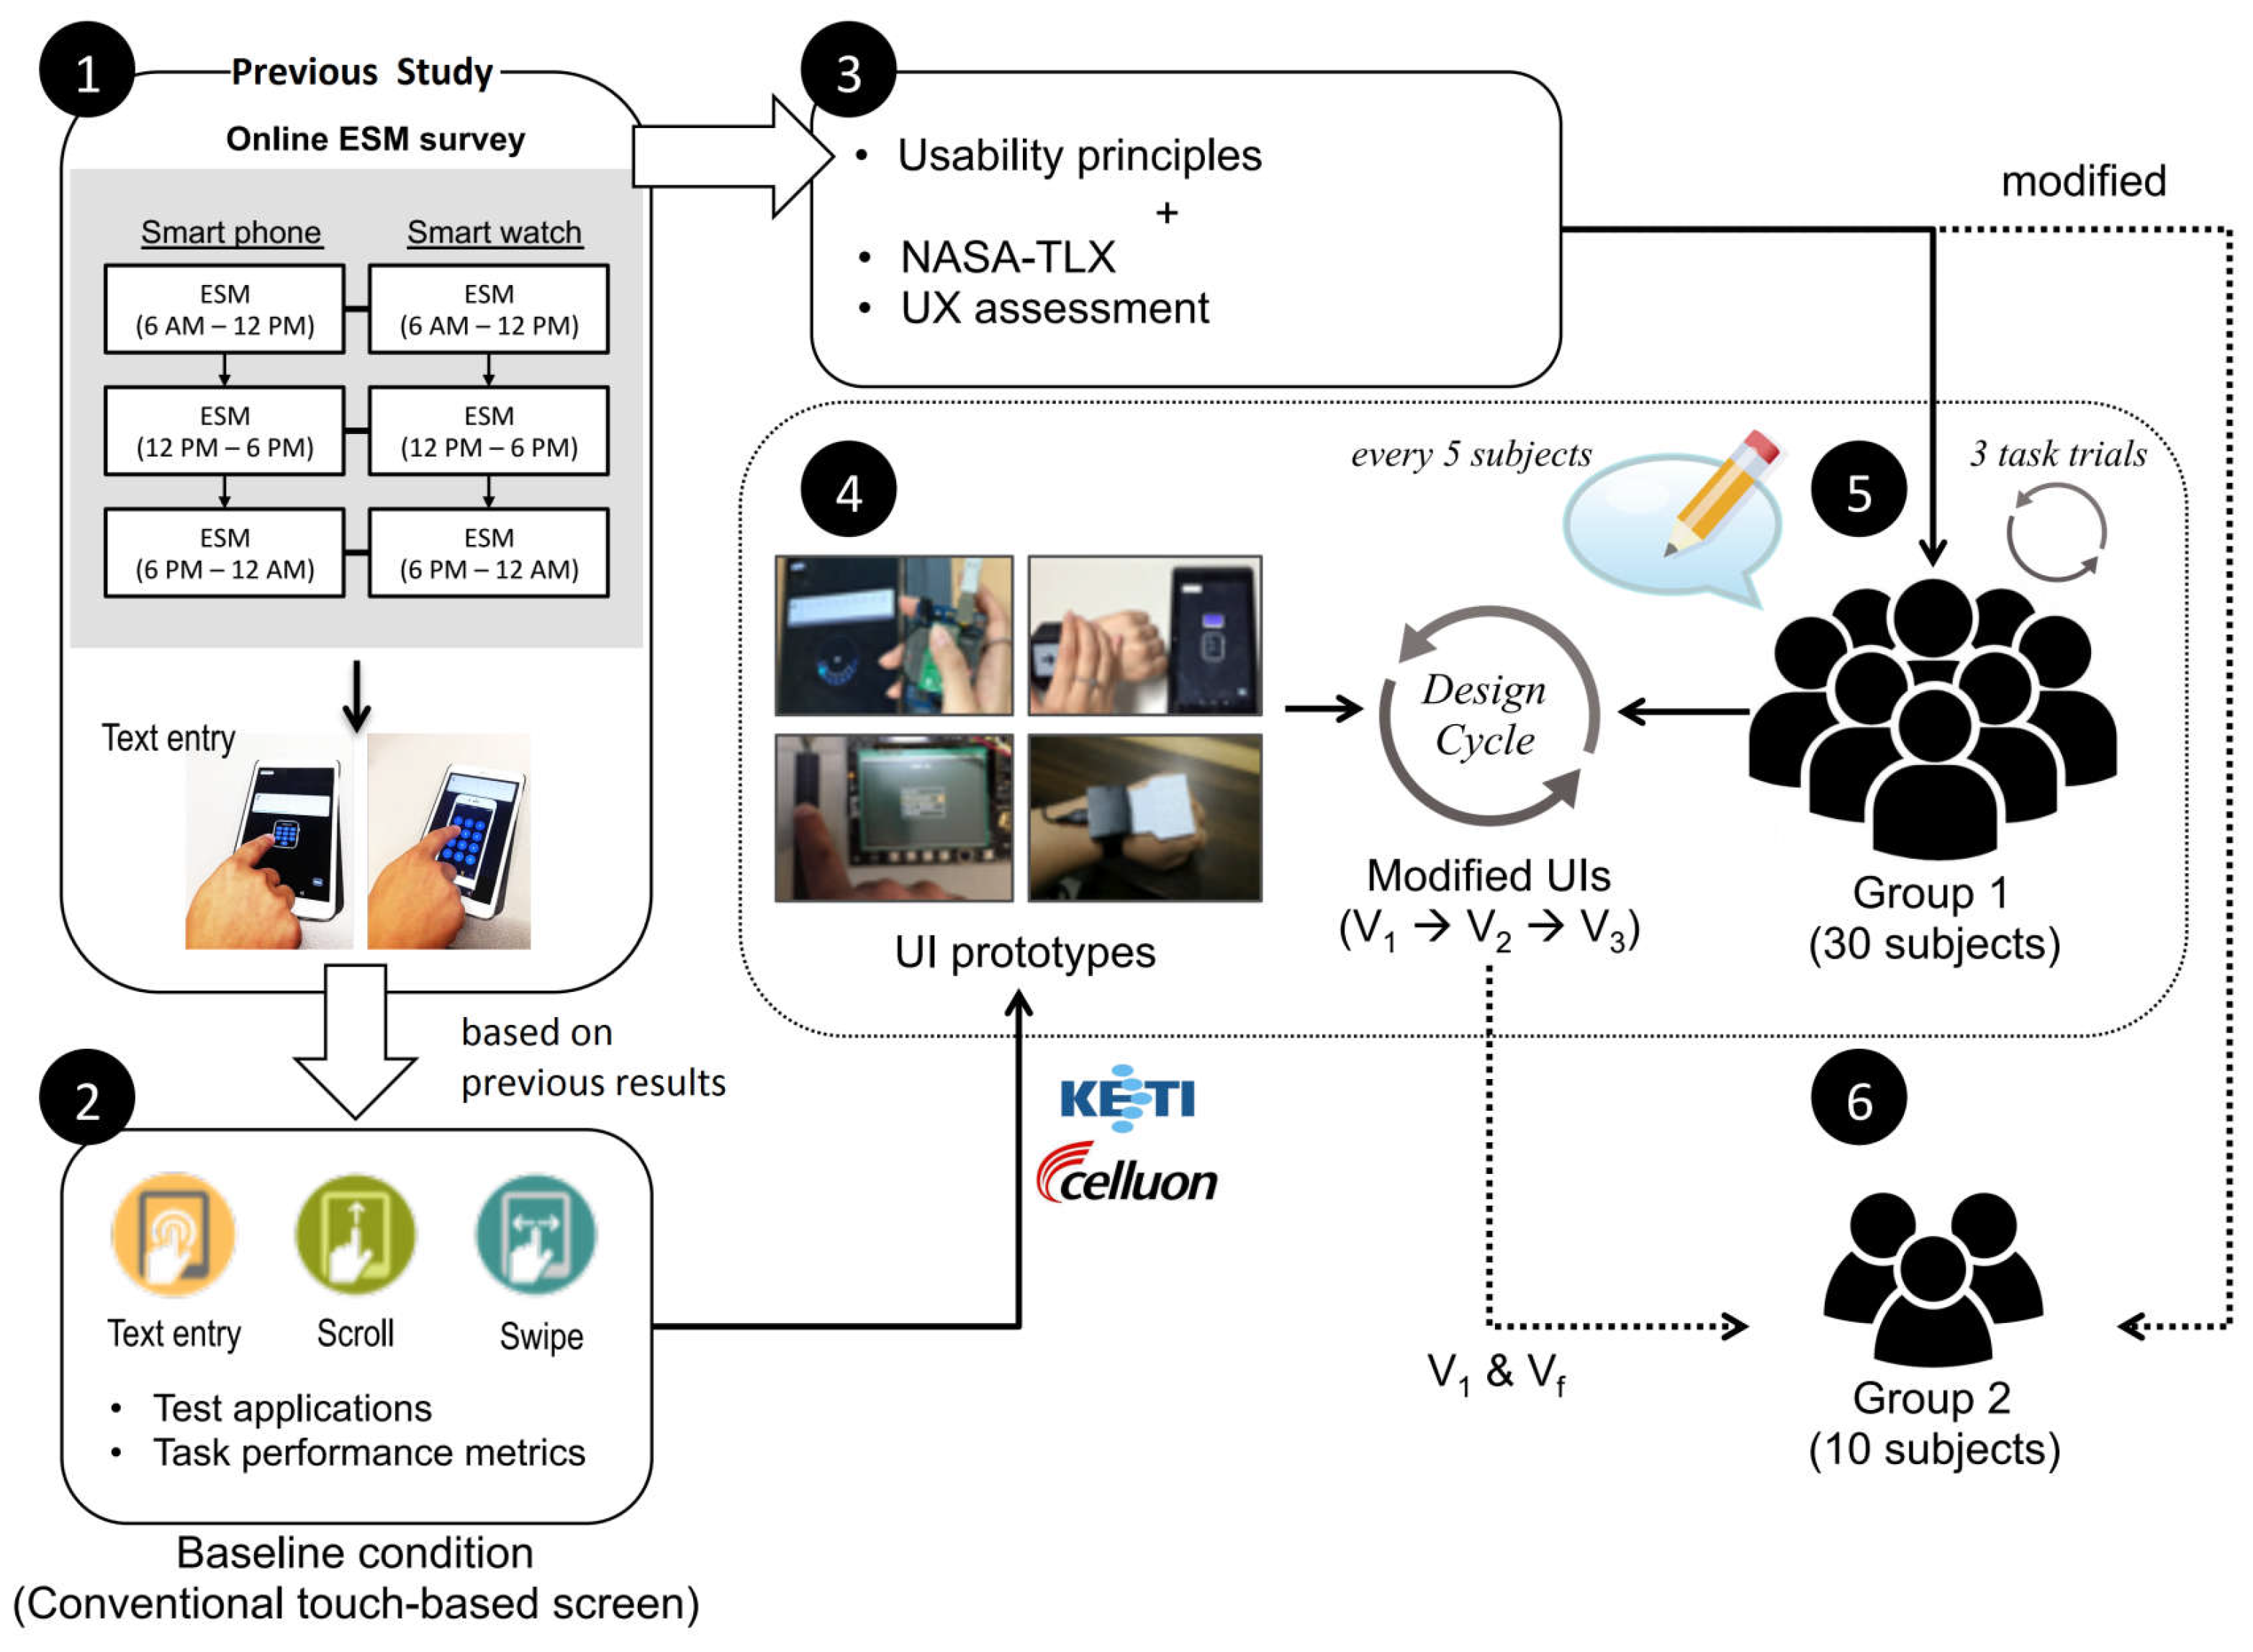
Figure 7.
Detailed framework for the first phase of the main experiment.

Figure 8.
Detailed framework for the second phase of the main experiment.

Figure 9.
Study participants were asked to perform number or Korean text entry, scrolling and swiping tasks with the proposed UI prototypes; fill out a set of structured questionnaires; and participate in an interview session.
Figure 9.
Study participants were asked to perform number or Korean text entry, scrolling and swiping tasks with the proposed UI prototypes; fill out a set of structured questionnaires; and participate in an interview session.

Figure 10.
Exemplar illustrations of (a) Number Entry Task, (b) Scrolling Task, (c) Swiping Task on traditional touch-based screen (i.e., baseline condition), and (d) Korean Text Entry Task, presented for Joystick UI.
Figure 10.
Exemplar illustrations of (a) Number Entry Task, (b) Scrolling Task, (c) Swiping Task on traditional touch-based screen (i.e., baseline condition), and (d) Korean Text Entry Task, presented for Joystick UI.

Figure 11.
The structure of our survey sessions for the UI/UX assessment and evaluation.

Figure 12.
A screenshot of our task workload assessment test-bed that we built with JavaScript.

Figure 13.
The multi-touch gestures dealt with in the second stage of the interview session. (a) Pan; (b) Pinch and unpinch; (c) Rotate; (d) Wrist flick.
Figure 13.
The multi-touch gestures dealt with in the second stage of the interview session. (a) Pan; (b) Pinch and unpinch; (c) Rotate; (d) Wrist flick.

Figure 14.
This participant breakdown chart displays subject IDs in the columns. The rows show tasks per UI types that each subject has participated in the study. The rows also show different prototype versions used for each task.
Figure 14.
This participant breakdown chart displays subject IDs in the columns. The rows show tasks per UI types that each subject has participated in the study. The rows also show different prototype versions used for each task.
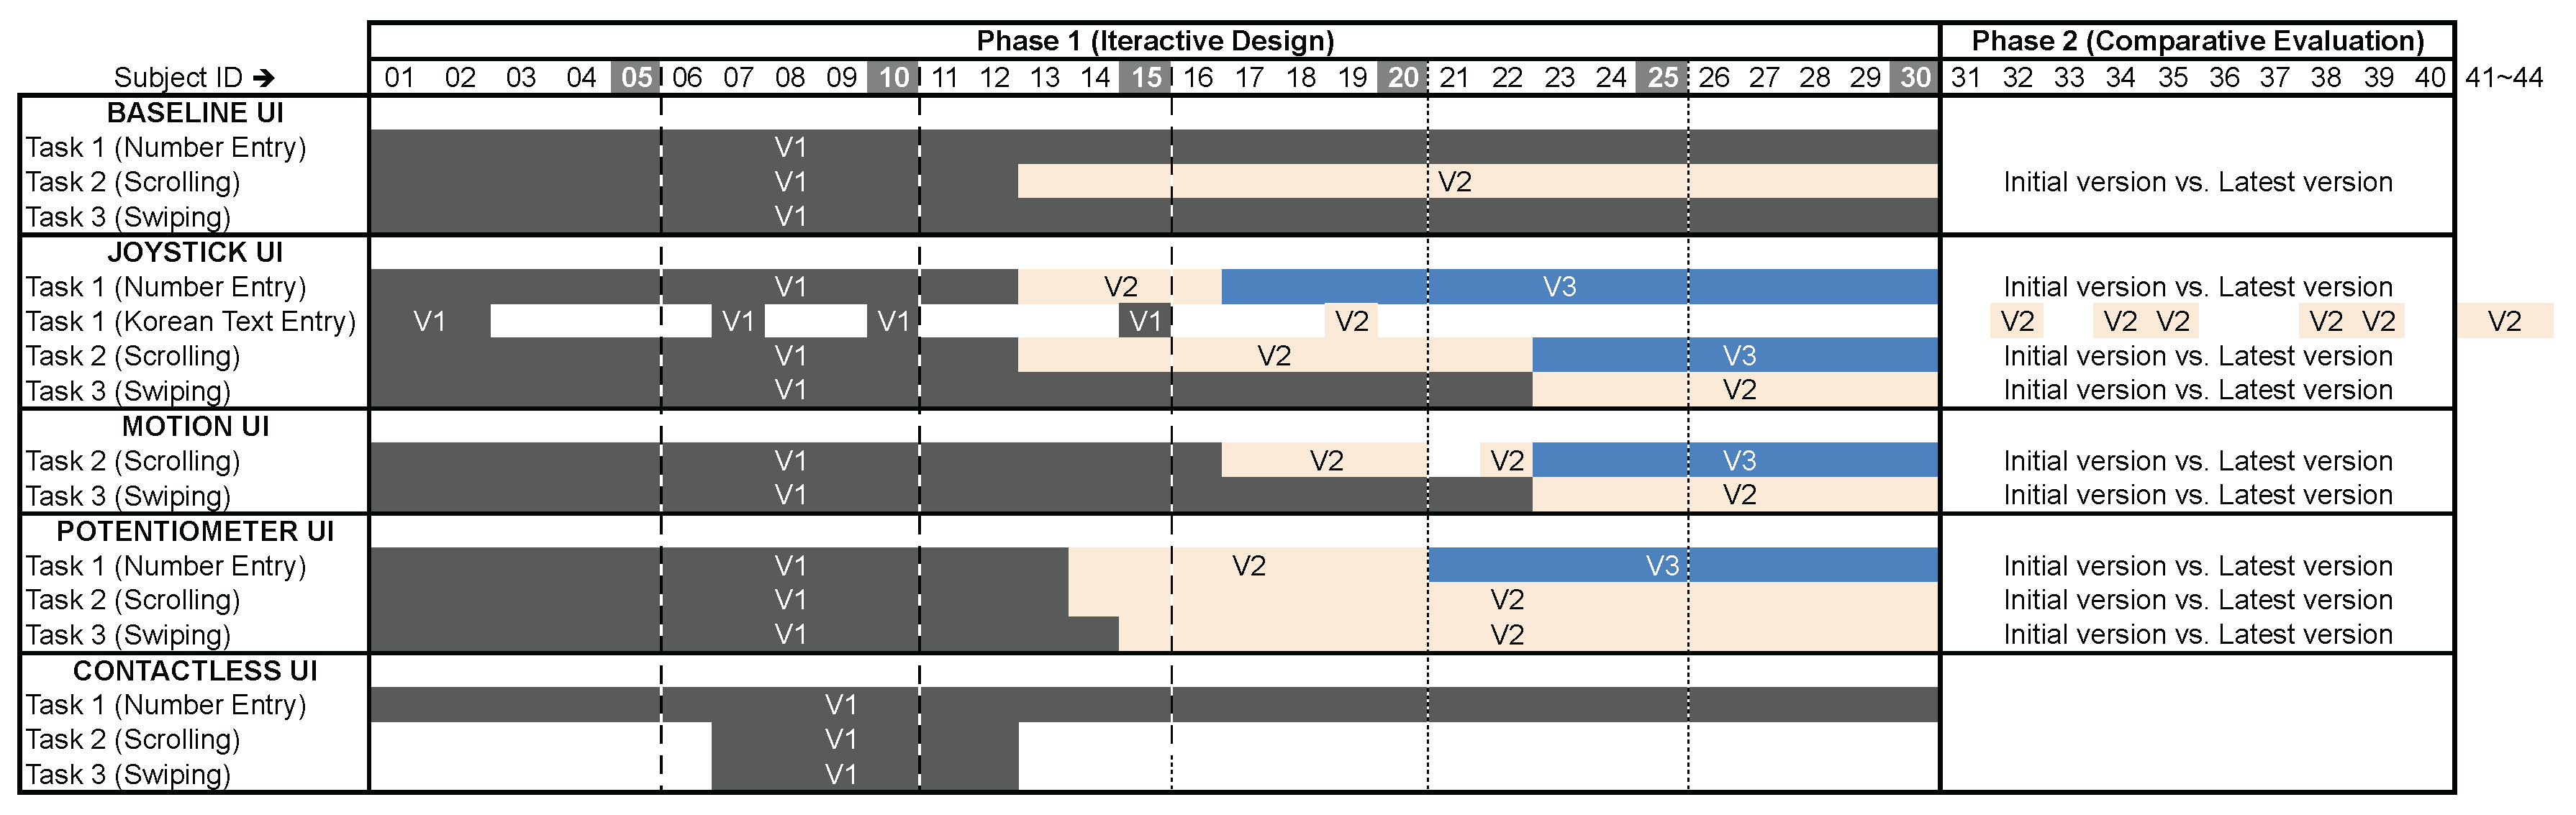
Figure 15.
Rating scores for number entry task, scrolling task and swiping task.

Figure 16.
Overall task workload in number entry task, scrolling task and swiping task.
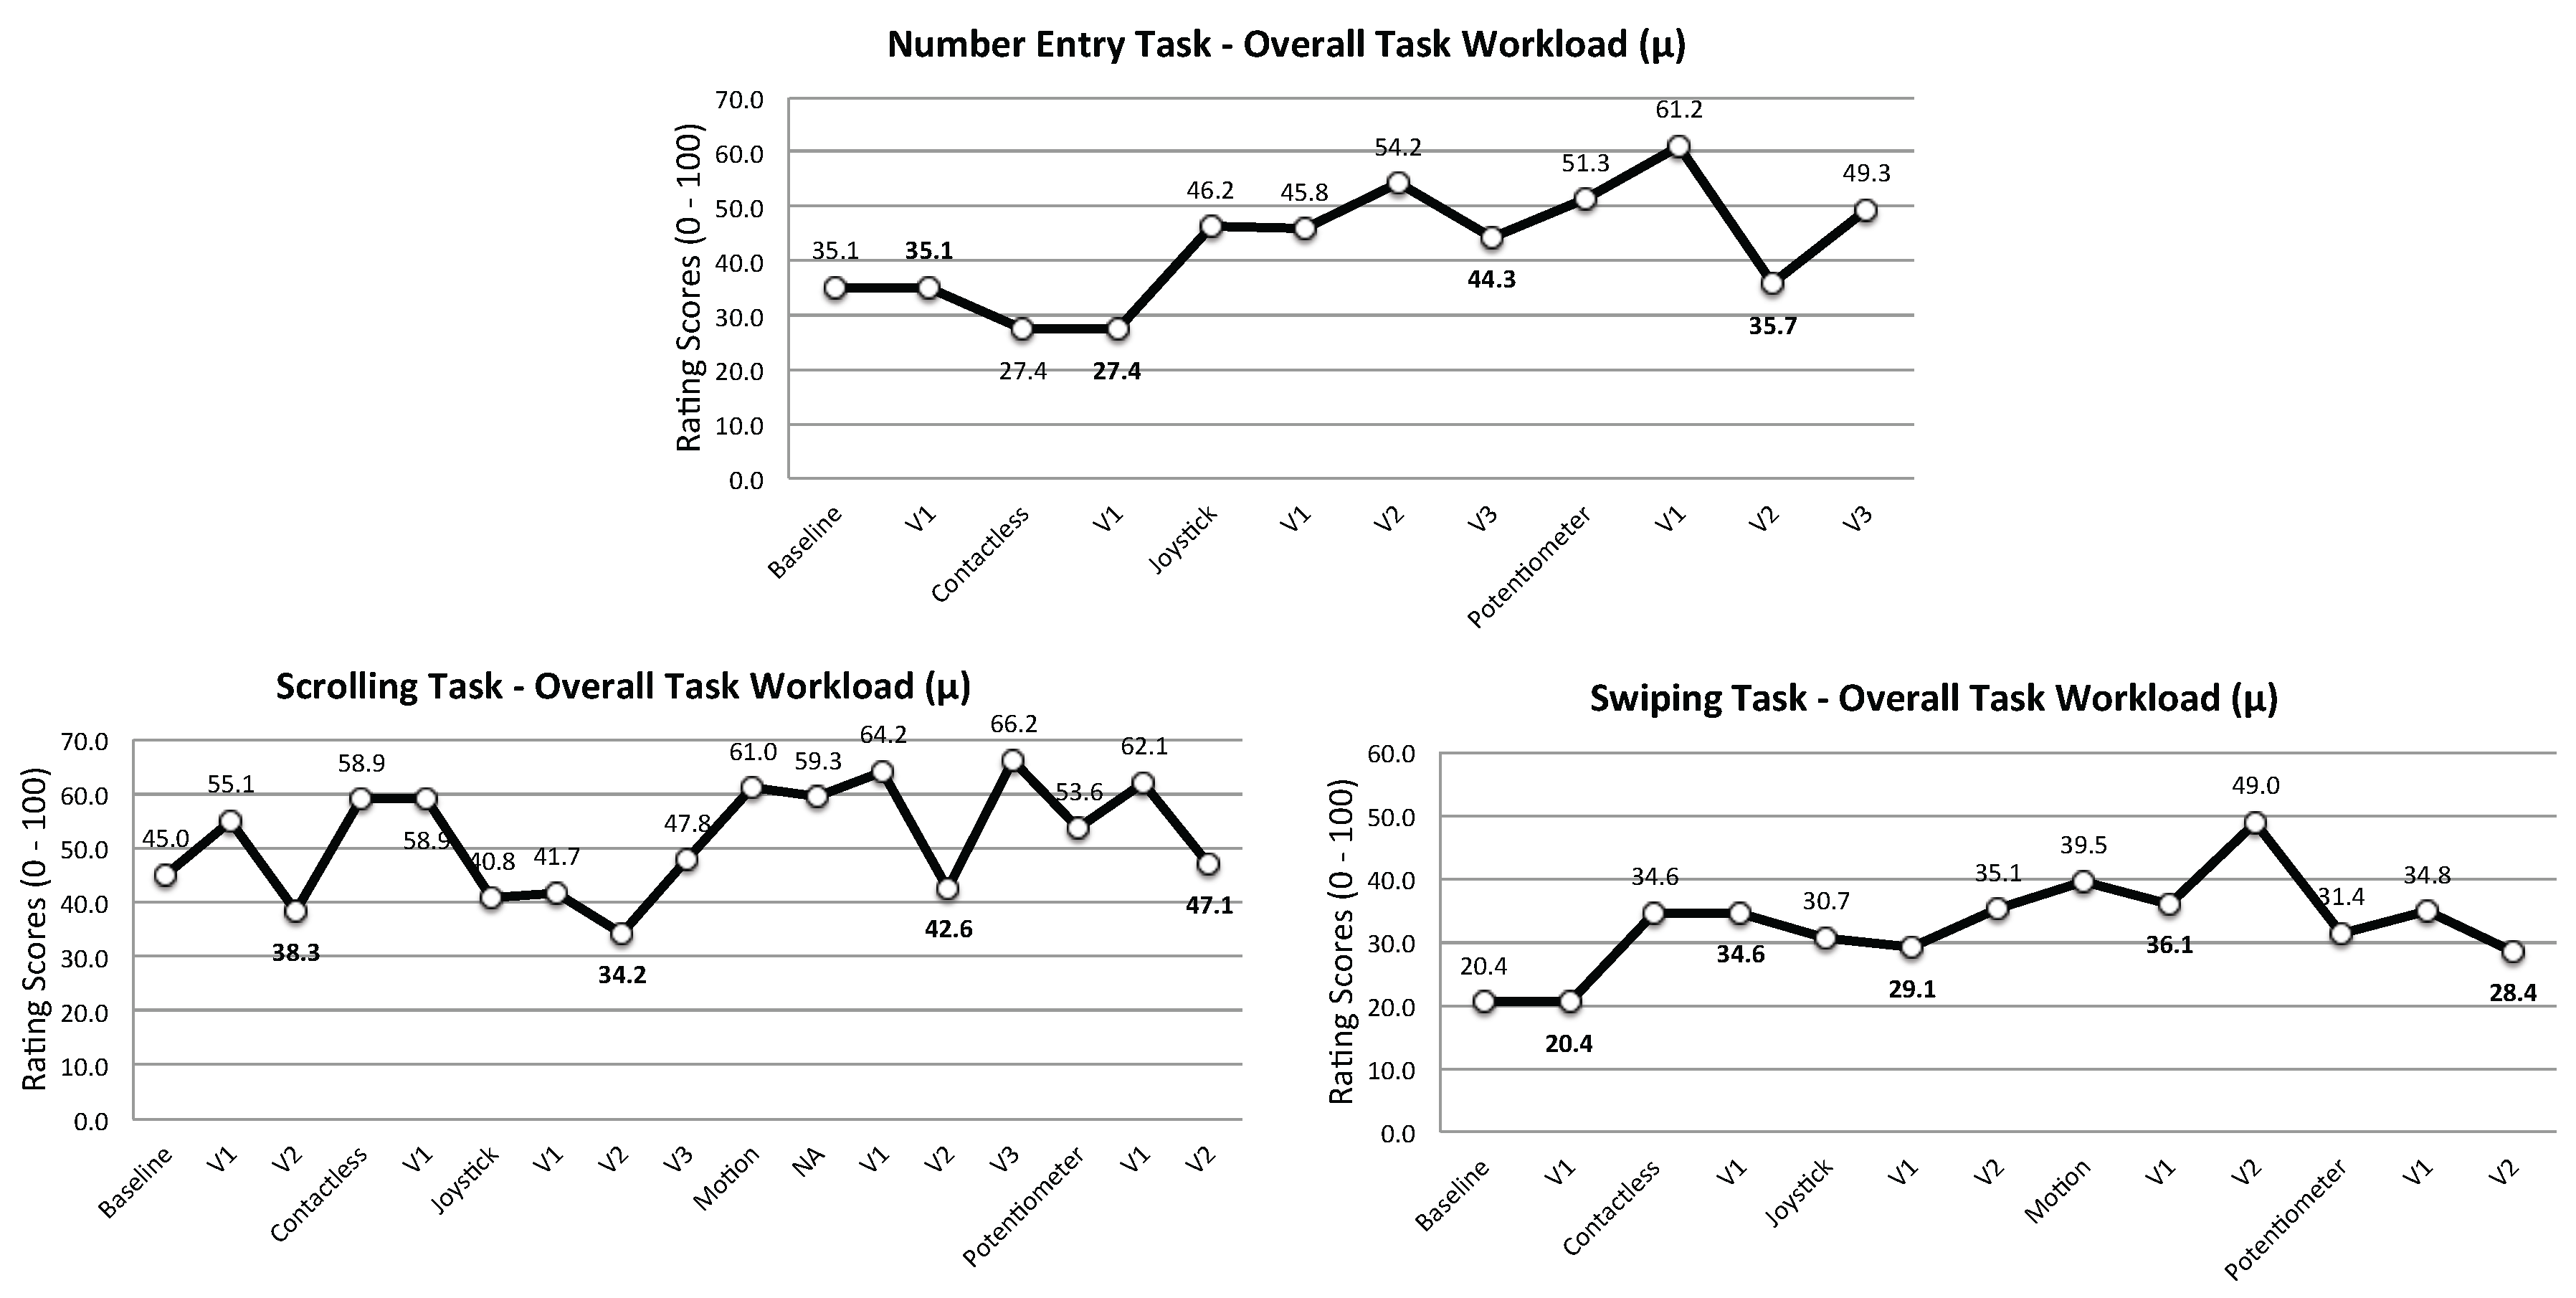
Figure 17.
Usability principle evaluation.

Figure 18.
User experience assessment of three tasks.

Figure 19.
Participants’ rating results for Usability, Performance and Workload.

Figure 20.
Participants’ rating results for Adaptability, Eliminates the SDFF problem, Willing to Switch and Competitiveness.
Figure 20.
Participants’ rating results for Adaptability, Eliminates the SDFF problem, Willing to Switch and Competitiveness.
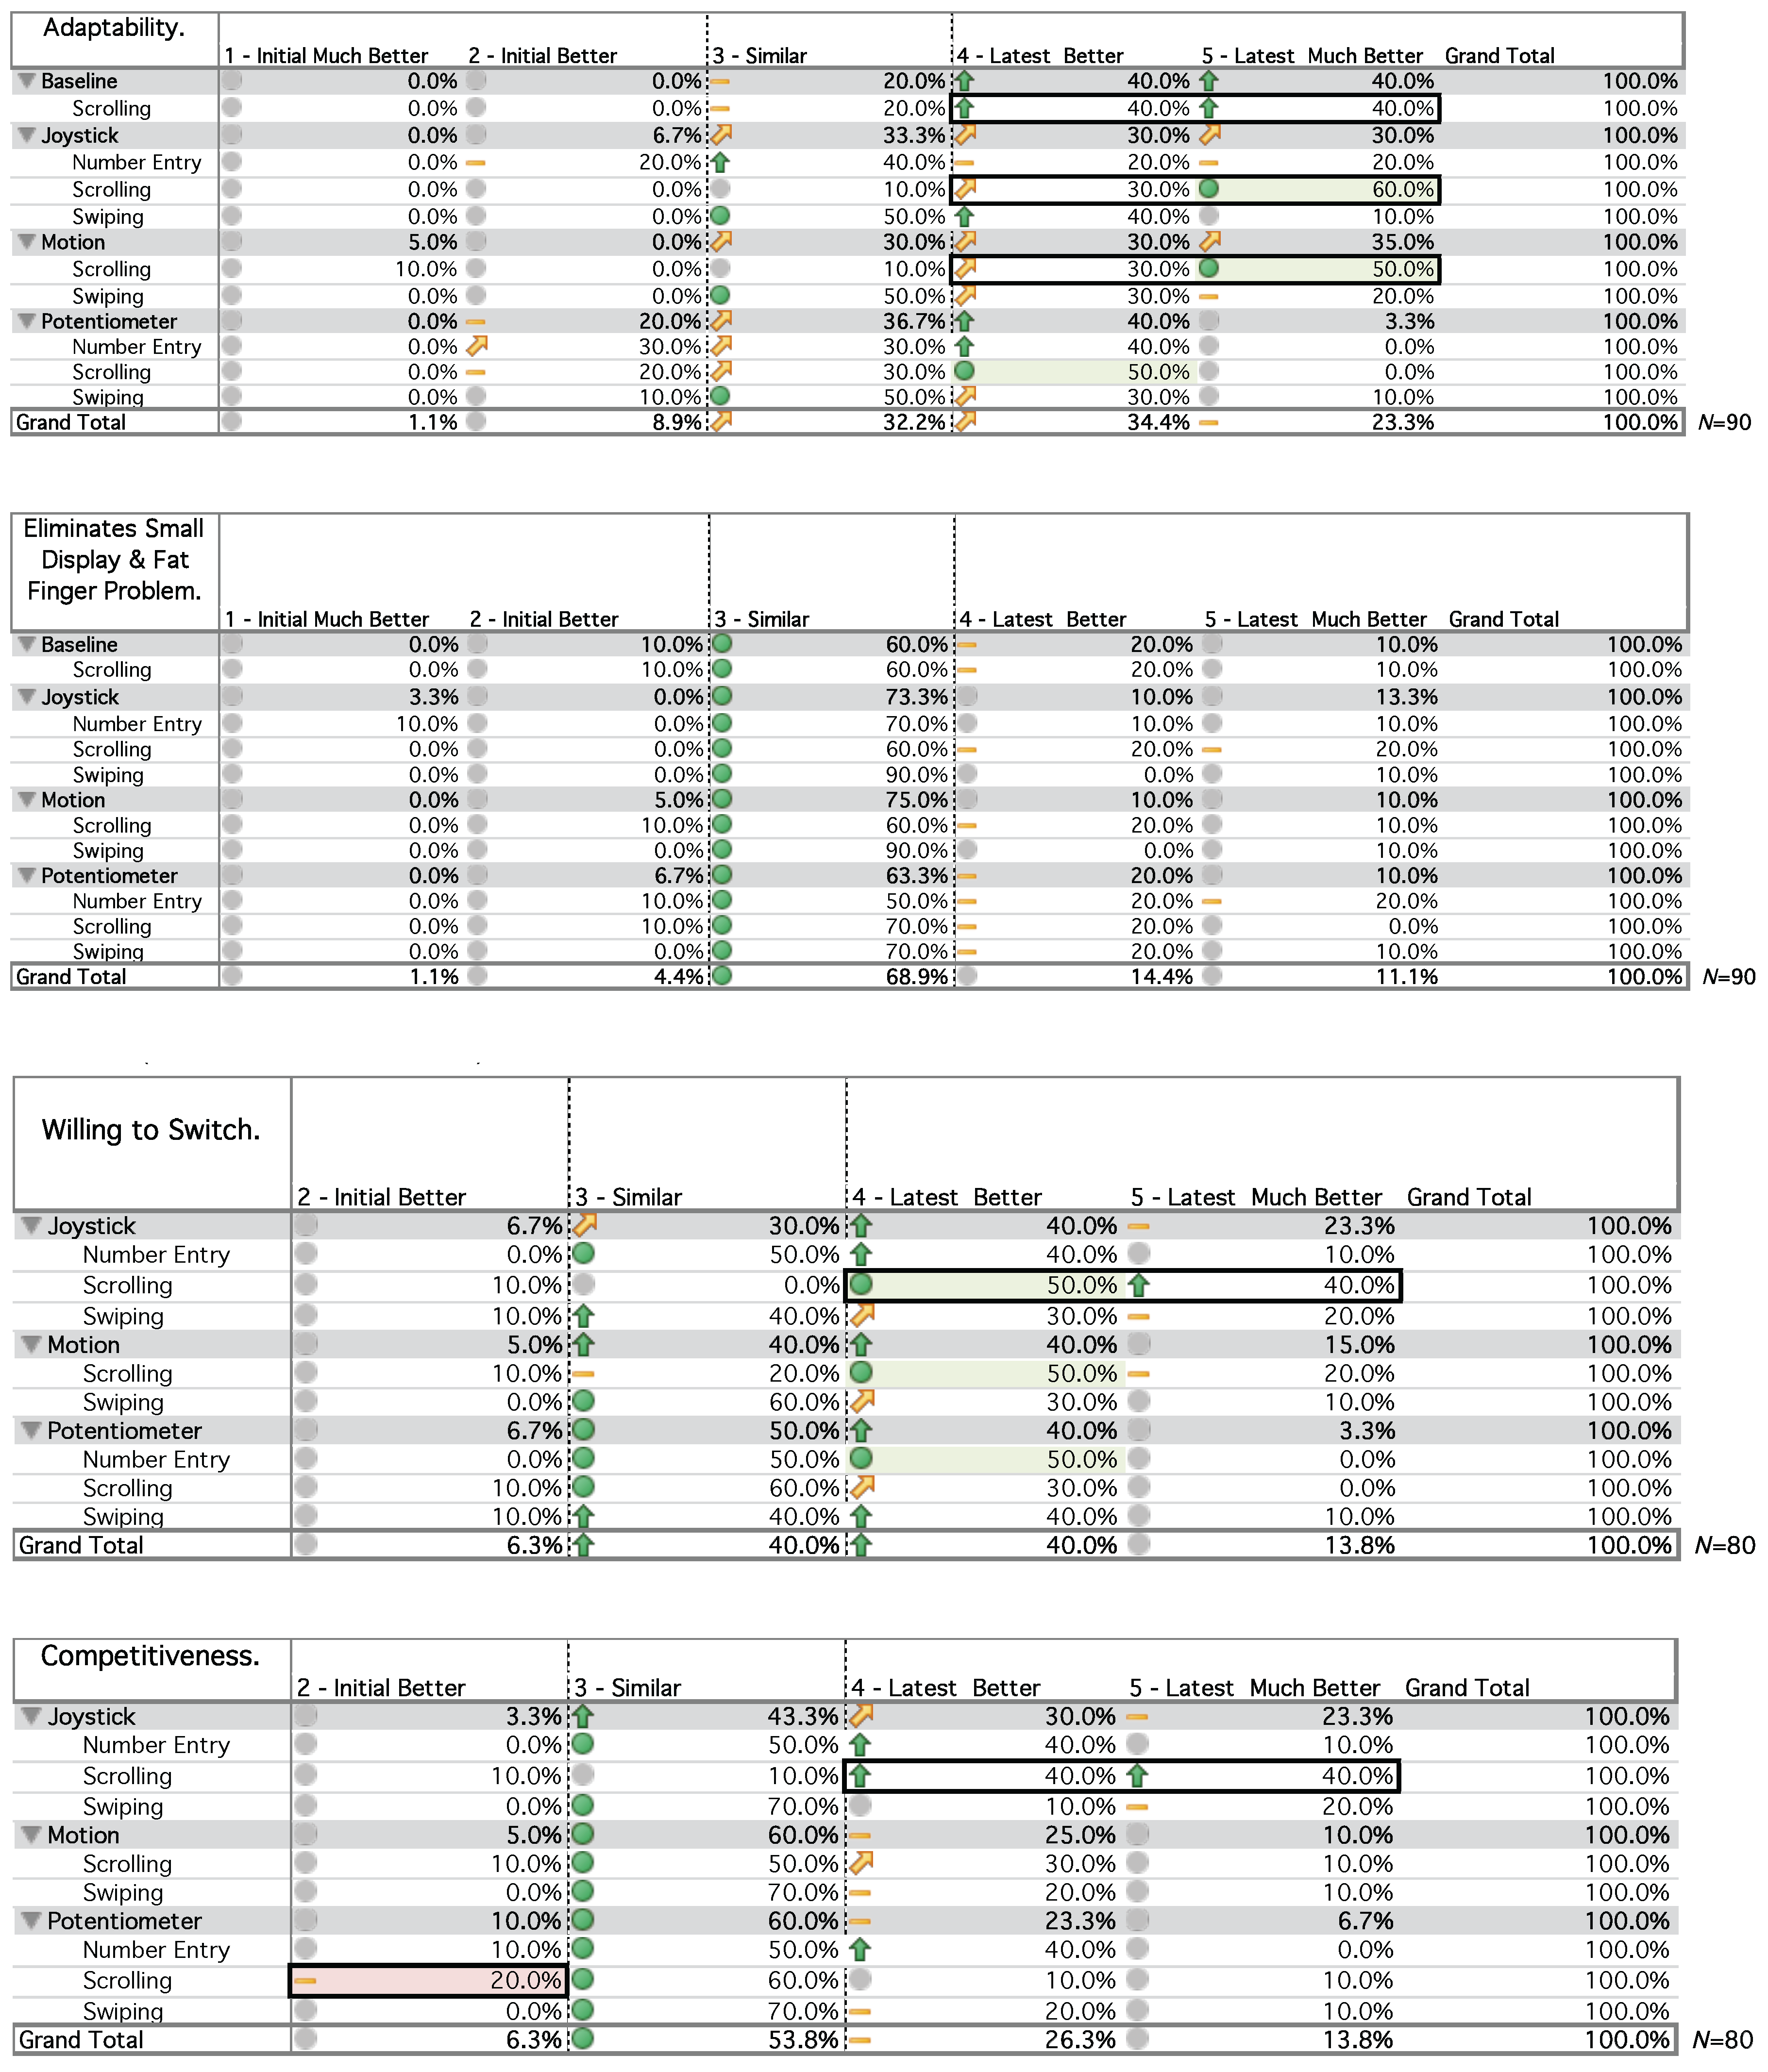
Figure 21.
Reduction in overall task workload.
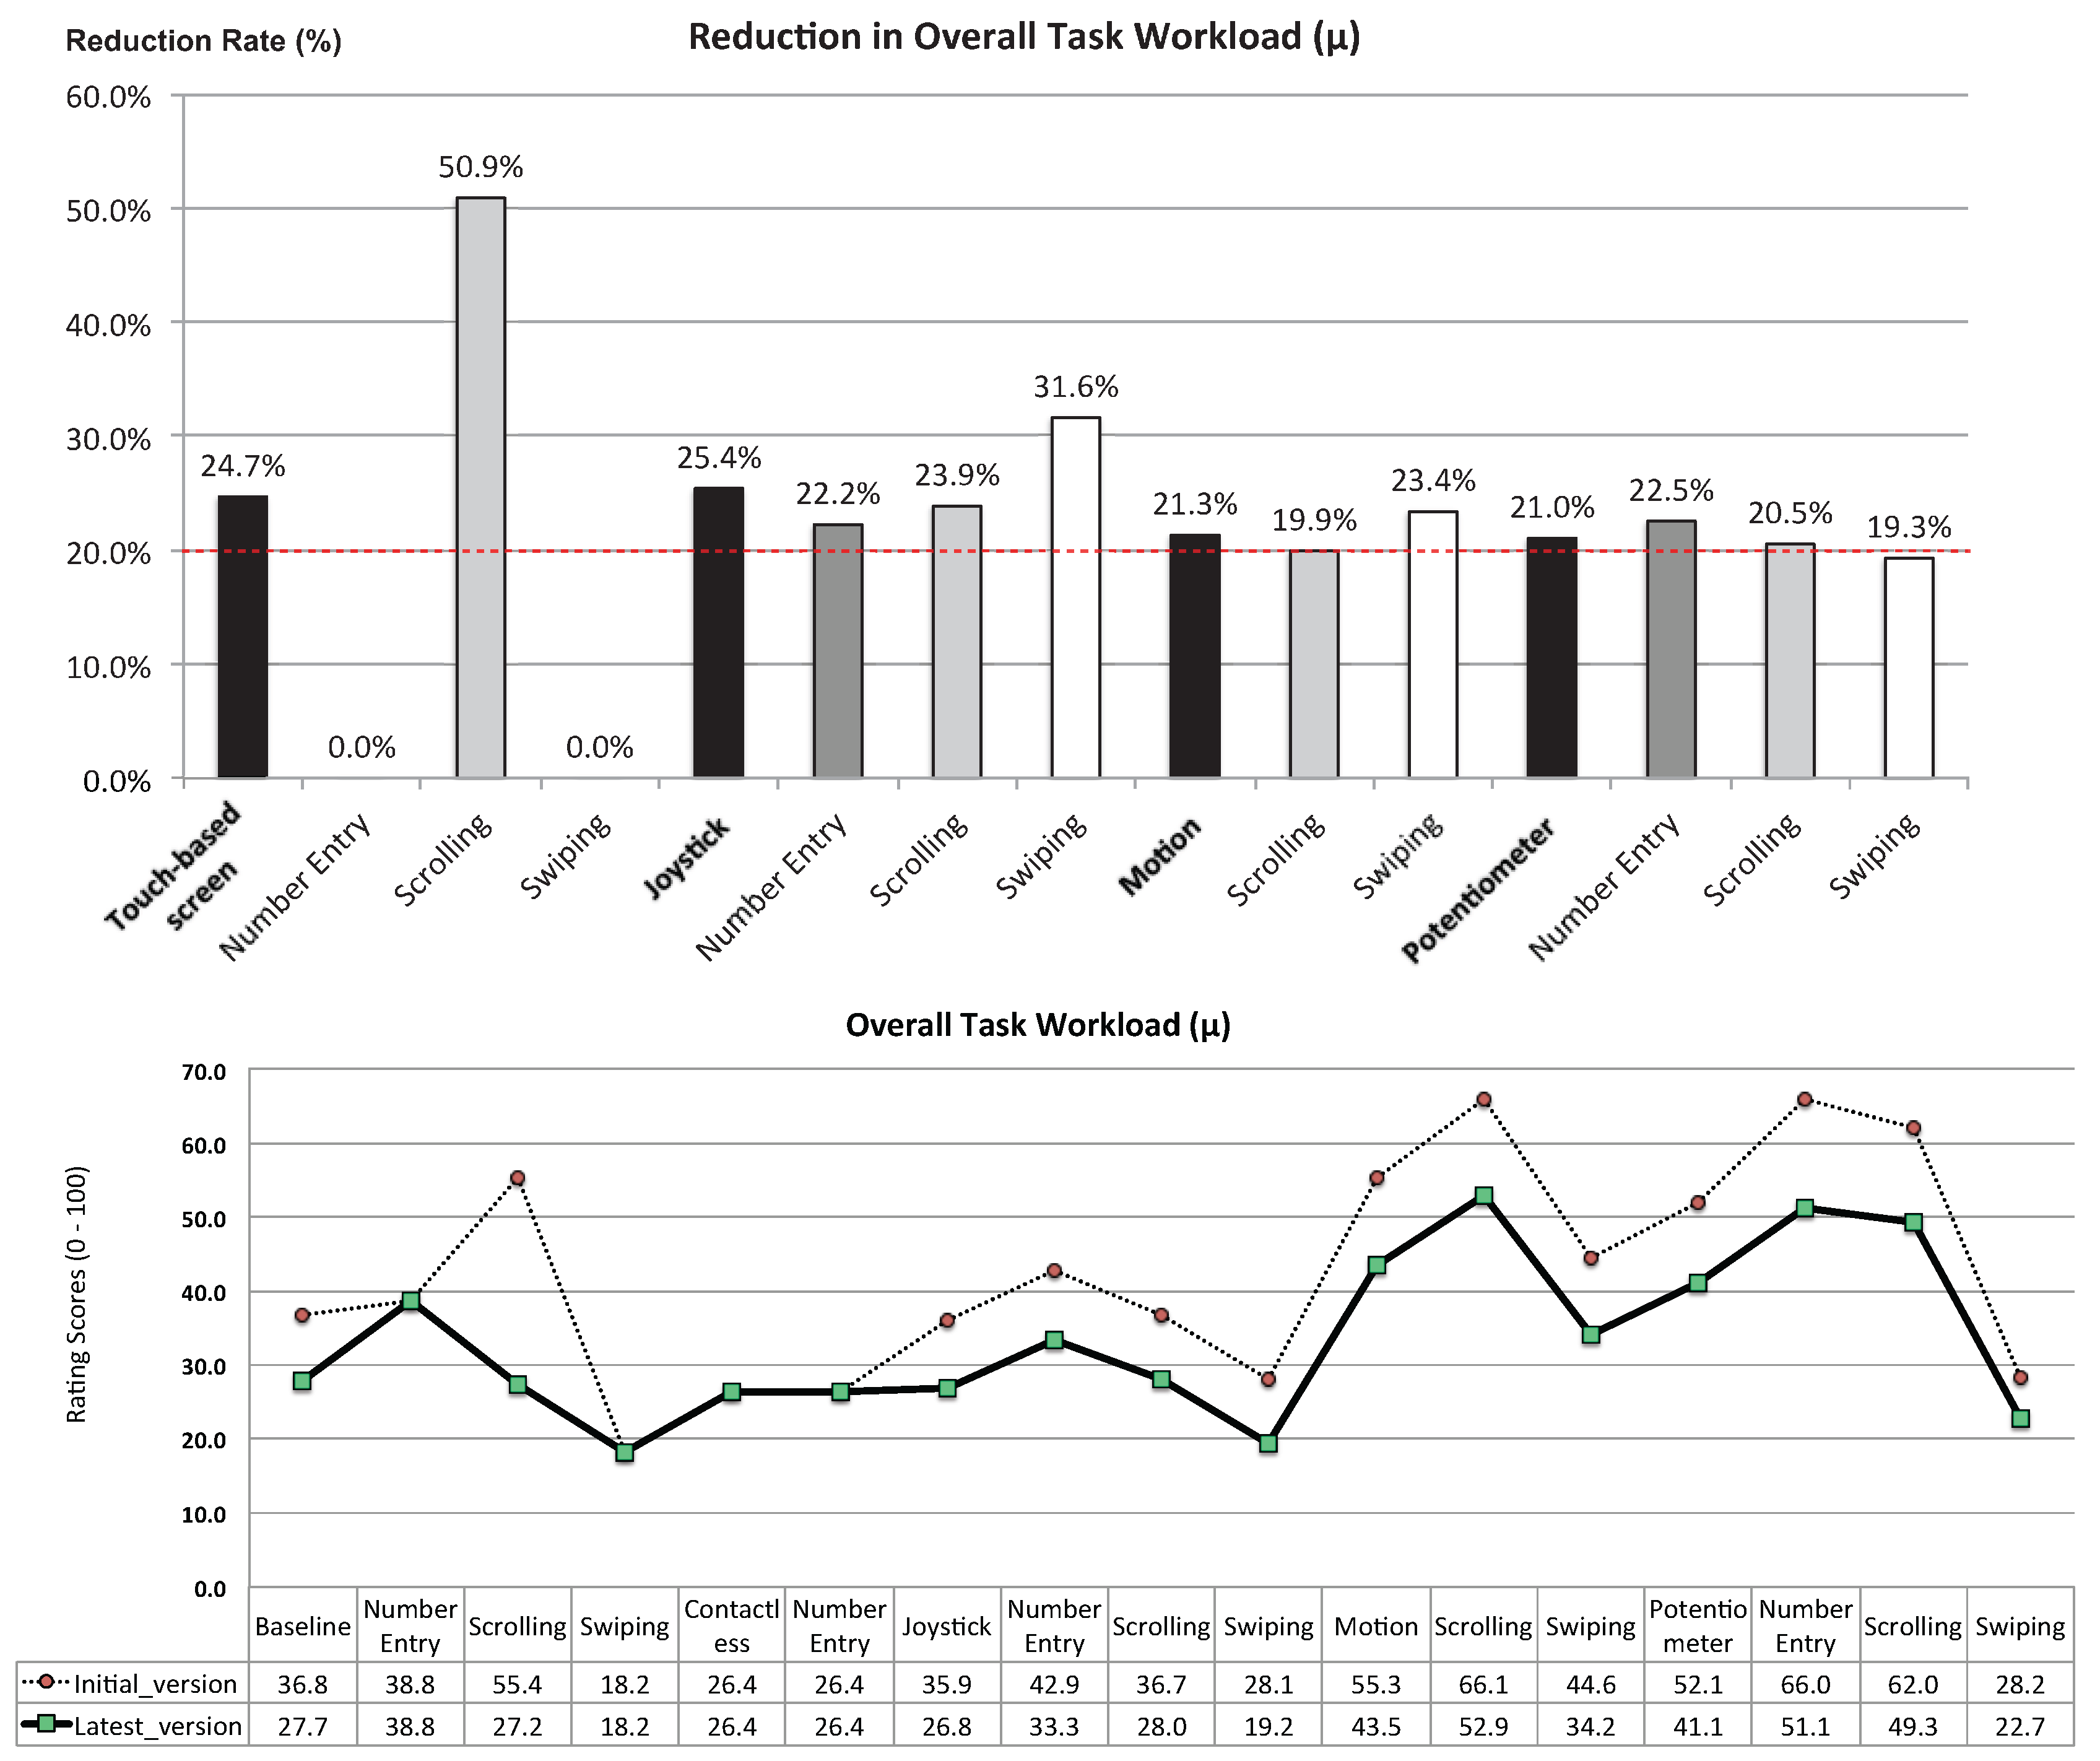
Figure 22.
Reduction in mental demand.
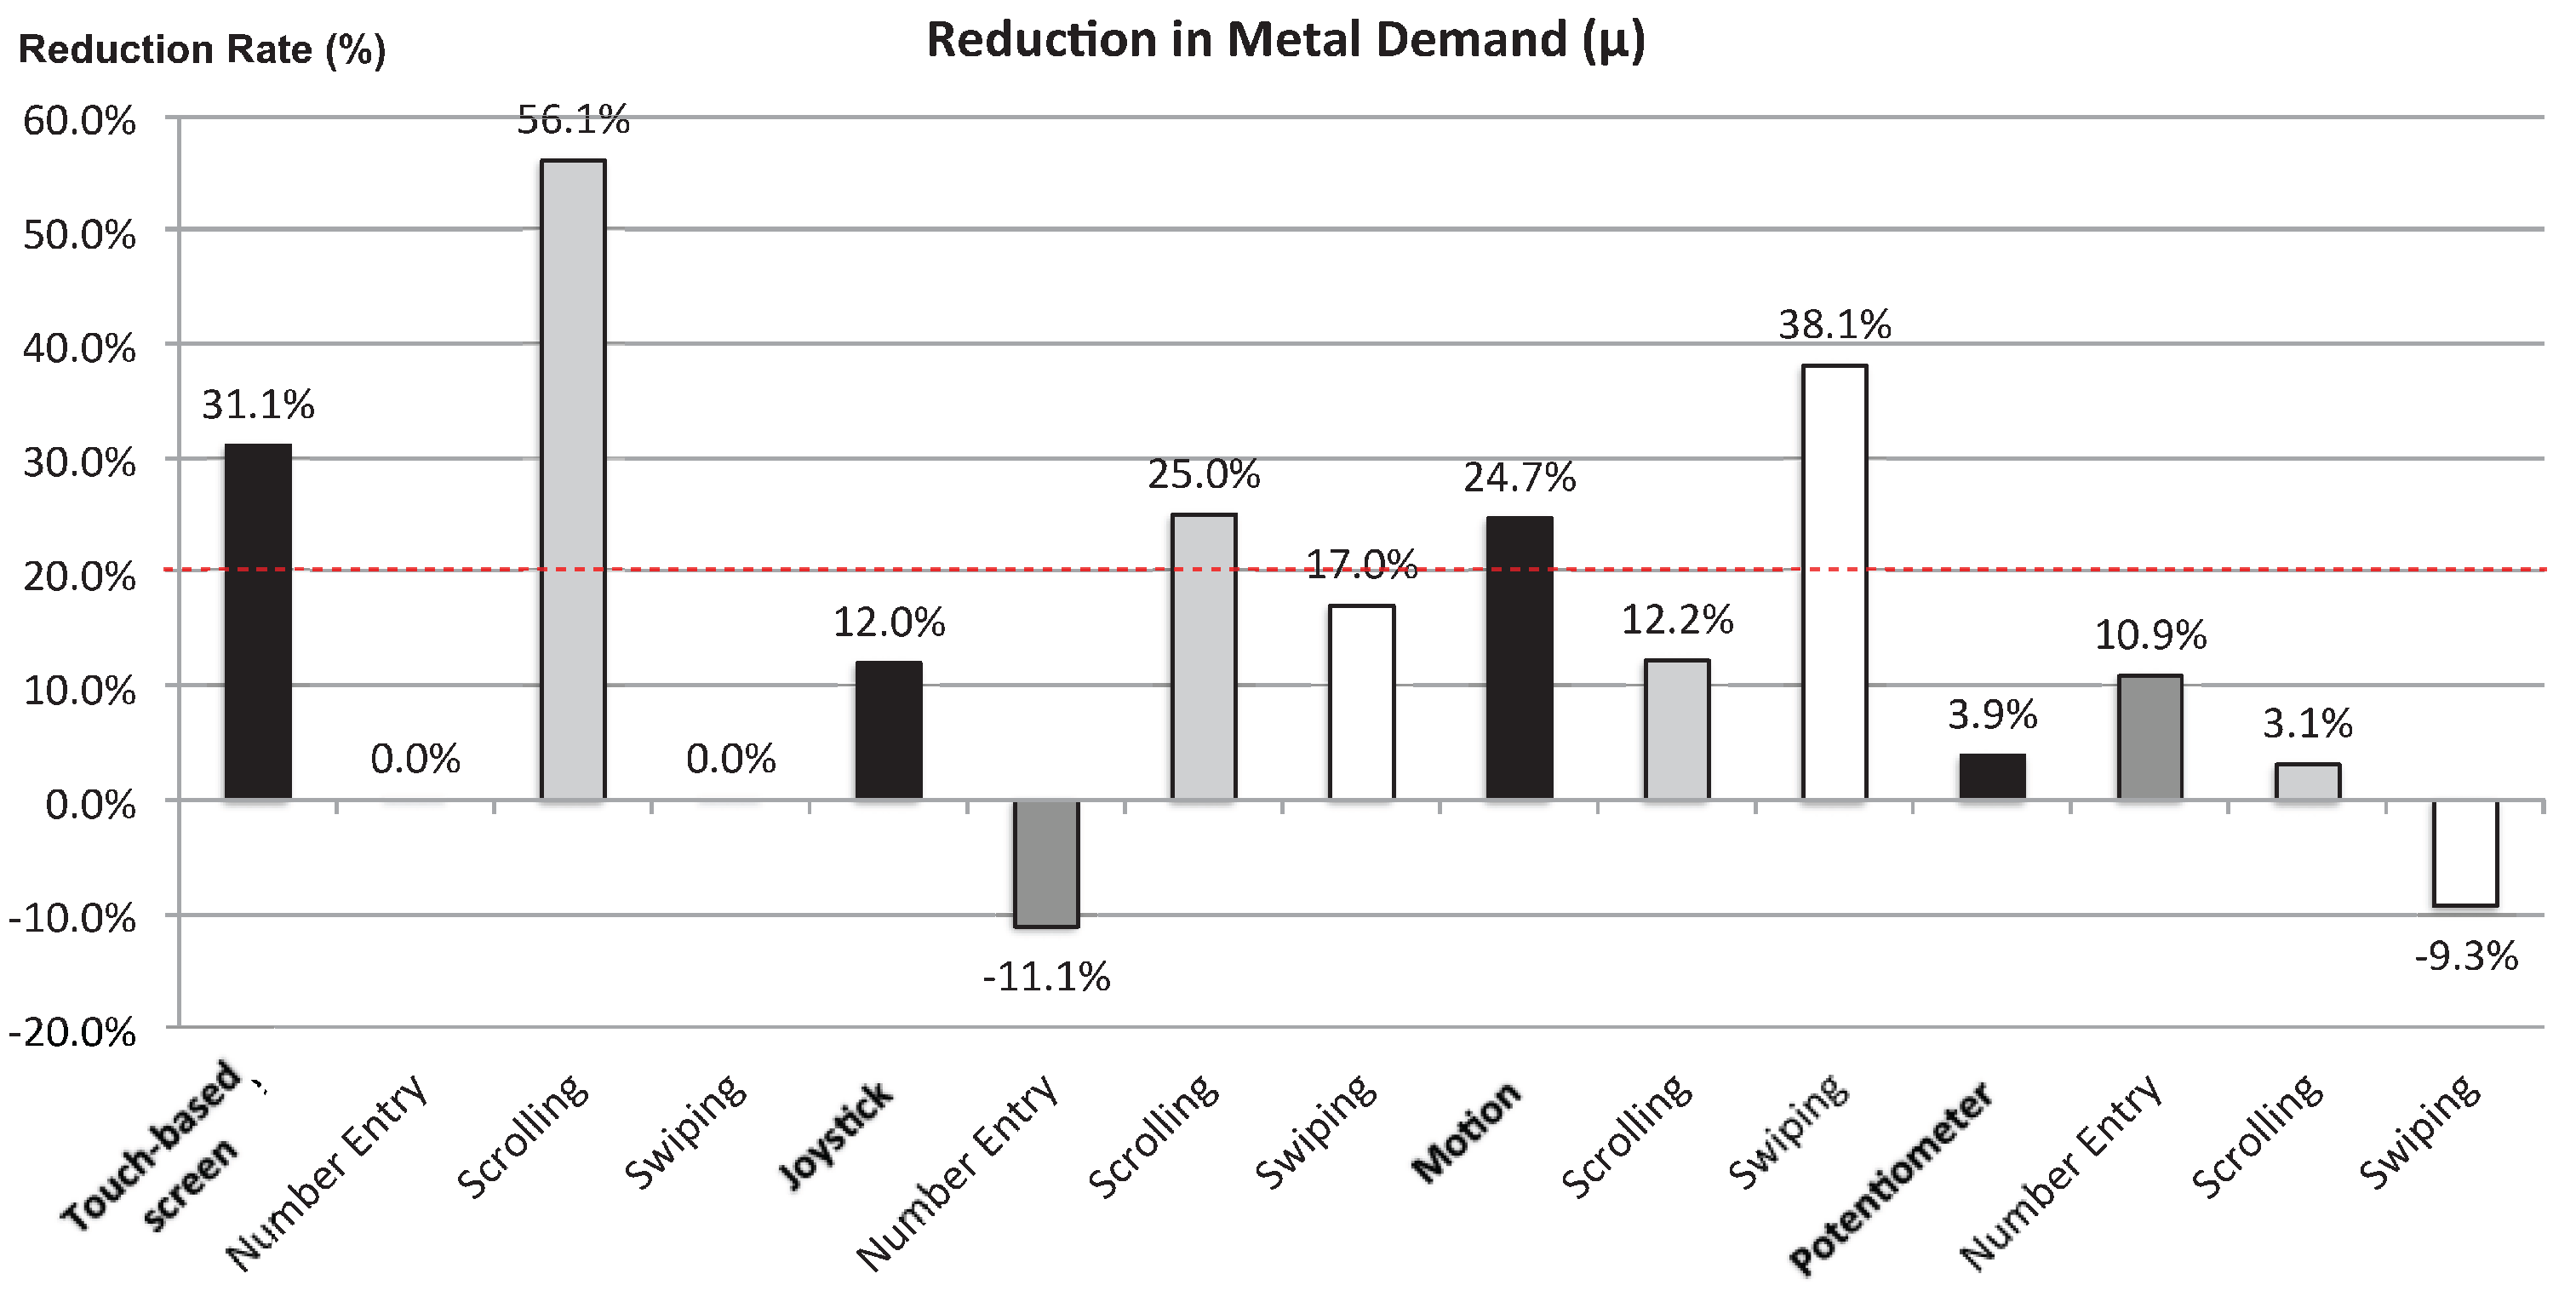

Figure 23.
Reduction in physical demand.
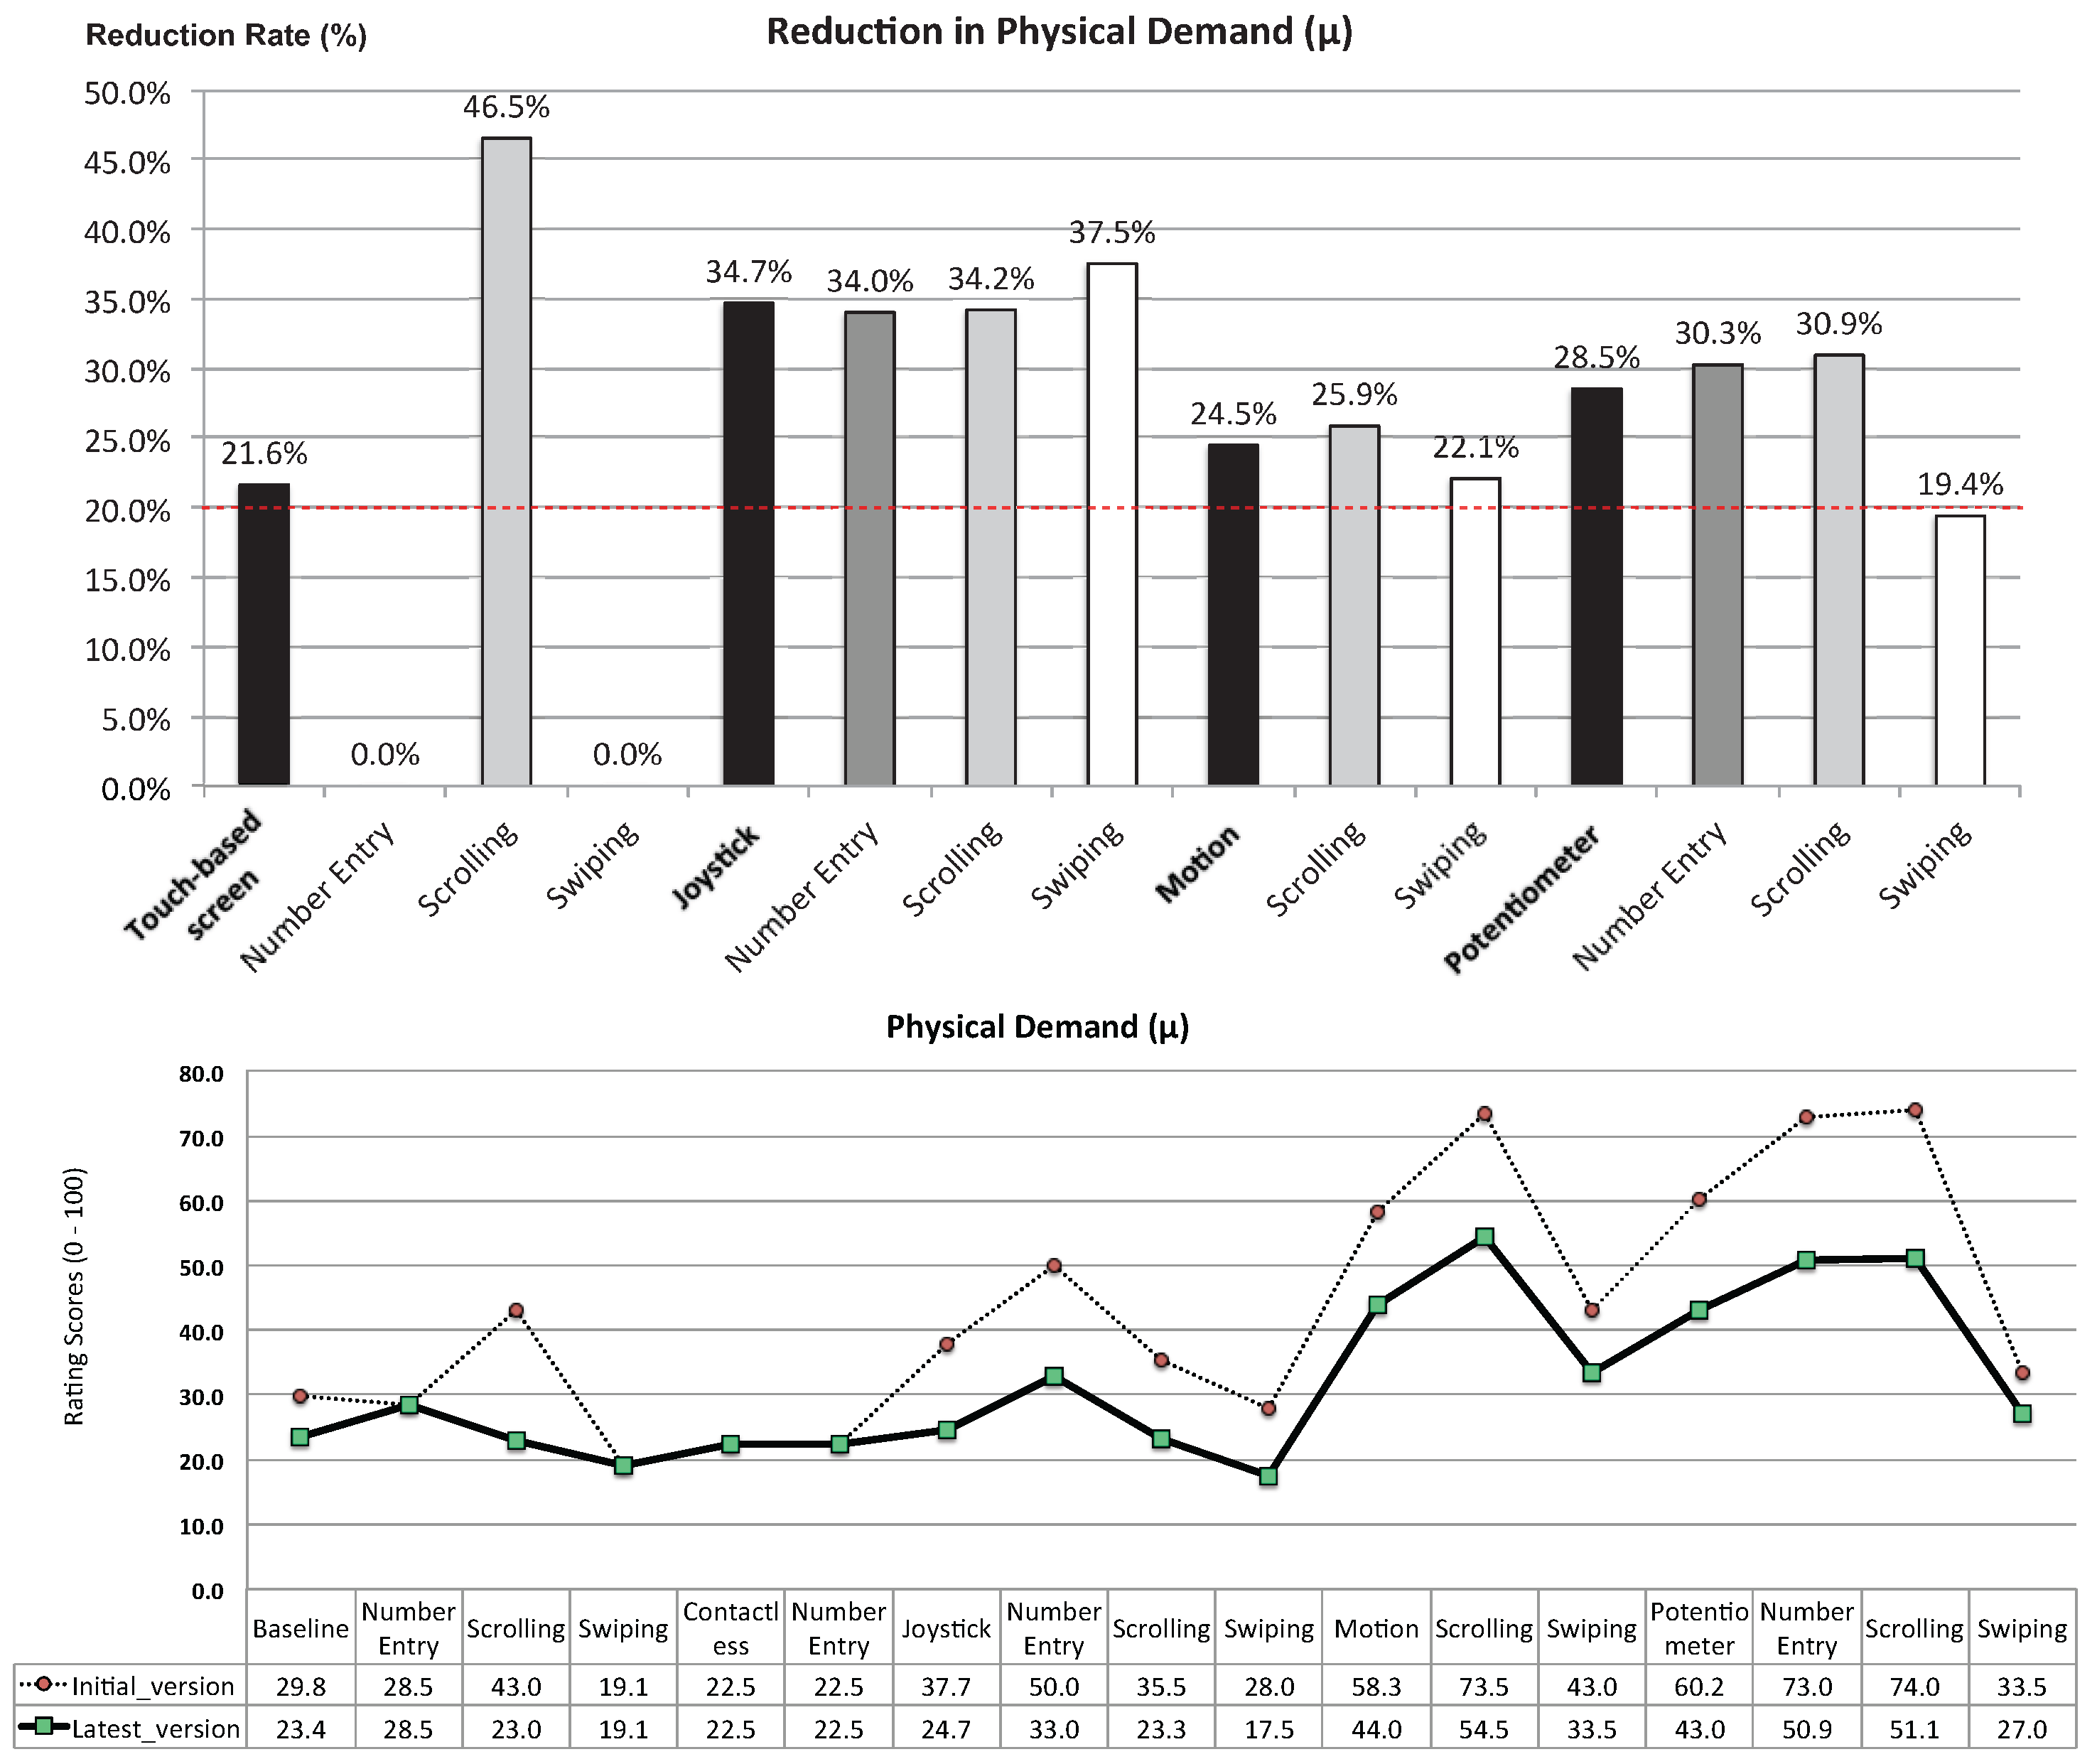
Figure 24.
Reduction in temporal demand.


Figure 25.
Reduction in own performance.
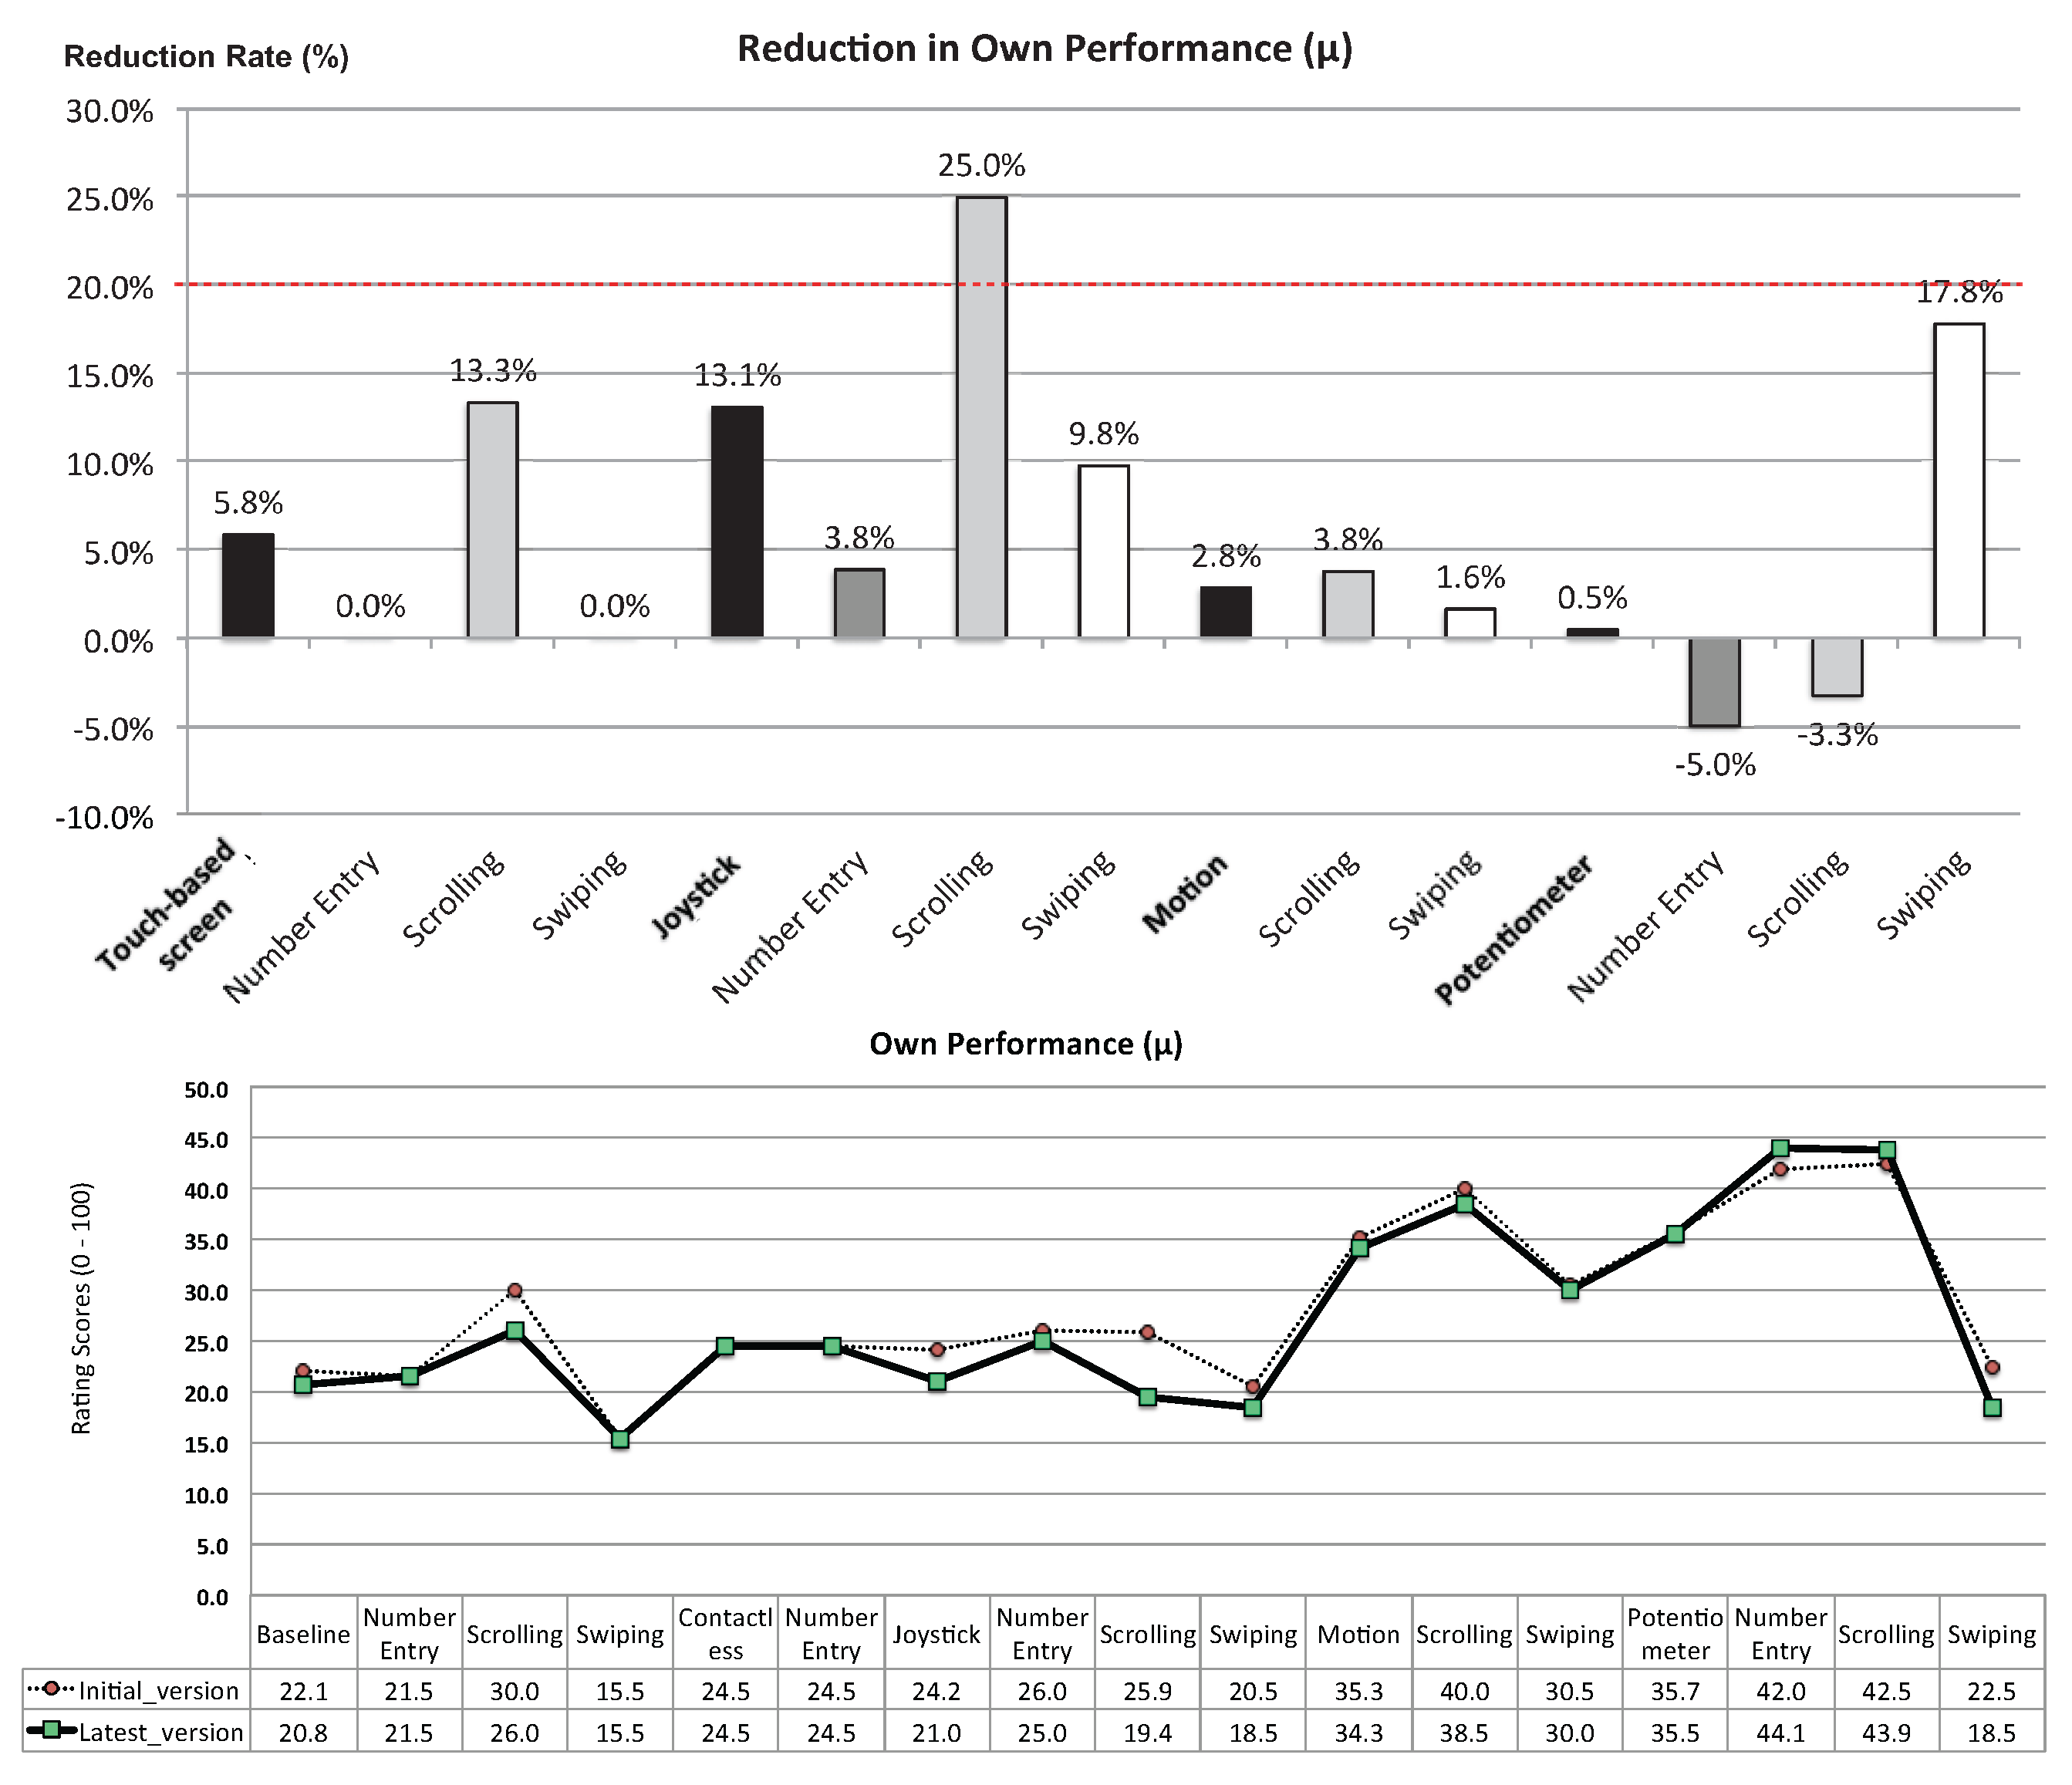
Figure 26.
Reduction in efforts.

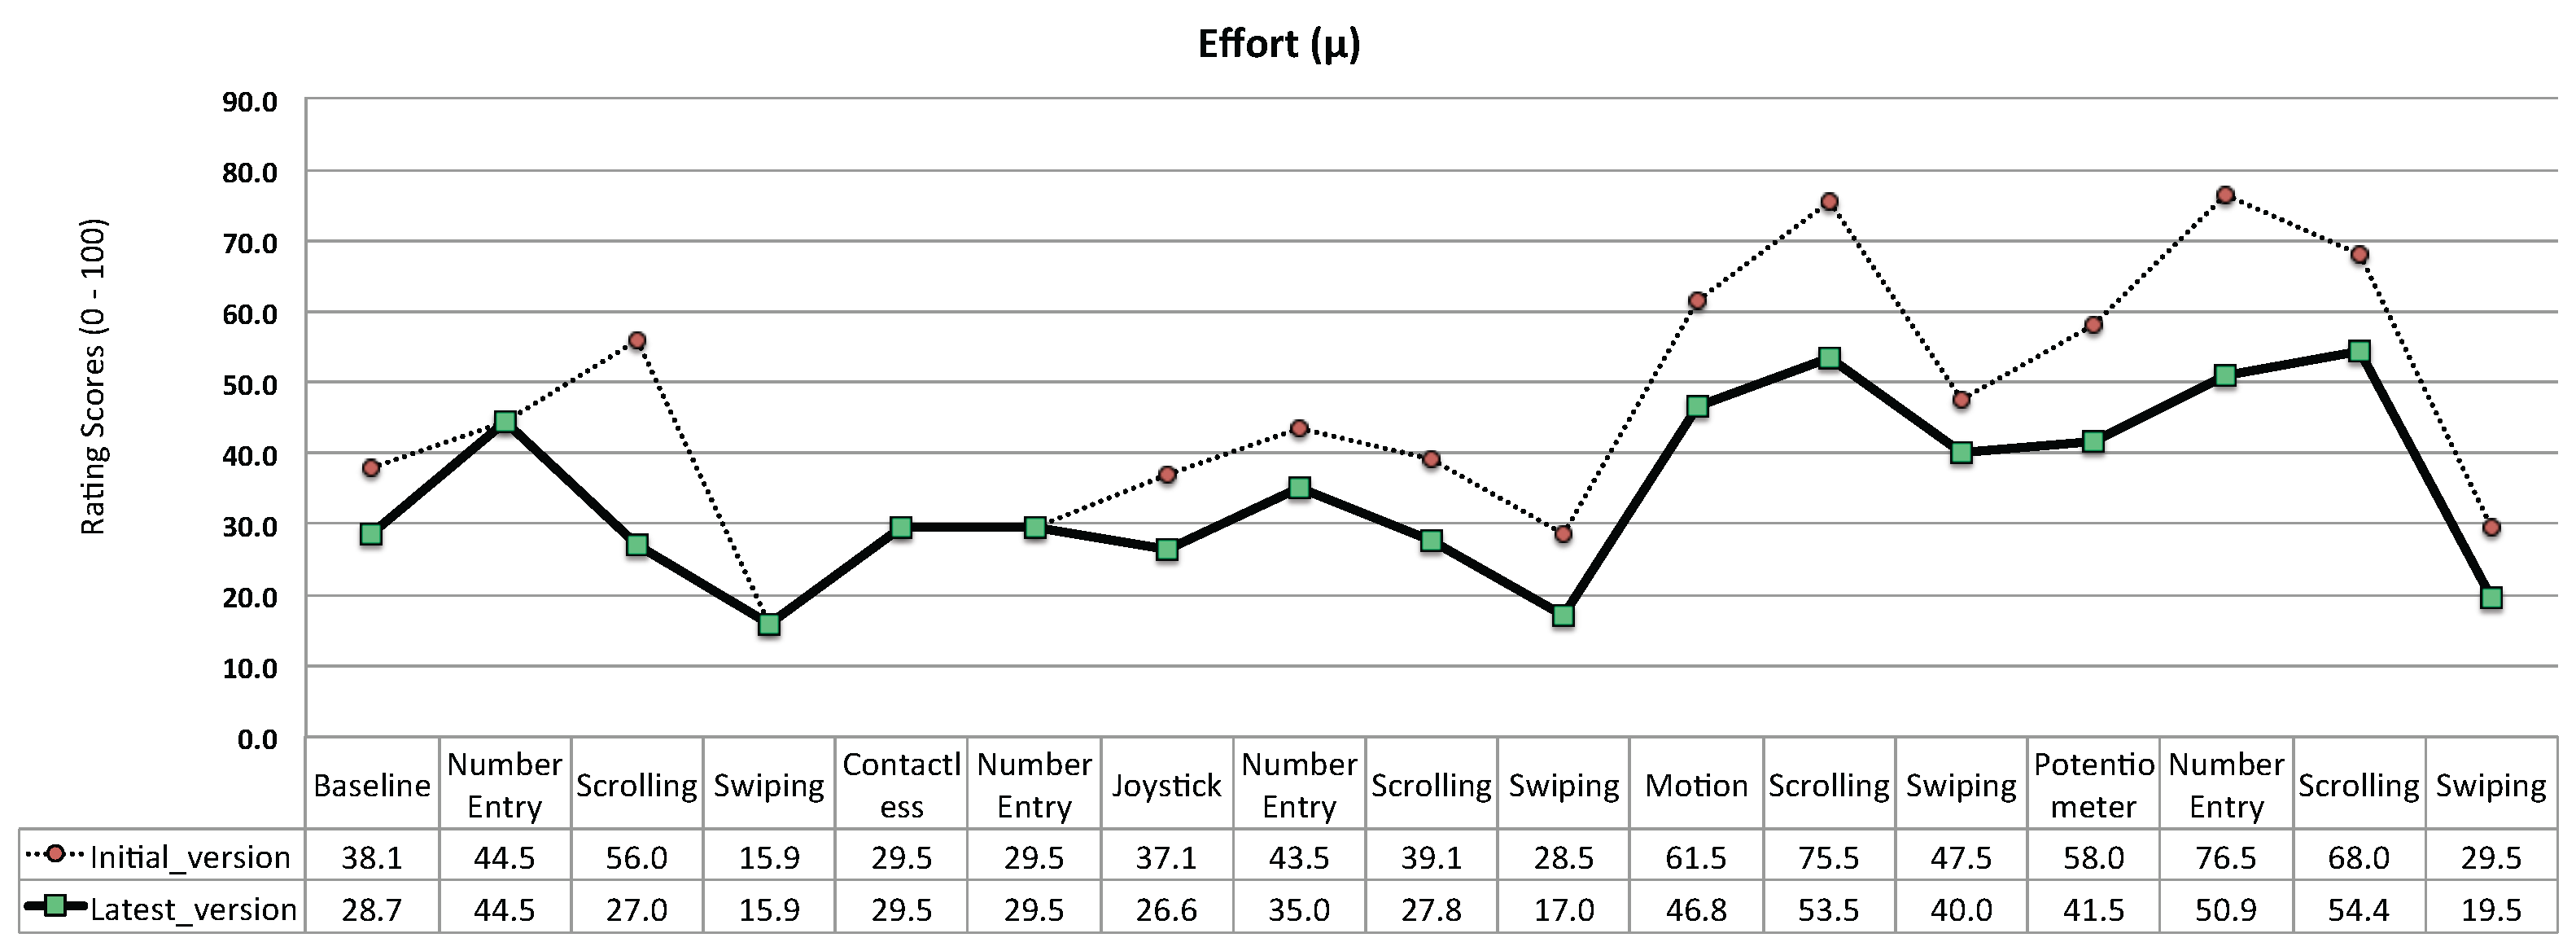
Figure 27.
Reduction in frustration.

Figure 28.
Rating score results for the usability principle evaluation.

Figure 29.
Reaction time (ms) and answer accuracy (%).
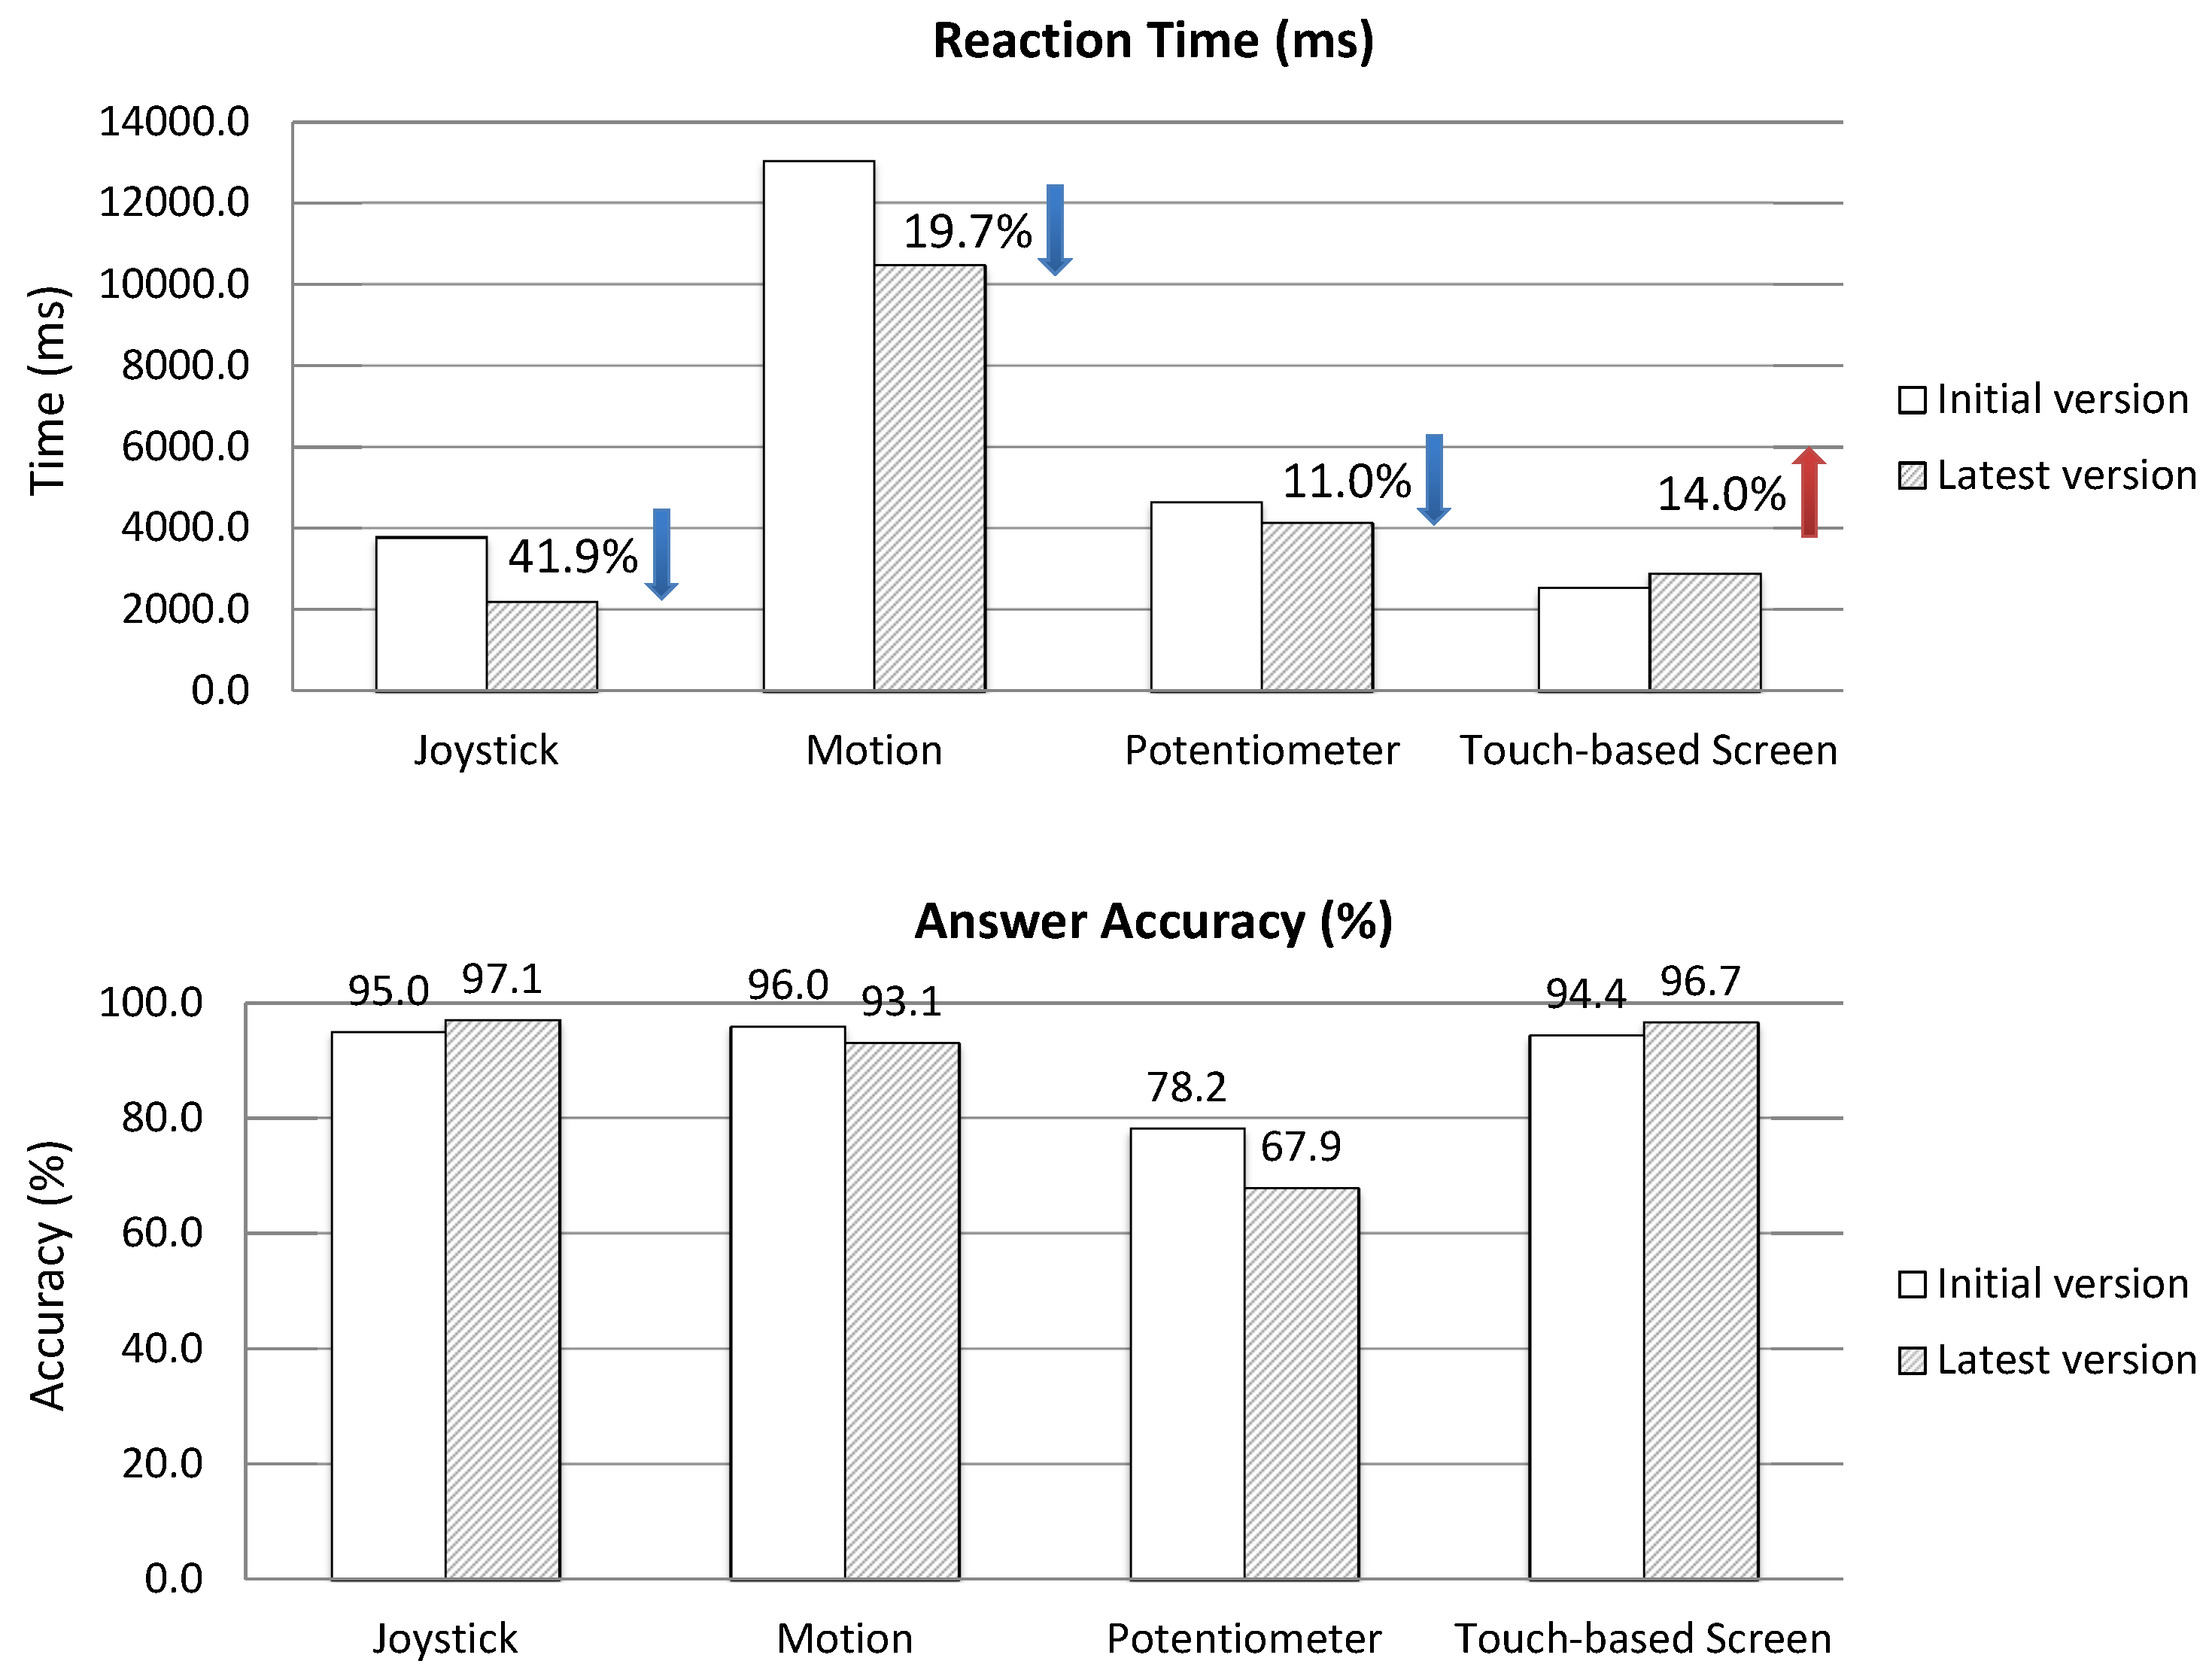

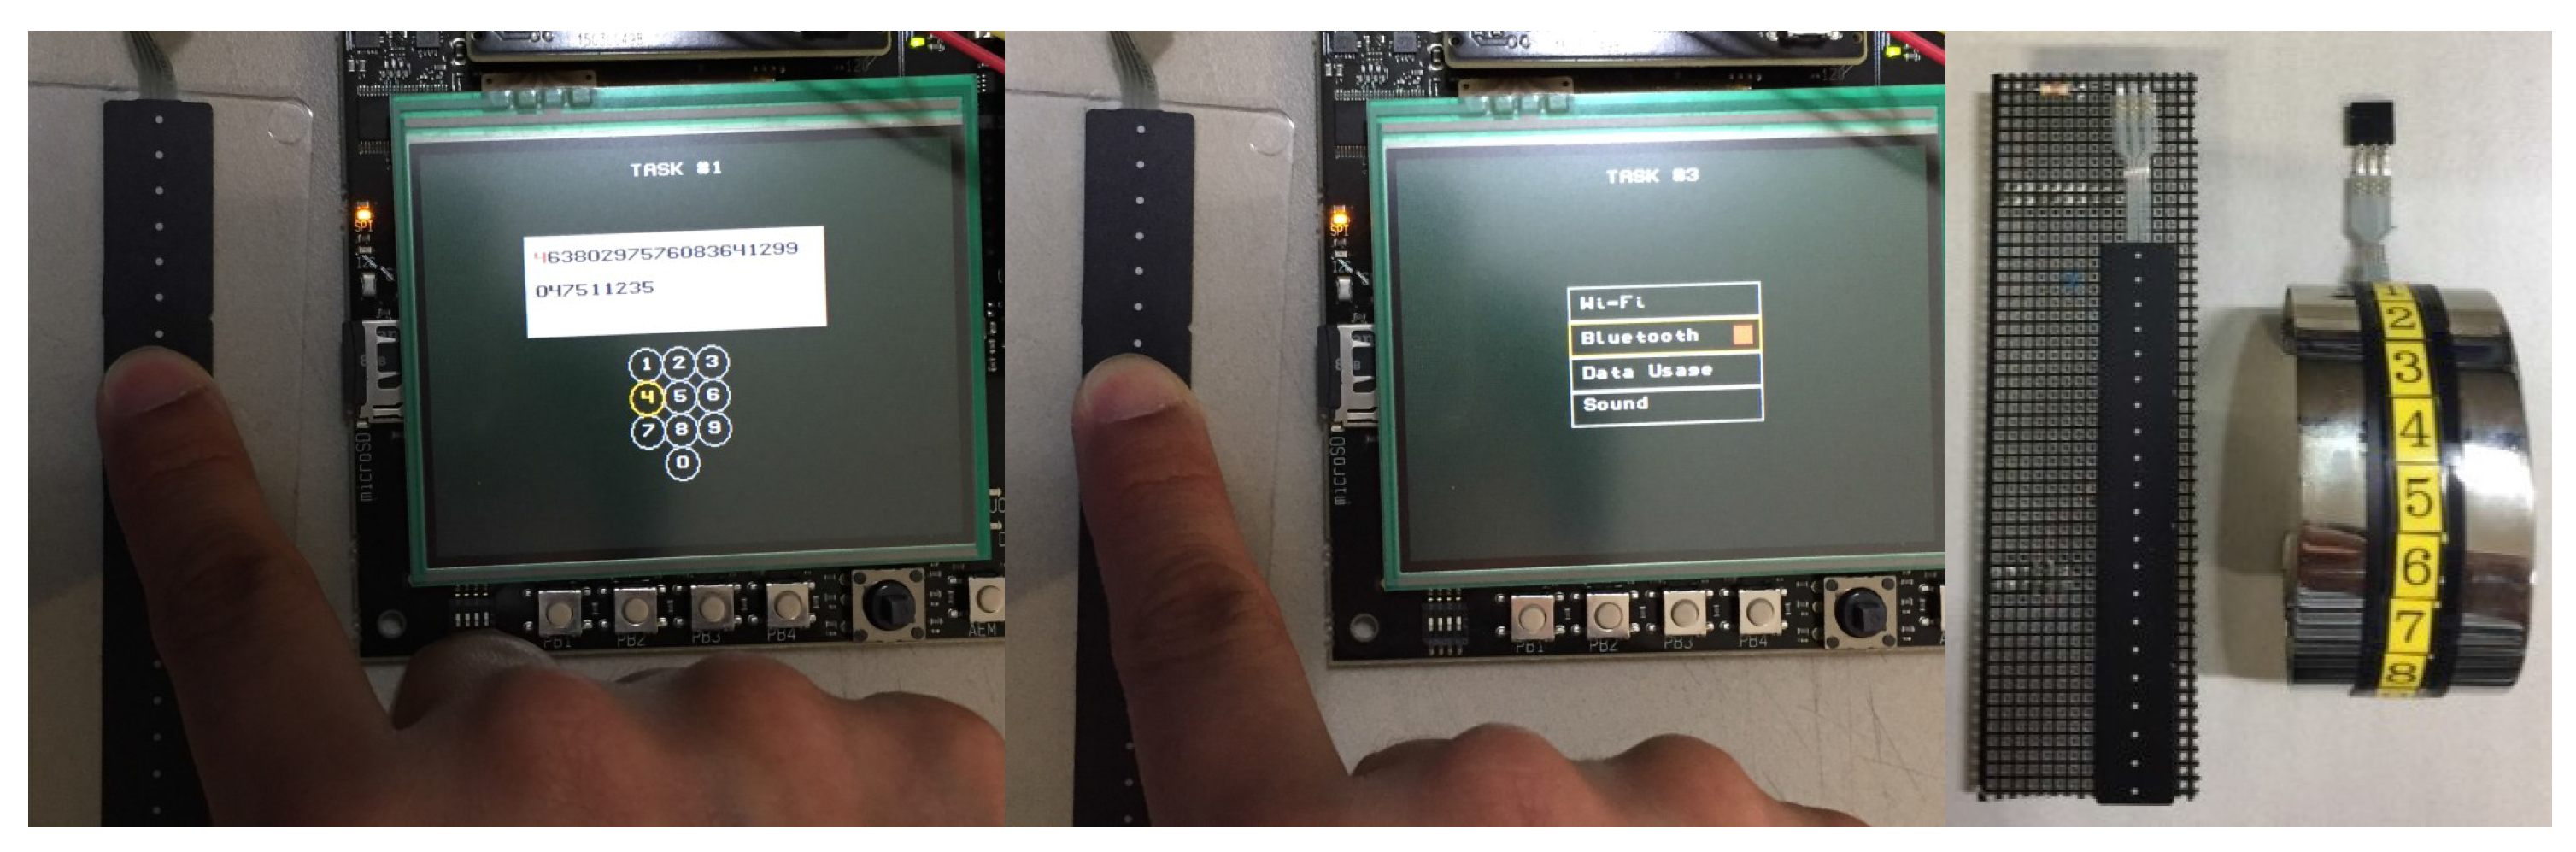
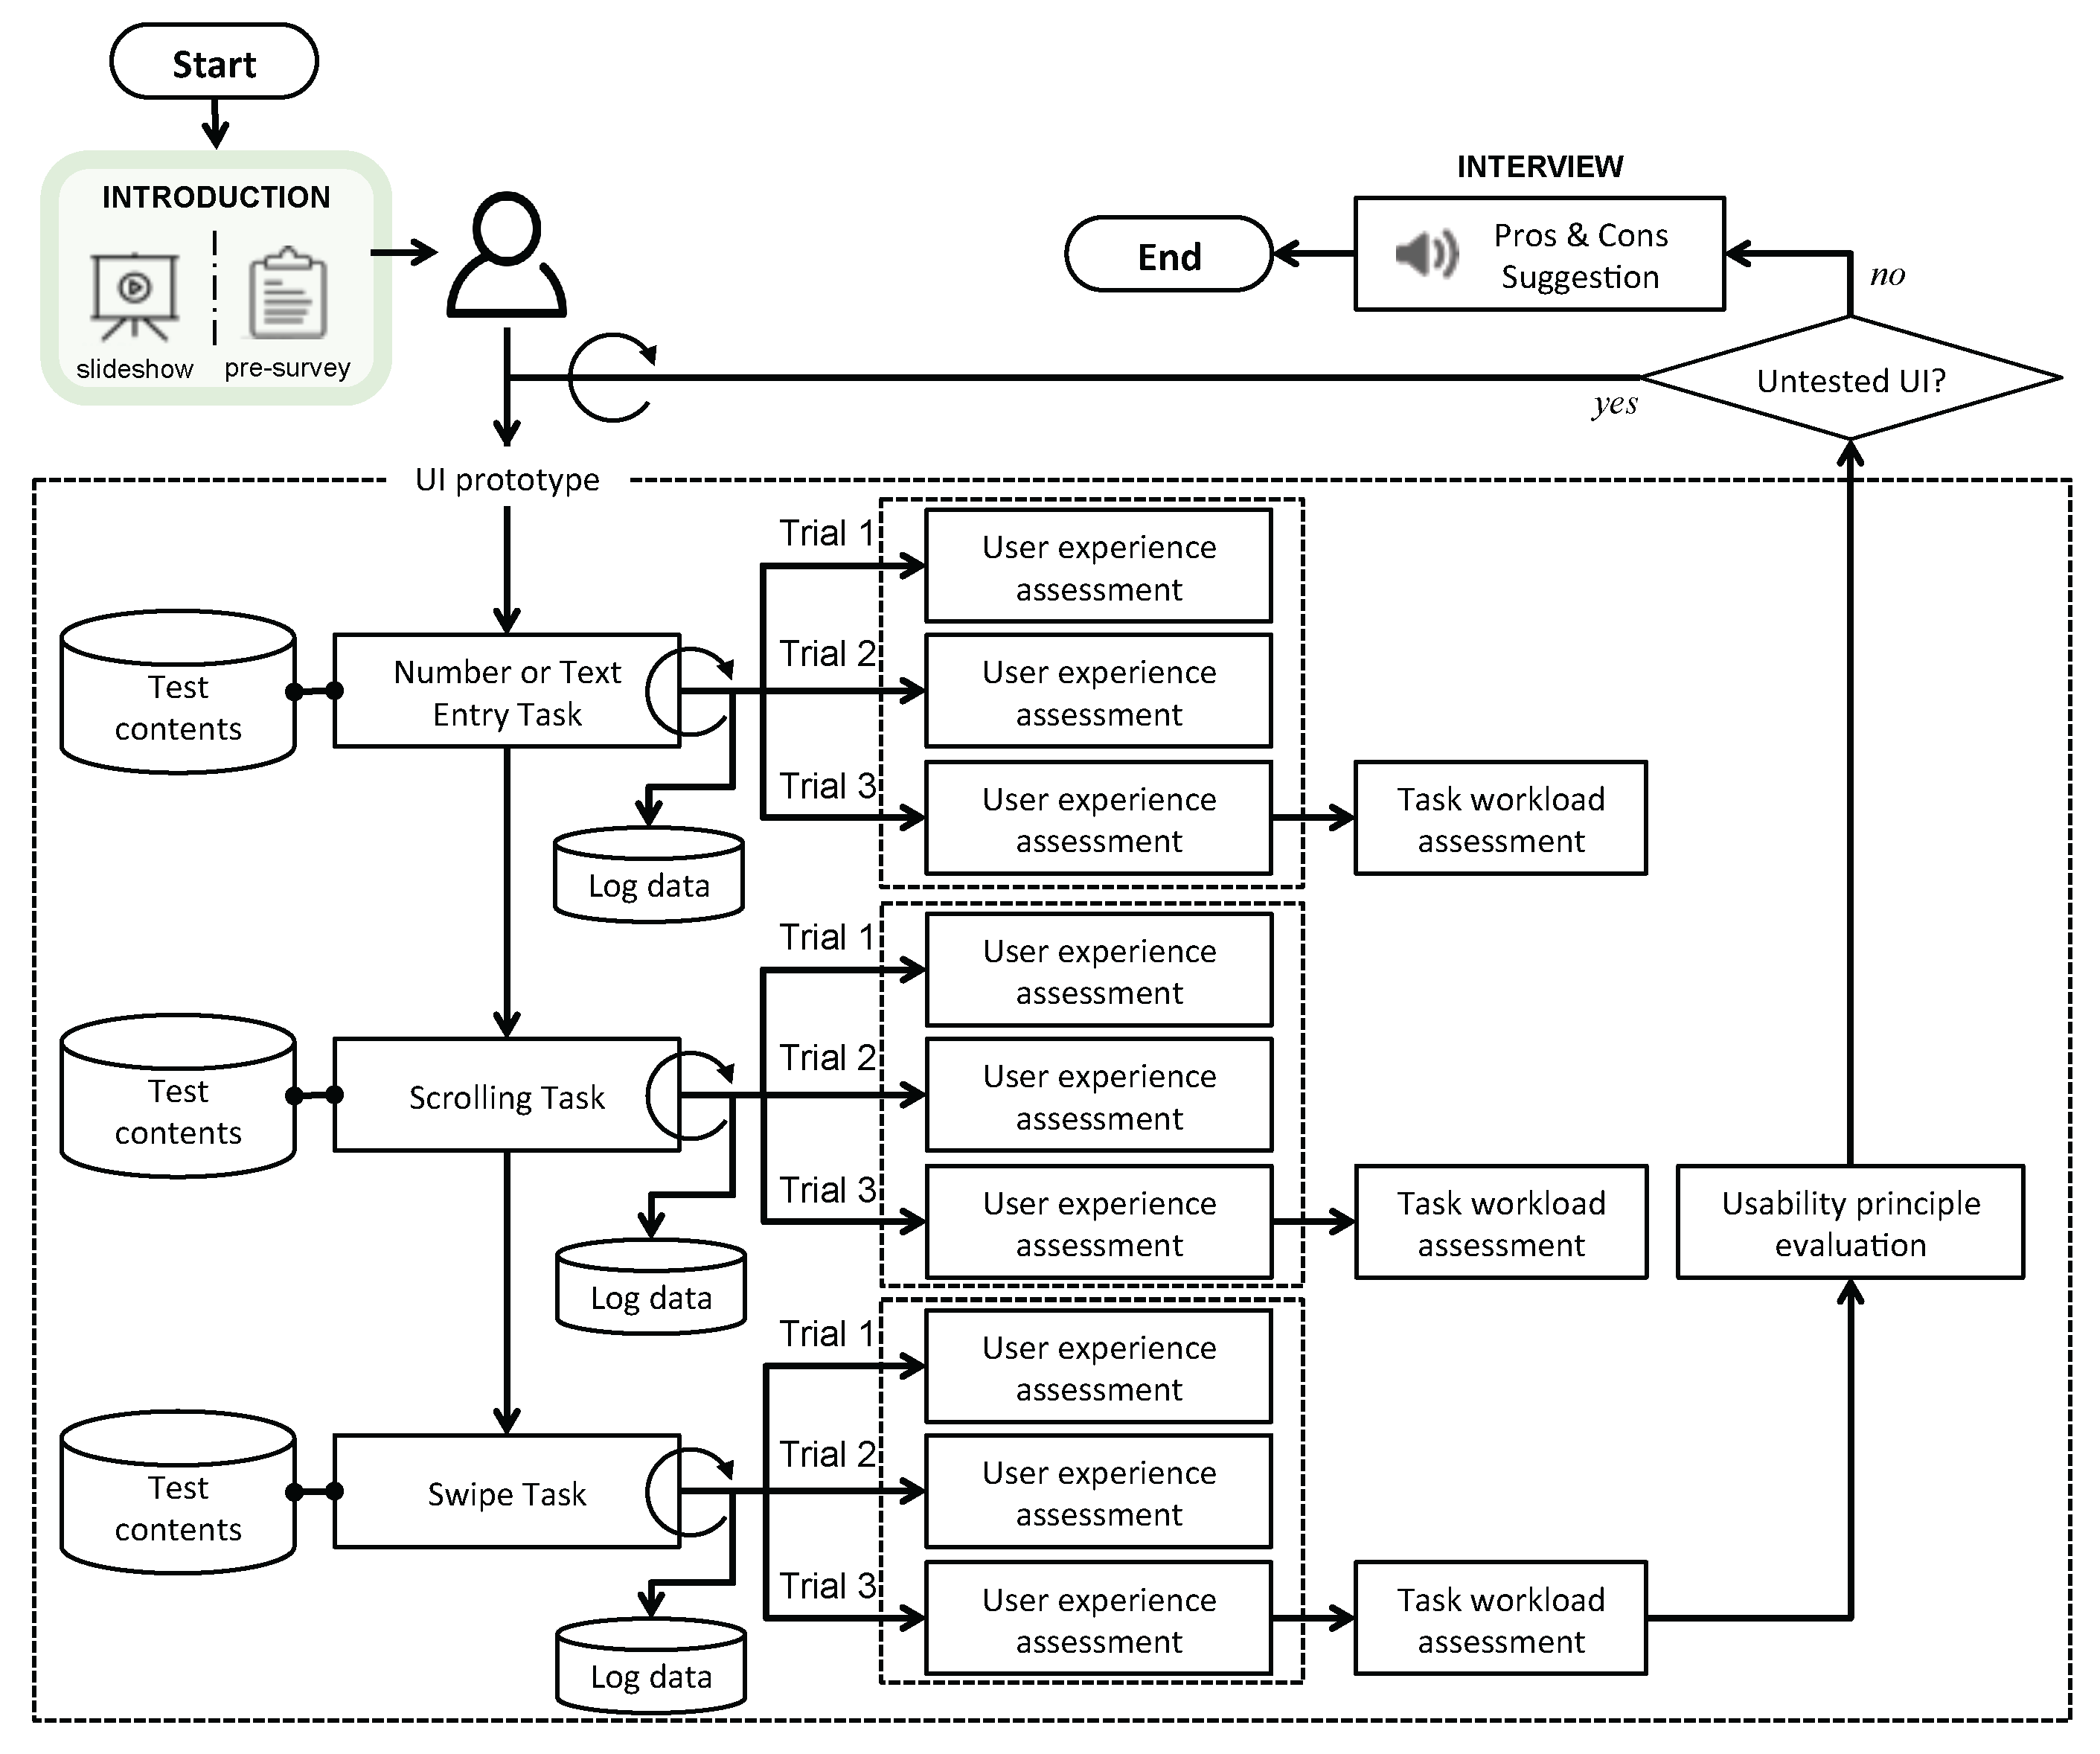
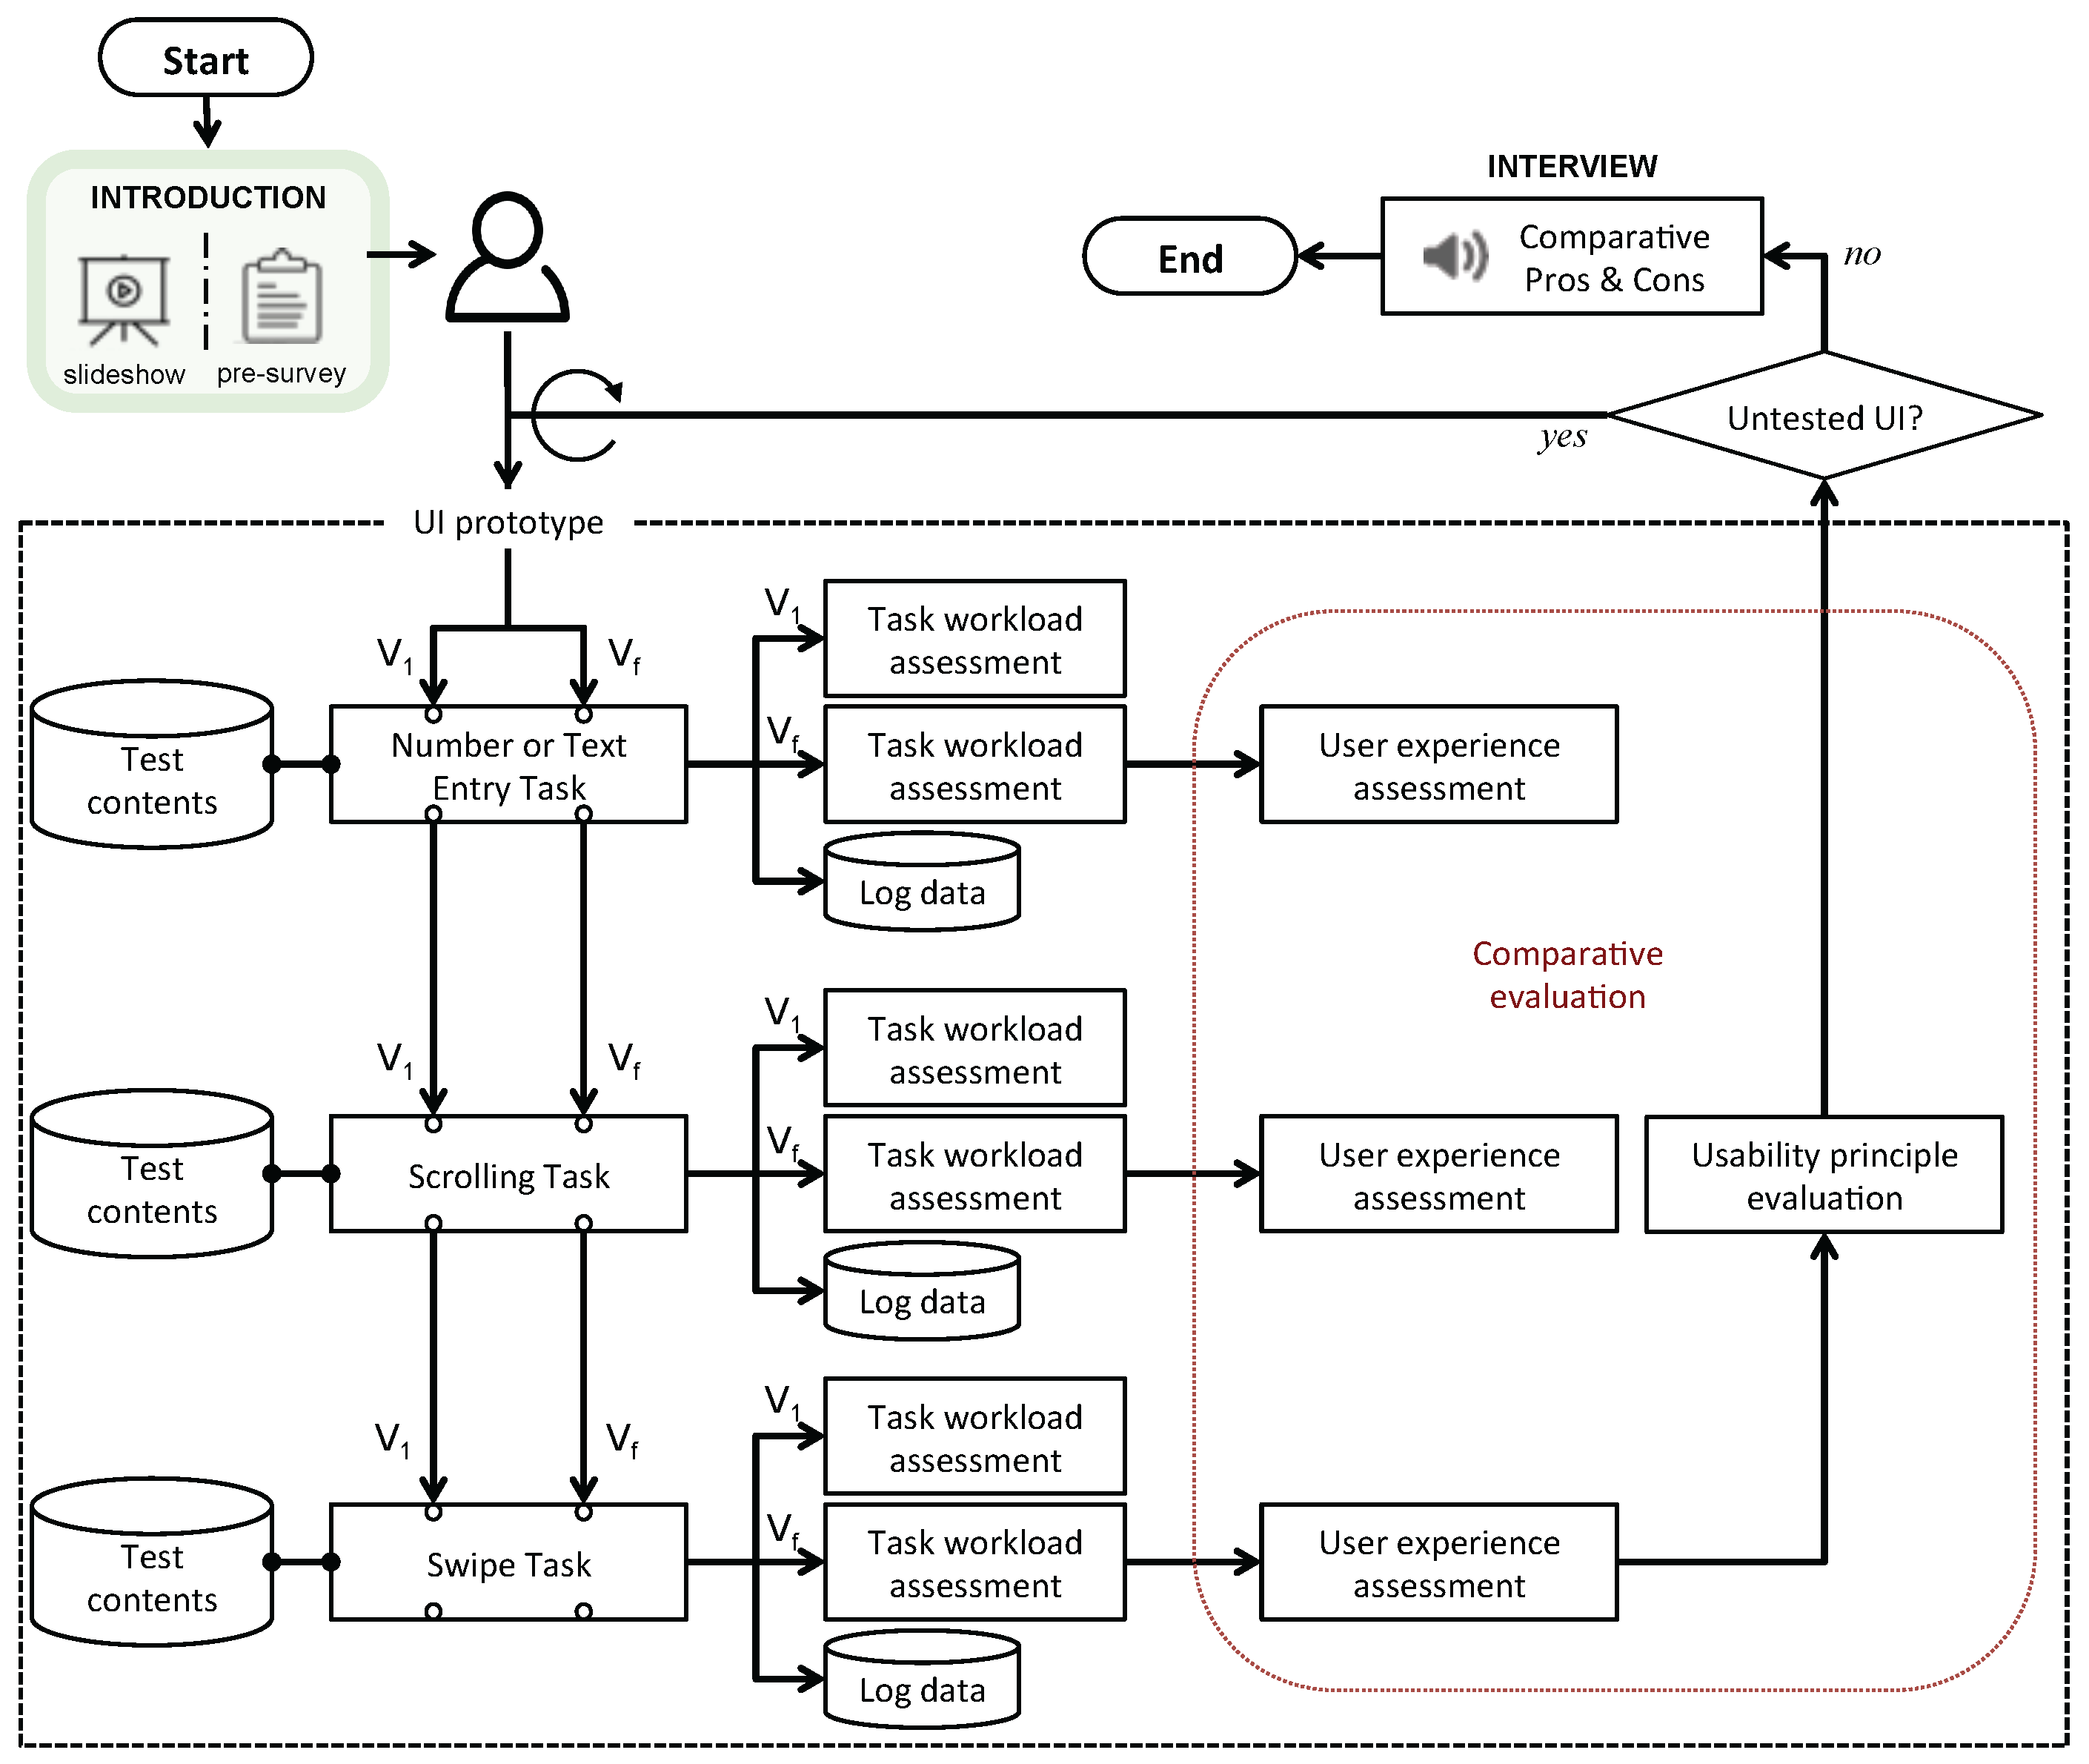
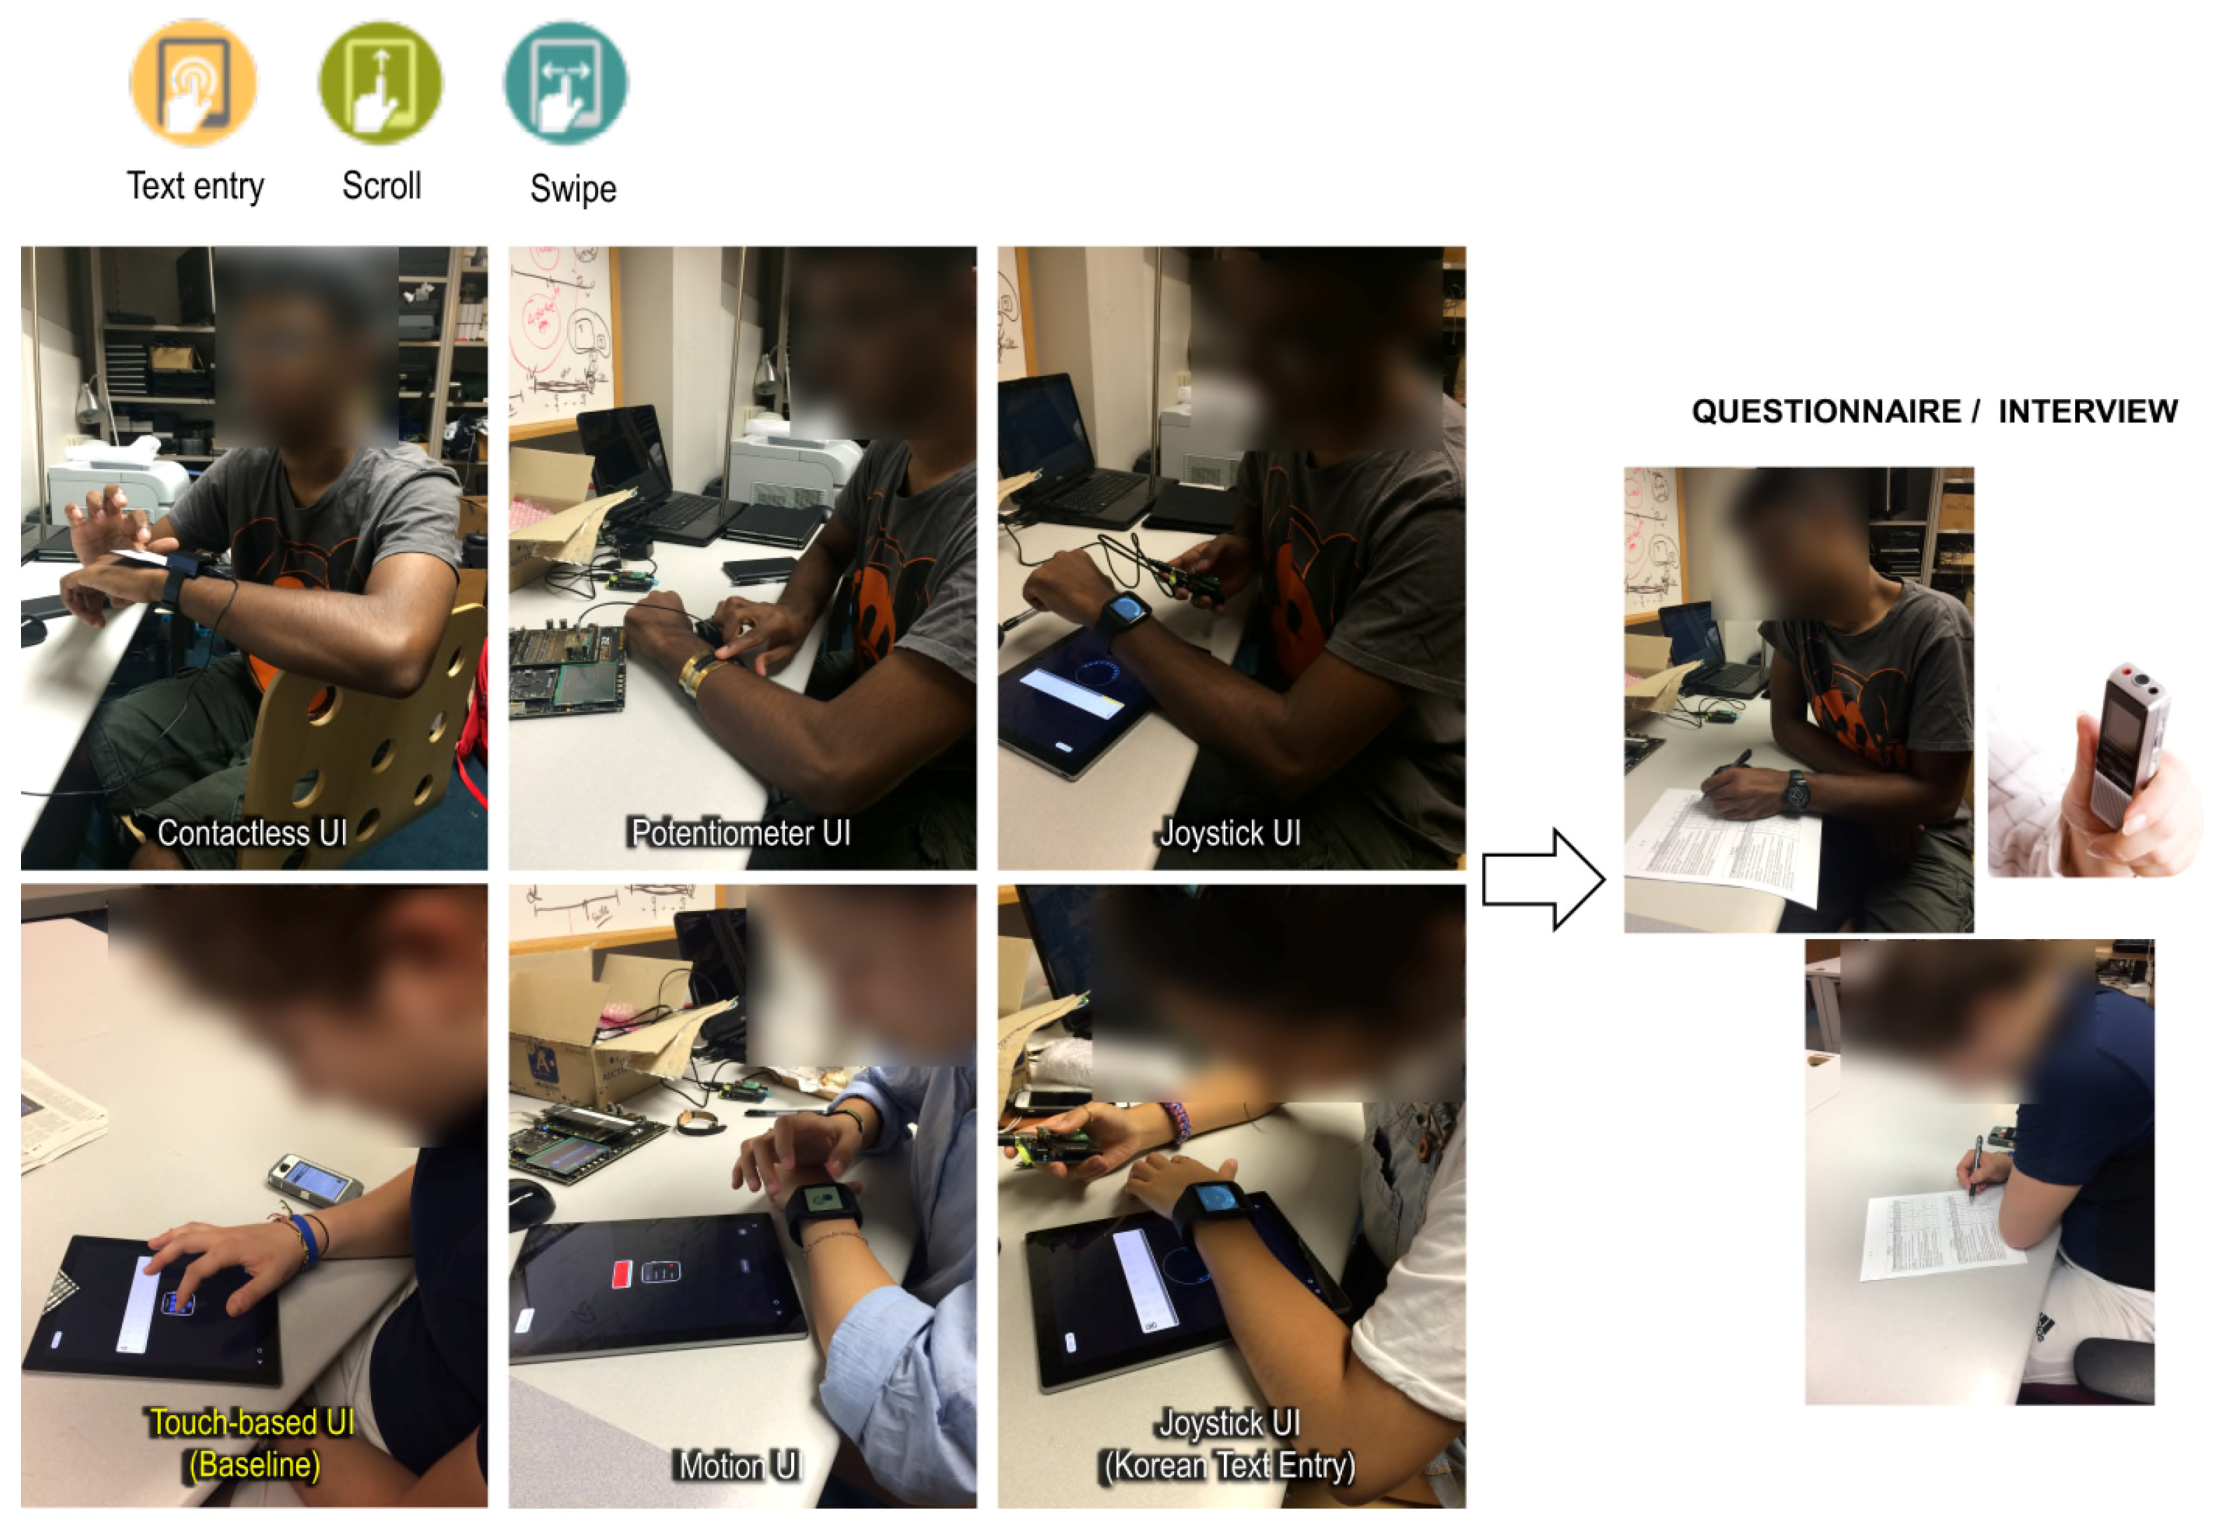
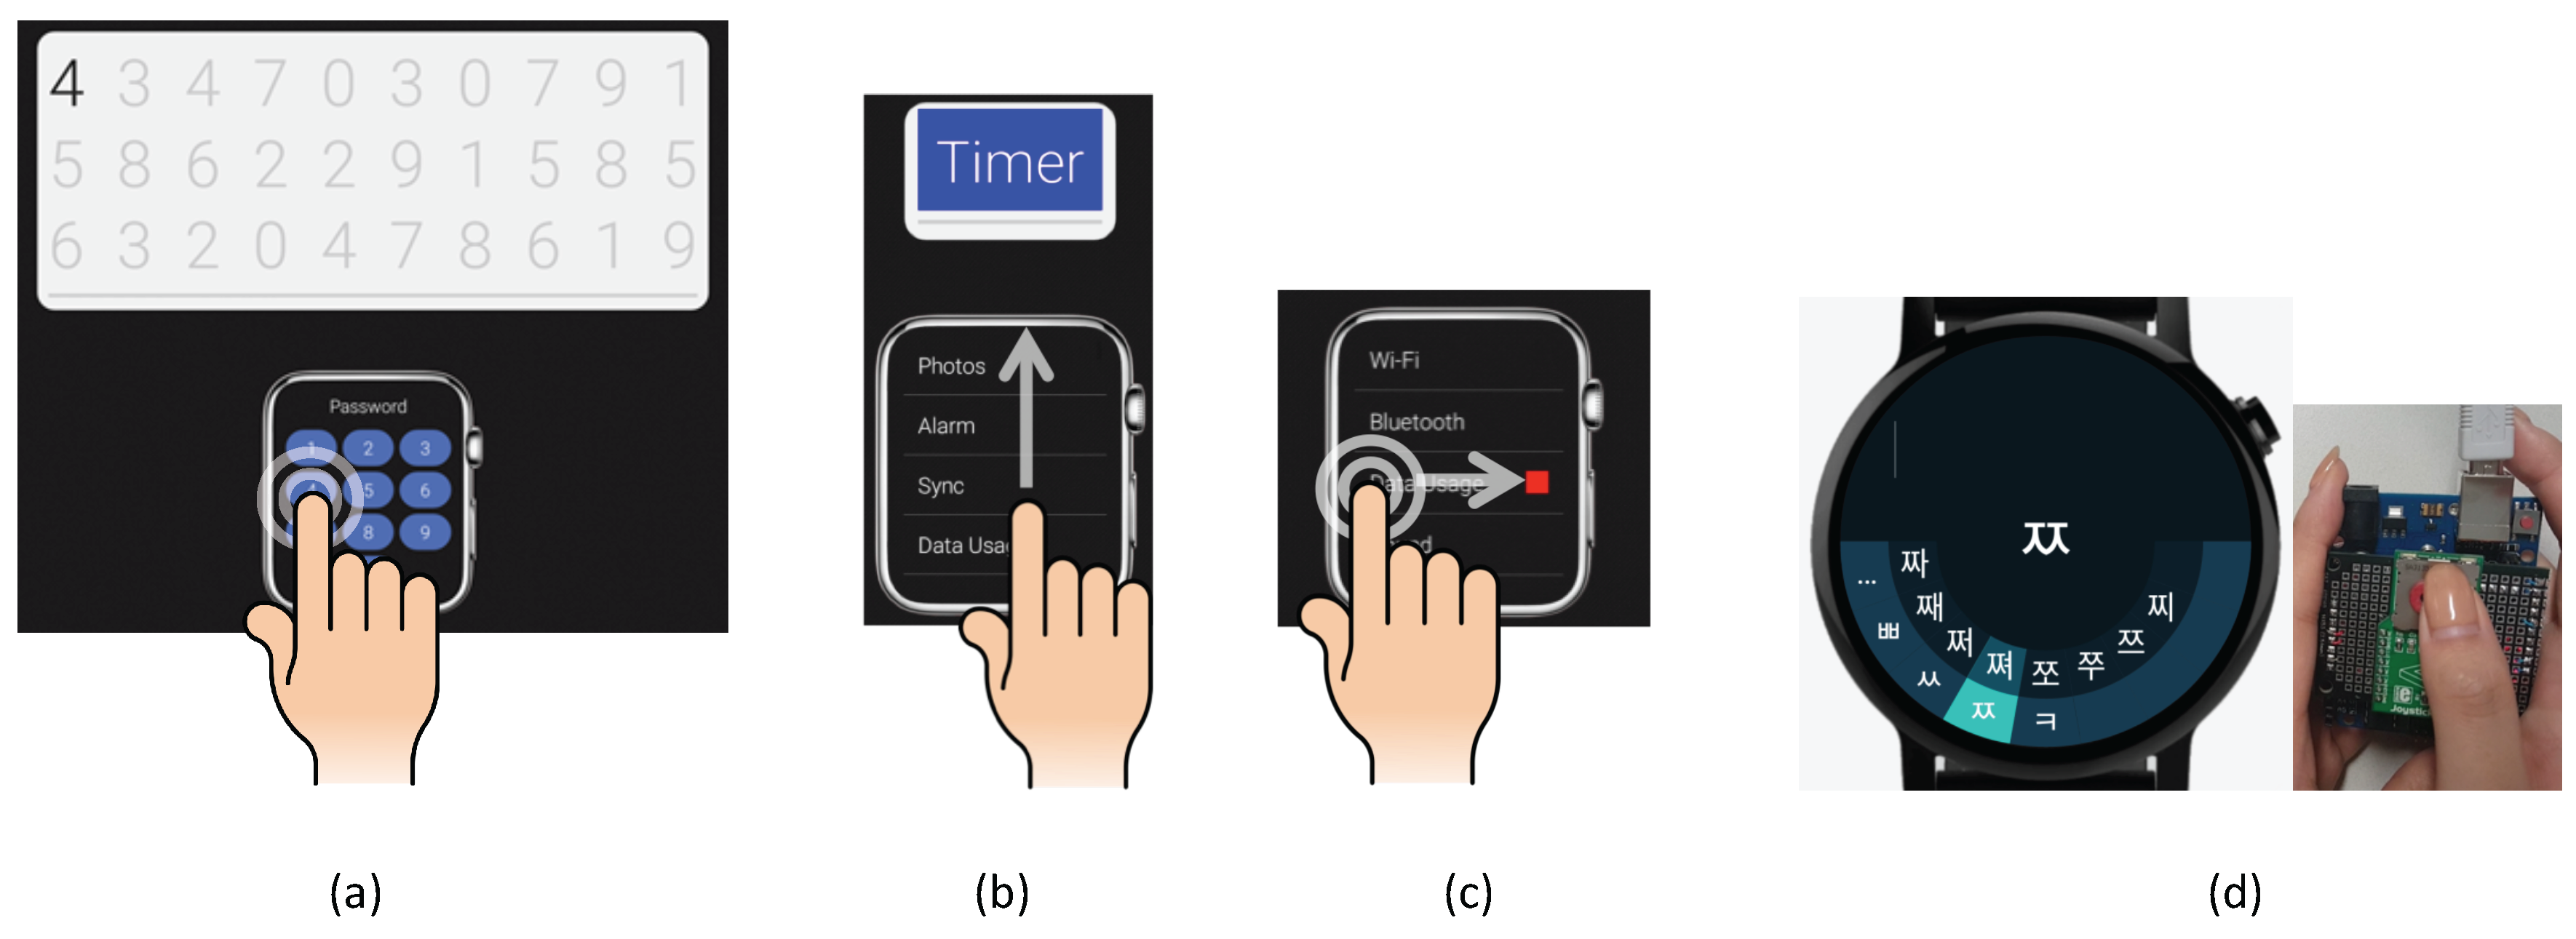
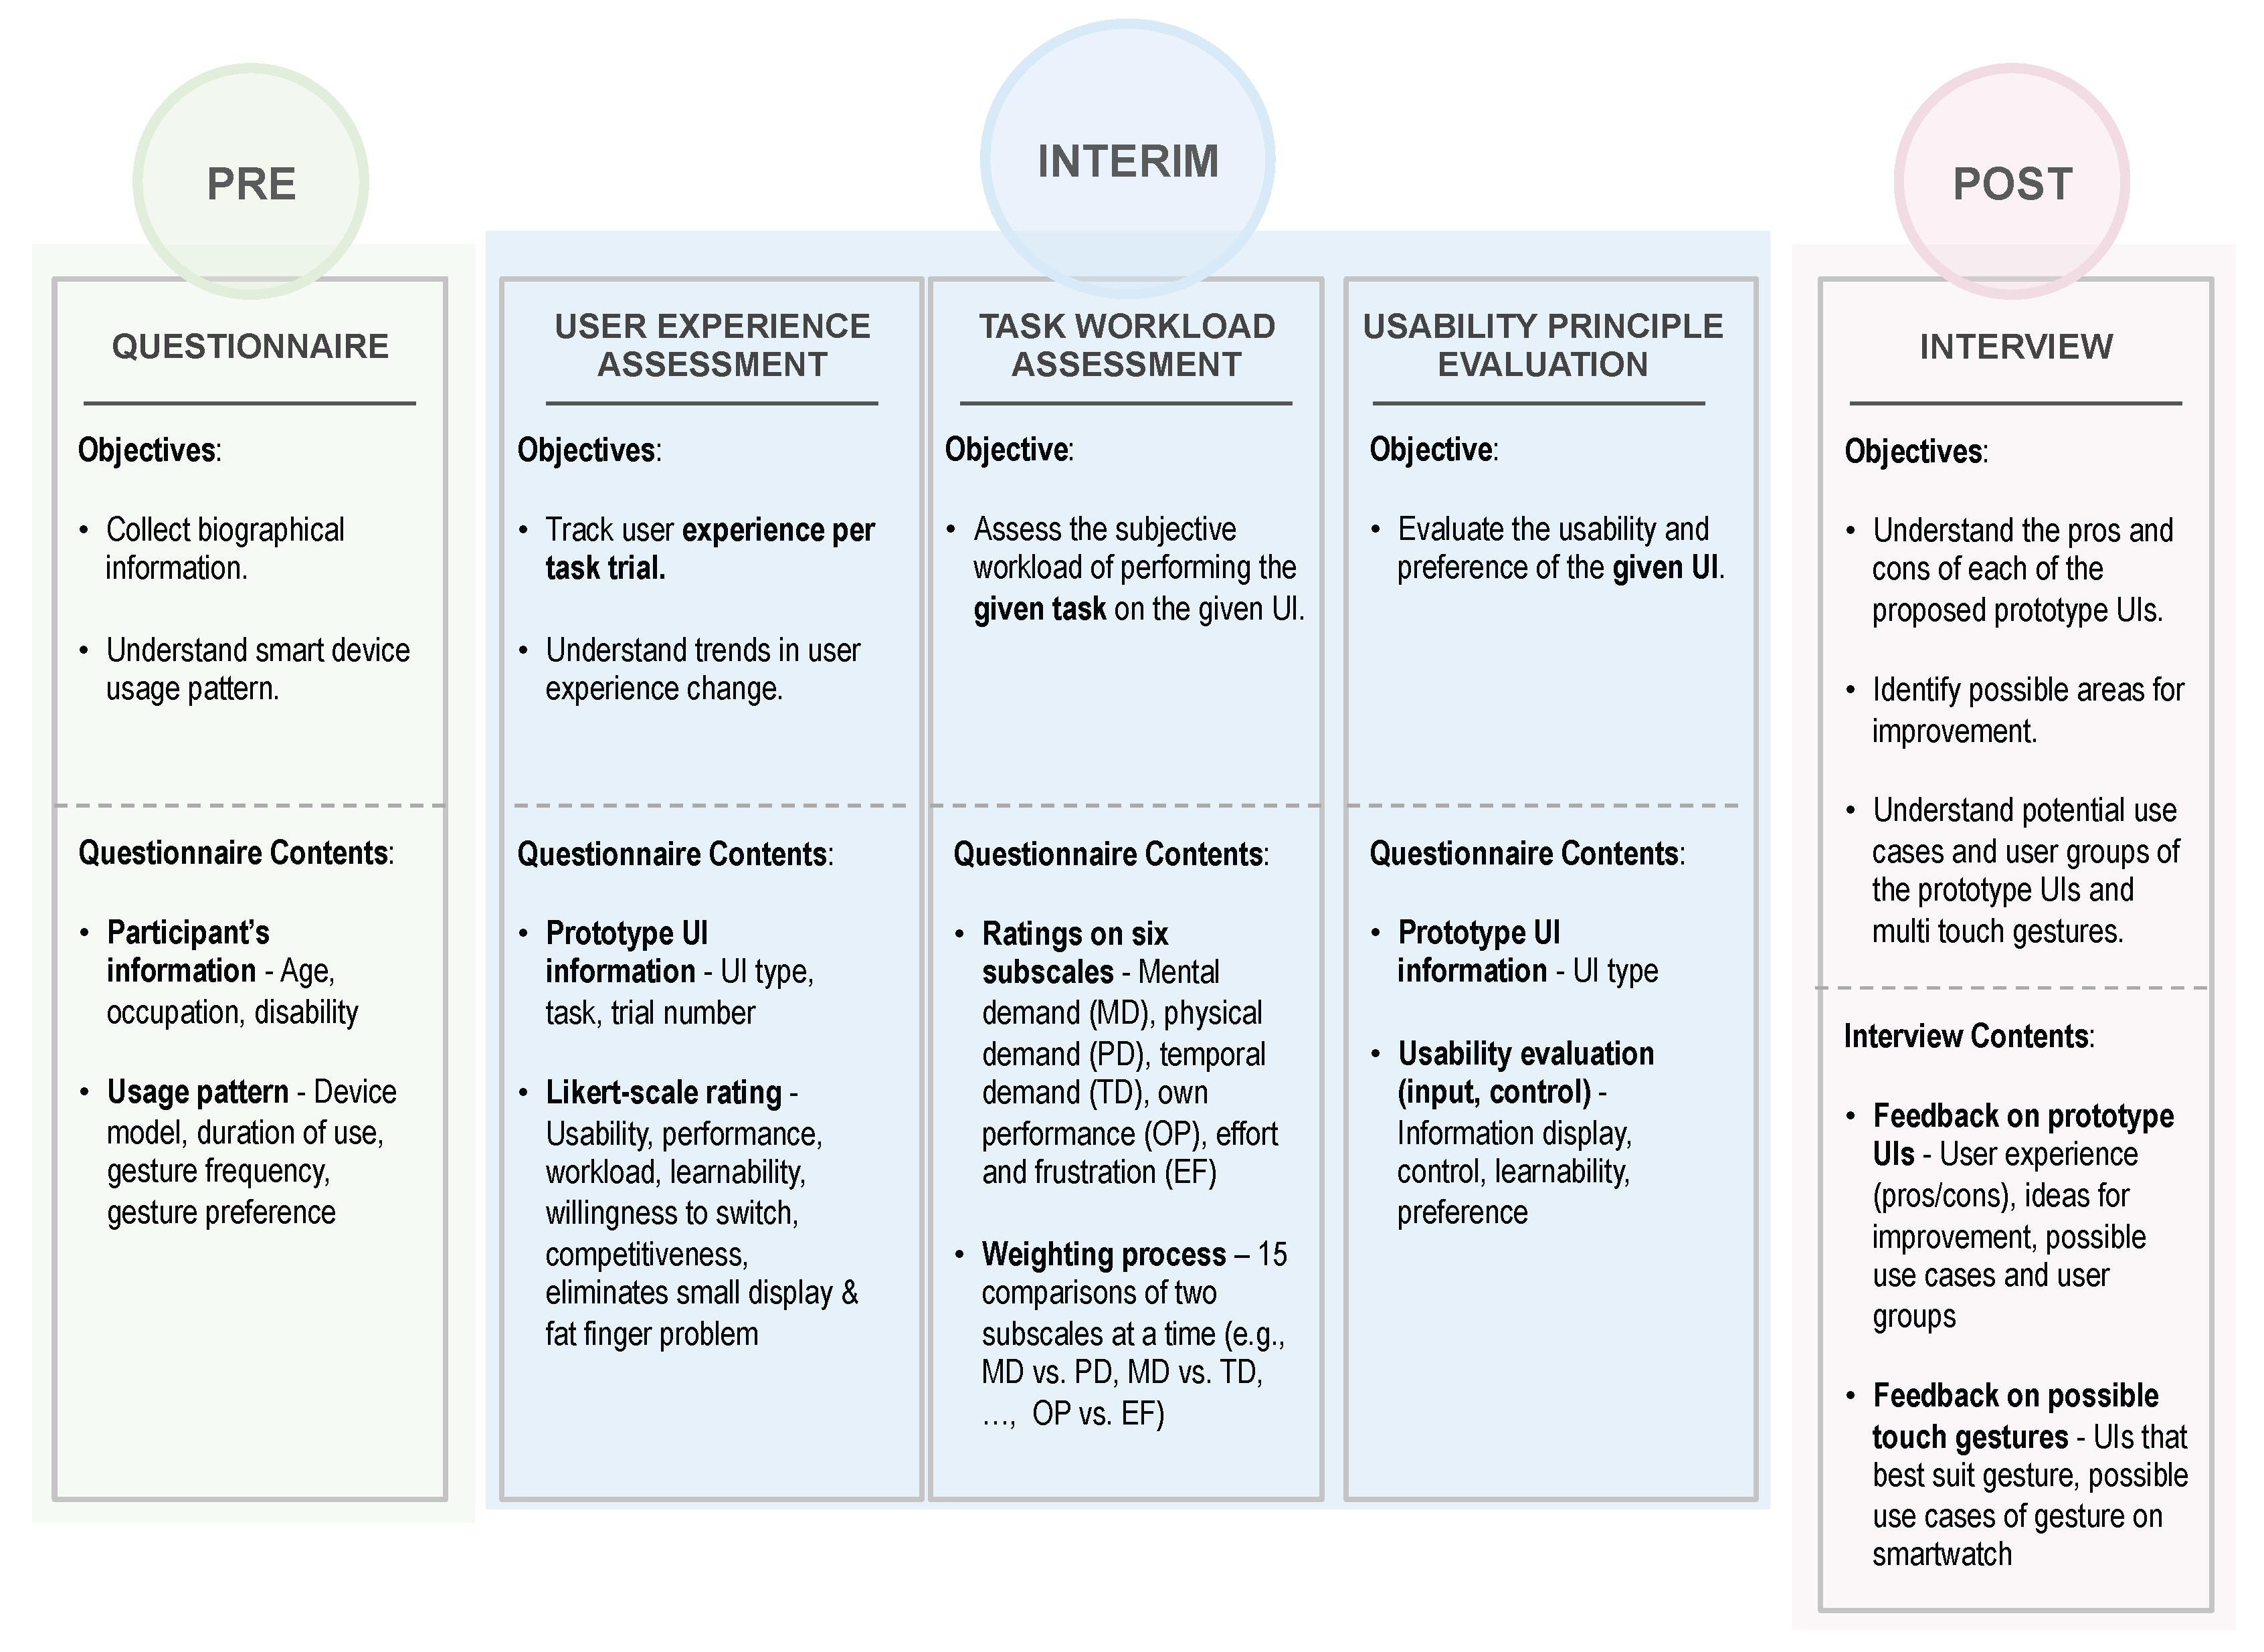
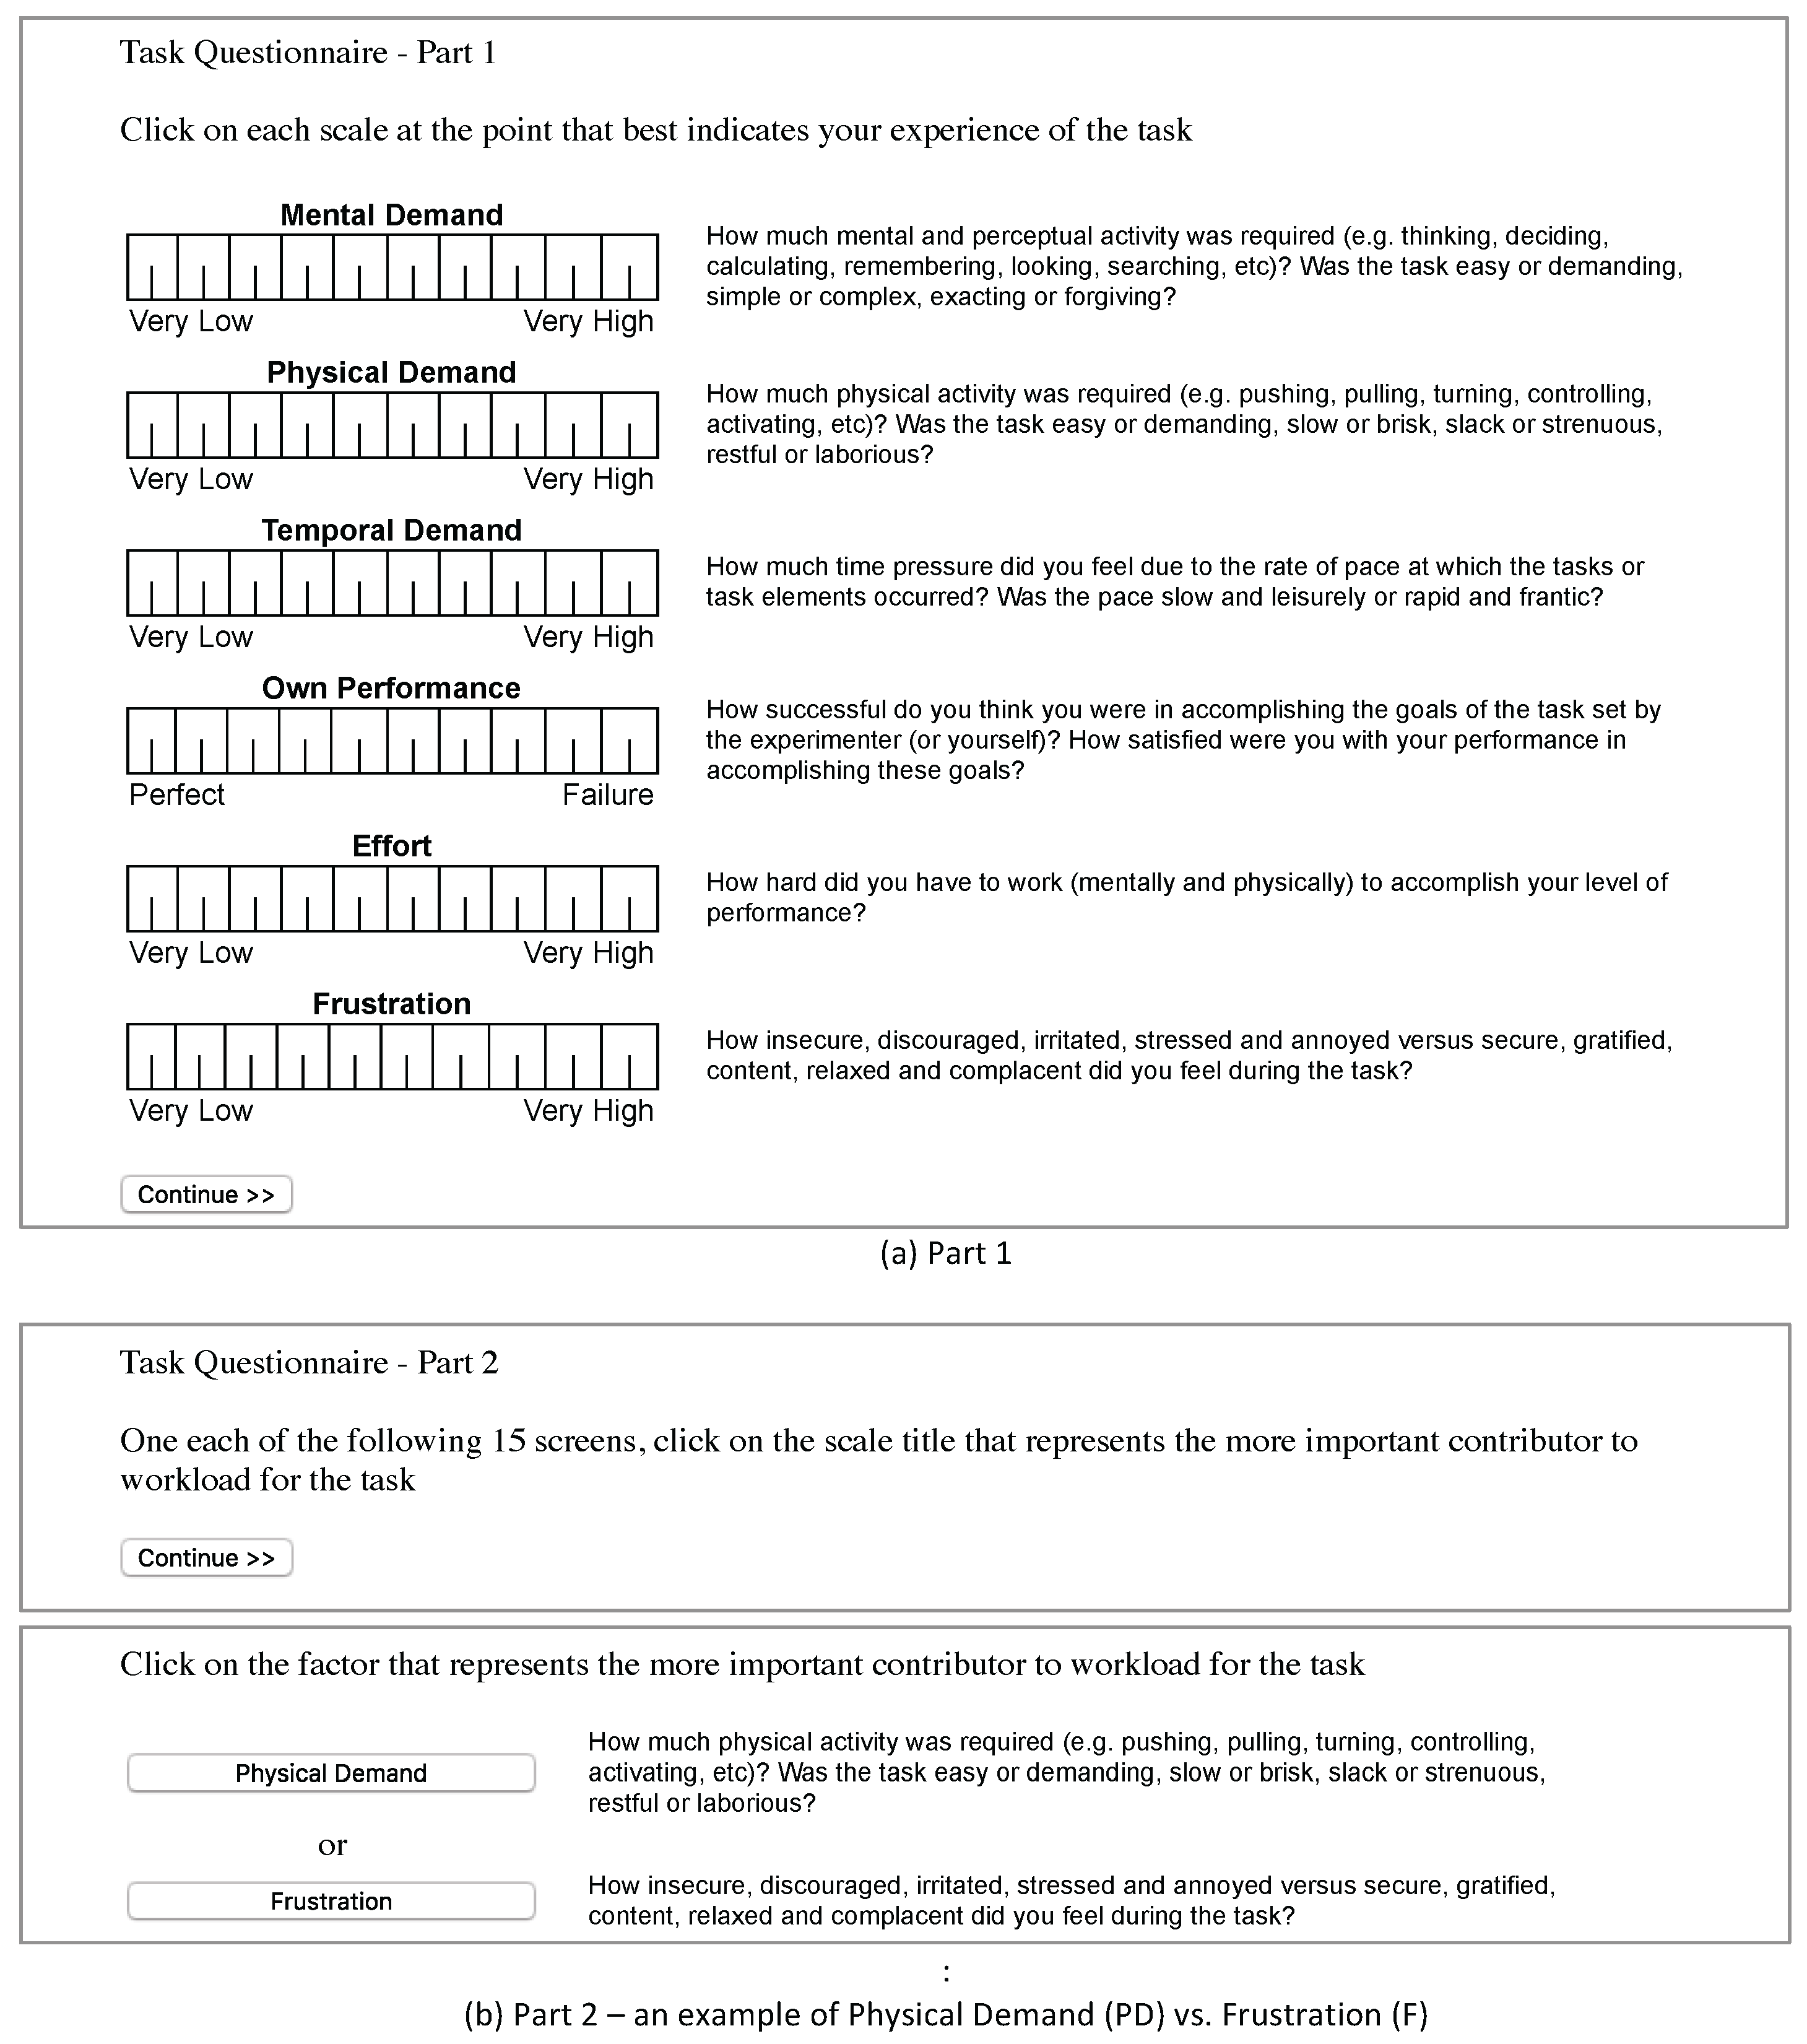
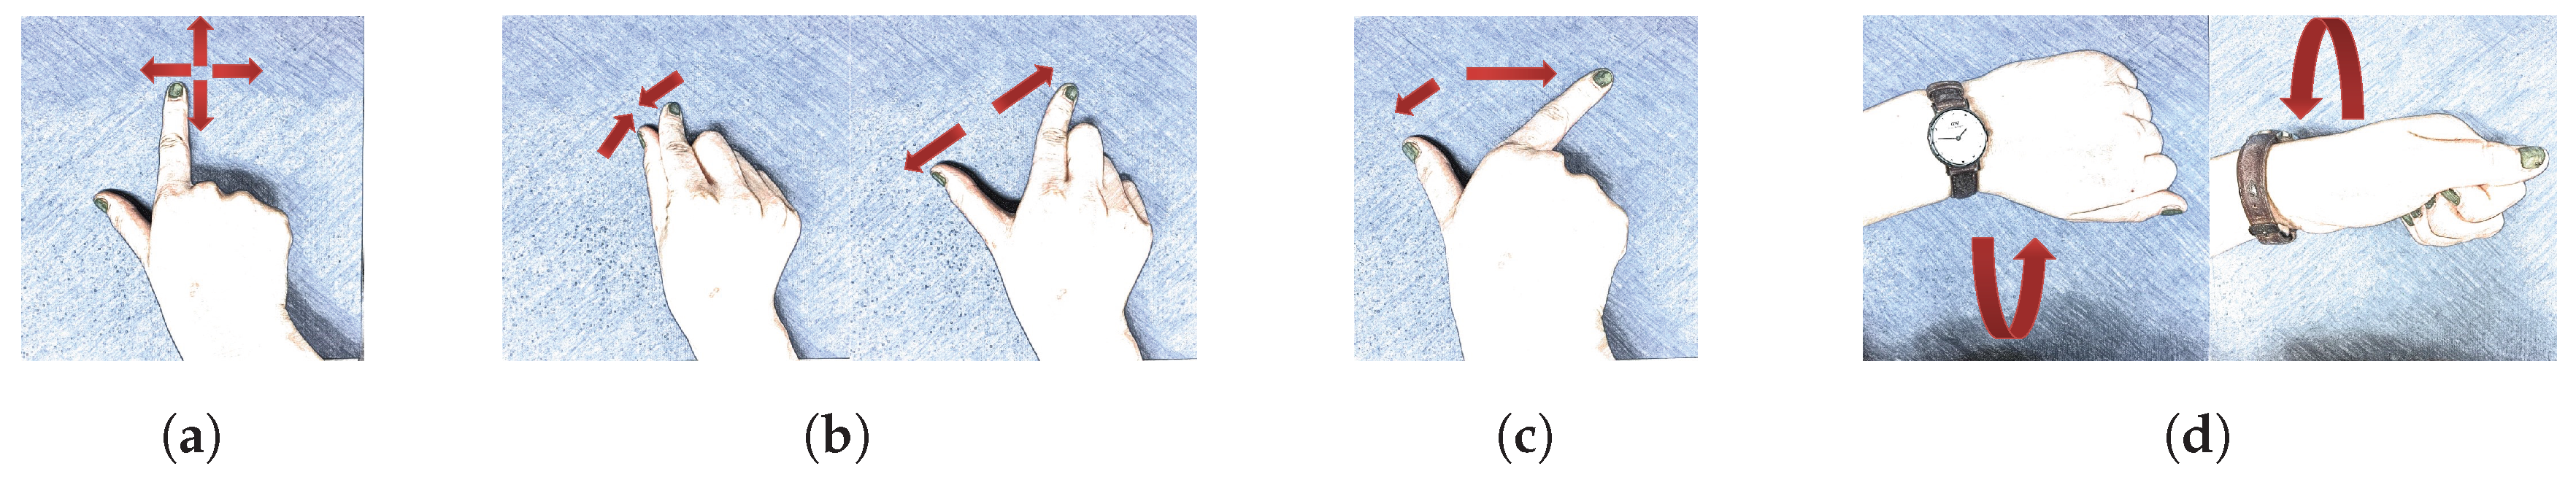
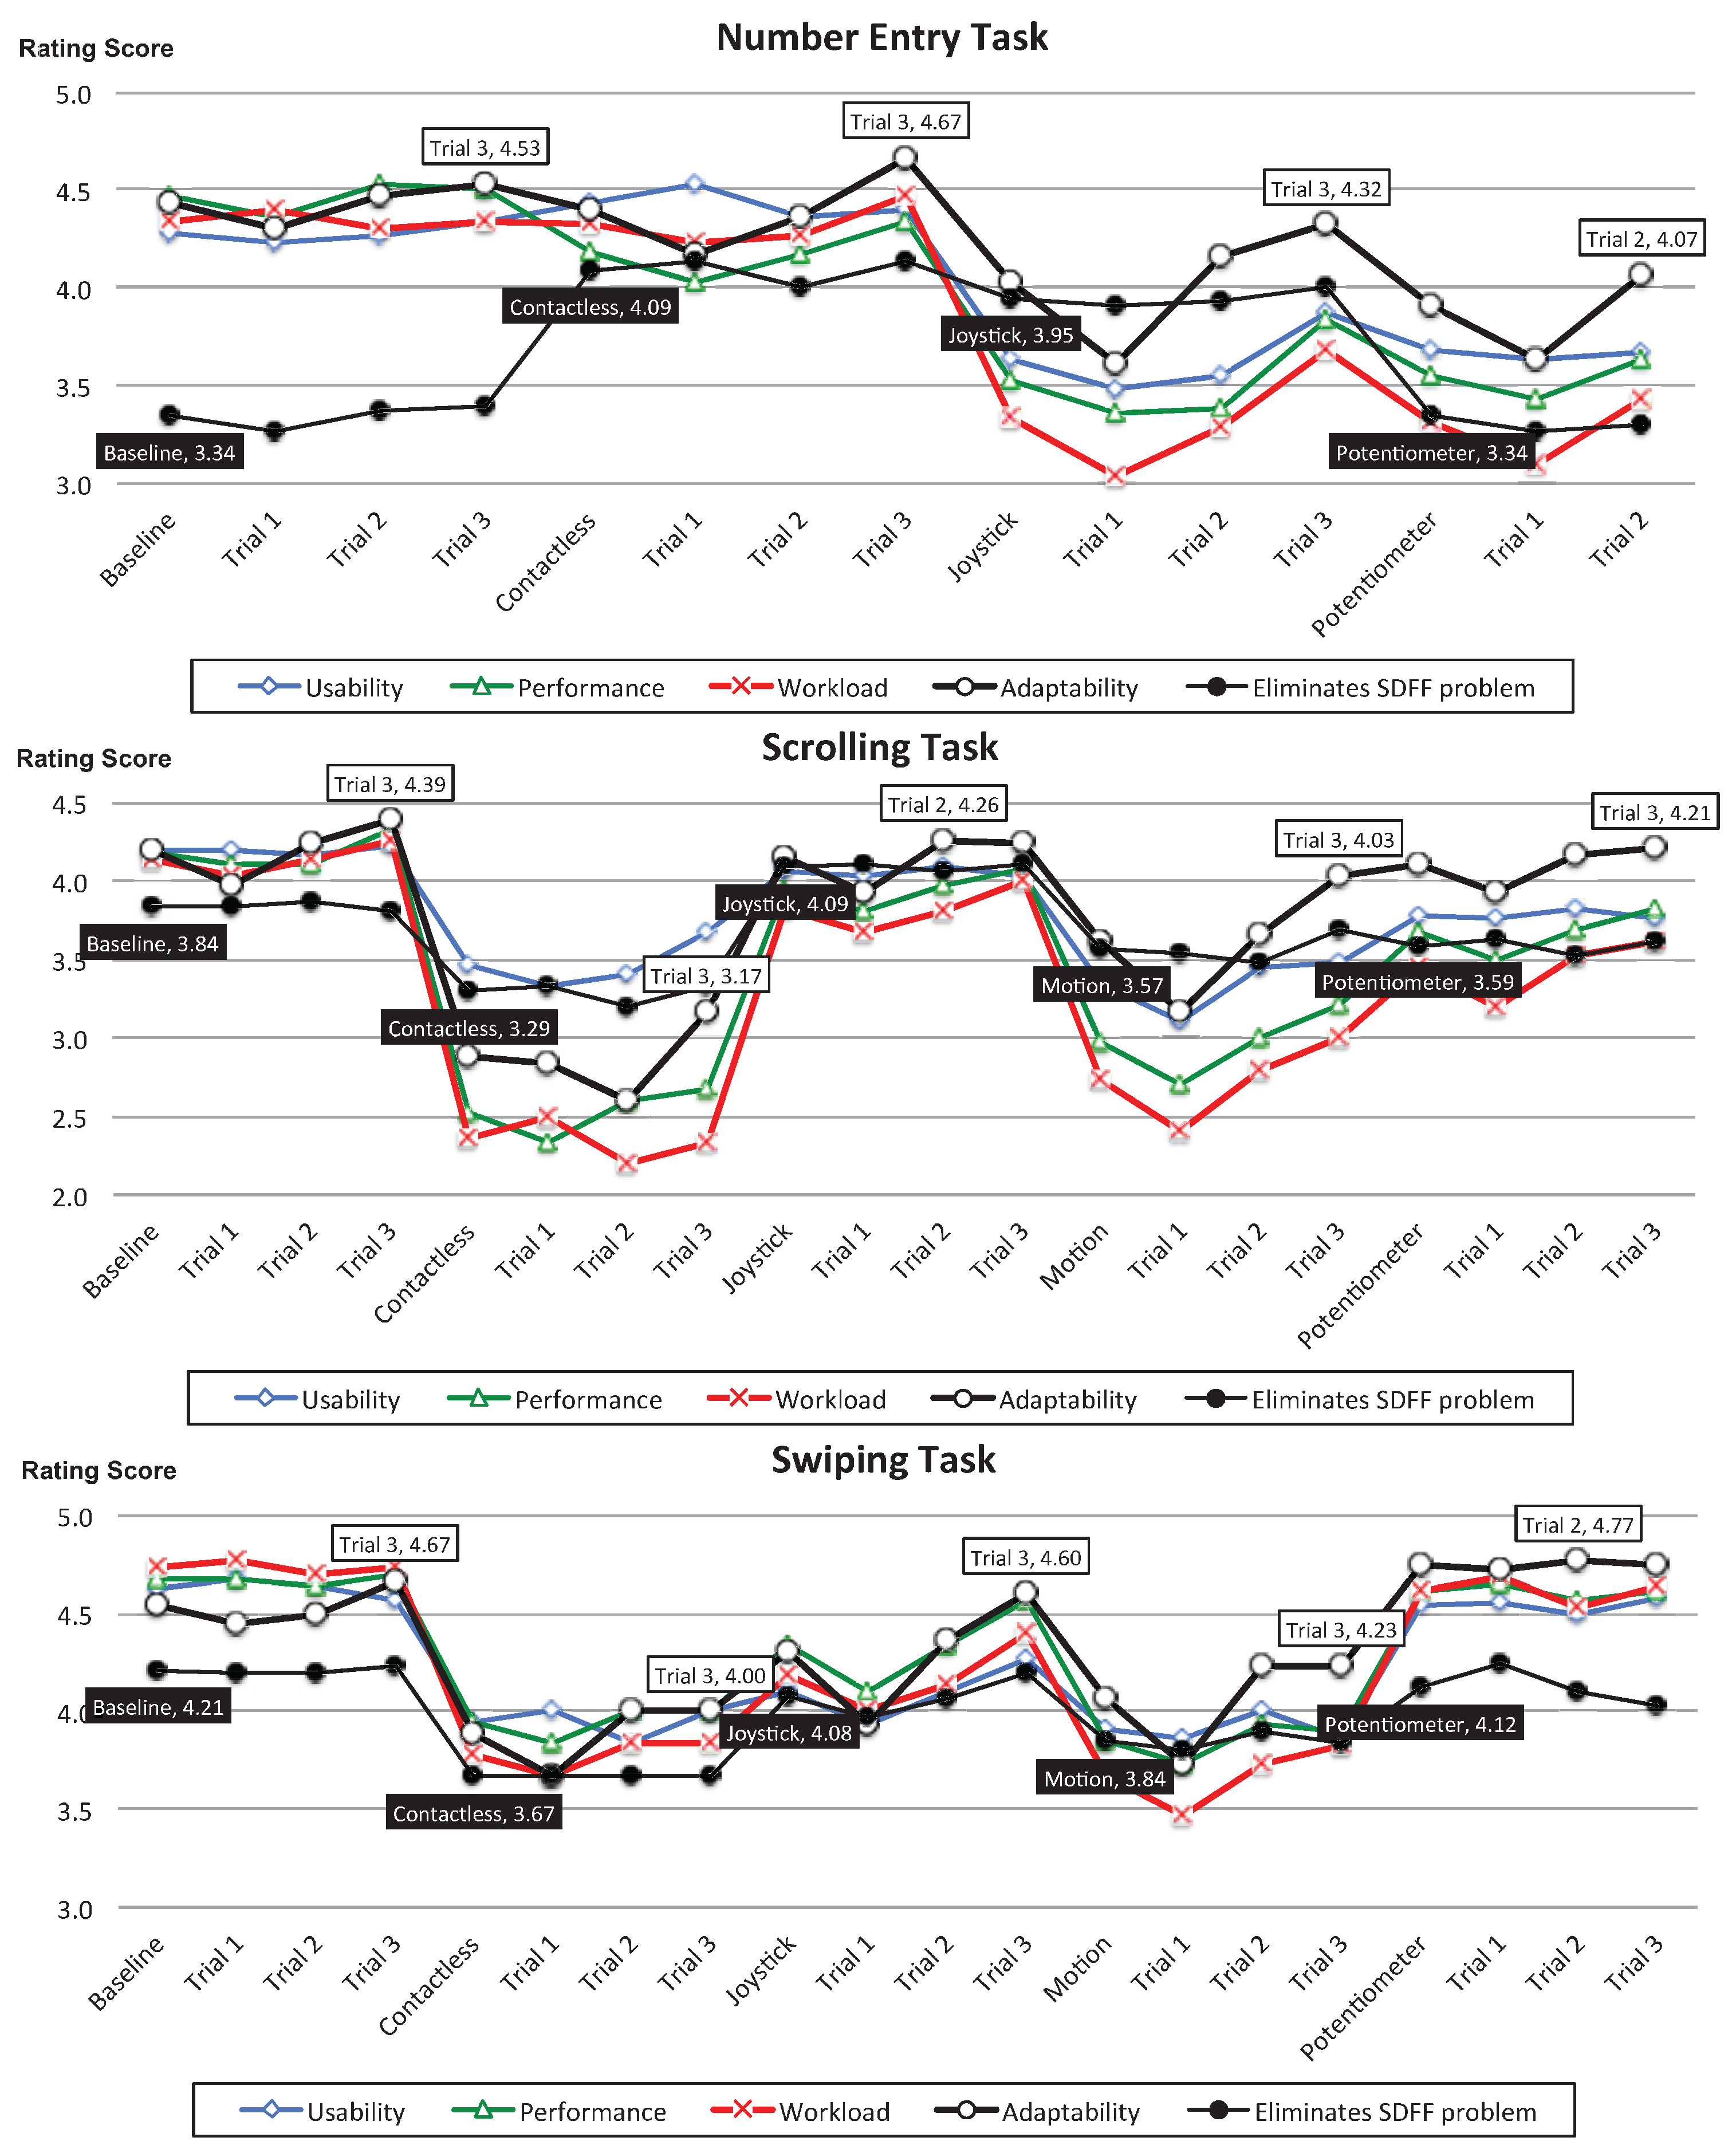
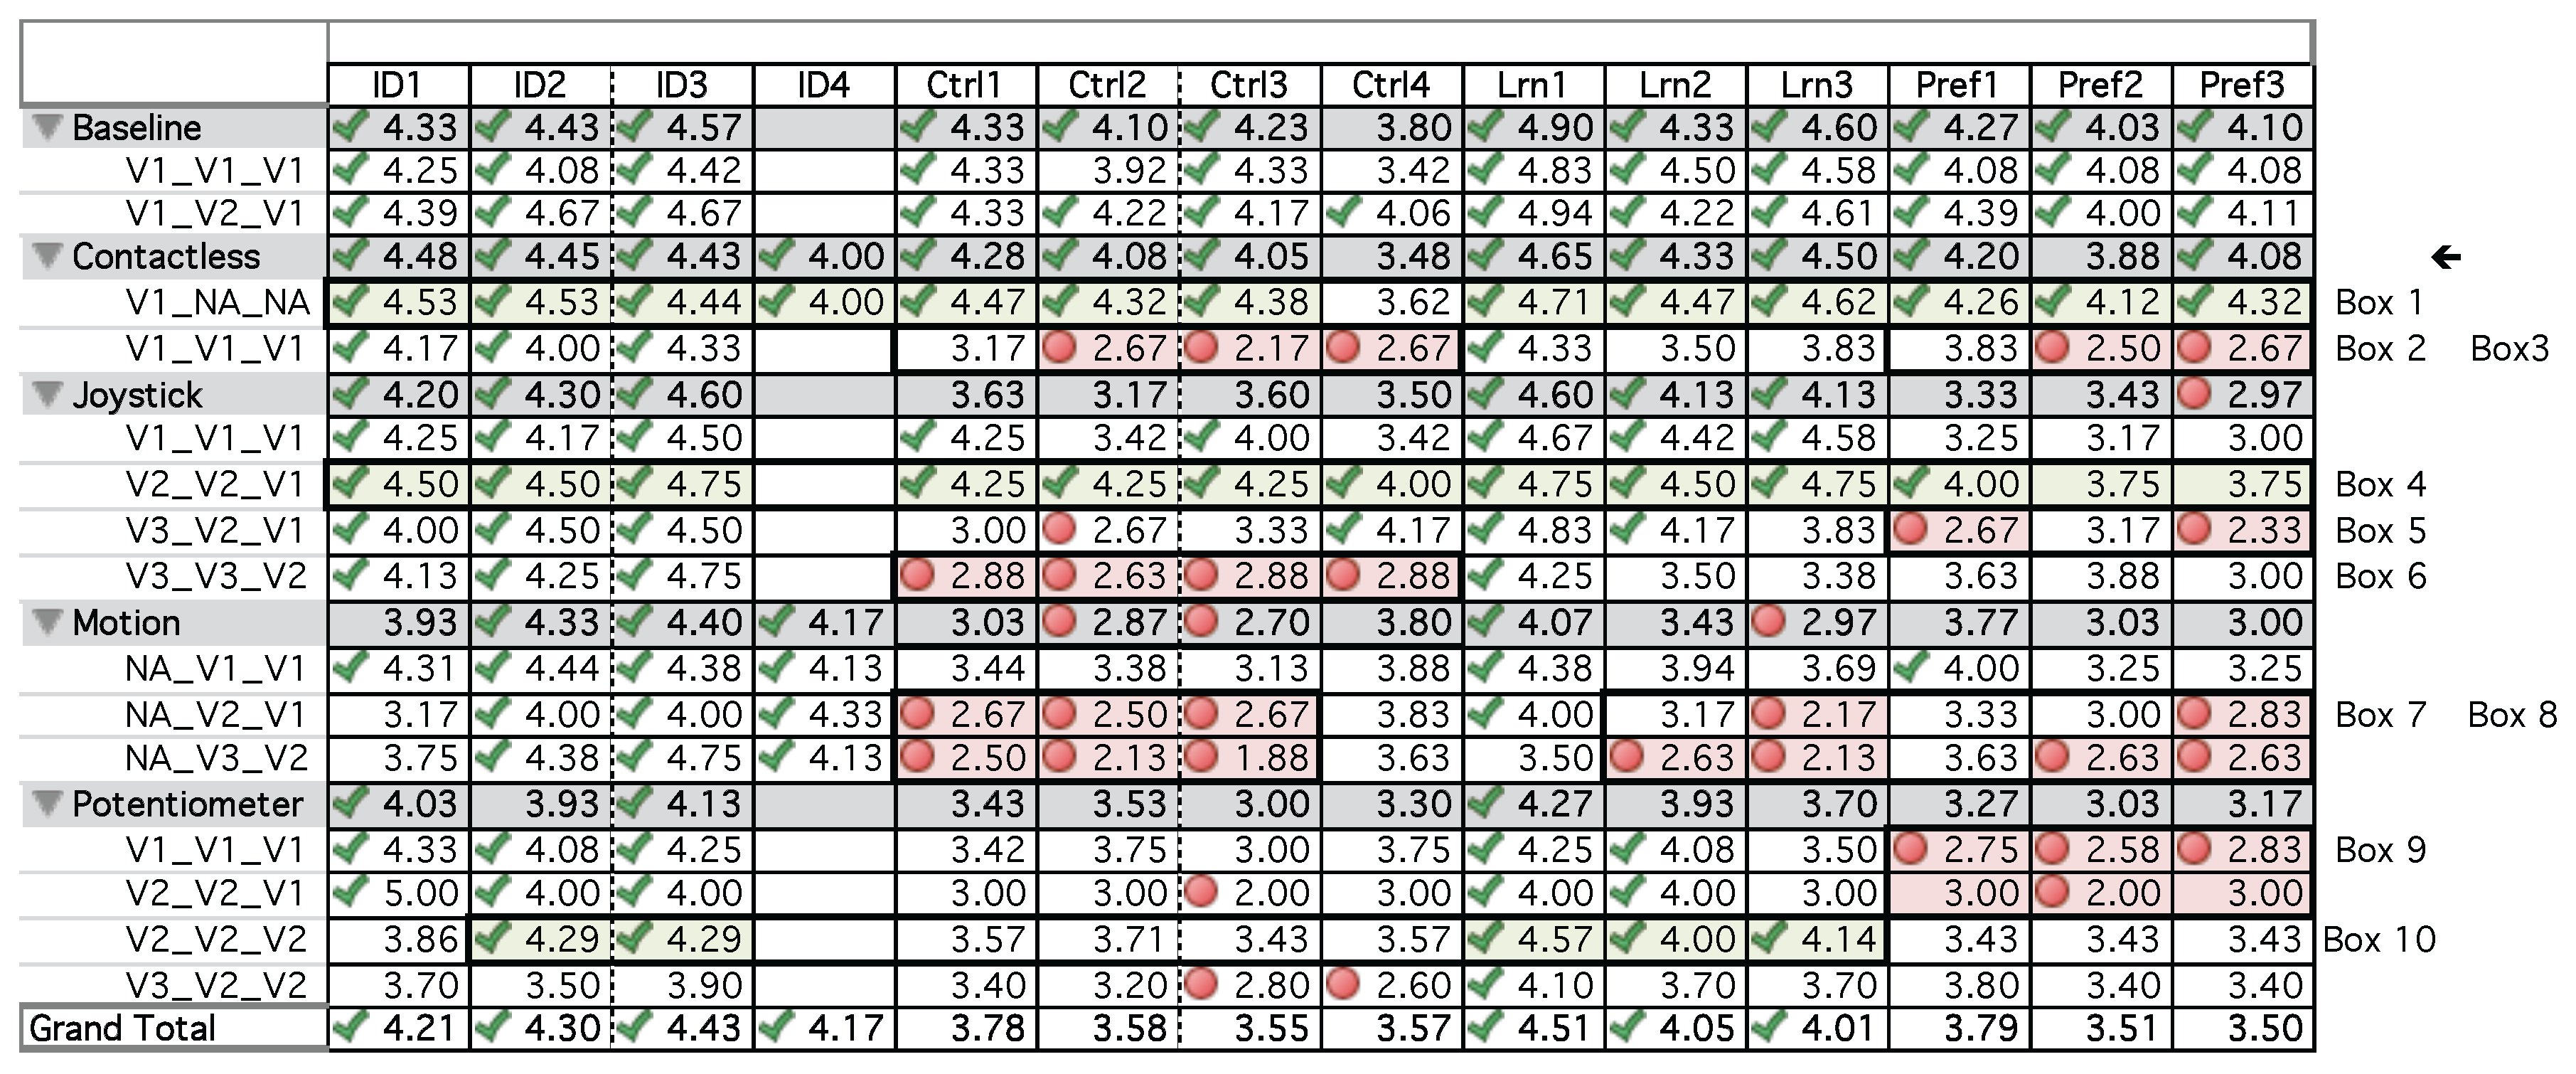
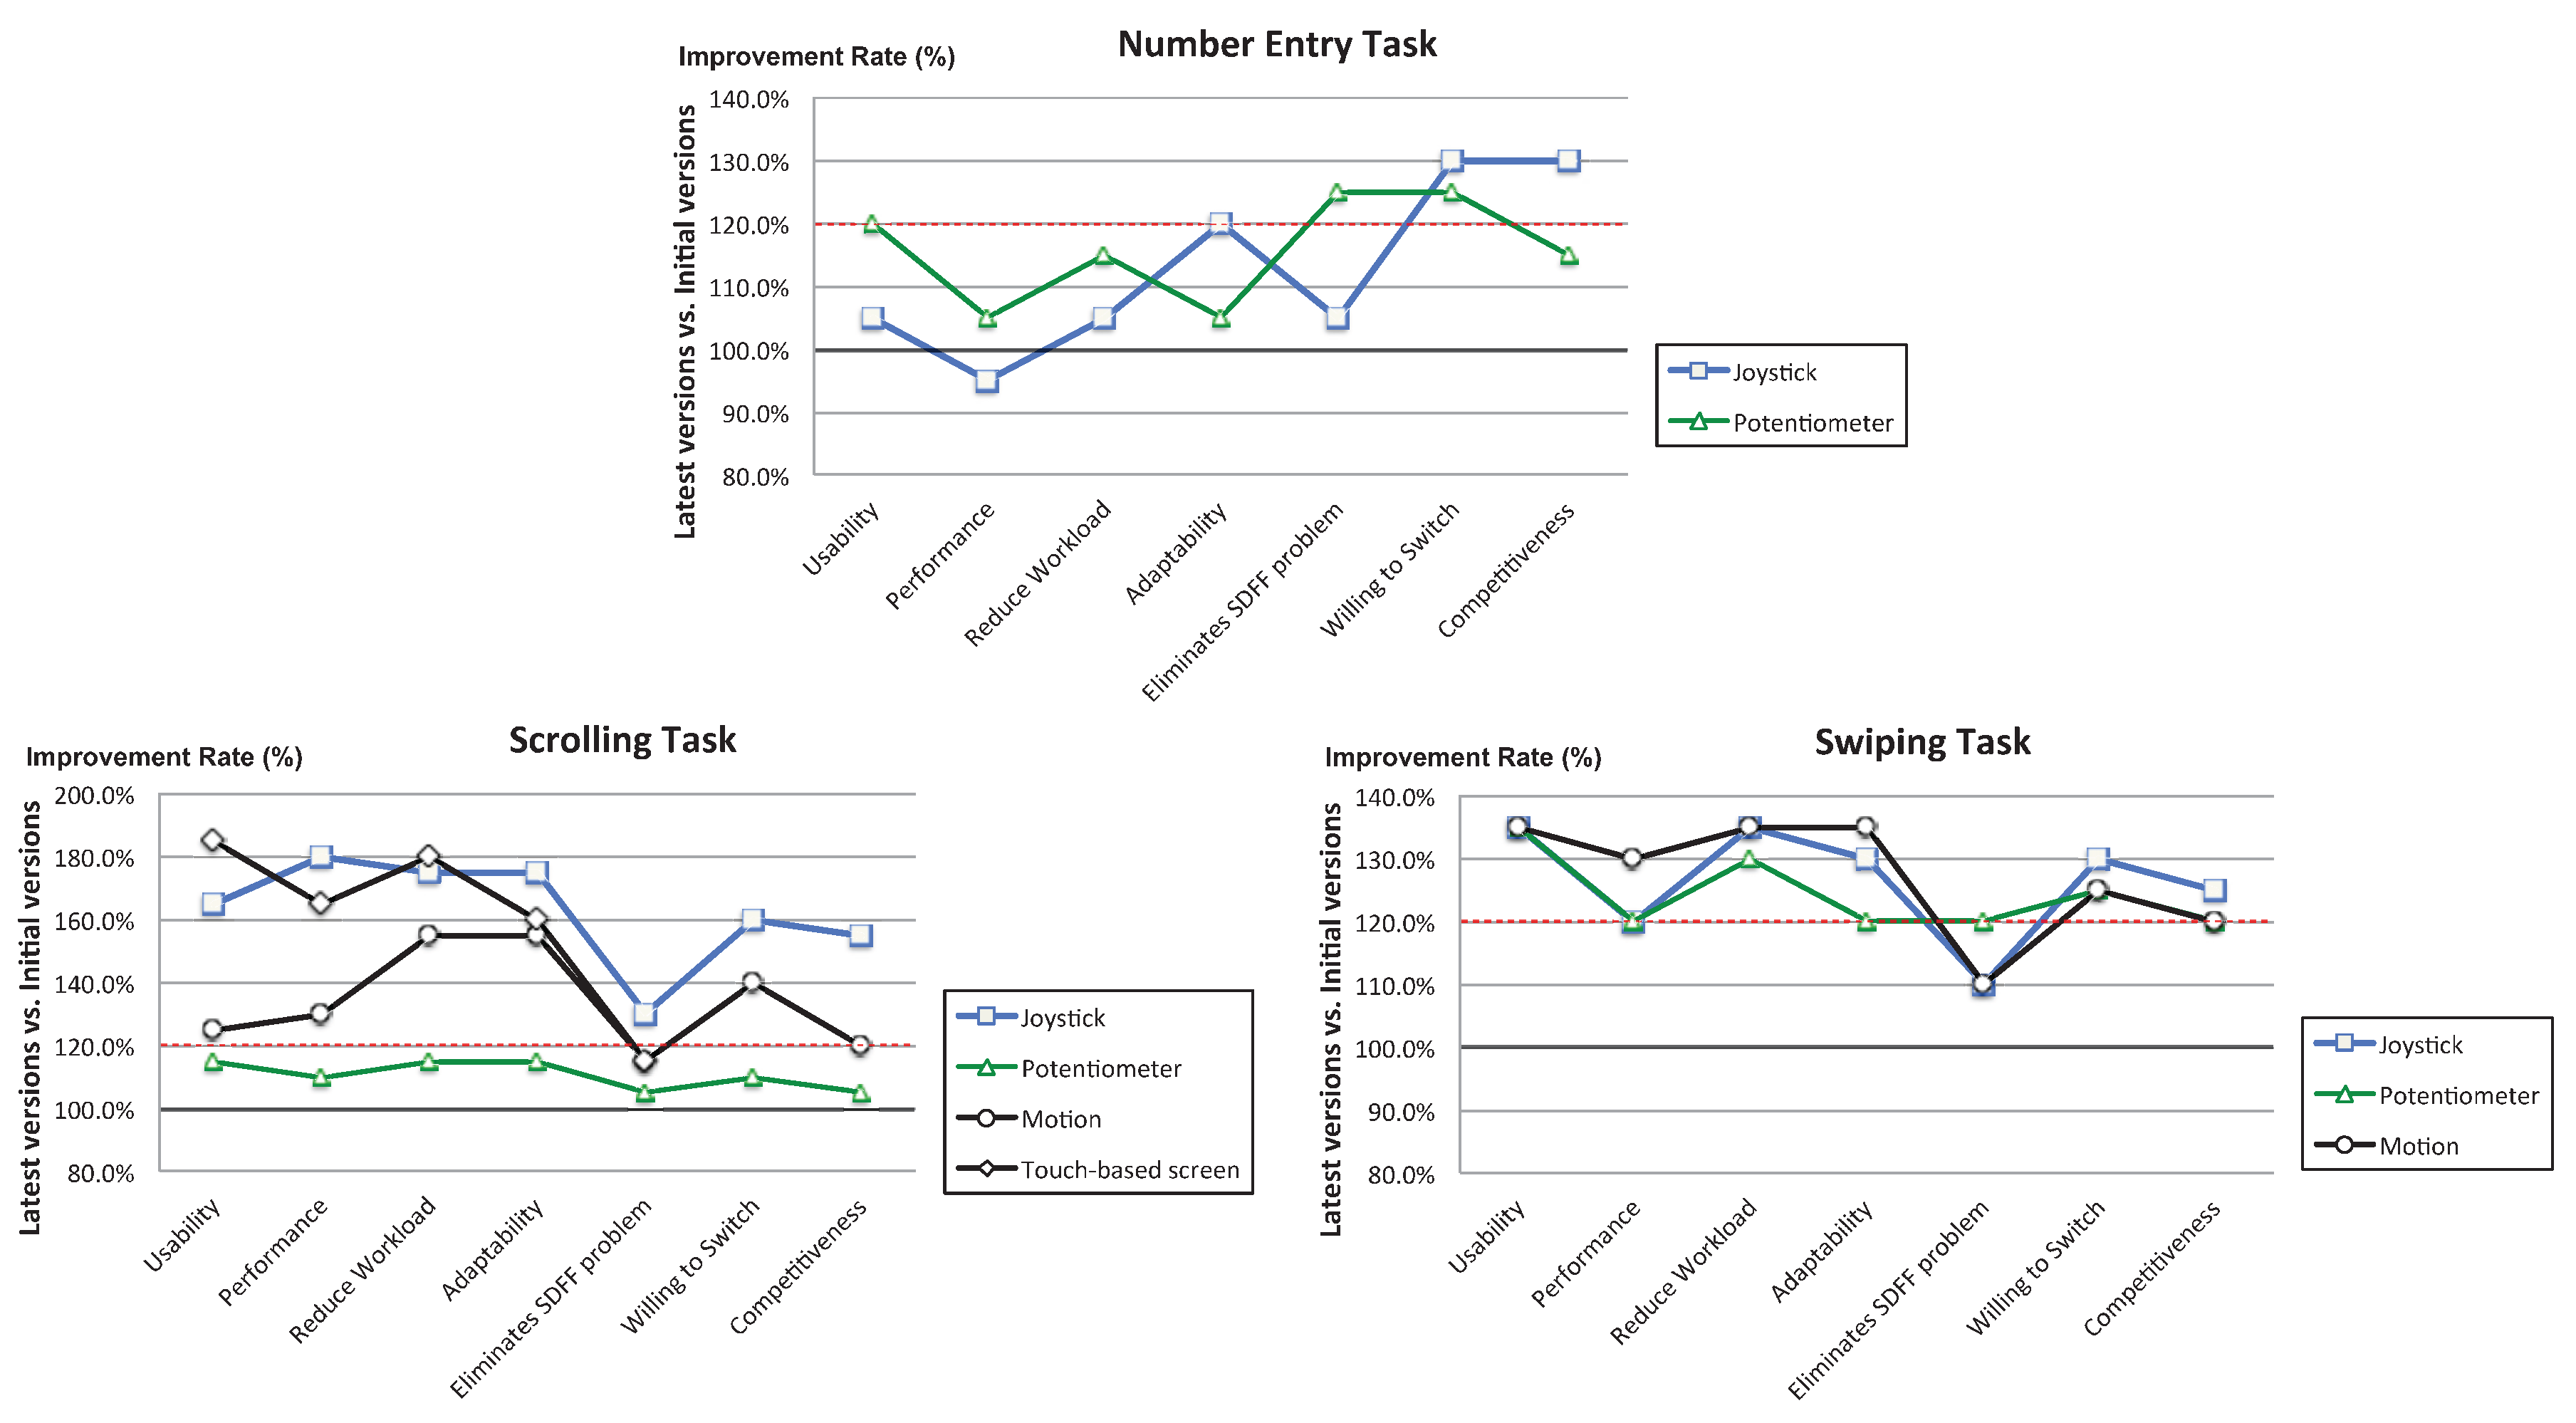
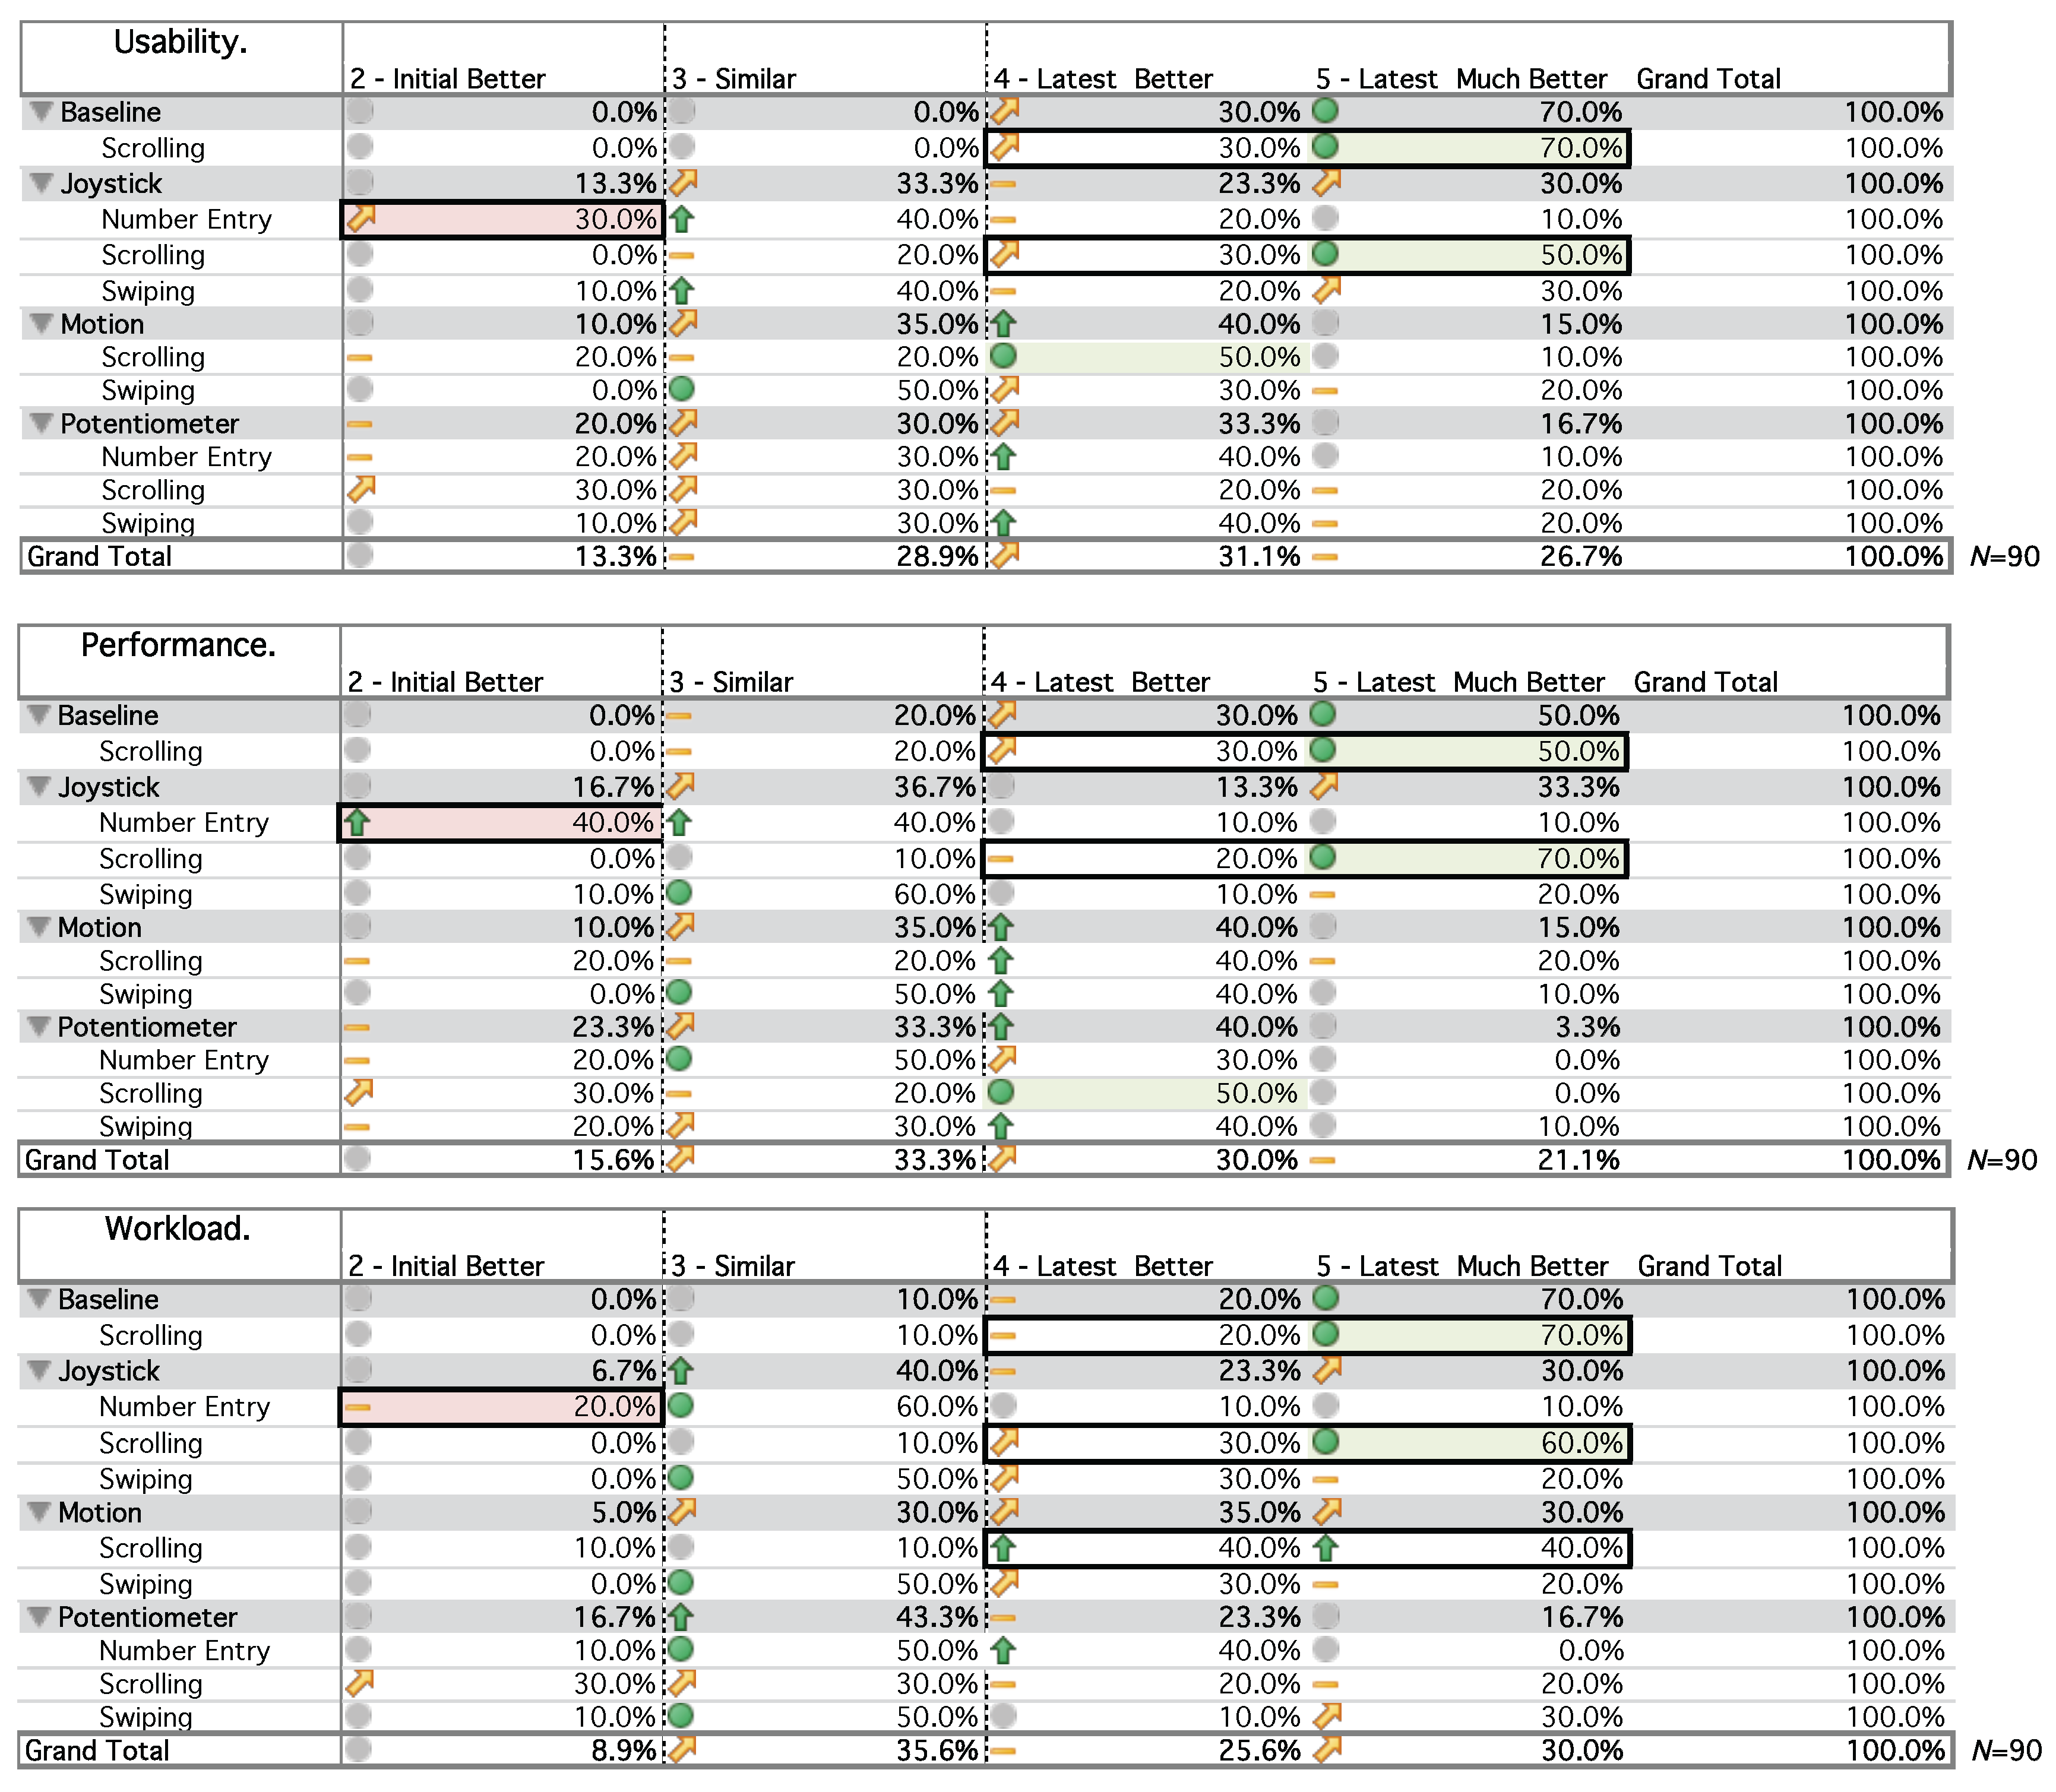
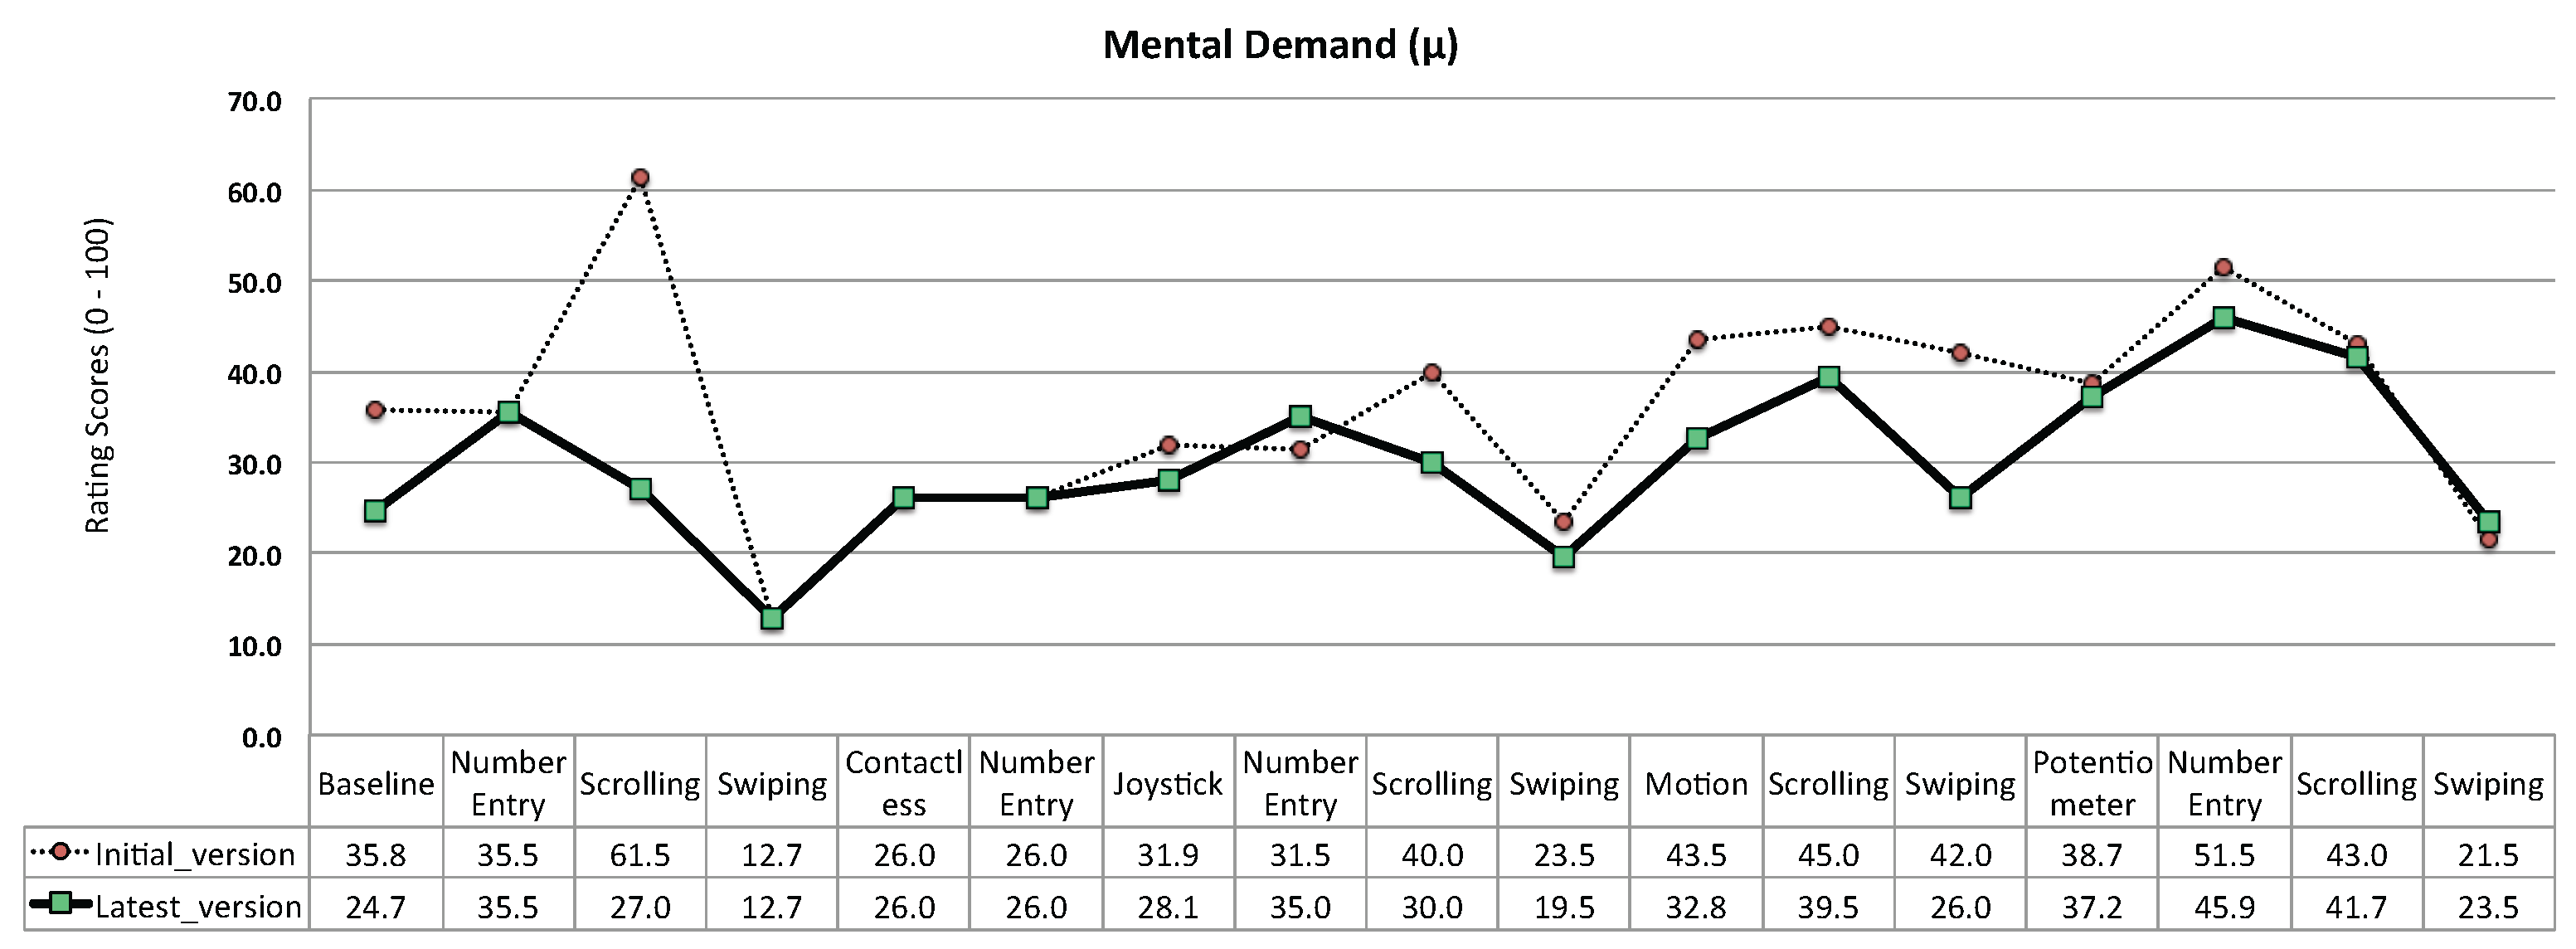
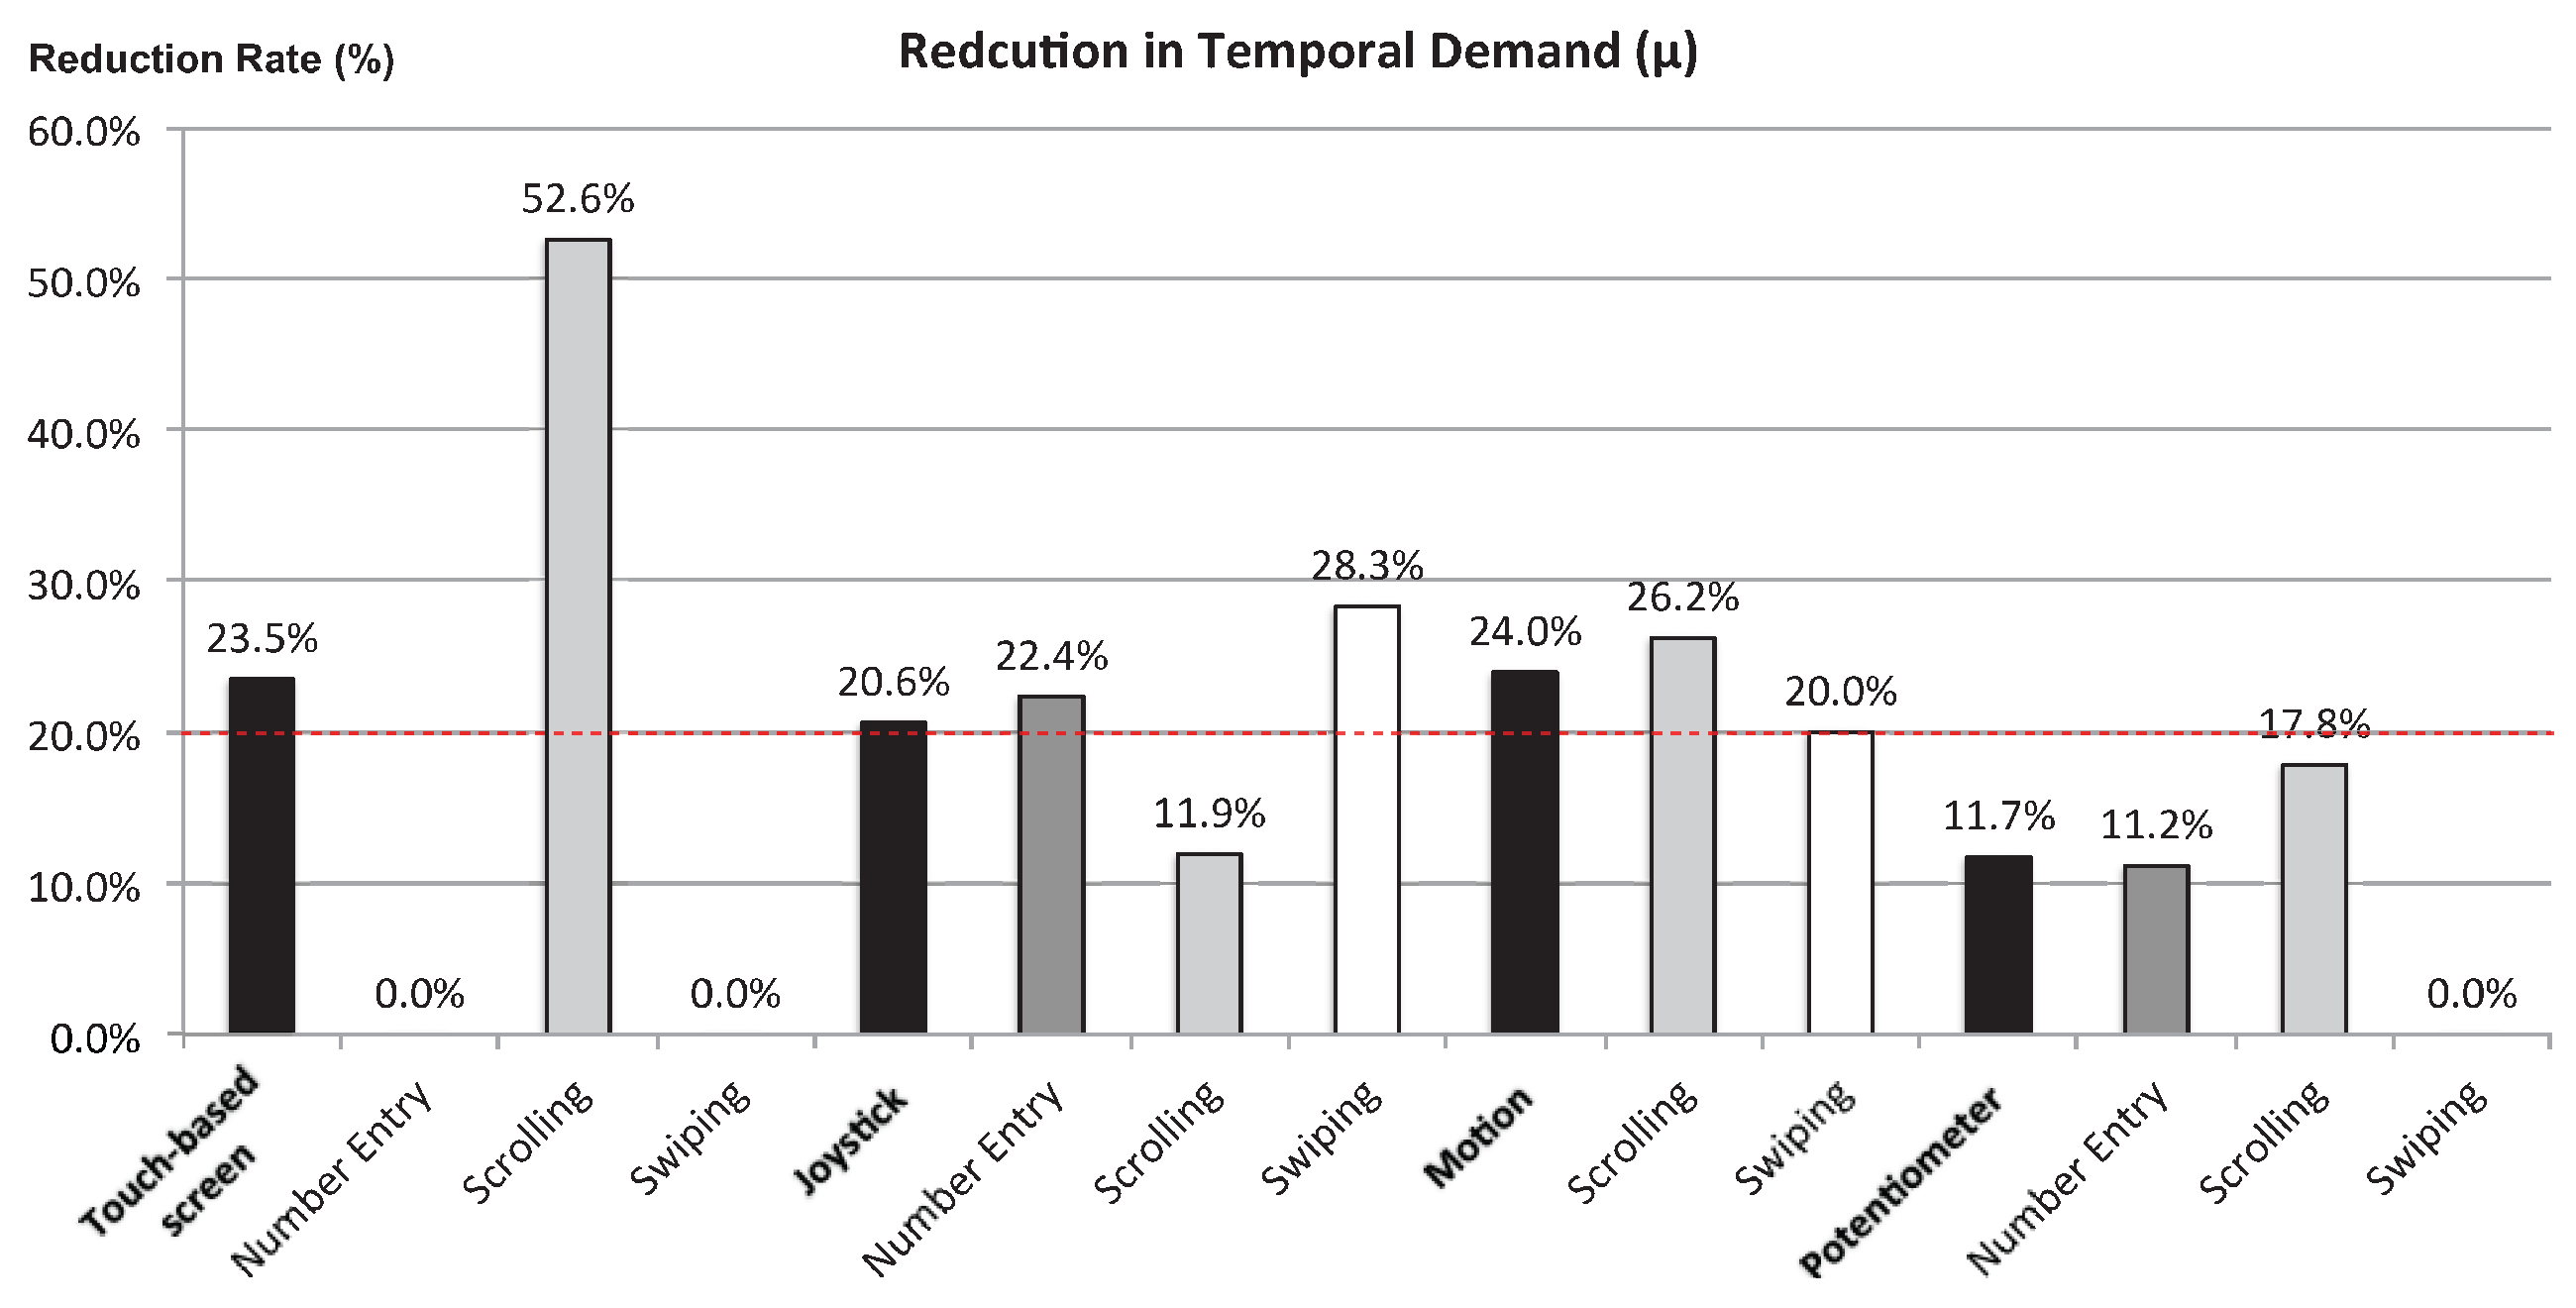
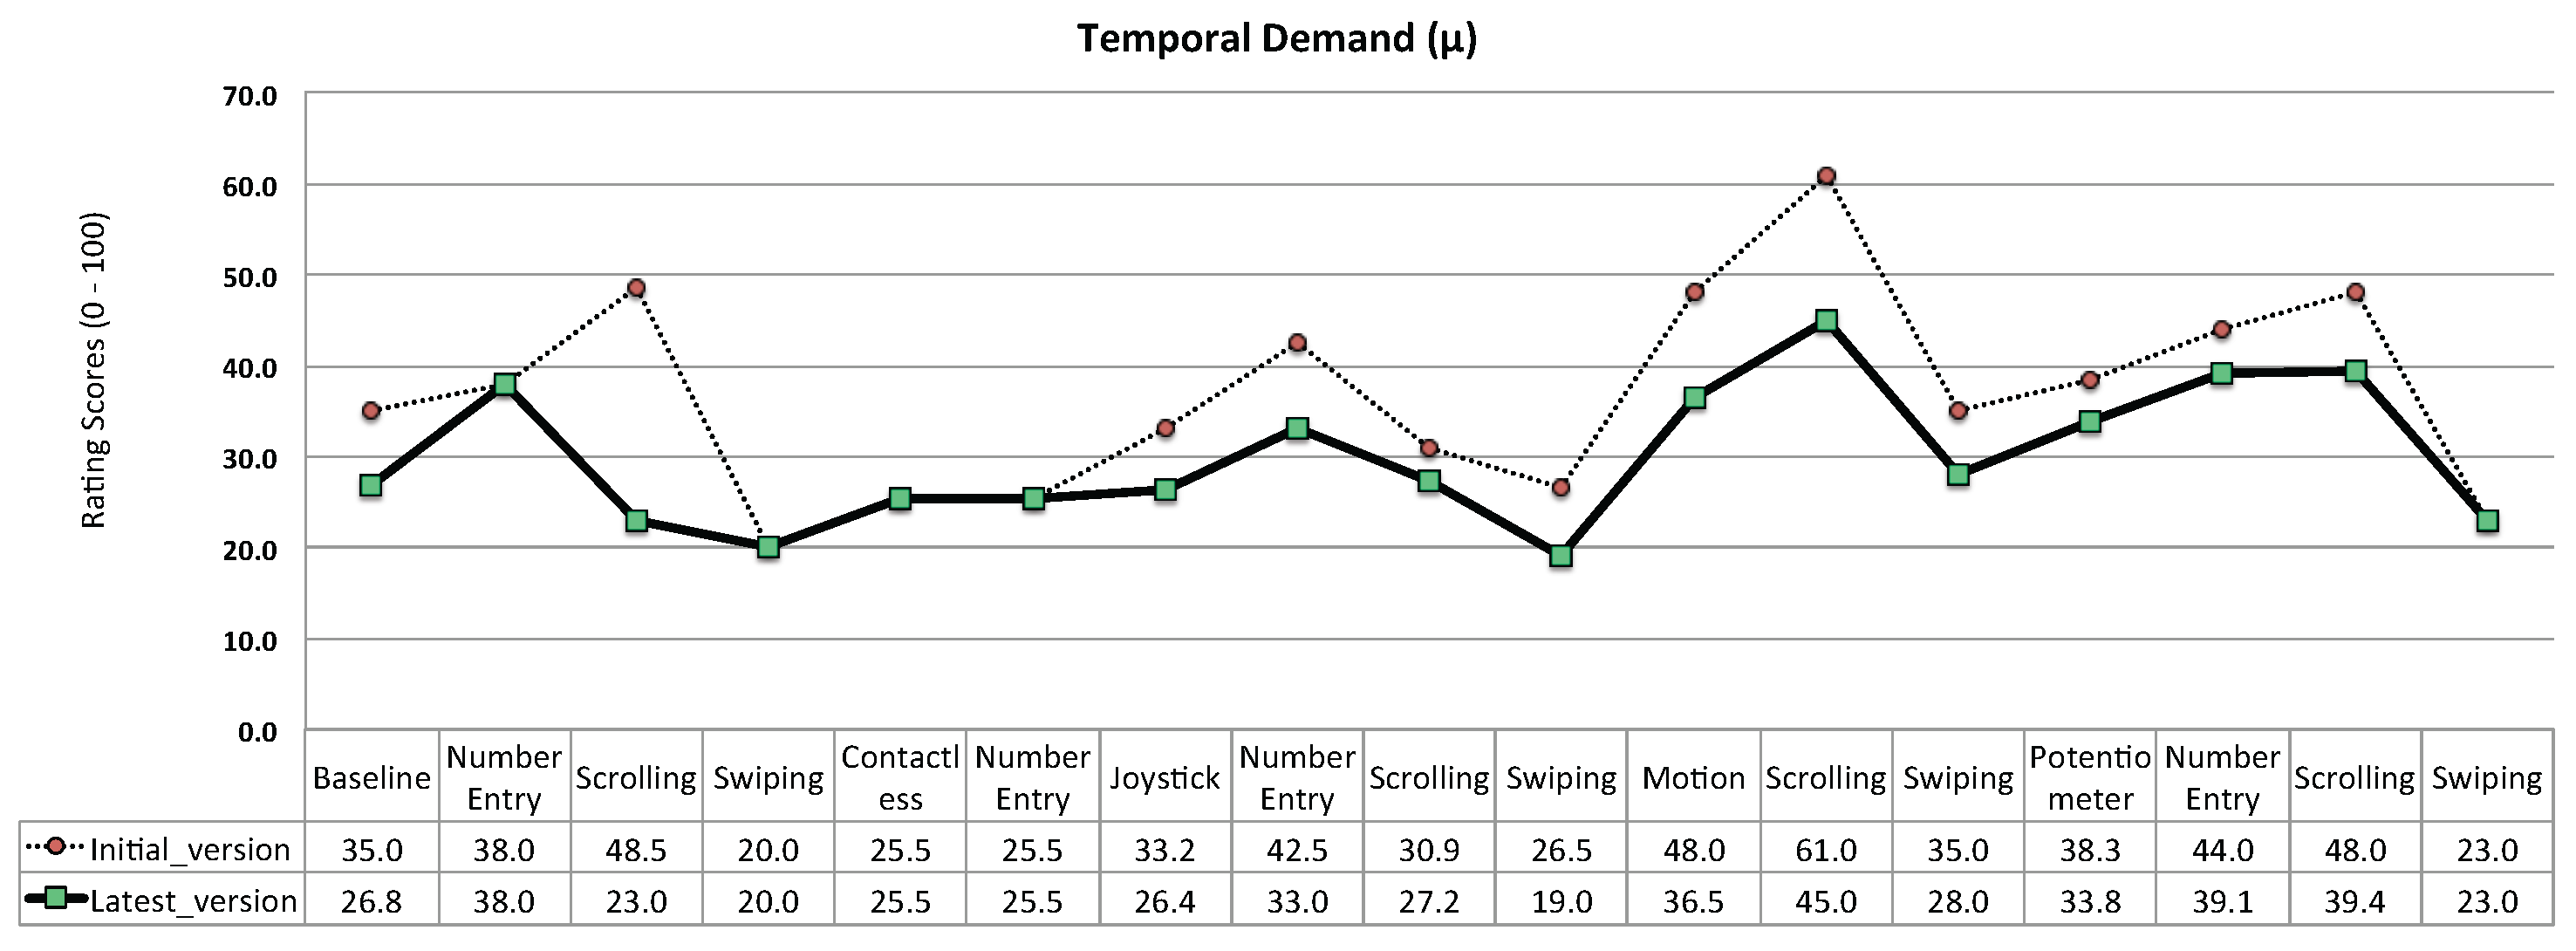
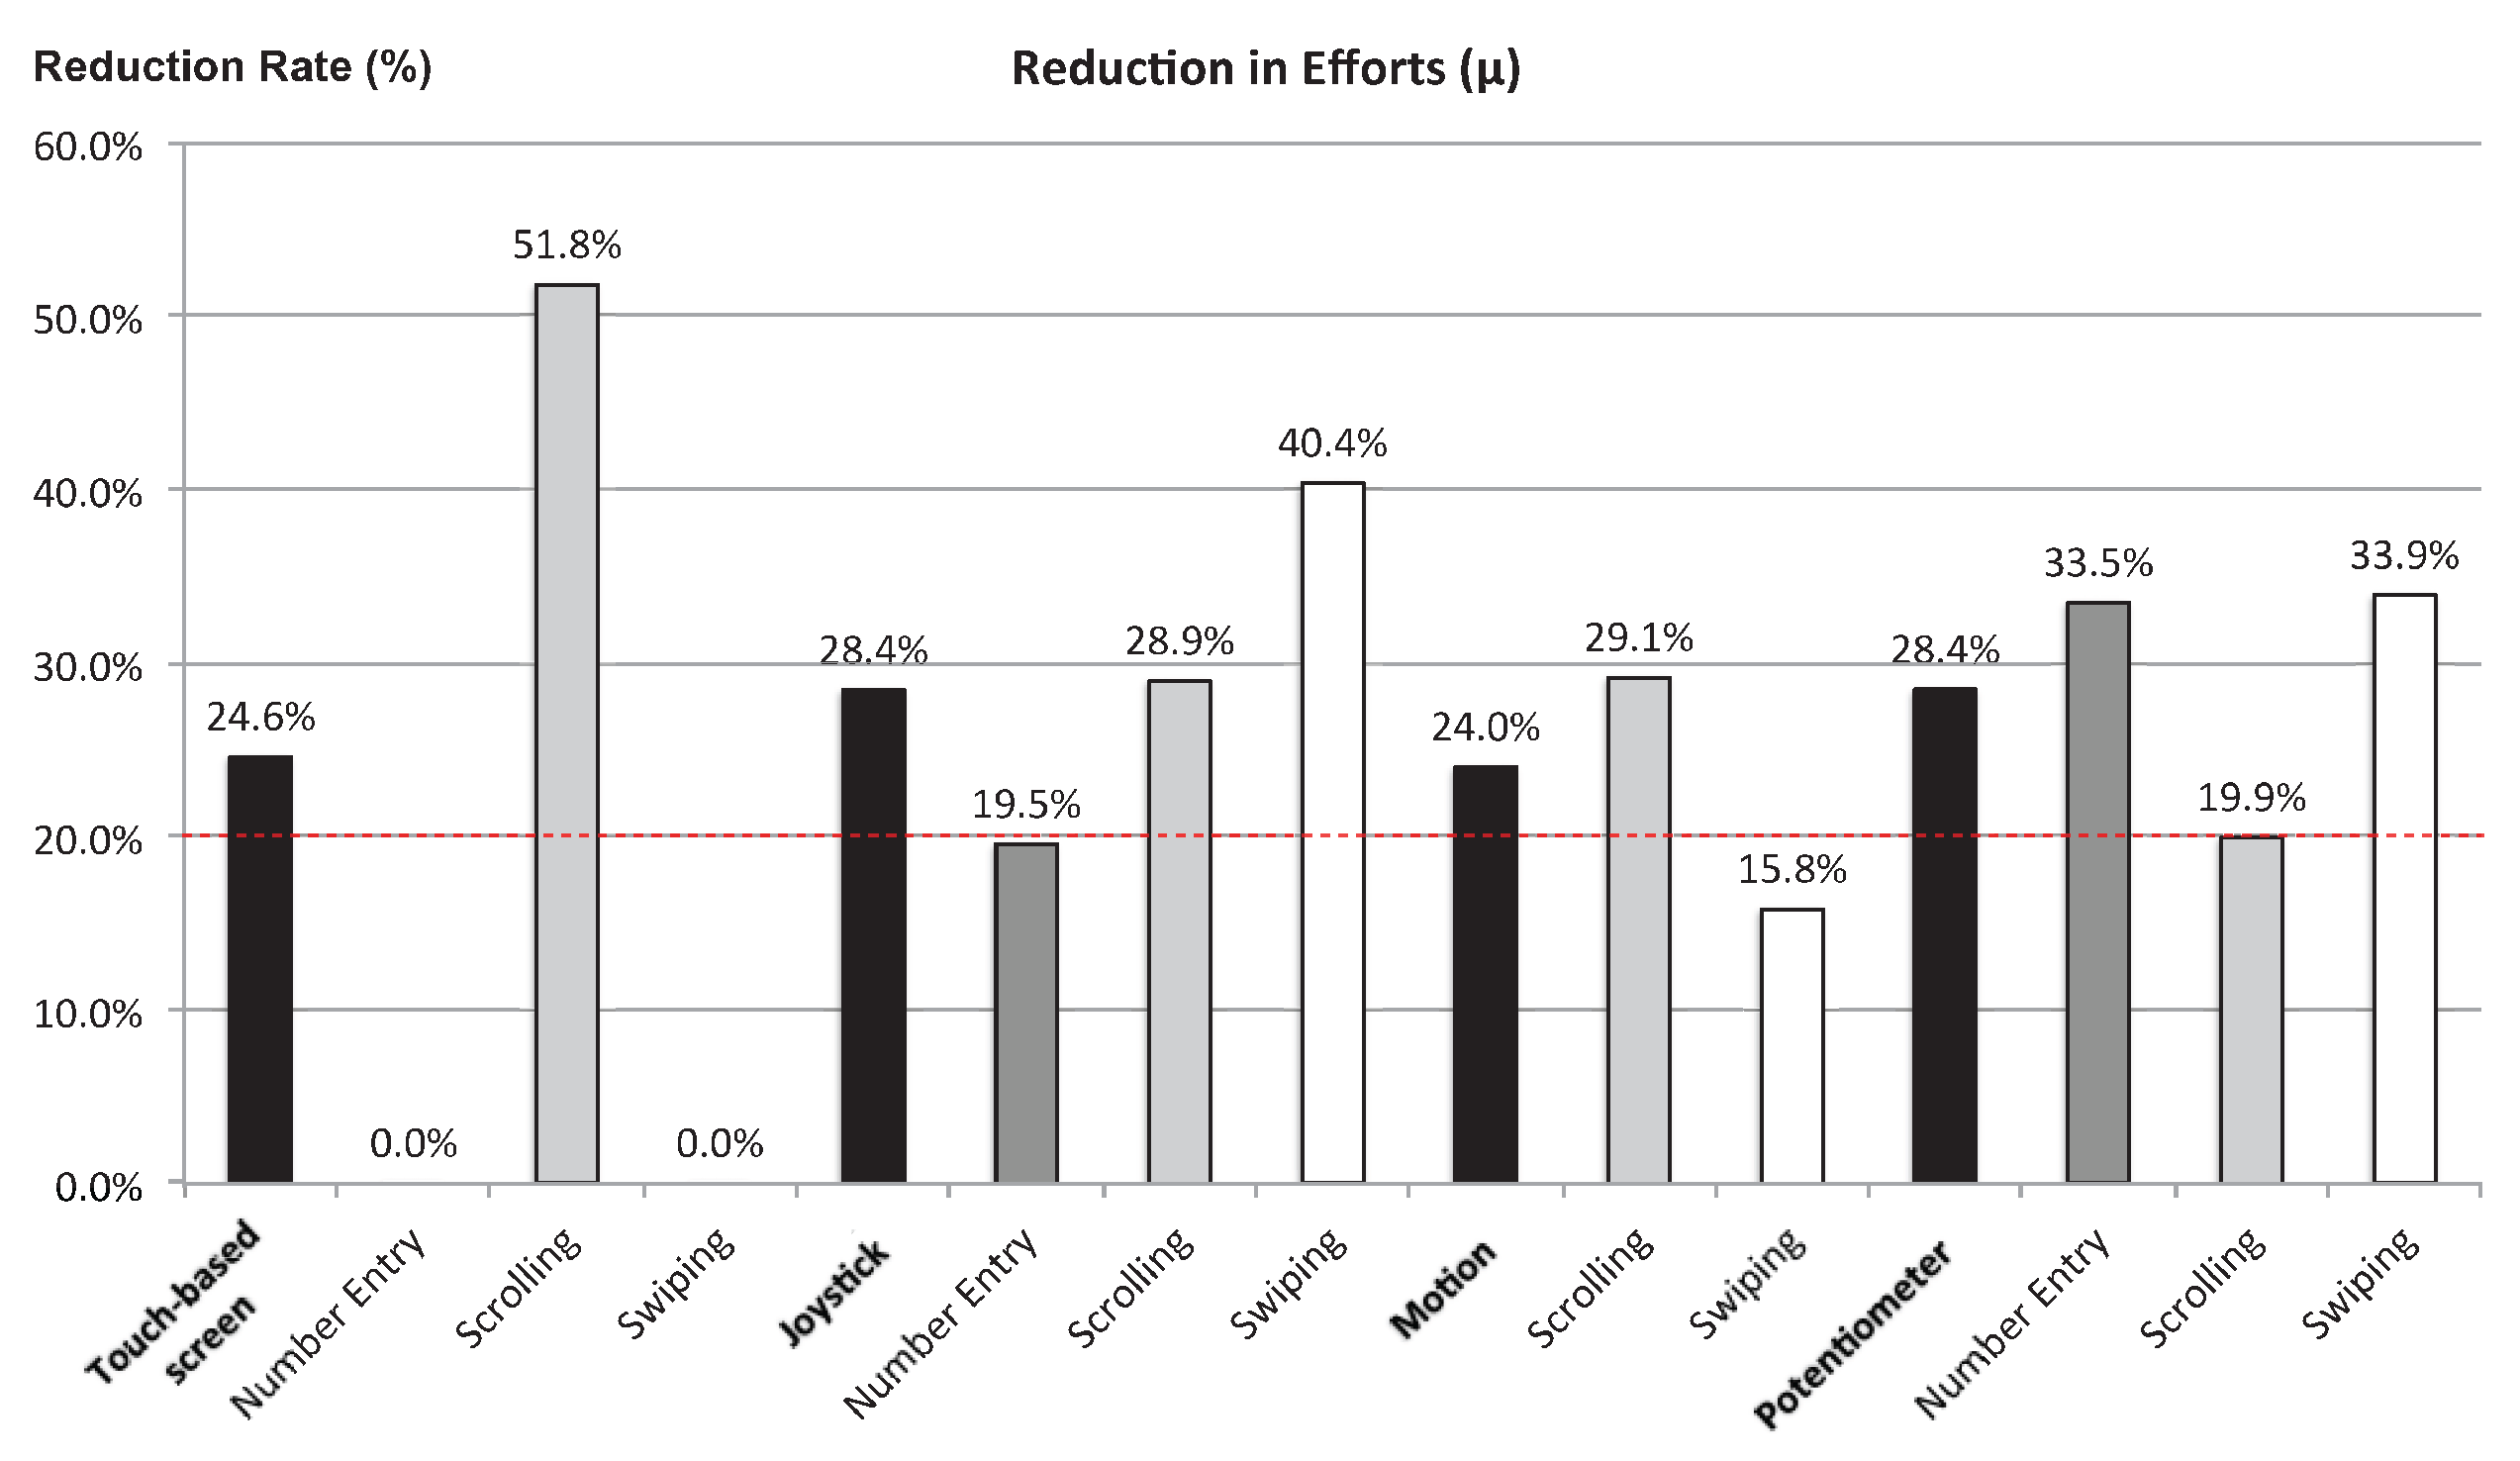
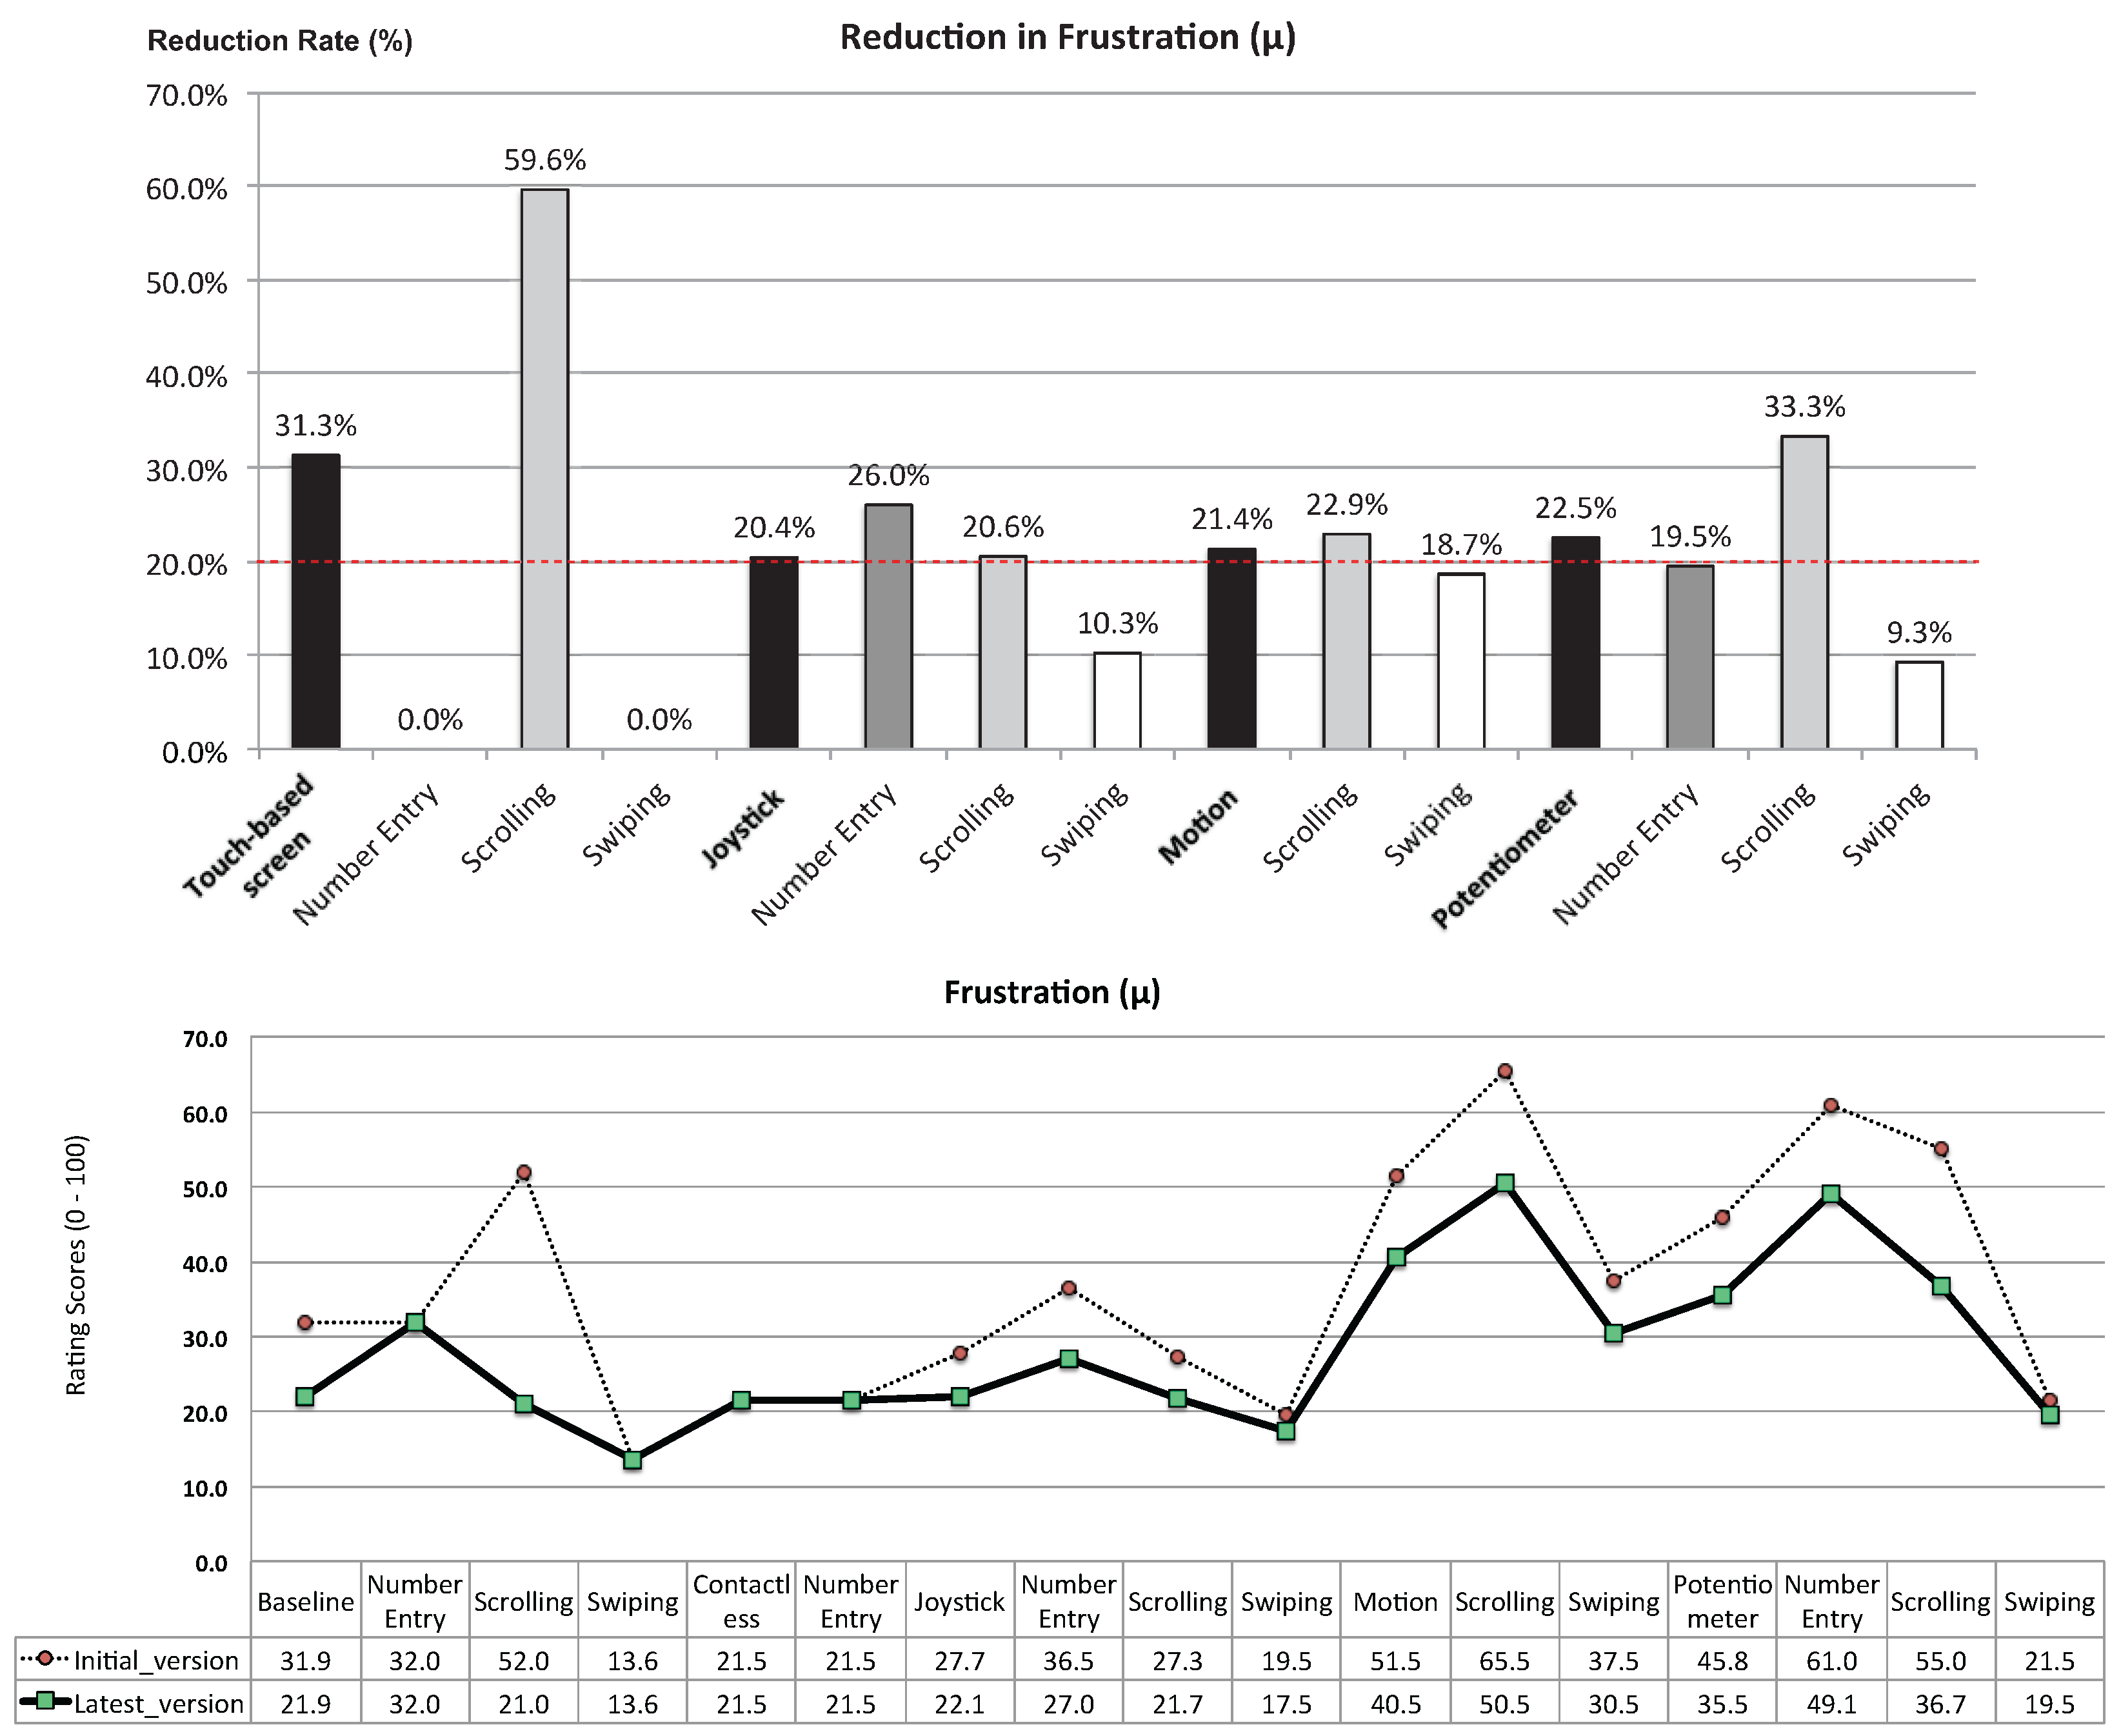
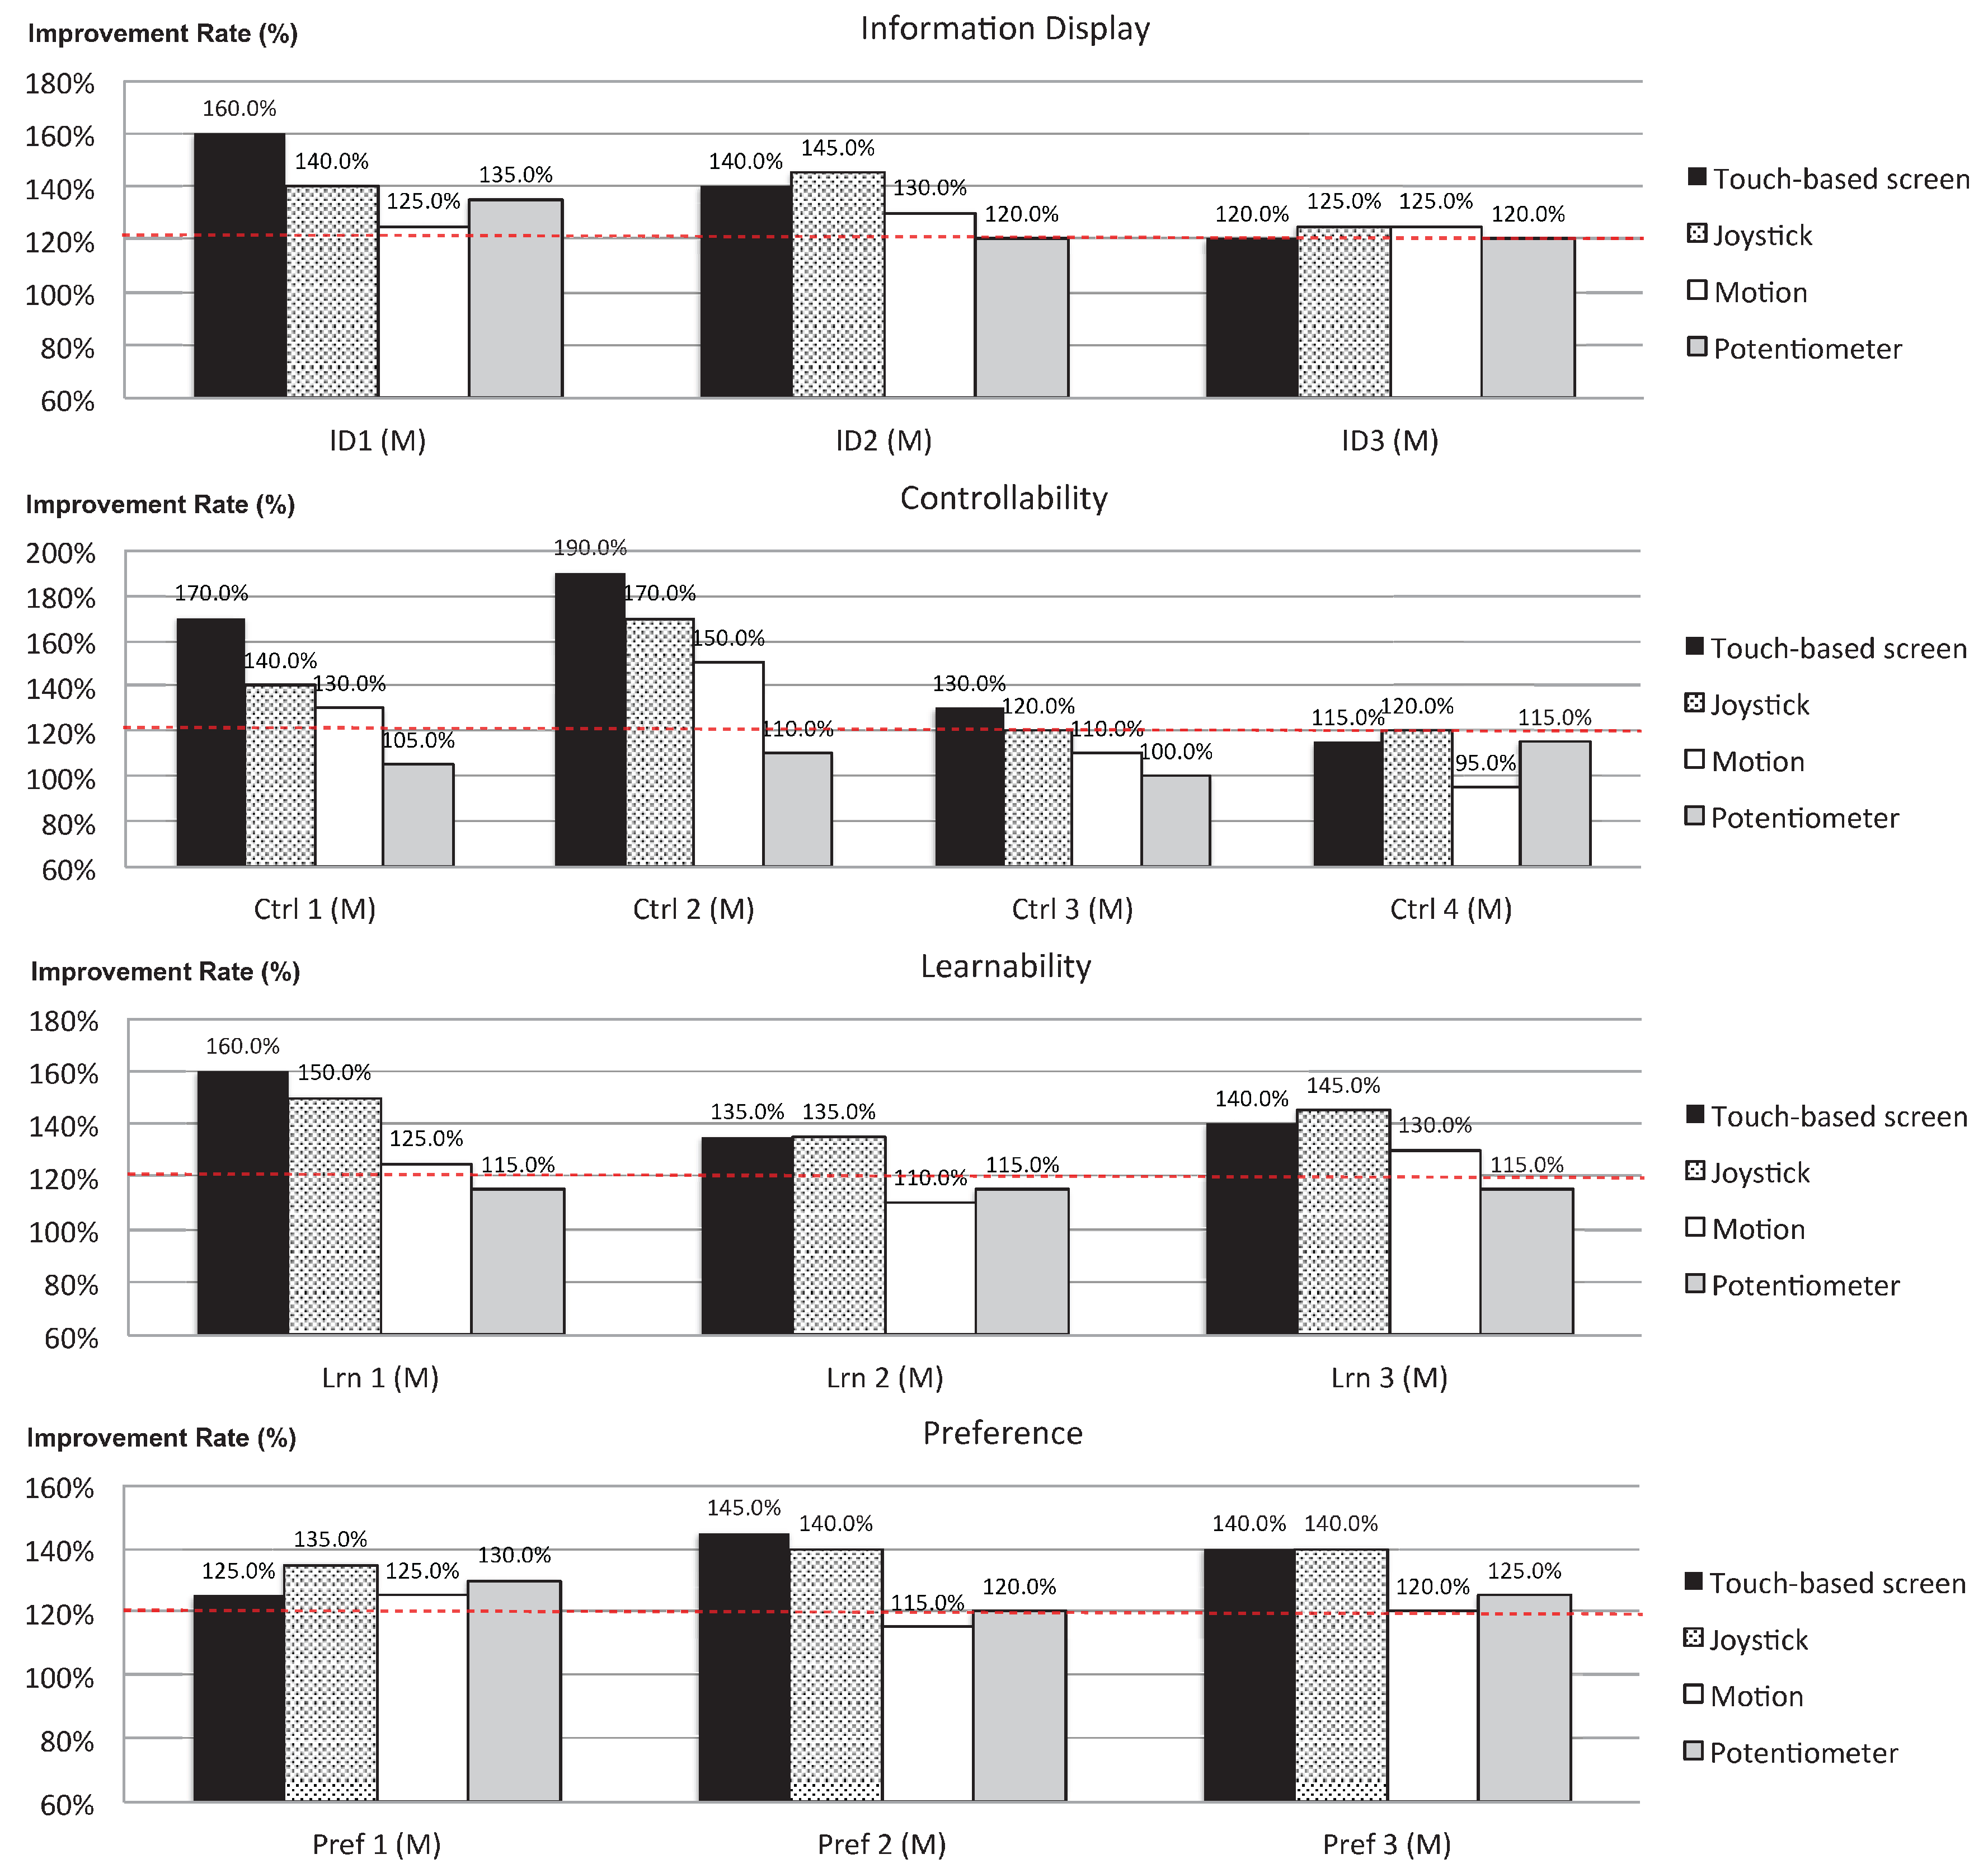
Table 1.
Text entry and scroll/swipe events mapping with corresponding joystick input.
| Text Entry Event | Joystick Input | Scroll/Swipe Event | Joystick Input |
|---|---|---|---|
| Selector Navigator Left | NC Left | Scroll Up | NC Up |
| Selector Navigator Right | NC Right | Scroll Down | NC Down |
| Selector Confirmation Step Up | NC Up | Item Selection | Short Click |
| Character Completion | Short Click | Swipe Left | NC Left |
| Undo Last Selection | NC Down ×1 | Swipe Right | NC Right |
| Undo All Selection | NC Down ×2 | ||
| Delete Last Character | NC Down ×3 | ||
| Space | Click State Right | ||
| Mode Switch | Long Click |
Table 2.
Question items for usability principles.
| Usability Principle | Question Item |
|---|---|
| Information Display | ID: Information displayed on the device is well organized and specific enough to understand the meaning. |
| ID: Visual information (icons, symbols, UI elements) is easily identified. | |
| ID: Texts displayed on the screen are clear and readable. | |
| ID: Vibrations of the device are clearly presented and thus easily identifiable. | |
| Control | Ctrl: I can easily complete the task using the prototype UI. |
| Ctrl: I can easily find and reach a target function (an app or interface element) whenever I want. | |
| Ctrl: The device reacts to my input precisely and accurately. | |
| Ctrl: The device provides feedback that allows me to follow the status of the device or the result of the task that I’ve conducted. | |
| Ctrl: I am able to easily undo or redo the same task whenever I make an error. | |
| Learnability | Lrn: It is easy to remember task procedures and repeat them. |
| Lrn: I can easily predict interaction results and the device actually provides result that I’m expecting from it. | |
| Lrn: The device is intuitively designed so that I can easily figure out how to use the device without reading through its manual. | |
| Preference | P: I like the look and the feel of the prototype UI. |
| P: Using the prototype UI is comfortable. | |
| P: Overall, I’m satisfied with the prototype UI. |
Table 3.
Experimenter’s instruction sheet to provide a structured overview of the major differences between the initial versions and the latest versions (UXA stands for UX Assessment).
Table 3.
Experimenter’s instruction sheet to provide a structured overview of the major differences between the initial versions and the latest versions (UXA stands for UX Assessment).
| Prototype UI | Task | Initial Version | Latest Version | |
|---|---|---|---|---|
| Baseline UI | Number Entry | -Same | - | |
| NASA-TLX | ||||
| Scrolling | - Random order | -Alphabetical order | UXA | |
| NASA-TLX | NASA-TLX | |||
| Swiping | -Same | - | ||
| NASA-TLX | ||||
| Usability Principle Evaluation | ||||
| Joystick UI | Number Entry | - On tablet | - On watch with feedback | UXA |
| NASA-TLX | NASA-TLX | |||
| Scrolling | - Random order | - Alphabetical order | UXA | |
| - List loop-around | ||||
| NASA-TLX | NASA-TLX | |||
| Swiping | - No selector | - Show selector | UXA | |
| NASA-TLX | NASA-TLX | |||
| Usability Principle Evaluation | ||||
| Potentiometer UI | Number Entry | - Different level pressures for #s | - Level 1 pressure | UXA |
| - Different number areas | ||||
| - On wristlet | ||||
| NASA-TLX | NASA-TLX | |||
| Scrolling | - Random order | - Alphabetical order | UXA | |
| - On wristlet | ||||
| NASA-TLX | NASA-TLX | |||
| Swiping | - Level 2 pressure level | - Level 1 pressure level | UXA | |
| On wristlet | ||||
| NASA-TLX | NASA-TLX | |||
| Usability Principle Evaluation | ||||
| Motion UI | Scrolling | - Random order | - Alphabetical order | UXA |
| - Flick for multi-scroll | - Flick for auto-scroll | |||
| NASA-TLX | NASA-TLX | |||
| Swiping | - No selector | - Show selector | UXA | |
| NASA-TLX | NASA-TLX | |||
| Usability Principle Evaluation | ||||
| Contactless UI | Number Entry | - Same | UXA | |
| NASA-TLX | ||||
| Usability Principle Evaluation | ||||
Table 4.
The number of data points used for the final analysis.
| Analysis | Phase 1 Experiment | Phase 2 Experiment | Korean Text Entry |
|---|---|---|---|
| (Iterative Design) | (Comparative Evaluation) | ||
| UX assessment | 1130 | 90 | 42 |
| Task workload assessment | 372 | 220 | 15 |
| Usability principle evaluation | 160 | 40 | 15 |
| Response time (ms) | 1133 | 196 | 45 |
| Response accuracy rate (%) | 1139 | 197 | 45 |
Table 5.
Question. How often do you perform the following tasks by using your smartphone?
| Task | Frequently | Never or Rarely |
|---|---|---|
| Text Entry Task | 88.6% | 2.3% |
| Scrolling Task | 93.2% | 2.3% |
| Swiping Task | 79.5% (least) | 11.4% (most) |
Table 6.
Ranks of the basic gestural tasks by importance.
| Task | Smartphone | Smartwatch | ||
|---|---|---|---|---|
| M | SD | M | SD | |
| Text Entry Task | 1.45 (highest) | 0.70 | 2.55 (lowest) | 0.76 |
| Scrolling Task | 1.89 | 0.58 | 1.70 | 0.70 |
| Swiping Task | 2.66 | 0.68 | 1.75 | 0.72 |
© 2017 by the authors. Licensee MDPI, Basel, Switzerland. This article is an open access article distributed under the terms and conditions of the Creative Commons Attribution (CC BY) license (http://creativecommons.org/licenses/by/4.0/).
Share and Cite
MDPI and ACS Style
Yoon, H.; Park, S.-H.; Lee, K.-T.; Park, J.W.; Dey, A.K.; Kim, S. A Case Study on Iteratively Assessing and Enhancing Wearable User Interface Prototypes. Symmetry 2017, 9, 114. https://doi.org/10.3390/sym9070114
AMA Style
Yoon H, Park S-H, Lee K-T, Park JW, Dey AK, Kim S. A Case Study on Iteratively Assessing and Enhancing Wearable User Interface Prototypes. Symmetry. 2017; 9(7):114. https://doi.org/10.3390/sym9070114
Chicago/Turabian StyleYoon, Hyoseok, Se-Ho Park, Kyung-Taek Lee, Jung Wook Park, Anind K. Dey, and SeungJun Kim. 2017. "A Case Study on Iteratively Assessing and Enhancing Wearable User Interface Prototypes" Symmetry 9, no. 7: 114. https://doi.org/10.3390/sym9070114
Note that from the first issue of 2016, this journal uses article numbers instead of page numbers. See further details here.