Article

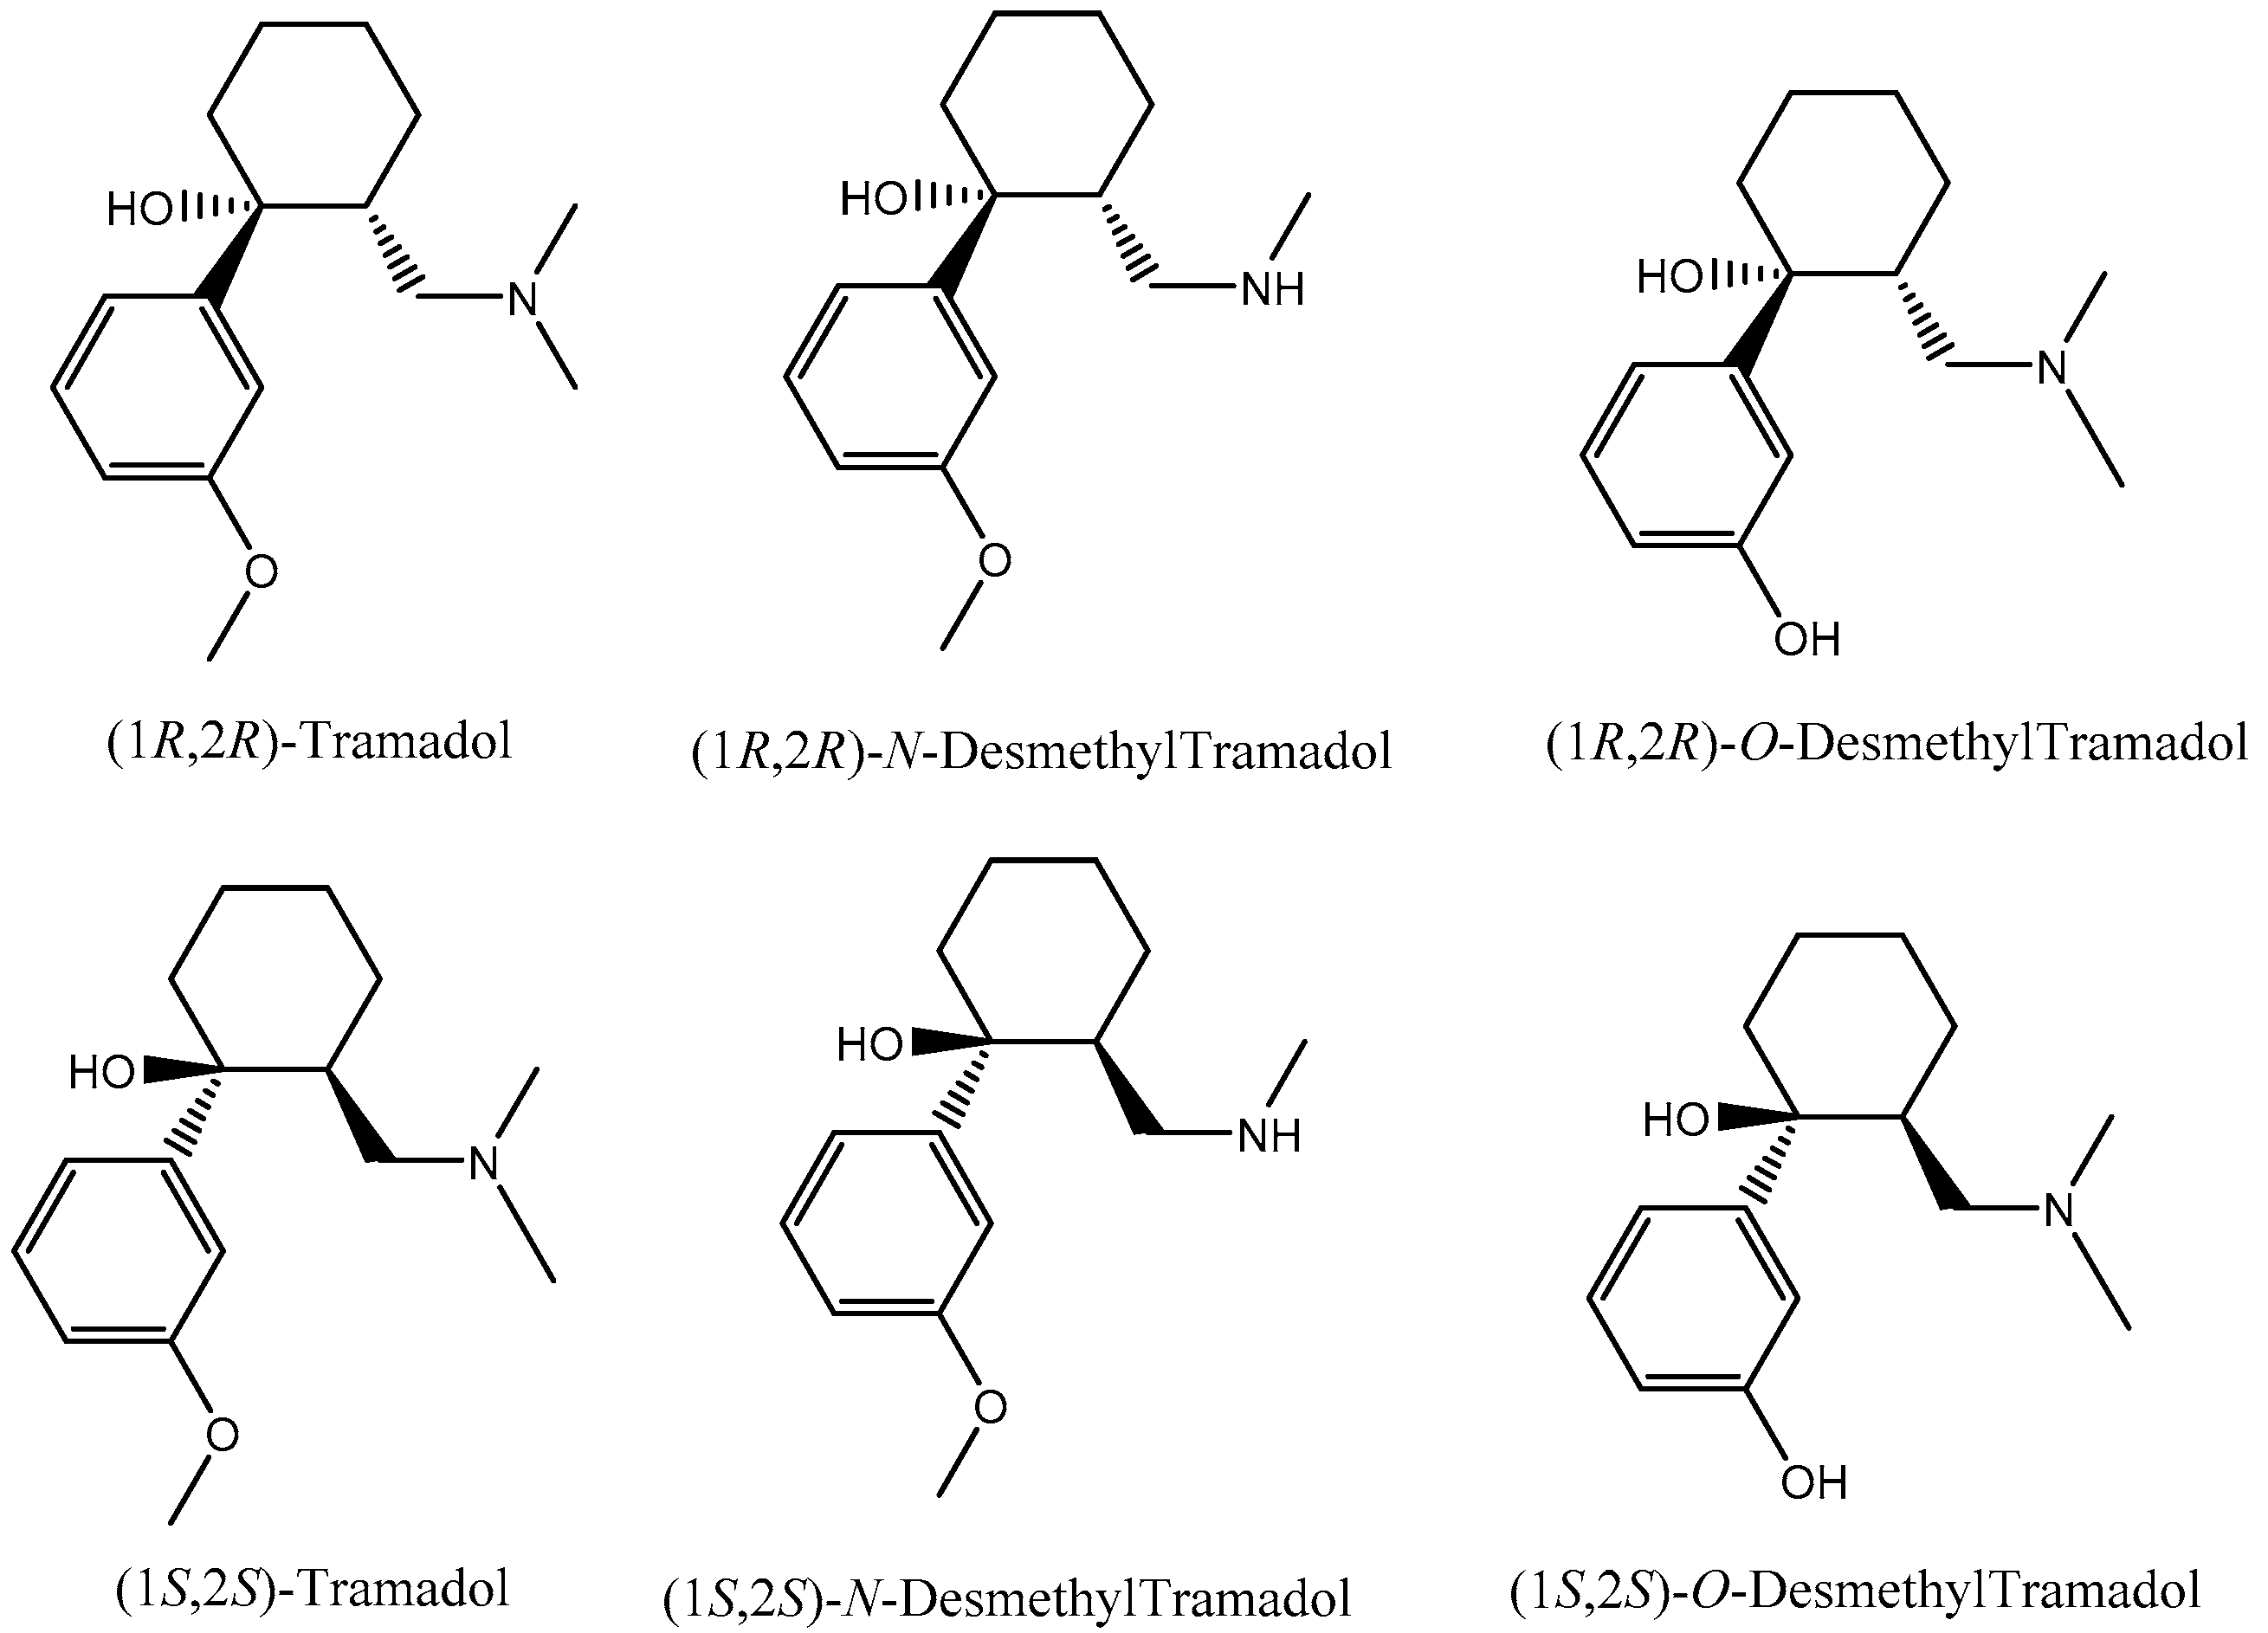
Enantiomeric Separation of Tramadol and Its Metabolites: Method Validation and Application to Environmental Samples

by
Cátia Silva
1,2,
Cláudia Ribeiro
2,3,4,*,
Alexandra S. Maia
2,3,
Virgínia Gonçalves
2,
Maria Elizabeth Tiritan
1,2,4 and
Carlos Afonso
1,4
1
Laboratório de Química Orgânica e Farmacêutica, Departamento de Ciências Químicas, Faculdade de Farmácia, Universidade do Porto, Rua de Jorge Viterbo Ferreira, 228, 4050-313 Porto, Portugal
2
CESPU, Instituto de Investigação e Formação Avançada em Ciências e Tecnologias da Saúde, Rua Central de Gandra, 1317, 4585-116 Gandra PRD, Portugal
3
Universidade Católica Portuguesa, CBQF—Centro de Biotecnologia e Química Fina—Laboratório Associado, Escola Superior de Biotecnologia, Rua Arquiteto Lobão Vital, apartado 2511, 4202-401 Porto, Portugal
4
Centro Interdisciplinar de Investigação Marinha e Ambiental (CIIMAR/CIMAR), Universidade do Porto, Rua dos Bragas 289, 4050-123 Porto, Portugal
*
Author to whom correspondence should be addressed.
Symmetry 2017, 9(9), 170; https://doi.org/10.3390/sym9090170
Submission received: 30 July 2017 / Revised: 12 August 2017 / Accepted: 19 August 2017 / Published: 24 August 2017
(This article belongs to the Special Issue Chiral Separations)

Abstract

:
The accurate assessment of racemic pharmaceuticals requires enantioselective analytical methods. This study presents the development and validation of an enantioselective liquid chromatography with a fluorescence detection method for the concomitant quantification of the enantiomers of tramadol and their metabolites, N-desmethyltramadol and O-desmethyltramadol, in wastewater samples. Optimized conditions were achieved using a Lux Cellulose-4 column 150 × 4.6 mm, 3 µm isocratic elution, and 0.1% diethylamine in hexane and ethanol (96:4, v/v) at 0.7 mL min−1. The samples were extracted using 150 mg Oasis® mixed-mode cation exchange (MCX) cartridges. The method was validated using a synthetic effluent of a laboratory-scale aerobic granular sludge sequencing batch reactor. The method demonstrated to be selective, accurate, and linear (r2 > 0.99) over the range of 56 ng L−1 to 392 ng L−1. The detection and the quantification limits of each enantiomer were 8 ng L−1 and 28 ng L−1 for tramadol and N-desmethyltramadol, and 20 ng L−1 and 56 ng L−1 for O-desmethyltramadol. The feasibility of the method was demonstrated in a screening study in influent and effluent samples from a wastewater treatment plant. The results demonstrated the occurrence of tramadol enantiomers up to 325.1 ng L−1 and 357.9 ng L−1, in the effluent and influent samples, respectively. Both metabolites were detected in influents and effluents.

1. Introduction

Pharmaceutical compounds are an important group of emergent environmental pollutants due to their high consumption and continuous discharge. These pollutants can enter the environment through various routes, including the direct discharge of sewage from health institutions, industries, agriculture, aquaculture, and households [1,2]. On the other hand, wastewater treatment plants (WWTPs) are unable to completely remove pharmaceutical compounds, and thus their effluents are also sources of these compounds in aquatic systems [2,3,4]. Therefore, residues (i.e., unchanged compounds and their metabolites) are continuously discharged into surface waters, where they can cause toxic effects to aquatic organisms and humans [1]. Further, many pharmaceuticals are chiral and are found in environmental matrices as single enantiomers or as enantiomeric mixtures [5]. These aspects produce additional environmental problems due to the potential diverse behavior of the enantiomers concerning their toxicological and ecotoxicological properties [4].
Enantiomers may present similar or different pharmacodynamic properties. In the first case, the drug can be commercialized as a racemic mixture, while in the second situation the drug may be commercialized as a racemic mixture or in an enantiomerically pure form, depending on the biological activities of each enantiomer. Despite the increased interest in chiral pharmaceuticals in the environment, most occurrence studies neglect the enantiomers and consider these compounds as a unique molecular entity [3]. Also, the ecotoxicological effects of chiral pharmaceuticals have been studied only for some therapeutic classes and enantiotoxicity has been poorly investigated. In the work developed by Stanley et al. [6], enantioselective effects were evaluated using the antidepressant drugs Fluoxetine (FLX) concerning the survival of the fish Pimephales promela [6]. This study demonstrated that the racemic mixture presents higher toxicity than its enantiomers, and the enantiomer R is more toxic that the enantiomer S (LC50 (rac) = 198 µg L−1; LC50 (S-FLX) = 216 µg L−1; LC50 (R-FLX) = 212 µg L−1) [6]. Enantiotoxicity was also evaluated for β-blockers as propranolol: (S)-propranolol affected the growth of P. promela and demonstrated to be more toxic than the R enantiomer [7].
The enantioselective fate of chiral pharmaceuticals in the environment is important, since enantiomers of the same chiral compound can differ in their environmental behavior (e.g., occurrence, distribution, biodegradation and toxicological effects. This requires the development of enantioselective methods for the quantitative assessment of each enantiomer and for the determination of enantiomeric fraction. Different analytical methods have been described for the separation of enantiomers using optical force [8], molecular imprinting [9]. However, gas chromatography mass spectrometry [10], and mainly liquid chromatography coupled with fluorescence, ultraviolet, or mass spectrometry are described [11,12,13]. Also, chiral membranes have been described for the separation of enantiomers [14].
Tramadol [2-[(dimethylamino)methyl]-1-(3-methoxyphenyl)cyclohexan-1-ol] (Figure 1) is a chiral pharmaceutical analgesic, structurally related to codeine and morphine, that is used for the treatment of moderate to severe pain [15,16]. It is a synthetic opioid that acts as an agonist by selective activity at the µ-opioid receptors and is commercialized as a racemic mixture. Tramadol is mainly metabolized in the liver by the cytochrome P450 CYP2D6 to N-desmethyltramadol (N-DT) and O-desmethyltramadol (O-DT) (Figure 1). O-DT, its main active metabolite, has higher pharmacological activity than the parent compound, and shows a higher affinity for the µ-opioid receptors [17,18]. According to Grond and Sablotzki [16], after oral administration, tramadol and its metabolites, O-DT and N-DT, are excreted via the kidney (≈90%) and via the biliary (1%) in the urine within 24 h at 12% for tramadol, and at 15% and 4% for O-DT and N-DT, respectively. Beyond the analgesic effects, tramadol has demonstrated other effects, such as antitussive, antidepressant, anti-inflammatory, and immunostimulatory effects [19]. The use of tramadol is associated with some risks, such as possible dependence, addiction, and adverse effects [10]. Some studies have demonstrated that tramadol can induce hepatotoxicity and nephrotoxicity upon acute and chronic exposure to rats, leading to liver and kidney damage [20,21].
Different analytical techniques have been reported for the simultaneous quantification of tramadol and its metabolites in biological samples, such as the brain tissue of mice and rats [22], saliva [23], urine [23,24], amniotic fluid [25], plasma [23,26,27,28,29,30,31,32,33,34,35,36,37,38,39], and environmental samples [11,40], but reports regarding enantiomeric quantification are scarce.
Quantification in WWTPs samples of enantiomers of tramadol and the racemic O-DT has been reported [11,40]. Enantiomers of tramadol have been quantified in a concentration of 506 ng L−1 to 1320.7 ng L−1 in effluent and influent WWTPs samples, respectively [40], and in a WWTP sample in a range of 595 to 798 ng L−1 [11]. The metabolite O-DT has also been quantified in a WWTP sample, in a concentration range of 801 to 950 ng L−1, but to the best of our knowledge, the quantification of the enantiomers of N-DT in the environment has never been reported.
The quantification of tramadol and its metabolites is challenging due to the low levels usually found in environmental matrices and the presence of interferences. Therefore, the aim of this study was to develop a method to enantioresolve the tramadol and its metabolites for further quantification in environmental samples. The method was validated for the simultaneous quantification of the enantiomers of tramadol and its metabolites in the influent and effluent of WWTPs. This is the first report that allows for the simultaneous chemo and enantioseparation of enantiomers of tramadol and its main metabolites, their quantification in environmental samples, and enantiomeric quantification.

2. Materials and Methods

2.1. Standards and Reagents

The tramadol and O-DT standards were purchased from Sigma Aldrich (Steinhein, Germany), and the N-DT standard was purchased from Lipomed (Arlesheim, Switzerland). The standards present a purity degree above 99%. The tramadol and O-DT enantiomers were kindly supplied by Grünenthal (Aachen, Germany). The ethanol (EtOH), acetonitrile (ACN), methanol (MeOH), and propan-2-ol (IPA) HPLC grade were purchased from Fisher Chemical (Leicestershire, UK). Hexane (Hex) HPLC grade was acquired from VWR Chemicals. Diethylamine (DEA), ammonium formate, ammonium acetate, and ammonium trifluoroacetate (ATFA) with ≥99% purity were obtained from Sigma Aldrich. Acetic acid was purchased by Panreac (Barcelona, Spain). Formic acid with 98–100% purity was acquired from MERCK (Darmstadt, Germany). Ultrapure water was supplied by a Milli-Q water system (Ultra Clear UV model). The tramadol, N-DT, and O-DT stock standard solutions were prepared at 1 mg mL−1 of racemic mixture in ethanol. These stock standard solutions were stored at −20 °C in amber bottles. Working solutions were prepared by freshly diluting the stock solutions into an appropriate mobile phase. The standards mixtures and dilution in Hex/EtOH in a proportion of 8:2 (v/v) and in ethanol, in normal elution mode, and reverse elution mode, respectively, were used in a final racemic concentration of 1 µg mL−1 for the optimization of the separation of enantiomers. To prepare the synthetic wastewater influent, the following substances were used: Ethylenediaminetetraacetic acid disodium salt dehydrate (EDTA∙2H2O) (Panreac, Portugal), zinc sulfate heptahydrate (ZnSO4∙7H2O) (Riedel, Kuffstein, Austria), calcium chloride (CaCl2) (Panreac, Portugal), manganese (II) chloride tetrahydrate (MnCl2·4H2O), Iron (II) sulfate hetpahydrate (FeSO4·7H2O), ammonium molybdate tetrahydrate ((NH4)6Mo7O24∙4H2O), copper (II) sulfate pentahydrate (CuSO4∙5H2O), cobalto (II) chloride (CoCl2), potassium hydroxide pellets, sodium acetate (CH3COONa), magnesium sulfate heptahydrate (MgSO4·7H2O), potassium chloride (KCl), disodium hydrogen phosphate (Na2HPO4), potassium dihydrogen phosphate (KH2PO4), and ammonium chloride (NH4Cl).

2.2. Instrumental Conditions

Chromatographic analyses were performed using a Shimadzu UFLC Prominence System equipped with two pumps LC-20AD, an autosampler SIL-20AC, a column oven CTO-20AC, a Degasser DGU-20A5, a System Controller CBM-20A, and an LC Solution, Version 1.24 SP1 (Shimadzu Corporation, Tokyo, Japan). The Fluorescence Detector (FD) coupled to the LC System was a Shimadzu RF-10AXL, with the excitation and emission wavelengths set at 275 and 300 nm, respectively. Solid Phase Extraction (SPE) procedures were realized using a Varian vacuum extraction device and Oasis® mixed-mode strong cation exchange (MCX) (150 mg 6cc) and Oasis® hydrophilic-lipophilic balance (HLB) (150 mg 6cc) from Waters Corporation (Milford, MA, USA). A vacuum concentrator, model Centrivap Centrifugal concentrator with a cold trap (−50 °C model) (Labconco, Kansas City, MO, USA) was used to evaporate to dryness the extracts from the SPE procedures.

2.3. Chromatographic Conditions

Several chiral stationary phases (CSP) and chromatographic conditions were attempted. After achieving the first baseline conditions on normal elution mode, the effects of several factors on chromatographic separation were studied, including EtOH percentage, buffer concentration, pH, column oven temperature, and flow rate. The chiral chromatographic columns used were: Astec Chirobiotic TAGTM and Astec Chirobiotic VTM, both with a particle size of 5 µm (150 × 2.1 mm), and supplied by SUPELCO Analytical (Sigma Aldrich, Steinhein, Germany); and Lux Cellulose-2 and Lux Cellulose-4, both with particle size 3 µm (150 × 4.6 mm), and supplied by Phenomenex (Torrance, CA, USA).
Diverse mobile phases in normal, reversed, and polar organic modes of elution were investigated, and different flow rates were attempted. The optimized condition was achieved with a Lux Cellulose-4 CSP with the mobile phase at an isocratic mode of a mixture of 0.1% diethylamine in hexane and ethanol (96:4, v/v) at 0.7 mL min−1. The injection volume was 10 µL. The column oven temperature was set at 23 °C and the autosampler tray temperature was set at 15 °C. The elution order of the compounds was determined by the injection of a solution of racemic compounds separately, namely tramadol, N-DT, and O-DT. The elution order of each of the enantiomers was determined by the injection of a solution of (−)-enantiomer of the compounds.

2.4. Sample Preparation Procedure

The solid phase extraction was optimized with 250 mL of ultrapure water spiked with 200 µL of a mixture of the three standards in a concentration of 1 µg mL−1 of the racemic mixture dissolved in EtOH. Two cartridges, 150 mg Oasis® Mixed-mode strong cation exchange (MCX) and Hydrophilic-Lipophilic Balance (HLB) were tested, and different SPE procedures were realized in order to select and define the most appropriate conditions for the determination of the compounds (higher recoveries and less matrix interferences). The procedures are described in Table 1. Each procedure was realized in triplicate and the pH of the sample adjusted according to the cartridge used. In each procedure the cartridges were sequentially conditioned with solvents described in Table 1. After the loading of the sample, the cartridges were washed with mixtures of the solvents described in Table 1. The cartridges were dried, between the washing and elution steps, under vacuum for 30 min and elution was done in two steps. The resulting extracts of the SPE procedures were evaporated to dryness and reconstituted in Hex/EtOH in the proportions of 8:2 (v/v), and then 20 µL was injected into the HPLC-FD for quantification.
After the optimization of the SPE procedure in ultra-pure water, the best condition was used to validate the method using a synthetic wastewater.

2.5. Method Validation

The analytical method was validated following the analytical performance parameters established by the International Conference on Harmonisation (ICH) validation guidelines in terms of selectivity, linearity, accuracy, intra-day precision, inter-day precision, and limits of detection and quantification [41]. For the validation of the method, a synthetic wastewater influent was used. The synthetic wastewater was prepared as follows: initially take Vischniac Trace Element Solution consisting in a mixture of the following substances: EDTA·2H2O (6.377 g), ZnSO4∙7H2O (2.2 g), CaCl2 (0.554 g), MnCl2∙4H2O (0.506 g), FeSO4·7H2O (0.499 g), (NH4)6Mo7O24∙4H2O (0.11 g), CuSO4·5H2O (0.157 g), and CoCl2 (0.0879 g) in 100 mL of water and adjust the pH to 6 with KOH. All substances except the KOH were weighed into a beaker and dissolved in 80 mL of ultrapure water. To dissolve all compounds, the pH was adjusted to 6.0 with KOH pellets. The solution was poured into a 100 mL flask and made up to volume with water. The solution was stored in a refrigerator at a temperature of 4 °C for future use. The synthetic wastewater, 250 mL, was prepared with Vischniac Trace Element Solution (0.234 mL) and another mixture, which involves the substances CH3COONa (0.121 g), MgSO4∙7H2O (0.021 g), KCl (0.008 g), Na2HPO4 (0.014 g), KH2PO4 (0.007 g), and NH4Cl (0.044 g).
Selectivity was verified by comparing the chromatograms of a synthetic wastewater matrix, a matrix spiked with the standards, and standard in solvent.
Linearity was performed using 200 µL of a racemic mixture at seven different racemic concentrations (56 ng mL−1, 112 ng mL−1, 168 ng mL−1, 224 ng mL−1, 280 ng mL−1, 336 ng mL−1, and 392 ng mL−1) spiked in 250 mL of acidified synthetic wastewater realized in triplicate, and each one was injected and analyzed in duplicate. For each concentration, the SPE procedure was processed in triplicate. The calibration curves were obtained by linear regression corresponding to the correlation between the peak area and the nominal concentration.
The detection limit (DL) and quantification limit (QL) were determined based on signal/noise. The determination of the signal-to-noise ratio was performed by comparing measured signals from samples with low concentrations of analyte with those of blank samples and establishing the minimum concentration at which the analyte can be reliably detected or quantified. A signal-to-noise ratio of 3:1 is generally acceptable to estimate the DL, and a signal-to-noise ratio of 10:1 is typically considered to estimate the QL.
Accuracy, precision, and recovery assays were estimated by three quality controls (QCs) standard solutions using the racemic concentrations (150 ng mL−1, 300 ng mL−1, and 410 ng mL−1) in spiked synthetic waste water, in triplicate. Accuracy was determined as the percentage of agreement between the method’s results and the nominal amount of added compound. Precision was expressed by the relative standard deviation (% RSD) of the replicate measurements.
The recovery rate results from the ratio of standards in spiked matrix by the optimized SPE and in solvent, and the results were expressed in recovery percentage.

2.6. Application of Developed HPLC-FD Method in WWTP Samples

Water samples of the influent, previously treated through solid filtration and some chemical treatments, and of the final effluent of the secondary clarifier of the WWTP of Parada, localized in Maia, North of Portugal, were collected on the 26th and 27th of June 2016 in pre-rinsed amber glass bottles (2 L) and transported at 4 °C to the laboratory.
After the collection of the samples, these were filtered under vacuum and acidified with H2SO4 to pH = 2 and preconcentrated by SPE with optimized conditions, according to the procedures established in Section 2.4.
In order to confirm the presence of tramadol, N-DT, and O-DT, a crossmatch test was realized, adding 20 µL of the standards mixture at a racemic concentration of 1 µg mL−1 to the samples.
The enantiomeric fraction (EF) and the degree of removal efficiency (DRE) were calculated with the following Formulas (1) and (2), respectively.
EF 1 = C o n c e n t r a t i o n   E 1 C o n c e n t r a t i o n   E 1 + C o n c e n t r a t i o n   E 2   or   EF 2 = C o n c e n t r a t i o n   E 2 C o n c e n t r a t i o n   E 1 + C o n c e n t r a t i o n   E 2 .
E1 and E2: the first and second enantiomer eluted, respectively.
DRE = C a n a l y t e   i n   e f f l u e n t C a n a l y t e   i n   i n f l u e n t × 100 .

3. Results and Discussion

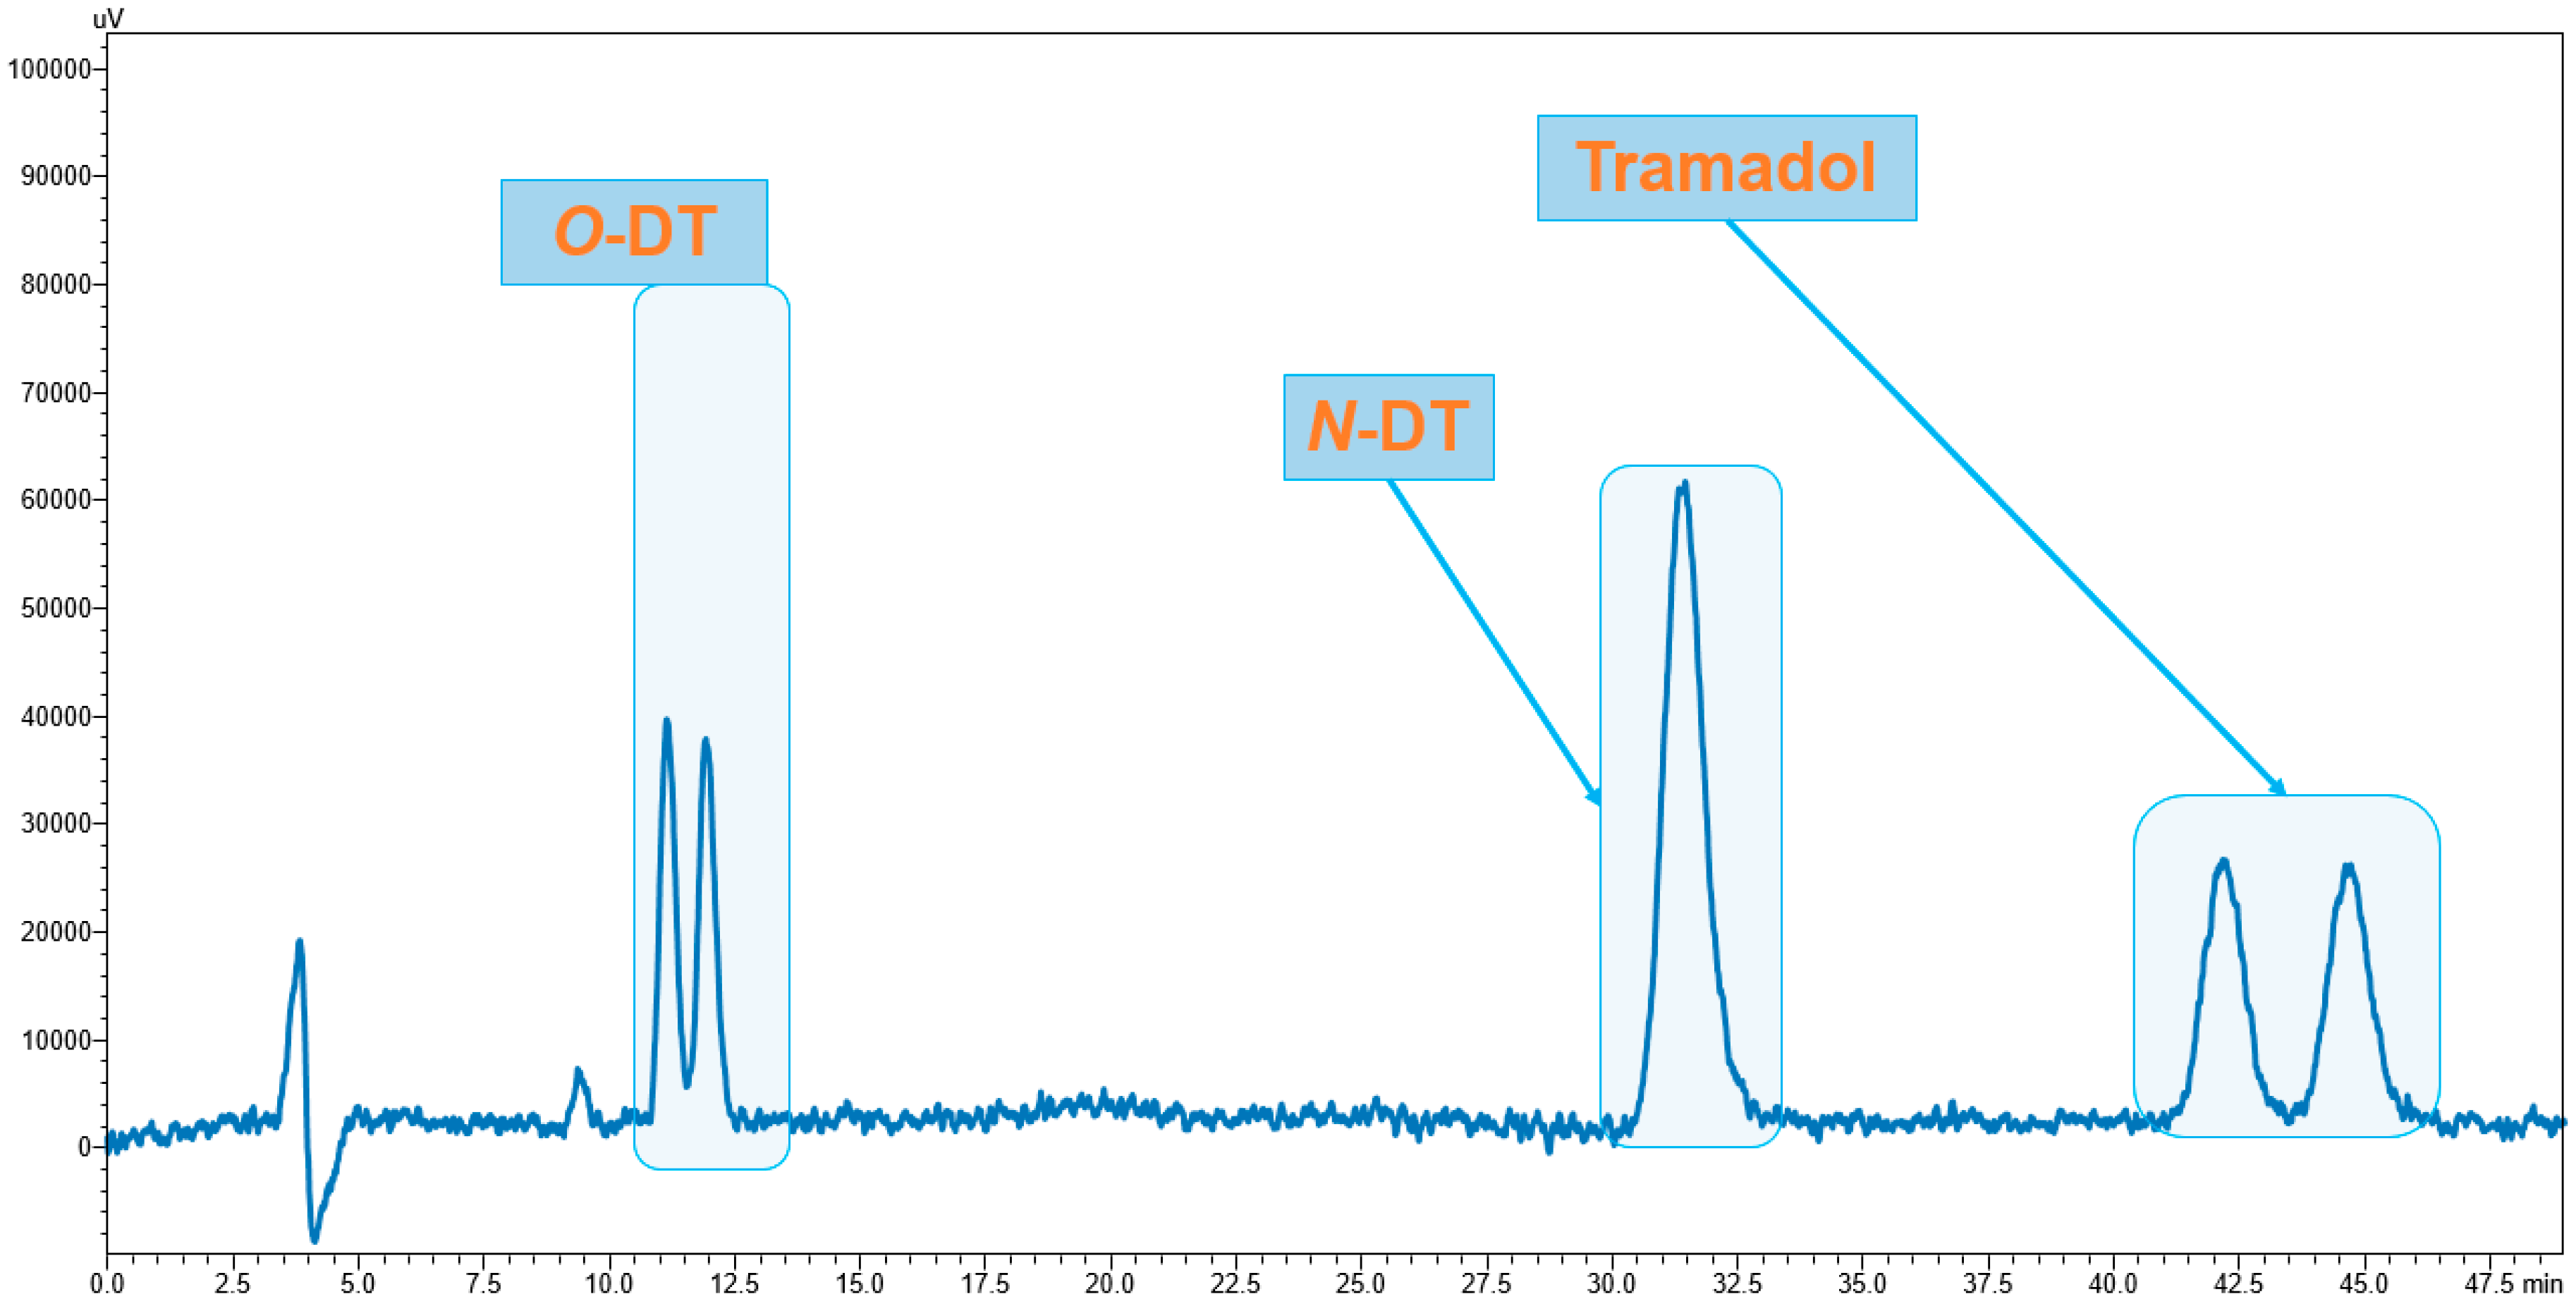
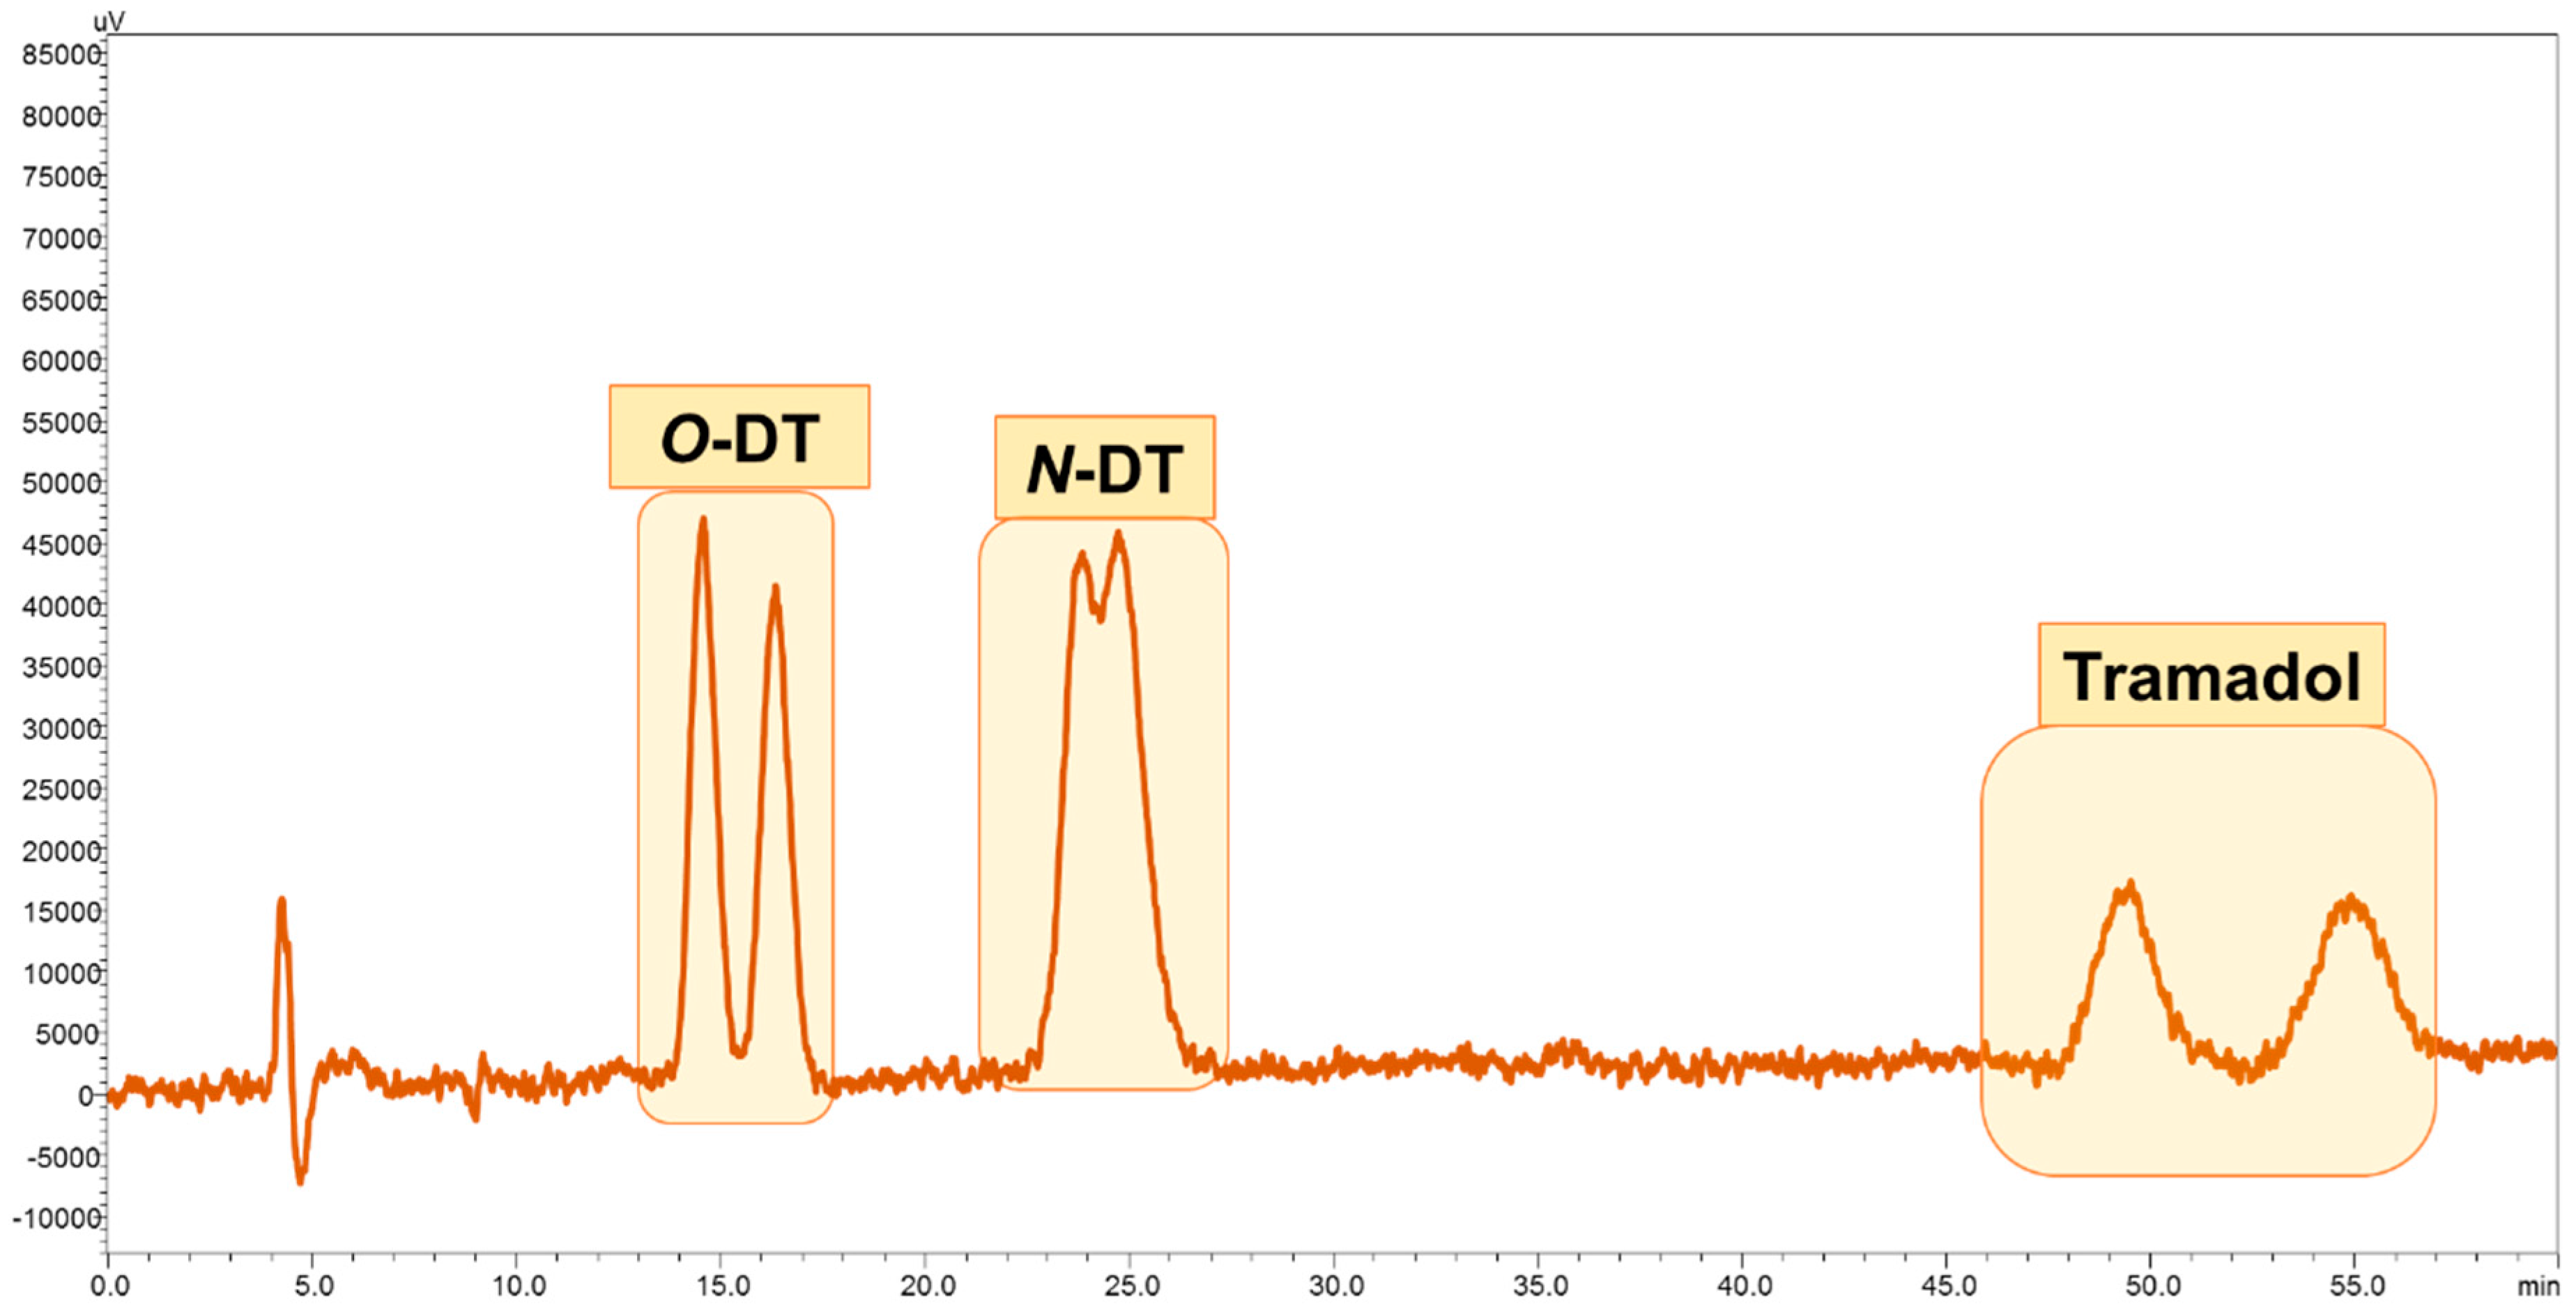
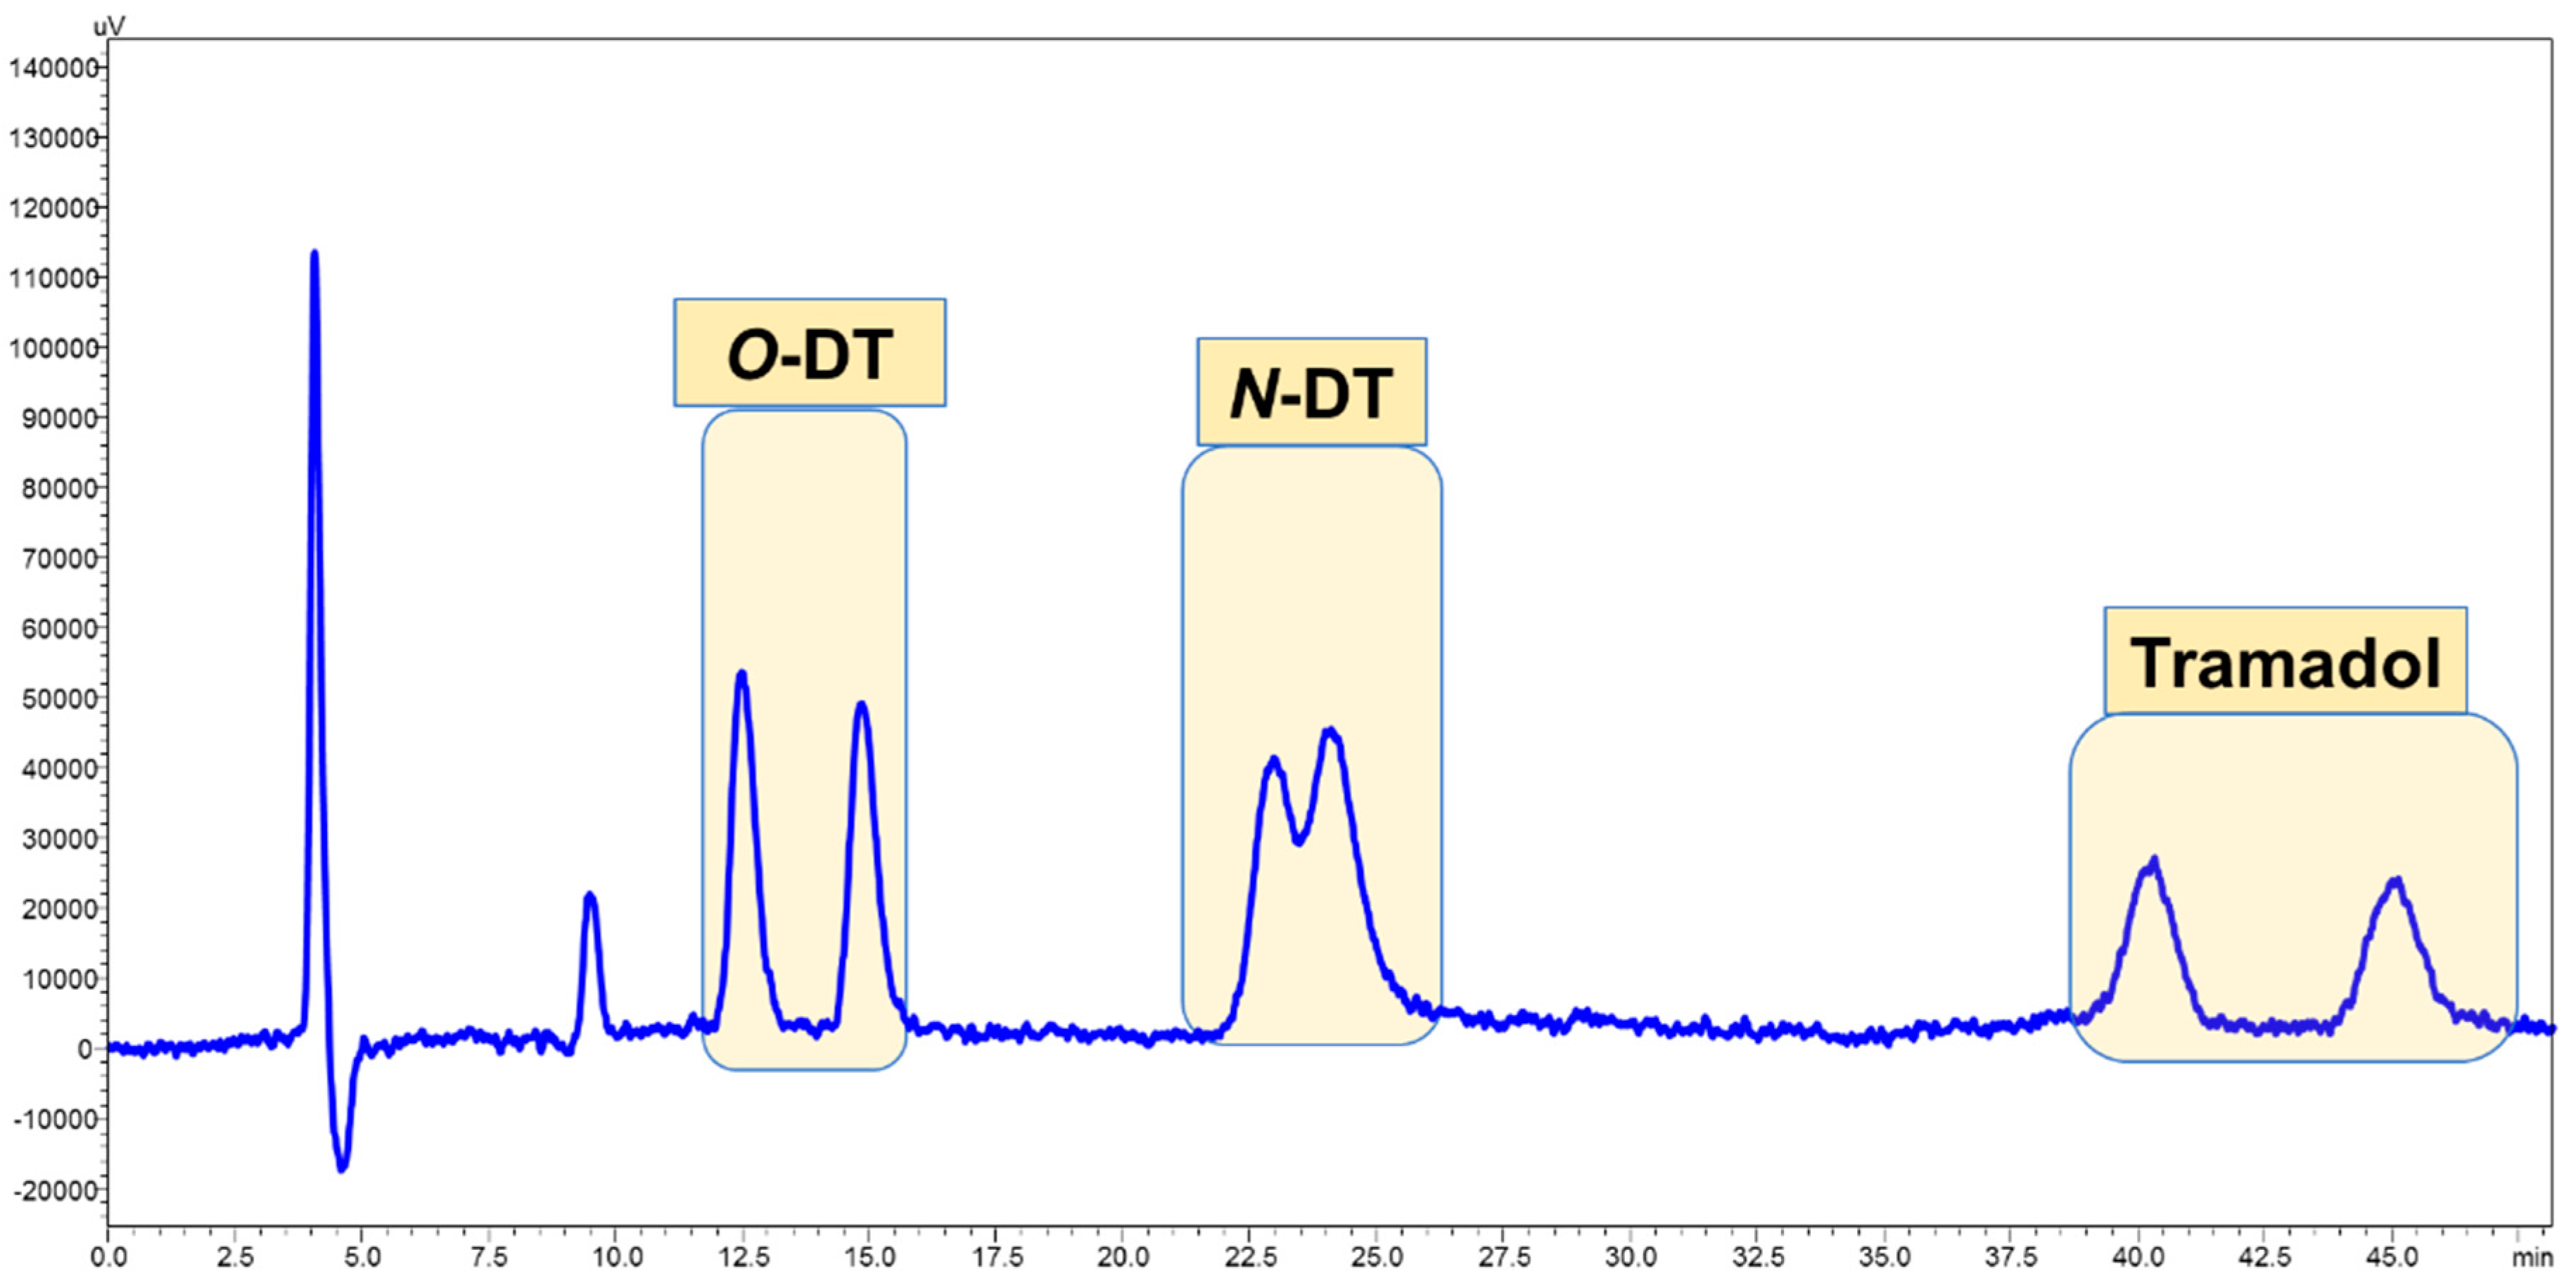
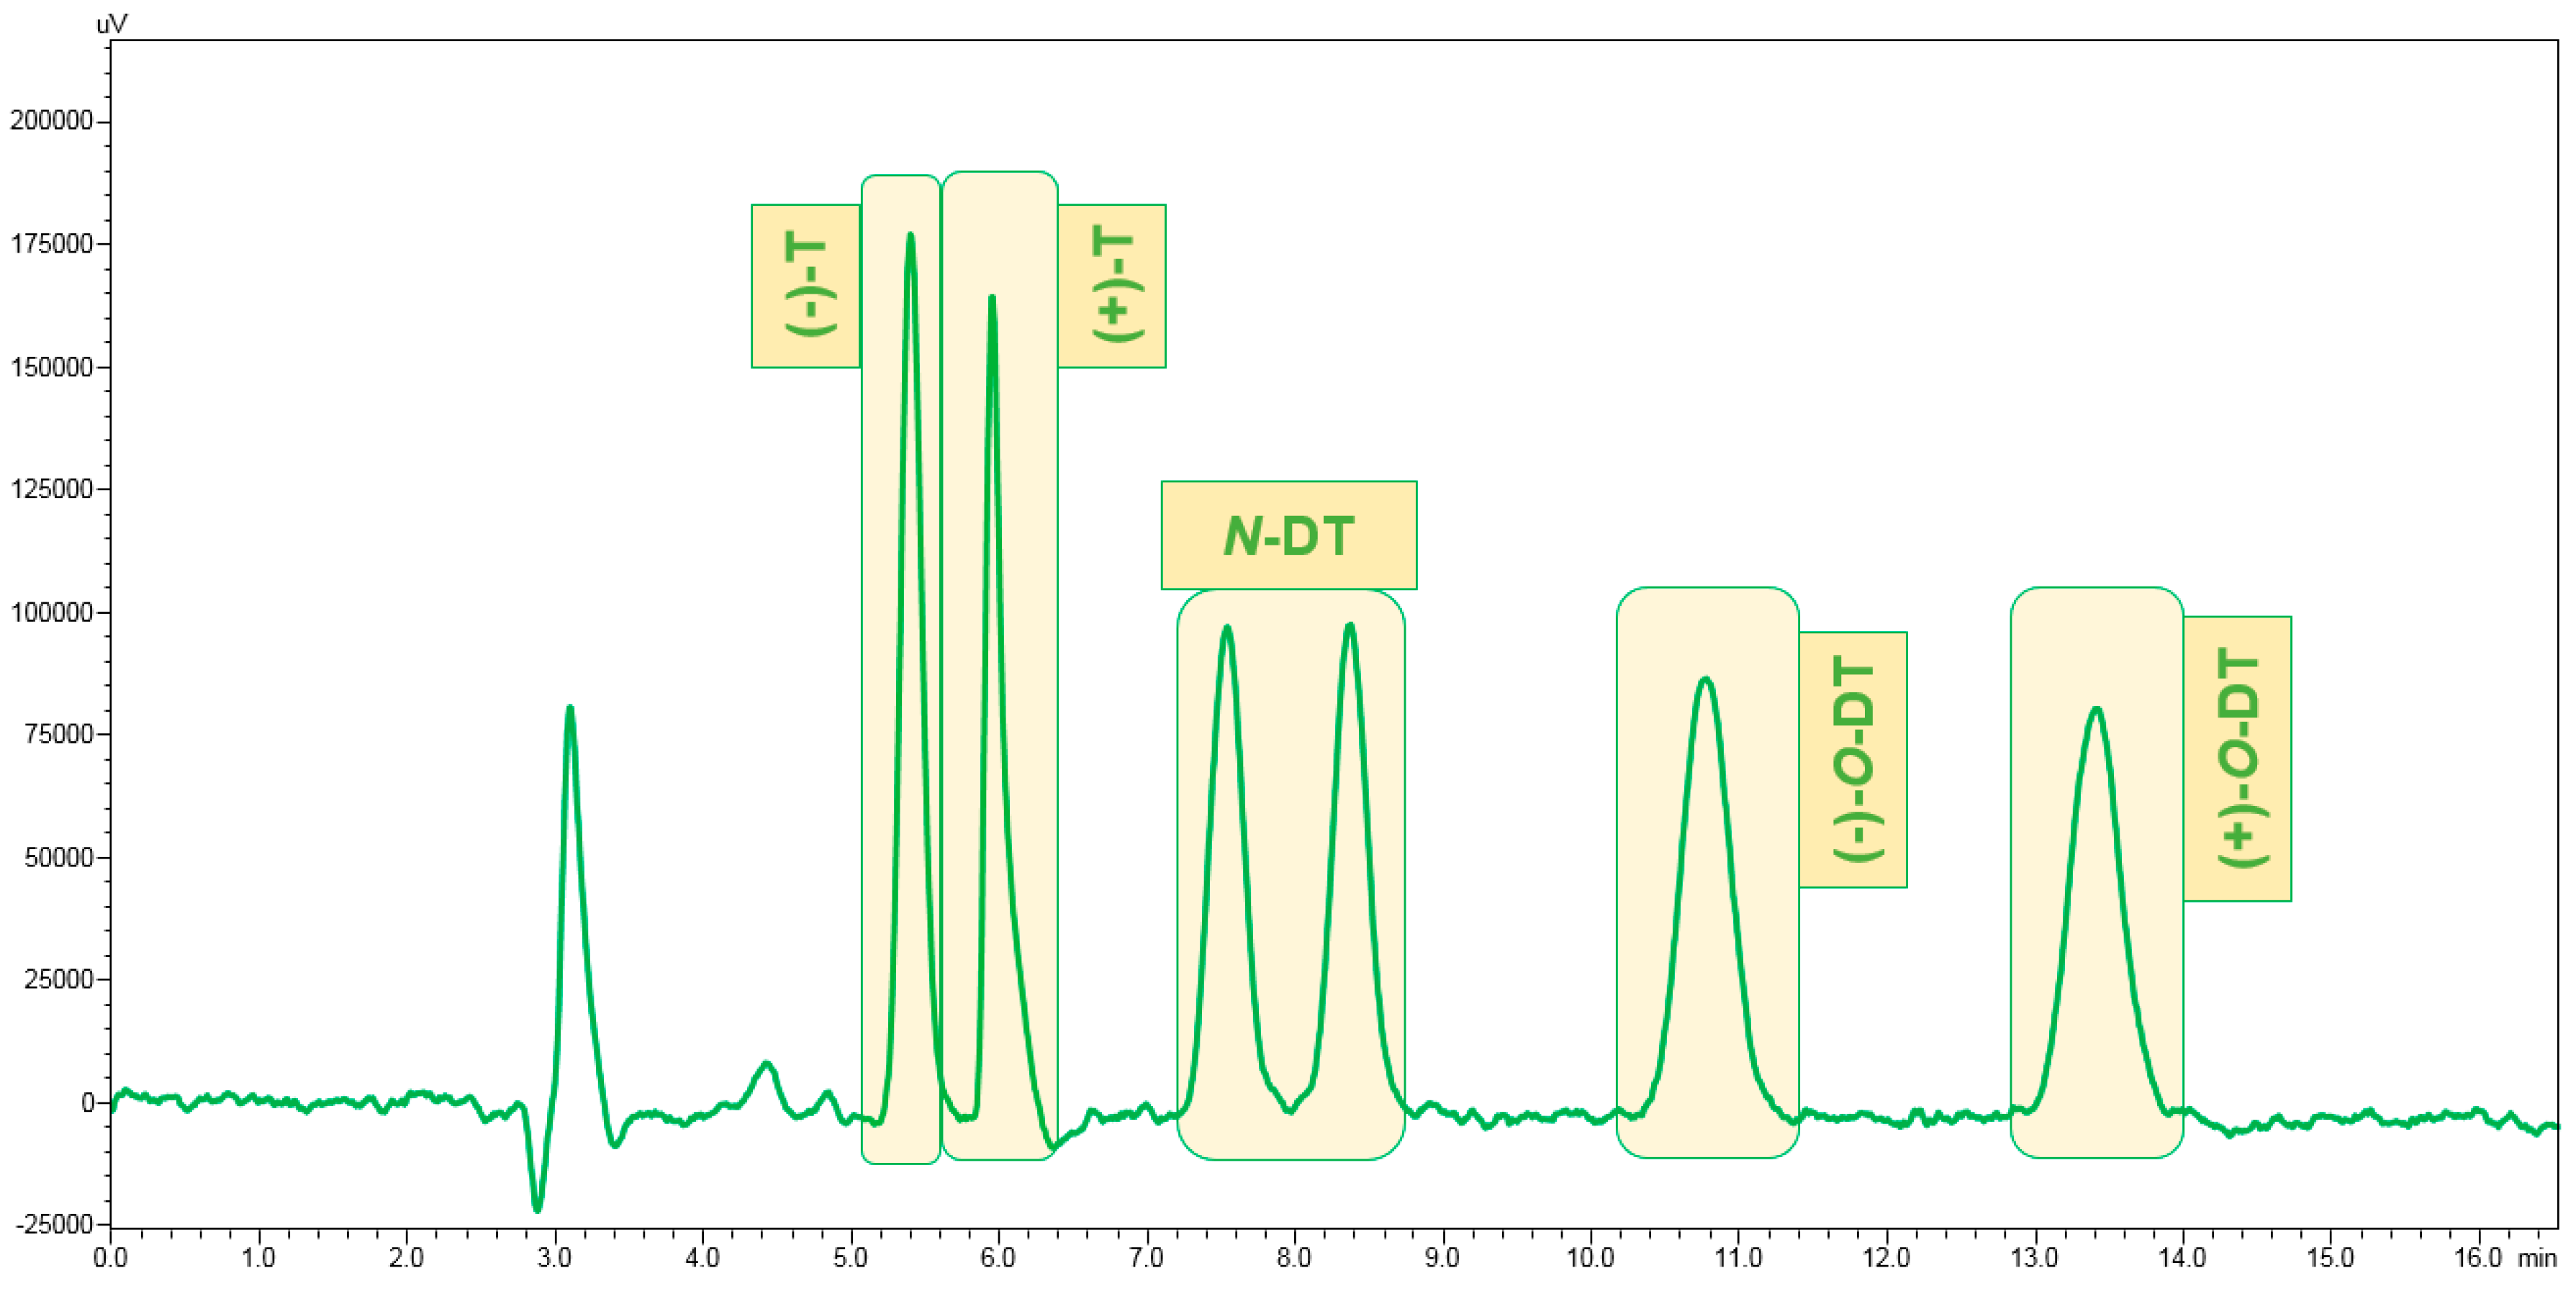
3.1. Enantiomeric Separation

Different types of chiral columns are commercially available [42,43,44,45,46]. The most important types of chiral selectors pointed to: Pirkle type, polysaccharide derivatives, cyclodextrin, protein, and macrocyclic glycopeptides antibiotics-based CSP [42,47,48]. Due the versatility and suitability for all elution modes, polysaccharides or macrocyclic antibiotics CSP are usually the first choice to start the trial–error challenge to achieve the desired separation of enantiomers [47,49,50,51,52]. In a tentative attempt to obtain the best result of chemo and enantioseparation of the enantiomers of tramadol and its metabolites (O-DT and N-DT), CSP based on macrocyclic glycopeptides antibiotics and polysaccharide derivates were evaluated in normal, polar, and reversed elution modes.
In the first attempt, macrocyclic glycopeptides antibiotics CSP, namely the Chirobiotic TAG (Telcoplanin Aglycone CSP) and Chirobiotic V (Vancomycin CSP), were tested. These CSP can be used in normal, reversed, polar organic, and polar ionic elution modes [3]. The separation of the enantiomers of tramadol was also reported in Chirobiotic V CSP [40]. Several mobile phases were attempted to enantioseparate tramadol, N-DT, and O-DT. Regarding Chirobiotic TAG CSP, only partial separation of the enantiomers of tramadol was achieved with MeOH (0.1% ATFA)/H2O (75:25 (v/v)) as the mobile phase and a flow rate of 1 mL min−1, with elution time around 7 min (data not shown). Chirobiotic V CSP presented only a partial enantioseparation of N-DT with EtOH with 10 mM aqueous ammonium acetate buffer (pH = 5.3) (92.5:7.5; v/v) as the mobile phase, and a flow rate of 0.1 mL min−1 (data not shown). The poor results led to the abandonment of the trial and error in this type of CSP.
Polysaccharide derivates CSP have a broad application in the separation of enantiomers of chiral pharmaceuticals, and can also be used within various elution modes. The columns Cellulose-2 (Cellulose tris (3-chloro-4-methylphenylcarbamate)) and Cellulose-4 (Cellulose tris (4-chloro-3-methylphenylcarbamate)) CSP were selected for this study. The difference between Cellulose-2 and Cellulose-4 is only the position of the substituents of the aromatic ring of the carbamate. Table 2 shows the best results relative to the enantiomeric separation achieved with these columns, and includes values of retention factor (K), separation factor (α), and resolution (Rs).
The separation of the enantiomers of N-DT and O-DT in Celullose-2 using Hex/IPA/DEA (90:10:0.1 (v/v/v)) as the mobile phase presented good results of α (1.44 and 1.964) and Rs (3.02 and 5.53), respectively. However, the separation of the enantiomers of tramadol did not present baseline separation. A reversed elution mode was attempted in different mobile phases and the best separation of enantiomers was obtained using ACN with 5 mM ammonium formate and 0.1% of DEA and H2O (30:70 (v/v)). The chromatograms obtained with these mobile phases are presented in Figure 2. In this elution mode, the separation of the enantiomers N-DT was not achieved and the chromatographic run was longer than 45 min.
Regarding the Cellulose-4 CSP, the majority of mobile phases attempted presented the separation of the enantiomers of the target compounds. The best result using the reversed elution mode was achieved with ACN (5 mM ammonium formate/0.1% DEA)/H2O (35:65 (v/v)) as the mobile phase (Figure 3); all target compounds presented enantioseparation, but none were chemoselective with tramadol and N-DT, which can be good results and conditions for analyses by mass spectrometry analysers but are not satisfactory for UV and FD detectors.
A mobile phase with MeOH and EtOH was used instead of ACN. Figure 4 presents the results with MeOH (5 mM Ammonium formate/0.05% DEA)/H2O (55:45 (v/v)) with a flow rate of 0.5 mL min−1. In this mobile phase, it is possible to observe a good separation of the enantiomers for O-DT, partial enantioseparation of N-DT, and baseline enantioseparation of tramadol, but long retention times (RT) (RT >50 min).
In order to improve the separation of enantiomers and decrease the retention time, two polar organic elution modes were attempted with ACN and EtOH, but separation of enantiomers was not improved (data not shown). The best mobile phase was constituted with ACN/EtOH (10 mM ammonium formate/0.1% DEA)/H2O in a proportion of 17.5/17.5:65 (v/v/v) with a flow rate of 0.5 mL min−1 (Figure 5). Tramadol and O-DT presented good resolution (Rs) (Rs >1.5), but N-DT presented only a partial separation of enantiomers. Further tests were made in normal elution mode.
Many different mobile phases were evaluated on a Cellulose-4 CSP in normal elution mode. EtOH and IPA were used as the organic modifier and DEA as the ionic suppressor. Enantio and chemoselective properties were achieved using a mixture of 0.1% diethylamine in Hex and EtOH as the mobile phase, in a proportion of 96:4, and in a flow rate of 0.7 mL min−1. Figure 6 shows the chromatogram obtained. These conditions were used to validate the chromatographic method for the further quantification of the enantiomers of tramadol and its metabolites N-DT and O-DT in the influent and effluent of a WWTP. It was possible to determine the order of elution of the enantiomers of tramadol and O-DT: the first enantiomer eluted of both compounds is the (−)-S,S-enantiomer.
Ceccato et al. [28] reported the enantiomeric determination of tramadol and its main metabolite O-DT in human plasma by liquid chromatography-tandem mass spectrometry (LC-MS/MS) using a Chiralpak AD column; nevertheless, the separation of enantiomers was not achieved in the same chromatographic run [28]. Other studies have reported the enantiomeric separation of tramadol and O-DT using similar columns in human plasma and environmental matrices, such as the effluent or influent of WWTPs [11,40,53,54]. However, this work reports for the first time the chemo and enantioseparation of enantiomers of tramadol and its two main metabolites in less than 15 min.

3.2. Optimization of the Sample Preparation Procedure

MCX and HLB cartridges with different conditions were tested using ultrapure water in order to establish the best procedure for sample preparation, i.e., the best recoveries for all compounds. The recoveries obtained for each enantiomer are shown in Figure 7.
The procedure 12 demonstrated the best overall recoveries for all compounds with the Oasis® MCX 150 cartridge, and was selected for the method’s validation with a synthetic influent and for the quantification of the compounds in the WWTP samples.

3.3. Method Validation

For the method’s validation, the following parameters were considered: selectivity; linearity; accuracy; precision (intra-day and inter-day), DL, and QL.
The selectivity of the developed method included the analysis of a synthetic WWTP sample previously treated by a SPE procedure (Figure 8: red line); the matrix spiked with the mixture of tramadol, N-DT, and O-DT, each one at a final concentration of 410 ng mL−1 of the racemic mixture (Figure 8: green line); and a mixture of the three compounds in solvent, Hex/EtOH 8:2 (v/v) (Figure 8: orange line). The comparison between the three chromatograms demonstrated the selectivity of the method.
Concerning the linearity, the calibration curve of the enantiomers of tramadol and N-DT in a range of nominal concentrations between 28 and 168 ng mL−1 and for each enantiomer of O-DT between 56 and 196 ng mL−1 demonstrated correlation coefficients higher than 0.99 (Table 3). The instrumental DL and QL and method DL and QL values of each enantiomer of the target compounds in synthetic influent were up to 25 ng L−1 and 56 ng L−1, respectively (Table 3).
The accuracy and recovery rates ranged from 70.3% to 108.7% and from 78.3% to 99.4%, respectively, as shown in Table 4. These values are within the range for quantitative determinations in complex matrix samples [41,55]. The precision of the method was evaluated by determining intra- and inter-day assays. The results demonstrated that this method is precise, with RSD values lower than 13.8% for intra-day precision and lower than 16.7% for inter-day precision (Table 4). This in agreement with international criteria, which recommend RSD values lower than 20% for complex matrices [41,55].

3.4. Application of Developed LC-FD Method in WWTP Samples

The optimized and validated method was applied for the quantification of the enantiomers of the selected compounds in the effluent and influent of WWTPs. Table 5 presents the results and the EFof the first enantiomer eluted. The EF range is from 0 to 1.0, if EF = 0.5, this means that analyte is present as a racemic mixture.
All enantiomers of the target compounds could be quantified in the effluent and influent samples, except for the first enantiomer of N-DT, which was under the QL.
According to Stamer et al. [56] and Payne et al. [57], the biotransformation of the racemic tramadol administered by oral drops in a concentration of 1.5 mg/kg [57] and intravenously in a concentration of 3 mg/kg [56] leads to higher quantities of the enantiomers (−)-tramadol and (−)-O-DT than the (+)-enantiomers in the human organism. In this study, regarding the influent and effluent samples, the first eluted enantiomer, (−)-tramadol, was also quantified at higher concentrations than the (+)-enantiomer. However, in the case of the metabolite O-DT, the results demonstrated an EF close to 0.5 (nearly racemic) or a higher concentration of the enantiomers (+)-O-DT (EF = 0.39), which indicates that the transformation of tramadol in the environment is different than the metabolism in the human organism and is enantioselective. Data about the EF of the N-DT metabolite in human excretions are not available. The metabolite N-DT presented an EF1 near to zero, which indicated that one enantiomer presented a higher amount than its antipode. The EF of the metabolite N-DT in the environment was never reported before.
Paar et al. [58] mentioned that the percentage of excretion by humans is 12%, 15%, and 4% for tramadol, O-DT, and N-DT, respectively. In this work, tramadol was present at higher concentrations than its metabolite O-DT in all the wastewater samples analyzed.
The DRE results predicted the removal of pollutants to some extent, and have demonstrated the low efficiency of WWTP to eliminate tramadol and its metabolites. Regarding the samples, (+)-tramadol and (−)-O-DT were enriched in the effluent, which indicated again the enantioselectivity in the transformation process of WWTP.

4. Conclusions

The enantioselective LC-FD method using a Lux Cellulose-4 column demonstrated to be accurate and precise to quantify the enantiomers of tramadol and its primary metabolites, N-DT and O-DT, in wastewater samples. The optimized conditions were achieved using 0.1% of DEA with Hex/EtOH 96:4 (v/v) as the mobile phase in an isocratic elution mode at a flow of 0.7 mL min−1. The separation of all enantiomers (six compounds) has been obtained in less than 15 min, with good resolution and enantioselectivity. The QL achieved was 28 ng L−1 for each enantiomer of tramadol and N-DT and 56 ng L−1 for each enantiomer of O-DT. The validated method was successfully applied in the quantification of the enantiomers of real wastewater samples.
Various samples from the effluent and influent of WWTPs were analyzed, and the compounds were detected in a concentration range below the QL, at 325.1 ng L−1 and 357.9 ng L−1, respectively. The enantiomers of tramadol and O-DT reveal different values of EF, and N-DT presented an EF approximately to zero. The DRE rates of this study reveal that the efficiency of a WWTP to remove these compounds is low. This study contributes to the urgent need of the development of enantioselective methods for racemic pharmaceuticals’ quantification in environmental matrices, and to further environmental risk evaluation with the consideration of both the enantiomers of tramadol and its major metabolites.

Acknowledgments

This work was developed at Laboratory of Environmental Research area/Environmental and Applied Chemistry research line of the IINFACTS-CESPU. The author acknowledges the financial support from PARMADRUGS-CESPU-2014 and ChiralDrugs_CESPU_2017. The authors wish to thank Grünenthal, GmbH for their kind donation of tramadol and O-DT enantiomers. This research was partially supported through national funds provided by FCT/MCTES: Foundation for Science and Technology from the Minister of Science, Technology and Higher Education (PIDDAC) and European Regional Development Fund (ERDF) through the COMPETE: Programa Operacional Factores de Competitividade (POFC) programme, under the Strategic Funding UID/Multi/04423/2013, in the framework of the programme PT2020.

Author Contributions

Maria Elizabeth Tiritan and Carlos Afonso conceived and designed the experiments; Cátia Silva, Cláudia Ribeiro, Alexandra Maia, and Virgínia Gonçalves performed the experiments; Maria Elizabeth Tiritan, Carlos Afonso, and Cláudia Ribeiro analyzed the data; Maria Elizabeth Tiritan and Carlos Afonso contributed reagents/materials/analysis tools; and Maria Elizabeth Tiritan, Cátia Silva, Cláudia Ribeiro, and Carlos Afonso wrote the paper. Authorship must be limited to those who have contributed substantially to the work reported.

Conflicts of Interest

The authors declare no conflict of interest.

References

  1. Herrmann, M.; Olsson, O.; Fiehn, R.; Herrel, M.; Kümmerer, K. The significance of different health institutions and their respective contributions of active pharmaceutical ingredients to wastewater. Environ. Int. 2015, 85, 61–76. [Google Scholar] [CrossRef] [PubMed]
  2. Cizmas, L.; Sharma, V.; Gray, C.; McDonald, T. Pharmaceuticals and personal care products in waters: Occurrence, toxicity, and risk. Environ. Chem. Lett. 2015, 13, 381–394. [Google Scholar] [CrossRef] [PubMed]
  3. Ribeiro, A.R.; Maia, A.S.; Cass, Q.B.; Tiritan, M.E. Enantioseparation of chiral pharmaceuticals in biomedical and environmental analyses by liquid chromatography: An overview. J. Chromatogr. B 2014, 968, 8–21. [Google Scholar] [CrossRef] [PubMed]
  4. Ribeiro, A.; Castro, P.L.; Tiritan, M. Environmental fate of chiral pharmaceuticals: Determination, degradation and toxicity. In Environmental Chemistry for a Sustainable World; Lichtfouse, E., Schwarzbauer, J., Robert, D., Eds.; Springer: Dordrecht, The Netherlands, 2012; pp. 3–45. [Google Scholar]
  5. Ribeiro, A.R.; Castro, P.M.L.; Tiritan, M.E. Chiral pharmaceuticals in the environment. Environ. Chem. Lett. 2012, 10, 239–253. [Google Scholar] [CrossRef]
  6. Stanley, J.K.; Ramirez, A.J.; Chambliss, C.K.; Brooks, B.W. Enantiospecific sublethal effects of the antidepressant fluoxetine to a model aquatic vertebrate and invertebrate. Chemosphere 2007, 69, 9–16. [Google Scholar] [CrossRef] [PubMed]
  7. Stanley, J.K.; Ramirez, A.J.; Mottaleb, M.; Chambliss, C.K.; Brooks, B.W. Enantiospecific toxicity of the beta-blocker propranolol to daphnia magna and pimephales promelas. Environ. Toxicol. Chem. 2006, 25, 1780–1786. [Google Scholar] [CrossRef] [PubMed]
  8. Rukhlenko, I.D.; Tepliakov, N.V.; Baimuratov, A.S.; Andronaki, S.A.; Gun’ko, Y.K.; Baranov, A.V.; Fedorov, A.V. Completely chiral optical force for enantioseparation. Sci. Rep. 2016, 6, 36884. [Google Scholar] [CrossRef] [PubMed]
  9. Kupai, J.; Rojik, E.; Huszthy, P.; Szekely, G. Role of chirality and macroring in imprinted polymers with enantiodiscriminative power. ACS Appl. Mater. Interfaces 2015, 7, 9516–9525. [Google Scholar] [CrossRef] [PubMed]
  10. Pinho, S.; Oliveira, A.; Costa, I.; Gouveia, C.A.; Carvalho, F.; Moreira, R.F.; Dinis-Oliveira, R.J. Simultaneous quantification of tramadol and O-desmethyltramadol in hair samples by gas chromatography-electron impact/mass spectrometry. Biomed. Chromatogr. 2013, 27, 1003–1011. [Google Scholar] [CrossRef] [PubMed]
  11. Castrignano, E.; Lubben, A.; Kasprzyk-Hordern, B. Enantiomeric profiling of chiral drug biomarkers in wastewater with the usage of chiral liquid chromatography coupled with tandem mass spectrometry. J. Chromatogr. A 2016, 1438, 84–99. [Google Scholar] [CrossRef] [PubMed] [Green Version]
  12. Mohr, S.; Taschwer, M.; Schmid, M.G. Chiral separation of cathinone derivatives used as recreational drugs by HPLC-UV using a CHIRALPAK® AS-H column as stationary phase. Chirality 2012, 24, 486–492. [Google Scholar] [CrossRef] [PubMed]
  13. Ribeiro, A.R.; Maia, A.S.; Moreira, I.S.; Afonso, C.M.; Castro, P.M.; Tiritan, M.E. Enantioselective quantification of fluoxetine and norfluoxetine by HPLC in wastewater effluents. Chemosphere 2014, 95, 589–596. [Google Scholar] [CrossRef] [PubMed]
  14. Zhang, F.; He, L.; Sun, W.; Cheng, Y.; Liu, J.; Ren, Z. Chiral liquid membrane for enantioselective separation of racemic ibuprofen by l-tartaric acid derivatives. RSC Adv. 2015, 5, 41729–41735. [Google Scholar] [CrossRef]
  15. Musshoff, F.; Madea, B. Fatality due to ingestion of tramadol alone. Forensic Sci. Int. 2001, 116, 197–199. [Google Scholar] [CrossRef]
  16. Grond, S.; Sablotzki, A. Clinical pharmacology of tramadol. Clin. Pharmacokinet. 2004, 43, 879–923. [Google Scholar] [CrossRef] [PubMed]
  17. Kusari, S.; Tatsimo, S.J.; Zuhlke, S.; Spiteller, M. Synthetic origin of tramadol in the environment. Angew. Chem. Int. Ed. 2016, 55, 240–243. [Google Scholar] [CrossRef] [PubMed]
  18. El-Sayed, A.A.; Mohamed, K.M.; Nasser, A.Y.; Button, J.; Holt, D.W. Simultaneous determination of tramadol, O-desmethyltramadol and n-desmethyltramadol in human urine by gas chromatography-mass spectrometry. J. Chromatogr. B 2013, 926, 9–15. [Google Scholar] [CrossRef] [PubMed]
  19. Patel, B.N.; Sharma, N.; Sanyal, M.; Shrivastav, P.S. An accurate, rapid and sensitive determination of tramadol and its active metabolite O-desmethyltramadol in human plasma by LC–MS/MS. J. Pharm. Biomed. Anal. 2009, 49, 354–366. [Google Scholar] [CrossRef] [PubMed]
  20. Mahmoud, M.; El-Abhar, H.; Saleh, S. The effect of nigella sativa oil against the liver damage induced by schistosoma mansoni infection in mice. J. Ethnopharmacol. 2002, 79, 1–11. [Google Scholar] [CrossRef]
  21. Awadalla, E.A.; Salah-Eldin, A. Histopathological and molecular studies on tramadol mediated hepato-renal toxicity in rats. IOSR J. Pharm. Biol. Sci. 2015, 10, 90–102. [Google Scholar]
  22. Tao, Q.; Stone, D.J., Jr.; Borenstein, M.R.; Jean-Bart, V.; Codd, E.E.; Coogan, T.P.; Desai-Krieger, D.; Liao, S.; Raffa, R.B. Gas chromatographic method using nitrogen–phosphorus detection for the measurement of tramadol and its O-desmethyl metabolite in plasma and brain tissue of mice and rats. J. Chromatogr. B Biomed. Sci. Appl. 2001, 763, 165–171. [Google Scholar] [CrossRef]
  23. Ardakani, Y.H.; Rouini, M.-R. Improved liquid chromatographic method for the simultaneous determination of tramadol and its three main metabolites in human plasma, urine and saliva. J. Pharm. Biomed. Anal. 2007, 44, 1168–1173. [Google Scholar] [CrossRef] [PubMed]
  24. Li, Q.; Wang, R. Simultaneous analysis of tramadol, metoprolol and their metabolites in human plasma and urine by high performance liquid chromatography. Chin. Med. J. 2006, 119, 2013–2017. [Google Scholar] [PubMed]
  25. Zhao, L.M.; Chen, X.Y.; Cui, J.J.; Sunita, M.; Zhong, D.F. Determination of tramadol and its active metabolite O-desmethyltramadol in plasma and amniotic fluid using LC/MS/MS. Acta Pharm. Sin. 2004, 39, 458–462. [Google Scholar]
  26. Ceccato, A.; Chiap, P.; Hubert, P.; Crommen, J. Automated determination of tramadol enantiomers in human plasma using solid-phase extraction in combination with chiral liquid chromatography. J. Chromatogr. B Biomed. Sci. Appl. 1997, 698, 161–170. [Google Scholar] [CrossRef]
  27. Valle, M.; Pavón, J.M.; Calvo, R.; Campanero, M.A.; Trocóniz, I.F. Simultaneous determination of tramadol and its major active metabolite O-demethyltramadol by high-performance liquid chromatography with electrochemical detection. J. Chromatogr. B Biomed. Sci. Appl. 1999, 724, 83–89. [Google Scholar] [CrossRef]
  28. Ceccato, A.; Vanderbist, F.; Pabst, J.Y.; Streel, B. Enantiomeric determination of tramadol and its main metabolite O-desmethyltramadol in human plasma by liquid chromatography-tandem mass spectrometry. J. Chromatogr. B Biomed. Sci. Appl. 2000, 748, 65–76. [Google Scholar] [CrossRef]
  29. Ruda, S.; Cherkaoui, S.; Dayer, P.; Fanali, S.; Veuthey, J.L. Simultaneous stereoselective analysis of tramadol and its main phase I metabolites by on-line capillary zone electrophoresis-electrospray ionization mass spectrometry. J. Chromatogr. A 2000, 868, 295–303. [Google Scholar] [CrossRef]
  30. Juzwin, S.J.; Wang, D.C.; Anderson, N.J.; Wong, F.A. The determination of RWJ-38705 (tramadol N-oxide) and its metabolites in preclinical pharmacokinetic studies using LC–MS/MS. J. Pharm. Biomed. Anal. 2000, 22, 469–480. [Google Scholar] [CrossRef]
  31. Gan, S.H.; Ismail, R. Validation of a high-performance liquid chromatography method for tramadol and O-desmethyltramadol in human plasma using solid-phase extraction. J. Chromatogr. B Biomed. Sci. Appl. 2001, 759, 325–335. [Google Scholar] [CrossRef]
  32. Nobilis, M.; Kopecky, J.; Kvetina, J.; Chladek, J.; Svoboda, Z.; Vorisek, V.; Perlik, F.; Pour, M.; Kunes, J. High-performance liquid chromatographic determination of tramadol and its O-desmethylated metabolite in blood plasma: Application to a bioequivalence study in humans. J. Chromatogr. A 2002, 949, 11–22. [Google Scholar] [CrossRef]
  33. Campanero, M.A.; García-Quetglas, E.; Sádaba, B.; Azanza, J.R. Simultaneous stereoselective analysis of tramadol and its primary phase I metabolites in plasma by liquid chromatography: Application to a pharmacokinetic study in humans. J. Chromatogr. A 2004, 1031, 219–228. [Google Scholar] [CrossRef] [PubMed]
  34. Ardakani, Y.H.; Mehvar, R.; Foroumadi, A.; Rouini, M.-R. Enantioselective determination of tramadol and its main phase I metabolites in human plasma by high-performance liquid chromatography. J. Chromatogr. B 2008, 864, 109–115. [Google Scholar] [CrossRef] [PubMed]
  35. Gu, Y.; Fawcett, J.P. Improved HPLC method for the simultaneous determination of tramadol and O-desmethyltramadol in human plasma. J. Chromatogr. B 2005, 821, 240–243. [Google Scholar] [CrossRef] [PubMed]
  36. Rouini, M.-R.; Ardakani, Y.H.; Soltani, F.; Aboul-Enein, H.Y.; Foroumadi, A. Development and validation of a rapid HPLC method for simultaneous determination of tramadol, and its two main metabolites in human plasma. J. Chromatogr. B 2006, 830, 207–211. [Google Scholar] [CrossRef] [PubMed]
  37. Mehvar, R.; Elliott, K.; Parasrampuria, R.; Eradiri, O. Stereospecific high-performance liquid chromatographic analysis of tramadol and its O-demethylated (M1) and N,O-demethylated (M5) metabolites in human plasma. J. Chromatogr. B 2007, 852, 152–159. [Google Scholar] [CrossRef] [PubMed]
  38. Curticapean, A.; Muntean, D.; Curticapean, M.; Dogaru, M.; Vari, C. Optimized HPLC method for tramadol and O-desmethyl tramadol determination in human plasma. J. Biochem. Biophys. Methods 2008, 70, 1304–1312. [Google Scholar] [CrossRef] [PubMed]
  39. Vlase, L.; Leucuta, S.E.; Imre, S. Determination of tramadol and O-desmethyltramadol in human plasma by high-performance liquid chromatography with mass spectrometry detection. Talanta 2008, 75, 1104–1109. [Google Scholar] [CrossRef] [PubMed]
  40. Evans, S.E.; Davies, P.; Lubben, A.; Kasprzyk-Hordern, B. Determination of chiral pharmaceuticals and illicit drugs in wastewater and sludge using microwave assisted extraction, solid-phase extraction and chiral liquid chromatography coupled with tandem mass spectrometry. Anal. Chim. Acta 2015, 882, 112–126. [Google Scholar] [CrossRef] [PubMed] [Green Version]
  41. ICH Steering Committee. ICH Q2B Validation of Analytical Procedures: Methodology; (CPMP/ICH/281/95); European Agency for the Evaluation of Medicinal Products, International Commission on Harmonisation: London, UK, 1996. [Google Scholar]
  42. Lämmerhofer, M. Chiral recognition by enantioselective liquid chromatography: Mechanisms and modern chiral stationary phases. J. Chromatogr. A 2010, 1217, 814–856. [Google Scholar] [CrossRef] [PubMed]
  43. De Campos Lourenço, T.; Cassiano, N.M.; Cass, Q.B. Fases estacionárias quirais para cromatografia líquida de alta eficiência. Quim. Nova 2010, 33, 2155–2164. [Google Scholar] [CrossRef]
  44. Ward, T.J.; Ward, K.D. Chiral separations: Fundamental review 2010. Anal. Chem. 2010, 82, 4712–4722. [Google Scholar] [CrossRef] [PubMed]
  45. Kalíková, K.; Riesová, M.; Tesařová, E. Recentchiral selectors for separation in HPLC and CE. Cent. Eur. J. Chem. 2012, 10, 450–471. [Google Scholar] [CrossRef]
  46. Scriba, G.K.E. Chiral recognition mechanisms in analytical separation sciences. Chromatographia 2012, 75, 815–838. [Google Scholar] [CrossRef]
  47. Fernandes, C.; Tiritan, M.; Pinto, M. Small molecules as chromatographic tools for HPLC enantiomeric resolution: Pirkle-type chiral stationary phases evolution. Chromatographia 2013, 76, 871–897. [Google Scholar] [CrossRef]
  48. Haginaka, J. Recent progresses in protein-based chiral stationary phases for enantioseparations in liquid chromatography. J. Chromatogr. B 2008, 875, 12–19. [Google Scholar] [CrossRef] [PubMed]
  49. Perrin, C.; Vu, V.A.; Matthijs, N.; Maftouh, M.; Massart, D.L.; Vander Heyden, Y. Screening approach for chiral separation of pharmaceuticals: Part I. Normal-phase liquid chromatography. J. Chromatogr. A 2002, 947, 69–83. [Google Scholar] [CrossRef]
  50. Andersson, M.E.; Aslan, D.; Clarke, A.; Roeraade, J.; Hagman, G. Evaluation of generic chiral liquid chromatography screens for pharmaceutical analysis. J. Chromatogr. A 2003, 1005, 83–101. [Google Scholar] [CrossRef]
  51. Cass, Q.B.; Batigalhia, F. Enantiomeric resolution of a series of chiral sulfoxides by high-performance liquid chromatography on polysaccharide-based columns with multimodal elution. J. Chromatogr. A 2003, 987, 445–452. [Google Scholar] [CrossRef]
  52. Fernandes, C.; Palmeira, A.; Santos, A.; Tiritan, M.E.; Afonso, C.; Pinto, M.M. Enantioresolution of chiral derivatives of xanthones on (S,S)-whelk-O1 and l-phenylglycine stationary phases and chiral recognition mechanism by docking approach for (S,S)-whelk-O1. Chirality 2013, 25, 89–100. [Google Scholar] [CrossRef] [PubMed]
  53. Chytil, L.; Matouskova, O.; Cerna, O.; Pokorna, P.; Vobruba, V.; Perlik, F.; Slanar, O. Enantiomeric determination of tramadol and O-desmethyltramadol in human plasma by fast liquid chromatographic technique coupled with mass spectrometric detection. J. Chromatogr. B 2010, 878, 481–486. [Google Scholar] [CrossRef] [PubMed]
  54. Musshoff, F.; Madea, B.; Stuber, F.; Stamer, U.M. Enantiomeric determination of tramadol and O-desmethyltramadol by liquid chromatography-mass spectrometry and application to postoperative patients receiving tramadol. J. Anal. Toxicol. 2006, 30, 463–467. [Google Scholar] [CrossRef] [PubMed]
  55. ICH, M. Q2b—Validation of analytical procedures: Methodology. In Proceedings of the International Conference on Harmonization Expert Working Group, Geneva, Switzerland, 6 Novermber 1996. [Google Scholar]
  56. Stamer, U.M.; Musshoff, F.; Kobilay, M.; Madea, B.; Hoeft, A.; Stuber, F. Concentrations of tramadol and O-desmethyltramadol enantiomers in different CYP2D6 genotypes. Clin. Pharmacol. Ther. 2007, 82, 41–47. [Google Scholar] [CrossRef] [PubMed]
  57. Payne, K.A.; Roelofse, J.A.; Shipton, E.A. Pharmacokinetics of oral tramadol drops for postoperative pain relief in children aged 4 to 7 years—A pilot study. Anesth. Prog. 2002, 49, 109–112. [Google Scholar] [PubMed]
  58. Paar, W.D.; Poche, S.; Gerloff, J.; Dengler, H.J. Polymorphic CYP2D6 mediates O-demethylation of the opioid analgesic tramadol. Eur. J. Clin. Pharmacol. 1997, 53, 235–239. [Google Scholar] [CrossRef] [PubMed]
Figure 1. Chemical structure of tramadol enantiomers and its metabolites.
Symmetry 09 00170 g001
Figure 2. Chromatogram of a mixture of the three analytes using ACN (5mM ammonium formate/ 0.1% DEA)/H2O 30:70 (v/v) as the mobile phase at a flow rate of 0.5 mL min−1 a using Lux Cellulose-2 column.
Symmetry 09 00170 g002
Figure 3. Chromatogram of a mixture of the three analytes (orange line) and of a mixture of O-DT and tramadol (blue line) using ACN (5 mM ammonium formate/0.1% DEA)/ H2O (35:65 (v/v)) as the mobile phase at a flow rate of 0.5 mL min−1 using a Lux Cellulose-4 column.
Symmetry 09 00170 g003
Figure 4. Chromatogram of a mixture of the three analytes using MeOH (5 mM Ammonium formate/0.05% DEA)/H2O (55:45 (v/v)) as the mobile phase at a flow rate of 0.5 mL min−1 using a Lux Cellulose-4 column.
Symmetry 09 00170 g004
Figure 5. Chromatogram of a mixture of the three analytes using ACN/EtOH (10 mM ammonium Format/0.1% DEA)/ H2O (17.5:17.5:65 (v/v/v)) as the mobile phase with a flow rate of 0.5 mL min−1 using a Lux Cellulose-4 column.
Symmetry 09 00170 g005
Figure 6. Chromatogram of a mixture of the three compounds using a mixture of 0.1% diethylamine in Hex/EtOH, (96:4 (v/v)) as the mobile phase at a flow of 0.7 mL min−1 using a Lux Cellulose-4 column.
Symmetry 09 00170 g006
Figure 7. Recoveries obtained for each SPE procedure.
Symmetry 09 00170 g007
Figure 8. Chromatogram of a synthetic influent (red line), standards mixture in synthetic wastewater at 410 ng mL−1 (green line), and a standards mixture at 410 ng mL−1 in solvent (orange line); mobile phase: 0.1% diethylamine in hexane and ethanol (96:4, v/v); the flow rate is 0.7 mL min−1.
Symmetry 09 00170 g008
Table 1. Experimental conditions of SPE.
ProcedureCartridgeConditioningWashingElution (1st Step)Elution (2nd Step)
1MCX8 mL MeOH
8 mL H2O
8 mL H2O
8 mL MeOH
8 mL of 5% NH4OH solved in ACN/MeOH 60:40-
2MCX8 mL MeOH
8 mL H2O
8 mL 2% Formic Acid8 mL MeOH8 mL of 5% NH4OH solved in MeOH
3MCX8 mL MeOH
8 mL H2O
8 mL 2% Formic Acid12 mL of 10% NH4OH solved in MeOH-
4MCX8 mL EtOH
8 mL H2O
8 mL 2% Formic Acid8 mL EtOH8 mL of 5% NH4OH solved in EtOH
5MCX8 mL EtOH
8 mL Formic acid 2%
8 mL 2% Formic Acid8 mL of 0.6% Formic Acid solved in EtOH8 mL of 5% NH4OH solved in EtOH
6MCX8 mL EtOH
8 mL H2O
(pH = 2 adjusted with HCl)
8 mL 2% Formic Acid8 mL EtOH8 mL of 5% NH4OH solved in EtOH
7HLB10 mL MetOH
10 mL H2O
10 mL H2O10 mL MeOH-
8MCX8 mL MeOH
8 mL H2O
8 mL 2% Formic Acid12 mL of 10% NH4OH solved in MeOH-
9MCX8 mL EtOH
8 mL H2O
8 mL 2% Formic Acid8 mL EtOH8 mL of 5% NH4OH solved in EtOH
10MCX8 mL EtOH
8 mL 2% Formic Acid
8 mL 2% Formic Acid8 mL of 0.6% Formic Acid solved in EtOH12 mL of 5% NH4OH solved in EtOH
11MCX8 mL EtOH
8 mL 2% Formic Acid
8 mL 2% Formic Acid12 mL of 5% NH4OH solved in EtOH-
12MCX8 mL EtOH
8 mL 2% Formic Acid
8 mL 2% Formic Acid8 mL of 0.6% Formic Acid solved in EtOH12 mL of 5% NH4OH solved in EtOH
MCX: Mixed-mode strong cation exchange; HLB: Hydrophilic-Lipophilic Balance Cartridge.
Table 2. Results of the enantiomeric separation of tramadol and of its metabolites on Cellulose chiral stationary phases (CSP).
ColumnElution ModeMobile Phase: Proportion (v/v)TramadolN-DTO-DT
K1K2αRsK1K2αRsK1K2αRs
Lux Cellulose-2NormalHex/IPA/DEA: 90:10:0.1 **0.730.891.221.001.131.621.443.021.553.041.965.53
Hex/IPA/DEA: 90:10:0.05 **4.314.661.080.924.535.571.232.759.8614.71.494.10
Hex/EtOH/DEA: 96:4: 0.1 **0.981.071.111.121.91-1.00-3.564.161.172.42
ReversedACN (5 mM ammonium formate/0.1% DEA)/H2O: 35:65 *5.756.131.071.494.29-1.00-1.291.421.110.949
ACN (5 mM ammonium formate/0.1% DEA)/H2O: 30:70 *9.9810.61.071.897.19-1.00-1.912.111.111.31
Lux Cellulose-4ReversedACN (5 mM ammonium formate/0.1% DEA)/H2O: 35:65 **6.327.211.142.7910.711.41.071.261.251.661.332.31
MeOH (5 mM ammonium formate/0.05% DEA)/H2O: 55:45 **10.711.91.122.184.624.831.050.2362.432.851.171.43
ACN:EtOH (10 mM ammonium formate/0.1% DEA) /H2O: 17.5:17.5:65 **8.9110.11.132.694.654.921.060.362.072.651.282.62
NormalHex/EtOH/DEA—96:4:0.1 ***0.740.9201.242.161.431.701.191.852.483.331.344.16
K1: Retention Factor of enantiomer 1; K2: Retention Factor of enantiomer 2; α: Separation Factor; Rs: Resolution; * flow rate of 0.3 mL/min; ** flow rate of 0.5 mL/min; *** flow rate of 0.7 mL/min.
Table 3. Linearity, range, instrumental detection and quantification limits, and method detection and quantification limits.
AnalyteENominal Conc. Range (ng L−1)Calibration Curve Equationr2IDL (ng L−1)IQL (ng L−1)MDL (ng L−1)MQL (ng L−1)
Tramadol(−)-T28–168y = 6944.4x − 935250.99021035828
(+)-Ty = 7421.2x − 1135990.99011035828
N-DT(−)-N-DT28–168y = 6128.8x + 42470.99581035828
(+)-N-DTy = 5973.8x + 333960.99391035828
O-DT(−)-O-DT56–196y = 30420x − 2 × 1060.995425702056
(+)-O-DTy = 44269x − 2 × 1060.994825702056
(E: enantiomer; IDL: instrumental detection limit; IQL: instrumental quantification limit; MDL: method detection limit; MQL: method quantification limit).
Table 4. Recovery, accuracy, and intra- and inter-day precision of each enantiomer.
AnalyteNominal Concentration (ng mL−1)E1st Day2nd Day3rd DayInter-Day RSD (%)Recovery (%)
Accuracy (%)RSD (%)Accuracy (%)RSD (%)Accuracy (%)RSD (%)
Tramadol75(−)-T89.67.788.54.994.33.16.587.1
(+)-T90.68.391.43.793.35.96.488.9
150(−)-T80.14.680.61.682.16.54.978.4
(+)-T81.06.780.40.382.95.85.478.3
205(−)-T105.61.082.28.097.98.512.597.8
(+)-T70.31.184.03.890.08.411.783.2
N-DT75(−)-N-DT99.18.282.08.8105.73.511.799.2
(+)-N-DT114.18.891.23.9100.08.911.799.4
150(−)-N-DT98.31.791.96.297.56.15.897.6
(+)-N-DT87.85.681.31.590.66.76.888.2
205(−)-N-DT77.06.385.64.0105.47.916.785.9
(+)-N-DT79.44.989.63.7108.77.416.389.8
O-DT75(−)-O-DT94.95.092.58.296.94.514.872.2
(+)-O-DT96.06.897.18.997.59.29.583.6
150(−)-O-DT97.09.993.25.096.37.810.687.4
(+)-O-DT99.94.698.57.299.43.65.998.1
205(−)-O-DT81.77.090.04.597.93.814.982.0
(+)-O-DT90.25.995.66.3106.38.914.592.2
E: Enantiomer; RSD: relative standard deviation.
Table 5. Concentration and enantiomeric fraction of analytes present in samples collected and degree of removal efficiency.
Sample nº12
EffluentInfluentEffluentInfluent
Concentration (ng L−1)Tramadol(−)-T235.8357.9325.1350.0
(+)-T118.7233.6314.9233.8
N-DT(−)-N-DT<QL<QL<QL<QL
(+)-N-DT43.763.962.172.7
O-DT(−)-O-DT60.869.771.669.5
(+)-O-DT57.786.795.4106.7
Enantiomeric FractionTramadolEF10.670.610.510.60
N-DTEF1≈0≈0≈0≈0
O-DTEF10.510.450.430.39
DRE (%)Tramadol(−)-T65.992.9
(+)-T50.8134.7 *
N-DT(−)-N-DTNCNC
(+)-N-DT68.485.4
O-DT(−)-O-DT87.2103.0 *
(+)-O-DT66.689.4
<QL: under quantification limit; NC: not calculated; E1 and E2 are the first and second enantiomers eluted, respectively; EF1: enantiomeric fraction of the first enantiomer eluted; DRE, degree of removal efficiency. * enrichment in the effluent.

