NS-k-NN: Neutrosophic Set-Based k-Nearest Neighbors Classifier


1
Department of Electrical and Electronics Engineering, Technology Faculty, Firat University, Elazig 23119, Turkey
2
Department of Computer Science, University of Illinois at Springfield, Springfield, IL 62703, USA
3
Department of Mathematics and Sciences, University of New Mexico, Gallup, NM 87301, USA
*
Author to whom correspondence should be addressed.
Symmetry 2017, 9(9), 179; https://doi.org/10.3390/sym9090179
Submission received: 2 August 2017
/
Revised: 16 August 2017
/
Accepted: 29 August 2017
/
Published: 2 September 2017
(This article belongs to the Special Issue Neutrosophic Theories Applied in Engineering)
Abstract
:k-nearest neighbors (k-NN), which is known to be a simple and efficient approach, is a non-parametric supervised classifier. It aims to determine the class label of an unknown sample by its k-nearest neighbors that are stored in a training set. The k-nearest neighbors are determined based on some distance functions. Although k-NN produces successful results, there have been some extensions for improving its precision. The neutrosophic set (NS) defines three memberships namely T, I and F. T, I, and F shows the truth membership degree, the false membership degree, and the indeterminacy membership degree, respectively. In this paper, the NS memberships are adopted to improve the classification performance of the k-NN classifier. A new straightforward k-NN approach is proposed based on NS theory. It calculates the NS memberships based on a supervised neutrosophic c-means (NCM) algorithm. A final belonging membership U is calculated from the NS triples as . A similar final voting scheme as given in fuzzy k-NN is considered for class label determination. Extensive experiments are conducted to evaluate the proposed method’s performance. To this end, several toy and real-world datasets are used. We further compare the proposed method with k-NN, fuzzy k-NN, and two weighted k-NN schemes. The results are encouraging and the improvement is obvious.
1. Introduction
The k-nearest neighbors (k-NN), which is known to be the oldest and simplest approach, is a non-parametric supervised classifier [1,2]. It aims to determine the class label of an unknown sample by its k-nearest neighbors that are stored in a training set. The k-nearest neighbors are determined based on some distance functions. As it is simplest and oldest approach, there have been so many data mining and pattern recognition applications, such as ventricular arrhythmia detection [3], bankruptcy prediction [4], diagnosis of diabetes diseases [5], human action recognition [6], text categorization [7], and many other successful ones.
Although k-NN produces successful results, there have been some extensions for improving its precision. Fuzzy theory-based k-NN (Fuzzy k-NN) has been among the most successful ones. As k-NN produces crisp memberships for training data samples, fuzzy k-NN replaces the crisp memberships with a continuous range of memberships which enhances the class label determination. Keller et al. [8] was the one who incorporated the fuzzy theory in the k-NN approach. Authors proposed three different methods for assigning fuzzy memberships to the labeled samples. After determination of the fuzzy memberships, some distance function was used to weight the fuzzy memberships for final class label determination of the test sample. The membership assignment by the conventional fuzzy k-NN algorithm has a disadvantage in that it depends on the choice of some distance function. To alleviate this drawback, Pham et al. [9] proposed an optimally-weighted fuzzy k-NN approach. Author introduced a computational scheme for determining optimal weights which were used to improve the efficiency of the fuzzy k-NN approach. Denœux et al. [10] proposed a k-NN method where Dempster-Shafer theory was used to calculate the memberships of the training data samples. Author assumed that each neighbor of a sample to be classified was considered as an item of evidence and the degree of support was defined as a function of the distance. The final class label assignment was handled by Dempster’s rule of combination. Another evidential theory-based k-NN approach, denoted by Ek-NN, has been proposed by Zouhal et al. [11]. In addition to the belonging degree, the authors introduced the ignorant class to model the uncertainty. Then, Zouhal et al. [12] proposed the generalized Ek-NN approach, denoted by FEk-NN. Authors adopted fuzzy theory for improving the Ek-NN classification performance. The motivation for the FEk-NN was arisen from the fact that each training sample was considered having some degree of membership to each class. In addition, Liu et al. [13] proposed an evidential reasoning based fuzzy-belief k-nearest neighbor (FBK-NN) classifier. In FBK-NN, each labeled sample was assigned with a fuzzy membership to each class according to its neighborhood and the test sample’s class label was determined by the K basic belief assignments which were determined from the distances between the object and its K nearest neighbors. A belief theory based k-NN, denoted by the BK-NN classifier was introduced by Liu et al. [14]. The author aimed to deal with uncertain data using the meta-class. Although, the proposed method produced successful results, the computation complexity and the sensitivity to k makes the approach inconvenient for many classification application. Derrac et al. [15] proposed an evolutionary fuzzy k-NN approach where interval-valued fuzzy sets were used. The authors not only defined a new membership function, but also a new voting scheme was proposed. Dudani et al. [16] proposed a weighted voting method for k-NN which was called the distance-weighted k-NN (WKNN). Authors presumed that the closer neighbors were weighted more heavily than the farther ones, using the distance-weighted function. Gou et al. [17] proposed a distance-weighted k-NN (DWKNN) method where a dual distance-weighted function was introduced. The proposed method has improved the traditional k-NN’s performance by using a new method for selection of the k value.
In [18,19,20,21], Smarandache proposed neutrosophic theories. Neutrosophy was introduced as a new branch of philosophy which deals with the origin, nature, and scope of neutralities, and their interactions with different ideational spectra [19]. Neutrosophy is the base for the neutrosophic set (NS), neutrosophic logic, neutrosophic probability, neutrosophic statistics, and so on. In NS theory, every event has not only a certain degree of truth, but also a falsity degree and an indeterminacy degree that have to be considered independently from each other [20]. Thus, an event, or entity, {A} is considered with its opposite {Anti-A} and the neutrality {Neut-A}. NS provides a powerful tool to deal with the indeterminacy. In this paper, a new straightforward k-NN approach was developed which is based on NS theory. We adopted the NS memberships to improve the classification performance of the k-NN classifier. To do so, the neutrosophic c-means (NCM) algorithm was considered in a supervised manner, where labeled training data was used to obtain the centers of clusters. A final belonging membership degree U was calculated from the NS triples as U = T + I − F. A similar final voting scheme as given in fuzzy k-NN was employed for class label determination.
The paper is organized as follows: In the next section, we briefly reviewed the theories of k-NN and fuzzy k-NN. In Section 3, the proposed method was introduced and the algorithm of the proposed method was tabulated in Table 1. The experimental results and related comparisons were given in Section 4. The paper was concluded in Section 5.
2. Related works
2.1. k-Nearest Neighbor (k-NN) Classifier
As it was mentioned earlier, k-NN is the simplest, popular, supervised, and non-parametric classification method which was proposed in 1951 [1]. It is a distance based classifier which needs to measure the similarity of the test data to the data samples stored in the training set. Then, the test data is labelled by a majority vote of its k-nearest neighbors in the training set.
Let denote the training set where is a training data point in the n-dimensional feature space and let denotes the corresponding class labels. Given a test data point whose class label is unknown, it can be determined as follows:
- Calculate the similarity measures between test sample and training samples by using a distance function (e.g., Euclidean distance)
- Find the test sample’s k nearest neighbors in training data samples according to the similarity measure and determine the class label by the majority voting of its nearest neighbors.
2.2. Fuzzy k-Nearest Neighbor (k-NN) Classifier
In k-NN, a training data sample is assumed to belong to one of the given classes so the membership U of that training sample to each class of C is given by an array of values in {0, 1}. If training data sample belongs to class then and where .
However, in fuzzy k-NN, instead of using crisp memberships, continuous range of memberships is used due to the nature of fuzzy theory [8]. So, the membership of training data sample can be calculated as:
where shows the number of instances belonging to class found among the k neighbors of and k is an integer value between [3,9].
After fuzzy membership calculation, a test sample’s class label can be determined as following. Determine the k nearest neighbors of the test sample via Euclidean distance and produce a final vote for each class and neighbor using the Euclidean norm and the memberships:
where is the jth nearest neighbor and m = 2 is a parameter. The votes of each neighbor are then added to obtain the final classification.
3. Proposed Neutrosophic-k-NN Classifier
As traditional k-NN suffers from assigning equal weights to class labels in the training dataset, neutrosophic memberships are adopted in this work to overcome this limitation. Neutrosophic memberships reflect the data point’s significance in its class and these memberships can be used as a new procedure for k-NN approach.
Neutrosophic set can determine a sample’s memberships belonging to truth, false, and indeterminacy. An unsupervised neutrosophic clustering algorithm (NCM) is used in a supervised manner [22,23]. Crisp clustering methods assumed that every data points should belong to a cluster according to their nearness to the center of clusters. Fuzzy clustering methods assigned fuzzy memberships to each data point according to their nearness to the center of cluster. Neutrosophic clustering assigned memberships (T, I, and F) to each data point not only according to its nearness to a cluster center, but also according to the nearness to the center mean of the two clusters. Readers may refer to [22] for detailed information about the NCM clustering. As the labels of a training dataset samples are known in a supervised learning, the centers of the clusters can be calculated accordingly. Then, the related memberships of true (T), false (F), and indeterminacy (I) can be calculated as follows:
where m is a constant, is a regularization parameter and cj shows the center of cluster j. For each point i, the is the mean of two cluster centers where the true membership values are greater than the others. Tij shows the true membership value of point i for class j. Fi shows the falsity membership of point i and Ii determines the indeterminacy membership value for point i. Larger Tij means that the point i is near a cluster and less likely to be a noise. Larger Ii means that the point i is between any two clusters and larger Fi indicates that point i is likely to be a noise. A final membership value for point i can be calculated by adding indeterminacy membership value to true membership value and subtracting the falsity membership value as shown in Equation (6).
After determining the neutrosophic membership triples, the membership for an unknown sample to class label j, can be calculated as [9]:
where is the distance function to measure the distance between and , k shows the number of k-nearest neighbors and q is an integer. After the assignment of the neutrosophic membership grades of an unknown sample to all class labels, the neutrosophic k-NN assigns to the class whose neutrosophic membership is maximum. The following steps are used for construction of the proposed NS-k-NN method:
- Step 1:
- Initialize the cluster centers according to the labelled dataset and employ Equations (3)–(5) to calculate the T, I, and F values for each data training data point.
- Step 2:
- Compute membership grades of test data samples according to the Equations (6) and (7).
- Step 3:
- Assign class labels of the unknown test data points to the class whose neutrosophic membership is maximum.
4. Experimental Works
The efficiency of the proposed method was evaluated with several toy and real datasets. Two toy datasets were used to test the proposed method and investigate the effect of the parameters change on classification accuracy. On the other hand, several real datasets were used to compare the proposed method with traditional k-NN and fuzzy k-NN methods. We further compare the proposed method with several weighted k-NN methods such as weighted k-NN (WKNN) and distance-weighted k-nearest neighbor (DWKNN).
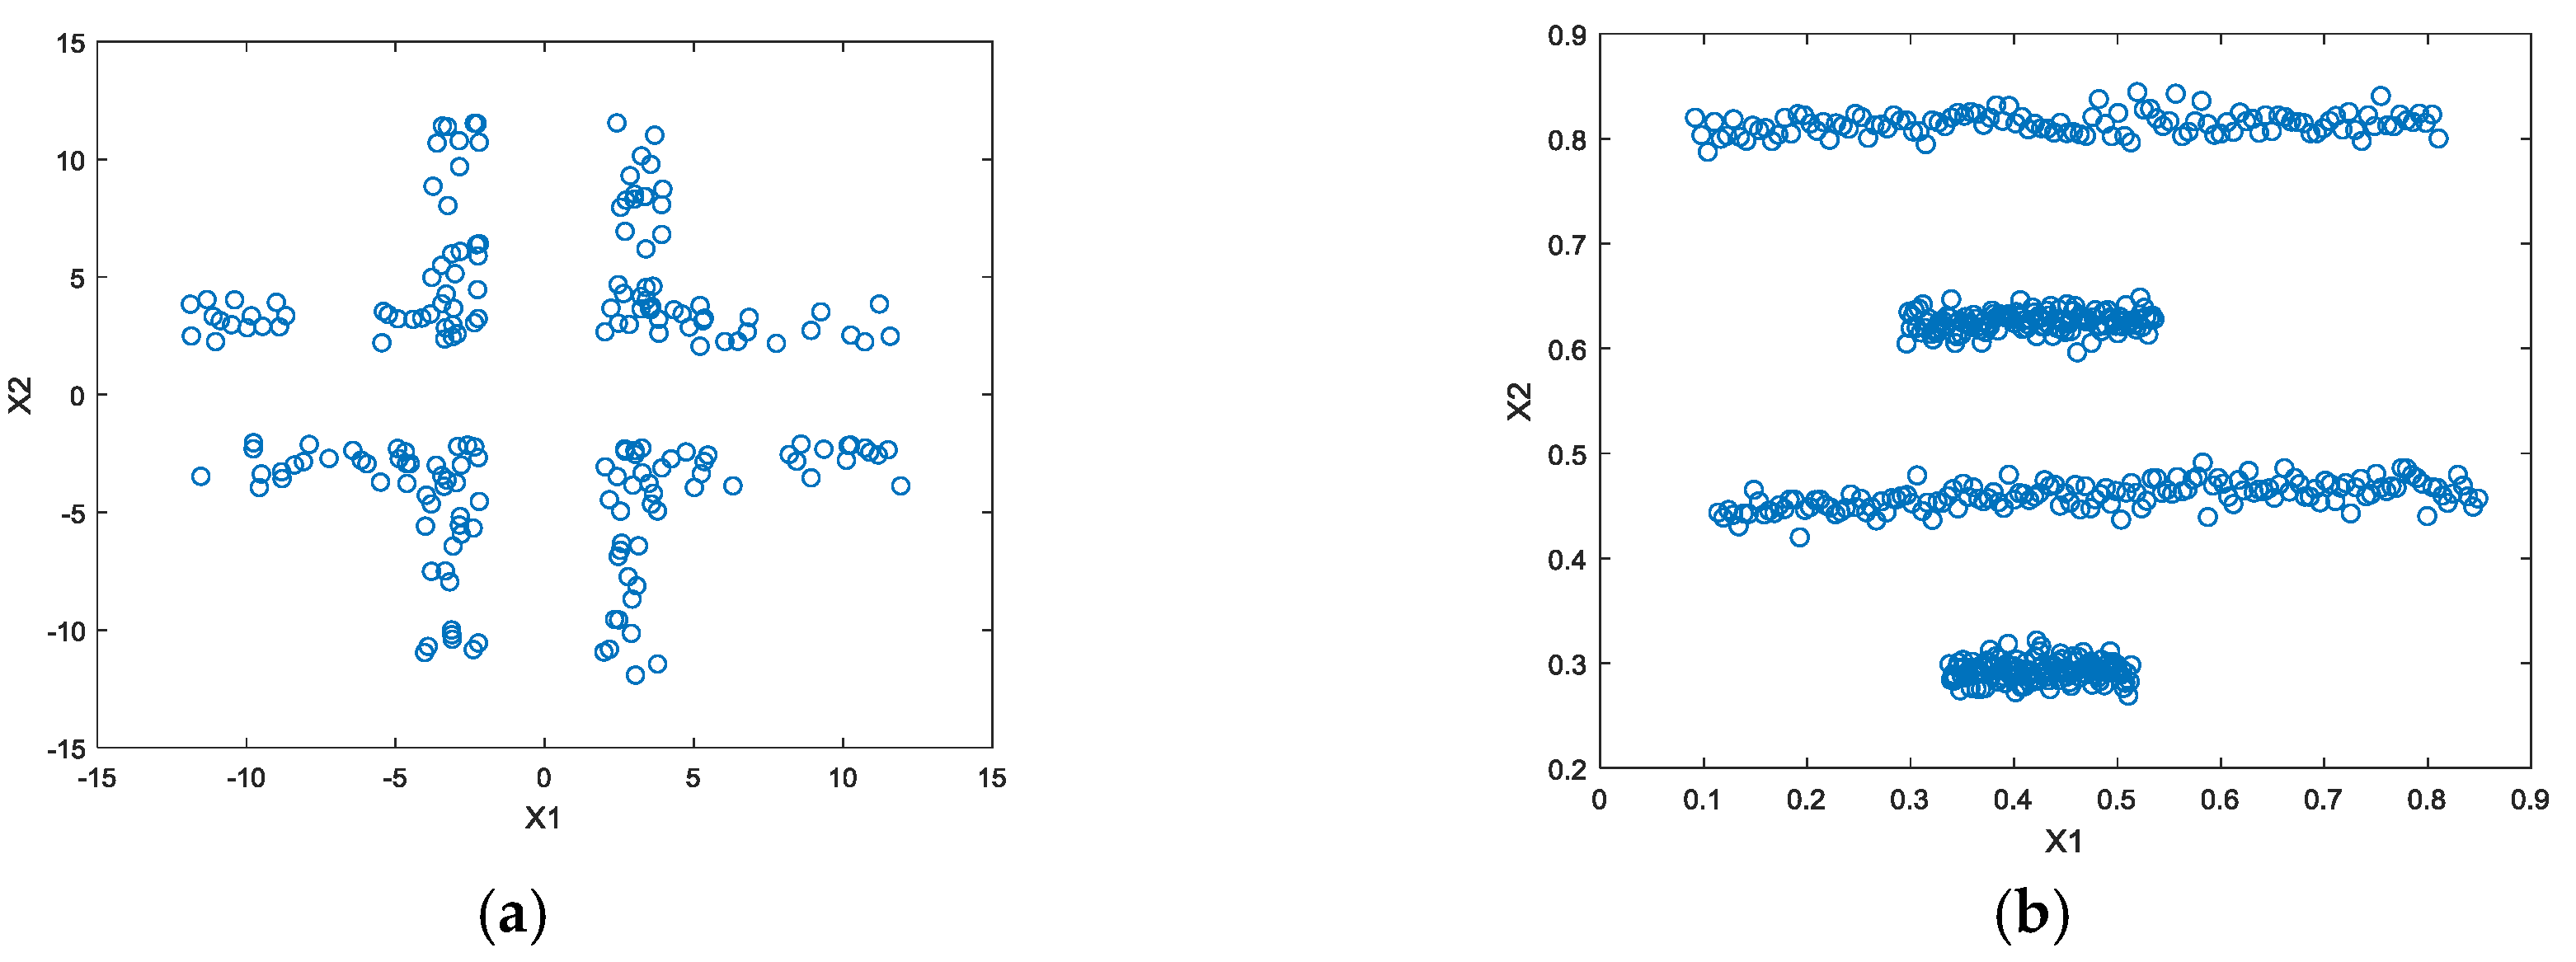
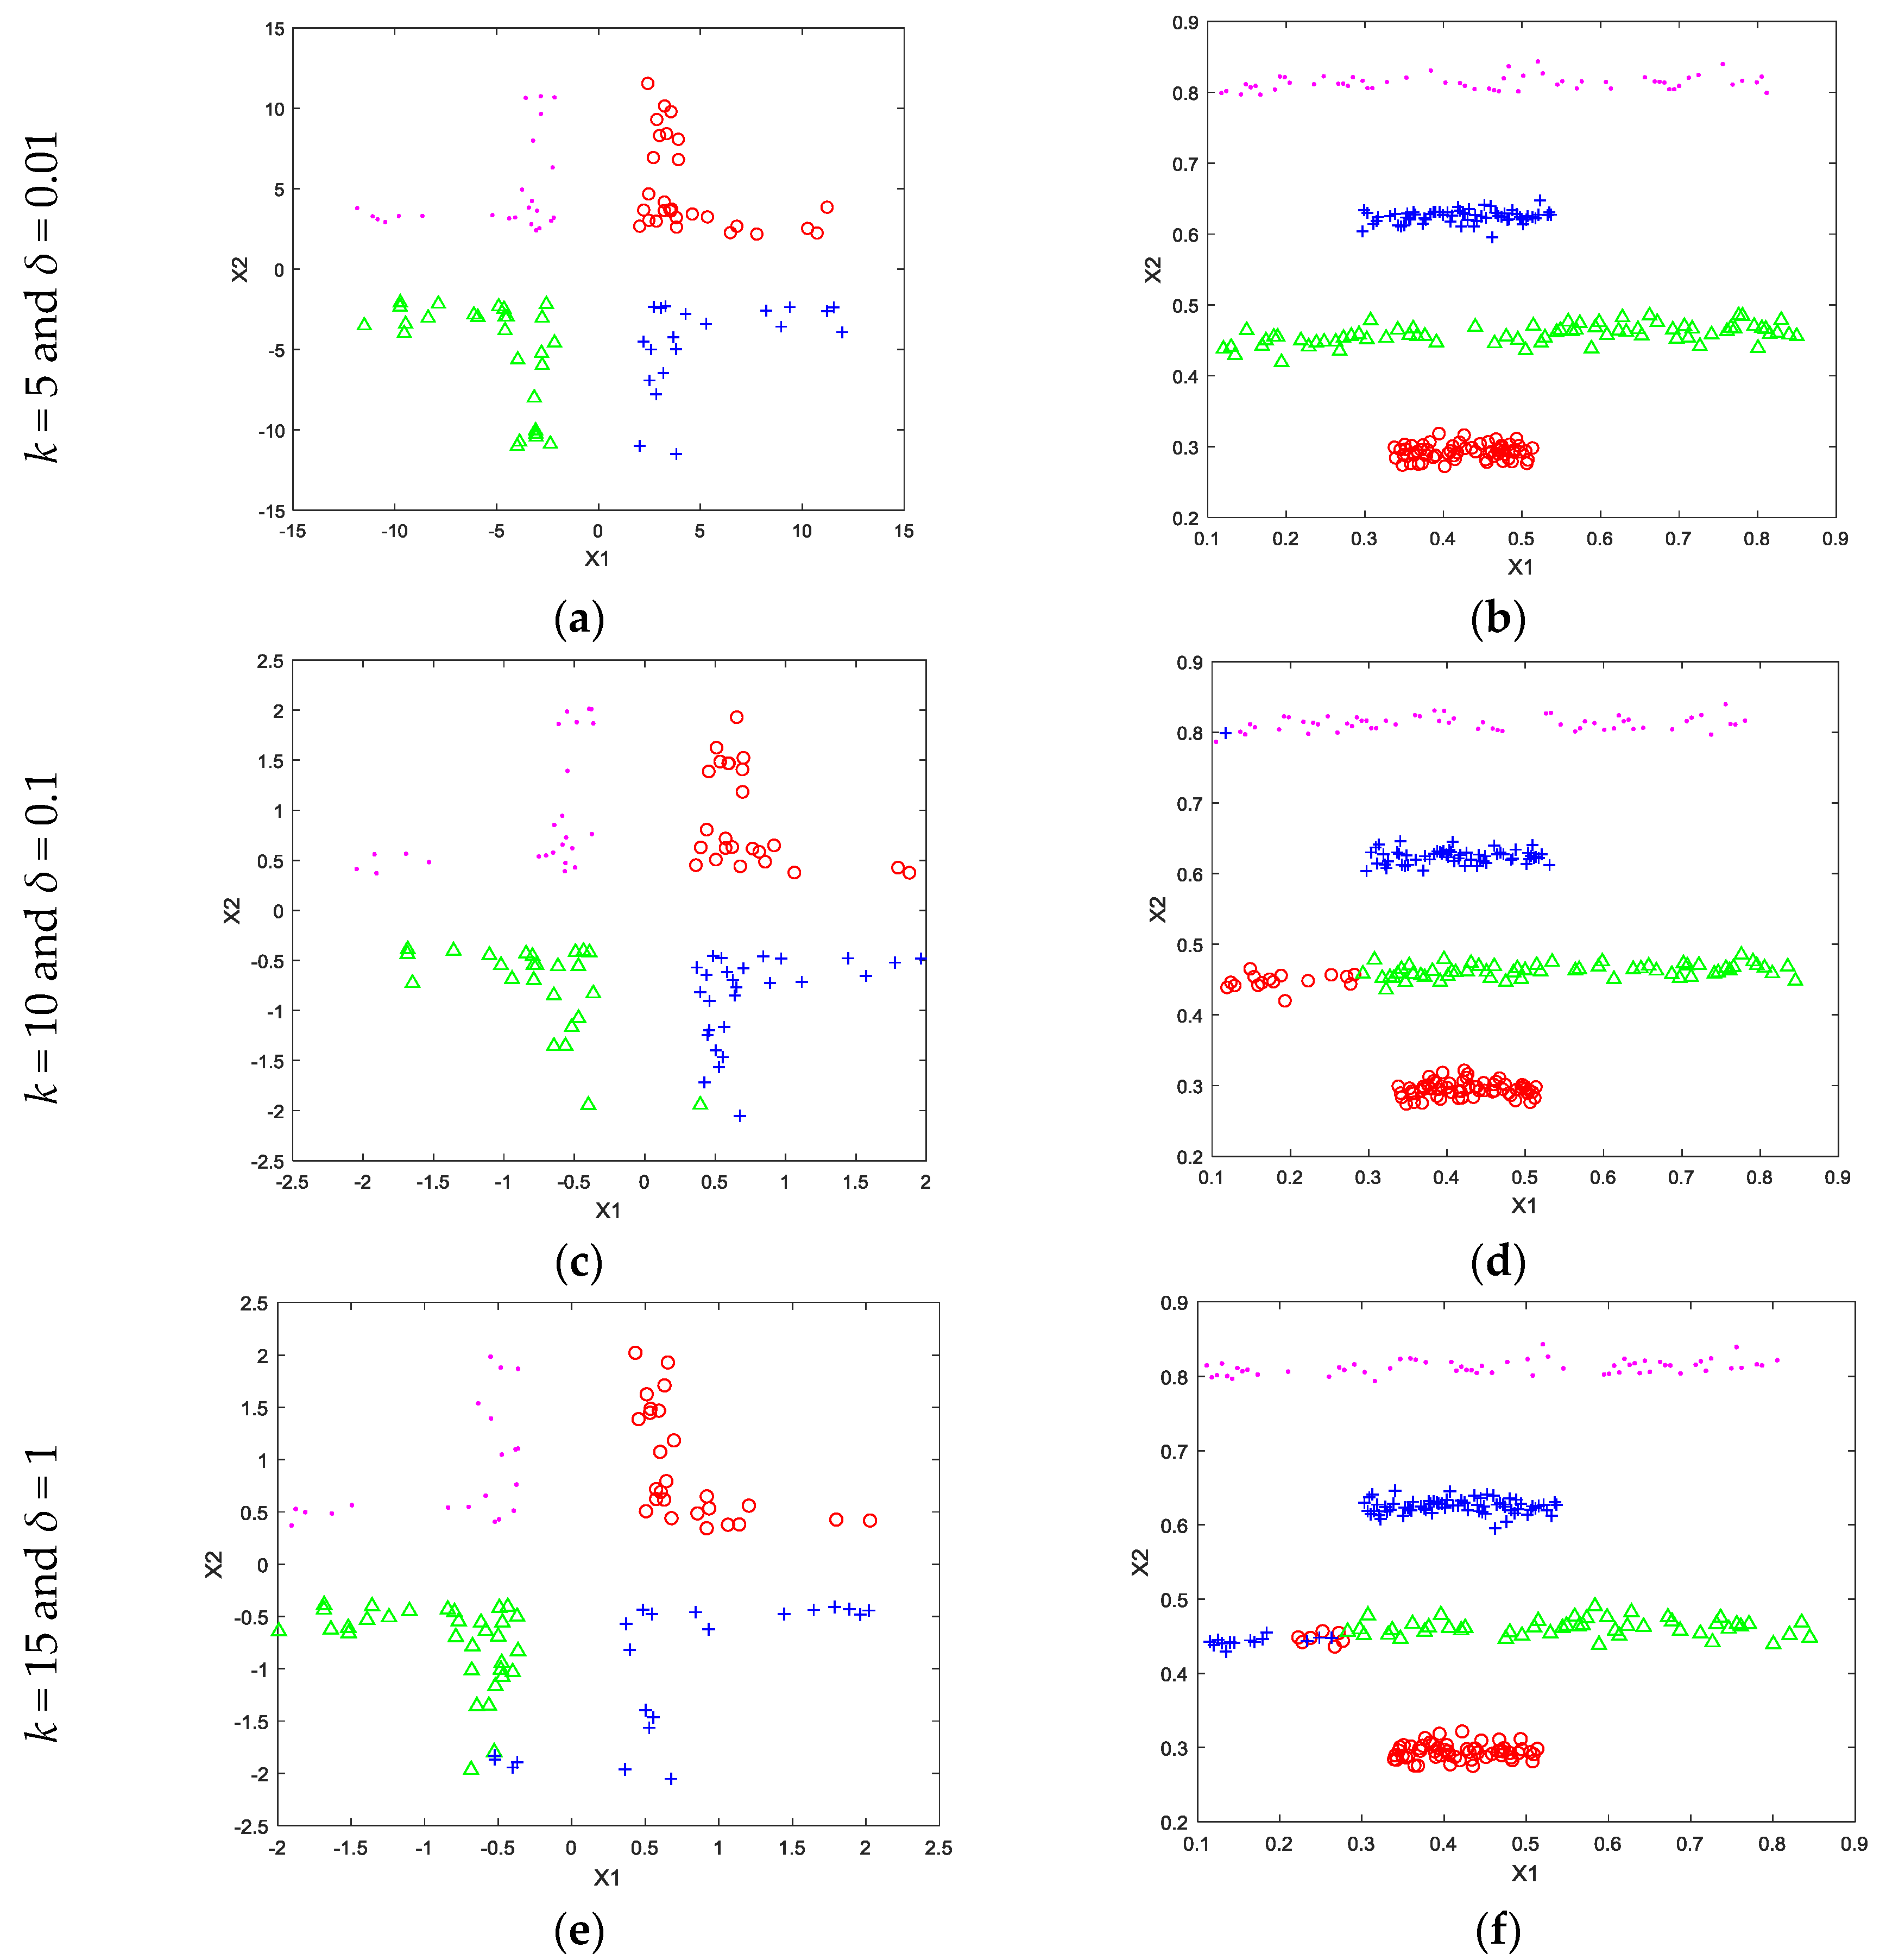
The toy dataset that were used in the experiments were shown in Figure 1a,b respectively. Both toy datasets contain two dimensional data with four classes. Randomly selected half of the toy datasets were used for training and the other half were used for testing. The k value was chosen to be 5, 10, and 15 and the δ parameter was chosen to be 0.01, 0.1, and 1, respectively. The obtained results were shown in Figure 2, respectively. As seen in the first row of Figure 2, the proposed method obtained 100% classification accuracy with k = 10 and δ = 0.01 values for both toy datasets. However, 100% correct classification did not obtained for the other parameters as shown in the second and the third rows of Figure 2. This situation shows that the proposed method needs a parameter tuning mechanism in the k vs. δ space. So, k was set to an integer value between [2, 15] and δ parameter was also searched on .
We conducted further experiments on 39 real-world datasets which were downloaded from KEEL dataset repository [24]. Each dataset was already partitioned according to the cross validation procedure (five-folds or 10-folds). Table 1 shows several characteristics of the each dataset such as number of samples, number of features, and number of classes. All feature values were normalized to [−1, 1] and a five-folds cross validation procedure was adopted in all experiments. The accuracies were calculated as the ratio of the number of correctly classified samples to the total number of samples.
In addition to our results, we also compared our results with k-NN and fuzzy k-NN results on the same datasets. The obtained results were tabulated in Table 2 where the best results were indicated with bold-face. As seen in Table 2, the proposed method performed better than the other methods in 27 of 39 datasets. In addition, k-NN and fuzzy k-NN performed better on six and seven datasets out of 39 datasets, respectively. Our proposal obtained 100% accuracy for two datasets (new thyroid and wine). Moreover, for 13 datasets, the proposed method obtained accuracy values higher than 90%. On the other hand, the worse result was recorded for “Wine quality-white” dataset where the accuracy was 33.33%. Moreover, there were a total of three datasets where the accuracy was lower than 50%. We further conducted experiments on several datasets from UCI-data repository [25]. Totally, 11 datasets were considered in these experiments and compared results with two weighted k-NN approaches, namely WKNN and DWKNN. The characteristics of the each dataset from UCI-data repository were shown in Table 3, and the obtained all results were tabulated in Table 4. The boldface in Table 4 shows the higher accuracy values for each dataset.
As seen in Table 4, the proposed method performed better than the other methods in eight of 11 datasets and DWKNN performed better in the rest datasets. For three datasets (Parkinson, Image and Landsat), the proposed method yielded accuracy value higher than 90% and the worse result was found for the ‘Glass’ dataset where the accuracy was 60.81%. DWKNN and the WKNN produced almost same accuracy values and performed significantly better than the proposed method on ‘Letter and Glass’ datasets. We further compared the running times of each method on each KEEL dataset and the obtained running times were tabulated in Table 5. We used MATLAB 2014b (The MathWorks Inc., Natick, MA, USA) on a computer having an Intel Core i7-4810 CPU and 32 GB memory. As seen in Table 5, for some datasets, the k-NN and fuzzy k-NN methods achieved lower running times than our proposal’s achievement. However, when the average running times took into consideration, the proposed method achieved the lowest running time with 0.69 s. The k-NN method also obtained the second lowest running time with 1.41 s. The fuzzy k-NN approach obtained the average slowest running time when compared with the other methods. The fuzzy k-NN method’s achievement was 3.17 s.
Generally speaking, the proposed NS-k-NN method can be announced successful when the accuracy values which were tabulated in Table 3, Table 4 and Table 5, were considered. The NS-k-NN method obtained these high accuracies because it incorporated the NS theory with the distance learning for constructing an efficient supervised classifier. The running time evaluation was also proved that the NS-k-NN was quite an efficient classifier than the compared other related classifiers.
5. Conclusions
In this paper, we propose a novel supervised classification method based on NS theory called neutrosophic k-NN. The proposed method assigns the memberships to training samples based on the supervised NCM clustering algorithm, and classifies the samples based on their neutrosophic memberships. This approach can be seen as an extension of the previously-proposed fuzzy k-NN method by incorporating the falsity and indeterminacy sets. The efficiency of the proposed method was demonstrated with extensive experimental results. The results were also compared with other improved k-NN methods. According to the obtained results, the proposed method can be used in various classification applications. In the future works, we plan to apply the proposed NS-k-NN on imbalanced dataset problems. We would like to analyze the experimental results with some non-parametric statistical methods, such as the Freidman test and Wilcoxon signed-ranks test. In addition, some other evaluation metrics such as AUC will be used for comparison purposes. We will also explore the k-NN method where Dezert-Smarandache theory will be used to calculate the data samples’ memberships, replacing Dempster’s rule by Proportional Conflict Redistribution Rule #5 (PCR5), which is more performative in order to handle the assignments of the final class.
Acknowledgments
The authors would like to thank the editors and anonymous reviewers for their helpful comments and suggestions.
Author Contributions
Yaman Akbulut, Abdulkadir Sengur, Yanhui Guo and Florentin Smarandache conceived and worked together to achieve this work.
Conflicts of Interest
The authors declare no conflict of interest.
References
- Fix, E.; Hodges, J.L. Discriminatory Analysis, Nonparametric Discrimination: Consistency Properties; Technique Report No. 4; U.S. Air Force School of Aviation Medicine, Randolf Field Texas: Universal City, TX, USA, 1951; pp. 238–247.
- Duda, R.; Hart, P. Pattern Classification and Scene Analysis; John Wiley & Sons: New York, NY, USA, 1973. [Google Scholar]
- Cabello, D.; Barro, S.; Salceda, J.; Ruiz, R.; Mira, J. Fuzzy k-nearest neighbor classifiers for ventricular arrhythmia detection. Int. J. Biomed. Comput. 1991, 27, 77–93. [Google Scholar] [CrossRef]
- Chen, H.-L.; Yang, B.; Wang, G.; Liu, J.; Xu, X.; Wang, S.; Liu, D. A novel bankruptcy prediction model based on an adaptive fuzzy k-nearest neighbor method. Knowl. Based Syst. 2011, 24, 1348–1359. [Google Scholar] [CrossRef]
- Chikh, M.A.; Saidi, M.; Settouti, N. Diagnosis of diabetes diseases using an artificial immune recognition system2 (AIRS2) with fuzzy k-nearest neighbor. J. Med. Syst. 2012, 36, 2721–2729. [Google Scholar] [CrossRef] [PubMed]
- Aslan, M.; Akbulut, Y.; Sengur, A.; Ince, M.C. Skeleton based efficient fall detection. J. Fac. Eng. Archit. Gazi Univ. 2017, accepted (in press). [Google Scholar]
- Li, B.; Lu, Q.; Yu, S. An adaptive k-nearest neighbor text categorization strategy. ACM Trans. Asian Lang. Inf. Process. 2004, 3, 215–226. [Google Scholar]
- Keller, J.M.; Gray, M.R.; Givens, J.A. A fuzzy k-nearest neighbor algorithm. IEEE Trans. Syst. Man Cybern. 1985, 15, 580–585. [Google Scholar] [CrossRef]
- Pham, T.D. An optimally weighted fuzzy k-NN algorithm. In Pattern Recognition and Data Mining; Volume 3686 of Lecture Notes in Computer Science; Singh, S., Singh, M., Apte, C., Perner, P., Eds.; Springer: Berlin/Heidelberg, Germany, 2005; pp. 239–247. [Google Scholar]
- Denoeux, T. A k-nearest neighbor classification rule based on Dempster–Shafer theory. IEEE Trans. Syst. Man Cybern. 1995, 25, 804–813. [Google Scholar] [CrossRef]
- Zouhal, L.M.; Denœux, T. An evidence-theoretic k-NN rule with parameter optimization. IEEE Trans. Syst. Man Cybern. Part C 1998, 28, 263–271. [Google Scholar] [CrossRef]
- Zouhal, L.M.; Denœux, T. Generalizing the evidence theoretic k-NN rule to fuzzy pattern recognition. In Proceedings of the 2nd International ICSC Symposium on Fuzzy Logic and Applications, Zurich, Switzerland, 12–14 February 1997; pp. 294–300. [Google Scholar]
- Liu, Z.G.; Pan, Q.; Dezert, J.; Mercier, G.; Liu, Y. Fuzzy-belief k-nearest neighbor classifier for uncertain data. In Proceedings of the Fusion 2014: 17th International Conference on Information Fusion, Salamanca, Spain, 7–10 July 2014; pp. 1–8. [Google Scholar]
- Liu, Z.; Pan, Q.; Dezert, J. A new belief-based K-nearest neighbor classification method. Pattern Recognit. 2013, 46, 834–844. [Google Scholar] [CrossRef]
- Derrac, J.; Chiclana, F.; García, S.; Herrera, F. Evolutionary fuzzy k-nearest neighbors algorithm using interval-valued fuzzy sets. Inf. Sci. 2016, 329, 144–163. [Google Scholar] [CrossRef]
- Dudani, S.A. The distance-weighted k-nearest neighbor rule. IEEE Trans. Syst. Man Cybern. 1976, 6, 325–327. [Google Scholar] [CrossRef]
- Gou, J.; Du, L.; Zhang, Y.; Xiong, T. A new distance-weighted k-nearest neighbor classifier. J. Inf. Comput. Sci. 2012, 9, 1429–1436. [Google Scholar]
- Smarandache, F. Neutrosophy. Neutrosophic Probability, Set, and Logic, ProQuest Information & Learning; Infolearnquest: Ann Arbor, MI, USA, 1998; p. 105. Available online: http://fs.gallup.unm.edu/eBook-neutrosophics6.pdf (accessed on 2 August 2017).
- Smarandache, F. Introduction to Neutrosophic Measure, Neutrosophic Integral and Neutrosophic Probability; Sitech: Craiova, Romania, 2013. [Google Scholar]
- Smarandache, F. Neutrosophy. Neutrosophic Probability, Set, and Logic; American Research Press: Rehoboth, DE, USA, 1998; p. 105. [Google Scholar]
- Smarandache, F. A Unifying Field in Logics Neutrosophic Logic. Neutrosophy, Neutrosophic Set, Neutrosophic Probability, 3rd ed.; American Research Press: Rehoboth, DE, USA, 2003. [Google Scholar]
- Guo, Y.; Sengur, A. NCM: Neutrosophic c-means clustering algorithm. Pattern Recognit. 2015, 48, 2710–2724. [Google Scholar] [CrossRef]
- Guo, Y.; Sengur, A. A novel color image segmentation approach based on neutrosophic set and modified fuzzy c-means. Circuits Syst. Signal Process. 2013, 32, 1699–1723. [Google Scholar] [CrossRef]
- Alcalá-Fdez, J.; Fernández, A.; Luengo, J.; Derrac, J.; García, S.; Sánchez, L.; Herrera, F. Keel data-mining software tool: Data set repository, integration of algorithms and experimental analysis framework. J. Mult. Valued Log. Soft Comput. 2011, 17, 255–287. [Google Scholar]
- Lichman, M. UCI Machine Learning Repository; University of California, School of Information and Computer Science: Irvine, CA, USA, 2013; Available online: http://archive.ics.uci.edu/ml (accessed on 20 July 2017).
Figure 1.
Toy datasets. (a) Corner data; (b) line data.

Figure 2.
Some classification results for various k and δ parameters. (a) classification result 1 of corner data with various parameters; (b) classification result 1 of line data with various parameters (c) classification result 2 of corner data with various parameters (d) classification result 2 of line data with various parameters (e) classification result 3 of corner data with various parameters; (f) classification result 3 of line data with various parameters.


Table 1.
Data sets and their properties.
| Data Sets | Instance (#) | Attribute (#) | Class (#) | Data Sets | Instance (#) | Attribute (#) | Class (#) |
|---|---|---|---|---|---|---|---|
| Appendicitis | 106 | 7 | 2 | Penbased | 10,992 | 16 | 10 |
| Balance | 625 | 4 | 3 | Phoneme | 5404 | 5 | 2 |
| Banana | 5300 | 2 | 2 | Pima | 768 | 8 | 2 |
| Bands | 365 | 19 | 2 | Ring | 7400 | 20 | 2 |
| Bupa | 345 | 6 | 2 | Satimage | 6435 | 36 | 7 |
| Cleveland | 297 | 13 | 5 | Segment | 2310 | 19 | 7 |
| Dermatology | 358 | 34 | 6 | Sonar | 208 | 60 | 2 |
| Ecoli | 336 | 7 | 8 | Spectfheart | 267 | 44 | 2 |
| Glass | 214 | 9 | 7 | Tae | 151 | 5 | 3 |
| Haberman | 306 | 3 | 2 | Texture | 5500 | 40 | 11 |
| Hayes-roth | 160 | 4 | 3 | Thyroid | 7200 | 21 | 3 |
| Heart | 270 | 13 | 2 | Twonorm | 7400 | 20 | 2 |
| Hepatitis | 80 | 19 | 2 | Vehicle | 846 | 18 | 4 |
| Ionosphere | 351 | 33 | 2 | Vowel | 990 | 13 | 11 |
| Iris | 150 | 4 | 3 | Wdbc | 569 | 30 | 2 |
| Mammographic | 830 | 5 | 2 | Wine | 178 | 13 | 3 |
| Monk-2 | 432 | 6 | 2 | Winequality-red | 1599 | 11 | 11 |
| Movement | 360 | 90 | 15 | Winequality-white | 4898 | 11 | 11 |
| New thyroid | 215 | 5 | 3 | Yeast | 1484 | 8 | 10 |
| Page-blocks | 5472 | 10 | 5 | - | - | - | - |
Table 2.
Experimental results of k-NN and fuzzy k-NN vs. the proposed method.
| Data Sets | k-NN | Fuzzy k-NN | Proposed Method | Data Sets | k-NN | Fuzzy k-NN | Proposed Method |
|---|---|---|---|---|---|---|---|
| Appendicitis | 87.91 | 97.91 | 90.00 | Penbased | 99.32 | 99.34 | 86.90 |
| Balance | 89.44 | 88.96 | 93.55 | Phoneme | 88.49 | 89.64 | 79.44 |
| Banana | 89.89 | 89.42 | 60.57 | Pima | 73.19 | 73.45 | 81.58 |
| Bands | 71.46 | 70.99 | 75.00 | Ring | 71.82 | 63.07 | 72.03 |
| Bupa | 62.53 | 66.06 | 70.59 | Satimage | 90.94 | 90.61 | 92.53 |
| Cleveland | 56.92 | 56.95 | 72.41 | Segment | 95.41 | 96.36 | 97.40 |
| Dermatology | 96.90 | 96.62 | 97.14 | Sonar | 83.10 | 83.55 | 85.00 |
| Ecoli | 82.45 | 83.34 | 84.85 | Spectfheart | 77.58 | 78.69 | 80.77 |
| Glass | 70.11 | 72.83 | 76.19 | Tae | 45.79 | 67.67 | 86.67 |
| Haberman | 71.55 | 68.97 | 80.00 | Texture | 98.75 | 98.75 | 80.73 |
| Hayes-roth | 30.00 | 65.63 | 68.75 | Thyroid | 94.00 | 93.92 | 74.86 |
| Heart | 80.74 | 80.74 | 88.89 | Twonorm | 97.11 | 97.14 | 98.11 |
| Hepatitis | 89.19 | 85.08 | 87.50 | Vehicle | 72.34 | 71.40 | 54.76 |
| Ionosphere | 96.00 | 96.00 | 97.14 | Vowel | 97.78 | 98.38 | 49.49 |
| Iris | 85.18 | 84.61 | 93.33 | Wdbc | 97.18 | 97.01 | 98.21 |
| Mammographic | 81.71 | 80.37 | 86.75 | Wine | 96.63 | 97.19 | 100.00 |
| Monk-2 | 96.29 | 89.69 | 97.67 | Winequality-red | 55.60 | 68.10 | 46.84 |
| Movement | 78.61 | 36.11 | 50.00 | Winequality-white | 51.04 | 68.27 | 33.33 |
| New thyroid | 95.37 | 96.32 | 100.00 | Yeast | 57.62 | 59.98 | 60.81 |
| Page-blocks | 95.91 | 95.96 | 96.34 | - | - | - | - |
Table 3.
Several datasets and their properties from UCI dataset.
| Data set | Features | Samples | Classes | Training Samples | Testing Samples |
|---|---|---|---|---|---|
| Glass | 10 | 214 | 7 | 140 | 74 |
| Wine | 13 | 178 | 3 | 100 | 78 |
| Sonar | 60 | 208 | 2 | 120 | 88 |
| Parkinson | 22 | 195 | 2 | 120 | 75 |
| Iono | 34 | 351 | 2 | 200 | 151 |
| Musk | 166 | 476 | 2 | 276 | 200 |
| Vehicle | 18 | 846 | 4 | 500 | 346 |
| Image | 19 | 2310 | 7 | 1310 | 1000 |
| Cardio | 21 | 2126 | 10 | 1126 | 1000 |
| Landsat | 36 | 6435 | 7 | 3435 | 3000 |
| Letter | 16 | 20,000 | 26 | 10,000 | 10,000 |
Table 4.
The accuracy values for DWKNN vs. NSKNN.
| Data set | WKNN (%) | DWKNN (%) | Proposed Method (%) |
|---|---|---|---|
| Glass | 69.86 | 70.14 | 60.81 |
| Wine | 71.47 | 71.99 | 79.49 |
| Sonar | 81.59 | 82.05 | 85.23 |
| Parkinson | 83.53 | 83.93 | 90.67 |
| Iono | 84.27 | 84.44 | 85.14 |
| Musk | 84.77 | 85.10 | 86.50 |
| Vehicle | 63.96 | 64.34 | 71.43 |
| Image | 95.19 | 95.21 | 95.60 |
| Cardio | 70.12 | 70.30 | 66.90 |
| Landsat | 90.63 | 90.65 | 91.67 |
| Letter | 94.89 | 94.93 | 63.50 |
Table 5.
Comparison of running times for each method.
| Data Sets | k-NN | Fuzzy k-NN | Proposed Method | Data Sets | k-NN | Fuzzy k-NN | Proposed Method |
|---|---|---|---|---|---|---|---|
| Appendicitis | 0.11 | 0.16 | 0.15 | Penbased | 10.21 | 18.20 | 3.58 |
| Balance | 0.15 | 0.19 | 0.18 | Phoneme | 0.95 | 1.88 | 0.71 |
| Banana | 1.03 | 1.42 | 0.57 | Pima | 0.45 | 0.58 | 0.20 |
| Bands | 0.42 | 0.47 | 0.19 | Ring | 6.18 | 10.30 | 2.55 |
| Bupa | 0.14 | 0.28 | 0.16 | Satimage | 8.29 | 15.25 | 1.96 |
| Cleveland | 0.14 | 0.18 | 0.19 | Segment | 1.09 | 1.76 | 0.63 |
| Dermatology | 0.33 | 0.31 | 0.22 | Sonar | 0.15 | 0.21 | 0.23 |
| Ecoli | 0.12 | 0.26 | 0.17 | Spectfheart | 0.14 | 0.25 | 0.22 |
| Glass | 0.10 | 0.18 | 0.18 | Tae | 0.13 | 0.12 | 0.16 |
| Haberman | 0.13 | 0.24 | 0.16 | Texture | 6.72 | 12.78 | 4.30 |
| Hayes-roth | 0.07 | 0.11 | 0.16 | Thyroid | 5.86 | 9.71 | 2.14 |
| Heart | 0.22 | 0.33 | 0.17 | Twonorm | 5.89 | 10.27 | 2.69 |
| Hepatitis | 0.06 | 0.06 | 0.16 | Vehicle | 0.17 | 0.31 | 0.27 |
| Ionosphere | 0.13 | 030 | 0.25 | Vowel | 0.47 | 0.62 | 0.31 |
| Iris | 0.23 | 0.13 | 0.16 | Wdbc | 0.39 | 0.46 | 0.26 |
| Mammographic | 0.21 | 0.22 | 0.20 | Wine | 0.08 | 0.14 | 0.17 |
| Monk-2 | 0.27 | 0.33 | 0.17 | Winequality-red | 0.28 | 0.46 | 0.34 |
| Movement | 0.16 | 0.34 | 0.35 | Winequality-white | 1.38 | 1.95 | 0.91 |
| New thyroid | 0.14 | 0.18 | 0.17 | Yeast | 0.44 | 0.78 | 0.30 |
| Page-blocks | 1.75 | 2.20 | 0.93 | Average | 1.41 | 3.17 | 0.69 |
© 2017 by the authors. Licensee MDPI, Basel, Switzerland. This article is an open access article distributed under the terms and conditions of the Creative Commons Attribution (CC BY) license (http://creativecommons.org/licenses/by/4.0/).
Share and Cite
MDPI and ACS Style
Akbulut, Y.; Sengur, A.; Guo, Y.; Smarandache, F. NS-k-NN: Neutrosophic Set-Based k-Nearest Neighbors Classifier. Symmetry 2017, 9, 179. https://doi.org/10.3390/sym9090179
AMA Style
Akbulut Y, Sengur A, Guo Y, Smarandache F. NS-k-NN: Neutrosophic Set-Based k-Nearest Neighbors Classifier. Symmetry. 2017; 9(9):179. https://doi.org/10.3390/sym9090179
Chicago/Turabian StyleAkbulut, Yaman, Abdulkadir Sengur, Yanhui Guo, and Florentin Smarandache. 2017. "NS-k-NN: Neutrosophic Set-Based k-Nearest Neighbors Classifier" Symmetry 9, no. 9: 179. https://doi.org/10.3390/sym9090179
Note that from the first issue of 2016, this journal uses article numbers instead of page numbers. See further details here.