Community Detection Based on Differential Evolution Using Social Spider Optimization
by
You-Hong Li
1, 
Jian-Qiang Wang
2,*,
Xue-Jun Wang
1,
Yue-Long Zhao
3,
Xing-Hua Lu
1 and
Da-Long Liu
1 1
Huali College, Guangdong University of Technology, Guangzhou 511325, China
2
School of Business, Central South University, Changsha 410083, China
3
School of Computer Science and Engineering, South China University of Technology, Guangzhou 510640, China
*
Author to whom correspondence should be addressed.
Symmetry 2017, 9(9), 183; https://doi.org/10.3390/sym9090183
Submission received: 11 August 2017
/
Revised: 29 August 2017
/
Accepted: 31 August 2017
/
Published: 6 September 2017
(This article belongs to the Special Issue Information Technology and Its Applications)
Abstract
:Community detection (CD) has become an important research direction for data mining in complex networks. Evolutionary algorithm-based (EA-based) approaches, among many other existing community detection methods, are widely used. However, EA-based approaches are prone to population degradation and local convergence. Developing more efficient evolutionary algorithms thus becomes necessary. In 2013, Cuevas et al. proposed a new differential evolution (DE) hybrid meta-heuristic algorithm based on the simulated cooperative behavior of spiders, known as social spider optimization (SSO). On the basis of improving the SSO algorithm, this paper proposes a community detection algorithm based on differential evolution using social spider optimization (DESSO/CD). In this algorithm, the CD detection process is done by simulating the spider cooperative operators, marriage, and operator selection. The similarity of nodes is defined as local fitness function; the community quality increment is used as a screening criterion for evolutionary operators. Populations are sorted according to their contribution and diversity, making evolution even more different. In the entire process, a random cloud crossover model strategy is used to maintain population diversity. Each generation of the mating radius of the SSO algorithm will be adjusted appropriately according to the iterative times and fitness values. This strategy not only ensures the search space of operators, but also reduces the blindness of exploration. On the other hand, the multi-level, multi-granularity strategy of DESSO/CD can be used to further compensate for resolution limitations and extreme degradation defects based on modular optimization methods. The experimental results demonstrate that the DESSO/CD method could detect the community structure with higher partition accuracy and lower computational cost when compared with existing methods. Since the application of the SSO algorithm in CD research is just beginning, the study is competitive and promising.
1. Introduction
Community detection (CD) is a method of dividing a complex network into several sub-structures. It is widely accepted that a community should have dense intra-connections and sparse inter-connections [1]. Most of complex networks imply a community structure [2,3,4,5]; their vertices are organized into groups, called communities, clusters, or modules. These include the functional structure of the protein networks, relationships in social networks, link relation of web pages on the Internet, cooperative modules in power network systems, and so on. Uncovering the mesoscopic-structure of community in complex networks is helpful for understanding complex systems [6,7,8], where objects are represented as nodes and the relationships among the objects are represented as edges [1]. Complex networks have characteristics of discrete distribution and dynamic evolution [9] unlike simple networks such as lattices or random graphs. Thus, simple modeling and analysis based on network topology gradually fails to meet the needs of community detection.
Recent studies have paid much attention to community detection and have developed various algorithms from different perspectives. According to the principle of division, community structures now can be detected through many different methods, such as division-based [1,10,11], cohesion-based [12,13], spectral-based [14,15], statistical-inference-based [16,17], and optimization-based [18,19,20,21,22,23,24,25,26] methods. Recently, the optimization-based methods have drawn steady attention to community detection [4,20,27,28]. The community detection problem can be translated into an optimization problem [29], where modularity function Q [10] is a widely adopted in optimization objective, even if maximizing Q is usually non-deterministic polynomial hard (NP-hard) [21]. In community structure detection, optimization is based on the monotonic increase and the approximate maximum two characteristics of the Q function [30]. Although Q functions are limited in resolution [28] and extreme degradation [31], they are widely used by researchers. Blondel [32] and Khadivi et al. [33] found that the design of multi-level, multi-granularity, and weighted methods can ease resolution limits and extreme degradation. Evolutionary algorithm (EA)-based strategies are effective in optimization approaches [33]. Compared to other strategies, there are three main advantages. Firstly, EAs are similar to the simulation network evolution process [34]. Secondly, the multi-level, multi-granularity strategy of EAs can be used to further compensate for resolution limitations and extreme degradation defects based on modular optimization methods [35]. Thirdly, they are more suitable for solving complex and discrete problems (EAs change their current state to the next state with the strategy adopted, while maintaining some degrees of randomness to ensure the exploration of solution space). However, in the EA-based for CD algorithm, too much fitness calculation and premature convergence of the population are still the main obstacles in the community testing process. In addition, maintaining the diversity of the population and balancing the algorithm convergence is the key issue to improving the performance of EAs [36].
Thus, researchers have designed a number of algorithms to overcome obstacles [36]. Recently, the differential evolution (DE) hybrid meta-heuristic-based optimization algorithms of CD research have made great progress [20,21,22,23,24,27,37,38]. Typically, the parent’s mutation operator of the DE algorithm is chosen randomly from the population. This is different from other EAs, in which the probability of all individuals being treated as parents is equal. Such a strategy could damage the population diversity [2,39,40,41]. Therefore, Wang [40] presented a new differential strategy, whereby individuals in the current population are first sorted according to their fitness and diversity contribution by non-dominant sorting, thus, the promising individuals with better fitness and diversity have a greater opportunity to be selected as parents in order to achieve a good balance between exploration and exploitation. However, the above strategy does not evaluate fitness and diversity information in real time in each generation. If it is used to model the discovery of the community, it may lead to loss of diversity information and be difficult to converge.
Based on the above analysis and inspiration, this paper proposes a community detection algorithm based on differential evolution using social spider optimization (DESSO/CD). In this algorithm, a new community detection algorithm framework based on social spider optimization (SSO) is presented. In initializing the population process, nodes in the network are initialized as populations in the SSO algorithm. In the cooperative operators’ process, the fitness function of the SSO algorithm is defined according to the local similarity strategy of nodes. The populations are divided into two categories: elite and non-elite based on the fitness value, which further improves the differential evolution strategy of the SSO algorithm (the effect of the strategy corresponds to the hybrid differential evolution scheme proposed in [40]). At the same time, a random cloud crossover model is adopted to keep the diversity of population. In the mating operator process of DESSO/CD, the mating radius will automatically be adjusted according to the fitness value in the dominant individuals. Each generation of the quality increment of community modularity is used as a criterion for the evolutionary selection operator. This approach promotes the balance between local exploration and global search, while maintaining the diversity of the populations can effectively improve the adaptability and efficiency of the CD algorithm.
Therefore, there are three main contributions of this paper. Firstly, a new community detection algorithm framework based on social spider optimization is presented. Secondly, based on the hybrid meta-heuristic approach, the population in the SSO algorithm is further differentiated. Thirdly, an adaptive mating radius strategy fitted by the fitness value and iterative times is presented.
The rest of the paper is organized as follows. In Section 2, we first introduce some background knowledge and the framework of the DESSO/CD algorithm. Then, the fitness function and evolution criteria of the proposed algorithm are presented. In Section 3, the SSO algorithm is described in detail. Our improvements for SSO and the general process steps of the DESSO/CD algorithm are described in Section 4, and experimental settings and analysis are provided in Section 5. In Section 6, the proposed algorithms are analyzed and discussed. The last section concludes this paper and threads some future research issues.
2. Related Work for DESSO/CD
In this section, we are devoted to the description of related work for DESSO/CD. Firstly, the necessary background knowledge for understanding the proposed algorithm (the definition of network community used in this paper) is introduced. Secondly, the community detection algorithm framework based on social spider optimization (SSO/CD) is given. Thirdly, the fitness function and evolution criteria of the proposed algorithm are presented.
2.1. Definition of Network Community Detection
Community detection is defined in [1,2]. Given network G = (V, E), where V and E represent the set of nodes and join edges in the network, respectively, for the purpose of the application of the network it is divided into the set C, (∪1≤i≤kCi=C) ∧ (C G). is the number of divided communities. The division increases the possibility of the nodes in the same community having a greater connecting edge [1], as shown in Figure 1.
2.2. Framework of DESSO/CD Algorithm
The community detection algorithm based on the evolutionary algorithm usually makes the community mass increase with the iterative selection criteria, with local similarity or aggregation equivalence as an evolutionary algorithm population of the fitness function value. When the algorithm converges, the community is divided [20]. Following this idea, the framework of the DESSO/CD algorithm is shown in Figure 2.
2.3. Fitness Functions and Community Optimization Incremental Guidelines
2.3.1. Fitness Function of Community Detection
In the evolutionary algorithm, fitness refers to the fitness degree of individuals in the population to the environment [36]. The fitness value is used to measure the degree of individual fitness. According to the definition of communities [1], the nodes of the same community are highly similar, while to the contrary, nodes across communities present low similarity [5,42]. We can we find that when there is higher similarity between nodes (nodes are initialized as populations in this paper), the fitness value is larger [22]. When designing CD fitness values, the simple strategy using the Euclidean distance or Jaccard similarity is not enough [43,44]. It should be noted that similarity of network nodes is closely related to factors [45] such as number of common neighbor nodes, local influence of nodes, direct or indirect connected edge, topic correlation network, etc. When dealing with CD problems, researchers usually use two different preference models to measure the similarity between nodes, as well as global characteristics and local similarity [46]. In this paper, the local similarity index is used as the fitness function, because the locally similar approach is more suitable for evolutionary algorithms to achieve optimal strategies gradually. Here we consider two nodes through the intermediary node in the network connecting to define similarity. The node i can be connected to the j node through a plurality of nodes between common neighbor edges (even i and j have no direct connection). If the average degree of public neighbor nodes between two nodes is larger, then the similarity between the two nodes is greater. Therefore, the node proximity similarity is defined as
where represents the set of neighbor nodes, represents the common neighbor of node i and j, represents the degree of node z, , and if there is no path between two nodes, .
This study uses to replace in Formula (9), and the weight ω is modeled as the minimization problem as
where , is the current population of evolutionary algebra, and is the current population of . Through the above design, vibration perception ability of is not only related to the spider population and Euclidean distance, but it also considers the relationship of the neighbor node edge. It can effectively improve the spider’s multi granularity and multi-level search ability.
2.3.2. Community Optimization Incremental Criteria
In community detection applications, the modularity Q function [10] has two main functions. One is the standard for testing quality, and the other is used as the objective function [43]. Although Q functions are limited in resolution [28] and extreme degradation [31], they are widely used by researchers. Blondel [32] and Khadivi [33] et al. found that the design of multi-level, multi granularity, and weighted methods can ease resolution limits and extreme degradation. The Q function value is greater when that network division is better. The maximum Q function is always NP-hard. Hence, Newman [29] put forward increment function of modularity considering. He was sure that the value of modularity would increase when nodes joined the community or the community consolidated. The definition can be stated as
where represents the ratio of the number of edges connecting two vertices to the total number of edges within the community , indicates the degree of node after community merging, m is the number of edges in the network, and is a network adjacency matrix, .
Based on the characteristics of the community mining process by using the monotone increasing function of Q, we use ΔQ as a criterion for optimizing operators. If the spiders have been mated for generations and the Q value has not changed significantly, the algorithm will converge.
3. Social Spider Optimization Algorithms
Cuevas [47] proposed the social spider optimization (SSO) algorithm in 2013. SSO is an intelligent swarm-based heuristic differential evolution algorithm, which is based on the simulation of cooperative behavior of social spiders. The SSO algorithm is different from most existing swarm algorithms which model individuals as unisex entities exhibiting virtually the same behavior [48]. The SSO algorithm has three steps [47,48,49,50,51] including initializing the population, cooperative operators, and mating operators. In the SSO algorithm, the search space is modeled as a spider’s web; the optimization of the problem is equivalent to finding the final position of the spider after the collaboration. The fitness value corresponds to the ability of the spider to adapt to the environment. When the SSO solves the problem, the spider position is randomly initialized, and the optimal solution of the problem is obtained through the interaction of female and male internal cooperative movement (evolution of population) and marriage process (each generation produces new individuals to replace inferior individuals). In the evolution of SSO, each individual has the ability to learn at random, as well as learning from parents and the most recent and optimal individual (Formula (7)). These strategies give SSO more flexible parameters, stronger adaptability, and a higher searching efficiency. It can maintain the diversity of the population and obtain better solutions.
Compared to existing EAs, SSO is more competitive [47,48,51,52]. Cuevas has experimentally tested SSO, considering 19 benchmark functions, and using comparisons with PSO and ABC algorithm performance. Results have confirmed that SSO is more competitive in solving discrete problems. In recent works, SSO has been used to solve different sorts of engineering problems. A multilevel image threshold is proposed based on the SSO algorithm [51]. The SSO is used in solving high-dimensional dataset clustering [52]. SSO has shown a better effect in solving the above problems. However, since SSO has only just been proposed, there are few studies related to the applications of the community detection, and further research is needed in terms of algorithm adaptability.
The SSO algorithm simulates the law of spider swarm movement to achieve optimization. In this algorithm, the number of females was controlled at 65–90% of the entire population [47]. Every spider has a weight according to the fitness value of its solution. A new population of search agents is generated using the mating operator. Male spiders tend to be attracted toward females according to a certain radius. This is called the mating radius. After producing new spiders, their fitness values are calculated and then compared to the worst spider in the population. In each generation, the inferior spiders will be replaced by the latest and most optimal spiders. The steps of SSO algorithm are as follows (the detailed process can be found in [47]):
3.1. Initializing the Population
Like other evolutionary algorithms, SSO is an iterative process involving a first step of randomly initializing the entire population (female and male). The algorithm begins by initializing the set S of N spider positions [47]. This occurs through initialization of the relevant parameters: population number N, probability factor PE, and the number of male and female spiders and . The correlation formula is
where is a downward integer, and is the random number of (0, 1).
The relationship between the male and female population of the spiders is
where F and M represent female and male populations, respectively, and S is the full spider population.
The formula for randomly generating male and female populations is
where and denote the initialized female and male, respectively; and denote the upper and lower bounds of the j dimension, respectively; and , , .
3.2. Cooperative Operators
3.2.1. Female Cooperative Operator
According to the biological behavior of the social-spider, the male population is divided into two classes: dominant and non-dominant male spiders. Females attract or exclude other individuals by vibration, and female spiders can be divided into two groups for individual updates. Their updates are less than or equal to the probability factor, while PE attracts and vice versa. In reality, the size of a spider is a characteristic manifestation of executive ability. In SSO, each individual (spider) designs a fitness weight that represents the solution quality (irrespective of gender). Individual updates are conducted by
where is the random number of the current iteration, is [0, 1], ; is an individual nearest to and superior to itself in distance from the individual ; is the vibration perception of individual l to individual v; is the fitness function of the individual objective function; and is the Euclidean distance between the individual v and the individual l.
3.2.2. Male Cooperative Operator
Dominant male spiders have better fitness characteristics (usually regarding size) in comparison to non-dominant spiders. Dominant males are attracted to the closest female spider in the communal web. In contrast, non-dominant male spiders tend to concentrate in the center of the male population as a strategy to take advantage of resources that are wasted by dominant males [47]. According to the size of the fitness ranking, the male individual update can be divided into dominant and non-dominant. Dominant individuals attract the opposite sex so that they are close, and have the ability to gather the middle section of individual male clusters. Individual updates are achieved through
where indicates the weight in the middle. The male individuals are arranged according to the weight of descending value. If the male has a weight greater than or equal to that of the middle position, it is updated by the dominant individual; otherwise, this occurs through the non-dominant individual. A subset of the population consisting of male-dominated individuals is represented by TD; is the closest individual to , and is the average weight of the male spider.
3.3. Mating Operator
Mating in a social spider colony is performed by dominant males and female members [46]. Under such circumstances, when a dominant male spider () locates a set of female members within a specific range r (range of mating), it mates, forming a new brood which is generated considering all the elements of the set that, in turn, has been generated by the union . Male and female spiders have a generational update after mating to produce new individuals to replace the inferior spider until it meets the conditions. In each of the dominant male mating radii (r), according to the methods of roulette bets and females after mating to generate new individuals (). That is, , , , , and D is the total number of individuals dominated by the male. If the value of is larger than that of the worst individual in the population, is replaced by . All female individuals are marked in the male mating radius for the population . The probability that the female individual q in is chosen for marriage by the male individual is calculated as
Marriage radius r is calculated as
where and are the upper limit and the lower limit of the jth dimension, respectively.
4. Our Improvement for SSO
4.1. Improvement of Differential Evolution Cooperative Operators
This section aims to improve SSO in two respects: an increase of population difference update strength, and a random cloud crossover model [50,53] to disrupt the population. In the early stage of SSO, spiders fall easily into local exploration because of a lack of prior information [51]. Therefore, we should increase the dynamics of the global optimal individuals and stochastic learning, so as to maintain the population diversity and avoid the algorithm being trapped in local convergence. In the later stage, we should enhance the local search ability of the population and reduce the matching radius to ensure the fine exploration of local community and further optimize classification accuracy [50]. On the other hand, for poor individuals, we should increase the global search to move closer to the nearest optimal community, while elite individuals should try to retain good genes and strengthen the local search [22,36,51]. To avoid population degradation, we propose a random cloud crossover model to disrupt the population strategy.
4.1.1. Further Improvement by the Elites and Non-Elites
In the SSO algorithm, the female population is divided into two evolutionary strategies—attraction and repulsion—according to the probability factor PE (Formula (7)). The male population is divided into two evolutionary strategies according to the size of the weight ω; namely, the dominating individual and the non-dominated individual (Formula (10)). In the SSO community discovery application, because the individual location and the adaptation values are different, the natural node that belongs to the community is also different. Populations are required to have more distinct diversity characteristics [3,21,22,23,24,36,37,38,39,40,41]. In view of this, we further divide the male and female populations into two categories—elite and non-elite—which are sorted according to their fitness. Specific definitions are as follows (take female cooperative operators as an example):
Female elite individual cooperative operators:
Female non elite individual cooperative operators:
where is a [−1, 1] random number; and ψ are the control factor; and and represent the optimal and suboptimal solutions of the female population, respectively. is a random individual within an elite individual of the population.
4.1.2. Random Cloud Crossover Model to Disrupt the Population
The results show that the initial population of SSO has good diversity, while the population diversity is weakened with later evolution, and the algorithm can easily fall into local stagnation. In order to maintain population diversity, it is necessary to design a new mixing mechanism to avoid premature convergence. In this paper, we use the cloud model method [50,53] to improve the random part, so that spiders can shift their positions with smaller probability, and the larger probability is around them.
The mixing dimension is defined as
where t and are the current iteration and the total number of iterations. If the new individual has a mixing dimension of k, that is, the new ’ is stirred
where represents the normal random number with the expected value a and the standard deviation b, , [50].
4.2. Adaptive Mating Radius
In view of the complex characteristics of network data, by improving mating radius, the purpose of improving local search ability of spiders is achieved. With the increase of the number of iterations, poor individuals are gradually replaced or merged; then the community division becomes more and more obvious. At this time, the overall strategy is to reduce the marriage radius appropriately, and the elite individuals should slow down or even increase their marriage radius with higher fitness. Therefore, the mating radius was redefined as
where r is the marriage radius expressed by Equation (12), t is the current iteration number, is the total iteration number, and is the current i individual fitness value.
4.3. Steps of the DESSO/CD Algorithm
After the above improvements, the main steps of the DESSO/CD algorithm are:
Step 1. Initializing the given network data.
| 1. | Population size N, Probability factor PE, Maximum iterations max(t). Initializing Nf, Nm by |
| 2. | Formula (4): |
| 3. | |
| 4. | //where rand is a random number between [0,1] and floor (.) maps a real number to an integer |
| 5. | Number. |
Step 2. Initializing the spider male and female S, F, and M according to Formula (7).
| 1. | For (i = 1; i < Nf + 1; i++) |
| 2. | For (j = 1; j < N + 1; j++) |
| 3. | |
| 4. | End for |
| 5. | End for |
| 6. | For (k = 1; k < Nm + 1; k++) |
| 7. | For (j = 1; j < N + 1; j++) |
| 8. | |
| 9. | End for |
| 10. | End for |
Step 3. Calculating the weight of the individual and sorting.
| 1. | For (l = 1; i < N + 1; l++) |
| 2. | For (j = 1; j < N + 1; j++) |
| 3. | |
| 4. | // Where |
| 5. | End for |
| 6. | End for |
Step 4. Moving female spiders according to the female cooperative operator.
| 1. | The elite and non-elite individuals are divided according to the criterion in the population F: |
| 2. | For (i = 1; i < Nf + 1; i++) |
| 3. | Calculate Vibji,Vibbi and Vibli by Formula (8) |
| 4. | If () |
| 5. | |
| 6. | If (rm < PE); where rm ∈ rand(0,1),τ ∈ rand(0,1),θb and ψ are the control factor. |
| 7. | |
| 8. | Else |
| 9. | |
| 10. | End if |
| 11. | End if |
| 12. | End for |
Step 5. Moving female spiders according to the male cooperative operator.
| 1. | The elite and the non-elite individuals are divided according to the criterion in the population M. |
| 2. | For (i = 1; i < Nm + 1; i++) |
| 3. | Calculate Vibji by Formula (8) |
| 4. | If |
| 5. | |
| 6. | Find the median male individual () from M. |
| 7. | Else if (), where rm ∈ rand (0,1),τ ∈ rand (0,1),θb and ψ are the control factor. |
| 8. | |
| 9. | Else |
| 10. | |
| 11. | End if |
| 12. | End if |
| 13. | End for |
Step 6. Calculating marriage radius according to Formula (17).
where t is the current number of iterations.
Step 7. In roulette bets, according to Formula (11) with respect to the probability of selection, in the male individual mating radius male and female marriages produce new individuals whilst replacing the worst individuals.
| 1. | For (i = 1; i < Nm + 1; i++) |
| 2. | If (Mi ∈ D) |
| 3. | Find Ei |
| 4. | If (Ei < >“”) |
| 5. | Form Snew using the roulette method |
| 6. | If (ωnews > ωwo) |
| 7. | Swo = Snew |
| 8. | End if |
| 9. | End if |
| 10. | End if |
| 11. | End for |
Step 8. If the module ΔQ (Formula (3)) does not increase several generations, the algorithm stops, or go to Step 9.
Step 9. The new individual is stirred by using the cloud model in Formula (16), go to Step 2.
Step 10. The convergent population labels are mapped into community partitions.
5. Experiments and Analysis
The framework of a CD algorithm based on SSO is proposed in this paper. There are two major improvements in the SSO algorithm from the specific application of CD. In order to verify the validity of the DESSO/CD algorithm, this section conducts a comparison with the existing algorithms. In order to compare the improved performance of the original SSO, we split the frame into four algorithms according to the different points of the improved SSO algorithm; the CD algorithm based on the original SSO framework (SSO/CD), the CD algorithm based on further differential SSO framework (DSSO/CD), the CD algorithm based on improved marriage radius of the SSO framework (RSSO/CD), and the CD algorithm based on two improved SSO frameworks (DESSO/CD). The other algorithms used for comparison are some evolutionary and non-evolutionary algorithms, including the CD algorithm based on simulated annealing [19] (an algorithm proposed by Guimerà and Amaral, GA), the CD based on the scatter-based genetic algorithm [9] (SSGA), the CD based on differential bat algorithm [9] (Improved Bat Algorithm Based On The Differential Evolutionary Algorithm, BADE), the CD based on hybrid particle swarm optimization (PSO) algorithm [54], and the CD based on immune discrete differential evolution algorithm [35] (IDDE). The comparison of the four algorithms (SSO/CD, DSSO/CD, RSSO/CD, and DESSO/CD) is to verify the effect of improving the SSO framework. The comparison of other existing algorithms is to confirm the competitiveness of the DESSO/CD framework.
There are evaluation metrics of accuracy of CD measure. Since the DESSO/CD algorithm uses modular increment as the evolutionary operator selection criteria, in order to avoid the bias error, we also use the normalized mutual information (NMI) [55] and modularity Q [10] functions as the evaluation metrics of accuracy for CD measure, as described in Section 4.1.
The experimental data set is as follows. In the LFR (Lancichinetti Fortunato Radicchi, LFR) benchmark [56], 10 randomly generated different sizes of the network, six kinds of real network data sets commonly used in the CD field, and a novel graphical analysis come from the DESSO/CD algorithm for a set of data collected in an online social network (Sina Weibo network) using community detection.
The experimental environment involves a PC with an Intel i7 7700 k 4.2 GHz CPU, 16 GB of memory, and a Windows 7 operating system. The general experimental parameters of this paper are population size N = 500 (less than the expected number of communities), probability factor PE = 0.6 [47], and maximum iteration number .
5.1. Evaluation Metrics of Accuracy for the CD Measure
The modularity function is defined as
where represents the possibility of node i and . If is connected, Krone function Δ = 1, or Δ = 0, and the value of Q is the actual difference between the two proportional expectations. The two ratios are the proportion of the connection edges between the nodes within the network community and the proportion of links between the nodes of community in the random network Q ∈ (0,1). The closer the Q value is to 1, the more obvious the network partitioning community is.
The NMI defines the formula as
where A and B represent two different communities, respectively, , and , I stands for mutual information, and H represents the entropy of information. If two communities are divided into the same A and B, then = 1. If the two partitions of A and B are more similar, then the NMI value is closer to 1.
5.2. Experiments on Artificial Data
The LFR benchmark [56] is an extension of the GN standard network data set, and is an artificial network commonly used in current community discovery. The model is defined as
The parameter meaning of LFR and the initial value of this experiment are shown in Table 1:
5.2.1. Experiments of Iterations on LFR Networks
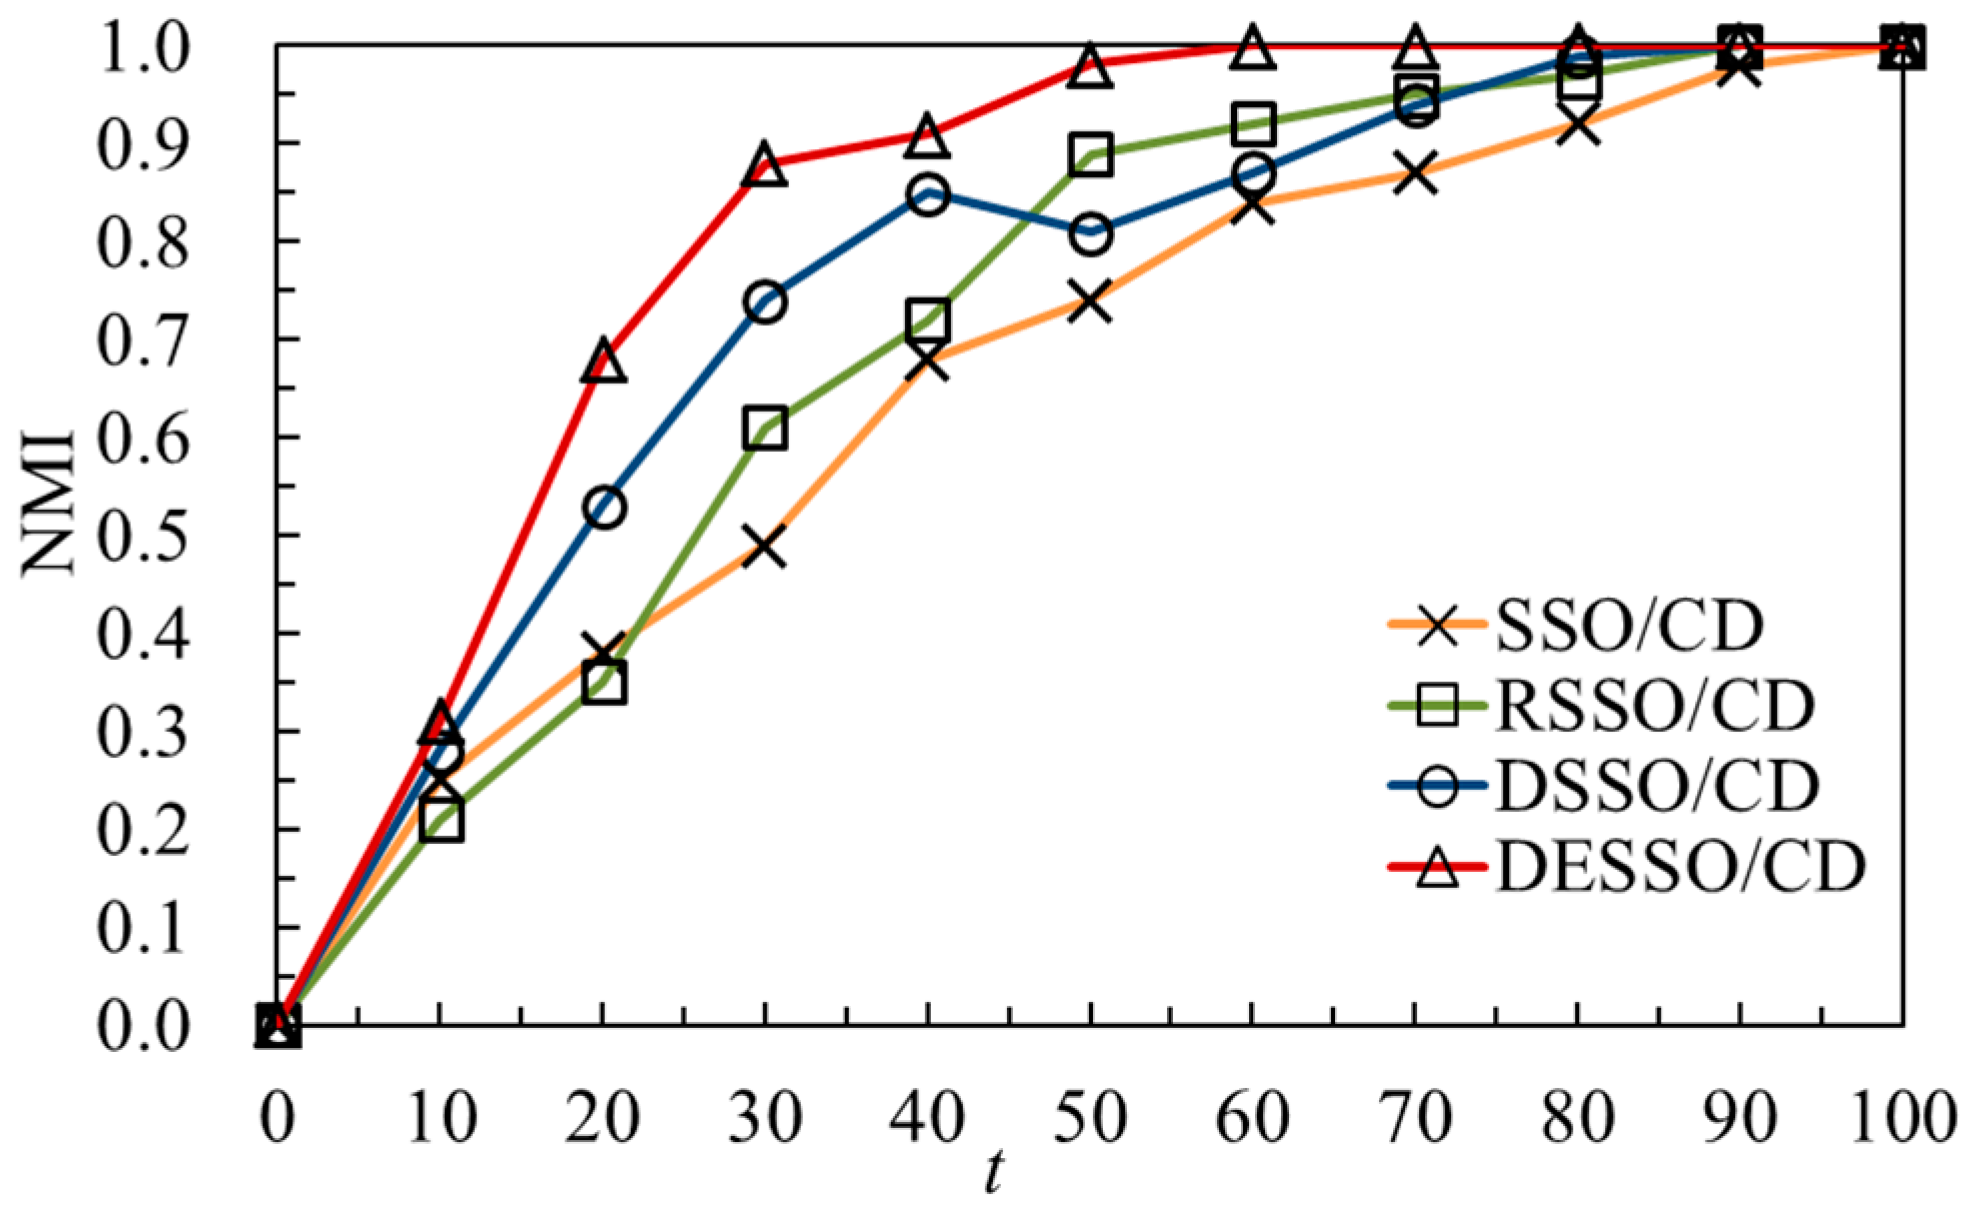
SSO/CD, DSSO/CD, RSSO/CD, and DESSO/CD will be compared in the same LFR networks. For the sake of fairness, all parameters in the above four algorithms maintain consistency and the mixing parameters μ = 0.06 in artificial benchmark networks on the LFR (usually μ ∈ [0, 3]), and in the meantime the network has obvious community structure characteristics: the smaller the μ is, the more obvious the characteristics of community structure will be. Other LRF parameters are shown in Table 1. The accuracy of DC (NMI) was detected by increasing the number of evolutionary iterations.
As shown in Figure 3, the convergence speed of the algorithm between 30–40 generations of DESSO/CD has an obvious oscillation period because of the random cloud crossover model to disrupt the population (Section 4.1.2). Therefore, it can be concluded that algorithm accuracy and convergence speed improved significantly after mixing the population as described in Section 4.1.2. This point can also be clearly obtained from the DSSO/CD algorithm for the 50th generation with precision changes. Moreover, in the later stage of the RSSO/CD algorithm, the spider search efficiency will be further improved due to the amplification of elite individual mating and mating radius, and the radius of other individuals being narrow. In addition, RSSO/CD has accelerated the trend of convergence clearly in the 15th generation.
5.2.2. Partitioning Accuracy on LFR Networks
The mixed parameter (μ) values of the LFR network are adjusted by 0.05 with the changing scale, so that 10 different artificial networks are generated randomly, and then the network can be divided. The algorithm runs 10 times in each network, taking the average of the precision index (NMI). Changes of NMI value with increasing μ value in LFR network are shown in Figure 4a, which indicates that when the network mixed parameter is μ ∈ [0, 3], the network community structure is relatively clear, and so is the above algorithm. When μ ≈ 0.3, the NMI of SSO/CD and IDDE drops more clearly, but DESSO/CD still can hold at 0.95 or so.
In addition, with the increase of μ, the changes of Q value index are shown in Figure 4b. Obviously, the SSO/CD and DESSO/CD algorithms are better than other algorithms, mainly because the two algorithms are based on the growth of ΔQ for jumping out of circulation. The accuracy of SSO/CD and IDDE is relatively close, that is because the SSO algorithm belongs to differential evolution as IDDE does. In conclusion, the improved DESSO/CD algorithm is more stable and accurate.
5.2.3. Partitioning Speed of LFR Networks
On the LFR benchmark network, with the increase of the number of edges, the data for the execution time of the test algorithm can be obtained, as shown in Figure 5. The reasons are because the radius of differential evolution strategy and adaptive matching reduces the calculation of the fitness function number as well as the random adjustment of learning mechanism based on a cloud model, which could effectively control the blind search spiders. Therefore, SSO/CD is slightly worse than IDDE in convergence, whereas algorithms based on differential evolution (DESSO/CD, IDDE, SSO/CD) are more efficient than the classical simulated annealing CD algorithm (GA). It can also be concluded that the adjusted DESSO/CD has better convergence.
5.3. Real Network Experiment
In the real network experiment, five groups of real networks are used to compare the precision of the algorithm presented in this study with other existing network algorithms. Moreover, we conduct some simulation and contrast experiments on network data randomly captured from Sina Weibo.
5.3.1. Partitioning Accuracy of Real Networks
The network data used in real network experiments is shown in Table 2. Amazon and YouTube are relatively complete networks, while the other two networks are relatively simple. In the same data set and experimental environment, each algorithm was repeated 10 times, and some experimental data derived from [20,35]. Table 2 and Table 3 have been marked.
The experimental results are shown in Table 3. In the karate network, because the network nodes and the connection edges are few, each kind of algorithm can maintain relatively high precision. The standard deviation is also small, so the precision of each algorithm is similar. The edge node and connection are relatively large in the football networks, and differential evolution algorithm (DESSO/CD, BADE, IDDE) can maintain high accuracy. However, in a more complex network, the meta-heuristic algorithm is based on differential evolution (DESSO/CD, BADE) with more obvious advantages. Overall, DESSO/CD runs on a variety of networks with a more stable performance, and better adaptability and accuracy.
5.3.2. Novel Graphical Analysis of Real Social Network Partitioning
Using the method provided by Yibochen [62], based on Sina Weibo opened by Application Programming Interface (API), we specified an account to capture a set of relational list data under the theme of sports. The experiment captured 517 Weibo accounts and their mutual data. Since the number of communities, the degree of node distribution, clustering coefficients, and other information in the experimental data are unknown, the test can also check the performance of the algorithm without prior information.
IDDE, SSO/CD, and DESSO/CD use the method of the target data classification experiments. The influential leading nodes in the community are detected as described in [63]. Igraph software is used to zoom in and render the five influential leader nodes, as shown in Figure 6. The community discovery using the SSO algorithm is better than IDDE, and the improved DESSO/CD is best. As shown in the diagram, the Weibo data captured will be divided into two parts: football and basketball, while each area shows a team based on community division, where the enlarged nodes show the opinion of influential leaders in the community.
6. Discussion
6.1. Convergence Analysis
The computational cost of DESSO/CD has three main parts: fitness calculation, population iteration convergence, and incremental community computing. The time complexity of fitness calculation is the sum total of each generation of population, since the cooperative iteration of operators is multi-population differential expansion and the number of iterations of convergence and incremental community computing are exponentially reduced. The parameter is not the final number of iterations; it is a much larger estimate than the actual value. Although the random cloud crossover model strategy may disturb the population, and the convergence rate of each generation will be affected, the total number of iterations is reduced. So the convergence speed of the algorithm is generally improved (the comparison can be seen in Figure 3).
6.2. Comparative Analysis
EAs have been widely employed for solving community optimization problems, as they can utilize the evolutionary rules of biological intelligence to effectively explore and optimize. However, there is a conflict in maintaining the diversity of the population and accelerating the convergence of the algorithm to an optimum. Repeated fitness calculations are also time-consuming. In contrast to other EAs, with DESSO/CD each individual is modeled considering gender and dominance. DESSO/CD defines individuals with different properties, performing different behaviors virtually. In this case, it promotes the possibility of adding new and selective operators as a result of considering individuals with different characteristics. Such a fact allows the incorporation of computational mechanisms to avoid critical flaws such as premature convergence and an incorrect exploration–exploitation balance commonly presented in both the PSO and the GA algorithm. In Table 3, the comparison can be seen.
Furthermore, the population fitness is defined by local similarity of nodes, so that each generation of community label segmentation is gradually made clear. The community quality increment criterion is defined as a component of the Q function and is used to screen populations. In contrast to the traditional time Q function optimization method, the strategy of this paper is optimized generation by generation, and each population is optimized in different ways and with multi-granularity. In this way, the resolution problem of the Q function can be overcome and the algorithm accuracy can be improved.
7. Conclusions
On the basis of improving the SSO algorithm, this paper proposes a community detection algorithm based on differential evolution using social spider optimization (DESSO/CD). Community detection is achieved by simulating spider cooperative operators, and marriage and operator selection. In this algorithm, nodes in the network are initialized as populations in the SSO algorithm. The similarity of nodes is defined as the local fitness function and the community quality increment is used as the screening criteria for evolutionary operators. Each individual has the ability to learn at random. Meanwhile, the populations are divided into two categories—elite and non-elite—based on the fitness value. Spider populations are further differentiated for cooperation. Since fitness and diversity information is simultaneously considered to select the operators, a good balance between exploration and exploitation can be achieved. A random cloud crossover model is adopted to maintain the diversity of the population. The mating radius will be adjusted automatically according to the fitness value in the dominant individuals. Each generation of the quality increment of community modularity is used as a criterion for the evolutionary selection operator. Thus, this strategy not only ensures the search space of operators, but also reduces the blindness of exploration. On the other hand, the multi-level, multi-granularity strategy of DESSO/CD can be used to further compensate for resolution limitations and extreme degradation defects based on modular optimization methods. It could detect community structure with higher partition accuracy and lower computational cost. Experiments on artificial and real-world networks show the effectiveness and efficiency of DESSO/CD. In comparison with other methods, EA algorithms also confirm that DESSO/CD’s flexibility is better.
DESSO/CD is a method of community detection based on local neighborhood expansion. It has less dependence on parameters, better adaptability, higher efficiency, and shows greater accuracy. This study is competitive and promising. Since the CD approach is based on SSO, the key points are setting of the fitness vectors and the screening criteria for evolutionary operators. This plays a vital role in maintaining the distribution of the population. The organizational dimension of the edges and nodes within the community is diverse. Indeed, the fitness values based on the objective function still result in many contradictions and conflicts in practical operation. However, in the future, we will focus on the application of multidimensional fitness values in the SSO-based CD algorithm and intelligent systems in fuzzy, neutrosophic, inconsistent, and dynamic environments [64,65,66,67,68].
Acknowledgments
This work was supported by the National Natural Science Foundation of China (Grant No. 61572200), and key platforms and major scientific research projects of provincial institutions of higher learning in Guangdong (Grant No. 2015KQNCX221).
Author Contributions
You-Hong Li, Jian-Qiang Wang, Xue-Jun Wang, Yue-Long Zhao, Xing-Hua Lu, and Da-Long Liu conceived and worked together to achieve this work; You-Hong Li wrote the paper; You-Hong Li and Xue-Jun Wang made contributions to the experiment and analysis.
Conflicts of Interest
The authors declare no conflict of interest.
References
- Girvan, M.; Newman, M.E. Community structure in social and biological networks. Proc. Natl. Acad. Sci. USA 2002, 12, 7821–7826. [Google Scholar] [CrossRef] [PubMed]
- Fortunato, S. Community detection in graphs. Phys. Rep. 2010, 3, 75–174. [Google Scholar] [CrossRef]
- Biswas, A.; Biswas, B. Analyzing evolutionary optimization and community detection algorithms using regression line dominance. Inf. Sci. 2017, 396, 185–201. [Google Scholar] [CrossRef]
- Duan, L.; Liu, Y.; Street, W.N.; Lu, H. Utilizing advances in correlation analysis for community structure detection. Expert Syst. Appl. 2017, 84, 74–91. [Google Scholar] [CrossRef]
- Fortunato, S.; Hric, D. Community detection in networks: A user guide. Phys. Rep. 2016, 659, 1–44. [Google Scholar] [CrossRef]
- Wang, M.; Wang, J.; Li, L. New online personalized recommendation approach based on the perceived value of consumer characteristics. J. Intell. Fuzzy Syst. 2017, 33, 1953–1968. [Google Scholar] [CrossRef]
- Wang, M.; Wang, J. An evolving Takagi-sugeno model based on aggregated trapezium clouds for anomaly detection in large datasets. J. Intell. Fuzzy Syst. 2017, 32, 2295–2308. [Google Scholar] [CrossRef]
- Li, J.; Wang, J. An extended QUALIFLEX method under probability hesitant fuzzy environment for selecting green suppliers. Int. J. Fuzzy Syst. 2017, 1–14. [Google Scholar] [CrossRef]
- Strogatz, S.H. Exploring complex networks. Nature 2001, 6825, 268. [Google Scholar] [CrossRef] [PubMed]
- Newman, M.E.; Girvan, M. Finding and evaluating community structure in networks. Phys. Rev. E 2004, 69, 026113. [Google Scholar] [CrossRef] [PubMed]
- Radicchi, F.; Castellano, C.; Cecconi, F.; Loreto, V.; Parisi, D. Defining and identifying communities in networks. Proc. Natl. Acad. Sci. USA 2004, 101, 2658–2663. [Google Scholar] [CrossRef] [PubMed]
- Lancichinetti, A.; Fortunato, S.; Kertész, J. Detecting the overlapping and hierarchical community structure in complex networks. New J. Phys. 2009, 11, 033015. [Google Scholar] [CrossRef]
- Ahn, Y.Y.; Bagrow, J.P.; Lehmann, S. Link communities reveal multiscale complexity in networks. Nature 2010, 466, 761. [Google Scholar] [CrossRef] [PubMed]
- Chi, Y.; Song, X.; Zhou, D.; Hino, K.; Tseng, B.L. Evolutionary spectral clustering by incorporating temporal smoothness. In Proceedings of the 13th ACM SIGKDD international conference on Knowledge discovery and data mining, San Jose, CA, USA, 12–15 August 2007; pp. 153–162. [Google Scholar]
- Li, Y.H.; Zhan, Y.W.; Wang, X.J. A community detection algorithm based on multi-domain adaptive spectral clustering. In Proceedings of the Advanced Information Management, Communicates, Electronic and Automation Control Conference (IMCEC), Xi’an, China, 3–5 October 2016. [Google Scholar]
- Yang, J.; Leskovec, J. Overlapping community detection at scale: a nonnegative matrix factorization approach. In Proceedings of the Sixth ACM International Conference on Web Search and Data Mining, Rome, Italy, 4–8 February 2013; pp. 587–596. [Google Scholar]
- Xin, Y.; Xie, Z.Q.; Yang, J. An adaptive random walk sampling method on dynamic community detection. Expert Syst. Appl. 2016, 58, 10–19. [Google Scholar] [CrossRef]
- Li, Y.H.; Zhan, Y.W.; Wang, X.J. Local Extended Label Propagation Ant Colony Optimization Overlapping Community Detection. Available online: http://kns.cnki.net/kcms/detail/51.1196.TP.20170727.2115.006.html (accessed on 27 July 2017).
- Guimerà, R.; Nunes Amaral, L.A. Functional cartography of complex metabolic networks. Nature 2005, 433, 895–900. [Google Scholar] [CrossRef] [PubMed]
- Atay, Y.; Koc, I.; Babaoglu, I.; Kodaz, H. Community detection from biological and social networks: A comparative analysis of metaheuristic algorithms. Appl. Soft Comput. 2016, 50, 194–211. [Google Scholar] [CrossRef]
- Gong, M.; Cai, Q.; Chen, X.; Ma, L. Complex network clustering by multi-objective discrete particle swarm optimization based on decomposition. IEEE Trans. Evol. Comput. 2014, 18, 82–97. [Google Scholar] [CrossRef]
- Wen, X.; Chen, W.N.; Lin, Y.; Gu, T.; Zhang, H.; Li, Y.; Zhang, J. A maximal clique based multi-objective evolutionary algorithm for overlapping community detection. IEEE Trans. Evol. Comput. 2017, 21, 363–377. [Google Scholar]
- Zou, F.; Chen, D.; Li, S.; Lu, R.; Lin, M. Community detection in complex networks: Multi-objective discrete backtracking search optimization algorithm with decomposition. Appl. Soft Comput. 2017, 53, 285–295. [Google Scholar] [CrossRef]
- Huang, Q.; White, T.; Jia, G.; Musolesi, M.; Turan, N.; Tang, K.; Yao, X. Community detection using cooperative co-evolutionary differential evolution. In International Conference on Parallel Problem Solving from Nature; Springer: Berlin/Heidelberg, Germany, 2012; pp. 235–244. [Google Scholar]
- Tasgin, M.; Herdagdelen, A.; Bingol, H. Community detection in complex networks using genetic algorithms. arXiv, 2007; arXiv:0711.0491. [Google Scholar]
- Shang, R.; Bai, J.; Jiao, L.; Jin, C. Community detection based on modularity and an improved genetic algorithm. Physica A: Stat. Mech. Appl. 2013, 392, 1215–1231. [Google Scholar] [CrossRef]
- Jia, G.; Cai, Z.; Musolesi, M.; Wang, Y.; Tennant, D.A.; Weber, R.J.; He, S. Community detection in social and biological networks using differential evolution. Lect. Notes Comput. Sci. 2012, 71–85. [Google Scholar] [CrossRef]
- Fortunato, S.; Barthélemy, M. Resolution limit in community detection. Proc. Natl. Acad. Sci. USA 2007, 104, 36–41. [Google Scholar] [CrossRef] [PubMed]
- Newman, M.E.J. Fast algorithm for detecting community structure in networks. Phys. Rev. E 2004, 69, 066133. [Google Scholar] [CrossRef] [PubMed]
- Tiomokoali, H.; Couillet, R. Performance analysis of spectral community detection in realistic graph models. In Proceedings of the IEEE International Conference on Acoustics, Speech and Signal Processing, Shanghai, China, 20–25 March 2016; pp. 4548–4552. [Google Scholar]
- Good, B.H.; de Montjoye, Y.A.; Clauset, A. Performance of modularity maximization in practical contexts. Phys. Rev. E 2010, 81, 046106. [Google Scholar] [CrossRef] [PubMed]
- Blondel, V.D.; Guillaume, J.L.; Lambiotte, R.; Lefebvre, E. Fast unfolding of communities in large networks. J. Stat. Mech. Theory Exp. 2008, 10, 155–168. [Google Scholar] [CrossRef]
- Khadivi, A.; Rad, A.A.; Hasler, M. Community detection enhancement in networks using proper weighting and partial synchronization. In Proceedings of the IEEE International Symposium on Circuits and Systems, Paris, France, 30 May–2 June 2010; pp. 3777–3780. [Google Scholar]
- Huang, J.B.; Sun, X.J.; Zou, Y. Research survey on team formation in social networks. Chin. J. Softw. 2017, 28, 1–18. [Google Scholar]
- Zhang, Y.G.; Gong, Z.H.; Chen, Q.K. Community detection complex networks using immune discrete differential evolution algorithm. Chin. Acta Autom. Sin. 2015, 41, 749–757. [Google Scholar]
- Li, B.; Li, J.; Tang, K.; Yao, X. Many-objective evolutionary algorithms: A survey. ACM Comput. Surv. 2015, 48, 1–35. [Google Scholar] [CrossRef]
- Amiri, B.; Hossain, L.; Crawford, J.W.; Wigand, R.T. Community detection in complex networks: Multi–objective enhanced firefly algorithm. Knowl. Based Syst. 2013, 46, 1–11. [Google Scholar] [CrossRef]
- De Meo, P.; Ferrara, E.; Fiumara, G.; Provetti, A. Mixing local and global information for community detection in large networks. J. Comput. Syst. Sci. 2014, 80, 72–87. [Google Scholar] [CrossRef]
- Özkiş, A.; Babalik, A. A novel metaheuristic for multi-objective optimization problems: The multi-objective vortex search algorithm. Inf. Sci. 2017, 402, 124–148. [Google Scholar] [CrossRef]
- Wang, J.; Liao, J.; Zhou, Y.; Cai, Y. Differential evolution enhanced with multi-objective sorting-based mutation operators. IEEE Trans. Cybern. 2014, 44, 2792–2805. [Google Scholar] [CrossRef] [PubMed]
- Li, K.; Deb, K.; Zhang, Q.; Kwong, S. An evolutionary many-objective optimization algorithm based on dominance and decomposition. IEEE Trans. Evol. Comput. 2015, 19, 694–716. [Google Scholar] [CrossRef]
- Malliaros, F.D.; Vazirgiannis, M. Clustering and community detection in directed networks: A survey. Phys. Rep. 2013, 533, 95–142. [Google Scholar] [CrossRef]
- Pizzuti, C. GA-Net: A genetic algorithm for community detection in social networks. In PPSN 2008: Parallel Problem Solving from Nature—PPSN X; Springer: Berlin/Heidelberg, Germany, 2008; pp. 1081–1090. [Google Scholar]
- Pasta, M.; Zaidi, F. Topology of complex networks and performance limitations of community detection algorithms. IEEE Access 2016, 99, 1–20. [Google Scholar] [CrossRef]
- Yang, J.; McAuley, J.; Leskovec, J. Community detection in networks with node attributes. In Proceedings of the IEEE International Conference on Data Mining series (ICDM), Dallas, TX, USA, 7–10 December 2013; pp. 1151–1156. [Google Scholar]
- Ronhovde, P.; Nussinov, Z. Local resolution-limit-free Potts model for community detection. Phys. Rev. E 2010, 81, 046114. [Google Scholar] [CrossRef] [PubMed]
- Cuevas, E.; Cortés, M.A.D.; Navarro, D.A.O. A swarm global optimization algorithm inspired in the behavior of the social-spider. Expert Syst. Appl. 2013, 40, 6374–6384. [Google Scholar] [CrossRef]
- James, J.Q.; Li, V.O. A social spider algorithm for global optimization. Appl. Soft Comput. 2015, 30, 614–627. [Google Scholar] [Green Version]
- Klein, C.E.; Segundo, E.H.; Mariani, V.C.; Coelho, L.D.S. Modified social-spider optimization algorithm applied to electromagnetic optimization. IEEE Trans. Magn. 2016, 53, 1–4. [Google Scholar] [CrossRef]
- Wang, Y.J.; Li, X.J.; Xiao, J. Social spider optimization with dynamic learning strategy. Chin. Control Decis. Conf. 2015, 9, 1575–1582. [Google Scholar]
- Ouadfel, S.; Taleb-Ahmed, A. Social spider optimization and flower pollination algorithm for multilevel image thresholding. Expert Syst. Appl. 2016, 55, 566–584. [Google Scholar] [CrossRef]
- Shukla, U.P.; Nanda, S.J. Parallel social spider clustering algorithm for high dimensional datasets. Eng. Appl. Artif. Intell. 2016, 56, 75–90. [Google Scholar] [CrossRef]
- Zhang, G.; He, R.; Liu, Y. An evolutionary algorithm based on cloud model. Chin. J. Comput. 2008, 31, 1082–1091. [Google Scholar] [CrossRef]
- Qu, J. A hybrid algorithm for community detection using PSO and EO. Adv. Inf. Sci. Serv. Sci. 2013, 5, 187. [Google Scholar]
- Danon, L.; Diaz-Guilera, A.; Duch, J.; Arenas, A. Comparing community structure identification. J. Stat. Mech. Theory Exp. 2005, 9, P09008. [Google Scholar] [CrossRef]
- Lancichinetti, A.; Fortunato, S.; Radicchi, F. Benchmark graphs for testing community detection algorithms. Phys. Rev. E 2008, 78, 046110. [Google Scholar] [CrossRef] [PubMed]
- Zachary, W.W. An information flow model for conflict and fission in small groups. J. Anthropol. Res. 1977, 33, 452–473. [Google Scholar] [CrossRef]
- Lusseau, D.; Newman, M.E.J. Identifying the role that animals play in their social networks. Proc. R. Soc. B Biol. Sci. 2004, 27, S477–S481. [Google Scholar] [CrossRef] [PubMed]
- Pothen, A.; Simon, H.D.; Liou, K.P. Partitioning sparse matrices with eigenvectors of graphs. SIAM J. Matrix Anal. Appl. 1990, 11, 430–452. [Google Scholar] [CrossRef]
- Gleiser, P.M.; Danon, L. Community structure in jazz. Adv. Complex Syst. 2003, 6, 565–573. [Google Scholar] [CrossRef]
- Yang, J.; Leskovec, J. Defining and evaluating network communities based on ground-truth. In International Conference on Data Mining; IEEE Computer Society: Washington, DC, USA, 2012; pp. 1–8. [Google Scholar]
- Yibo, C. Sina Weibo Data Extraction Methods [EB/OL]. Available online: https://github.com/yibochen/weiBor (accessed on 5 July 2013).
- Cao, J.X.; Chen, G.J.; Wu, J.L. Multi-feature based opinion leader mining in social networks. Chin. Acta Electron. Sin. 2016, 44, 898–905. [Google Scholar]
- Cao, Y.; Zhou, H.; Wang, J. An approach to interval-valued intuitionistic stochastic multi-criteria decision-making using set pair analysis. Int. J. Mach. Learn. Cybern. 2016. [Google Scholar] [CrossRef]
- Ji, P.; Zhang, H.; Wang, J. Fuzzy decision-making framework for treatment selection based on the combined QUALIFLEX-TODIM method. Int. J. Syst. Sci. 2017, 45. [Google Scholar] [CrossRef]
- Li, J.; Wang, J. Multi-criteria outranking methods with hesitant probabilistic fuzzy sets. Cogn. Comput. 2017, 1–15. [Google Scholar] [CrossRef]
- Wang, J.; Cao, Y.; Zhang, H. Multi-criteria decision-making method based on distance measure and choquet integral for linguistic Z-numbers. Cogn. Comput. 2017, 1–16. [Google Scholar] [CrossRef]
- Liang, R.; Wang, J.; Li, L. Multi-criteria group decision making method based on interdependent inputs of single valued trapezoidal neutrosophic information. Neural Comput. Appl. 2016, 1–20. [Google Scholar] [CrossRef]
Figure 1.
Sketch map of network community detection.
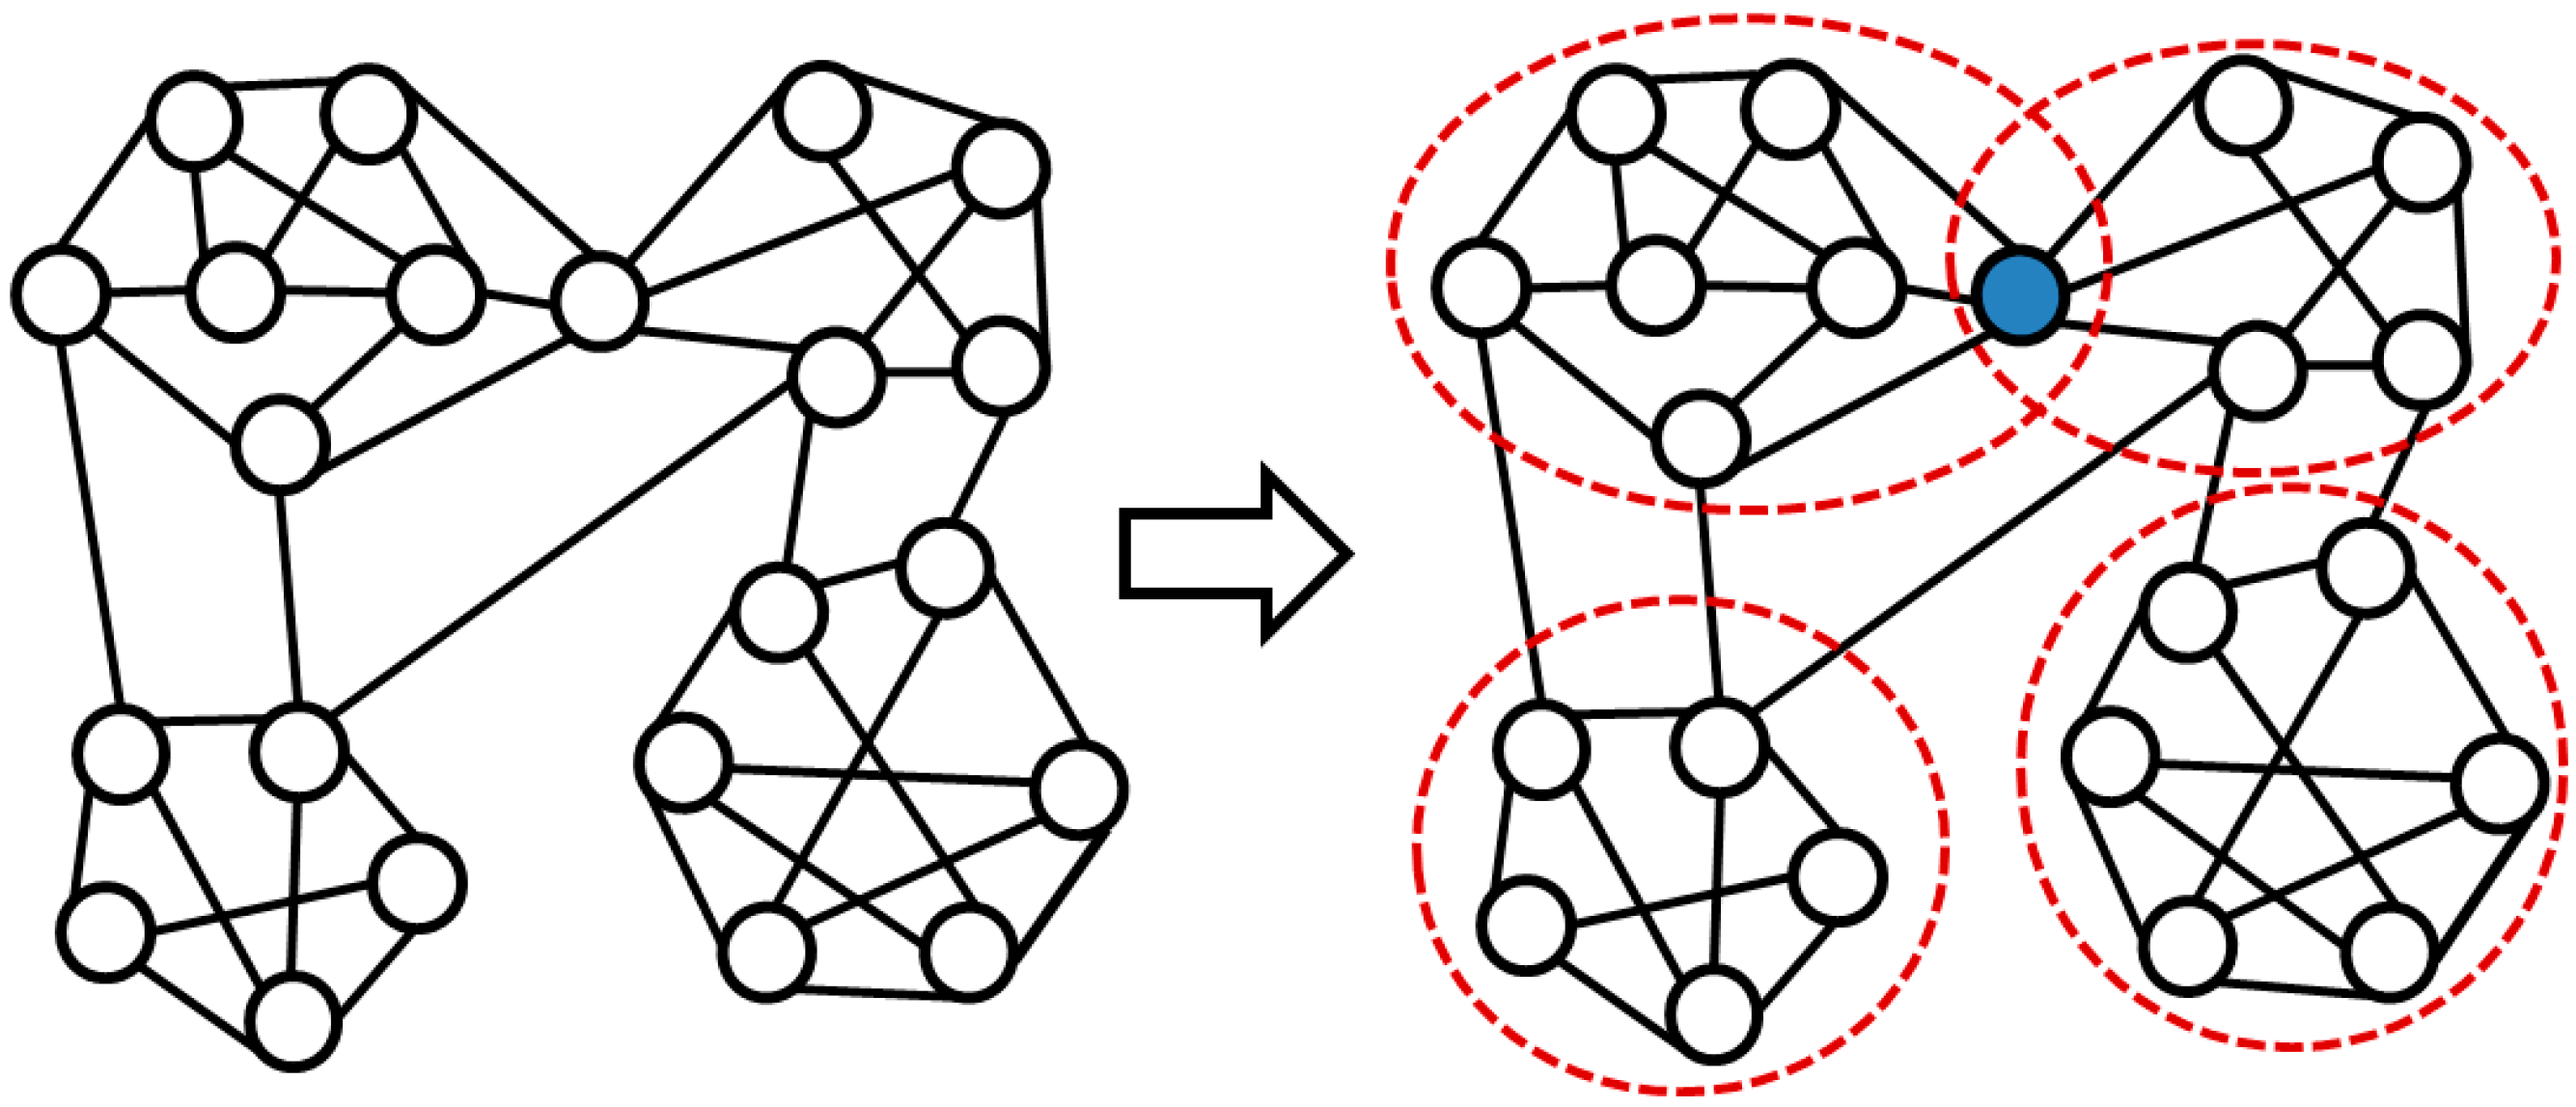
Figure 2.
Framework of the community detection algorithm based on social spider optimization (SSO/CD) algorithm.
Figure 2.
Framework of the community detection algorithm based on social spider optimization (SSO/CD) algorithm.
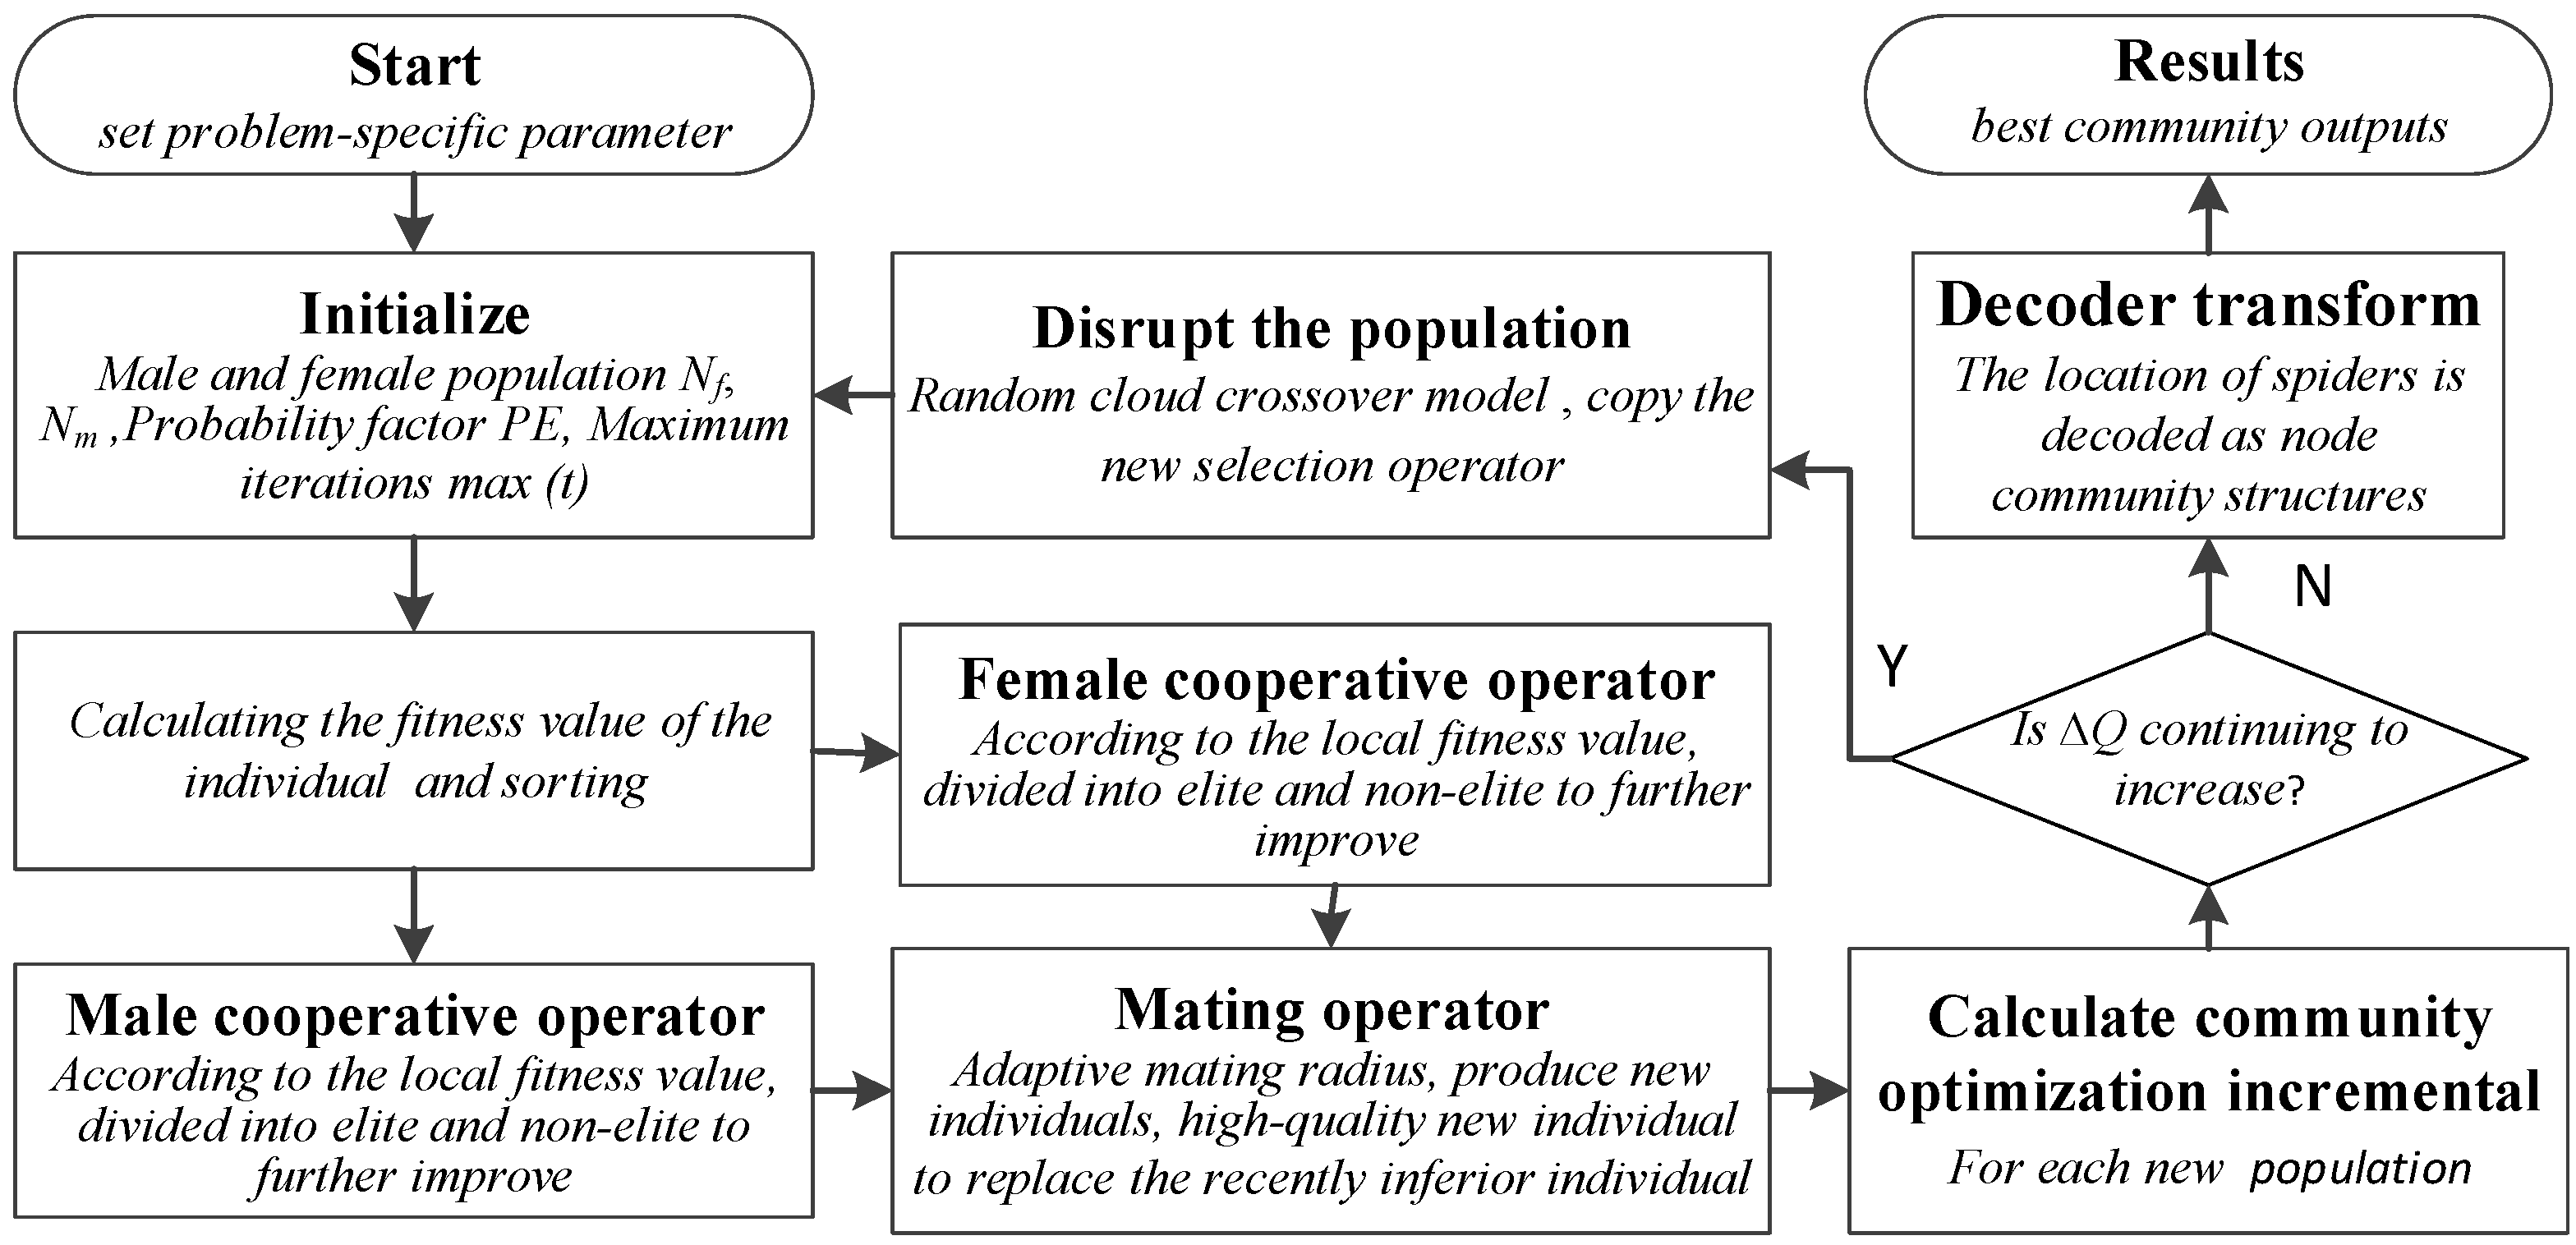
Figure 3.
Changes in the normalized mutual information (NMI) value in the LFR network with the increase of evolutionary iterations.
Figure 3.
Changes in the normalized mutual information (NMI) value in the LFR network with the increase of evolutionary iterations.

Figure 4.
Changes of accuracy value with increasing μ value in LFR network. (a) Changes of NMI value; (b) Changes of the Q value.
Figure 4.
Changes of accuracy value with increasing μ value in LFR network. (a) Changes of NMI value; (b) Changes of the Q value.
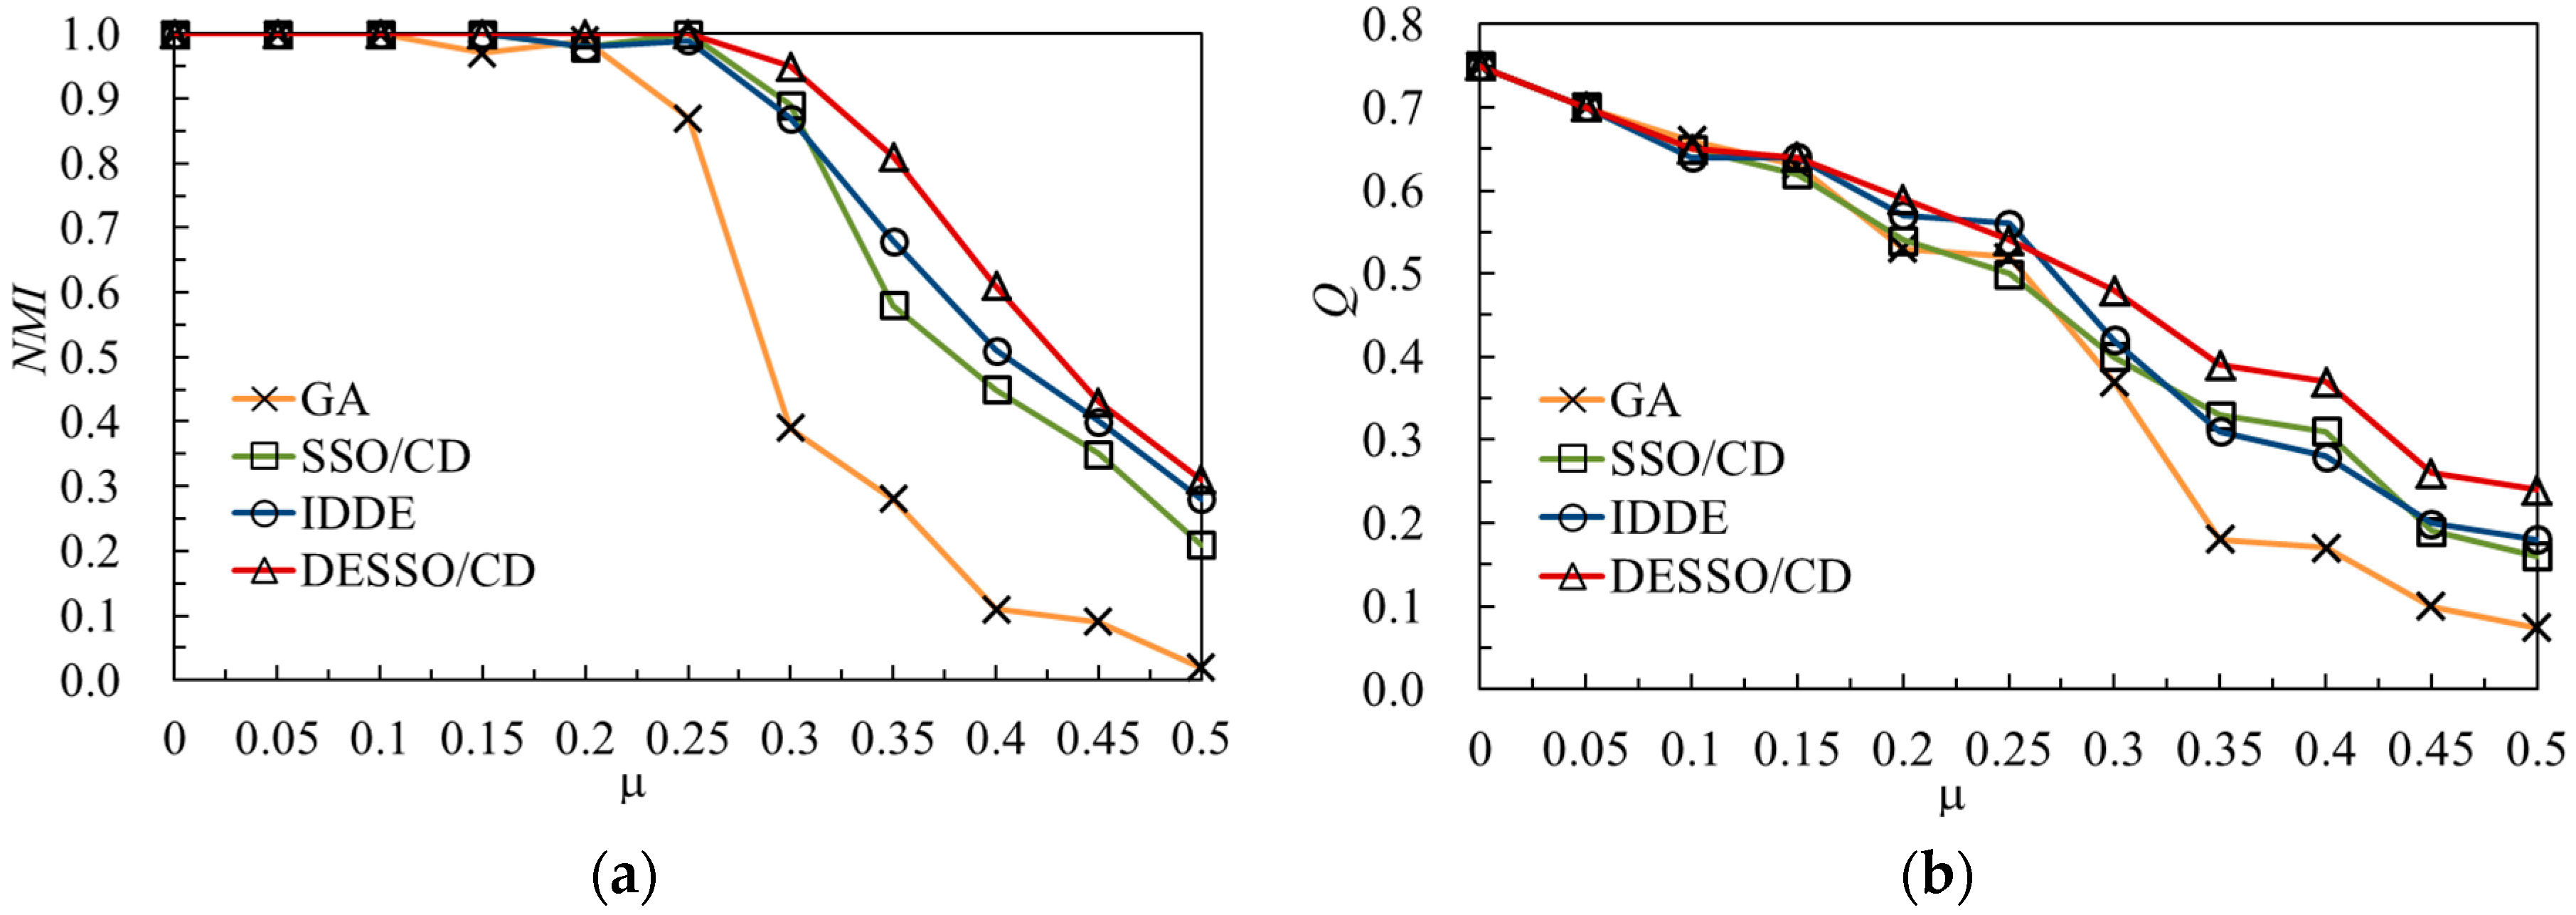
Figure 5.
Convergence times change with the increase of the number of edges. IDDE: immune discrete differential evolution algorithm; GA: Algorithm proposed by Guimerà and Amaral.
Figure 5.
Convergence times change with the increase of the number of edges. IDDE: immune discrete differential evolution algorithm; GA: Algorithm proposed by Guimerà and Amaral.
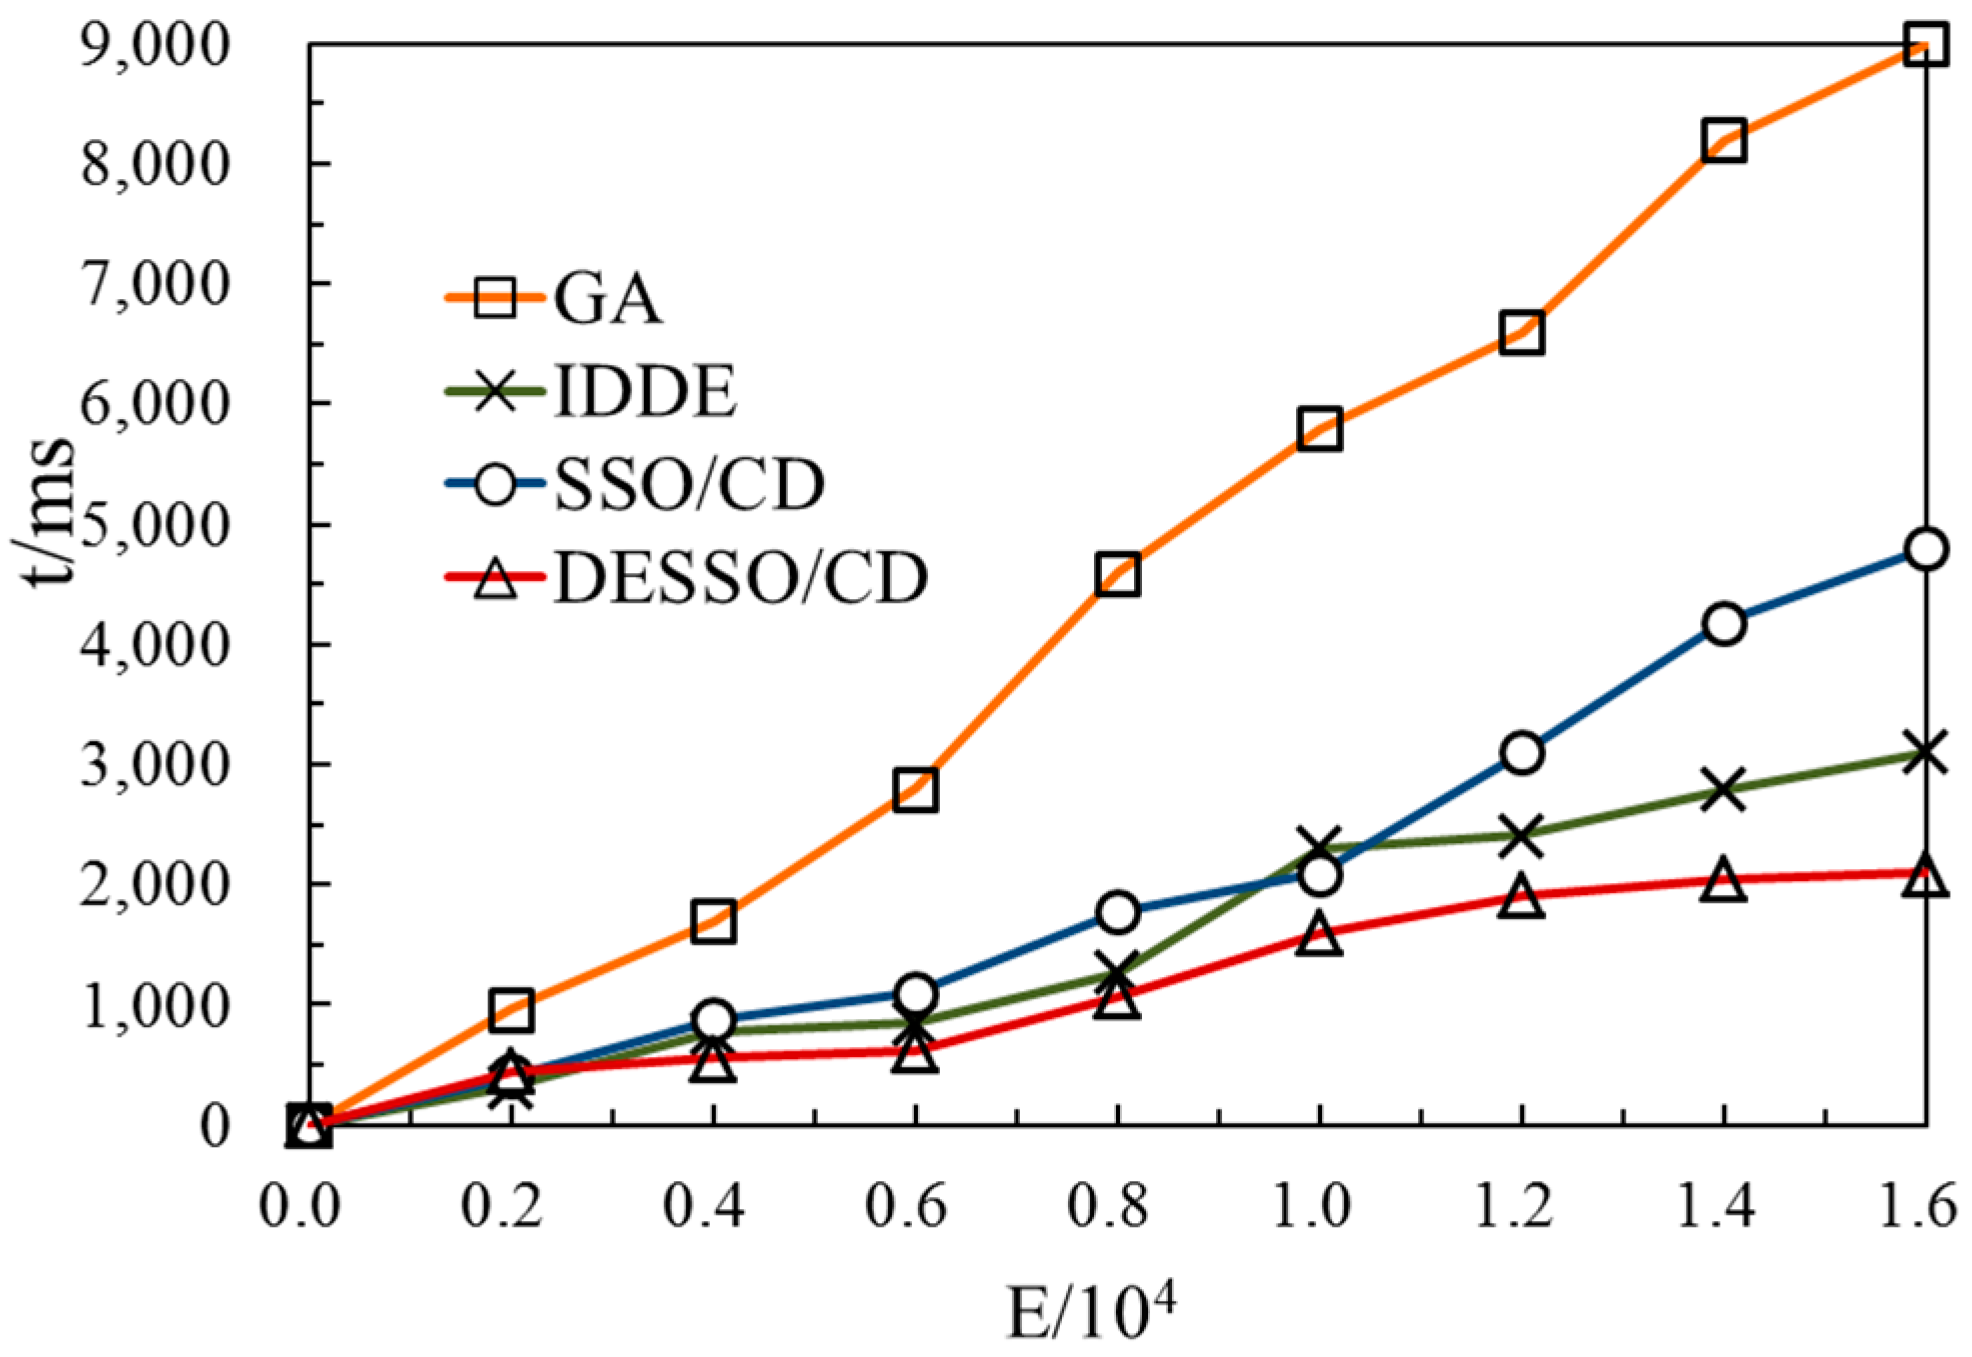
Figure 6.
Grab local Sina Weibo data community detection simulation. (a) IDDE; (b) SSO/CD; (c) DESSO/CD.
Figure 6.
Grab local Sina Weibo data community detection simulation. (a) IDDE; (b) SSO/CD; (c) DESSO/CD.


Table 1.
Parameters of the LFR network
| Parameter | Initial Value | Description |
|---|---|---|
| N | 1000 | Number of nodes |
| d | 10 | Average degree |
| dmax | 50 | Maximum degree |
| γ | −2 | Power law distribution of node scale |
| b | −1 | Power law distribution of community size |
| cmin | 10 | Minimum number of nodes in the community |
| cmax | 50 | Number of nodes in the largest community |
| on | 100 | Number of overlapping nodes in the community |
| om | 4 | Number of overlapping nodes linking communities |
| μ | 0–0.5 | Mixing parameter |
Table 2.
Real network data sets used in experiments
| Name | Nodes | Edges | Communities | Description |
|---|---|---|---|---|
| Karate [57] | 34 | 78 | 2 | Relationships between karate club members |
| Dolphins [58] | 62 | 159 | 2 | Dolphin behavior network |
| Football [59] | 115 | 613 | 12 | American Football League network |
| Jazz [60] | 198 | 2742 | unknown | Jazz musician network |
| Amazon [61] | 334,863 | 925,872 | 75,149 | Amazon product network |
| YouTube [61] | 1,134,890 | 2,987,624 | 8385 | YouTube online social network |
Table 3.
Q value of real network partition
| Networks/Algorithms | GA [19] | SSGA [20] | BADE [20] | PSO [54] | IDDE [35] | SSO/CD | DESSO/CD | |
|---|---|---|---|---|---|---|---|---|
| Karate | mean | 0.4067 | 0.4198 | 0.4188 | 0.4200 | 0.4198 | 0.4196 | 0.4196 |
| std | 0 | 0 | 0.0018 | 0.0012 | 0.0001 | 0.0004 | 0.0004 | |
| Dolphins | mean | 0.5216 | 0.5200 | 0.5129 | 0.525 | 0.5282 | 0.5178 | 0.5377 |
| std | 0.0036 | 0.004 | 0.0120 | 0.0178 | 0.0189 | 0.0141 | 0.0057 | |
| Football | mean | 0.5911 | 0.5277 | 0.5513 | 0.605 | 0.6046 | 0.5406 | 0.6133 |
| std | 0.0062 | 0.0057 | 0.0085 | 0.0038 | 0.0042 | 0.0069 | 0.0045 | |
| Jazz | mean | 0.4439 | 0.4411 | 0.4511 | 0.4431 | 0.4448 | 0.4441 | 0.4651 |
| std | 0.0137 | 0.0109 | 0.0098 | 0.0074 | 0.0082 | 0.0101 | 0.0039 | |
| Amazon | mean | 0.3876 | 0.3885 | 0.4041 | 0.3845 | 0.3987 | 0.3815 | 0.4153 |
| std | 0.0151 | 0.0090 | 0.0103 | 0.02018 | 0.0079 | 0.0125 | 0.0081 | |
| YouTube | mean | 0.4012 | 0.4279 | 0.4315 | 0.4215 | 0.42131 | 0.4110 | 0.4501 |
| std | 0.0102 | 0.0081 | 0.0093 | 0.0112 | 0.0097 | 0.0104 | 0.0074 | |
© 2017 by the authors. Licensee MDPI, Basel, Switzerland. This article is an open access article distributed under the terms and conditions of the Creative Commons Attribution (CC BY) license (http://creativecommons.org/licenses/by/4.0/).
Share and Cite
MDPI and ACS Style
Li, Y.-H.; Wang, J.-Q.; Wang, X.-J.; Zhao, Y.-L.; Lu, X.-H.; Liu, D.-L. Community Detection Based on Differential Evolution Using Social Spider Optimization. Symmetry 2017, 9, 183. https://doi.org/10.3390/sym9090183
AMA Style
Li Y-H, Wang J-Q, Wang X-J, Zhao Y-L, Lu X-H, Liu D-L. Community Detection Based on Differential Evolution Using Social Spider Optimization. Symmetry. 2017; 9(9):183. https://doi.org/10.3390/sym9090183
Chicago/Turabian StyleLi, You-Hong, Jian-Qiang Wang, Xue-Jun Wang, Yue-Long Zhao, Xing-Hua Lu, and Da-Long Liu. 2017. "Community Detection Based on Differential Evolution Using Social Spider Optimization" Symmetry 9, no. 9: 183. https://doi.org/10.3390/sym9090183
Note that from the first issue of 2016, this journal uses article numbers instead of page numbers. See further details here.