Optimizing Location of Bulk Metallic Minerals Processing Based on Greenhouse Gas Avoidance


Abstract
: The bulk minerals iron ore and bauxite cause significant greenhouse emissions in their processing to steel and aluminum respectively. The level of these emissions is highly dependent on the source of electrical and thermal energy. However, they also cause significant greenhouse gas emissions from their transportation across the globe for processing. This study examines these minerals from the perspective of greenhouse gas avoidance, examining the location of processing as an option for reducing transportation-based and process-based emissions. The analysis proposes a “radius of reduction” to define the potential for transporting ore to reduce emissions by offshore processing. Overall scenarios for localized steel production indicate potential for 85% reduction of transport emissions in the steel industry and 14% of overall industry emissions. Local high-carbon electricity grids and inefficient production mean that the benefit of reduced transportation is partially counteracted by increased processing emissions. The transportation of all global bauxite to Norway and other nations with low-emissions electricity for production of aluminum could result in an overall reduction of industry emissions of up to 44%.1. Introduction
The bulk minerals—iron ore and bauxite—are the largest contributors to the greenhouse gas emissions of the global minerals industry aside from cement [1,2]. As such, there has been significant ongoing research into ways of mitigating the emissions from the processing of these vitally important materials [1,3,4]. One of the touted strategies in regards to aluminum from bauxite has been the shifting of aluminum refineries to countries such as Iceland that have high renewable energy potential in their electricity grids. The transportation of these minerals has however, been shown to be a significant contributor to the life cycle emissions [5]. So the question that must be asked is whether the excess transportation creates a net benefit in terms of greenhouse gas avoidance.
The two mineral-to-metal production chains are significantly different in nature, meaning that the expected avoidance and optimal location are expected to be quite different. For example, the life cycle emissions of steel are highly dependent on the use of coke and coal in the blast furnace. Although there is some indication that the use of charcoal from renewable biomass is feasible in the range of 20–60% substitution, it is not considered likely that 100% renewable fuel could be used on a large scale [6,7]. This means that the co-location of coking coal (another bulk mineral) and iron ore in close proximity would be expected to be ideal conditions for locating processing, as the maximum transport could be reduced (if there is no consideration of alloying elements). In the case of aluminum however, the major life cycle energy usage is electrical in the aluminum smelter [1,4,8]. This means that the potential to utilize renewable electricity, from a wide range of renewables, is high. Thus the carbon emissions of the electricity grid of a country, and its future potential for renewable energy, would determine the benefit for greenhouse avoidance of smelting alumina there. An additional consideration (not analyzed here) could be the indirect emissions—for example from the production of caustic soda (NaOH) (approximately 172 kg NaOH per tonne of Al [8]), which can contribute significantly to indirect emissions (900–3,000 kg CO2-eq/t NaOH) [9].
An examination of the recent production history [10-12] shows that globally approximately 75% of increase in production from 1998 to 2008 has been in countries with high (and in many cases increasing) carbon dioxide emissions per unit of electricity—namely Australia, China, India, Indonesia, Iran and the United Arab Emirates—with the largest contribution from China. Conversely, in the same period, approximately 22% of increased production was in Argentina, Brazil, Canada, Iceland, Norway, Russia and Tajikistan—where the emissions from grid electricity are much lower due to the high renewable energy and gas usage. An additional improvement in the emissions from global aluminum production came from the decrease in production in the United States over that period, which effectively removed highly emitting production from the mix.
The overall aim of this paper is to determine whether there would be a net benefit in terms of greenhouse gas emissions from the relocating of bulk minerals processing—either from reduction of transportation emissions by localization of processing, or by reducing processing emissions by relocating to countries with lower emissions energy sources. The paper examines the emissions from the global production of the bulk minerals iron ore and bauxite and the emissions from their processing to steel and aluminum, as well as international shipping between major ore producing and primary metal producing countries. Emissions from domestic transport of bulk minerals to ports for export have been shown elsewhere to be only a small fraction of the international transportation emissions [5] (in the context of Australia, which could be assumed to have one of the largest domestic emissions rates due to the long distances to ports). In terms of transportation, therefore, international transportation emissions are the focus of this work. In order to clarify whether there is any overall benefit in transporting or not-transporting ore for processing, the processing emissions based on current and potential alternative processing locations are also calculated.
2. Methodology
A list of the major iron ore, coal and bauxite exporting nations and the countries that produced steel and aluminum was produced using data from the USGS [12]. The electricity grid emissions figure for each of these nations was taken from the IEA [10,11]. The global average distance travelled per tonne of bauxite-alumina, iron ore and coal was used to estimate the total transport load and then specific trade routes were used to calculate the transport load under the scenarios of onsite or alternative processing locations.
The emissions from the production of the metals were then calculated in three stages:
Emissions from transportation—to the current metal producers or to alternative producers
Emissions from processing—at the ore producer or at the metal producer
Alternative processing sites were compared, and the optimal outcome identified
For steel production, the transportation of both coking coal and iron ore was considered, as both are critical to global iron and steel production. For aluminum production, the refining of alumina and smelting of aluminum were considered as potentially undertaken in different locations.
2.1. Transportation Emissions
The first step in determining the mitigation potential for the non-transport of bulk minerals was identifying how far they are currently transported. An initial estimate was undertaken using the historical figures for maritime transport of bulk minerals to derive the average distance per tonne of mineral exported, as well as production figures for iron ore and steel, bauxite, alumina and aluminum [8,12] and exports of coal and coal products [10,11,13]. These figures are shown in Table 1, with the emissions factors used throughout this paper for international shipping shown in Table 2. Combined, these emissions are equivalent to approximately 8% of the minerals industry's other energy-based emissions, or for iron ore and bauxite-alumina respectively about 14% of the steel industry and 2% of the non-ferrous minerals industry's emissions. It must be noted that the transport of final product metal is not considered in these initial estimates.
Mitigation of these emissions, without consideration of further optimization, could be anticipated to be related directly to the grade of the ore being transported—that is, approximately 60% for iron ore, 37% Al2O3 for bauxite and 52% Al in alumina by mass. Thus, by not transporting iron ore but instead transporting iron or steel, approximately 40% of the transportation emissions is avoided (or around 69 Mt CO2-eq). By processing bauxite and alumina through to aluminum onsite, the final exported mass would be approximately 26 Mt, leading to an avoided transportation emission load of 6.2 Mt CO2-eq. The overall effect of this reduction in transportation from both sectors (not including any subsequent effect on coking coal transport) would be a reduction of 20% of the initial transportation emissions (for coal, iron ore and bauxite-alumina)—or the equivalent of 1.6% of the minerals industry's energy emissions (as shown in Table 3).
Examining the broad effect on coking coal transportation, currently 220 Mt of coking coal is shipped worldwide [15] from 6 major exporting countries (see Table 4). The localization of steel production would have two counteracting effects on coking coal transportation. Firstly, those countries that produce less than sufficient coking coal in order to process their domestic iron ore would require increased imports of coking coal to cover their deficit. Secondly, countries that currently import iron ore would no longer need to import coking coal for this imported ore. The calculated value of the increase required for the former countries would be 210 Mt, while the decreased requirement for the latter countries would be 145 Mt. On the assumption that the transported distance would be equivalent for each tonne of coal, the overall increase in transported coking coal would be 65Mt and the subsequent increase in emissions would be 9.9 Mt CO2-eq. If charcoal from domestic sources could be substituted for coke at 20% or 60% respectively as suggested elsewhere [6,7], then a subsequent reduction in the import requirement of coking coal would be reduced significantly. (These results are summarized in Table 5).
2.2. Processing Emissions
Emissions from the production of steel, alumina and aluminum are dependent on the source of electricity and the source of thermal energy used in processing. It can be seen from Table 4 that the contribution of thermal energy is greatest in the iron and steel sector, and that electricity plays a stronger role in the non-ferrous metals sector. For steel, the thermal energy is the highest source of emissions as the current large-scale production technology—blast furnaces/oxygen blown converter—is optimized to utilize coal and coke, with minimal substitutability of coke due to its non-process function in providing bed mechanical stability [7]. The emissions and energy from the production of coke from metallurgical coal are included in the steel sector balance in Table 4 as per convention [10]. These are significant contributors to steel sector totals and a crucial part in steel production. Energy use in the iron and steel industry is typically available on a country-by-country basis [10,11]. Using this data, and emissions factors for coal and coke consumption [16], we can estimate the national emissions per tonne of steel produced. From the production figures for iron ore and steel, we can determine the amount of iron ore export that could be avoided in favor of local production of steel. The subsequent benefit to world iron and steel industry emissions can be calculated assuming the current national steel emissions per unit remain constant for the increased production. Although this does not include improvements from the use of modern technology or the potential differences caused by a change in the production process mix, it is considered a reasonable estimate. This aggregated figure comes to approximately 235 Mt CO2-eq that could be avoided (or approximately 9% of the industry's emissions). Much of this benefit would come from not producing steel in China—where the emissions per tonne of steel are much higher than the world average.
Global usage of energy in the production of metals is shown in Table 4. The energy used to produce non-ferrous metals is not disaggregated at the global scale hence to identify the final energy usage in alumina and aluminum production we must rely on alternative sources—e.g., [1,4,8]. In terms of tonnage, aluminum production contributes over 50% of the non-ferrous metals sector, but this cannot be directly correlated to its energy usage. Therefore, using the global industry average energy usage [8], we can determine the current industry emissions from the refining and smelting stages of the process at the global and national level. The global aggregate emissions calculated in this way are 645 Mt CO2-eq (25% larger than the figure for the global non-ferrous metals industry) of which 53% are from alumina refining and 47% from aluminum smelting. 52% of the total is from the thermal energy usage in alumina refining. The difference in this figure calculated by a bottom-up methodology as compared with the reported energy statistics for the global non-ferrous metals industry (see Table 4) is possibly due to a combination of under-reporting or non-reporting at the global level, the lack of coverage of the entire industry in the International Aluminum Institute's survey, and lower carbon fuel mix and efficiency changes between 2005 and 2008. Ideally, the top-down approach would be applied to both iron-steel and bauxite-aluminum however the lack of disaggregated energy use data for alumina and aluminum make this difficult to justify. Therefore the bottom-up approach is used for the remainder of the assessment for bauxite-aluminum, while the iron-steel analysis utilizes the top-down approach due to data availability and the opportunity to examine two alternative applications of the “radius of reduced emissions” introduced below.
Using a similar process to that outlined for iron and steel, the localization of bauxite processing through to aluminum would result in an increase in emissions to 730 Mt CO2-eq (14% increase). The bulk of this increase would come from the higher emissions due to electricity from higher carbon-intensity local electricity grids, which would contribute 56% to the total.
2.3. Combined Emissions
So far, we have examined the emissions from transportation and processing separately, however to obtain the true picture of the potential of localization or alternative siting of minerals processing, we must combine the two aspects. We introduce here the “radius of reduced emissions” for the transportation and processing of minerals. Inside this radius, emission may be reduced for a given original and final energy mix, while outside the radius the emissions from transportation will overtake the benefit of processing offshore.
Optimizing the location of processing for bauxite to alumina and alumina to aluminum, we can define the radius of reduced emissions based on the life cycle energy usage at each stage of processing. The total emissions per tonne of input material from the transportation and processing of the mineral, is given by Equation (1):
For the situations considered here, due to the lack of country-specific energy data, the thermal and electric energy usage figures are assumed to be the same in both locations. This leads to the following simplifications of the equations (with Eth = 4.3 and EEl = 0.17 substituted based on global average [8]):
For Bauxite processing:
For Aluminium smelting the equations are further simplified due to the sole use of electricity (with Eth = 0 and EEl = 28.6 substituted based on global average [8]):
These equations can be utilized to determine which possible locations the bauxite and alumina could be exported to based on alternative energy mixes. For example, in the alumina situation, for coal-based electricity (35% efficiency) and gas-based electricity (50% efficiency) the emissions factors are 253 and 103 kg CO2/GJ electricity respectively. Thus, the radius of reduction for shipping alumina from a country with coal-based electricity to another country with natural gas based electricity is over 200,000 km—so in all cases this is a feasible solution (longest direct trade routes are less than 25,000 km [17]). Using the reverse process, we can identify that, based on the historical average transportation of alumina and bauxite (5,060 km/tonne), the minimum difference in emissions factors required to make reductions in emissions for this distance would be 4 kg CO2-eq/GJ electricity. From this, analysis we can state that Mozambique, Norway and Iceland—all with less than 1.5 kg CO2-eq/GJ electricity would be the location of choice for all global aluminum smelting at average or double the average transportation rates, as their nearest rivals are 7.6 kg CO2-eq/GJ or more. For bauxite, assuming coal use for all energy in location A and gas use for all energy in location B, the radius of reduction would be 8,800 km.
Likewise, we can develop the radius of reduction for iron and steel, but in this case we choose to use the current energy and emissions factors for steel produced in each country (derived from the top-down approach) rather than general energy usage rates (derived from the bottom-up approach) due to the lack of available data in the latter case. We must also take into account the need to transport coke. Thus the balance equation would take the form:
Thus, equating the reduction in emissions again we can derive the reduction radius:
The grade factor (fSteel) is available for all iron ore producing countries however, an average grade of 0.6 is used for those countries that produce steel entirely from imported iron ore. The coke ratio is assumed to be 0.24 for those countries where consumption data is not available. By way of example, using the data in Table 6, the radius of reduction for countries with characteristics similar to Australia and China would be 550 km, meaning that iron ore could only be shipped up to 550 km from China in order to reduce emissions—it could therefore not realistically be shipped to Australia for processing.
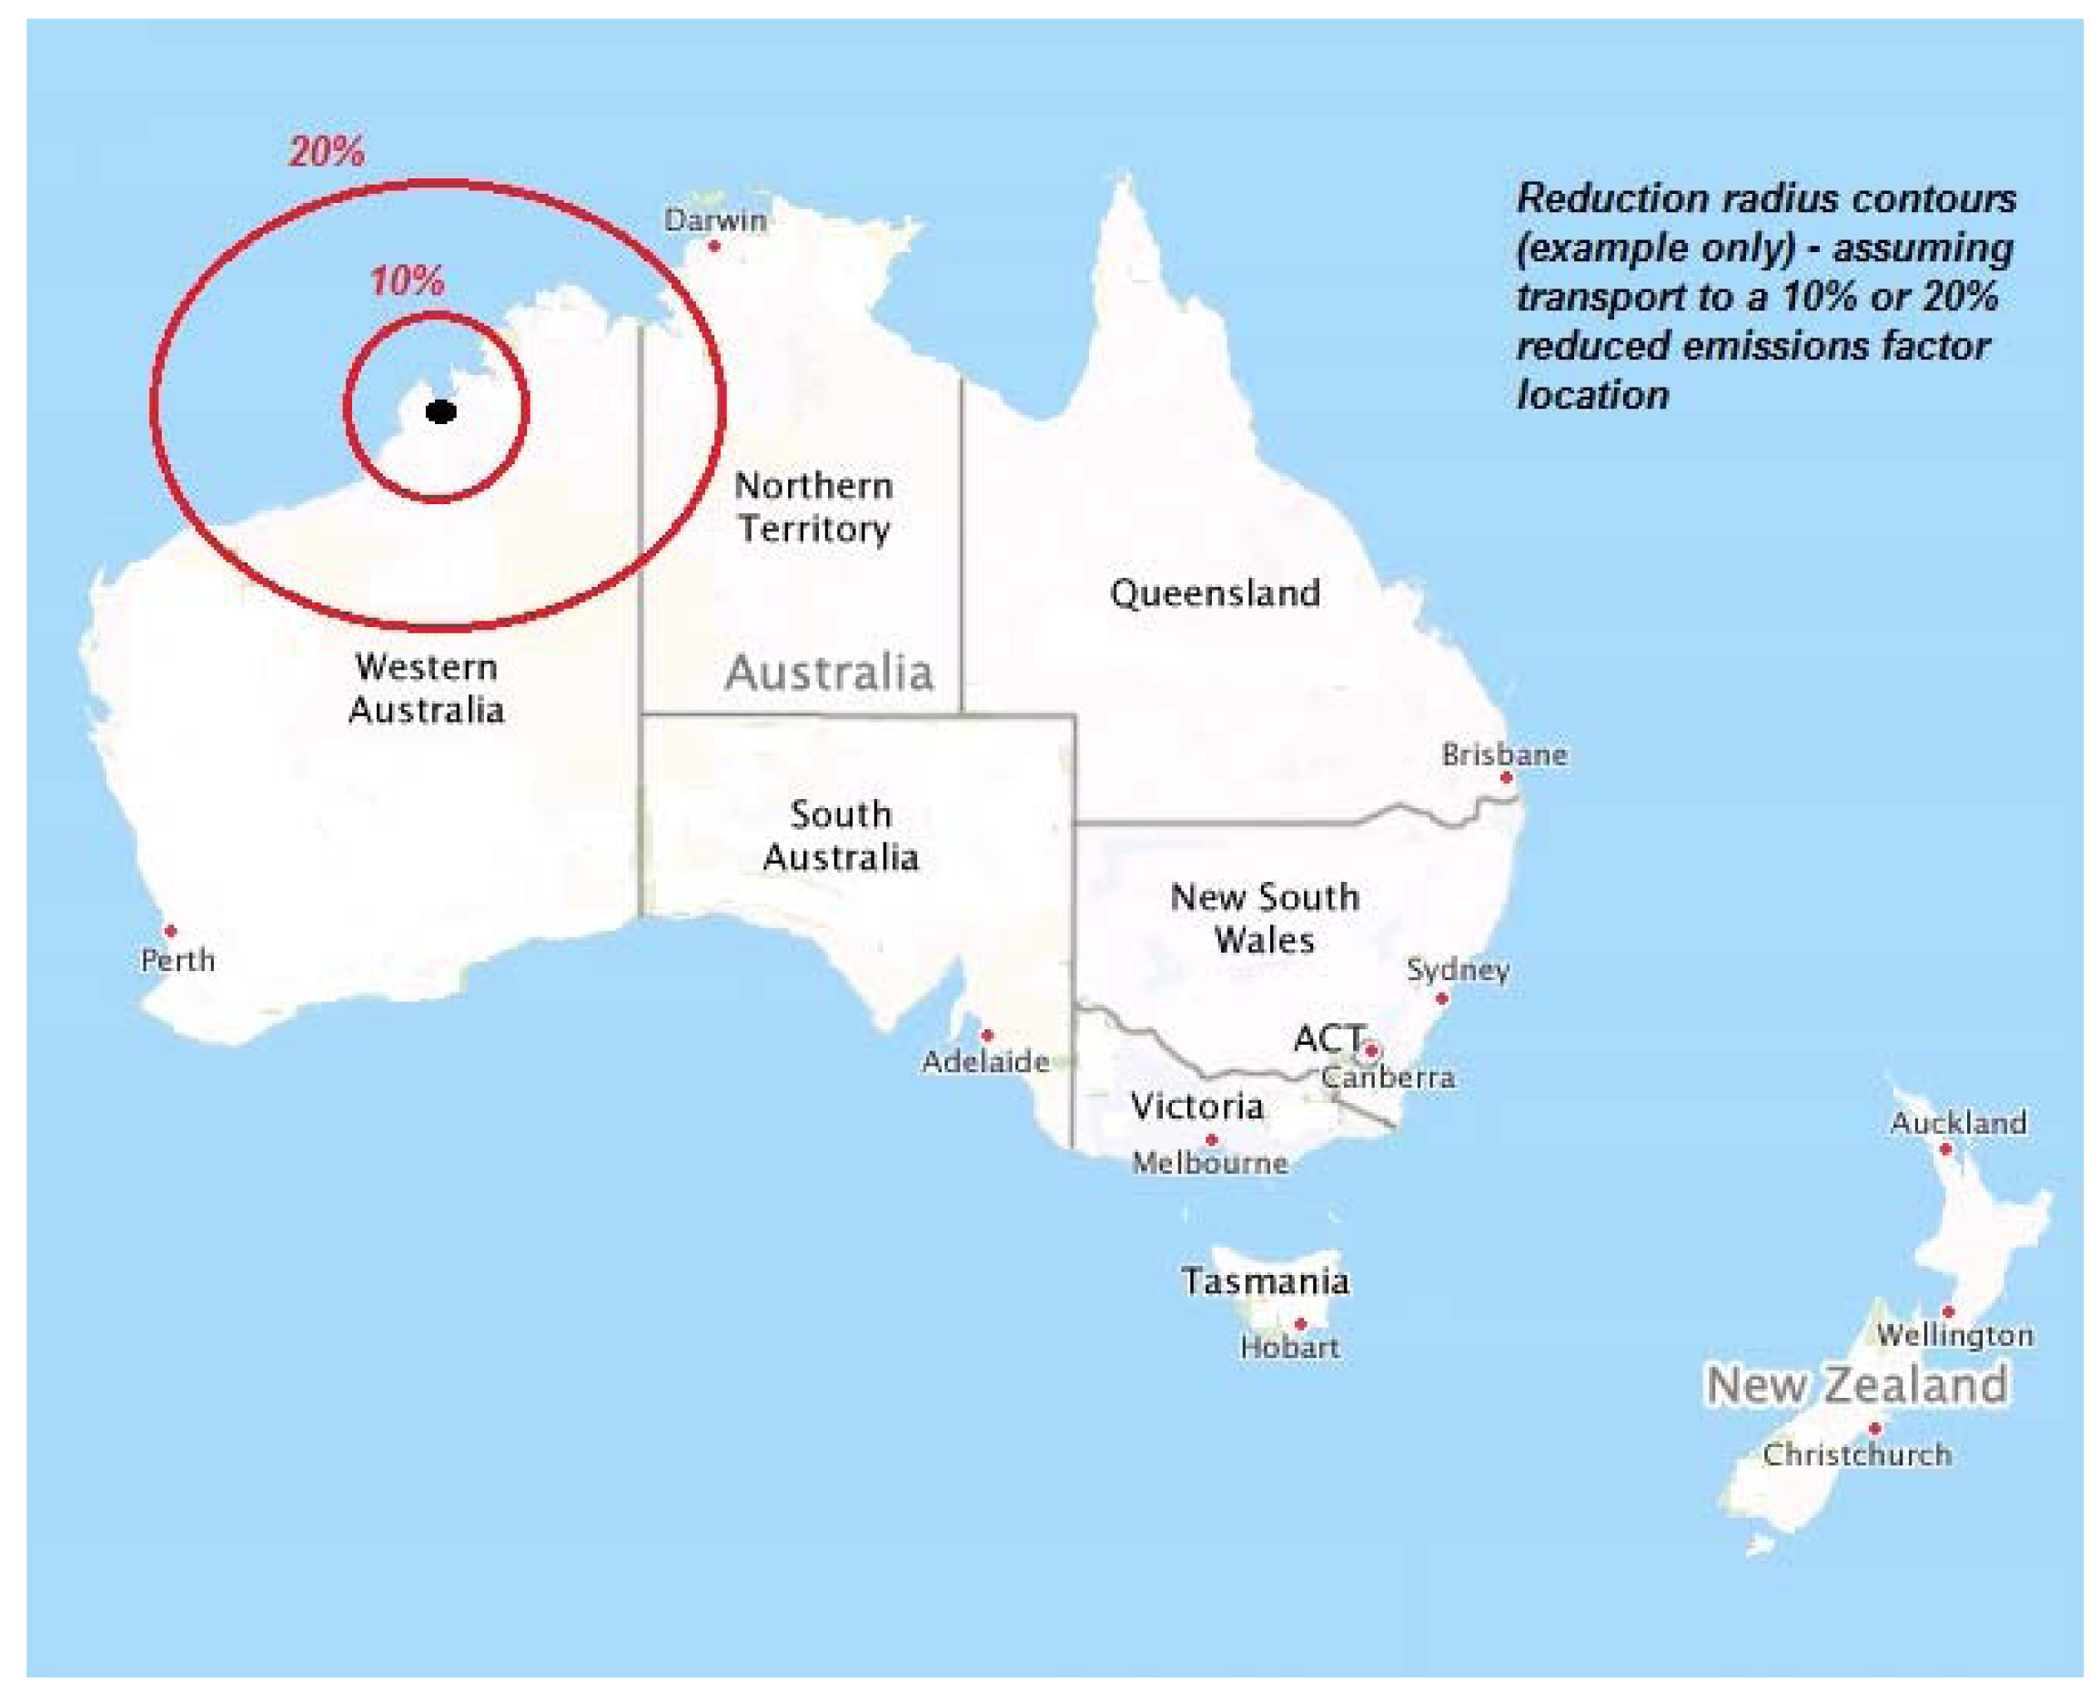
This approach using the radius of reduction could be used to develop maps showing the potential for a resource to be transported to locations with lower emissions energy—these could be called emissions reduction contours (see Figure 1).
For the assessment here, we calculated the radius of reduction for each mineral producing nation, with a key focus on the primary resource countries. The theoretical radius of reduction for aluminum smelting was also calculated for every country with data within the aluminum supply chain in a cross-wise comparison. These radii were used as a first-glance check in the subsequent analysis and the results of the full analysis confirmed their indicated increase or reduction in emissions. This cross-wise comparison is given as an Appendix.
2.4. Scenarios
In order to analyze the impact of processing in different locations, a number of selected scenarios were undertaken. The localization of production was addressed earlier, so the scenarios here are aimed at potential alternative locations.
For the aluminum production chain, it was considered (both for the current country-by-country emissions estimate and the alternative scenarios) that the processing of bauxite currently in countries that have coal reserves is likely to be fueled by coal—even if other fossil energy sources are available, the low cost of coal would make it the probable choice. For the reduction of emissions, it was proposed that thermal energy usage would be solely from natural gas. Radii of reduction were calculated for all countries assuming coal used domestically and gas used in the new location (Table 7 indicates the countries without a domestic gas supply—where gas-based processing would be unlikely). Norway is the country most attractive in terms of its reserves of gas and low carbon electricity. Less attractive (from the electricity emissions perspective) but still highly desirable locations for processing would be Brazil, Canada and Venezuela. So, the following scenarios were examined:
All alumina refining and aluminum smelting takes place in (a) Norway or (b) Brazil or (c) Canada (calculations made for all global processing occurring in each country)
Alumina refining and aluminum smelting take place in Norway, Brazil or Canada—whichever is closest to the bauxite production site.
2.5. No domestic Coal or Gas
For the iron and steel industry, the data on emissions per tonne of production in the major producing countries was used to identify the potential emissions reduction under 3 scenarios:
Localization
Localization plus 20% charcoal substitution for coal
Localization plus 60% charcoal substitution for coal
The radius of reduction under these scenarios was used as an indicator of the most preferable locations.
3. Results and Discussion
The results of the scenario analysis indicated that there is an overall benefit from relocating the production of aluminum. As shown in Table 8, there is an increase in emissions from the transportation of the entire bauxite production, but this is offset by the reduction in processing emissions from alumina refining. Furthermore, the largest reduction in emissions is seen in the aluminum smelting stage, with a significant potential reduction from all scenarios, but most notably from shipping all bauxite to Norway for processing on gas and low-emissions electricity. An alternative not examined here, but also worth further consideration, would be examining the potential for biomass to substitute for the thermal component of alumina refining—this would be particularly relevant given the location of most major bauxite resources in tropical or subtropical areas (due to their weathering origins) would also be expected to coincide with areas of high biomass growth rate potential.
The scenario analysis for the iron and steel industry was based on the localization and use of alternative, renewable fuel in the form of charcoal, recognizing that under the current circumstances the radius of reduction indicates minimal benefit for exporting to other steel producing nations.
Assuming that countries producing and exporting coking coal do not need to import it under current circumstances, and that the non-exporting countries import coal at the global average transported distance, using a cross-wise comparison of the major steel and iron ore producing countries, the top countries under different conditions for the production of steel are shown in Table 9. The availability of domestic coking coal in these countries is the major factor in favoring production there, which may change given greater scrutiny of domestic coking coal transport—for instance, in the example above, if iron ore were processed to steel in Australia it would likely be done in the Pilbara region, thus requiring coal to be transported from the east coast to the west coast—4,500 km by sea. Ideally, if the data were available, the specific transportation routes for each country could be assessed however, data was not available for this assessment.
The maximum and average radii of reduction under the different scenarios are shown in Table 10. The decrease in radii for the 60% charcoal scenario is indicative of the lower emissions potential for local production, while the increase in radii for the localization situation indicates the greater centralization and increased transportation of coking coal. From this analysis, the maximum radius of reduction is 5,555 km, meaning that the scope for reduction of emissions from transporting iron ore offshore is minimal. Two strategies were considered as potential for making export of iron ore to reduce emissions more viable. Firstly, the development of a significant charcoal industry and appropriate utilization technology in one or more countries could drive down emissions from steel making and thus increase the radius of reduction. Secondly, using the radius of reduction it may be possible to identify a number of countries on each continent with significantly higher efficiency and lower emissions per tonne of steel, to which the worse performing countries could export their iron ore.
Results of the steel industry scenarios are shown in Table 11. Two important points can be seen from the scenarios. Firstly, that the localization of production does not eliminate all emissions from transportation—in particular, the transport of coking coal is still highly significant. Secondly, the reduction in coking coal imports through localization combined with the use of charcoal can be significantly more successful, and as gradually more charcoal is added to the mix, considerably more transport can be avoided as those countries with limited domestic coal resources become capable of supplying their coking needs domestically.
This study has a number of limitations that should be considered in the interpretation of these results. Firstly, this study has not examined the practical potential of producing the required amount of charcoal in the locations where it is needed. Additionally, the examination here has been limited to greenhouse gas emissions—which are one of many aspects of environmental and social impacts that would be affected by the proposed shifts in processing. There should also be consideration of burden shifting that might arise as a result of the scenarios—for example, the impacts of land use change and resource depletion from charcoal production or waste storage from mineral processing. Furthermore, the study has not considered financial costs—which are the current major driver in location of processing. Further research to cover these areas, and to examine the relocation of alternative minerals and alternative countries is recommended.
The two different variations on the method applied to the different commodities in this paper were a result of a lack of the ideal data. However, the methods attempt to approach the best estimate for regional data—as it is apparent that the local electricity, fuel reserves and fuel mix, are very important for the overall emissions. In the case of bauxite-aluminum, the regional electricity mix data was used with global energy use figures, and country-to-country transportation calculations. However, in the case of iron ore-steel, the regional fuel mixes were used and the transportation was limited to the provision of coal/coke which could not be exactly identified.
4. Conclusions
This paper has demonstrated some of the potential reductions that could be possible from transferring processing of the bulk minerals to alternative locations. For aluminum smelting, Norway, Iceland or other countries with very low emissions electricity would be ideal, and the additional emissions from transport would be more than offset by the reductions in processing. With current grid electricity, localization of aluminum and alumina production in bauxite-producing countries, would result in an overall increase in emissions by roughly 14%. Relocating to Norway would result in a reduction over current emissions of approximately 44%.
For the steel industry, iron ore exportation for processing is seen to be counteractive in most cases as the radius of reduction of emissions is too low in most cases. The localization of processing and the use of charcoal substitution at 20% or 60% are seen to reduce industry emissions by 14%, 31% and 66% respectively.


| Total transport (billion km) | Total tonnage (Mt) | Average distance per tonne (km/t) | Total energy consumption (PJ) | Total emissions (kt CO2-eq) | |||
|---|---|---|---|---|---|---|---|
| 2003 | 2008 | 2003 | 2008 | 2003/2008 | 2008 | 2,008 | |
| Bauxite-Alumina | 319 | 430 | 63 | 85 | 5,060 | 73 | 9,000 |
| Fe ore | 4,890 | 8,200 | 524 | 880 | 9,330 | 1,400 | 172,000 |
| Coal | 4,520 | 6,430 | 619 | 880 | 7,310 | 1,090 | 135,000 |
| Coking coal | - | 1,610 | - | 220 | 7,310 | 270 | 34,000 |
| Coke | - | 220 | - | 30 | 7,310 | 40 | 5,000 |
Notes: (1) Although relatively small, the distances attributed to coke transport are expected to be an overestimate; (2) Calculation of energy and emissions: Total tonnage × Average distance per tonne × Emissions Factor (from Table 2).
| Final energy consumption (combustion of fuel) | 0.17 MJ/ntk |
| Carbon dioxide emissions from final energy consumption | 0.021 kg CO2-eq/ntk |
| Industry sector | Production (Mt) | Final energy consumption | CO2 emissions | |||
|---|---|---|---|---|---|---|
| Electricity (PJ) | Fossil fuel thermal energy (PJ) | Combustible waste, renewables and heat (PJ) | From electricity (Mt CO2-eq) | From fossil fuel usage (Mt CO2-eq) | ||
| Iron and steel | 1,330 | 3,372 | 20,923 | 749 | 506 | 2,053 |
| Non-ferrous metals | 77 | 2,841 | 1,683 | 115 | 396 | 115 |
| Total | 1,407 | 6,212 | 22,606 | 864 | 902 | 2,168 |
| Percentage | 21% | 76% | 3% | 29% | 71% | |
| 29,682(PJ) | 3,070 (Mt CO2-eq) | |||||
| Country | 2008 exports of metallurgical coal (Mt) |
|---|---|
| Australia | 134.8 |
| Canada | 26.6 |
| China | 3.5 |
| Poland | 1.7 |
| Russian Federation | 15.5 |
| United States | 38.6 |
| Total seaborne | 220.7 |
| Scenario | Coal transported (Mt) | Associated emissions (Mt CO2-eq) |
|---|---|---|
| Current transported coal | 220 | 35 |
| Non-transported coal | −145 | −22 |
| Localised processing—new total coal imports | 210 | 32 |
| Localised processing + 20% domestic charcoal substitution | 170 | 26 |
| Localised processing + 60% domestic charcoal substitution | 81 | 13 |
| Location | (A) China | (B) Australia |
|---|---|---|
| DCoke (km) | 7000 | 4,500 (domestic) |
| fcoke | 0.23 | 0.24 |
| fSteel | 0.33 | 0.61 |
| EFSteel (kg CO2-eq/t) | 2.7 | 2.1 |
| No domestic coal or gas | No domestic gas | |
|---|---|---|
| Dominican Republic | Bosnia and Herzegovina | |
| Ghana | Greece | |
| Guinea | Hungary | |
| Guyana | Montenegro | |
| Jamaica | Mozambique | |
| Suriname | Sierra Leone | |
| Tanzania | ||
| Turkey | ||
| Percentage of world bauxite | 20% | 3% |
| Norway | Brazil | Canada | Closest to Bauxite | |
|---|---|---|---|---|
| Transportation Emissions (kt CO2-eq) | 63,200 | 50,900 | 39,700 | 35,800 |
| Increase in transportation emissions compared to present (1) (kt CO2-eq) | 54,200 | 41,900 | 30,700 | 26,800 |
| Reduction in bauxite processing emissions (ktCO2-eq) | 40,200 | 39,300 | 38,400 | 38,700 |
| Reduction in Al2O3 processing emissions (kt CO2-eq) | 300,900 | 250,200 | 194,700 | 168,700 |
| Overall reduction in emissions (kt CO2-eq) | 286,800 | 247,700 | 202,500 | 180,600 |
| Percentage of current emissions (2) | 44% | 38% | 31% | 28% |
Notes:(1)current transportation emissions are 9,000 kt CO2-eq as per Table 1(2)Percentage of current aluminium industry—refining, smelting and transportation—654 Mt CO2-eq as calculated in section 2.2.
| Top 10 countries | |||
|---|---|---|---|
| Current | Localized transport | 20% charcoal | 60% charcoal |
| Kazakhstan | Norway | Norway | Ukraine |
| Colombia | Pakistan | Pakistan | Australia |
| Australia | Colombia | Colombia | Canada |
| Mongolia | Australia | Australia | Iran |
| Mexico | Russia | Russia | North Korea |
| China | Malaysia | Malaysia | Russia |
| Iran | Morocco | Morocco | Tunisia |
| USA | China | China | Germany |
| Russia | USA | USA | Mexico |
| Indonesia | Canada | Canada | South Africa |
| Current | Localised | 20% Charcoal | 60% Charcoal | ||
|---|---|---|---|---|---|
| Maximum | 4,436 | 5,555 | 4,445 | 3,975 | |
| Average | 974 | 1,235 | 1,161 | 864 | |
| Scenario | Emissions (MtCO2-eq) | Percentage reduction | ||
|---|---|---|---|---|
| Processing | Transportation | Combined | ||
| Current | 2,559 | 207 | 2,766 | 0% |
| Localization | 2,337 | 32 | 2,369 | 14% |
| Charcoal-20% | 1,869 | 26 | 1,895 | 31% |
| Charcoal-60% | 934 | 13 | 947 | 66% |
References
- Norgate, T.E.; Jahanshahi, S.; Rankin, W.J. Assessing the environmental impact of metal production processes. J. Clean. Prod. 2007, 15, 838–848. [Google Scholar]
- Allwood, J.M.; Cullen, J.M.; Milford, R.L. Options for achieving a 50% cut in industrial carbon emissions by 2050. Environ. Sci. Technol. 2010, 44, 1888–1894. [Google Scholar]
- Worrell, E.; Price, L.; Martin, N. Energy efficiency and carbon dioxide emissions reduction opportunities in the US iron and steel sector. Energy 2001, 26, 513–536. [Google Scholar]
- Gao, F.; Nie, Z.; Wang, Z.; Li, H.; Gong, X.; Zuo, T. Greenhouse gas emissions and reduction potential of primary aluminum production in China. Sci. China Ser. E 2009, 52, 2161–2166. [Google Scholar]
- Li, Y.; Corder, G.D.; McLellan, B.C. Transport in the minerals industry—Contributions to greenhouse gas emissions and potential for mitigation. Miner. Eng. 2011. in press. [Google Scholar]
- Gielen, D.; Moriguchi, Y. CO2 in the iron and steel industry: An analysis of Japanese emission reduction potentials. Energy Policy 2002, 30, 849–863. [Google Scholar]
- Norgate, T.; Langberg, D. Environmental and economic aspects of charcoal use in steelmaking. ISIJ Int. 2009, 49, 587–595. [Google Scholar]
- Life Cycle Assessment of Aluminium: Inventory Data for the Primary Aluminium Industry; International Aluminium Institute: London, UK, 2007.
- McLellan, B.C.; Williams, R.P.; Lay, J.; van Riessen, A.; Corder, G.D. Costs and carbon emissions for geopolymer pastes in comparison to ordinary portland cement. J. Clean. Prod. 2011, 19, 1080–1090. [Google Scholar]
- Energy Balances of Non-OECD Countries; International Energy Agency: Paris, France, 2010.
- Energy Balances of OECD Countries; International Energy Agency: Paris, France, 2010.
- Mineral Commodity Summaries 2010; United States Geological Survey: Washington, DC, USA, 2010.
- The Iron and Steel Industry in 2009; Directorate for Science, Technology and Industry, OECD: Paris, France, 2010.
- Fearnley's Annual Review 2004; FearnResearch: Oslo, Norway, 2005; p. 92.
- Australian Commodity Statistics; Australian Bureau of Agricultural and Resource Economics and Sciences: Canberra, Australia, 2010.
- National Greenhouse Accounts (NGA) Factors; Department of Climate Change, Australian Government: Canberra, Australia, 2010.
- SeaRates.Com. Port-to-Port Distance Calculator; SeaRates, Inc.: Bay Harbor Islands, FL, USA, 2011. Available online: http://www.searates.com/reference/portdistance/ (accessed on 24 August 2011).
© 2011 by the authors; licensee MDPI, Basel, Switzerland. This article is an open access article distributed under the terms and conditions of the Creative Commons Attribution license (http://creativecommons.org/licenses/by/3.0/).
Share and Cite
McLellan, B.C. Optimizing Location of Bulk Metallic Minerals Processing Based on Greenhouse Gas Avoidance. Minerals 2011, 1, 144-156. https://doi.org/10.3390/min1010144
McLellan BC. Optimizing Location of Bulk Metallic Minerals Processing Based on Greenhouse Gas Avoidance. Minerals. 2011; 1(1):144-156. https://doi.org/10.3390/min1010144
Chicago/Turabian StyleMcLellan, Benjamin C. 2011. "Optimizing Location of Bulk Metallic Minerals Processing Based on Greenhouse Gas Avoidance" Minerals 1, no. 1: 144-156. https://doi.org/10.3390/min1010144