Article

Water Organization and Dynamics on Mineral Surfaces Interrogated by Graph Theoretical Analyses of Intermolecular Chemical Networks

Department of Chemistry, Washington State University, Pullman, WA 99164, USA
*
Author to whom correspondence should be addressed.
Minerals 2014, 4(1), 118-129; https://doi.org/10.3390/min4010118
Submission received: 26 January 2014 / Revised: 19 February 2014 / Accepted: 19 February 2014 / Published: 4 March 2014
(This article belongs to the Special Issue Advances in Low-temperature Computational Mineralogy)

Abstract

:
Intermolecular chemical networks defined by the hydrogen bonds formed at the α-quartz|water interface have been data-mined using graph theoretical methods so as to identify and quantify structural patterns and dynamic behavior. Using molecular-dynamics simulations data, the hydrogen bond (H-bond) distributions for the water-water and water-silanol H-bond networks have been determined followed by the calculation of the persistence of the H-bond, the dipole-angle oscillations that water makes with the surface silanol groups over time, and the contiguous H-bonded chains formed at the interface. Changes in these properties have been monitored as a function of surface coverage. Using the H-bond distribution between water and the surface silanol groups, the actual number of waters adsorbed to the surface is found to be 0.6 H2O/10 Å2, irrespective of the total concentration of waters within the system. The unbroken H-bond network of interfacial waters extends farther than in the bulk liquid; however, it is more fluxional at low surface coverages (i.e., the H-bond persistence in a monolayer of water is shorter than in the bulk) Concentrations of H2O at previously determined water adsorption sites have also been quantified. This work demonstrates the complementary information that can be obtained through graph theoretical analysis of the intermolecular H-bond networks relative to standard analyses of molecular simulation data.

1. Introduction

Adsorbed water plays an essential role in the reactivity of many minerals. Interfacial behavior is strongly influenced by the chemical composition at the mineral surface (oxidation state, the presence of defects, surface hydrophilic or hydrophobic groups), which can be probed using a variety of spectroscopic (e.g., X-ray photoelectron spectroscopy) as well as microscopic (e.g., scanning tunneling microscopy) and mass spectrometric methods (e.g., resonant ionization mass spectrometry). In combination with the surface composition, many experimental studies have examined the adsorption of water to mineral surfaces at controlled humidities and the subsequent physical properties of water including its infrared vibrational spectrum [1] and dielectric constant [2] (references provided specifically for the quartz|water interface). There are, however, few experimental methods for quantifying the interfacial structure and dynamics of water at a mineral surface. As such, classical statistical molecular simulations (molecular dynamics–MD, or Monte Carlo–MC) have historically played an important role in dissecting the molecular underpinnings of interfacial water organization that influence experimentally observed reactivities [3]. Statistics is relied upon heavily in the analysis of molecular simulation data so as to have confidence in the predicted organizational patterns. Thus large data sets are often analyzed and the average values are utilized to gain chemical insight. Spatial correlation functions (also known as density-, radial-, or pair-distribution functions) are often employed to understand the average probability of finding a specific atom type above the surface or near specified atoms. There is much utility in this approach, and it can be used to gain insight into localized interactions, surface clustering and adsorption sites of a water on the surface. However, it is the ability of water to form hydrogen bonds, and the complex network of these hydrogen bonds, that underlies its interaction with hydrophilic mineral surfaces and strongly influences surface diffusion and reactivity through passivation and shielding of other adsorbates to reactive sites.
In recent work [4], we have developed a graph theoretical formalism for interrogating the structure and dynamics of intermolecular interactions from molecular simulation data, including that for hydrogen bonds. Atomic or molecular species are converted into vertices, with an edge between them being present upon satisfaction of the geometric criterion for the hydrogen bond interaction. Thus a graph is formed from the hydrogen bond network that can then be analyzed using the topological analyses widely employed in graph theory. Among the most applicable to probe the hydrogen bond network properties of interfacial water on mineral surfaces are: (1) the water-water and water-silanol hydrogen bond distributions, (2) the persistence of the hydrogen bonding interactions, (3) the dipole orientation of water to surface functional groups as a function of time, (4) the geodesic (or shortest contiguous hydrogen bond) pathways, and (5) the geodesic index, ηgd. The goal of the current work is to apply these analysis tools to molecular-dynamics simulations of water on the surface of α-quartz as a function of water coverage, with particular comparison of the network properties of what may be labeled a monolayer of water (1 H2O/10 Å2) and the interfacial water in the presence of the bulk liquid.

2. Computational Methods

2.1. Simulation Data

The previously published data from Wander and Clark [5] have been utilized for re-analysis using the ChemNetworks software package [4]. The dynamics simulation data was produced using the LAMMPS software package [6] and the CLAYFF force field [7], which uses a flexible simple point charge (SPC) water model [8,9,10]. It consists of 1 ns production runs in the microcanonical (NVE) ensemble of adsorbed and bulk water on an α-quartz (001) surface at the target temperature of 300 K. In particular, the 1 H2O/10 Å2 (nominally a monolayer of coverage with 126 H2O on the two water|quartz interfaces in the box), 2 H2O/10 Å2 (a bilayer with 250 H2O), and 4 H2O/10 Å2 (a tetralayer with 502 H2O) levels of hydration were examined, in addition to bulk water (1164 H2O) on the fully protonated quartz slab. In all cases, the simulation box was of dimensions 24.6 Å × 25.5 Å × 118.0 Å (Figure 1). A 1 fs time step was utilized and trajectories of each simulation were saved every 25 fs, yielding 40,000 snapshots per ns.
Figure 1. A single quartz|water slab (half of the simulation box) for (A) 1H2O/10 Å2 level of hydration (monolayer); (B) 2 H2O/10 Å2 level of hydration (bilayer); (C) 4 H2O/10 Å2 level of hydration (tetralayer); and (D) bulk water.
Minerals 04 00118 g001

2.2. Graph Theoretical Analyses

Properties of the hydrogen bond network that consists of the water-water and water-silanol intermolecular interactions have been examined by complex network analyses implemented in the ChemNetworks software package [4]. ChemNetworks first converts each trajectory into a graph object based upon user-specified geometric parameters defining the intermolecular interactions that result in edges between the molecules (vertices) of interest. In this work, water-water interactions were studied using a definition of the H-bond where rOw…Hw < 2.5 Å and ϕw > 150° (Figure 2), as we have shown previously that this particular definition yields a water network wherein the number of tetra-coordinated H2O molecules is maximized while the number of under- and over-coordinated H2O molecules is minimized [4]. For the water-silanol interactions at the water|quartz interface, in addition to the distance criterion of (rOw…Hq or rOq…Hw) < 3.0 Å, an H-bond angle criterion of ϕq > 130° was used to prevent the formation of unphysical edges between H2O and –SiOH units at the interface (Figure 2). Testing criteria where the water-silanol H-bond angles (ϕq) were smaller than 130° resulted in the large populations of waters with unphysical, over-coordinated H-bonds (5 or 6 H-bonds, see Figure S1 in Supplemental Information).
Figure 2. Definition of the intermolecular hydrogen bonds utilized to convert the simulation trajectories into a graph. On the left: water-silanol H-bond parameters. On the right: water-water H-bond parameters.
Minerals 04 00118 g002
Initially, the hydrogen bond distributions within the water-water and the water-silanol network were obtained for each of the hydration levels. Then, the average persistence of both the H2O…H2O and the H2O…SiOH hydrogen bonds were determined. Figure 3 shows a “stream” of all the H-bonds formed in the course of a simulation of duration Tf-Ti. Each line within the stream represents an H-bond whose duration is represented by the length of the line. The persistence of the H-bond is then calculated as the average of all H-bond durations weighted by the relative concentration of each length of duration. Persistence is generally considered to be different from the “lifetime” of the H-bond because transient breaks are included in the calculation.
Figure 3. Length of duration of a hydrogen bond to be used in the calculation of its persistence, P, within a simulation of duration Tf-Ti.
Minerals 04 00118 g003
Another network analysis employed in this work is the determination of the shortest contiguous edge paths between all water pairs within the network for each level of hydration. These paths (geodesics) are obtained by converting the graph into the geodesic distance matrix using the Floyd–Warshall algorithm [11,12] as implemented in the ChemNetworks software package [4]. The count of geodesics normally includes the count of sub-geodesics that make up a given geodesic length. Thus, a geodesic of length four also contains a geodesic of length three, two, and one. Here, we remove all sub-geodesics to only consider what are termed the “isolated” geodesics of the system.
The orientations of the dipole moment vector, P, of water molecules with respect to the quartz–SiOH units were also examined as a function of time. The angle between the dipole moment vector (P) and the position vector (r), which points from the reference –SiOH unit to the water and lies on the hydrogen bond between the two, is defined as the dipole angle (Figure 4). For the H2O donating an H-bond to the reference –SiOH unit, the angle alpha (α) may have a maximal value of 180° indicating alignment of the dipole vector along the hydrogen bond (Figure 4). On the other end, for the H2O accepting a H-bond from the reference –SiOH unit, the angle beta (β) may have a minimum value of 0° such that the dipole moment vector is aligned perfectly with the hydrogen bond (Figure 4). This scheme allows H2O molecules to be distinguished with respect to the directionality of the H-bonds made with the reference –SiOH units on the quartz surface. This analysis also yields further information about the dynamics of the water-silanol hydrogen bond network.
Figure 4. Definition of dipole moment orientation of H2O with respect to –SiOH unit at the water|quartz interface.
Minerals 04 00118 g004

3. Results and Discussion

In our previous study of the water|quartz interface, atom number densities (for O- and H-atoms) and orientational sorting (distinguishing between H-atoms that point toward or away from the surface) were used to characterize surface adsorption sites of water and to understand how the dielectric constant of water changes when moving from bulk water to the surface [5]. Three surface water adsorption sites were identified (Figure 5) wherein the primary site (labeled S1 in [
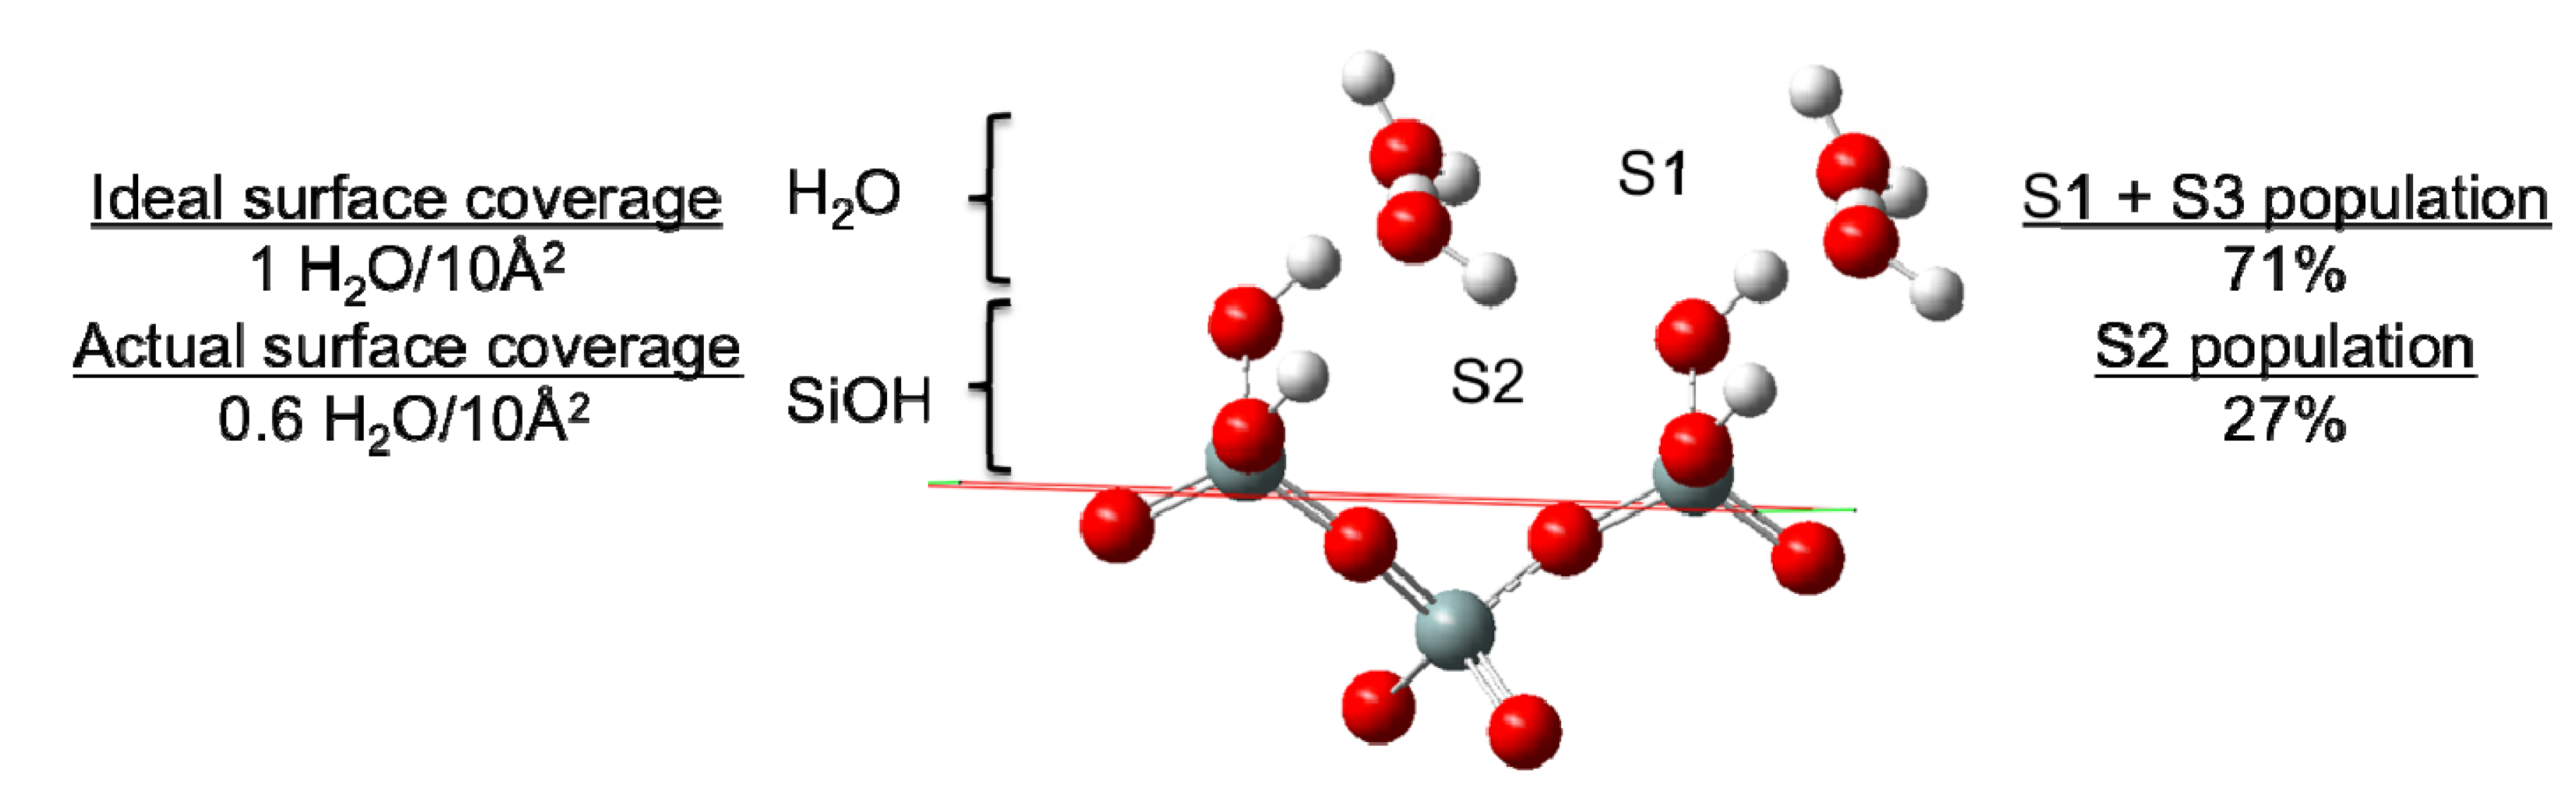
5]) consists of a mixture of water that has either (a) both H-atoms pointing away from the surface, or (b) one O-H bonding vector parallel to the surface and one H-atom pointing away from the surface. In this case, waters at the primary adsorption site (S1) would be expected to form at most a single H-bond with a surface –SiOH group. The secondary adsorption site (S2) was found to have both H-atoms of water pointed toward the surface, and was proposed to consist of H2O wherein each –OH group donates an H-bond to different silanol groups, effectively bridging those groups. The third and final site (S3) was found to derive exclusively from waters that had their –OH vectors parallel to the surface (H-side) and were believed to contribute exclusively to the stable water-water hydrogen bond network. In this case, only a single H-bond from a surface silanol to water would be expected.
Figure 5. Identification of two of the three surface adsorption sites of H2O on quartz (reproduced with permission from the author). Site S3 is not at a fixed location and is thus not illustrated. Comparisons of the ideal and actual surface coverage values (waters with direct H-bonding interaction with surface –SiOH groups) are presented alongside the percentage of surface bound waters in sites S2 and the combined S1 + S3 sites (which cannot be distinguished using the H-bond distributions).
Minerals 04 00118 g005
Here, a complementary understanding of the hydrogen bond network of water is obtained; the atom densities are deconstructed into their contributions from both water-water and water-silanol interactions, and the dynamic behavior of the resulting intermolecular networks is elucidated. Beginning with the simplest topological analysis, the distribution of H-bonds over each water and surface silanol group was first examined. 
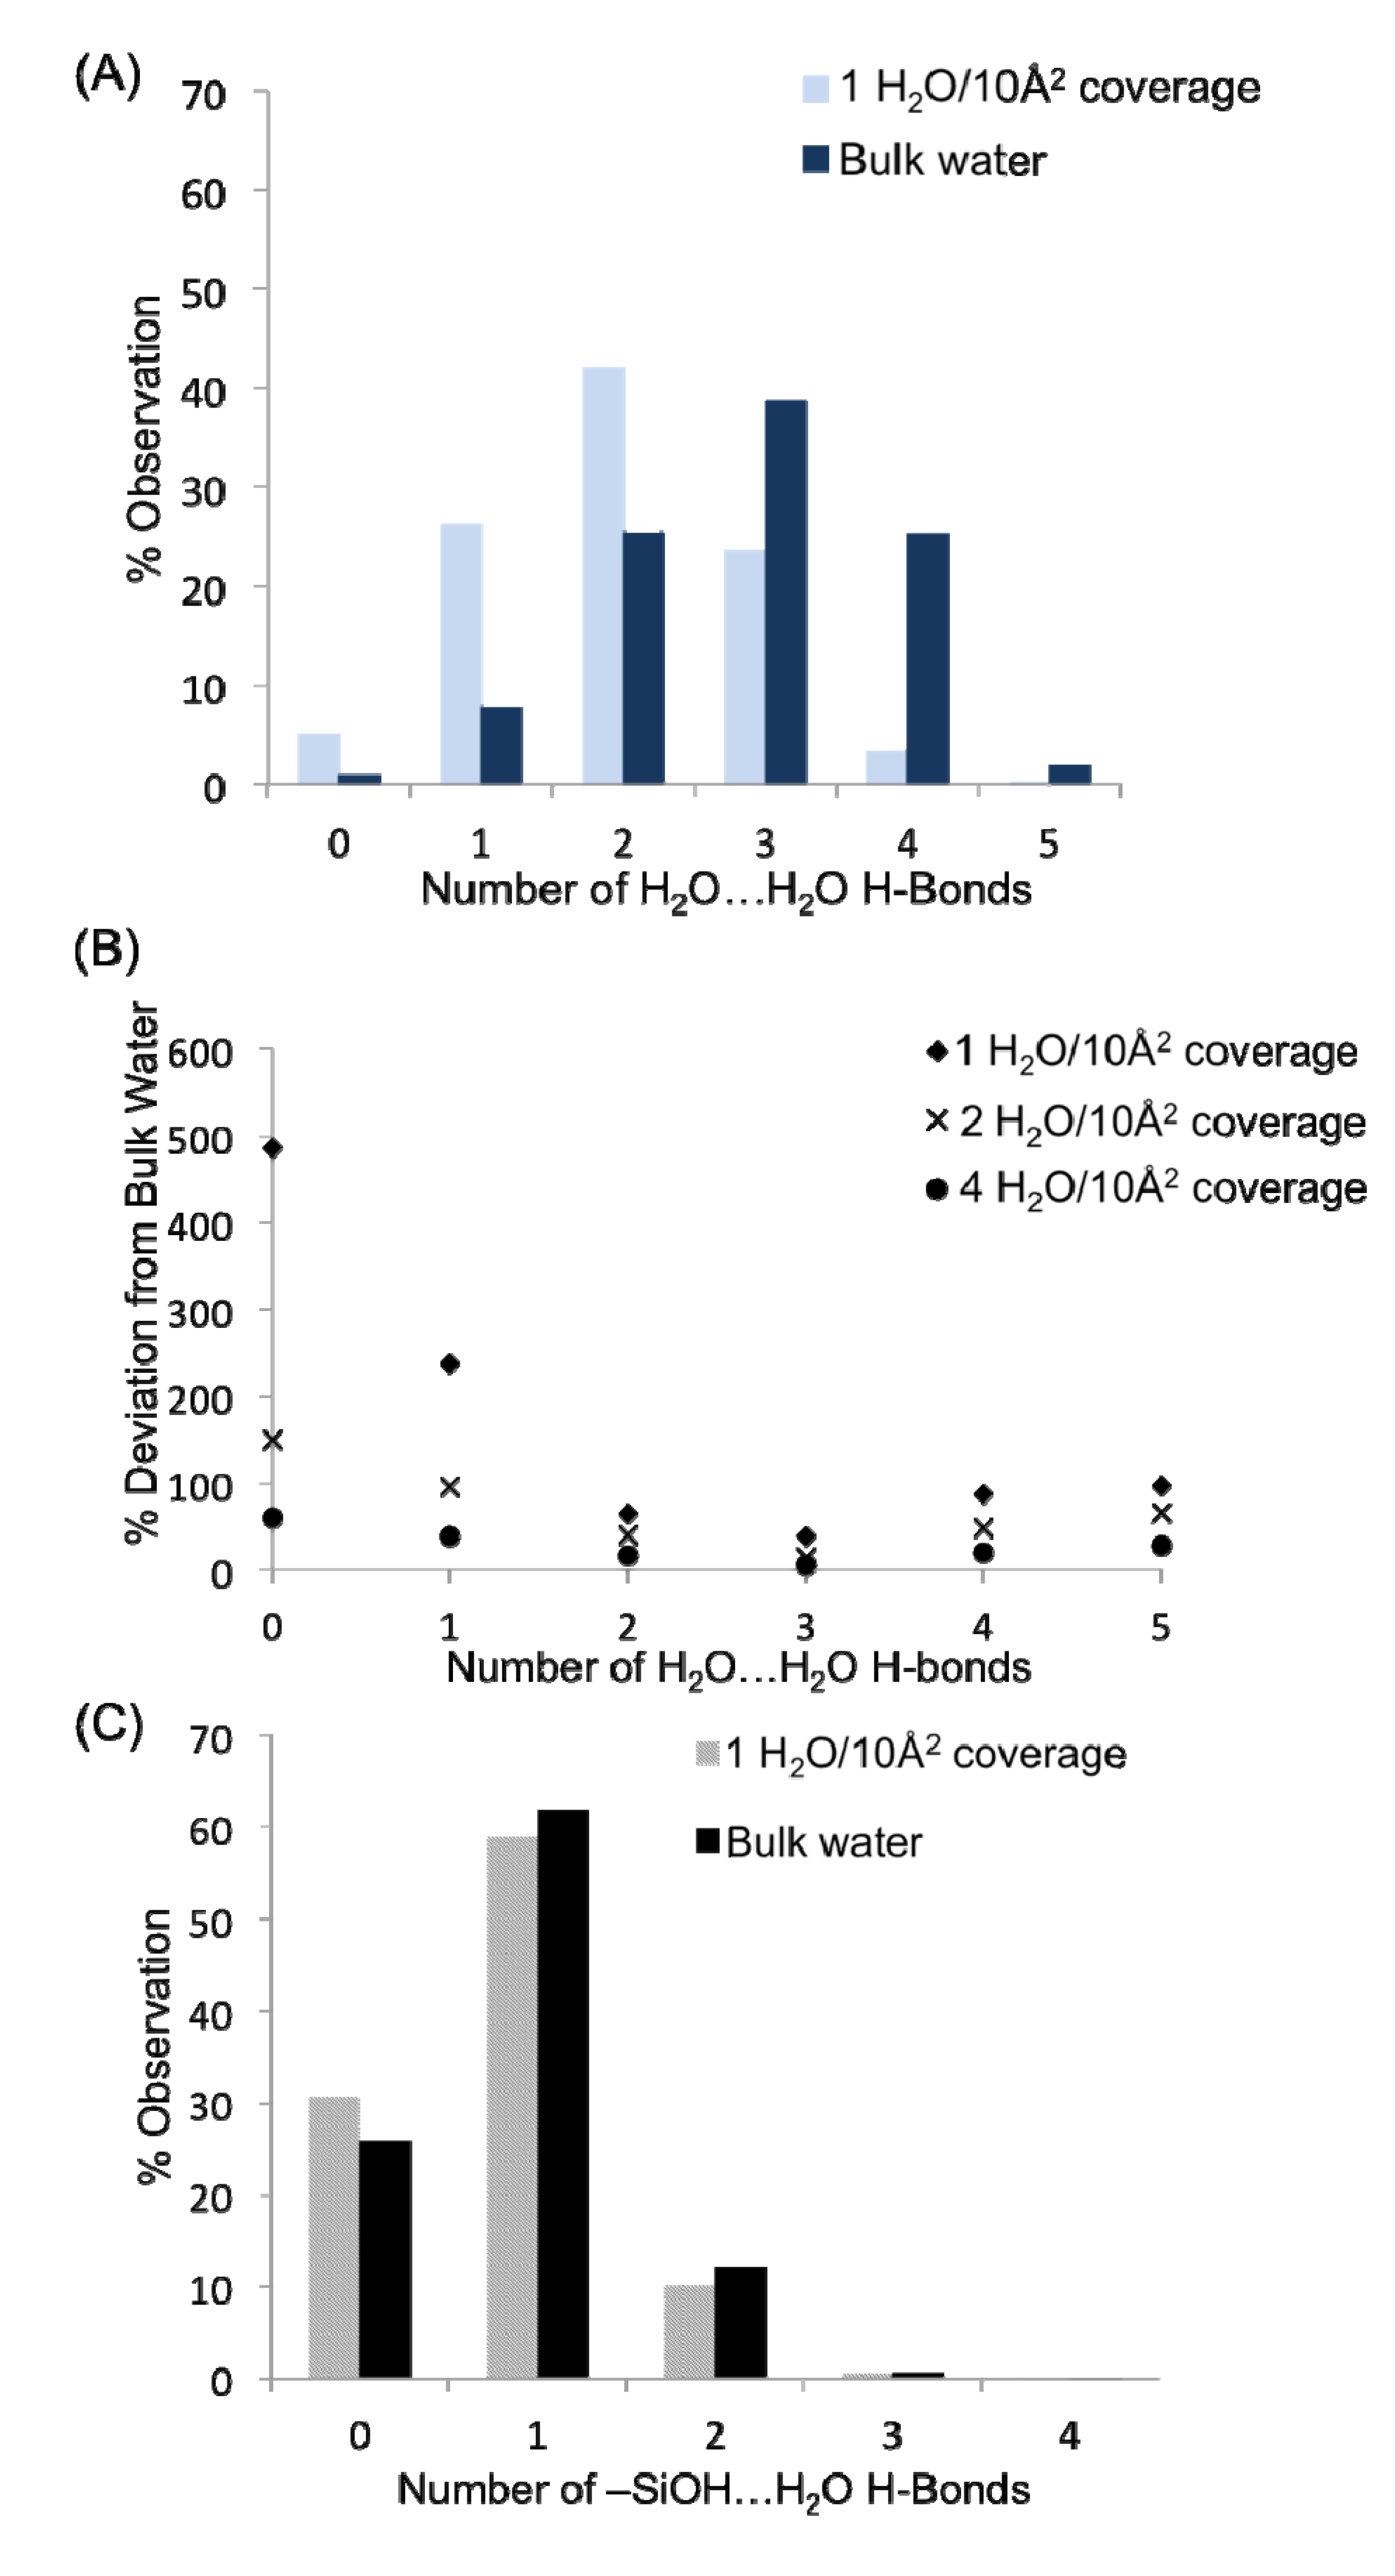
Figure 6A presents a comparison of the hydrogen bond distributions for all water-water H-bonds in the monolayer (1 H2O/10 Å2) and bulk systems. Within the two plots, it is apparent that the water-water H-bond distributions (the concentration of waters in the system with a specific number of H-bonds) are quite different in the monolayer system vs. the bulk solution in contact with quartz. This is unsurprising given that waters in the monolayer do not have the benefit of hydrogen bonding with layers of water farther from the surface (though some surface aggregation is observed, vide infra), in addition to an appreciable fraction of water H-bonds that are tied up with H-bonds to the surface silanol groups. The large concentration of waters with one or two H-bonds agrees very well with the three adsorption sites found previously, in that most waters with the descriptions provided for sites S1–S3 should only have 1–2 H-bonds. Thus, at a monolayer of coverage the average number of water-water H-bonds per molecule is 2.04, significantly less than in bulk water (2.88 H-bonds per molecule). It is possible to determine at what point in the hydration level the system becomes similar to the bulk water over the quartz by considering the % deviation in the concentration of waters with zero, one, two, three, four and five H-bonds from the bulk water values as one progresses from the monolayer to the bilayer and then tetralayer (
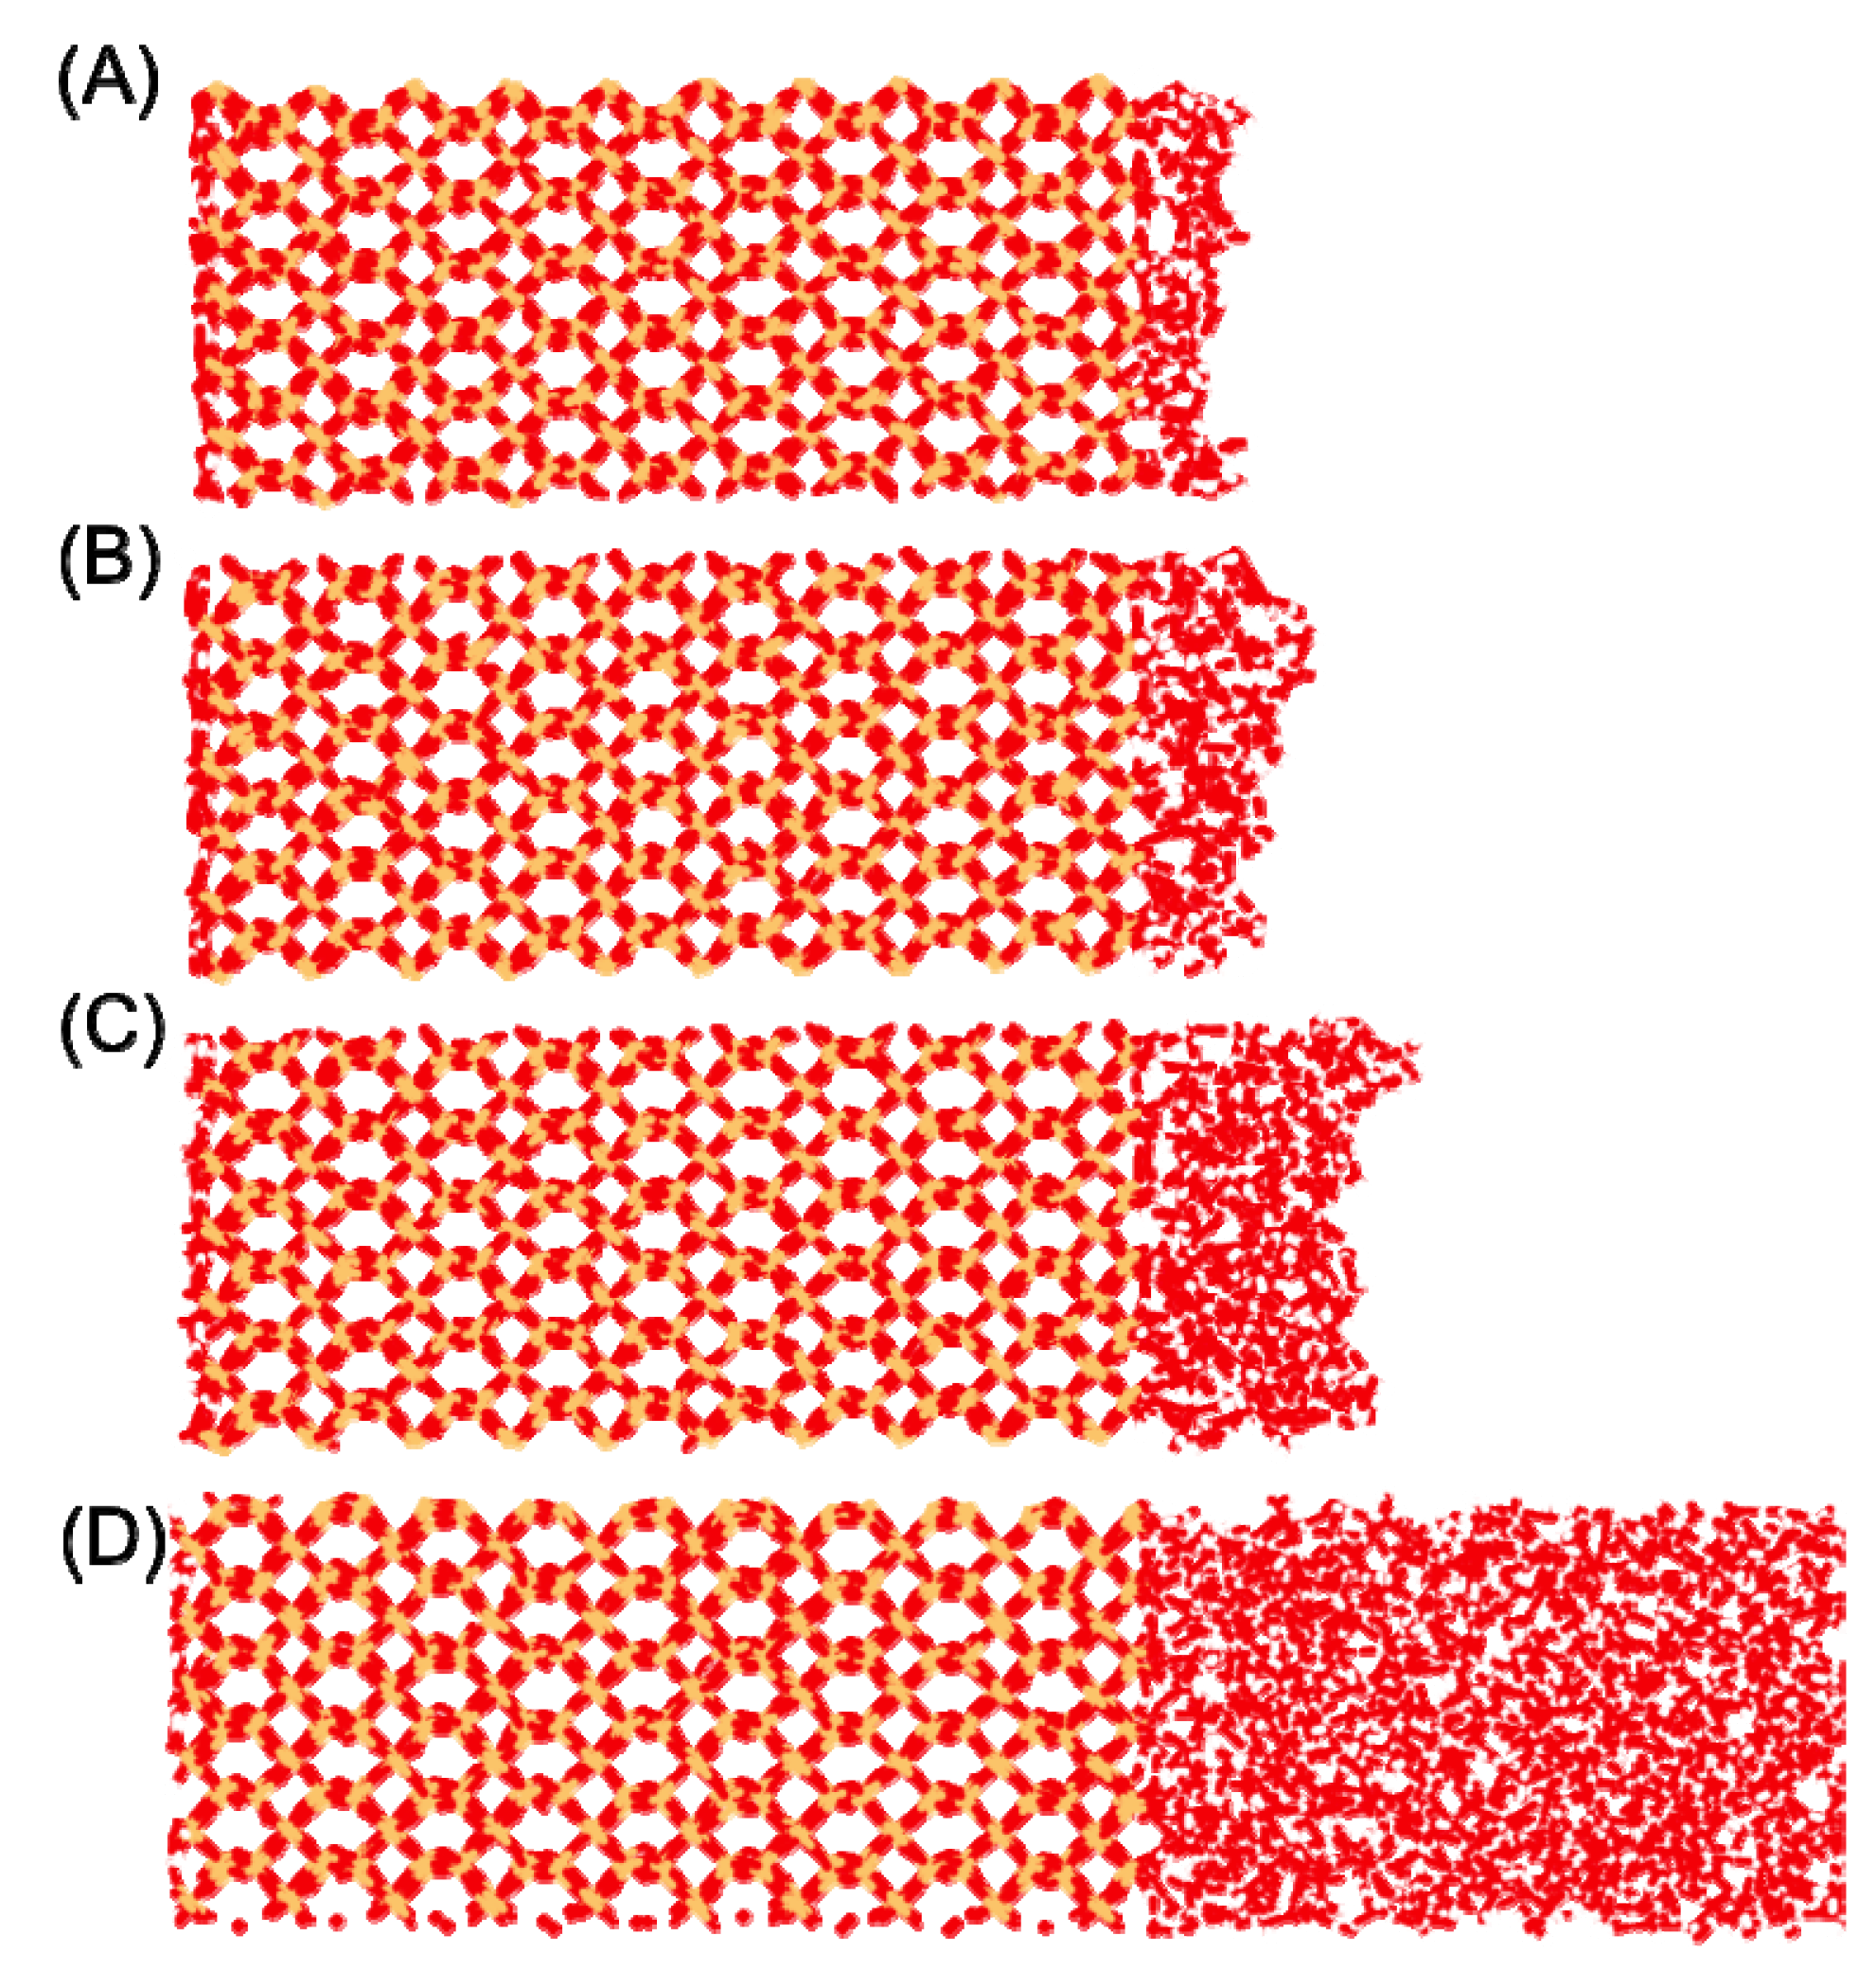
Figure 6B). While it is not surprising that the H-bond distribution becomes more “bulk”-like as water is added to the quartz surface, it is interesting how similar even the bilayer is to the bulk system—thus the water-water H-bonds between layers plays a significant role in filling out the water H-bond coordination sphere, helping to progress to the bulk H-bond distribution values. Important deviations in the hydrogen bond distributions relative to bulk still appear at a tetralayer of coverage (4 H2O/10 Å2); however, these are mostly attributable to the water|vapor interface (Figure 1) which causes an appreciable concentration of water molecules with only one or two H-bonds (1% and 11%, respectfully for the 4 H2O/10 Å2 system).
The distributions of the H-bonds to the surface silanol groups can be examined from the perspective of the surface –SiOH groups as well as from the perspective of the surface H2O molecules. Figure 6C presents the H-bond distribution of the surface –SiOH groups for a monolayer of coverage vs. the bulk. The H-bond distributions for the two systems are quite similar, indicating that the fundamental H-bonding interaction of water with the surface is relatively unchanged in the presence of the bulk liquid. The majority of silanol groups are found to form a single H-bond with water; however nearly 30% do not have any hydrogen bonds that fit within the designated criterion for the H-bond defined above. Recall that the H-bond criteria for the water-silanol interaction was optimized so as to prevent large populations of waters with unphysical over-coordination (5 or 6 H-bonds), and thus the 30% of silanols with zero H-bonds may reflect a significant population of waters on the surface that have very distorted interactions with the surface –SiOH groups. These may be waters that are “sandwiched” in between silanol groups or unfavorably oriented to form an H-bond with them. Considering the H-bonds to the surface silanols from the perspective of water molecules, 42% of the H2O in the monolayer (1 H2O/10 Å2) do not form a H-bond with –SiOH groups. Thus, ~73 waters have H-bond interactions with the surface that fall within a normal H-bonding range. This places the actual coverage of water on the surface at ~0.6/10 Å2 (Figure 5), with the remaining water either aggregating to a second layer on the surface or having a highly distorted interaction with the surface. Of those waters having a direct H-bond with the surface, 71% form a single H-bond with the surface and 27% bridge two separate silanol surface groups (Figure 5). As such, we can place a minimum value to the population of waters at the previously mentioned site S2 (Figure 5) at 27%, while at least 71% of the surface waters are either in site S1 or S3. In comparison with the interactions between the bulk liquid and the surface, a similar value of ~80 waters are found to have an H-bond interaction with the surface. Of those waters having a direct interaction with the surface the same distribution of waters with a single H-bond vs. bridging waters is observed as in the monolayer of coverage discussed above. These data further support the notion that the organizational aspect of the surface interactions between water and the surface is generally unaffected by layers of water farther from the surface.
The hydrogen bond lifetime between water molecules is known to be quite sensitive to the conditions of the system (temperature and pressure) and also the organizational structure about each molecule (the H-bond distribution)3. As such, it is not surprising that the water-water H-bond persistence does change depending upon the hydration value in a manner consistent with the systematic trends in the H-bond distributions. At the monolayer of coverage, the H-bond persistence between water molecules is found to be 123 fs, which is slightly shorter, though statistically significant, value relative to the bulk (137 fs, Table 1, and Figure S2 in Supplemental Information). The persistence of the –SiOH…H2O interaction is ~30% longer than the water H-bond persistence; however, it too is slightly shorter when a monolayer is present vs. the bulk liquid above the surface (Figure S3 in Supplemental Information). These data are not entirely unsurprising, as thermal effects (librational motion) are expected to be somewhat amplified for the monolayer and the presence of the bulk liquid above the interface may stabilize the dynamics of the H-bonding network at the surface.
Figure 6. (A) Hydrogen bond distributions as a function of water concentration between water molecules. (B) Convergence of water-water hydrogen bond distributions toward the bulk water values as a function of surface concentration of water. (C) H-bond distributions as a function of water concentration between water and surface –SiOH groups of quartz.
Minerals 04 00118 g006
Table 1. Persistence (in fs) of H2O…H2O and H2O…SiOH hydrogen bonds as a function of surface concentration of water.
Level of hydrationH2O…H2O H-bondH2O…SiOH H-bond
1 H2O/10Å2 (monolayer)123162
2 H2O/10Å2 (bilayer)133167
4 H2O/10Å2 (tetralayer)136168
Bulk137171
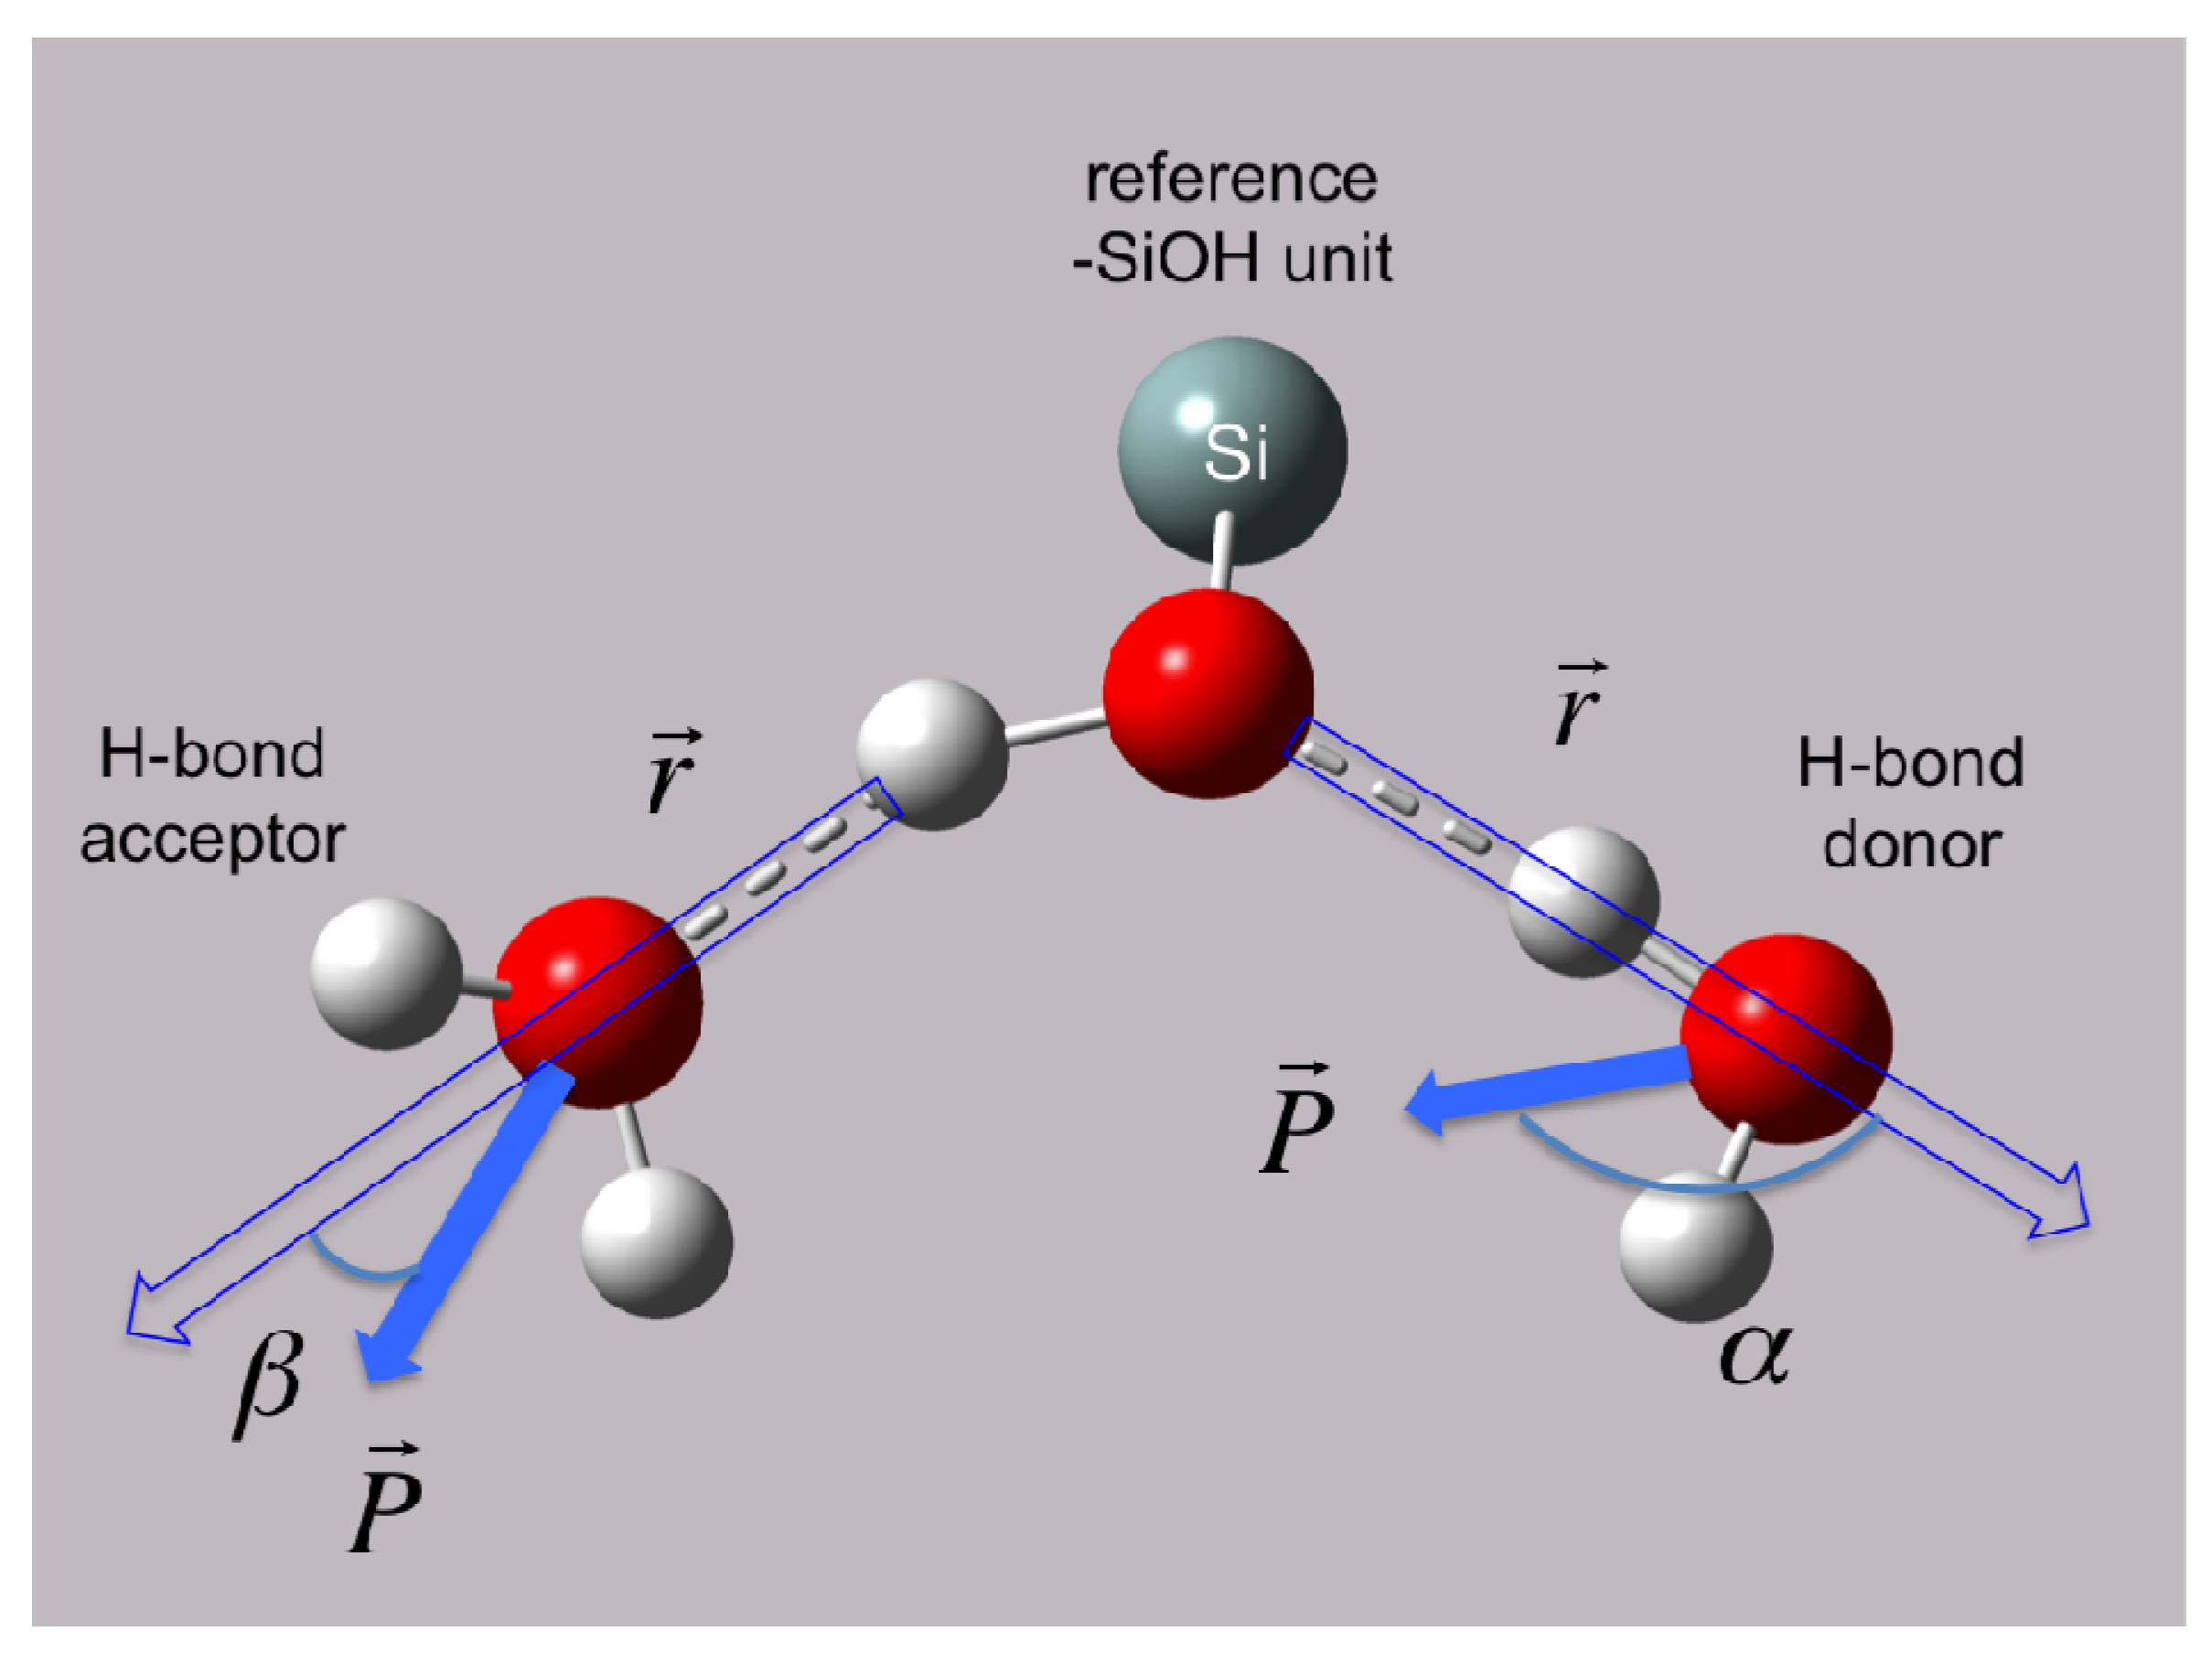
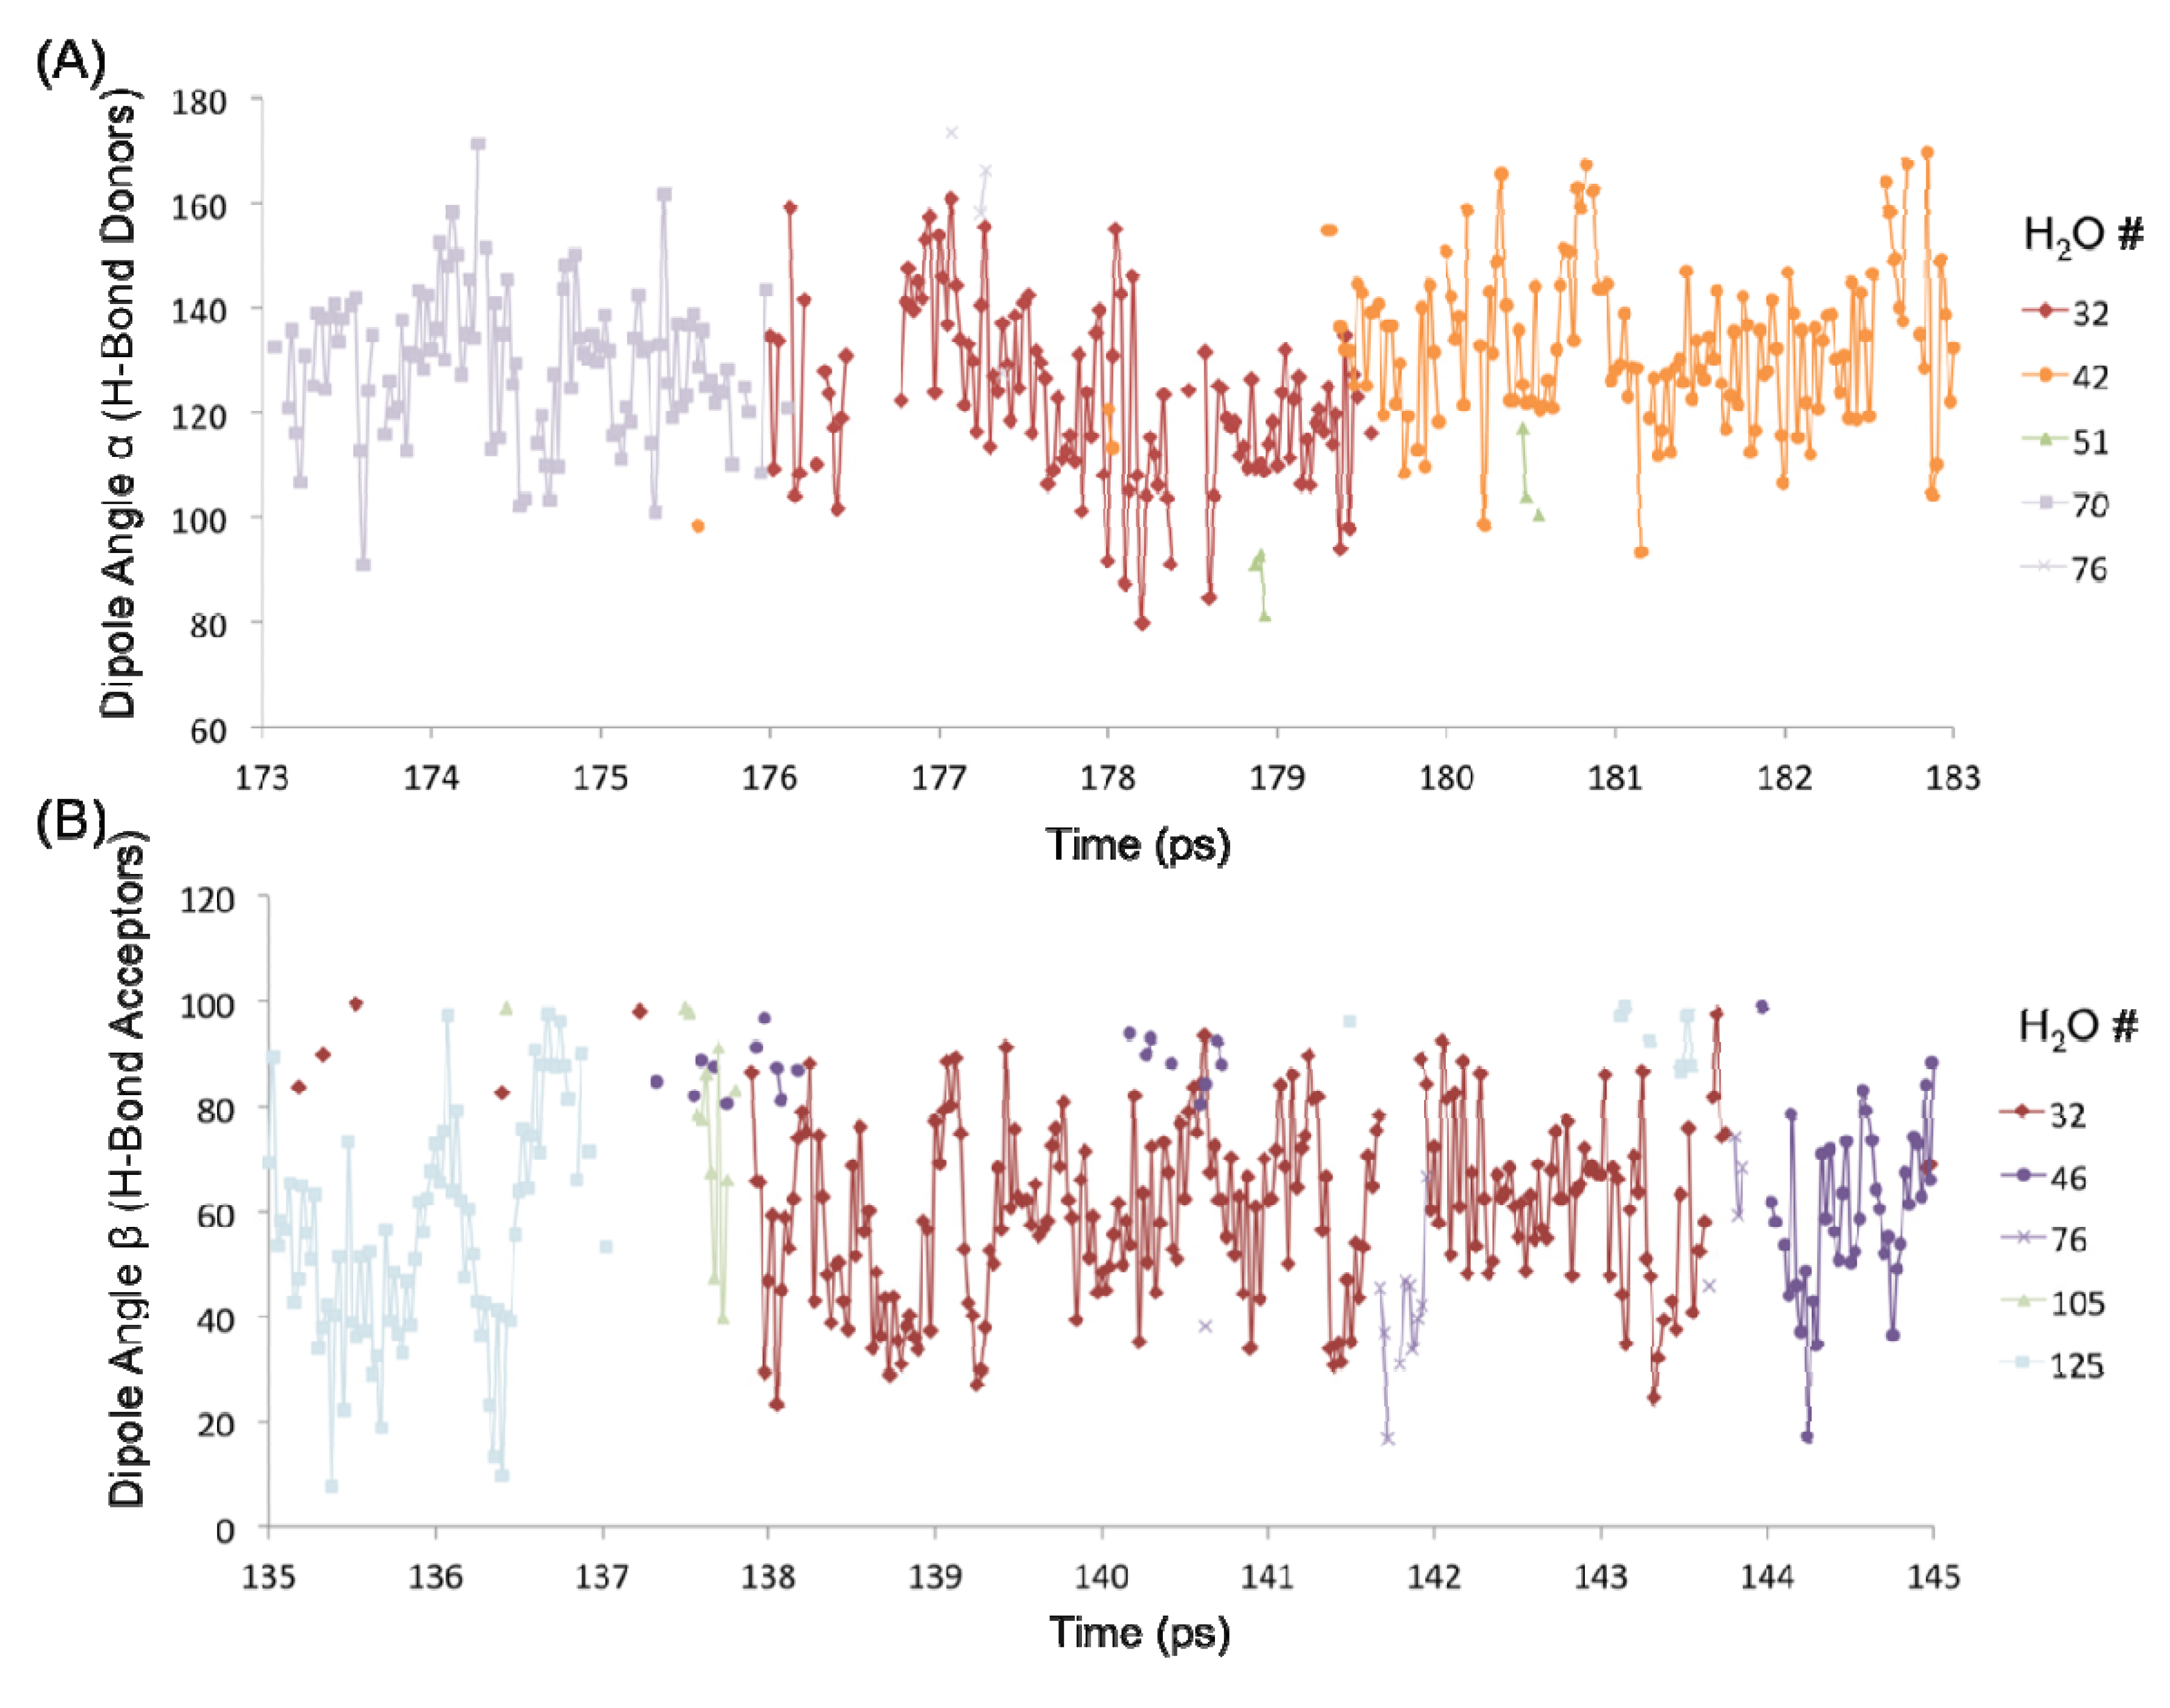
The H-bond persistence values are complemented by the study of the oscillations in the dipole angle that water forms with the surface silanol groups over time. Representative water dipole angle data are shown in Figure 7 about two silanol groups (designated #1 and #4) in the 1 H2O/10 Å2 system. Here, each data point represents a water molecule either donating an H-bond to the surface silanol, or accepting an H-bond from the silanol. There is generally one molecule that is H-bonded to a silanol group at a time, consistent with the H-bond distribution of the –SiOH groups (Figure 6C). The oscillatory behavior of the dipole angles at short time scales indicates a predominance of librational motion that leads to transient H-bond breaking as indicated by unconnected data points in Figure 7. It has been generally accepted that librational motions, especially in water, cause an apparent breaking and reforming of a hydrogen bond on a very fast time scale, and that the dynamics on a subpicosecond timescale is primarily due to librations [13,14]. The observed transient breaks due to librations are the primary source of the shorter H-bond persistence values. However, the residence time of a water molecule about a surface silanol is on the order of a few picoseconds (~3–7 ps). For example, the donor H2O molecules numbered 32, 42, and 70 are all H-bonded to silanol #1 (–SiOH group with ID 1) within the time interval 173–183 ps, each with an average residence time of ~3–4 ps (Figure 7A). It is further observed that H2O #32 also forms an H-bond (as an acceptor) with silanol #4 that is an immediate neighbor of silanol #1 (separated by an Si–Si distance of ~5 Å) within a time interval of 135–145 ps (Figure 7B). Thus, the H2O #32 travels from one silanol group to the neighboring silanol group slowly over a large time interval (~50 ps). This indicates that the dynamics of the first adsorbed layer of waters on the quartz surface tends to be non-translational, but primarily librational in character, which is in agreement with the experimentally observed structural immobility of the adsorption layer [2,15,16,17,18].
The extent of connectivity within the water-water H-bond network has been assessed using geodesic analysis. A geodesic (gd) is the shortest contiguous hydrogen bond pathway formed between two H2O vertices. Thus the distribution of geodesics is indicative of the extent of localization of the network about any water therein. As observed in Figure 8, bulk SPC water has a normal and fairly narrow distribution of geodesics centered around a gd length of seven H-bonds. The distribution of geodesics in the ideal monolayer of surface coverage (1 H2O/10 Å2) is also centered about a gd length of seven; however, it is much more broad with significant populations of geodesics of length greater than 10. Thus the average geodesic length in bulk water is 6.7, while it is 8.1 in the monolayer of surface coverage. This indicates that the surface serves to promote contiguous hydrogen bonded paths on the surface. However, when combined with the persistence of individual H-bonds between waters, we can see that this network is more fluxional than bulk water. Another metric that can be used to assess the extent of interconnectivity within the network is the geodesic index, ηgd, which is a measure of the number of geodesics (gd) each vertex i participates in (labeled gdi). This value is determined by:
Minerals 04 00118 i001
where sum of the geodesics j that every vertex i participates is averaged over all atoms and then divided by the number of vertices N (because the geodesic matrix is N × N) and total number of frames, M, multiplied by a scaling factor of 100. As a reference, consider that a perfect network of water, wherein each H2O has exactly four H-bonds (e.g., hexagonal ice) has an ηgd value of 121.3. If there are many broken pathways within the network, then each molecule will participate in a fewer number of contiguous H-bond pathways. In bulk SPC water, ηgd has a value of 28.4, while when a single monolayer of water is present on the surface ηgd has a value of 54.9. The increase in ηgd for the monolayer waters generally derives from the fact that while there are no layers above the monolayer that would extend the geodesic pathways beyond the interfacial region the relative immobility of the surface waters enhance the likelihood of much longer geodesic chains to be formed, as observed in Figure 8. Thus, there is a larger extension of the H-bond network laterally, which increases the total number of geodesics that each water participates in.
Figure 7. Dipole angle oscillations on the quartz surface with the monolayer coverage. (A) Dipole angles of H2O molecules donating H-bond to the –SiOH group #1 over the time interval 173–183 ps. (B) Dipole angles of H2O molecules accepting H-bond from the –SiOH group #4 over the time interval 135–145 ps.
Minerals 04 00118 g007
Figure 8. Distribution of geodesic (gd) lengths found in bulk simple point charge (SPC) water and the ideal monolayer of water (1H2O/10 Å2).
Minerals 04 00118 g008

4. Conclusions

This work demonstrates the complementary information that can be obtained through graph theoretical analysis of the intermolecular hydrogen bond networks at mineral interfaces relative to standard analysis of molecular simulation data (e.g., density profiles). Specifically, for the water|quartz system, the actual number of waters adsorbed to the surface can be discerned, and has been found to be ~40% less than the ideal value (0.6 vs. 1 H2O/10 Å2). Geodesic analysis reveals that the unbroken hydrogen bond network of interfacial waters extends farther than in the bulk liquid; however, the persistence of individual hydrogen bonds between water molecules and between water and silanol indicates that the network is more fluxional at low surface coverage. Concentrations of H2O at previously determined water adsorption sites have also been quantified. Specifically, we can place a minimum value to the population of waters at the S2 site at 27%, while at least 71% of the surface waters are either in site S1 or S3.

Acknowledgments

The research was supported by the U.S. Department of Energy, Office of Basic Energy Sciences, Division of Chemical Sciences, Geosciences and Biosciences under Award DE-FG02-12ER16362. This work was performed in part at the William R. Wiley Environmental Science Laboratory and using the Molecular Science Computing Facility (MSCF) therein, a national scientific user facility sponsored by the U.S. Department of Energy’s Office of Biological and Environmental Research and located at the Pacific Northwest National Laboratory, operated for the Department of Energy by Battelle.

Conflicts of Interest

The authors declare no conflict of interest.

References

  1. Anderson, J.H.; Wickersheim, K.A. Near infrared characterization of water and hydroxyl groups on silica surfaces. Surf. Sci. 1964, 2, 252–260. [Google Scholar] [CrossRef]
  2. Sakamoto, T.; Nakamura, H.; Uedaira, H.; Wada, A. High-frequency dielectric relaxation of water bound to hydrophilic silica gels. J. Phys. Chem. 1989, 93, 357–366. [Google Scholar] [CrossRef]
  3. Skelton, A.A.; Fenter, P.; Kubicki, J.D.; Wesolowski, D.J.; Cumming, P.T. Simulations of the quartz(1011)/water interface: A comparison of classical force fields, Ab initio molecular dynamics, and X-ray reflectivity experiments. J. Phys. Chem. C 2011, 115, 2076–2088. [Google Scholar]
  4. Ozkanlar, A.; Clark, A.E. ChemNetworks: A complex network analysis tool for chemical systems. J. Comput. Chem. 2013, 35, 495–505. [Google Scholar] [CrossRef]
  5. Wander, M.C.F.; Clark, A.E. Structural and dielectric properties of quartz-water interfaces. J. Phys. Chem. C 2008, 112, 19986–19994. [Google Scholar] [CrossRef]
  6. Plimpton, S. Fast parallel algorithms for short-range molecular dynamics. J. Comput. Phys. 1995, 117, 1–19. [Google Scholar] [CrossRef]
  7. Cygan, R.T.; Liang, J.-J.; Kalinichev, A.G. Molecular models of hydroxide, oxyhydroxide, and clay phases and the development of a general force field. J. Phys. Chem. B 2004, 108, 1255–1266. [Google Scholar] [CrossRef]
  8. Berendsen, H.J.C.; Postma, J.P.M.; van Gunsteren, W.F.; Hermans, J. Interaction Models for Water in Relation to Protein Hydration. In Intermolecular Forces; Pullman, B., Ed.; Springer: Berlin, Germany, 1981; pp. 331–342. [Google Scholar]
  9. Teleman, O.; Jonsson, B.; Engstrom, S. A molecular dynamics simulation of a water model with intramolecular degrees of freedom. Mol. Phys. 1987, 60, 193–203. [Google Scholar] [CrossRef]
  10. Wallqvist, A.; Teleman, O. Properties of flexible water models. Mol. Phys. 1991, 74, 515–533. [Google Scholar] [CrossRef]
  11. Floyd, R.W. Algorithm 97: Shortest path. Commun. Assoc. Comput. Mach. 1962, 5. [Google Scholar] [CrossRef]
  12. Warshall, S. A theorem on boolean matrices. J. Assoc. Comput. Mach. 1962, 9, 11–12. [Google Scholar] [CrossRef]
  13. Chen, S.-H.; Teixeira, J. Structure and dynamics of low-temperature water as studied by scattering techniques. Adv. Chem. Phys. 1986, 64, 1–45. [Google Scholar]
  14. Luzar, A.; Chandler, D. Effect of environment on hydrogen bond dynamics in liquid water. Phys. Rev. Lett. 1996, 76, 928–931. [Google Scholar] [CrossRef]
  15. Bellissent-Funel, M.-C.; Lal, J.; Bosio, L. Structural study of water confined in porous glass by neutron scattering. J. Chem. Phys. 1993, 98, 4246. [Google Scholar] [CrossRef]
  16. Li, I.; Bandara, J.; Shultz, M.J. Time evolution studies of the H2O/Quartz interface using sum frequency generation, atomic force microscopy, and molecular dynamics. Langmuir 2004, 20, 10474–10480. [Google Scholar] [CrossRef]
  17. Yang, J.; Wang, E.G. Reaction of water on silica surfaces. Curr. Opin. Solid State Mater. Sci. 2006, 10, 33–39. [Google Scholar] [CrossRef]
  18. Li, T.-D.; Gao, J.; Szoszkiewicz, R.; Landman, U.; Riedo, E. Structured and viscous water in subnanometer gaps. Phys. Rev. B 2007, 75, 115415. [Google Scholar] [CrossRef]

