Article

Distribution and Substitution Mechanism of Ge in a Ge-(Fe)-Bearing Sphalerite

1
School of Chemical Engineering, University of Adelaide, Adelaide, SA 5005, Australia
2
School of Geosciences, Monash University, Clayton, VIC 3800, Australia
3
South Australian Museum, North Terrace, Adelaide, SA 5000, Australia
4
Diamond Light Source, Harwell Science and Innovation Campus, Didcot, Oxon OX11 0QX, UK
5
Australian Synchrotron, 800 Blackburn Rd., Clayton, VIC 3168, Australia
6
The Monash Centre for Electron Microscopy, Monash University, Clayton, VIC 3800, Australia
7
School of Chemical and Physical Sciences, Flinders University, GPO Box 2100, Adelaide, SA 5000, Australia
8
Key Laboratory for Ultrafine Materials of Ministry of Education, School of Materials Science and Engineering, East China University of Science and Technology, Shanghai 200237, China
*
Author to whom correspondence should be addressed.
Minerals 2015, 5(2), 117-132; https://doi.org/10.3390/min5020117
Submission received: 3 February 2015 / Revised: 6 March 2015 / Accepted: 16 March 2015 / Published: 24 March 2015

Abstract

:
The distribution and substitution mechanism of Ge in the Ge-rich sphalerite from the Tres Marias Zn deposit, Mexico, was studied using a combination of techniques at μm- to atomic scales. Trace element mapping by Laser Ablation Inductively Coupled Mass Spectrometry shows that Ge is enriched in the same bands as Fe, and that Ge-rich sphalerite also contains measurable levels of several other minor elements, including As, Pb and Tl. Micron- to nanoscale heterogeneity in the sample, both textural and compositional, is revealed by investigation using Focused Ion Beam-Scanning Electron Microscopy (FIB-SEM) combined with Synchrotron X-ray Fluorescence mapping and High-Resolution Transmission Electron Microscopy imaging of FIB-prepared samples. Results show that Ge is preferentially incorporated within Fe-rich sphalerite with textural complexity finer than that of the microbeam used for the X-ray Absorption Near Edge Structure (XANES) measurements. Such heterogeneity, expressed as intergrowths between 3C sphalerite and 2H wurtzite on [ 1 1 ¯ 0 ] zones, could be the result of either a primary growth process, or alternatively, polystage crystallization, in which early Fe-Ge-rich sphalerite is partially replaced by Fe-Ge-poor wurtzite. FIB-SEM imaging shows evidence for replacement supporting the latter. Transformation of sphalerite into wurtzite is promoted by (111)* twinning or lattice-scale defects, leading to a heterogeneous ZnS sample, in which the dominant component, sphalerite, can host up to ~20% wurtzite. Ge K-edge XANES spectra for this sphalerite are identical to those of the germanite and argyrodite standards and the synthetic chalcogenide glasses GeS2 and GeSe2, indicating the Ge formally exists in the tetravalent form in this sphalerite. Fe K-edge XANES spectra for the same sample indicate that Fe is present mainly as Fe2+, and Cu K-edge XANES spectra are characteristic for Cu+. Since there is no evidence for coupled substitution involving a monovalent element, we propose that Ge4+ substitutes for (Zn2+, Fe2+) with vacancies in the structure to compensate for charge balance. This study shows the utility of synchrotron radiation combined with electron beam micro-analysis in investigating low-level concentrations of minor metals in common sulfides.

1. Introduction

Consumption of germanium for use in light-emitting diodes, fiber-optic systems, and satellite and terrestrial solar cells, has significantly increased in recent years, highlighting the need to ensure an adequate future supply of germanium. Currently, germanium is extracted commercially from some Ge-rich coal seams and from zinc concentrates from some Zn-Pb mining operations, in which Ge is hosted within the common sulfide mineral sphalerite (ZnS) [1,2]. Germanium is particularly enriched in relatively Fe-poor sphalerite from Mississippi Valley-type (MVT) deposits formed at relatively low temperatures [2].
The mechanism by which Ge is substituted into the sphalerite crystal lattice has long been the subject of debate. Some authors (e.g., [3,4,5]) have favoured incorporation of Ge4+ into the sphalerite structure, implying either coupled substitution or vacancies to achieve charge compensation. For example, [5,6] invoke the 3Zn2+ ↔ Ge4+ + 2Ag+ substitution for the incorporation of Ge (up to 1200 ppm) in Ag-rich (max 1000 ppm) sphalerite from a French vein-type deposit, based on a coarse correlation between Ge and Ag. In contrast, [6,7] found no significant correlation between Ge and other elements in sphalerite from different base metal mineral deposits containing tens to hundreds of ppm Ge, and suggested that Ge might be directly substituted as Ge2+ for Zn2+ or, alternatively, the substitution mechanism involves Ge4+, but with vacancies to maintain charge balance.
Understanding the oxidation state of Ge in natural sphalerite is critical for modeling element substitution mechanisms. We used X-ray Absorption Near-Edge Structure (XANES) micro-spectroscopy to investigate the Ge oxidation state in a relatively Ge-rich sphalerite (~1000 ppm); higher concentrations up to ~3000 ppm are only known from a limited number of occurrences worldwide [8]. We studied cm-sized pieces of sphalerite ore from the Tres Marias Zn deposit, Mexico [9]. In this material, Ge concentrations correlate positively with the Fe contents. This presents us with the opportunity to also investigate the oxidation state of Fe in substituted sphalerite. Although Fe is normally considered to occur only as Fe2+ in sphalerite (e.g., [10,11]), we aim to establish whether this assumption is also true for Ge-rich sphalerite, or whether there is any evidence for the presence of Fe3+.

2. Sample Description

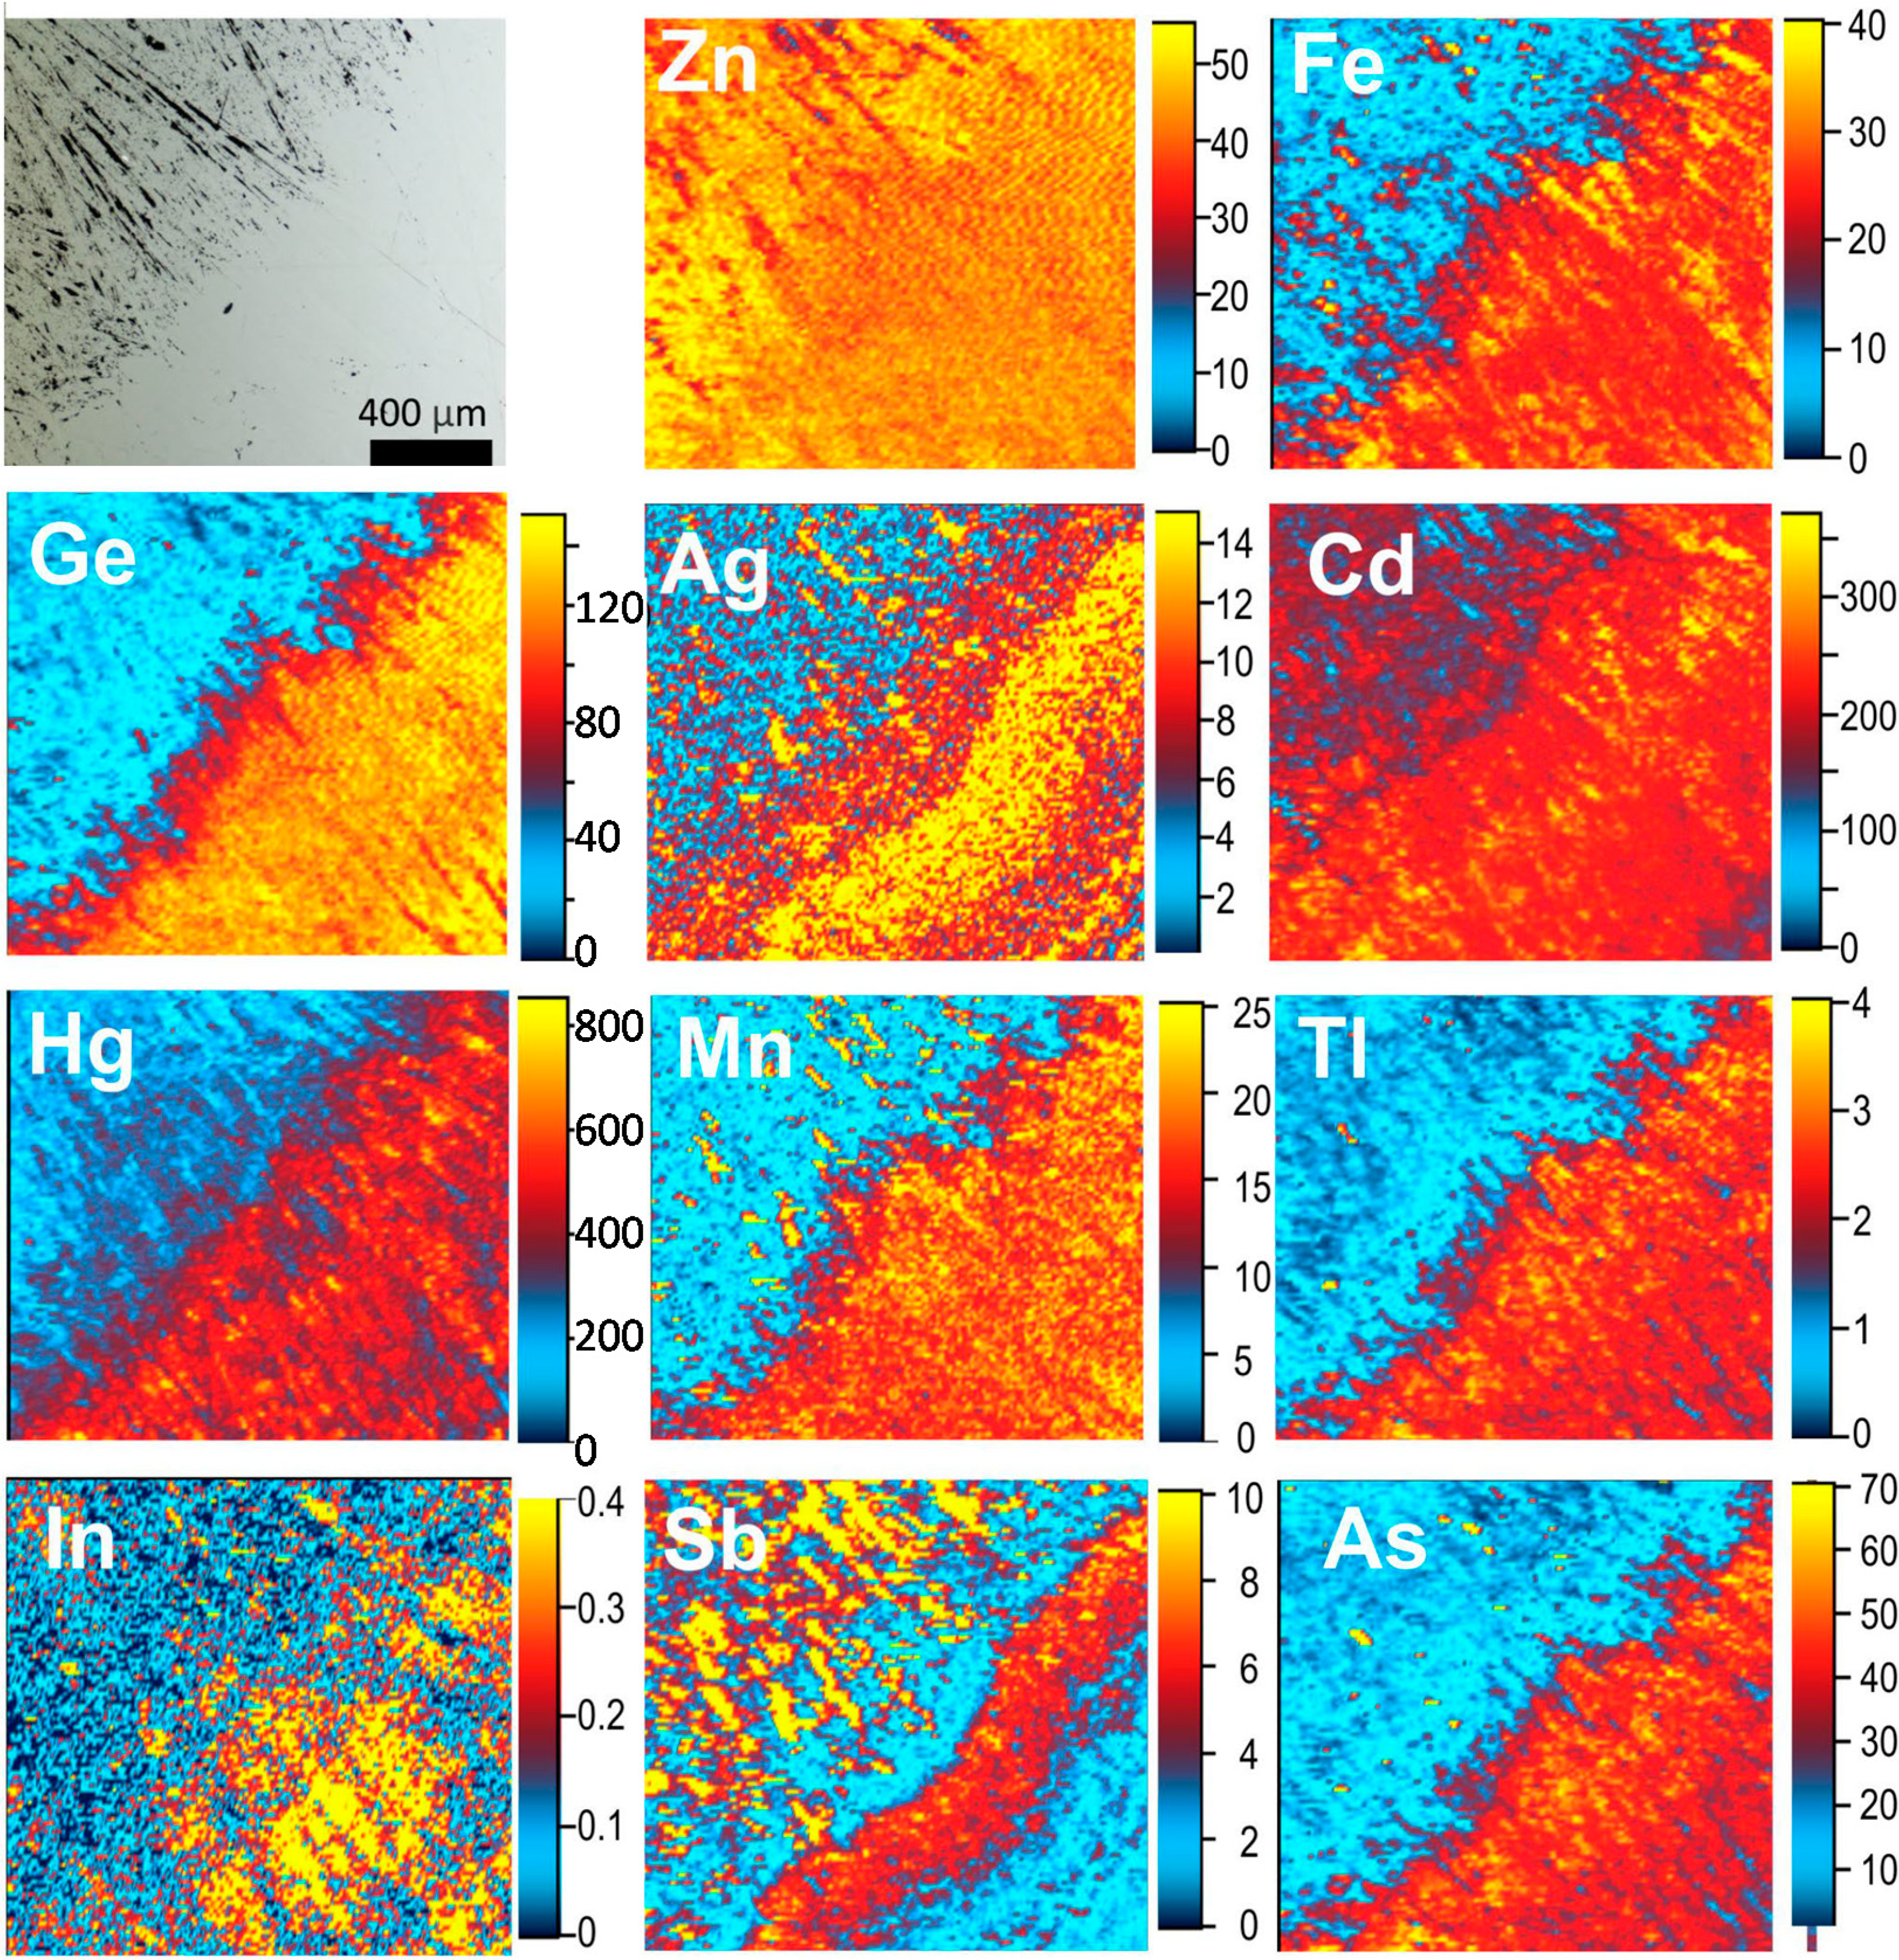
2.1. Macro- to μm-Scale

The sample comprises massive sphalerite with a characteristic bladed appearance, possibly suggesting the co-presence of wurtzite at the smallest scale, as in other specimens considered to consist only of sphalerite (Pring et al. unpublished results). Powder X-ray diffraction studies showed that the sample consists of a fine-scale intergrowth of sphalerite and wurtzite-2H, with the ratio of the two minerals ranging from 10:1 down to 4:1. Two compositionally distinct areas (Fe-rich and Fe-poor) are recognized on the surface of our polished mount. A ragged boundary separates the two areas (Figure 1f in [6]). The Fe-rich sphalerite consists of aligned blades, typically 50–200 μm in length, and with irregular to lamellar grate-like features within some blades that are distinct in reflected light or back-scattered electron images. Figure 3a in [9] shows a back-scattered electron image with “delicate lamellar to dendritic” textures identical to those described here. The Fe-poor sphalerite has the same general appearance but is distinct by having a markedly greater porosity along the individual blades.
Published Electron Probe (EPMA) and Laser Ablation Inductively-Coupled Plasma Mass Spectrometry (LA-ICP-MS) spot analyses of the same hand specimen [6] gave Fe contents of 3.14 wt% [(Zn0.95Fe0.05)S] and 8.72 wt% [(Zn0.85Fe0.15)S] in the low- and high-Fe sphalerite, respectively. Germanium is enriched in the Fe-rich area of the polished mount. Mean Ge concentrations, as measured by LA-ICP-MS, are 252 and 1081 ppm in the Fe-poor and Fe-rich areas, respectively. Cadmium concentrations are ~5000 ppm in both areas. Other elements present at significant concentrations (LA-ICP-MS data) are As (means of 572 and 434 ppm in Ge-Fe-rich and Ge-Fe-poor areas, respectively), Pb (1349 and 3090 ppm) and Tl (158 and 53 ppm). Silver and Cu concentrations are a few ppm and a few tens of ppm, respectively. Gallium concentration is ~25 ppm in the Fe-poor sphalerite but an order of magnitude lower in the Fe-rich area.
LA-ICP-MS trace element maps across the boundary between the two compositionally distinct areas were obtained to further characterize the material. Analytical procedures and operating conditions follow [12], using the sulfide-matrix Mass-1 [13] as a reference material, and Zn as the internal standard. The maps (Figure 1) show a striking compositional heterogeneity, highlighting the differences between the Fe-rich areas, and that Ge enrichment closely follows Fe and is also associated with enrichment in Ag, Hg, Mn, Tl and As, and that there is an inverse relationship between (Ge,Fe) and Zn. Silver, In and Sb display a subtle zoning relative to the boundary between the two areas. The sum of cations likely present in the monovalent state, (Cu + Ag + Tl) which were observed to play a role in maintaining charge balance in galena [14], is only a fraction of that of Ge.
Figure 1. Reflected light image of sphalerite from the Tres Marias Zn deposit, Mexico (top left) and LA-ICP-MS element maps across the boundary between (Ge-Fe)-rich and (Ge-Fe)-poor areas. Scales in counts-per-second × 103 (except Zn and Fe: × 106).
Minerals 05 00117 g001

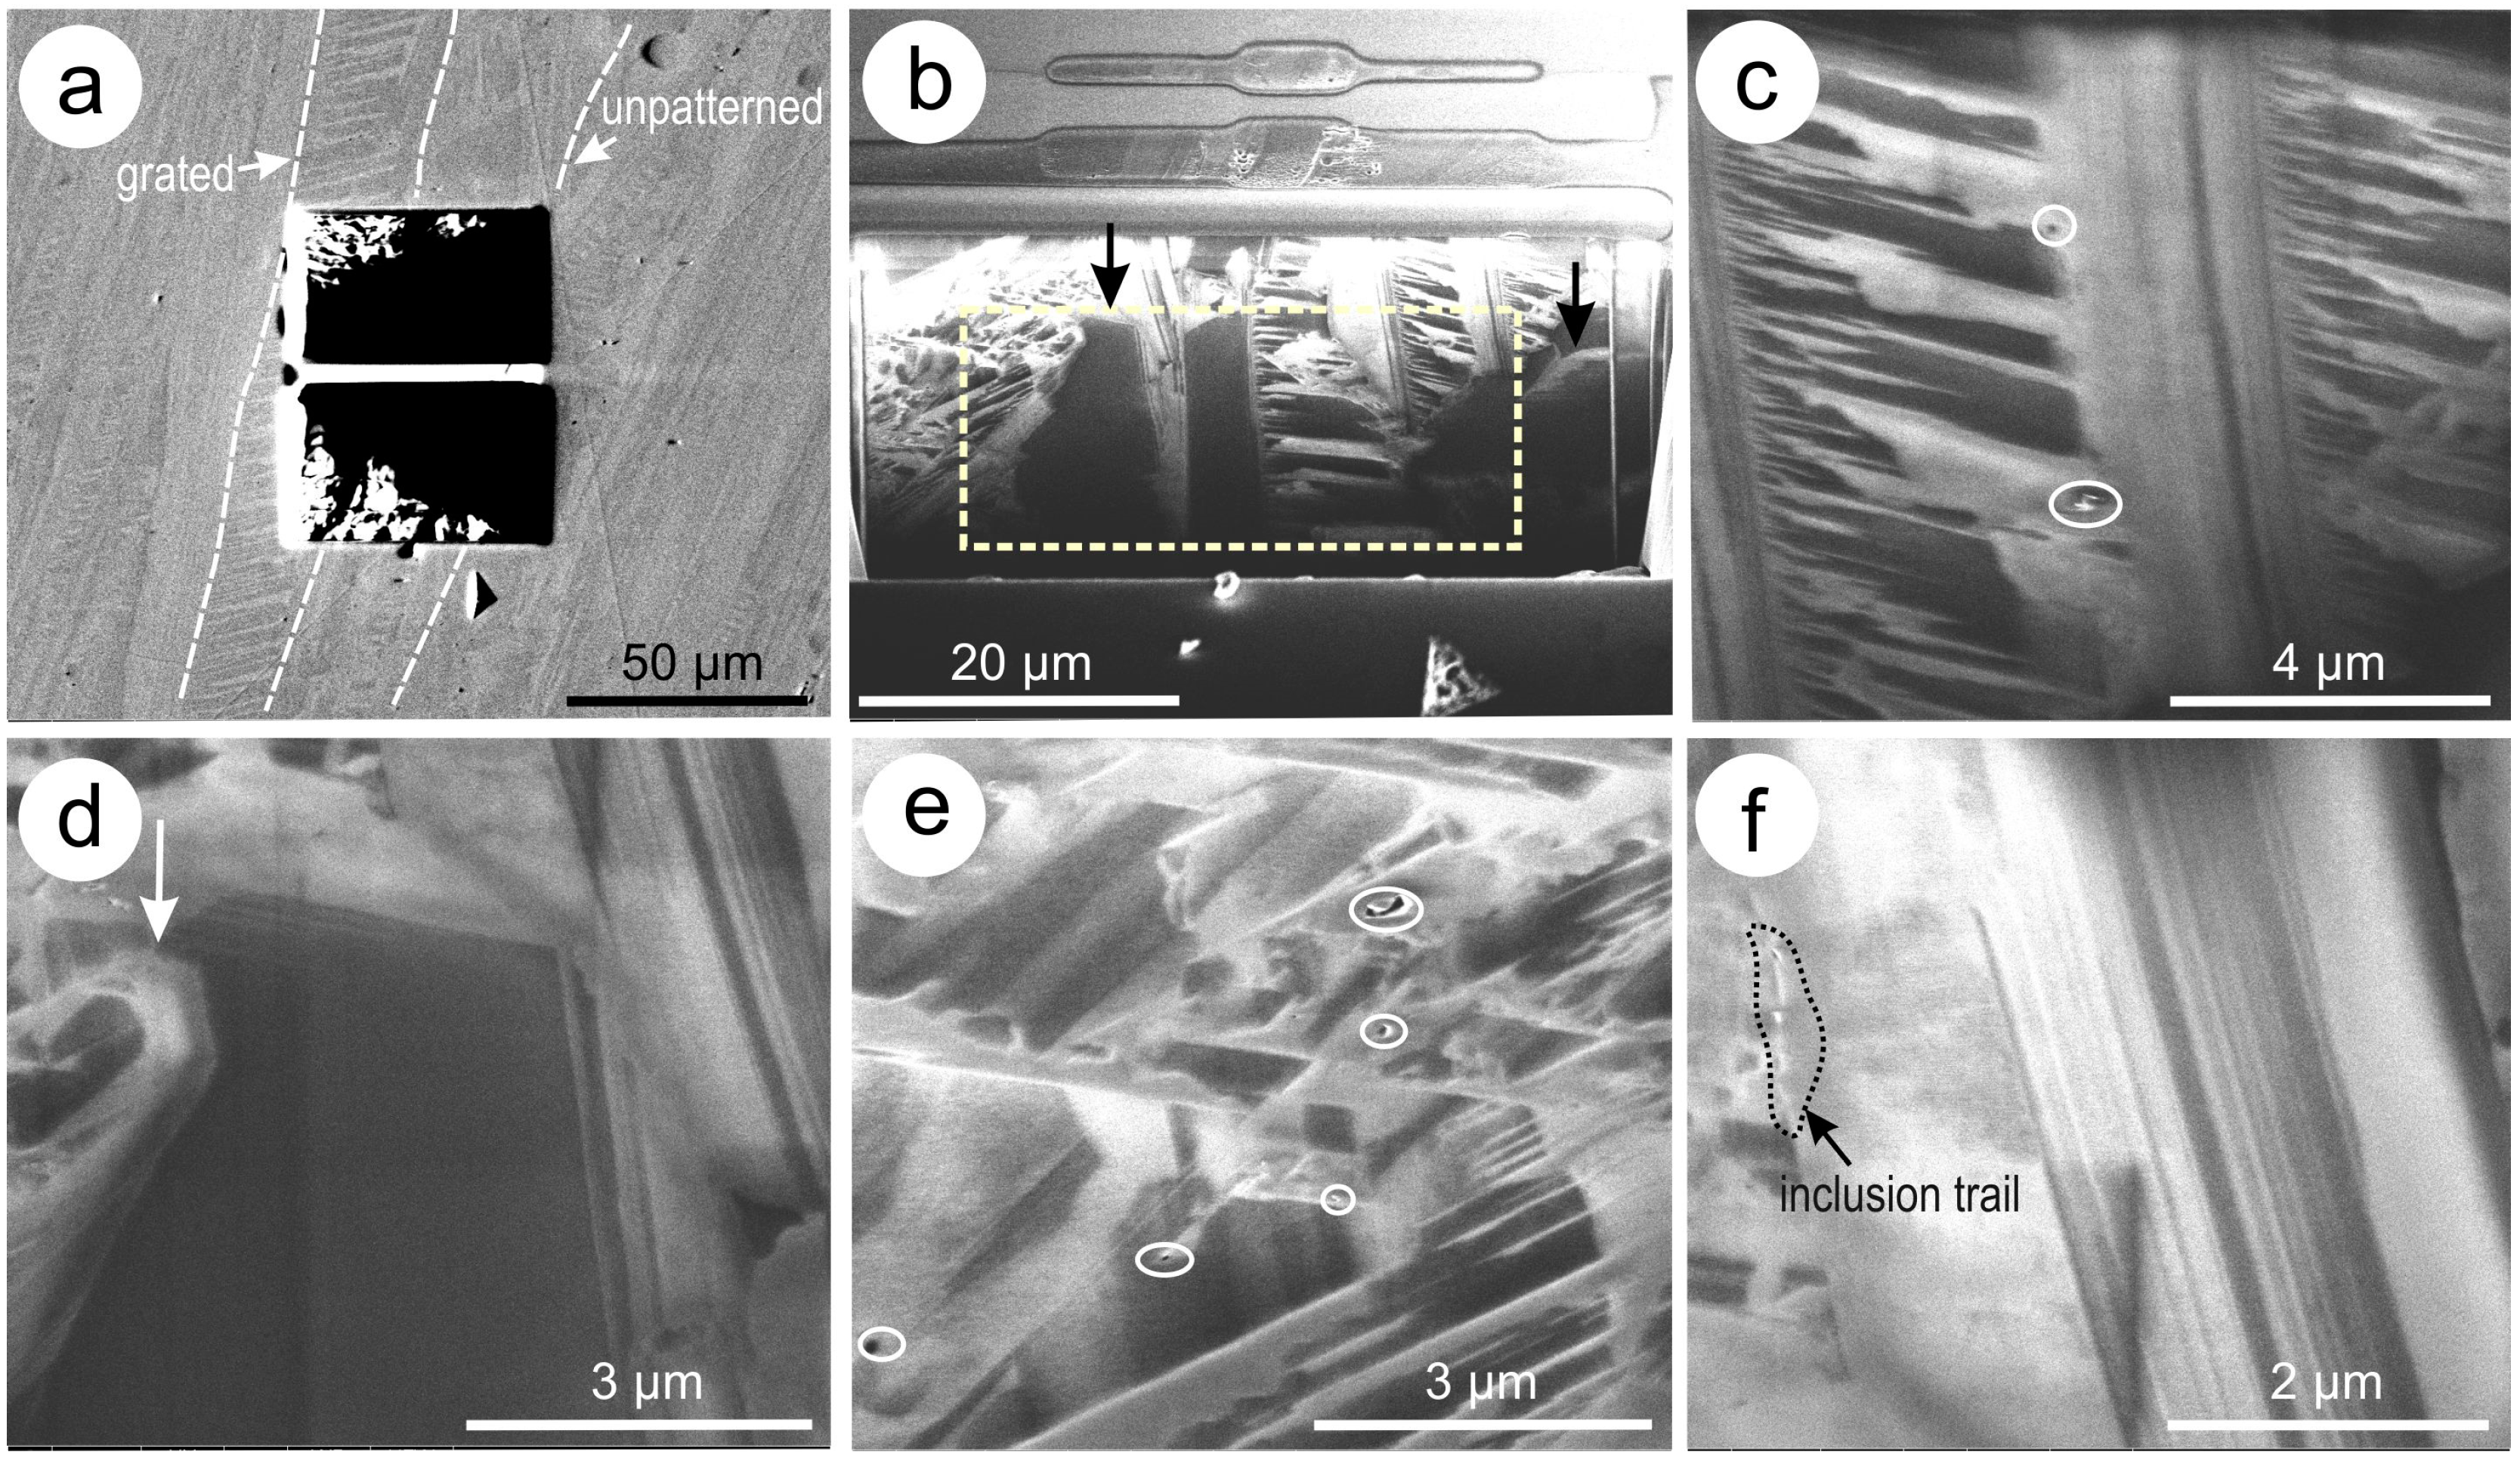
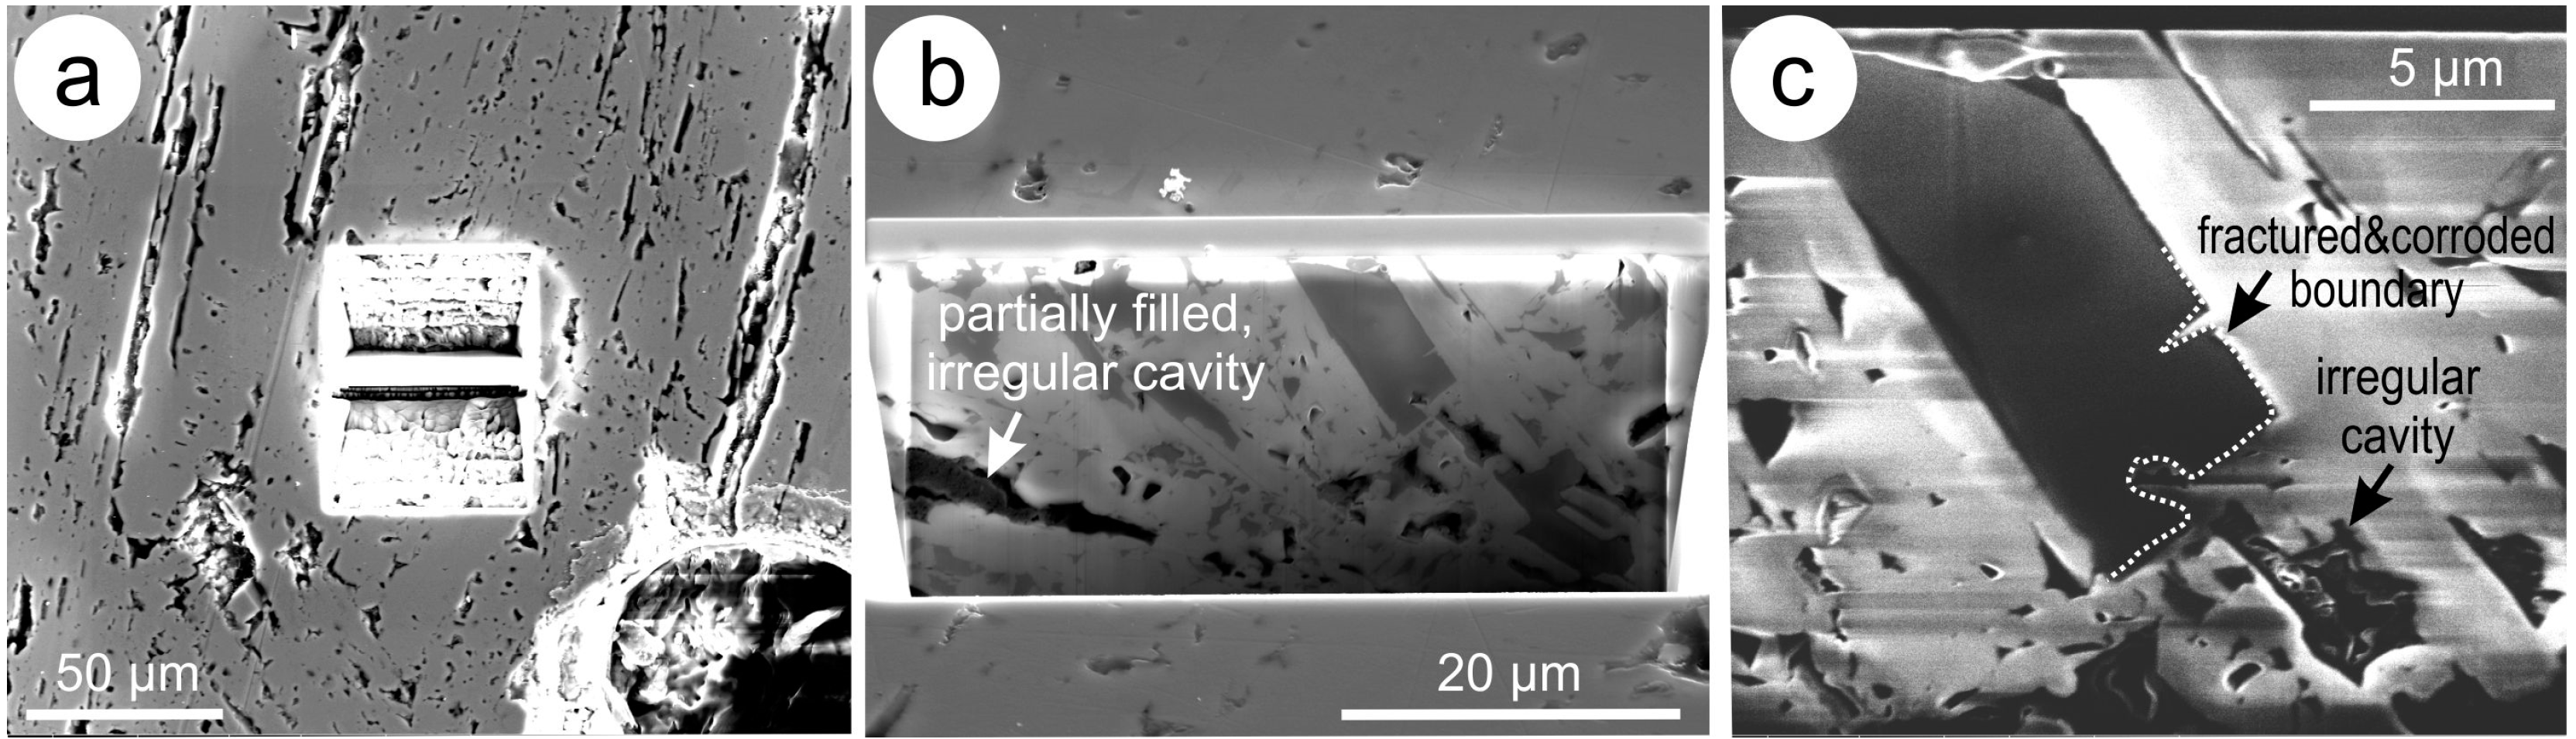
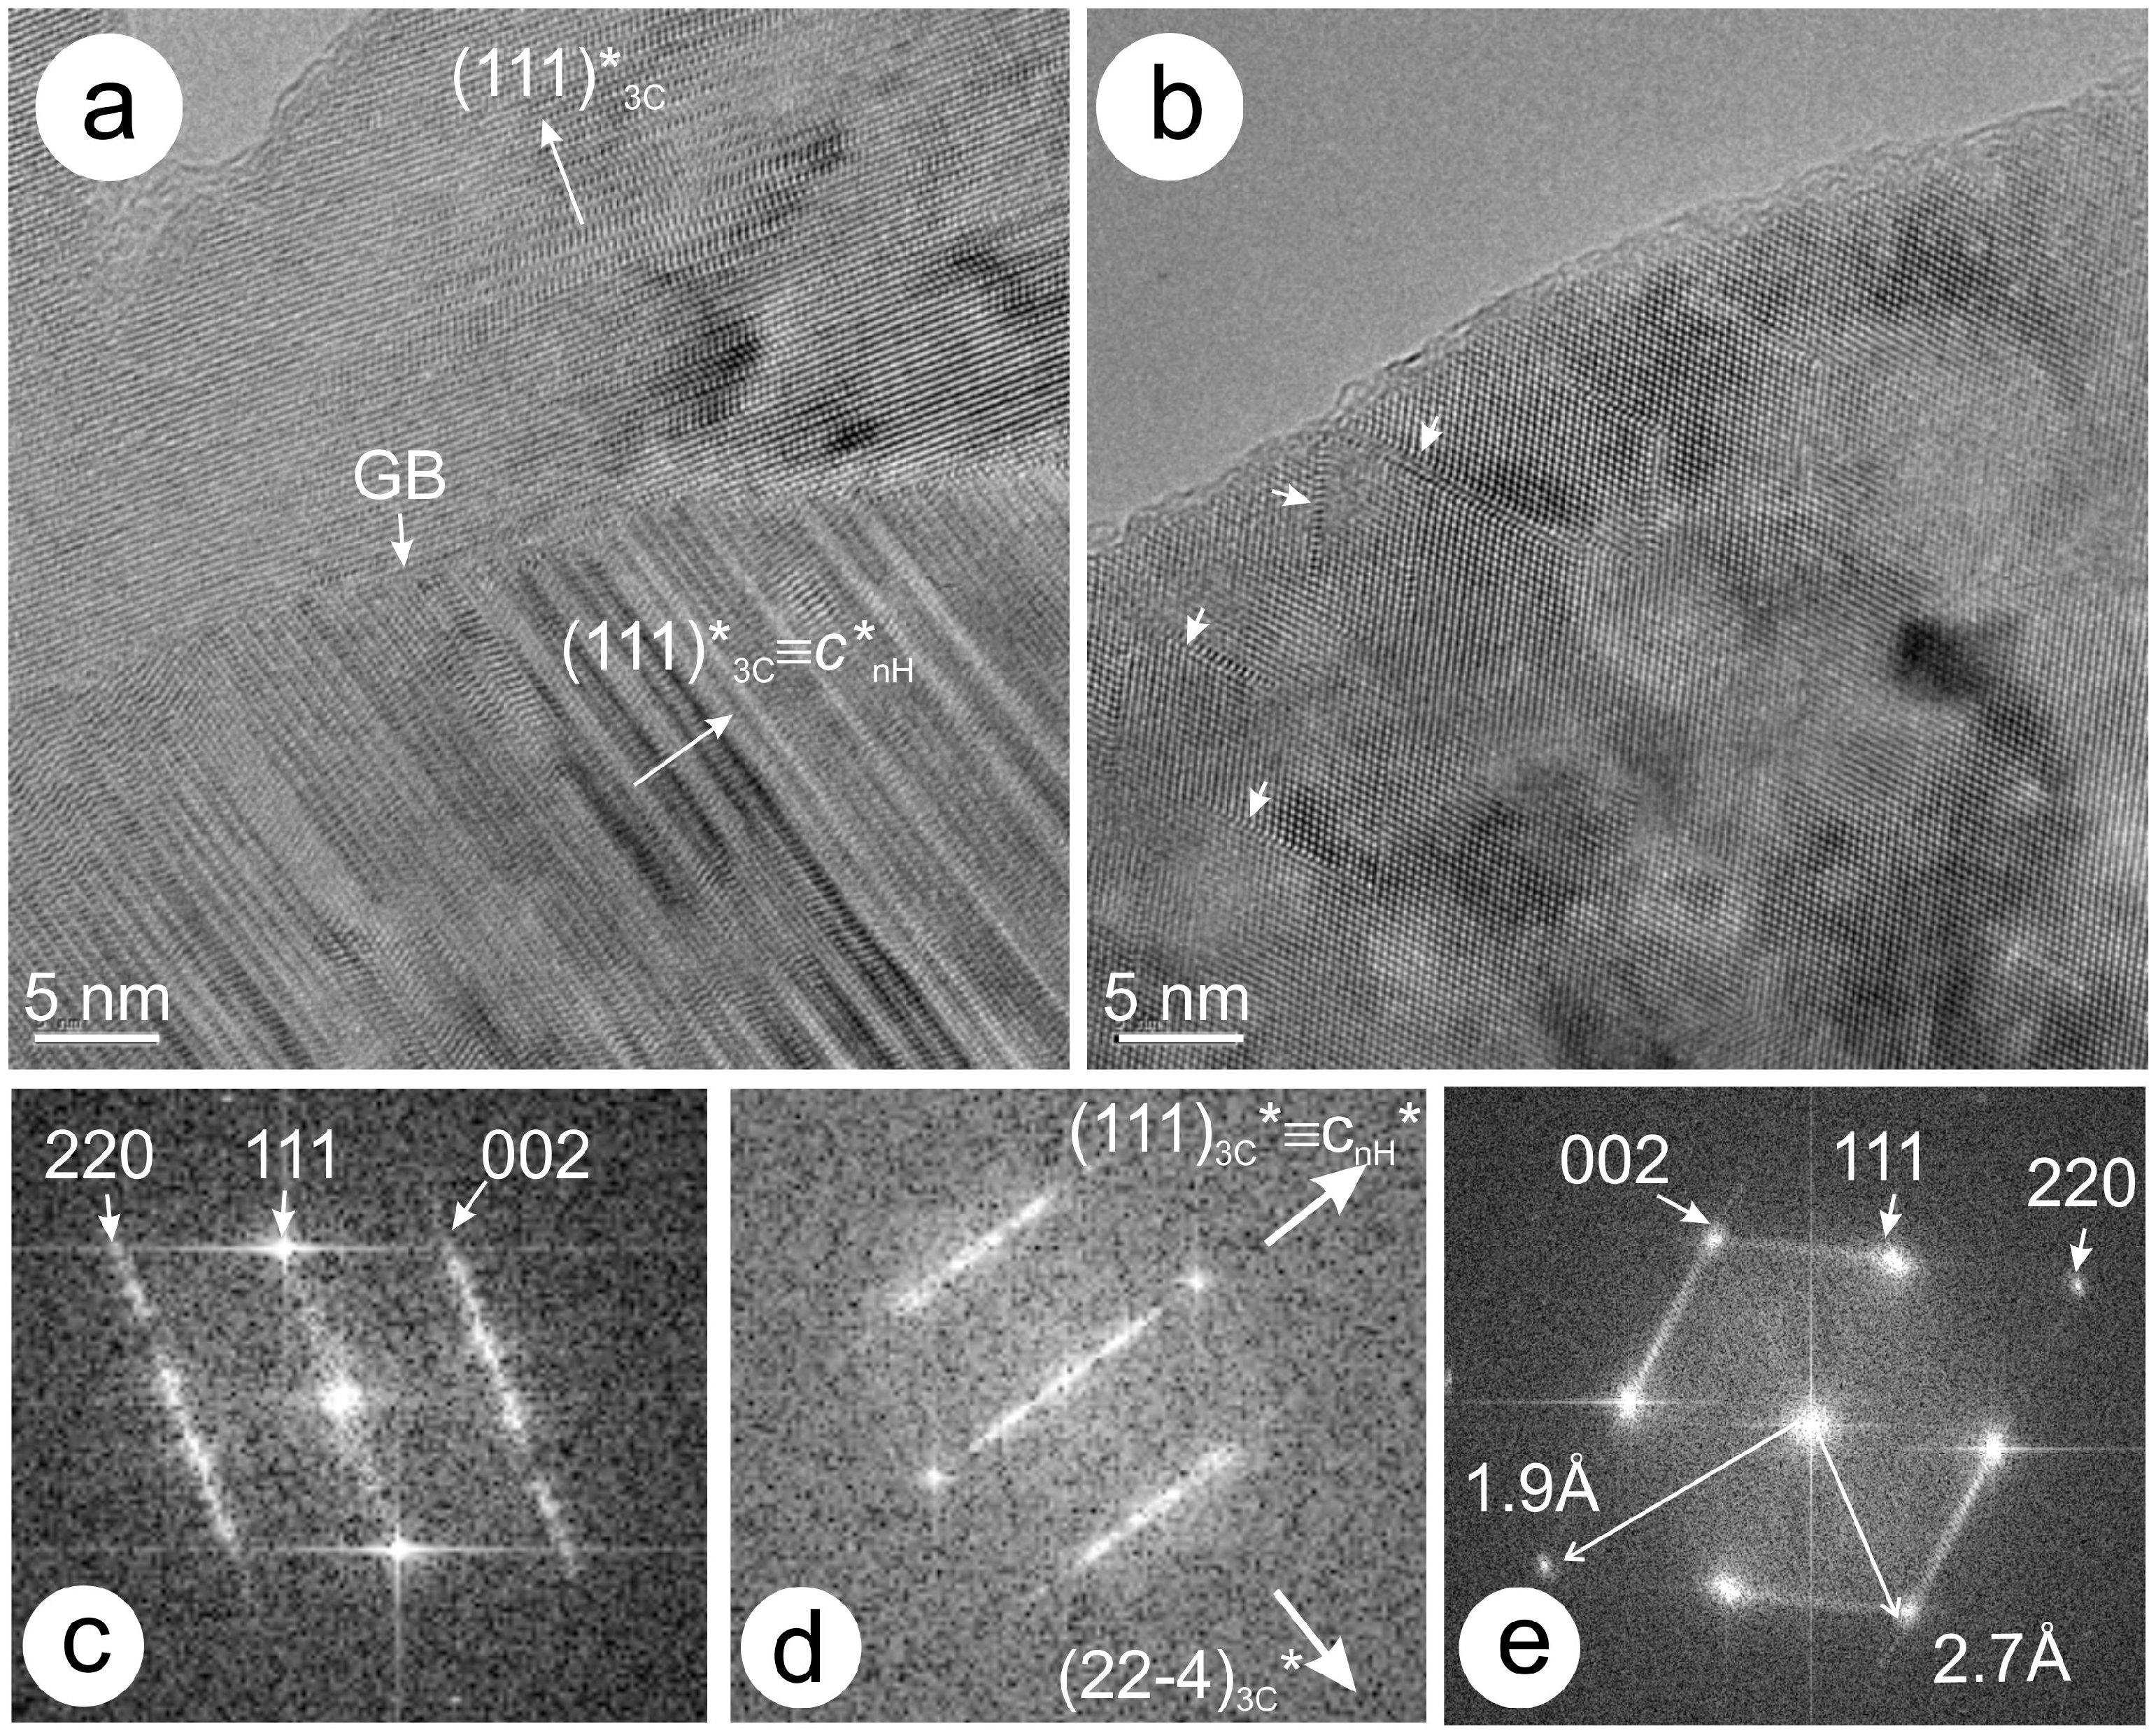
2.2. Nanoscale Sample Characterization
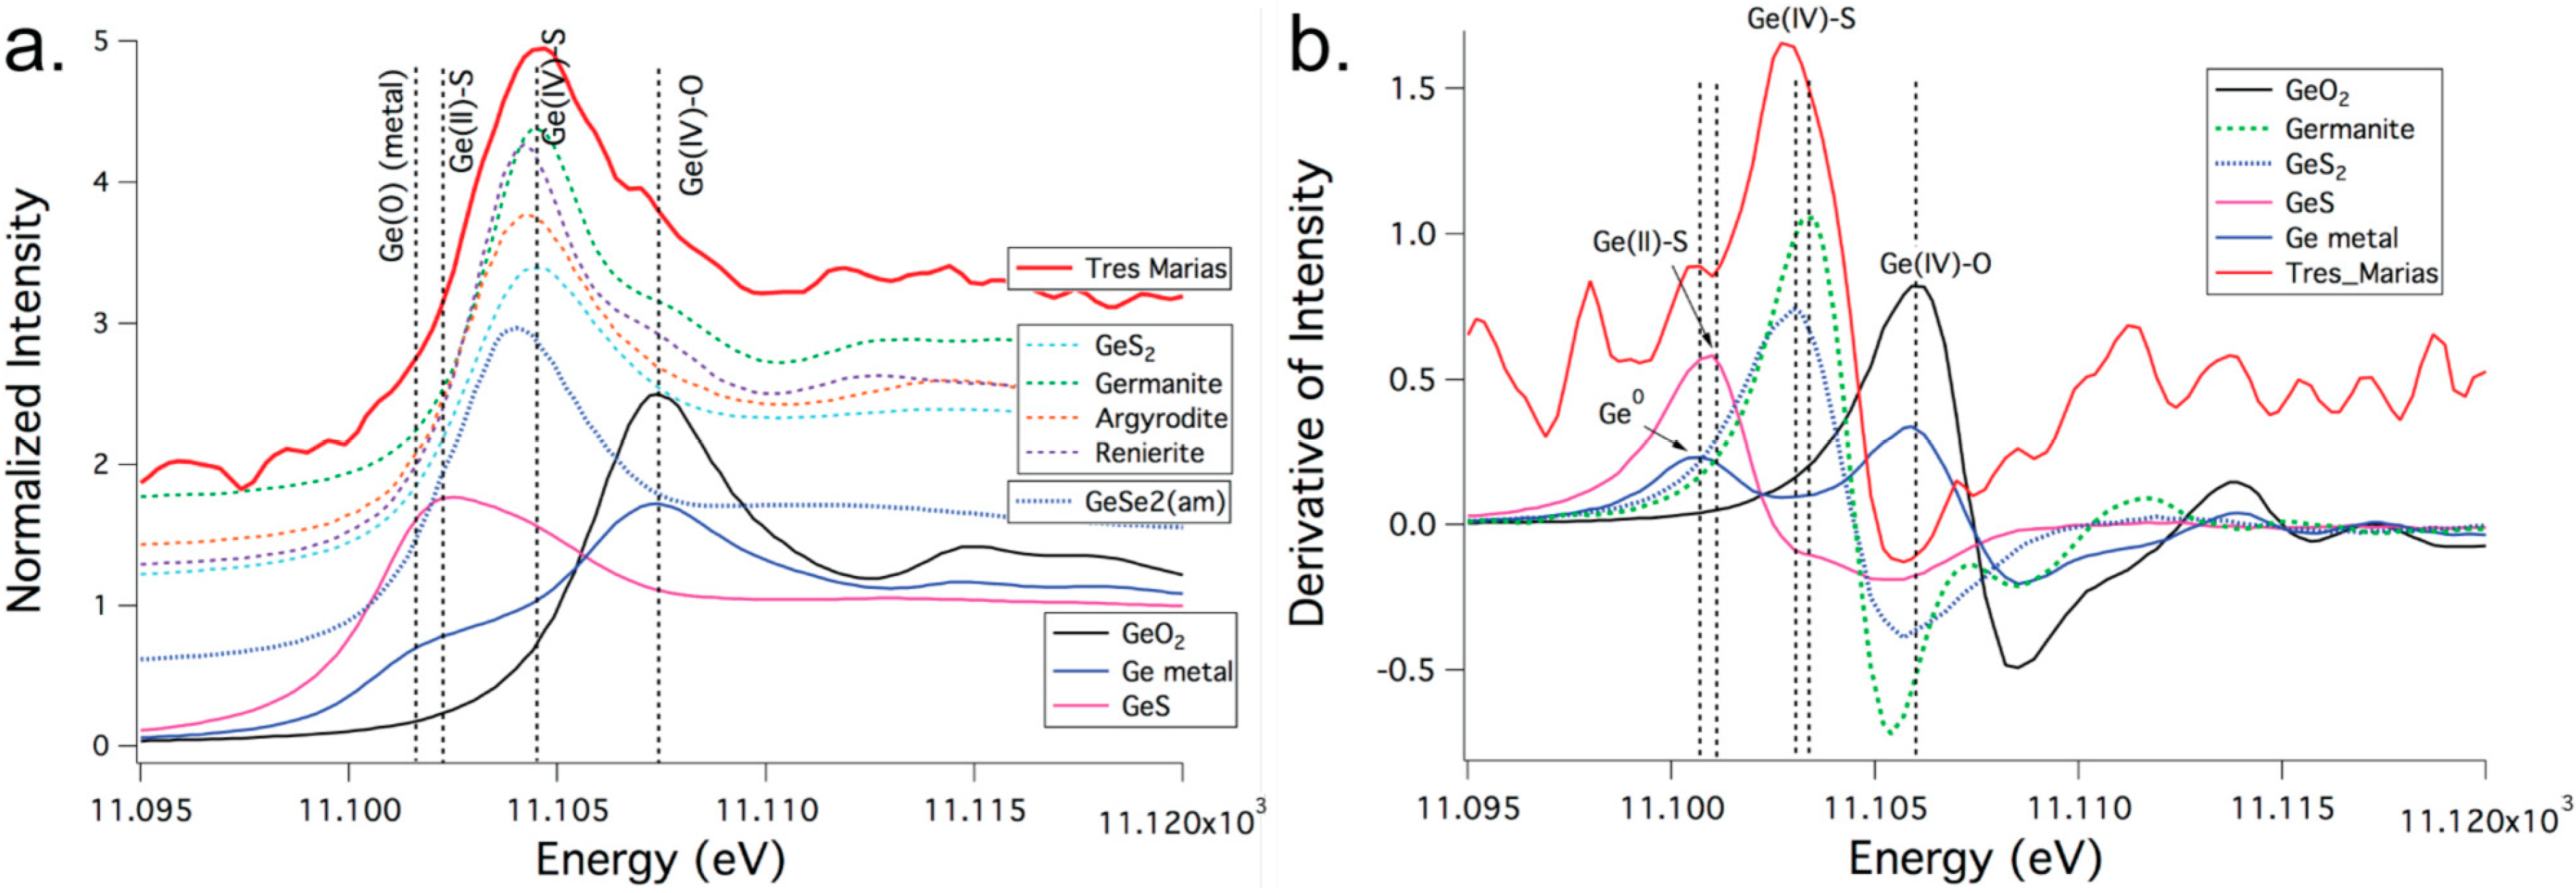
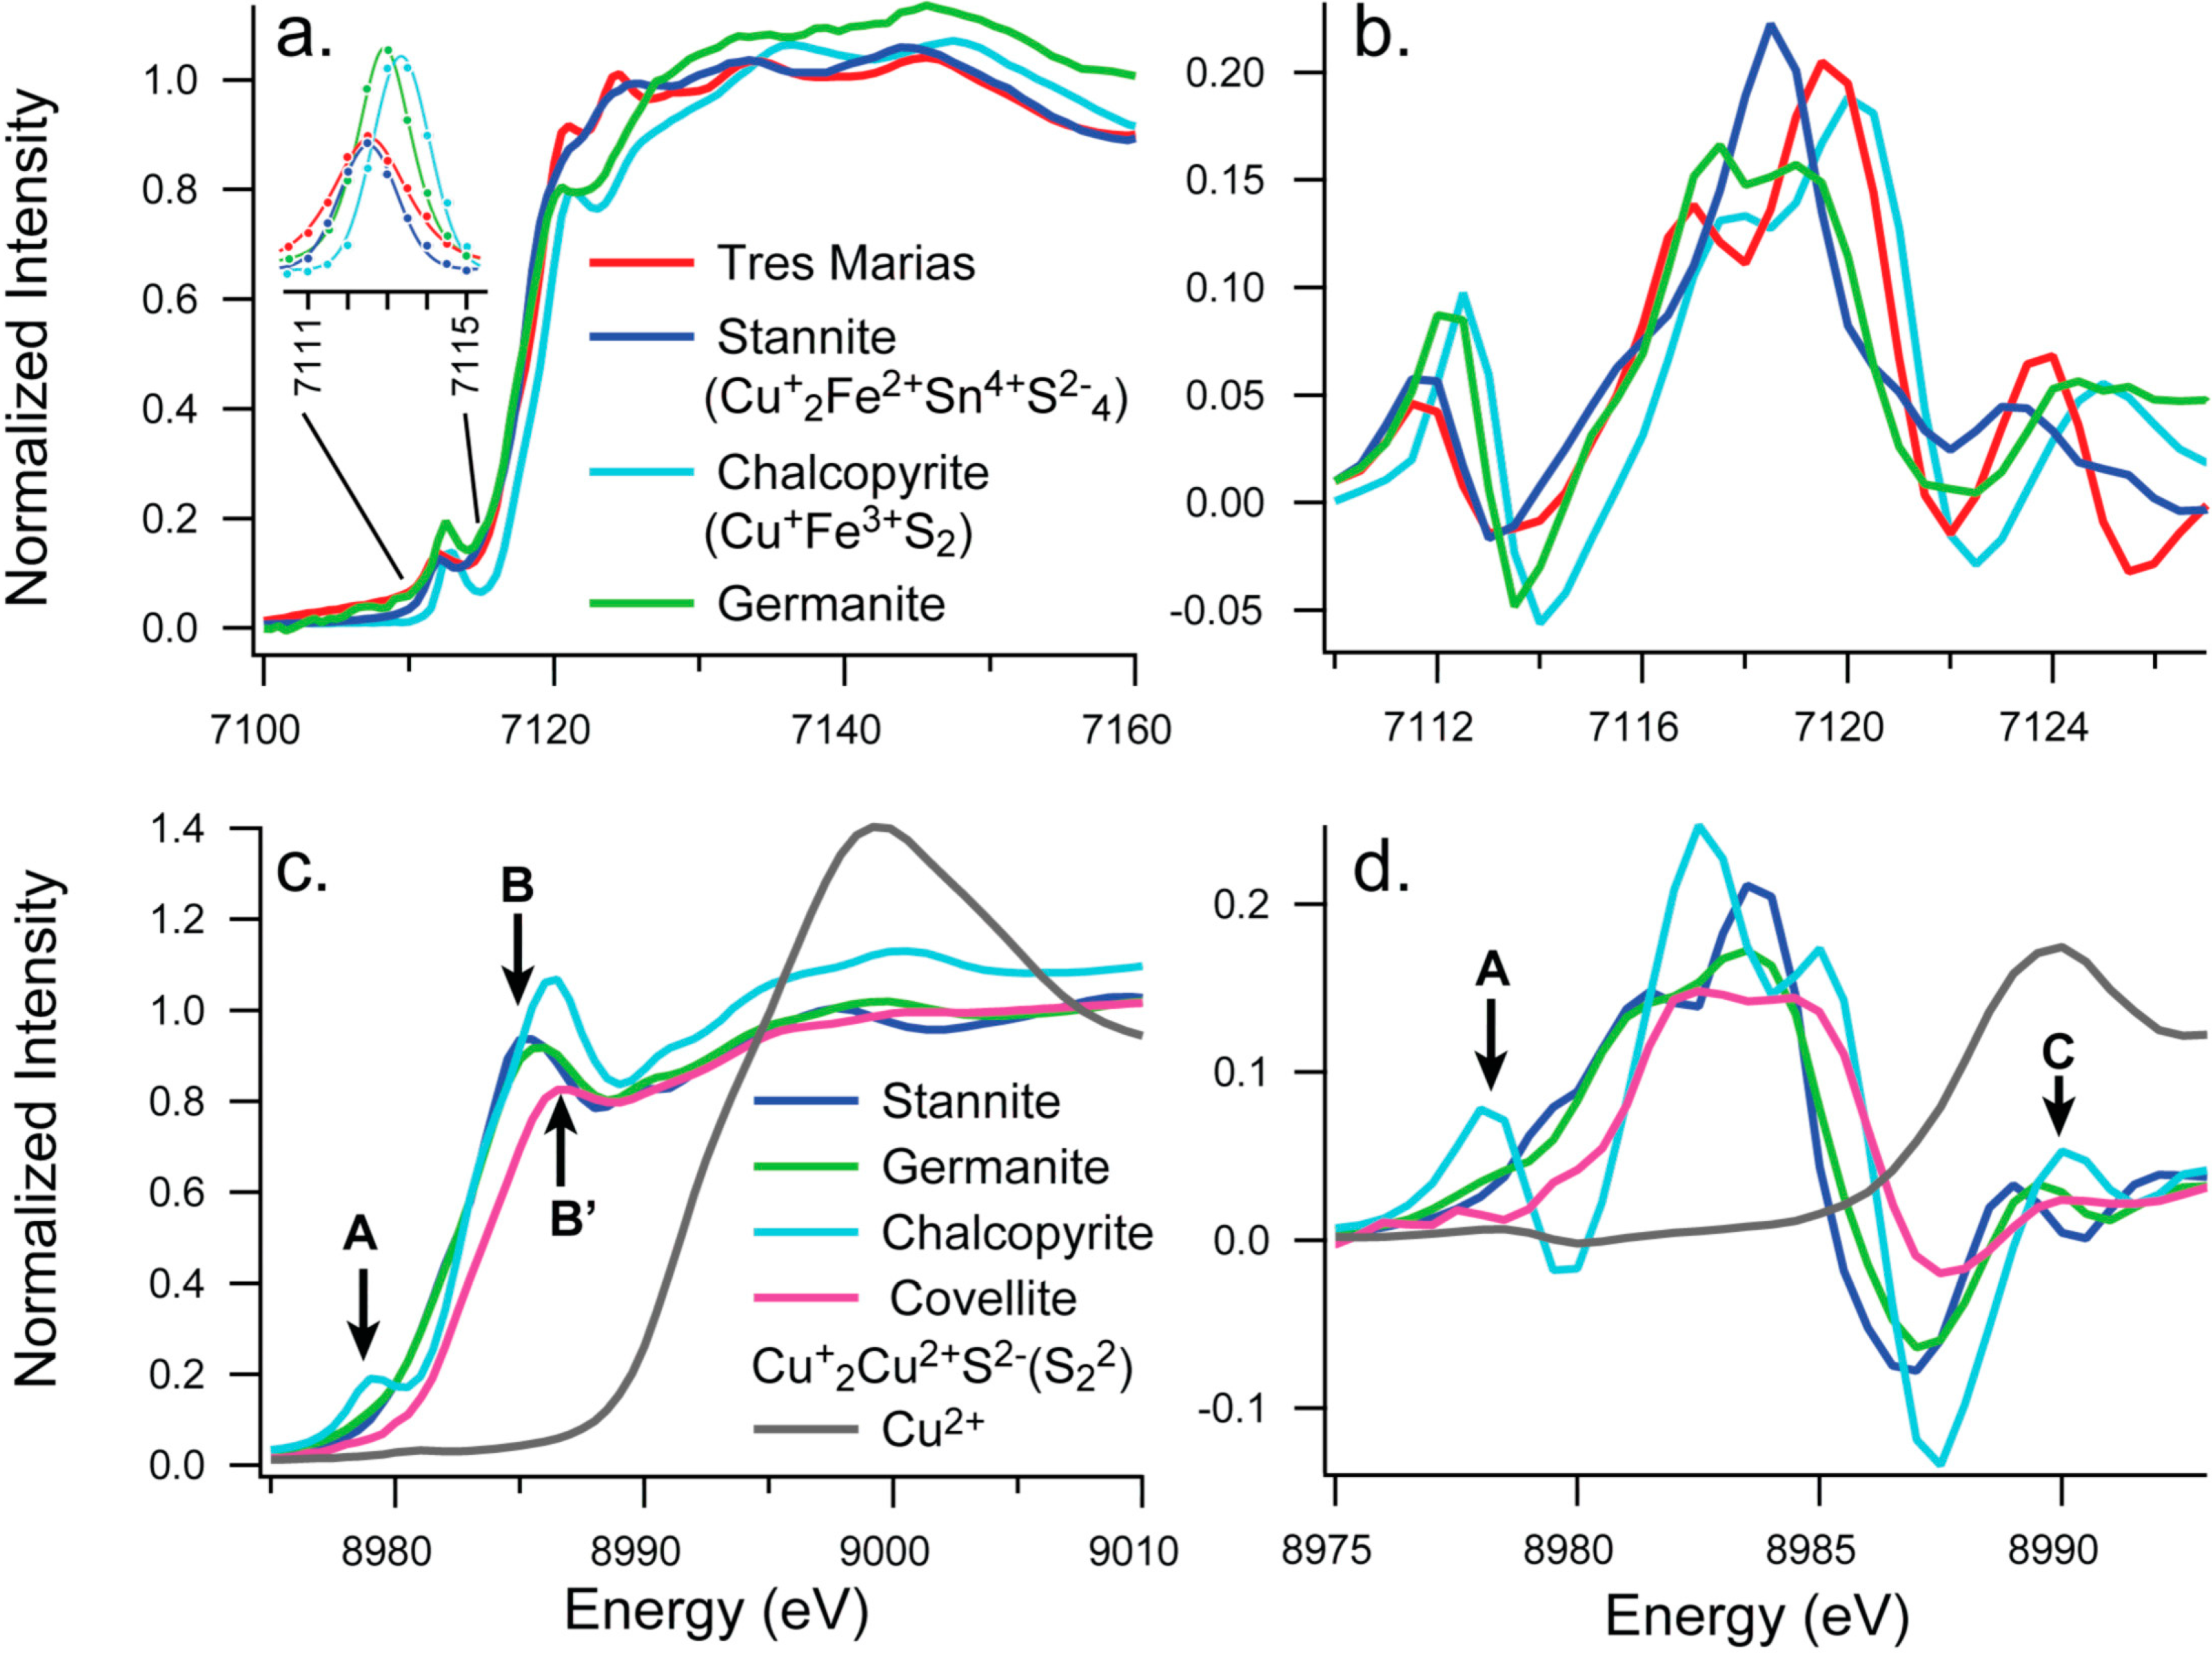
FIB-SEM, synchrotron microbeam X-ray fluorescence microscopy and TEM techniques were employed, following [15], to assess (i) if the micron-scale textural and compositional heterogeneity observed in the Tres Marias material (Figure 1f in [6]; Figure 1) extend down to the nanoscale; and (ii) to understand the relationships between the ZnS polytypes at the nanoscale, in view of the co-existence of variable mixtures between sphalerite (3C) and wurtzite (2H) indicated by the X-ray powder diffraction data obtained on bulk material.
FIB-SEM cross-sectioning and imaging were performed in each of the two areas, (Ge-Fe)-rich and -poor (Figure 2 and Figure 3). The FIB cut in the (Ge-Fe)-rich area was done across the boundaries of blades with or without the characteristic, intricate sub-structure defined by perpendicular grating (subsets of short lamellae; Figure 2a). This type of pattern extends in depth, in particular in the middle part of the wall exposed by FIB cross-sectioning (Figure 2b). Further complexity, however, is shown by the presence of coarse grains (equant domains) on the cross-section margins (arrowed on Figure 2b). The darkest and most homogenous parts on the Secondary Electron (SE) images are present either in these grains or in the adjacent vertical structures. In detail, both vertical and horizontal lamellar sets show sub-μm heterogeneity on SE images (Figure 2c). Moreover, sub-μm pores ± inclusions are present at the boundary and within the horizontal lamellar sets (circled on Figure 2c). The fine, sub-μm zoning is present in all types of structures (Figure 2d–f). Boundary relationships between darker and brighter structures (Figure 2b,d) show a degree of corrosion, i.e., the brighter grain intrudes the outline of the adjacent darker grain. The most complex patterns are represented by sub-micron-scale banding in the brighter portions, both granular and vertical (Figure 2e,f). Furthermore, the brighter structures are typified by numerous pores ± inclusions (circled on Figure 2e), unlike the darker ones which are clean. The corrosion relationship, as well as the presence of pores ± inclusions within the brighter domains, suggests replacement of the darker, homogeneous domains (relict) by the brighter sub-structures.
The cut in the (Ge-Fe)-poor area was also performed perpendicular to the elongation highlighted in this case by sets of microfractures, trails of pores and secondary mineral inclusions (Figure 3a). FIB cross-sectioning reveals filled fractures and cavities at depth, as well as the presence of irregularly shaped darker areas within a brighter matrix (Figure 3b). In detail, the relict character of the darker portions is further highlighted by marginal cracks and relationships with larger cavities (Figure 3c). Compared to the (Ge-Fe)-rich area, the replacement character is well developed, and the brighter matrix features patchiness in shades rather than fine zoning.
Synchrotron X-ray Fluorescence Microscopy using a Vortex silicon drift detector [16] at the Australian Synchrotron was used to obtain element maps of the FIB-prepared slice from the (Ge-Fe)-rich sphalerite (Figure 4) following the same sample preparation approach as [17]. The incident X-ray beam was focused with a Fresnel zone plate to a spot size of ~200 nm. The maps show that the μm-scale substructures identified by FIB cross-section imaging are also expressed by compositional variation, i.e., the darker (on FIB image; Figure 2b,c), relict (?) parts are Zn- and As-poor but clearly Fe- and Ge-rich relative to the brighter parts.
High-resolution TEM imaging of FIB-prepared foils from the (Ge-Fe)-rich area shows irregular boundaries separating grains of different orientation (Figure 5a). In detail, the nanoscale textural complexity is further highlighted by sets of irregular [ 1 1 ¯ 0 ] twins. Such twinning is one of the main mechanisms for polytype transformation between the 3C cubic and nH hexagonal ZnS polytypes (e.g., [15,18,19]. However, the dominant component of the sample is 3C sphalerite featuring lattice-scale defects of which most abundant are stacking faults along (hkl)* directions (Figure 5b). Indexing of the image in Figure 5b is shown in the Fast Fourier Transform (FFT) diffraction in Figure 5e. Similar irregular twin domains and defects have been described for Fe-rich Toyoha sphalerite [15].
Figure 2. Secondary Electron (SE) images of (Ge-Fe)-rich areas showing: (a) location of FIB cut across the intricate sub-structure combining elongate blades and perpendicular subsets of short lamellae (marked); (b) extension of surface structures in depth exposed by FIB cross-sectioning in the middle part of the wall. Note presence of equant domains (arrowed) on the cross-section margins; the rectangle shows the area mapped in Figure 4; (c) detail of lamellar structures showing sub-μm scale heterogeneity; pores ± inclusions are circled; (d) detail of a coarse grain with darkest appearance showing boundary relationships with brighter grain; note partial corrosion on one side (arrowed); (e,f) details of sub-μm-scale heterogeneity expressed as fine banding in the brighter domains exposed in different orientations; pores ± inclusions are circled. FIB-SEM work performed on a Dual Beam FEI Helios Nanolab FIB-SEM platform at Adelaide Microscopy following methods outlined by [15].
Minerals 05 00117 g002
Figure 3. Secondary Electron (SE) images of Ge-Fe-poor area showing: (a) location of FIB cut roughly perpendicular to the elongation highlighted by sets of microfractures, trails of pores and secondary mineral inclusions; (b) extension of surface structures in depth exposed by FIB cross-sectioning. Note filled fractures and cavities (marked) at depth, as well as the presence of irregularly-shaped darker areas within a brighter matrix; (c) marginal cracks and relationships with larger pores lending the darker domains a relict character. The experimental methodology is the same as for Figure 2.
Minerals 05 00117 g003
Relevant crystallographic relationships between the two polytypes are illustrated in Figure 5a, i.e., lattice fringes of the upper and lower grains, with orientations shown by indexed FFT diffractions (Figure 5c,d computed from the image in Figure 5a). Relationships across the grain boundary can also be clearly seen from the orientation of dominant lattice fringes (75° to one-another). Transformation into wurtzite takes place by twinning along the (111)* direction of initial sphalerite (3C polytype) which corresponds to the c* axis of wurtzite or other hexagonal ZnS polytypes (c*nH). This means that the stacking direction of horizontal sets of lamellae in Figure 2 are along the (111)* axis of sphalerite epitaxial with c* axis in wurtzite.
Figure 4. Microbeam X-ray Fluorescence element maps for Fe, Zn, Ge and As in a slice cut from Ge-Fe-rich area in the Tres Marias sphalerite (rectangle on Figure 2b). A 200 nm step size was used; which corresponded to the approximate beam size (Australian Synchrotron) and was also nearly identical to the smallest possible beam size. The maps show that the μm-scale structures identified by FIB cross-section imaging are also expressed by compositional variation, i.e., the darker, relict domains are Zn and As-poor but clearly Fe- and Ge-rich relative to the brighter domains. The map lower right is a composite of the Fe (red), Zn (green) and Ge (blue) maps.
Minerals 05 00117 g004

3. μ–XANES Data

Germanium, Cu and Fe K-edge XANES spectra were collected at the Microfocus Spectroscopy Beamline (I18), Diamond Light Source Synchrotron facility, UK I18 uses a Si(111) monochromator, the incident X-ray beam was focused to ~2 × 2 μm2 using Kirkpatrick-Baez (KB) mirrors. The fluorescence data were collected using a four-element Si-Drift detector and transmission data with ion chambers. Ge and Cu XANES data were collected in fluorescence mode from the Ge-Fe-rich area of the polished mount. Al and Ni filters were used to cut down fluorescence from Zn at the Ge edge. Fe Kα data were collected in transmission from pressed pellets made from the powdered sample diluted with boron nitride (BN). XANES/EXAFS (Extended X-ray Absorption Fine Structure) were measured on the reference materials, which included GeO2 (99.999%, Strem Chemicals; tetragonal modification with quartz-like structure [20]); germanite Cu13Fe2Ge2S16 (South Australian Museum (SAM) G4777, Tsumeb Mine, Namibia; Ge, Cu, Fe); partially oxidized powdered Ge metal (British Drug House (BDH)) Chemicals; 99.99% Ge); stannite (Cu2FeSnS4, SAM G19206 Yaogangxian Mine, Hunan, China; Cu, Fe); and chalcopyrite CuFeS2 (SAM G22621, Moonta Mines, South Australia; Cu, Fe). In addition, argyrodite Ag8GeS6 (Museum Victoria (M), Melbourne, Australia, sample number M3071; [21]); renierite Cu11ZnGeFe4S16 (M47647); synthetic GeS2 glass (synthesized by heating high-purity (5N) Ge and S that had been vacuum sealed in quartz ampules to 900 °C, rocked for 10 h and then quenched in air [22,23,24]); synthetic GeSe2 glass (synthesized via the melt-quenching method [25,26]); and synthetic GeS (orthorhombic; Strem Chemicals, 99.999%) were measured in transmission mode on pellets either at the X-ray Absorption Spectroscopy (XAS) beamline of the Australian Synchrotron or at BM18, the Core EXAFS beamline at the Diamond Light Source. Beamline energies were calibrated using Fe and Cu foils as well as Ge-metal; in addition, the same GeO2(s) pellet was measured at all three beamlines to provide a direct comparison across the datasets.
Figure 5. High Resolution Transmission Electron Microscopy (HRTEM) images of Ge-Fe-rich sphalerite showing (a) an irregular boundary (GB) separating grains of different orientation, i.e., (111)*3C at 75° to one another. Note sets of irregular [1,2,3,4,5,6,7,8,9,10] twins expressed by contrast differences on the lower grain; (b) 3C sphalerite down the same zone axis showing abundant stacking faults along (hkl)* directions (arrowed). Images recorded using a JEOL 2011 instrument (JEOL Co. Ltd., Akishima, Japan) at the Monash Centre for Electron Microscopy, operated at 200 kV. (ce) Fast Fourier Transform diffractions computed from images in (a) and (b), showing orientations of upper and lower grains in (a) as (c) and (d), and of the grain from (b) in (e).
Minerals 05 00117 g005
The assignment of the oxidation state of Ge in sulfide minerals is poorly constrained, as these minerals are generally structurally and compositionally complex. Ge is assumed to exist in tetravalent form in known Ge-sulfide minerals, and is present in tetrahedral coordination with Ge-S distances in the range of 2.19–2.35 Å (renierite, Cu11ZnGeFe4S16, 2.27 Å [27]; Ag2PbGeS4, 2.2212 Å [28]; putzite, (Cu4.7Ag3.3)GeS6, 2.192 Å [29]; argyrodite, Ag8GeS6, 2.212 Å [21]; Cu8GeS6, 2.235 Å [30]). In germanite, nominally Cu+16Cu2+10Fe3+4Ge4+4S32 assuming a Ge4+ oxidation state, Fe and Ge share a tetrahedral site, with (Ge,Fe)-S distances of 1 × 2.18 Å and 3 × 2.35 Å (mean 2.31 Å) [31]. Only in the GeS2 glass can the oxidation state be formally assigned as Ge4+ and here the Ge is tetrahedral with Ge-S distances of 2.224 Å [32]. The Ge-S bond length in the GeS2 glass was refined from our data to be 2.231(9) Å with a Debye-Waller of 0.0023(6) Å2. Divalent germanium typically occurs in triangular pyramidal coordination in oxide and halogenide compounds, with a stereochemically active lone electron pair oriented opposite to the triangle of anions, similar to As3+ [33]. In GeS(orthorhombic), Ge2+ exists in 3 + 2 coordination, with Ge-bonding distances significantly greater than in 4 + compounds (3 × 2.441; 2 × 3.270 Å [34]).
The low Ge and high Zn concentrations (Ge Kα1 fluorescence line at 9.886 keV receiving some background from the Zn Kβ1 line) resulted in rather noisy Ge spectra for the Tres Marias sphalerite; however, the spectra measured on different points on the sample were similar. The average of five Ge Kα edge spectra for Ge-bearing sphalerite is shown in Figure 6a, along with reference materials. The “white line” (peak) for the Tres Marias sample aligns with that of germanite, argyrodite, renierite, and the GeS2 glass, indicating that the oxidation state and local environment (geometry, nature of ligands) of Ge in these samples are similar. Plots of the derivative for the XANES spectra (Figure 6b) show that: (i) the peak of the derivative (inflexion point) for GeO2 is shifted by ~5 eV relative to the first peak of oxidized Ge metal; (ii) the second peak of the Ge metal aligns well with GeO2, demonstrating that the metallic powder was partially oxidized into Ge+4; and (iii) the peak for germanite lies between metallic Ge and GeO2 (~3 eV below GeO2), but 2 eV above that of GeS; the peak of GeS is at approximately the same position as metallic Ge. The alignment of the Tres Marias sphalerite, germanite, renierite and argydorite spectra with GeS2 glass indicates that Ge is present as Ge4+ in all these minerals.
Figure 6. Ge K-edge XANES data for the Tres Marias sample compared to standards ((a) normalized; (b) first derivative).
Minerals 05 00117 g006
In general, the edge position shifts towards higher energy with increasing valence state of the resonant atom, as the energy shift of a core state is directly related to the variation of the atomic electronic occupancy [35]. This correlation is strong for semi-metals such as As (e.g., [36]) and Te (e.g., [37]), for which the energy of the first peak in the derivative of the XANES spectrum shifts nearly monotonically with formal oxidation state, regardless of the associated ligand. Exceptions to this rule exist, notably chromium [38], where the shift in edge energy for Cr3+ with various ligands is comparable to the shift between Cr0 and Cr6+. After examining the density of states, [38] concluded that geometry and not electronegativity was the driving factor behind these large energy shifts. In the case of Ge, the large shift between GeO2 and GeS2, both of which contain tetrahedral-coordinated Ge4+ is surprising and cannot be explained by geometry. It must be predominantly related to the effect of the ligand. Note that both S and Se have a similar effect relative to O (Figure 6). The electronegativity of Ge favors covalent bonding with many ligands; Ge–O bonds have about 31% ionic character and Ge–S bonds only 7% [39].
Fe K-edge XANES were collected on the Tres Marias sphalerite, and Fe and Cu K-edge XANES were collected on germanite, a sphalerite-derivative [31]. The edge position in Fe and Cu K-edge XANES spectra is commonly obscured [40], and most determinations of oxidation states rely on empirical calibrations, which depend, in turn, on the material investigated [41]. For the Fe data, most calibrations rely on the position of the pre-edge (1s → 3d) at around 7113 eV. In all the minerals shown in Figure 7a,b, Fe is present in tetrahedral coordination. Stannite contains Fe2+ [42]; the overall spectra and the pre-edge positions (7112.54 and 7112.56 eV, respectively) are similar in stannite and Tres Marias sphalerite, suggesting similar prevalent coordination and oxidation states. The formal oxidation state of Fe in chalcopyrite is likely to be Fe3+, and the position of the pre-edge is shifted by ~0.8 eV (7113.37 eV). The Fe-K-edge XANES of germanite is intermediate between stannite and chalcopyrite (pre-edge at 7112.94 eV), suggesting a mixed oxidation state of Fe.
Figure 7. Fe and Cu K-edge XANES data for the Tres Marias sphalerite compared to standards ((a), (c), normalized; (b), (d), first derivative).
Minerals 05 00117 g007
Charge balance considerations require that Cu exists in mixed oxidation state (Cu+/Cu2+) in germanite. Germanite contains four tetrahedrally-coordinated Cu sites [31]. The Cu-XANES spectrum of germanite is close to that of stannite, in which the formal oxidation state of copper is +1. The lack of pre-edge at ~8980 keV (arrow A in Figure 7c) and the distinct pre-edge appearing as a shoulder at 8983 keV (arrow B in Figure 7c) are key features of Cu+ compounds, suggesting the strong monovalent character for some of the Cu in germanite ([40], Figure 7c,d). This situation is analogous to covellite (CuS), which based on the structural formula Cu+2Cu2+(S2)2−S2− contains both Cu(I) and Cu(II) in 2:1 ratio [43]. However, XANES and X-ray photoelectron spectroscopy (XPS) data show little evidence for Cu(II) in covellite [44,45], reflecting the covalent nature of the Cu-S bonds and the mainly monovalent nature of Cu in this mineral.

4. Discussion

According to the XANES data, germanium is present as Ge4+ in the natural Ge-sulfides germanite, argyrodite, and renierite as well as in the Tres Marias sphalerite. Iron in the sphalerite is predominantly in divalent form, while Fe in germanite is mixed valence. Copper in germanite has a strong monovalent affinity and XANES does not confirm the presence of Cu(II) in germanite. This study also demonstrates the versatility of synchrotron radiation for the determination of chemical state of trace elements in natural minerals [46,47].
The stable oxidation states of Ge in the solid state are Ge2+ and Ge4+. Germanium is an element of low crustal abundance; most Ge is found in small amounts (few ppm) in silicate minerals, due to isomorphous substitution of Ge4+ for the Si4+ [8]. Germanium forms discrete Ge-minerals in a limited number of ore deposits, notably in the Tsumeb Mine, Namibia [48] and the Apex Mine, Utah, USA [49]. Ge4+ is present in all known minerals where the germanium oxidation state can be established unambiguously. Ge2+ was proposed by [50] to occur in the Ge-spinel, brunogeierite (Fe2GeO4), but a recent re-investigation has shown that ideal, end-member brunogeierite is (Fe2+)2Ge4+O4 [33]. [51] suggested that Ge2+ substitutes for Pb2+ in anglesite and cerussite from Tsumeb (50 to 500 ppm Ge). Germanium is assumed to be transported in the tetravalent state (e.g., germanic acid, H4GeO4(aq), and its dissociation products, and possibly chloride and fluoride complexes) in hydrothermal fluids [52]. However, we note that Ge2+ is stable in aqueous solutions even at room temperature (standard potential of 0 V for the Ge4+ + 2e = Ge2+ reaction [53]). Complexing and increase in temperature will increase the relative stability of the Ge2+ oxidation state in hydrothermal solutions (e.g., compare with tellurium; [54]). The first unambiguous occurrence of Ge2+ in a natural mineral may have been observed by [55]. On the basis of XANES and EXAFS data, [55] suggest the presence of both Ge2+ and Ge4+ in Ge-bearing MVT-type sphalerite from Tennessee. The material studied by Bonnet et al. [55] is clearly different from that studied here. These differences are emphasized by the additional observation of (argutite-like) Ge4+ surrounded by oxygen atoms, and an inverse correlation between Ge and Fe in the Tennessee material.
Combined with the LA-ICP-MS data that show no correlation between Ge and monovalent cations substituting in the Tres Marias sphalerite, our XANES data suggest that the substitution of Ge4+ + (vacancy) for (Zn2+, Fe2+) is the main mechanism of Ge incorporation in the studied sphalerite. Why the substitution of Zn2+ ↔ Ge4+ + (vacancy) is closely associated with Fe-rich zones is not clear. [11] used autocorrelation analysis of infrared spectra of Fe-bearing sphalerites to show that there is little strain introduced into the structure associated with Fe substitution of Zn. Thus the concentration of Ge4+ in iron-rich domains appears to be a distinct characteristic of the Tres Marias sphalerite-dominated ZnS.
Compositional-textural heterogeneity in the Tres Marias sample is observed at a scale finer than that of the microbeam used for the XANES measurements (~2 × 2 μm2). This intrinsic micron- to nanoscale heterogeneity is expressed both texturally and compositionally in the Tres Marias material. This may be the result of a “two-stage deposition process: early Ge-Fe-rich Zn sulfide precipitated, surrounded by later Ge-Fe-poor Zn sulfide”, the interpretation given by [9]. The data here indicate that early Fe-rich sphalerite (~8 wt% Fe; occurring as darkest structures on the SE images on Figure 2 and Figure 3), is the main Ge-carrier (up to ~1000 ppm Ge; [6]), as shown by the correlation between compositional patterns (Figure 4) and textures revealed by FIB cross-sectioning (Figure 2). However, the sample also shows intergrowths between the dominant sphalerite and a lesser wurtzite component that could be part of a primary growth process rather than the product of two-stage crystallization. Considering the evidence for corrosion and pores ± inclusions in the (Ge-Fe)-rich area (Figure 2) it is more logical to assume a polystage formation. Moreover, from the more advanced porosity and cavities, partially filled by secondary minerals, in the (Ge-Fe)-poor areas (Figure 3), fluid-driven replacement can be inferred.
Transformation of sphalerite into wurtzite is promoted by (111)* twinning or lattice-scale defects (Figure 5) and leads to a heterogeneous ZnS sample, in which the dominant component, sphalerite, can host up to ~20% wurtzite (X-ray powder diffraction data). Whereas crystal-structural control of transformation between the two ZnS polytypes is a common feature in many Zn-ores, Ge-enrichment is consistent with formation of Fe-rich sphalerite at Tres Marias. We note the similarity to textures described by [56], in which Fe-rich, trace-element-bearing acicular sphalerite was considered to have formed as wurtzite and subsequently underwent transformation to sphalerite, even if the scenario favoured in this paper indicates a partial transformation of initial sphalerite into zones that contain intergrown wurtzite.

Acknowledgements

We gratefully acknowledge the Diamond Light Source Synchrotron facility for beamline access and excellent collaboration during our visit to UK (experiment sp7563). Part of this research was undertaken on the XAS and X-ray fluorescence microscopy (XFM) beamlines at the Australian Synchrotron, Victoria, Australia. We sincerely thank Bernhardt Saini-Eidukat and Frank Melcher for making the sample available to us. Rongping Wang (Australian National University (ANU), Canberra, Australia) generously provided the GeSe2 glass sample. The authors acknowledge the use of facilities within the Monash Centre for Electron Microscopy and the use of equipment funded by Australian Research Council (ARC) grant RIEFP99. The manuscript benefitted from the comments from three anonymous reviewers.

Author contributions

N.J.C. led the grant application for synchrotron access and co-ordinated this work together with J.B. B.E. conducted the XAS data analysis, C.L.C. performed the nanoscale characterization; D.H., T.W., N.R., B.J. and K.G. assisted with experiments and expertise. A.P. provided samples and contributed to interpretations; G.C. contributed standards and expertise.

Conflicts of Interest

The authors declare no conflict of interest.

References

  1. Seredin, V.V. From coal science to metal production and environmental protection: A new story of success Commentary. Int. J. Coal Geol. 2012, 90, 1–3. [Google Scholar] [CrossRef]
  2. Frenzel, M.; Ketris, M.P.; Gutzmer, J. On the geological availability of germanium. Miner. Depos. 2014, 49, 471–486. [Google Scholar] [CrossRef]
  3. Moh, G.H.; Jäger, A. Phasengleichgewichte des Systems Ge–Pb–Zn–S in Relation zu Germanium-Gehalten alpiner Pb–Zn-Lagerstätten. Verh. Geol. Bundesanst. Wien 1978, 1978, 437–440. (In German) [Google Scholar]
  4. Johan, Z. Indium and germanium in the structure of sphalerite: An example of coupled substitution with copper. Mineral. Petrol. 1988, 39, 211–229. [Google Scholar] [CrossRef]
  5. Belissont, R.; Boiron, M.-C.; Luais, B.; Cathelineau, M. LA-ICP-MS analyses of minor and trace elements and bulk Ge isotopes in zoned Ge-rich sphalerites from the Noailhac–Saint-Salvy deposit (France): Insights into incorporation mechanisms and ore deposition processes. Geochim. Cosmochim. Acta 2014, 126, 518–540. [Google Scholar] [CrossRef]
  6. Cook, N.J.; Ciobanu, C.L.; Pring, A.; Skinner, W.; Shimizu, M.; Danyushevsky, L.; Saini-Eidukat, B.; Melcher, F. Trace and minor elements in sphalerite: A LA-ICPMS study. Geochim. Cosmochim. Acta 2009, 73, 4761–4791. [Google Scholar] [CrossRef]
  7. Lin, Y.; Cook, N.J.; Ciobanu, C.L.; Liu, Y.P.; Zhang, Q.; Liu, T.G.; Gao, W.; Yang, Y.L.; Danyushevskiy, L. Trace and minor elements in sphalerite from base metal deposits in South China: A LA-ICPMS study. Ore Geol. Rev. 2011, 39, 188–217. [Google Scholar] [CrossRef]
  8. Höll, R.; Kling, M.; Schroll, E. Metallogenesis of germanium—A review. Ore Geol. Rev. 2007, 30, 145–180. [Google Scholar] [CrossRef]
  9. Saini-Eidukat, B.; Melcher, F.; Lodziak, J. Zinc-germanium ores of the Tres Marias Mine, Chihuahua, Mexico. Miner. Depos. 2009, 44, 363–370. [Google Scholar] [CrossRef]
  10. Di Benedetto, F.; Andreozzi, G.B.; Bernardini, G.P.; Borgheresi, M.; Caneschi, A.; Cipriani, C.; Gatteschi, D.; Romanelli, M. Short-range order of Fe2+ in sphalerite by 57Fe Mössbauer spectroscopy and magnetic susceptibility. Phys. Chem. Miner. 2005, 32, 339–348. [Google Scholar] [CrossRef]
  11. Pring, A.; Tarantino, S.C.; Tenailleau, C.; Etschmann, B.; Carpentep, M.A.; Zhang, M.; Lin, Y.; Withers, R.L. The crystal chemistry of Fe-bearing sphalerites: An infrared spectroscopic study. Am. Mineral. 2008, 93, 591–597. [Google Scholar] [CrossRef] [Green Version]
  12. Cook, N.J.; Ciobanu, C.L.; Meria, D.; Silcock, D.; Wade, B. Arsenopyrite-pyrite association in an orogenic gold ore: tracing mineralization history from textures and trace Elements. Econ. Geol. 2013, 108, 1273–1283. [Google Scholar] [CrossRef]
  13. Wilson, S.A.; Ridley, W.I.; Koenig, A.E. Development of sulfide calibration standards for the laser ablation inductively-coupled plasma mass spectrometry technique. J. Anal. At. Spectrom. 2002, 17, 406–409. [Google Scholar] [CrossRef]
  14. George, L.; Cook, N.J.; Ciobanu, C.L.; Wade, B.P. Trace and minor elements in galena: A reconnaissance LA-ICP-MS study. Am. Mineral. 2015, 100, 548–569. [Google Scholar] [CrossRef]
  15. Ciobanu, C.; Cook, N.J.; Utsunomiya, S.; Pring, A.; Green, L. Focussed ion beam-transmission electron microscopy applications in ore mineralogy: Bridging micro- and nanoscale observations. Ore Geol. Rev. 2011, 42, 6–31. [Google Scholar] [CrossRef]
  16. Paterson, D.; de Jonge, M.D.; Howard, D.L.; Lewis, W.; McKinlay, J.; Starritt, A.; Kusel, M.; Ryan, C.G.; Kirkham, R.; Moorhead, G.; et al. The X-ray Fluorescence Microscopy Beamline at the Australian Synchrotron. In 10th International Conference on X-Ray Microscopy; McNulty, I., Eyberger, C., Lai, B., Eds.; American Institute of Physics: College Park, MD, USA, 2011; pp. 219–222. [Google Scholar]
  17. Cook, N.J.; Ciobanu, C.L.; Brugger, J.; Etschmann, B.; Howard, D.L.; de Jonge, M.D.; Ryan, C.; Paterson, D. Determination of the oxidation state of Cu in substituted Cu-In-Fe-bearing sphalerite via mu-XANES spectroscopy. Am. Mineral. 2012, 97, 476–479. [Google Scholar] [CrossRef]
  18. Fleet, M.E. Structural Transformations in Natural Zns. Am. Mineral. 1977, 62, 540–546. [Google Scholar]
  19. Pósfai, M.; Buseck, P.R. Modular structures in sulphides: sphalerite/wurtzite-, pyrite/marcasite-, and pyrrhotite-type minerals. EMU Notes in Mineral. 1997, 1, 193–235. [Google Scholar]
  20. Smith, G.S.; Isaacs, P.B. Crystal structure of quartz-like GeO2. Acta Crystallogr. 1964, 17, 842–846. [Google Scholar] [CrossRef]
  21. Eulenberger, G. Die Kristallstruktur der Tieftemperaturmodifikation von Ag8GeS6, synthetischer Argyrodit. Chem. Mon. 1977, 108, 901–913. (In German) [Google Scholar] [CrossRef]
  22. Hilton, A.R.; Jones, C.E.; Brau, M. Non-Oxide IVA-VA-VIA Chalcogenide Glasses. I. Glass-Forming Regions and Variations in Physical Properties. Phys. Chem. Glasses 1966, 7, 105–112. [Google Scholar]
  23. Zakery, A.; Elliott, S.R. Optical properties and applications of chalcogenide glasses: A review. J. Non-Cryst. Solids 2003, 330, 1–12. [Google Scholar] [CrossRef]
  24. Hilton, A.R.; Kemp, S. Chalcogenide Glasses for Infrared Optics; McGraw-Hill Companies Inc.: New York, NY, USA, 2010. [Google Scholar]
  25. Wang, R.P.; Smith, A.; Luther-Davies, B.; Kokkonen, H.; Jackson, I. Observation of two elastic thresholds in GexAsySe1-x-y glasses. J. Appl. Phys. 2009, 105. [Google Scholar] [CrossRef]
  26. Wei, W.H.; Wang, R.P.; Shen, X.; Fang, L.; Luther-Davies, B. Correlation between structural and physical properties in Ge-Sb-Se glasses. J. Phys. Chem. C 2013, 117, 16571–16576. [Google Scholar] [CrossRef]
  27. Bernstein, L.R.; Reichel, D.G.; Merlino, S. Renierite crystal-structure refined from Rietveld analysis of powder neutron-diffraction data. Am. Mineral. 1989, 74, 1177–1181. [Google Scholar]
  28. Kogut, Y.; Fedorchuk, A.; Zhbankov, O.; Romanyuk, Y.; Kityk, I.; Piskach, L.; Parasyuk, O. Isothermal section of the Ag2S-PbS-GeS2 system at 300 K and the crystal structure of Ag2PbGeS4. J. Alloy. Compd. 2011, 509, 4264–4267. [Google Scholar] [CrossRef]
  29. Paar, W.H.; Roberts, A.C.; Berlepsch, P.; Armbruster, T.; Topa, D.; Zagler, G. Putzite, (Cu4.7Ag3.3)∑8GeS6, a new mineral species from capillitas, Catamarca, Argentina: Description and crystal structure. Can. Mineral. 2004, 42, 1757–1769. [Google Scholar]
  30. Ishii, M.; Onoda, M.; Shibata, K. Structure and vibrational spectra of argyrodite family compounds Cu8SiX6 (X = S, Se) and Cu8GeS6. Solid State Ion. 1999, 121, 11–18. [Google Scholar] [CrossRef]
  31. Tettenhorst, R.T.; Corbato, C.E. Crystal-structure of germanite, Cu26Fe4Fe4S32, determined by powder X-ray-diffraction. Am. Mineral. 1984, 69, 943–947. [Google Scholar]
  32. Dittmar, G.; Schafer, H. Crystal-structure of low-temperature GeS2. Acta Cryst. B 1976, 32, 1188–1192. [Google Scholar] [CrossRef]
  33. Cempirek, J.; Groat, L.A. Note on the formula of brunogeierite and the first bond-valence parameters for Ge2+. J. Geosci. 2013, 58, 71–74. [Google Scholar] [CrossRef]
  34. Bissert, G.; Hesse, K.F. Refinement of structure of germanium(II) sulfide, GeS. Acta Cryst. B 1978, 34, 1322–1323. [Google Scholar] [CrossRef]
  35. Joly, Y.; Bunău, O.; Lorenzo, J.E.; Galera, R.M.; Grenier, S.; Thompson, B. Self-consistency, spin-orbit and other advances in the FDMNES code to simulate XANES and RXD experiments. J. Phys. Conf. Ser. 2009, 190. [Google Scholar] [CrossRef]
  36. James-Smith, J.; Cauzid, J.; Testemale, D.; Liu, W.; Hazemann, J.; Proux, O.; Etschmann, B.; Philippot, P.; Banks, D.; Williams, P.; et al. Arsenic speciation in fluid inclusions using micro-beam X-ray absorption spectroscopy. Am. Mineral. 2010, 95, 921–932. [Google Scholar]
  37. Grundler, P.; Brugger, J.; Meisser, N.; Ansermet, S.; Borg, S.; Etschmann, B.; Testemale, D.; Bolin, T. Xocolatlite, Ca2Mn24+Te2O12·H2O, a new tellurate related to kuranakhite: Description and measurement of Te oxidation state by XANES spectroscopy. Am. Mineral. 2008, 93, 1911–1920. [Google Scholar] [CrossRef]
  38. Tromp, M.; Moulin, J.; Reid, G.; Evans, J. Cr K-edge XANES spectroscopy: Ligand and oxidation state dependence—What is oxidation state? X-Ray Absorpt. Fine Struct. 2007, 882, 699–701. [Google Scholar]
  39. Bernstein, L.R. Germanium Geochemistry and Mineralogy. Geochim. Cosmochim. Acta 1985, 49, 2409–2422. [Google Scholar] [CrossRef]
  40. Kau, L.-S.; Spira-Solomon, D.J.; Penner-Hahn, J.E.; Hodgson, K.O.; Solomon, E.I. X-ray absorption edge determination of the oxidation state and coordination number of copper: Application to the type 3 site in Rhus vernicifera laccase and its reaction with oxygen. J. Am. Chem. Soc. 1987, 109, 6433–6442. [Google Scholar] [CrossRef]
  41. Berry, A.J.; Yaxley, G.M.; Woodland, A.B.; Foran, G.J. A XANES calibration for determining the oxidation state of iron in mantle garnet. Chem. Geol. 2010, 278, 31–37. [Google Scholar] [CrossRef]
  42. Zalewski, W.; Bacewicz, R.; Antonowicz, J.; Pietnoczka, A.; Evstigneeva, T.L.; Schorr, S. XAFS study of kesterite, kuramite and stannite type alloys. J. Alloy. Compd. 2010, 492, 35–38. [Google Scholar] [CrossRef]
  43. Evans, H.T.; Konnert, J.A. Crystal-structure refinement of covellite. Am. Mineral. 1976, 61, 996–1000. [Google Scholar]
  44. Pattrick, R.A.D.; Mosselmans, J.F.W.; Charnock, J.M.; England, K.E.R.; Helz, G.R.; Garner, C.D.; Vaughan, D.J. The structure of amorphous copper sulfide precipitates: An X-ray absorption study. Geochim. Cosmochim. Acta 1997, 61, 2023–2036. [Google Scholar] [CrossRef]
  45. Di Benedetto, F.; Borgheresi, M.; Caneschi, A.; Chastanet, G.; Cipriani, C.; Gatteschi, D.; Pratesi, G.; Romanelli, M.; Sessoli, R. First evidence of natural superconductivity: Covellite. Eur. J. Mineral. 2006, 18, 283–287. [Google Scholar] [CrossRef]
  46. Brugger, J.; Pring, A.; Reith, F.; Ryan, C.; Etschmann, B.; Liu, W.; O'Neill, B.; Ngothai, Y. Probing ore deposits formation: New insights and challenges from synchrotron and neutron studies. Radiat. Phys. Chem. 2010, 79, 151–161. [Google Scholar] [CrossRef]
  47. Brugger, J.; Etschmann, B.; Pownceby, M.; Liu, W.; Grundler, P.; Brewe, D. Oxidation state of europium in scheelite: Tracking fluid-rock interaction in gold deposits. Chem. Geol. 2008, 257, 26–33. [Google Scholar] [CrossRef]
  48. Melcher, F. The Otavi mountain land in Namibia—Tsumeb, germanium and snowball Earth. Mitt. Österr. Mineral. Ges. 2003, 148, 413–435. [Google Scholar]
  49. Dutrizac, J.E.; Jambor, J.L.; Chen, T.T. Host minerals for the gallium-germanium ores of the Apex Mine, Utah. Econ. Geol. 1986, 81, 946–950. [Google Scholar] [CrossRef]
  50. Welch, M.D.; Cooper, M.A.; Hawthorne, F.C. The crystal structure of brunogeierite, Fe2GeO4 spinel. Mineral. Mag. 2001, 65, 441–444. [Google Scholar] [CrossRef]
  51. Frondel, C.; Ito, J. Geochemistry of germanium in the oxidized zone of the Tsumeb mine, South-West Africa. Am. Mineral. 1957, 42, 743–753. [Google Scholar]
  52. Wood, S.A.; Samson, I.M. The aqueous geochemistry of gallium, germanium, indium and scandium. Ore Geol. Rev. 2006, 28, 57–102. [Google Scholar] [CrossRef]
  53. Vanýsek, P. Electrochemical Series. In Handbook of Chemistry and Physics, 92nd ed.; Chemical Rubber Company: Boca Raton, FL, USA, 2011. [Google Scholar]
  54. Grundler, P.V.; Brugger, J.; Etschmann, B.E.; Helm, L.; Liu, W.H.; Spry, P.G.; Tian, Y.; Testemale, D.; Pring, A. Speciation of aqueous tellurium(IV) in hydrothermal solutions and vapors, and the role of oxidized tellurium species in Te transport and gold deposition. Geochim. Cosmochim. Acta 2013, 120, 298–325. [Google Scholar] [CrossRef]
  55. Bonnet, J.; Mösser-Ruck, R.; Cauzid, J.; Bailly, L.; André, A. Crystallographic control of trace element (Cu-Ga-Ge-Fe-Cd) distribution in MVT sphalerites, Tennessee, USA. In Proceedings of the 21st IMA Meeting, Johannesburg, South Africa, 1–5 September 2014.
  56. Beaudoin, G. Acicular sphalerite enriched in Ag, Sb, and Cu embedded within color-banded sphalerite from the Kokanee Range, British Columbia, Canada. Can. Mineral. 2000, 38, 1387–1398. [Google Scholar] [CrossRef]

