Remote Sensing for Mineral Exploration in Central Portugal


1
GeoBioTec, NOVA University of Lisbon , Quinta da Torre, 2829-516 Caparica, Portugal
2
Faculty of Sciences and Technology, NOVA University of Lisbon, Quinta da Torre, 2829-516 Caparica, Portugal
3
Ozdogu Portugal Mining and Exploration Lda., 2710-444 Sintra, Portugal
*
Author to whom correspondence should be addressed.
Minerals 2017, 7(10), 184; https://doi.org/10.3390/min7100184
Submission received: 28 August 2017
/
Revised: 22 September 2017
/
Accepted: 25 September 2017
/
Published: 29 September 2017
(This article belongs to the Special Issue Selected Papers from the 2nd International Conference on Mining in Europe)
Abstract
:Central Portugal is well known for the existence of Sn-W and Au-Ag mineral occurrences primarily associated with hydrothermal processes. Despite the economic and strategic importance of such occurrences, the detailed geology of this particular region is poorly known and there is an obvious absence of geological mapping at an adequate scale. Remote sensing techniques were used in order to increase current geological knowledge of the Góis–Castanheira de Pêra area (600 km2) and to guide future exploration stages by targeting and prioritising potential locations. Digital image processing algorithms, such as Red, Green, Blue (RGB) colour composites, digital spatial filters, band ratios and Principal Components Analysis, were applied to Landsat 8 imagery and elevation data. Lineaments were extracted relying on geological photointerpretation criteria, allowing the identification of new geological–structural elements. Fieldwork was carried out in order to validate the remote sensing interpretations. Integration of remote sensing data with other information sources led to the definition of locations possibly suitable for hosting Sn-W and Au-Ag mineral occurrences. These areas were ranked according to their mineral potential. Targeting the most promising locations resulted in a reduction to less than 10% of the original study area (50.5 km2).
Keywords:
remote sensing; mineral exploration; lineaments; digital image processing; Portugal; gold; tin; tungsten
1. Introduction
In recent decades, a tendency regarding mineral exploration has become apparent: since the most accessible surface or near-surface mineral deposits have already been found and nearly fully exploited, current exploration endeavours are targeting deeper and deeper deposits, in harsher and evermore difficult terrain [1]. As one of the cutting-edge technologies currently supporting the geosciences (among others), remote sensing may have a significant role in mineral exploration works, effectively decreasing initial investments and saving time by clearly targeting the most suitable locations for the occurrence of ore deposits. The advantages and limitations of remote sensing techniques in mineral exploration have already been thoroughly discussed by many authors [1,2,3,4]. However, it must be made clear that remote sensing is not a substitute for direct fieldwork and laboratory studies; quite the opposite, the best interpretation results are consistently obtained from the integration of different data and even from analysis at different scales. Therefore, despite being no replacement for fieldwork and other more traditional methods, remote sensing can provide essential information from a truly new perspective.
Despite the fact that remote sensing tools have been somewhat regularly applied to diverse aspects of the geosciences in Portugal, with the remarkable exception of a handful of publications, there is a true lack of published work regarding its specific use in metallic ore exploration [5].
Covering less than 90,000 km2, the Portuguese mainland territory is rather limited. Despite its extent, the geological complexity and diversity of the Portuguese territory provide Portugal with a considerable potential for mineral resources, including a very high potential for the occurrence of precious and base metals [6]. However, by examining the areas with the greatest mineral potential and the coverage of the geological mapping at 1:50,000 scale, an unfortunate pattern emerges. The three great territory clusters still requiring geological mapping at an adequate scale correspond to areas with very high mineral potential (Figure 1).
Tin-tungsten and gold-silver deposits occur throughout central Portugal and are often co-existent [8,9,10,11,12,13,14]. The existence of important mining activities in the region, presently and historically, as well as the strategic and economic significance of such metals [6,15,16,17], mark this region as one of the most desirable targets for mineral exploration in the country.
The absence of detailed geological information is a fundamental limitation in mineral exploration endeavours since all these works are directly dependent on the degree of knowledge over any territory. The extent of the Góis–Castanheira de Pêra area and the region’s landscape (mountainous terrain with very dense vegetation) pose a great challenge to all prospecting and exploration stages. Thus, the use of remote sensing techniques was proposed in order to overcome these restraints and increase the current geological knowledge, guiding future mineral exploration stages by identifying and ranking potential target locations.
2. Geological Setting
Located in central Portugal, the study area comprises 627 km2 between the towns of Góis and Castanheira de Pêra. Comprised within this area is the Escádia Grande exploration area (252 km2), which mineral exploration rights for Au, Ag, Cu, Pb, Zn, Sn, Sb and W are presently held by Empresa de Desenvolvimento Mineiro (EDM, S.A.)—see Figure 2.
The Góis-Castanheira de Pêra area is located in the Central-Iberian Zone, a major tectonostratigraphic subdivision of the Iberian Variscan belt [21]. This sector is dominated by the Late Ediacaran flysch-like sequences comprising the Beiras Group (Douro–Beiras Supergroup), which are unconformably overlain by Early Ordovician quartzites [20,22,23]. The Early Ordovician quartzites directly overlay the schists and greywackes of the Beiras Group, occurring in NW–SE-trending limbs of Variscan kilometre-scale folds [19,24].
According to the most recent studies, the Coentral granite, which is the single granite outcrop known within the study area, dates from 586–582 Ma [25], thus preceding the known mineral occurrences by a considerable margin and probably not having any genetic relation to them. The northwestern sector of the area is comprised by Meso–Cenozoic basins, mainly including sandstones, arkoses and conglomerates.
The north-western sector of the area is bounded by the ENE–WSW-trending Lousã-Seia fault. Extending almost 100 km, the Lousã–Seia fault is a major structure of the Portuguese Hesperic Massif. This is a reverse fault (NW—verging; SE—dipping) controlling the uplift of the southern hanging-wall block, being its nature and cinematics related to its reactivation during Cenozoic times, due to the Alpine compressive tectonics [26].
The Au-bearing vein formation in the Iberian Massif is strongly controlled by D2–D3 major regional shear zones although in detail they are hosted by subsidiary multi-scale brittle-ductile sheared and dilatational fractures. The most significant D2–D3 Hercynian regional shear zones trend ENE–WSW and NW–SE to WNW–ESE [27,28,29]. The late Variscan compressive stresses were also responsible for the tectonic reactivation of early mineralised structures and, consequently, for late enrichments. Some of these lenses and veins are strictly intragranitic, while others are intrametamorphosed sedimentary rocks. At a local scale, some mineralisations preserved this trend, mainly when the veins are disposed along the S–C–C’ mylonitic foliations. However, many of the Au veins correspond to N–S to NE–SW extensional fractures (sometimes as en échelon tension gashes) emplaced in granites or in the metasediments [27,30]. Many of those interpreted as pure tension gashes are, in fact, primary extensional shears trending NE–SW to ENE–WSW, generated by the transtensional regime associated with the cinematic of the regional or local shear zones [31]. Several occurrences are associated with a Late Variscan fracture and fault network (NNE–SSW to NE–SW) dominated by brittle structures.
The Alpine orogeny originated fault systems trending NNE–SSW, ENE–WSW to NE–SW and NW–SE [9]. In the studied area, the most striking structures are related with the fault systems recovered by Alpine orogeny. Although the aforementioned NE–SW Seia–Lousã fault is the most prominent structural feature of the region, the similar trending Cebola fault is also significant, as well as other similar minor faults (see numbered items in Figure 2) [32]. The tectonic block defined the two major structures of Lousã-Seia and Cebola seems to be controlled by NNE–SSW faults, of which the Safra fault is an example [32].
2.1. Mineral Occurrences in Góis—Castanheira de Pêra
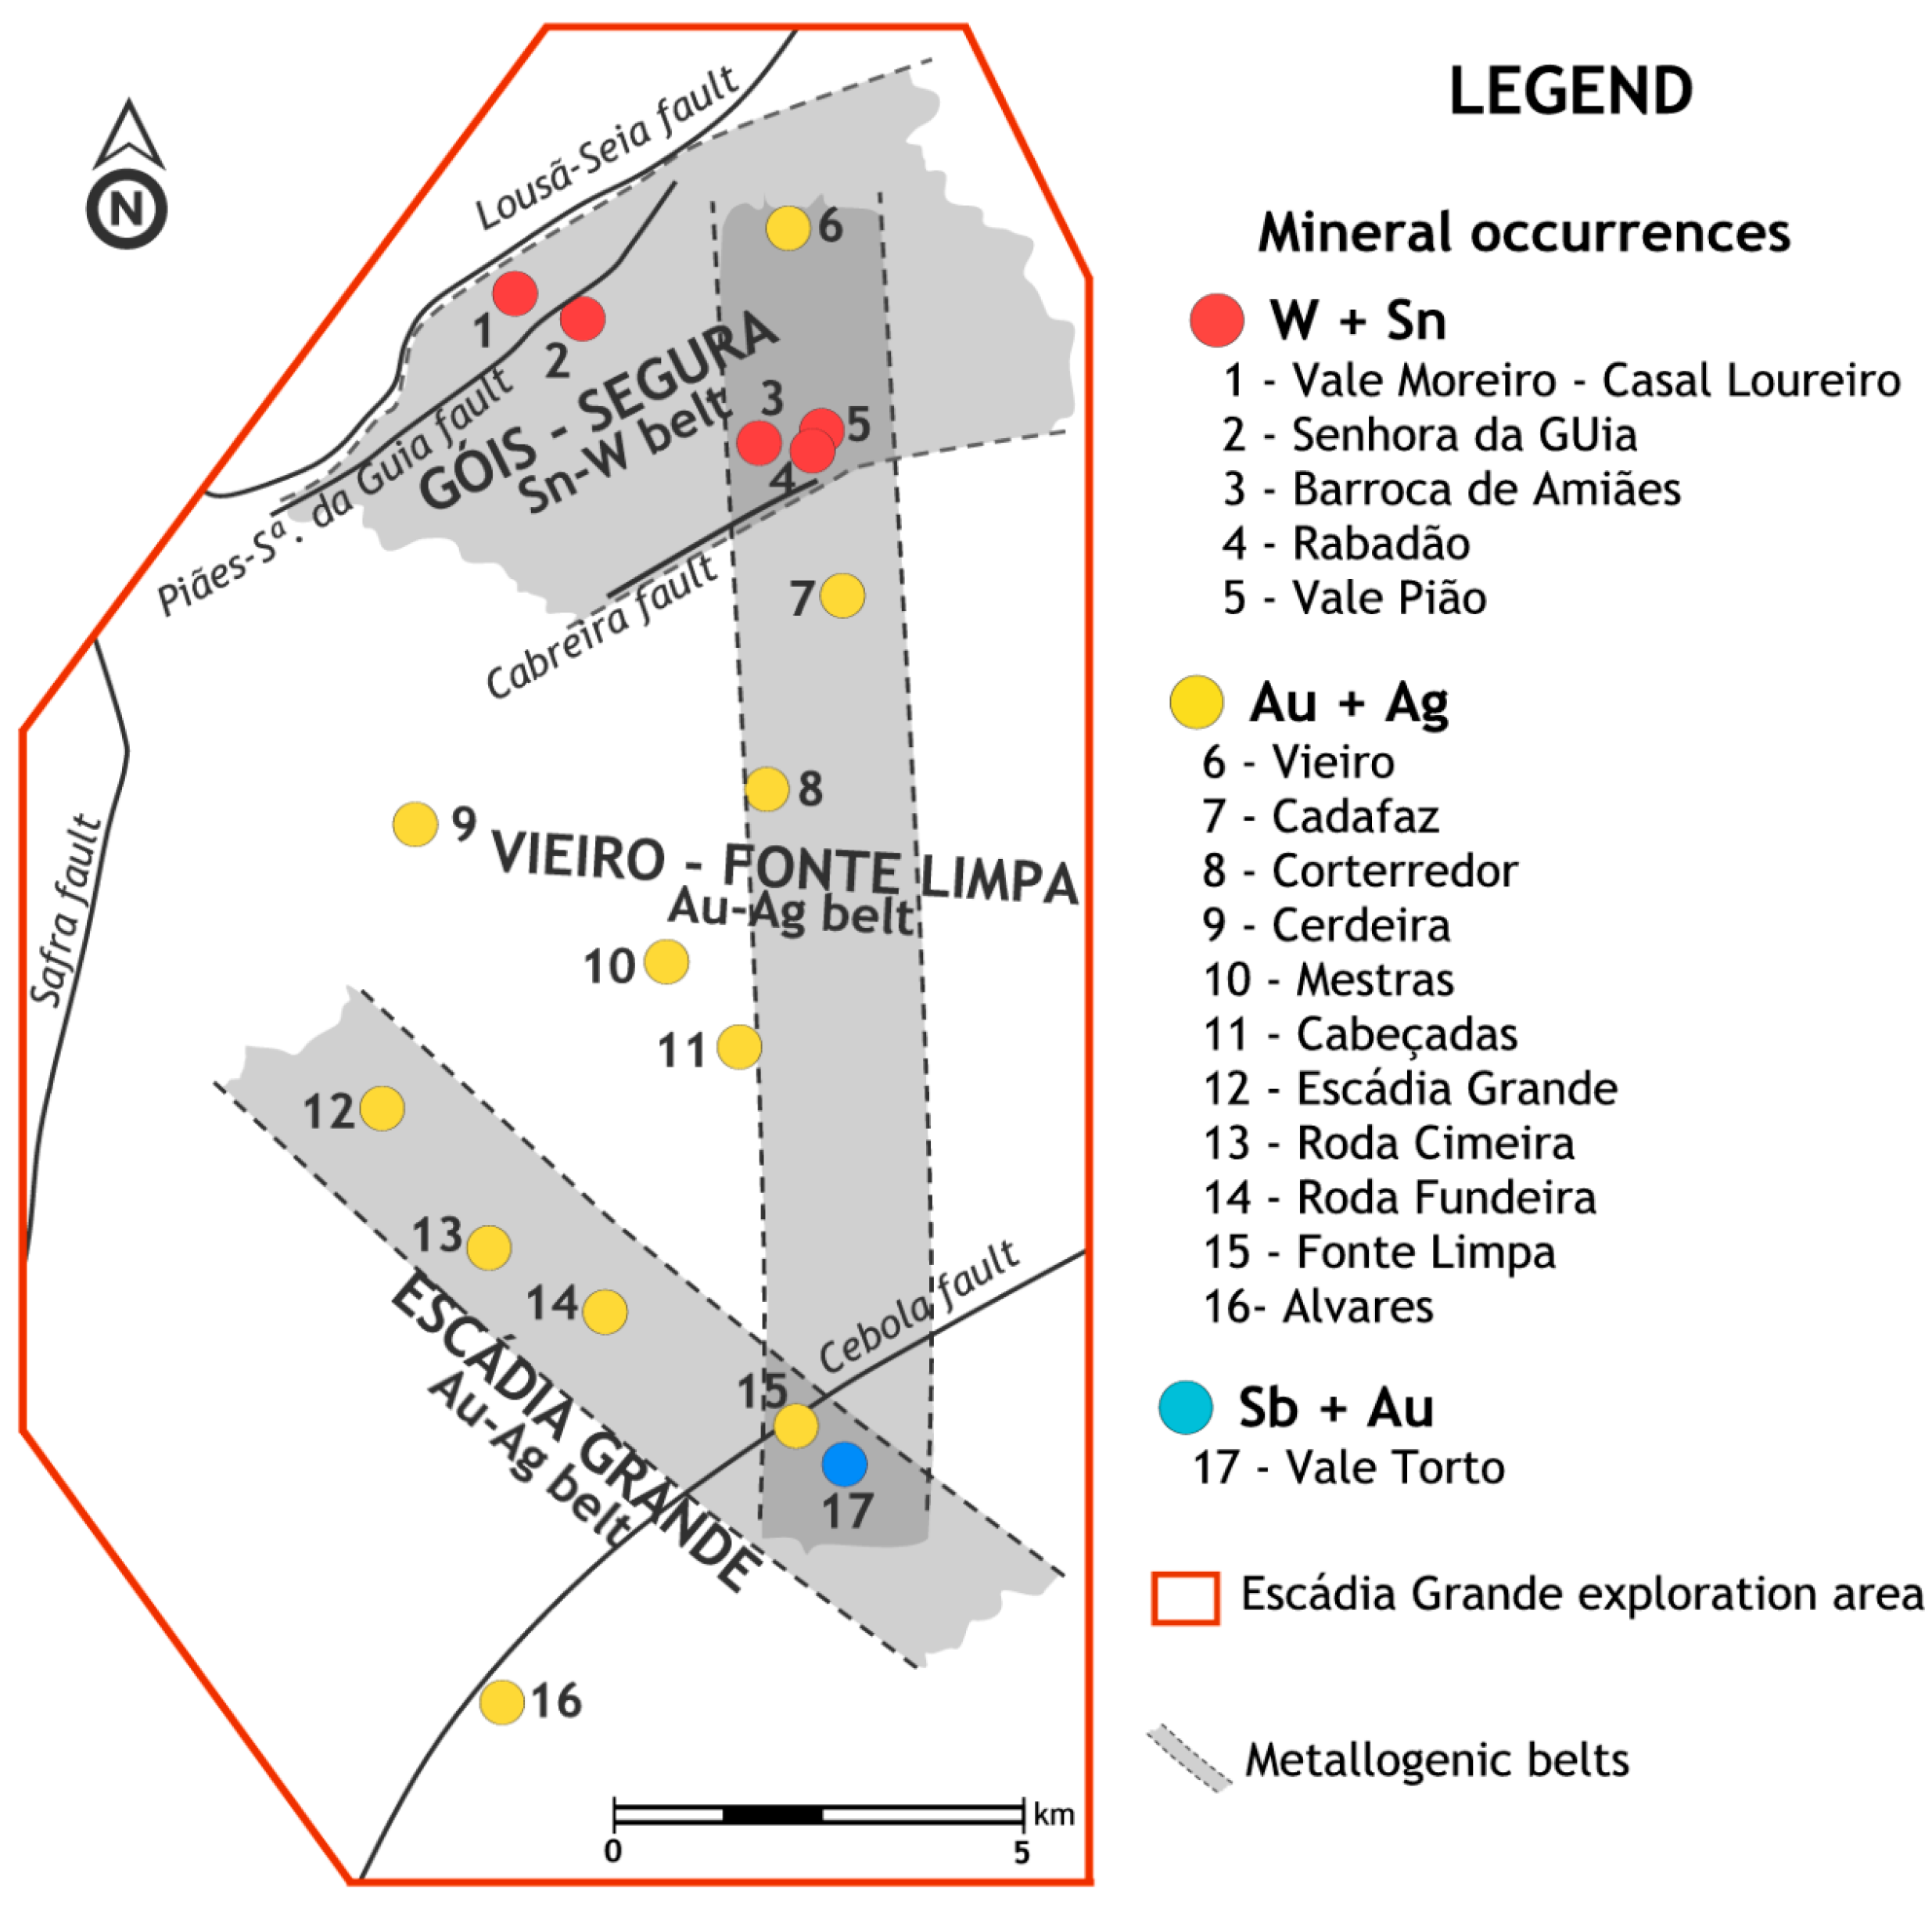
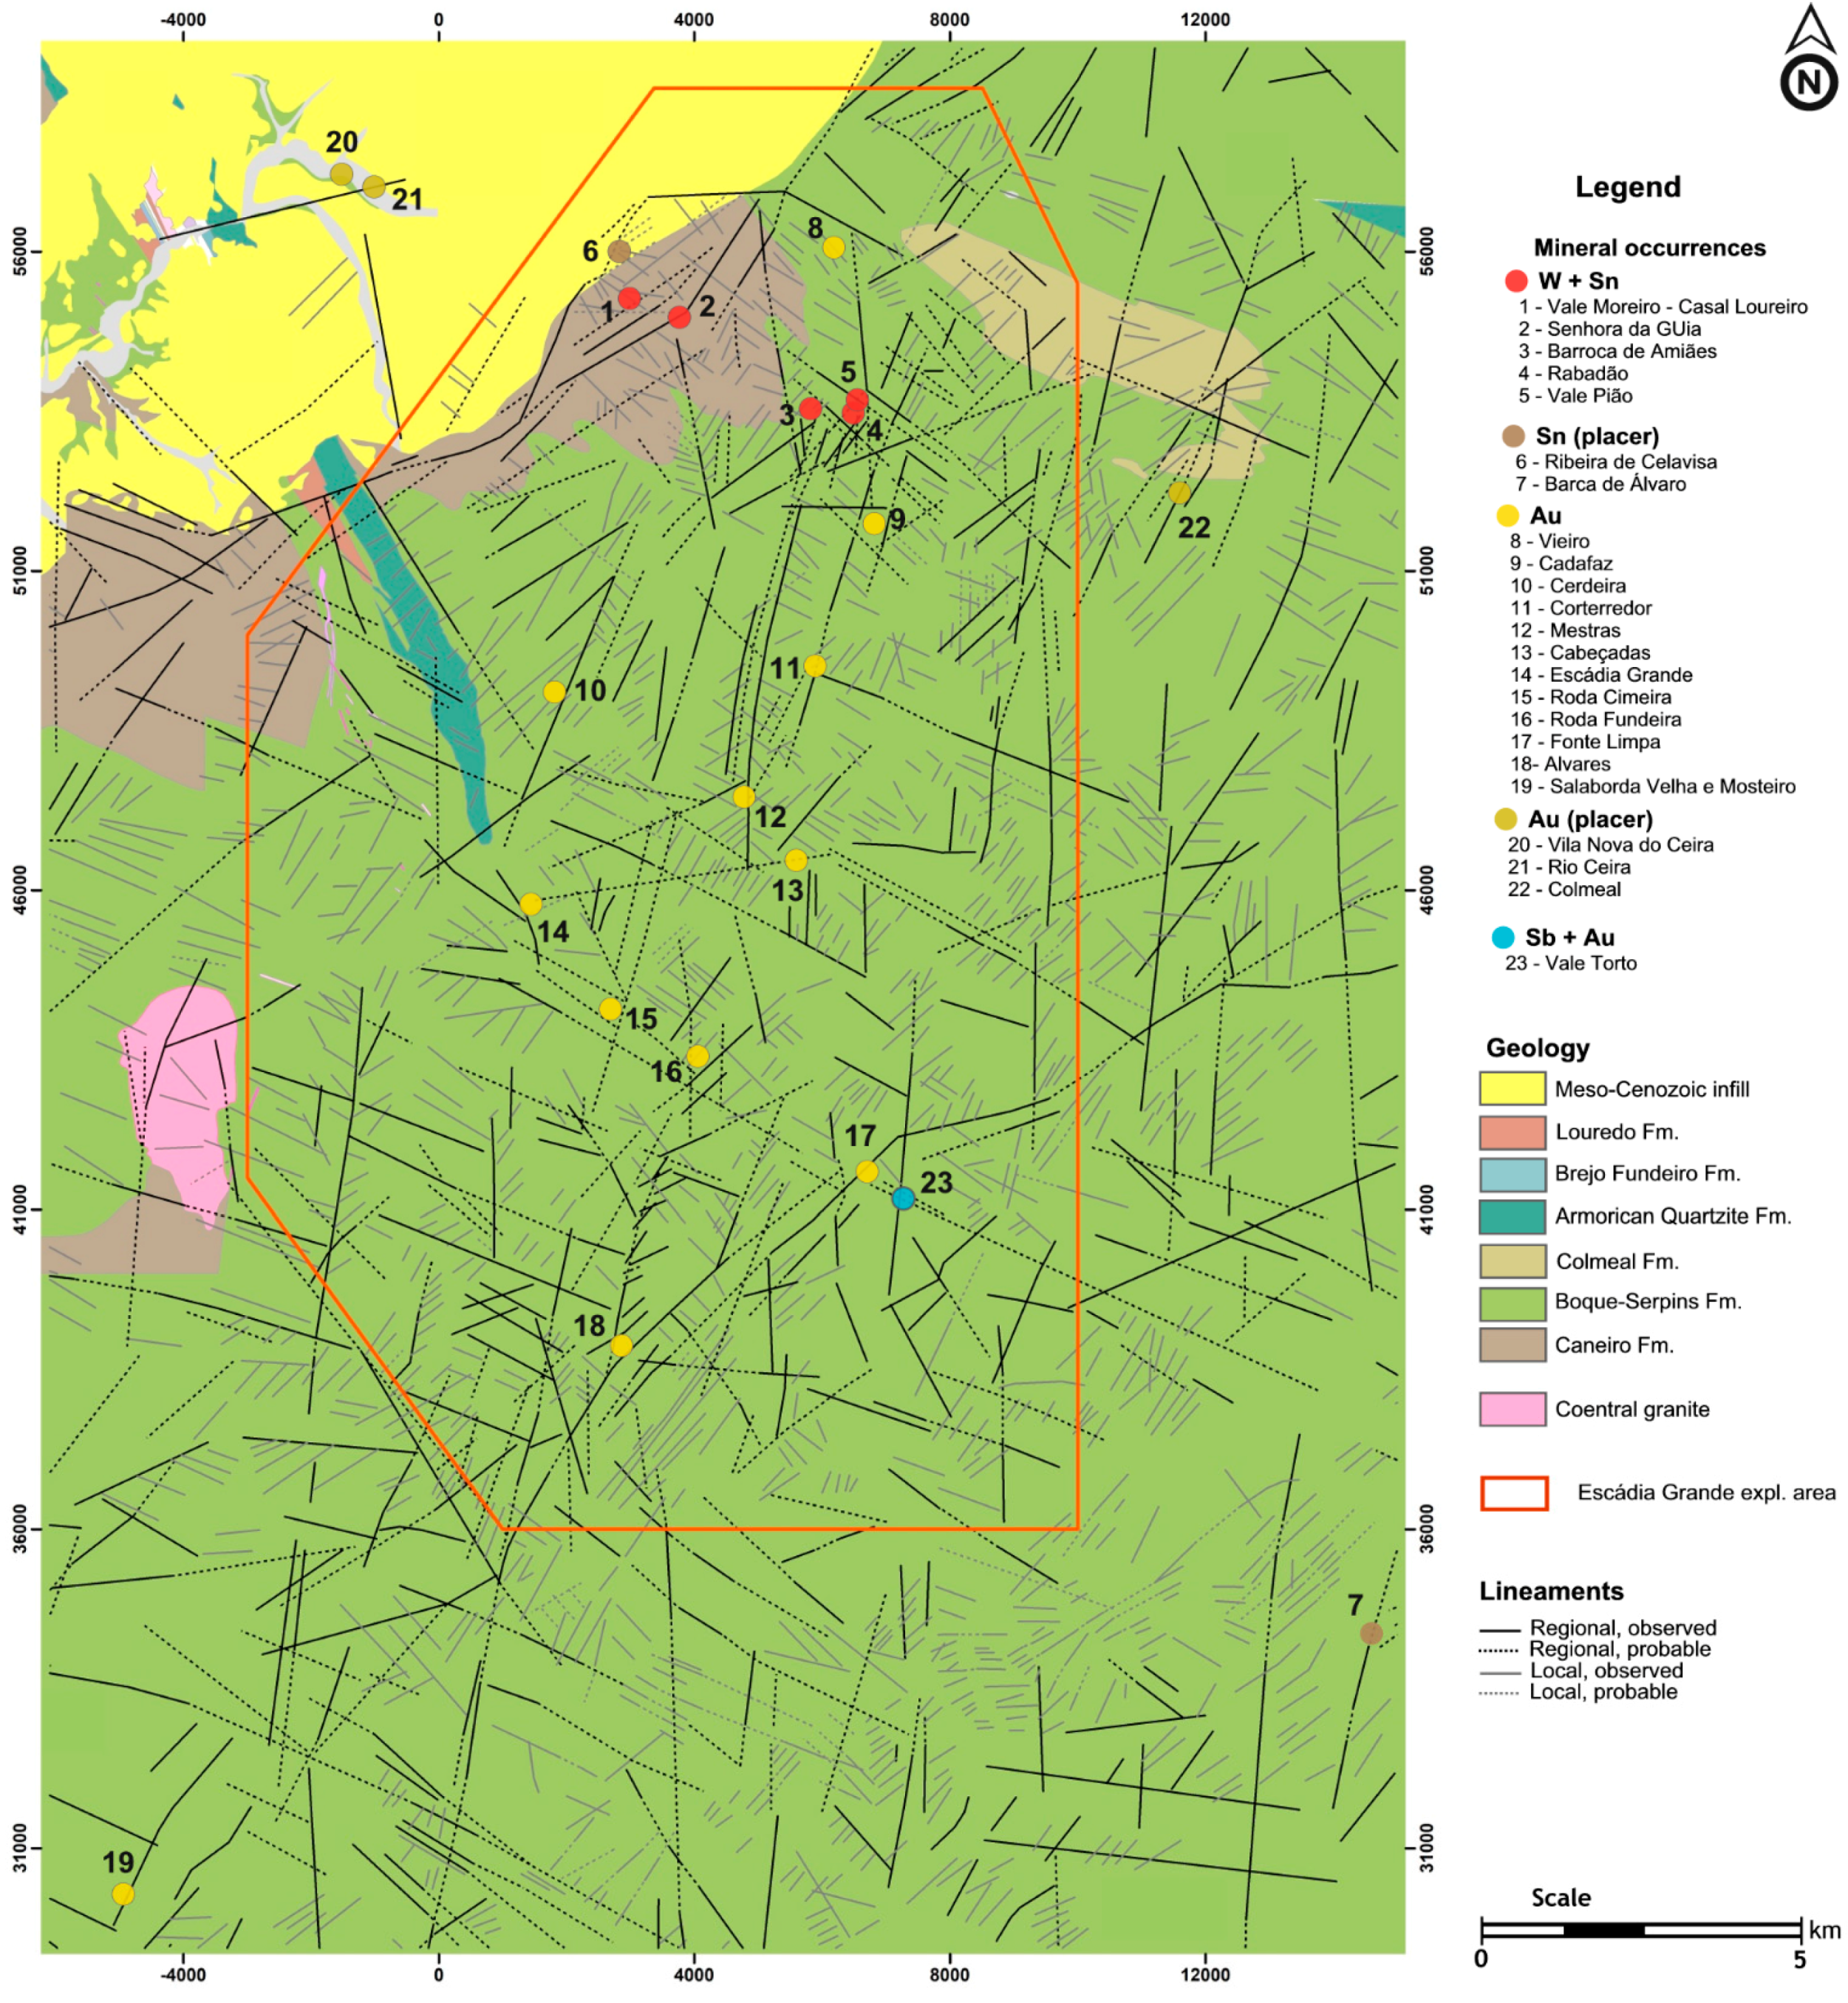
The Góis–Castanheira de Pêra area is historically known for the occurrence and exploitation of Au-Ag and Sn-W mineral ores. In particular, the sector nearby the town of Góis is known for both primary and placer type occurrences of Sn and W. Further south is the Escádia Grande mine, where Au-Ag ores have been mined since Roman times and from 1937 to 1952 [33]. This area is noticeable for the intersection of three metallogenic belts: the Góis–Segura Sn-W belt, the Escádia Grande Au-Ag belt and the Vieiro–Fonte Limpa Au-Ag belt (Figure 3). Even though the exploitation of placer-type deposits has been economically important for this region’s development, the primary occurrences are the main focus of the present article.
2.1.1. Sn-W Occurrences
The Góis–Segura Sn-W belt is a nearly E–W alignment hosting numerous Sn and/or W occurrences and important mines such as Argemela or Panasqueira (which is still operating and remains a worldwide mining reference [6]). Many mineral occurrences within the Góis–Segura Sn-W belt evidence a clear structural control that is expressed near intersections of E–W and N–S and NNE–SSW to ENE–WSW trending structural features [10].
The Sn-W occurrences in the Góis sector occur mostly in veins, but also in lenticular breccias and stockwork associated with shear zones. The dominant trends of these occurrences are NNE–SSW, NE–SW and NW–SE [35].
The Sn-W Góis sector is usually divided in blocks limited by important structural features [34,35,36,37,38,39]: (1) north-westwards of Lousã–Seia fault there are only Au and Sn placer deposits; (2) the block bounded by the Lousã–Seia fault and the Piães–Senhora da Guia fault contains mainly Sn and Au occurrences; (3) in the block limited by the Piães–Senhora da Guia fault and the Cabreira fault, the Sn and Sn-W occurrences dominate; Sn or W occurrences are not known to the SE of the Cabreira fault (see Figure 3).
Although the Coentral granite comprises the only granite outcrop in the area, much of the data collected during the geophysical campaigns performed in the 1980s [40,41,42] seems to point out that some of the mineral occurrences in Góis are due to a non-outcropping granitic dome, estimated to be between 120 and 280 m deep. For this reason, many have made a parallel between the Panasqueira mine and the Sn-W Góis occurrences.
2.1.2. Au-Ag Occurrences
The Escádia Grande Au-Ag metallogenic belt is hosted in a nearly NW–SE sinistral shear zone, with the Au-Ag bearing quartz veins distributed along the hinge of a secondary synform and also disseminated in schists [34].
The Escádia Grande ore deposit is the most important mine in the study area. Archaeological findings suggest that this location was exploited during Roman times [33,34]. In modern times, the Escádia Grande mine operated from 1940 to 1952. The Escádia Grande ore deposit is comprised by a tabular quartz vein, trending N 30°–40°–55° W, dipping 50°–60° SW, with an average thickness of 50 to 70 cm and with an average content of 8 g/t Au and 33 g/t Ag [33,34,43].
The Vieiro–Fonte Limpa Au-Ag belt follows a nearly N–S fault and includes the quartz vein hosted Au-Ag occurrences of Vieiro, Cadafaz, Corterredor, Mestras and Cabeçadas (see Figure 3).
3. Materials and Methods
The selection of the most adequate methods and tools in mineral exploration studies is directly associated to the mode of formation and occurrence of the targeted mineral deposits [3]. Since this study targets primary Sn-W and Au-Ag occurrences, which occur in veins, breccias, stockwork and/or related to shear zones, the best surface indications (geological guides) for these features are structural controls and hydrothermal alteration. These features are usually expressed as lineaments and lithological contrasts, respectively.
The use of the word lineament through the present work is based on the broader concept proposed by O’Leary et al. (1976) [44]. Therefore, lineaments are seen as rectilinear or slightly curvilinear features that are the reflection of geological phenomena occurring on the Earth’s surface. This concept, consequently, includes an array of features including diverse geological meanings (e.g., faults, shear zones, joint patterns, bedding, and intrusive structures) and other features that may not have a direct geological significance but may be replicating the underlying geological structure (e.g., aligned water courses and valleys, topographical alignments, vegetation contrasts and aligned natural springs).
3.1. Materials
The materials used in the present work can be grouped as follows: satellite imagery, elevation data, radiometric data and geological and structural mapping. Further details regarding all materials and their original sources are given in the ensuing subsections.
3.1.1. Satellite Imagery
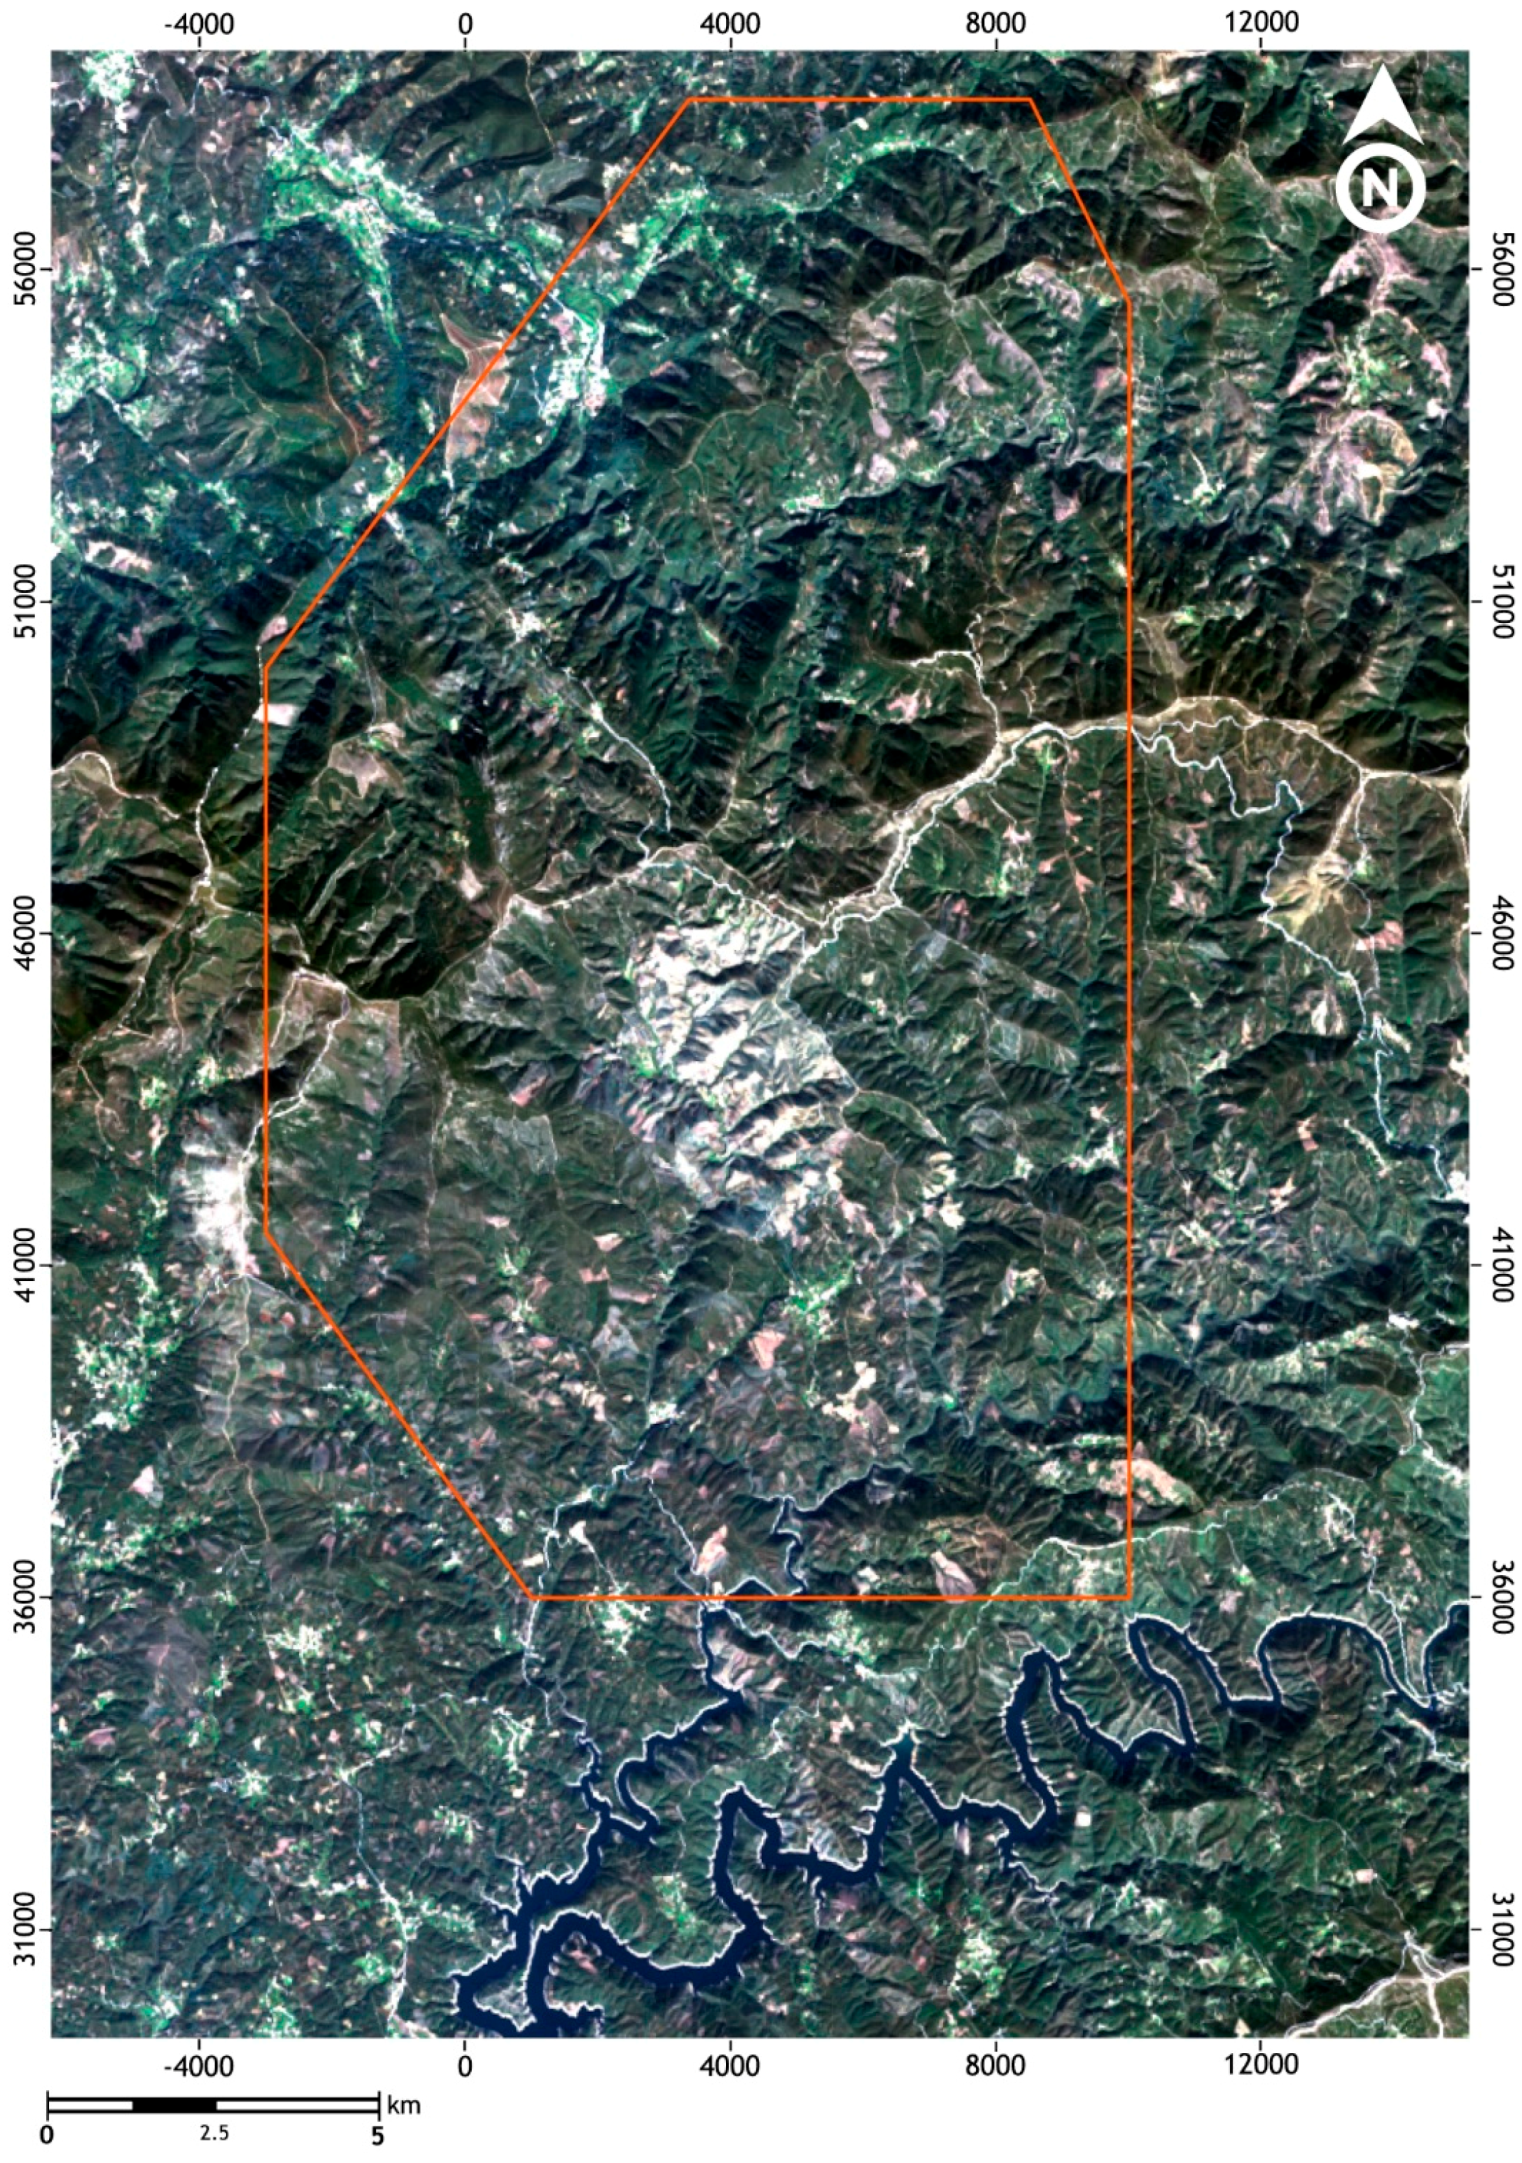
The satellite imagery used was clipped from the Landsat 8 scene LC82040322014302LGN00, from 29 October 2014 (available at: earthexplorer.usgs.gov), collected by sensors OLI (Operational Land Imager) and TIRS (Thermal Infrared Sensor). Landsat 8 band specifications are presented in Table 1. This scene was chosen due to its near perfect quality (9/9), the virtually non-existent cloud coverage (0.33/100) and due to the relative low solar elevation (34.4°). Solar elevation (relative to the horizon) can be an impacting factor in choosing a satellite scene: lower solar elevations are usually preferred for structural focused studies since they enhance terrain morphology and structural features; on the contrary, higher solar elevations usually favour lithological interpretation (as previously exemplified by [45]). Due to the region’s rugged topography and relatively monotonous geology, natural shadows may influence the use of some methods, especially those focused on lithological discrimination. In fact, previous authors such as [45] mention the difficulties in discriminating units within the flysch sequences of the Beiras Group. With this in mind, and since the targeted mineral occurrences are closely related to structural controls, the authors chose to use a low solar elevation scene. The digital processing of the Landsat 8 scene and the preliminary lineament mapping were executed using IDRISI Selva® software (Clark Labs, Worcester, MA, USA).
3.1.2. Elevation Data
The elevation hard data (trig points and contour lines) originated from the Portuguese Military Cartography at 1:25,000 scale (sheets 242—Foz de Arouce (Lousã), 243—Góis, 252—Lousã, 253—Pampilhosa da Serra, 264—Castanheira de Pêra, 265—Madeirã (Oleiros), 276—Figueiró-dos-Vinhos and 277—Troviscal (Sertã)) and were processed using ArcGIS® software (Esri, Redlands, CA, USA). These same maps were used for their toponymical references.
3.1.3. Radiometric Data
The radiometric data used in this work was clipped from the Radiometric map of the Portuguese mainland [47]. The clipped data is comprised by roughly 1500 total gamma radiation measurements collected from 1955 to 1966 by vehicle-borne and aerial spectrometers.
3.1.4. Geological and Structural Mapping
The geological and structural base map used in this work results from the merging of all currently publicly available sources: Sheet19D (Coimbra-Lousã), Geological map of Portugal at 1:50,000 scale [18]; Geological map of Portugal at 1:500,000 scale [19]; Geological sketch of the Góis region [20]; Photointerpretation of the Góis region [48]. The locations of mineral occurrences (as seen on Figure 3 and others) were provided by E.D.M., S.A. after initial fieldwork campaigns based on the SIORMINP database [34] and mining reports [22,33,36,37,43,49,50,51,52].
3.2. Methods
The present subsection describes in detail all methods used. Satellite imagery and elevation data were processed in order to provide new digital images for geological interpretation. The preliminary interpretations were field validated and a new, more detailed, interpretation work was carried out. These new interpretations were integrated with other information sources, thus allowing the definition of locations possibly suitable for hosting Sn-W and Au-Ag mineral occurrences. The target areas were, then, ranked according to their mineral potential.
3.2.1. Satellite Imagery and Elevation Data Processing
The following common digital processing techniques were used: Red, Green, Blue (RGB) colour composites, Principal Component Analysis (PCA), directional spatial filters, band ratios and image classification.
RGB colour composites are a typical way for displaying multi-spectral imagery by attributing the three primary colours to three chosen bands that are simultaneously combined [3,53]. The most common RGB composites used in geological remote sensing include: 6-5-2, 6-5-3, 7-5-2, 7-5-3 and 7-6-5 (numbers referring to Landsat 8 OLI bands) [45]. The contrast of all images was linearly stretched with 1% saturation.
The selection of the most appropriated 3-band combinations was made calculating the Optimum Index Factor (OIF) [42] and using all Landsat 8 bands. The OIF formula allows the selection of the spectral bands and band ratios for RGB colour composites. The bands or band ratios with the highest OIF values are the most adequate for RGB colour composites since they combine the largest amount of information (maximum variance) with minimum duplication (low correlation between bands) [54,55].
Ratioing is a common procedure used for feature enhancements based on the division of every pixel value of one band by the homologous pixels of the other band [4]. The most commonly used band ratios in the geosciences include [1,3,55,56]:
- B6/B7—the clay ratio is used for distinguishing argillitic and non-argillitic materials;
- B4/B2—the iron oxide ratio allows the contrast between FeO and non-FeO materials;
- B6/B5—the ferrous mineral ratio is used to enhance iron-bearing minerals;
- B4/B5—this ratio is used for contrasting rocks/soil and vegetation;
- (B5 − B4)/(B5 + B4)—called NDVI (normalised difference vegetation index), this ratio is used for distinguishing between vegetation and non-vegetation.
Despite the fact that high vegetation density may critically limit the use of Landsat imagery in the detection of hydrothermally altered rocks (Siegal and Goetz, 1977 in [1]) and the known difficulties in discriminating units within the flysch sequences of the Beiras Group [45], the authors proposed to test different band ratios in a previously unstudied area. The following band ratios were tested: B6/B7, B4/B2, B4/B5, (B5 − B4)/(B5 + B4)), B4/B6 and B10/B11.
Directional spatial filters are operators that modify pixel values of an original image based on the values of neighbouring pixels using windows or kernels, usually 3 × 3, 5 × 5 or 7 × 7, allowing edge enhancement in a particular direction [3,53,57]. The main applications of this type of filters include: obtaining sharper and more detailed images, edge enhancement and reducing local illumination effects [3]. Although these filters may be applied to any band or processed image, the use of bands B6 and B7 is the most common [45,58,59].
In this work, the four directional filters depicted in Figure 4 were applied to the Landsat 8/OLI B6 (1.57–1.65 µm—short wave infrared) and to most of the band ratios previously mentioned.
Principal Components Analysis (PCA) is a linear transformation used to compress image information and redundant values by multiplying the original data values by statistical coefficients (PC—principal components), which are derived from the variance/covariance matrix of the original data [3,53,57]. Usually the first principal component (PC1) contains the most information (greater variance) and the following PC’s contain progressively less information [4]. Each PC is represented in individual new images that can be used to create RGB colour composites.
PCA was carried out using all Landsat 8 OLI and TIRS bands.
Digital image classification is based on grouping pixels according to their spectral pattern and categorising them into different classes. Classification methods are usually divided into unsupervised or supervised. While the first one is an automatic and purely statistical analysis of the complete image, the former is based on the user’s previous knowledge of the area, requiring the use of sample or training areas in order to define the classes, which are then used to generate a classification for the whole image [3,53]. Although some limitations are acknowledged to these methods [3], they can be used for geological mapping or to define surface covers that may be later correlated to the underlying geology.
Both supervised and unsupervised classifications were tested, using different algorithm on varying Landsat 8 band sets. Further details regarding the tested classifications are given in Section 4.1.1.
The elevation data were processed using ArcGIS® software in order to create a DTM—Digital Terrain Model (raster resolution 10 m × 10 m), which was later employed to create several hill-shade relief maps (solar azimuth intervals 45°).
3.2.2. Geological Interpretation and Field Validation
The processed digital images resulting from the Landsat 8 imagery and the hill-shade relief maps (resulting from the processing of the DTM) were visually interpreted using geological photointerpretation criteria, thus resulting preliminary lineament maps. Since some authors propose that non-outcropping granite domes may exist in the study area (see Section 2.1.1), the search for circular features as also carried out. Field validation was carried out in order to identify mapped features in situ, attesting their possible geological meaning, and to identify possible false positives.
A two-stage lineament reinterpretation followed the fieldwork: (1) the original digital processed images were reinterpreted, resulting in new lineament maps; at this stage, lineaments were also classified according to their scale (regional/local) and occurrence (observed/probable), (2) all new lineament interpretations were ultimately merged, thus resulting a single and final lineament map.
3.2.3. Lineament Analysis and Data Integration
The final lineament map was used to create a lineament density map using the line density function of ArcGIS, which calculates the density of linear features that intersect a user defined neighbourhood around each raster cell. Density is calculated in units of length per unit of area.
Following the data processing and extraction stages, the mapped lineaments were analysed, integrated and compared with other kinds of data: geological mapping, mineral occurrences, radiometric data and toponymy. This crucial stage allowed the identification of remarkable patterns between the mapped lineaments and the other types of data.
3.2.4. Target Selection
Five criteria were, then, established in order to select the areas with the highest potential for mineralisation. These criteria (geology, known mineral occurrences, mapped lineaments, radiometric data and toponymy) allowed the identification of areas possibly suitable for hosting mineral occurrences. The areas selected as primary exploration targets were eventually ranked according to their mineral potential. Further details regarding target selection and ranking are given in Section 4.5.
4. Results
4.1. Digital Image Processing
The objective of this first stage was to select and use an array of digital image processing techniques adequate to the identification of geological features possibly related to the targeted mineral occurrences. In this sense, the techniques used aimed to enhance the digital images in order to identify lithological contrasts and structural features (lineaments).
4.1.1. Satellite Imagery
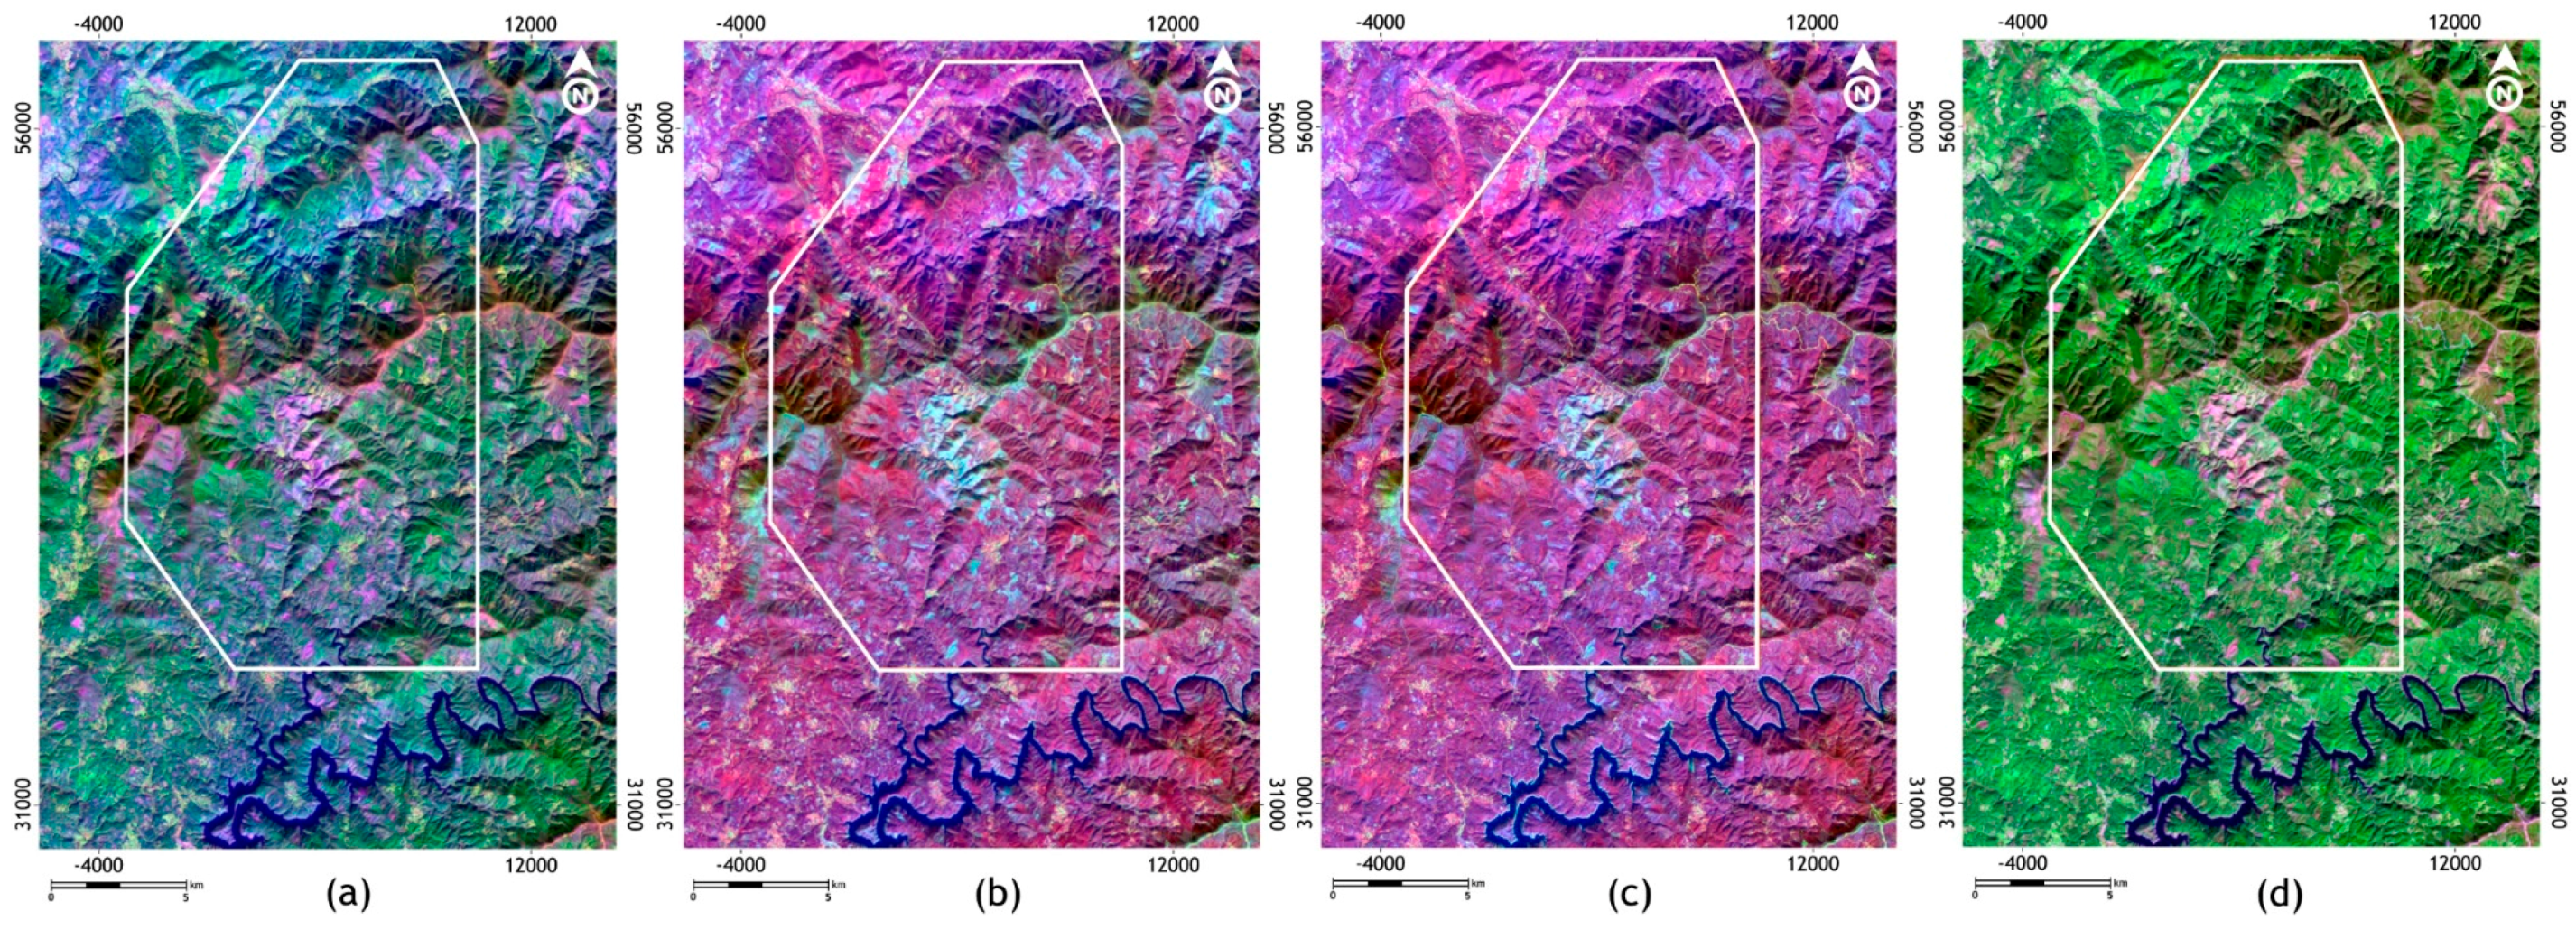
Based on the calculation of the OIF, the following band combinations were found the most suitable for geological interpretation: 6-5-10, 5-7-11, 5-8-10 and 7-5-2 (Table 2 and Figure 5). Additionally, as displayed in Figure 6, the true colour RGB composite was also interpreted.
On their own, the several band ratios that were tested were not effective in the enhancement of geological features, in particular, lithological contrasts. This was most probably due to the rugged terrain (causing many shadow areas/dark pixels) and due to the dense vegetation covering the area, which, as previously mentioned in Section 3.2.1 [1], may have limited the application of these techniques.
The principal components resulting from PCA (Table 3) were used to produce colour composites (Figure 7). The first four PCs aggregate 99.17% of the image variance.
As Table 3 shows, the first principal component (PC1) is dominated by B5, B6 and B7. The weight of these three bands in PC1, which aggregates the greatest variance (72.66%), may indicate that the vegetation coverage greatly influences the spectral response. The second principal component (PC2) is also dominated by B5 and, thought in a lesser proportion, bands B6 and B7, thus emphasising yet again the great influence of the vegetation in the area. Bands B10 and B11 dominate the third principal component (PC3), which means that this component depicts surficial temperature variations and in water content. PC4, which only aggregates 2% of the total variance, is dominated by bands B6 and B8 and, with lesser weights, bands B1, B2, B3 and B4. Thus, PC4 is mostly related to the visible spectrum, emphasising some atmospheric effects and variations in water content. A clear NW–SE divide is apparent in the northeastern sector of all the RGB colour composites of Figure 7. Despite the fact that this divide corresponds to an important lithological contrast between the Beiras Group flysch and the Mesozoic and Cenozoic deposits, no other direct lithological correlations could be made. Although many man-made features (especially roads and urban areas) are very easily distinguishable, the use of PCA did not provide the identification of other features of interest.
Unsupervised classifications were tested using the ISODATA algorithm on varying band sets and limiting class number from 10 to 30. Bands B10 and B11 were removed due a persistent artificial NE–SW striping (issue already reported by USGS/NASA [46]). The unsupervised classifications presented constant errors: the north facing slopes (shadow zones) were always grouped in the same class as surface water; both the outcrops of the Coentral granite and the Armorican Quartzite ridges were merged together with the urban areas; no differentiation could be found between the NW and SE sections of the area, that is, the Meso-Cenozoic basins and the Beiras Group flysch sequences, respectively.
Due to the poor results obtained with unsupervised classification, supervised classifications were tested using the maximum likelihood algorithm. Training areas were defined based on geological mapping [19] and fieldwork observation, and the number of tested classes ranged from five to fifteen. One of the best results, depicted in Figure 8, includes eight classes intending to identify several man-made coverages, water bodies, vegetation, and geological units.
Analysing Figure 8, Classes 1–3 are fairly well represented and correctly classified (i.e., urban, road-network and surface water, respectively); Class 4 also seems to be quite compatible with previous local knowledge since floodplains and agriculture zones mostly follow the flatter areas and valleys. This classification is an improvement on the unsupervised algorithms, but its results are not sufficient. Many areas that appear classified as (7), which should correspond to the Coentral granite, are, in fact, non-vegetated rock outcrops of the Beiras Group following the ridge lines. Class (5), which should represent the Armorican Quartzite ridges, appears dispersed throughout the area and seems to have been somewhat influenced by illumination effects. Class (8), fairly represents the Meso-Cenozoic deposits on the NW corner of the area, but it also includes larger areas further south that are urban and non-vegetated areas. Despite being roughly limited to its known geological limits, Class (6), which intended to match the Beiras Group, is clearly influenced by the dense vegetation cover; furthermore, as mentioned in previous works [45], the use of image classification techniques was not effective in the detection of lithological contrasts within the Beiras Group flysch.
Despite the excellent results classifying roads, urban areas, water bodies and farming areas, the classification of geological features was very poor. Once again, these difficulties may probably be due to the dense vegetation coverage of the area.
4.1.2. Elevation Data
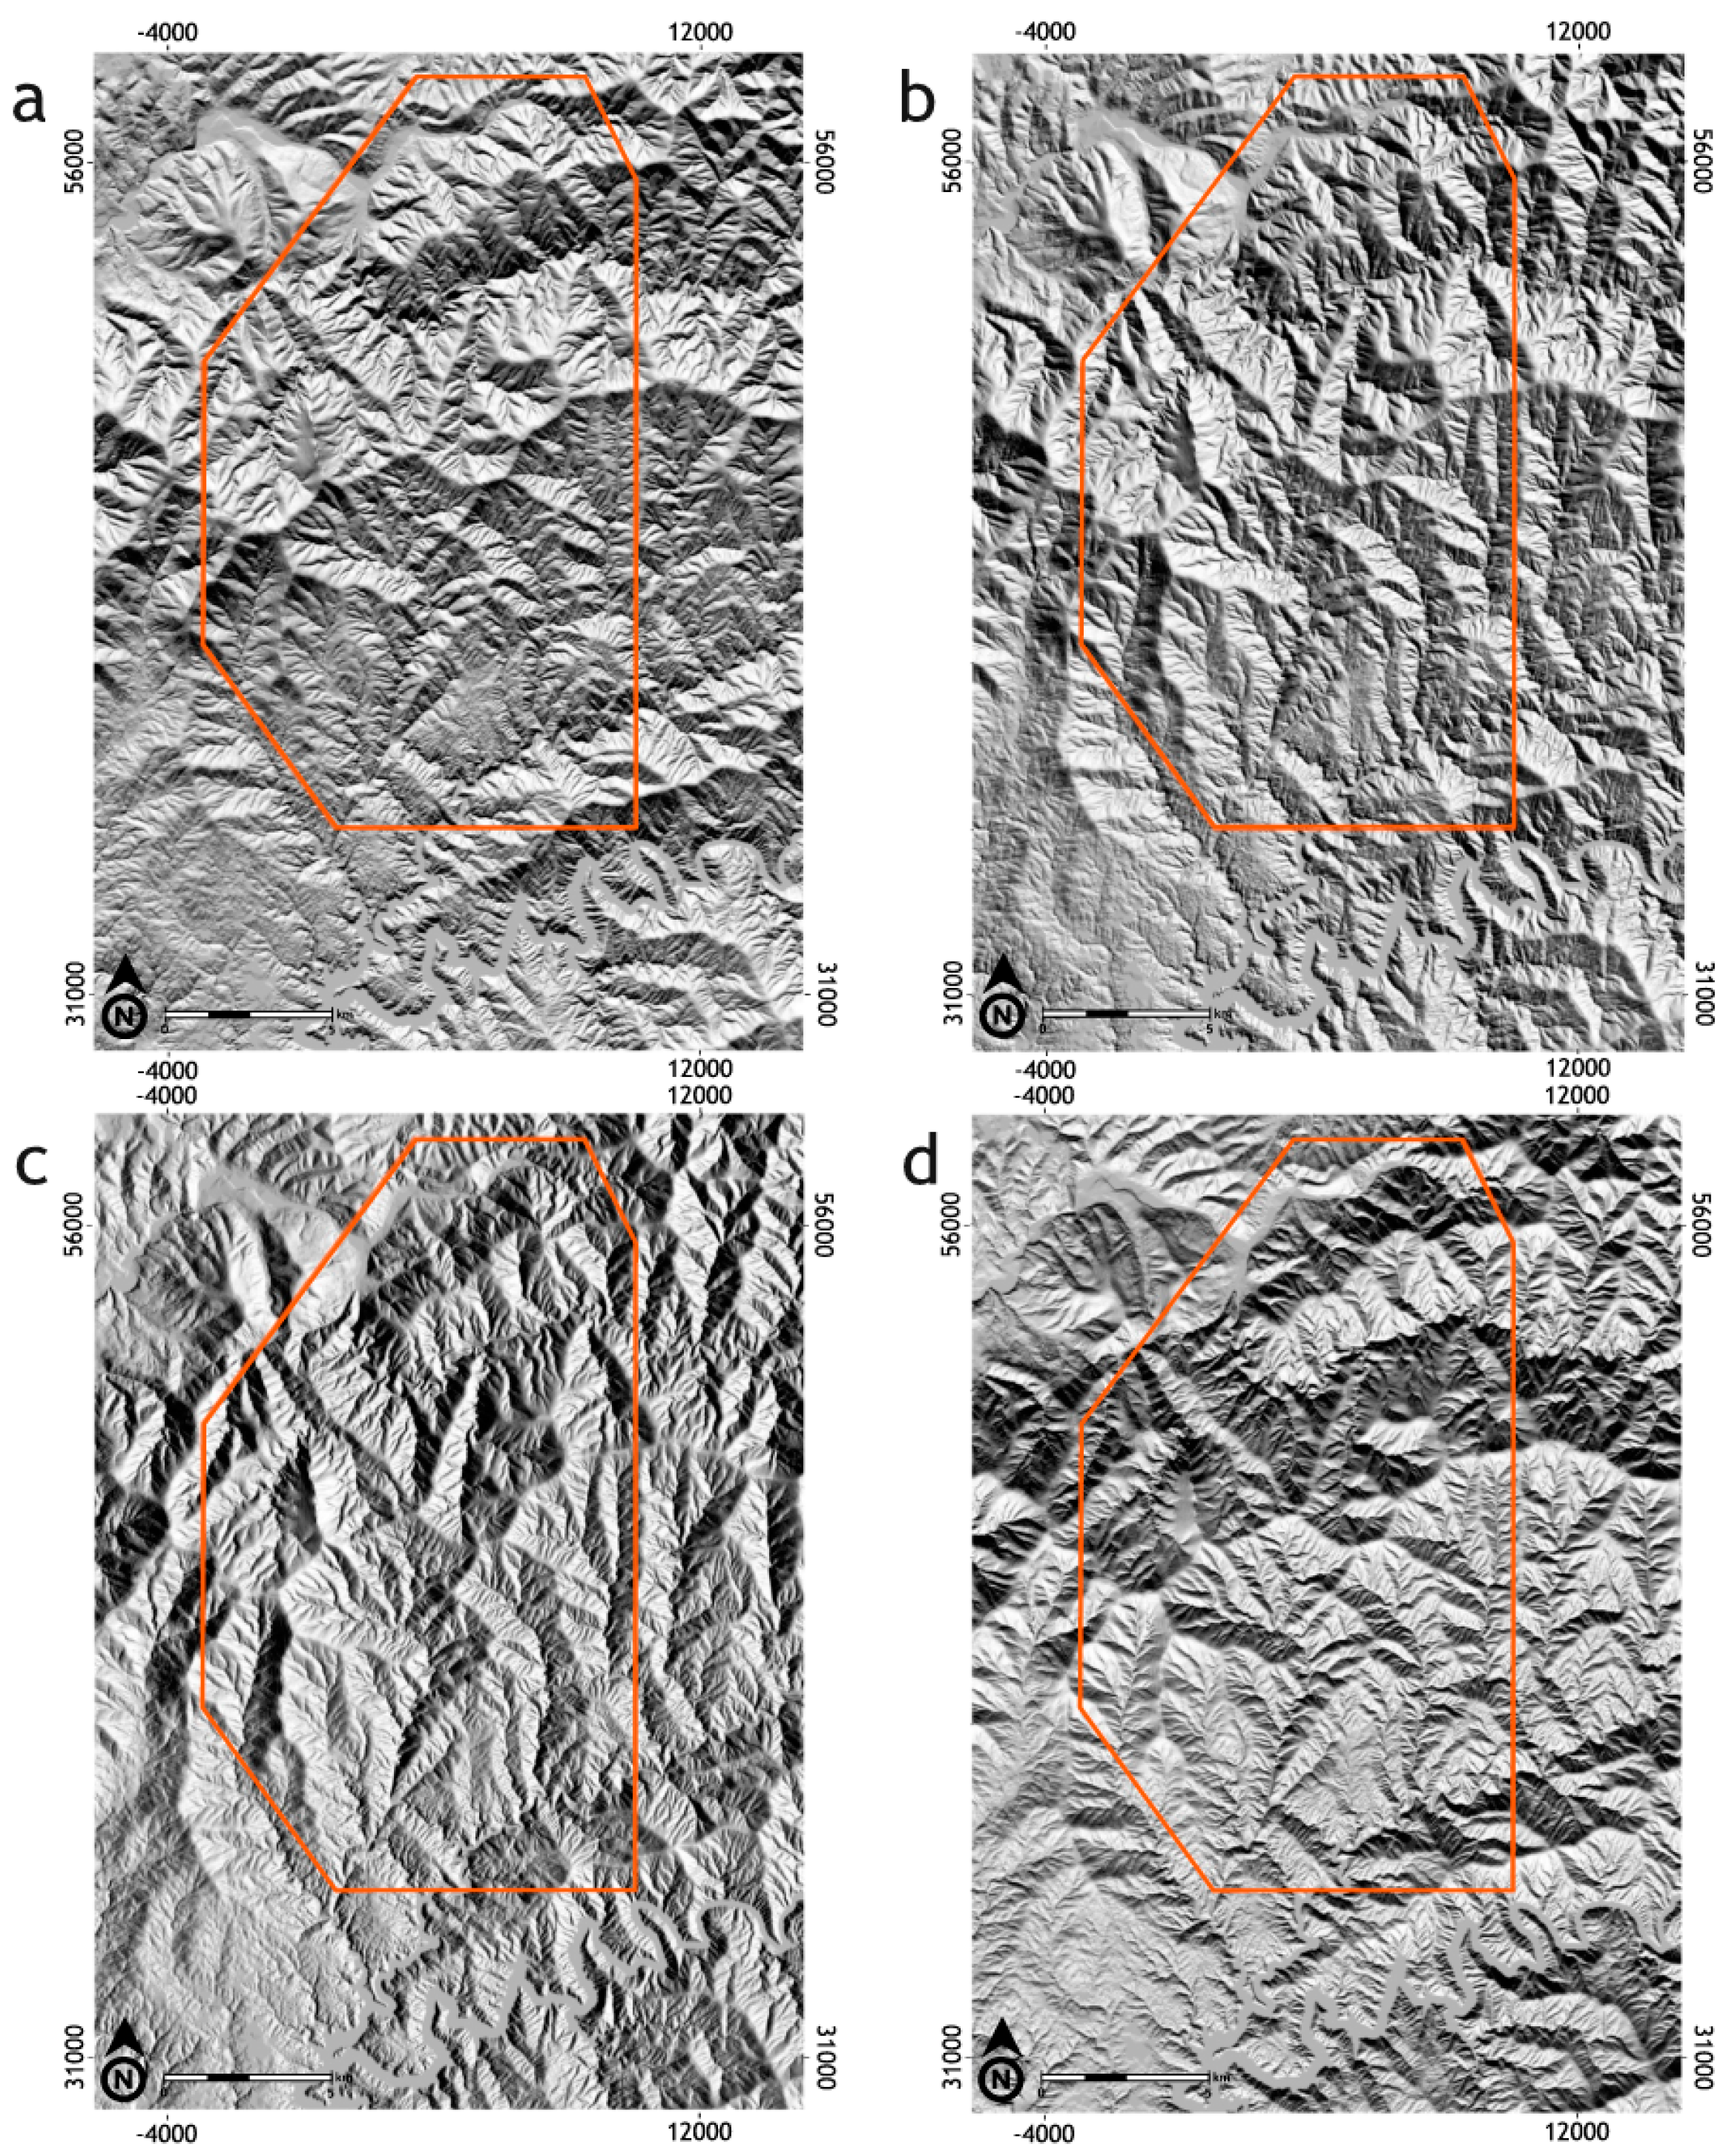
Hill-shade relief maps (original elevation data from the Portuguese Military Cartography at 1:25,000 scale) were created using the following parameters: z factor: 2; solar azimuth intervals: 45°; solar angle: 45°; raster resolution 10 m × 10 m. Some examples of the obtained maps are shown in Figure 9.
4.1.3. Preliminary Lineament Extraction
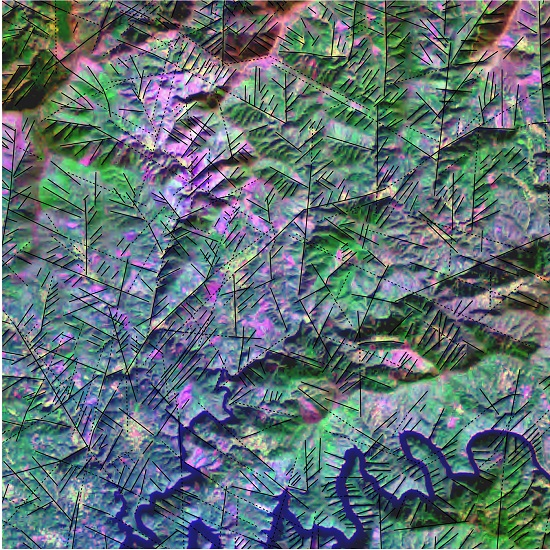
The processed digital images resulting from the Landsat 8 imagery (RGB colour composites, directional high pass filters over single bands and band ratios) and the hill-shade relief maps were interpreted using geological photointerpretation criteria. From these initial interpretations, the preliminary lineament maps displayed in Figure 10 were obtained.
4.2. Field Validation and Lineament Reinterpretation
Fieldwork was undertaken between May and July 2015 in order to authenticate, in situ, the results of image processing and interpretation. Lineament maps were the most significant products resulting from the early interpretations. Hence, fieldwork was mainly focussed in structural and geomorphological analysis. Additionally, part of the work included the identification of false positives. These false positives mostly included man-made linear features such as roadways, forest firebreaks, electrical power distribution structures or vegetation and agriculture boundaries.
Due to some constraints such as the dimensions of the study area or the poor accesses in the region, the fieldwork was mainly focused within the borders of the Escádia Grande mineral exploration area. Due to the scarcity of accessible quality rock outcrops, most of the work was done in the vicinity of some of the old mines (e.g., Vale Pião, Escádia Grande or Senhora da Guia) and following road cut slopes.
The majority of the mapped lineaments, or their general trend, were identified in the field as features with clear geological significance (some examples are provided in Figure 11). A complete description of the fieldwork can be found in Manuel (2015) [5] (pp. 82–94).
Following fieldwork, a two-stage lineament reinterpretation took place. Firstly, the original digital processed images were reinterpreted, resulting in new lineament maps. At this stage, lineaments were also classified according to their scale (regional/local) and occurrence (observed/probable)—see Figure 12. Ultimately, all new lineament interpretations were merged, thus resulting in a final lineament map.
Regional scale lineaments presented in Figure 12 are similarly represented in all Landsat 8 interpretations. The reinterpretation based on the RGB composites seems to be the more natural in the sense that it produced shorter and irregular lineaments, but with very persistent trends. While providing more spatially continuous lineaments, the reinterpretation of the images resulting from the application of directional filters on Landsat 8 Band 6, produced equally acceptable results. Despite the fact that the use of directional spatial filters on band ratios provided the smallest number of lineaments of the three original Landsat 8 processing techniques, all identified trends are coherent with the other interpretations. The different interpretations of local scale lineaments are virtually complementary; together, they produce a very detailed interpretation, clearly showing preferential trends.
The classification of lineaments according to their scale and occurrence and a more detailed interpretation provided significant improvements to the preliminary interpretations. In addition to the fact that regional structures became even more evident, local scale lineaments are reflecting the terrain texture and the most probable geological features that originate them.
Figure 13 depicts the final lineament map, obtained by ultimately merging all lineament reinterpretations.
4.3. Lineament Analysis
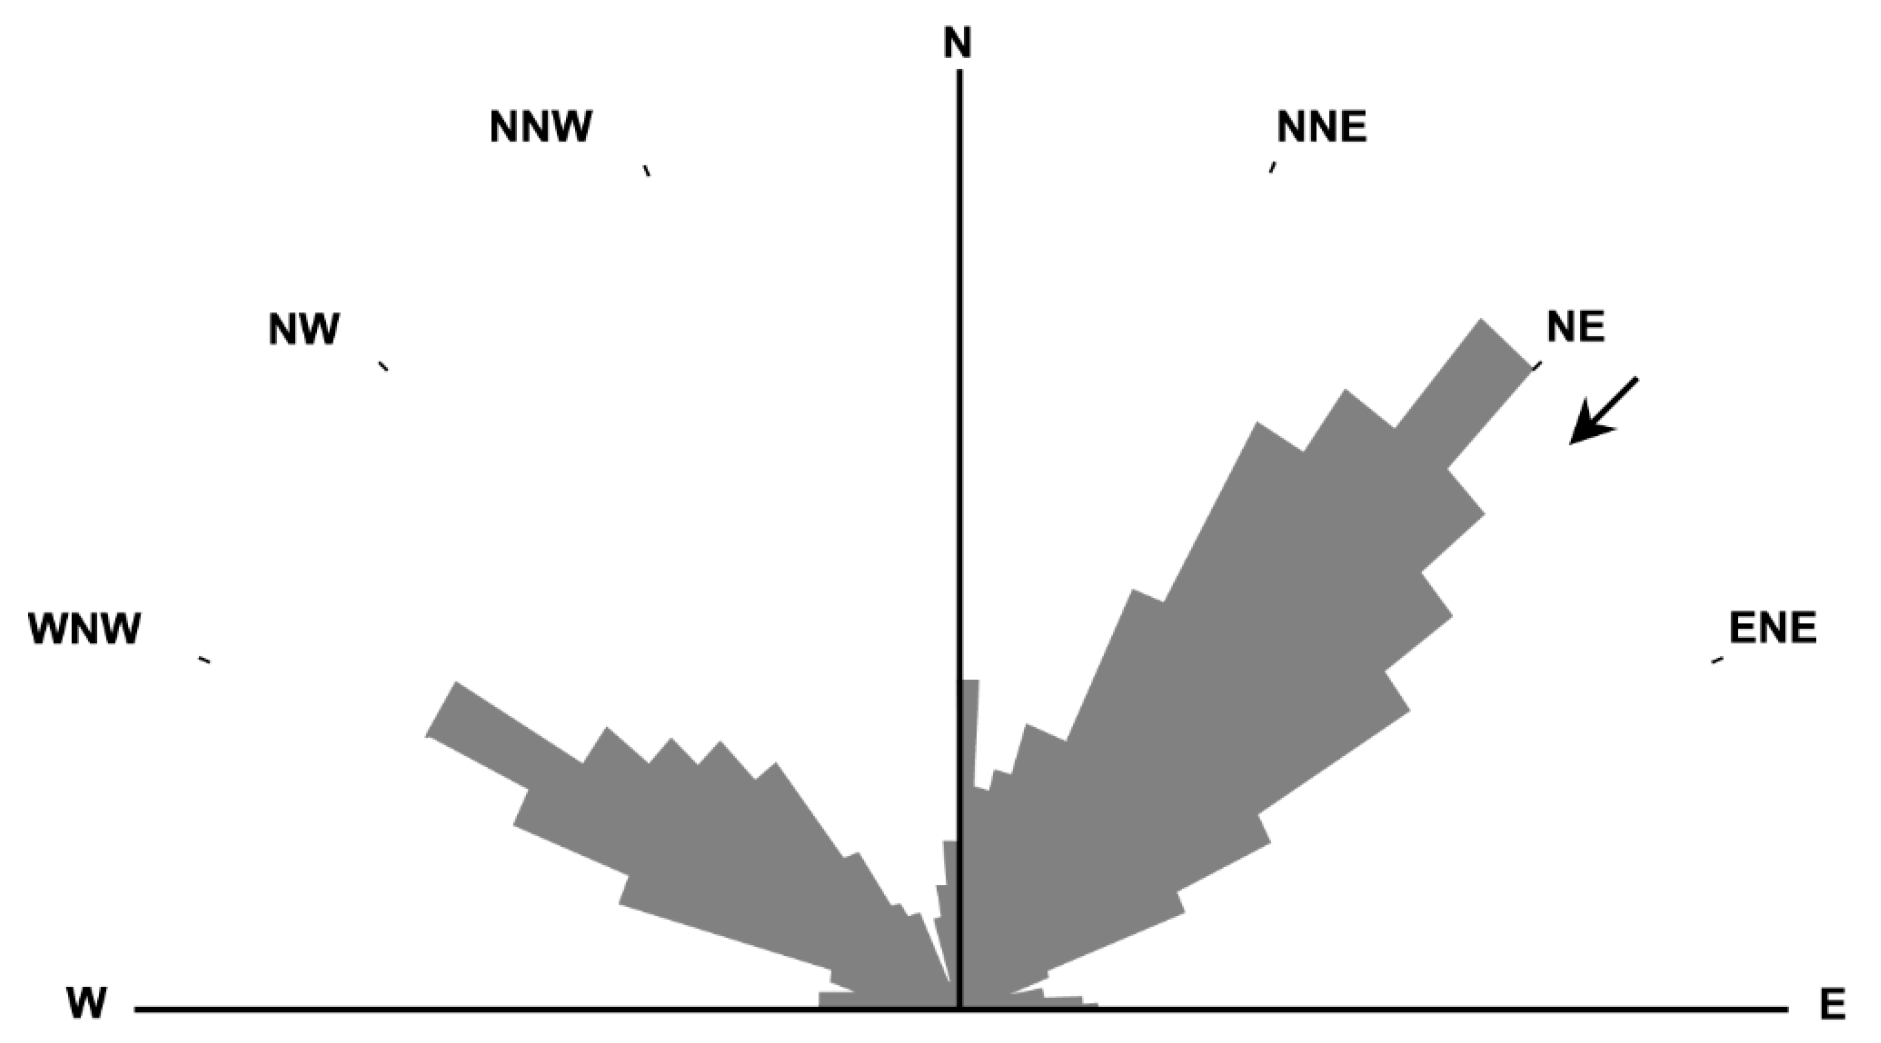
The display of all lineament trends in a rose diagram (Figure 14) allows the easy identification of the NE–SW trends as the most predominant. This is the trend displayed by important faults and fractures (possibly related to the Lousã or Cebola faults)—resulting from recent, brittle, deformation stages and affecting the geology and metallogeny of the whole region [10,20,27,30]. This is also the trend of the Sn-W breccias (also associated with Au) of Vale Moreiro-Casal Loureiro and of Vale Pião [35,36,37,38].
The second most significant set of lineament trends is WNW–ESE. This trend group should be related to Variscan deformation stages (D1–D4), which tends to confirm that it is this orogeny that controls the most penetrative structural features of the region. This is also the trend of the most ancient W occurrences of Senhora da Guia, of some of the occurrences in Vale Pião and also of the Escádia Grande occurrences [37,38,39].
The least common lineament trends are N–S and E–W, which may be related to recent brittle deformation stages. According to what was previously referred, the N–S trend should be related to the structural control of the Vieiro-Fonte Limpa Au-Ag metallogenic belt [34].
By grouping all lineament trends in classes of 30°, the observations just made regarding lineament trends become even more apparent. As seen in Figure 15, the trend classes that include the most lineaments are N 30°–60° E, N 30°–60° W and N 60°–90° W, which evidently matches the information present in the rose diagram. In the same sense, the lineament trends that are least represented include the intervals N 60°–90° E and N 0°–30° W. While the N 30°–60° E, N 30°–60° W and N 60°–90° W trend classes include the bulk of mapped lineaments, it is also clear that their extent is rather limited. Ergo, these trends are depicting numerous small-scale structures, usually extending from 300 m to 600 m, and they are the ones marking the unique terrain texture of the region. It should be noted that despite these small-scale lineaments appear to be disperse throughout the whole area, they can be grouped in various clusters that, in many cases, seem to be themselves limited by larger, more significant lineaments of varying trends. That is, several local lineaments seem to be disposed en échelon, suggesting the existence of regional ductile-brittle structures (shear zones), most probably sinistral, and trending NNE–SSW to NE–SW (see Figure 13). Consequently, this seems to be a crucial argument pointing to the soundness of the interpretation.
Following the creation of the final lineament map, a lineament density map was constructed. The map values shown in Figure 16 were filtered in order to only include lineament density values greater than 3 km/km2. The analysis of Figure 16 readily indicates that the highest lineament densities are concentrated within the Escádia Grande mineral exploration area. An alignment of densities is evident and following the NNE–SSW trend and other smaller alignments of high density values are also evident averagely following the NW–SE trend. The highest lineament density values are found in the north of the area, encompassing both Góis and the region Vale Pião–Cadafaz. Another high-density cluster appears in the southwestern corner of the mineral exploration area.
Although the results shown and discussed previously seem to be somewhat promising, confirmation of the potential association between lineaments, regional geology and metallogeny can only be achieved with the integration of new data. This kind of integration was, indeed, carried out, as described in the following section.
4.4. Data Integration
Following the data processing and extraction stages, the mapped lineaments were integrated and compared with other kinds of data: geological mapping, mineral occurrences, radiometric data and toponymy.
4.4.1. Lineaments and Geological Mapping
Aiming to assess the quality of the lineament interpretation, the mapped lineaments were compared against the currently available geological base-information (Sheet19-D (Coimbra-Lousã), Geological map of Portugal 1:50,000; Geological map of Portugal 1:500,000 [18,19,20]). As Figure 17 depicts, the results obtained coincide with the structures mapped and referenced by previous authors.
The Lousã–Seia fault and related structures (Figure 17(a1)) were effectively identified across the study area. In fact, it can be said that the major difference between the new data and the existing geological mapping is the identification of several smaller structures that parallel the major fault, which may be related with working at larger scales. Both fieldwork and remote sensing data seem to point out that the Piães–Senhora da Guia fault (Figure 17(a2),b) is, in fact, comprised by two branches, trending N 60° E and N 30°–40° E. The Cabreira fault (Figure 17(a3),b) was also identified and the new data seem to indicate that this structure may extend further east.
The eastern contact between the Beiras Group flysch and the Ordovician Quartzite was recognised, as well as some minor NW–SE structures that cut the Armorican Quartzite ridges. It was neither possible to identify the N–S faults that cross the Caneiro Formation near the western edge of the area, nor the Safra fault (Figure 17(a4)).
A rather continuous set of identified lineaments can be identified as the Cebola fault (Figure 17(a5),b). Notwithstanding that the extension of this fault to the south-west does not seem to match the existing geological mapping, the mapped lineaments seem to present a distinct NNE–SSW structural control. In fact, one of the major additions of the current work is precisely the mapping, for the first time, of several NNE–SSW lineaments across the study area, which is directly supported by previous structural descriptions of the area ([47], Ribeiro et al. (1979) in [32]).
The obtained results can be correlated with the data presented by previous authors [45,48,61] who used similar techniques (photointerpretation of satellite imagery and aerial photography) in the Góis–Castanheira de Pêra region or its immediate vicinity. The dominant lineament trends presented by these latter authors are in accordance with the major lineament families that have been highlighted in this study. Unlike the works that included the mapping of several circular features within the Beiras Group (possibly related to non-outcropping granite domes) and the Meso–Cenozoic basins (Andrade and Conde (1976) in [12,43]), no similar structures were identified in this study.
Since the current interpretation allowed the identification of most of the major structural features of the area, in total or in considerable sections of their length, also bearing in mind the differences between scales of work and the fact that many lineaments or their trends have been observed during fieldwork, the efficiency of the present methodology can be attested and the current interpretation may be deemed consistent.
4.4.2. Lineaments and Mineral Occurrences
Overlaying the known mineral occurrences with the lineament map one can clearly see that most of them occur in the proximity of mapped lineaments or, even more important, in locations where these lineaments intersect (see Figure 18).
One of the most important observations, as it is mentioned by previous authors, is the sectioning of the Sn-W sector of Góis by features subparallel to the Lousã-Seia fault. Since this family of lineaments appears to extend west as far as the Armorican Quartzite ridges, if there are Sn-W occurrences to the south-west of the ones currently known, they should certainly be conditioned by structural features of this family and, possibly, share a similar block geometry.
The four different lineament trends that intersect in vicinity of Vale Pião–Cadafaz (Figure 18—mineral occurrences (5) and (9)) may be related with possible mineral occurrences. While the nearly NNW–SSE and NNE–SSW trends may be closely related to Au-Ag occurrences, the NW–SE and NE–SW lineaments may very well be related to possible Sn-W occurrences. Vieiro (Figure 18(8)), the single Au-Ag occurrence known north of the Cabreira fault, seems to be related with a N 5° W feature extending as far as Cadafaz (Figure 18(9)). To the west, two lineaments quite similar to that of Vieiro, one beginning near Senhora da Guia (Figure 17(2)) and the other crossing Barroca de Amiães (Figure 18(3)), may be related to both Sn-W and Au-Ag occurrences. No distinct N–S features were found indicating the Au-Ag Vieiro–Fonte Limpa metallogenic belt.
An alignment from Cadafaz to Mestras/Cabeçadas (Figure 18—mineral occurrences (9,12,13)), which may extend up to Alvares (Figure 18(18)), includes a set of lineaments averagely trending N 15° E and appears to be closely related to Au-Ag occurrences. Even though there are no previous mentions of such an alignment or of any relationship between this particular trend and Au-Ag occurrences in the study region, this close association is quite common throughout the Iberian Massif.
The only features identified near Escádia Grande (Figure 18(14)) are most probably not directly related with the ore-body itself, but with the NNW–SSE and ENE–WSW fracturing systems influencing it. Notwithstanding, the mapping of NW–SE trending lineaments between Escádia Grande and Fonte Limpa (Figure 18—mineral occurrences (14,17)) may be related with the Escádia Grande Au-Ag metallogenic belt. It should also be noted that similar trending features were mapped both to the north and south of this belt and that, most importantly, many Au-Ag occurrences appear near the intersection of these lineaments with others trending NNE–SSW. Thus, these locations should be of particular interest in exploration.
The occurrences of Fonte Limpa and Vale Torto (Figure 18—mineral occurrences (17,23)) appear near the intersection of NW–SE, NE–SW and nearly N–S lineaments, which marks locations with similar characteristics as potential exploration targets.
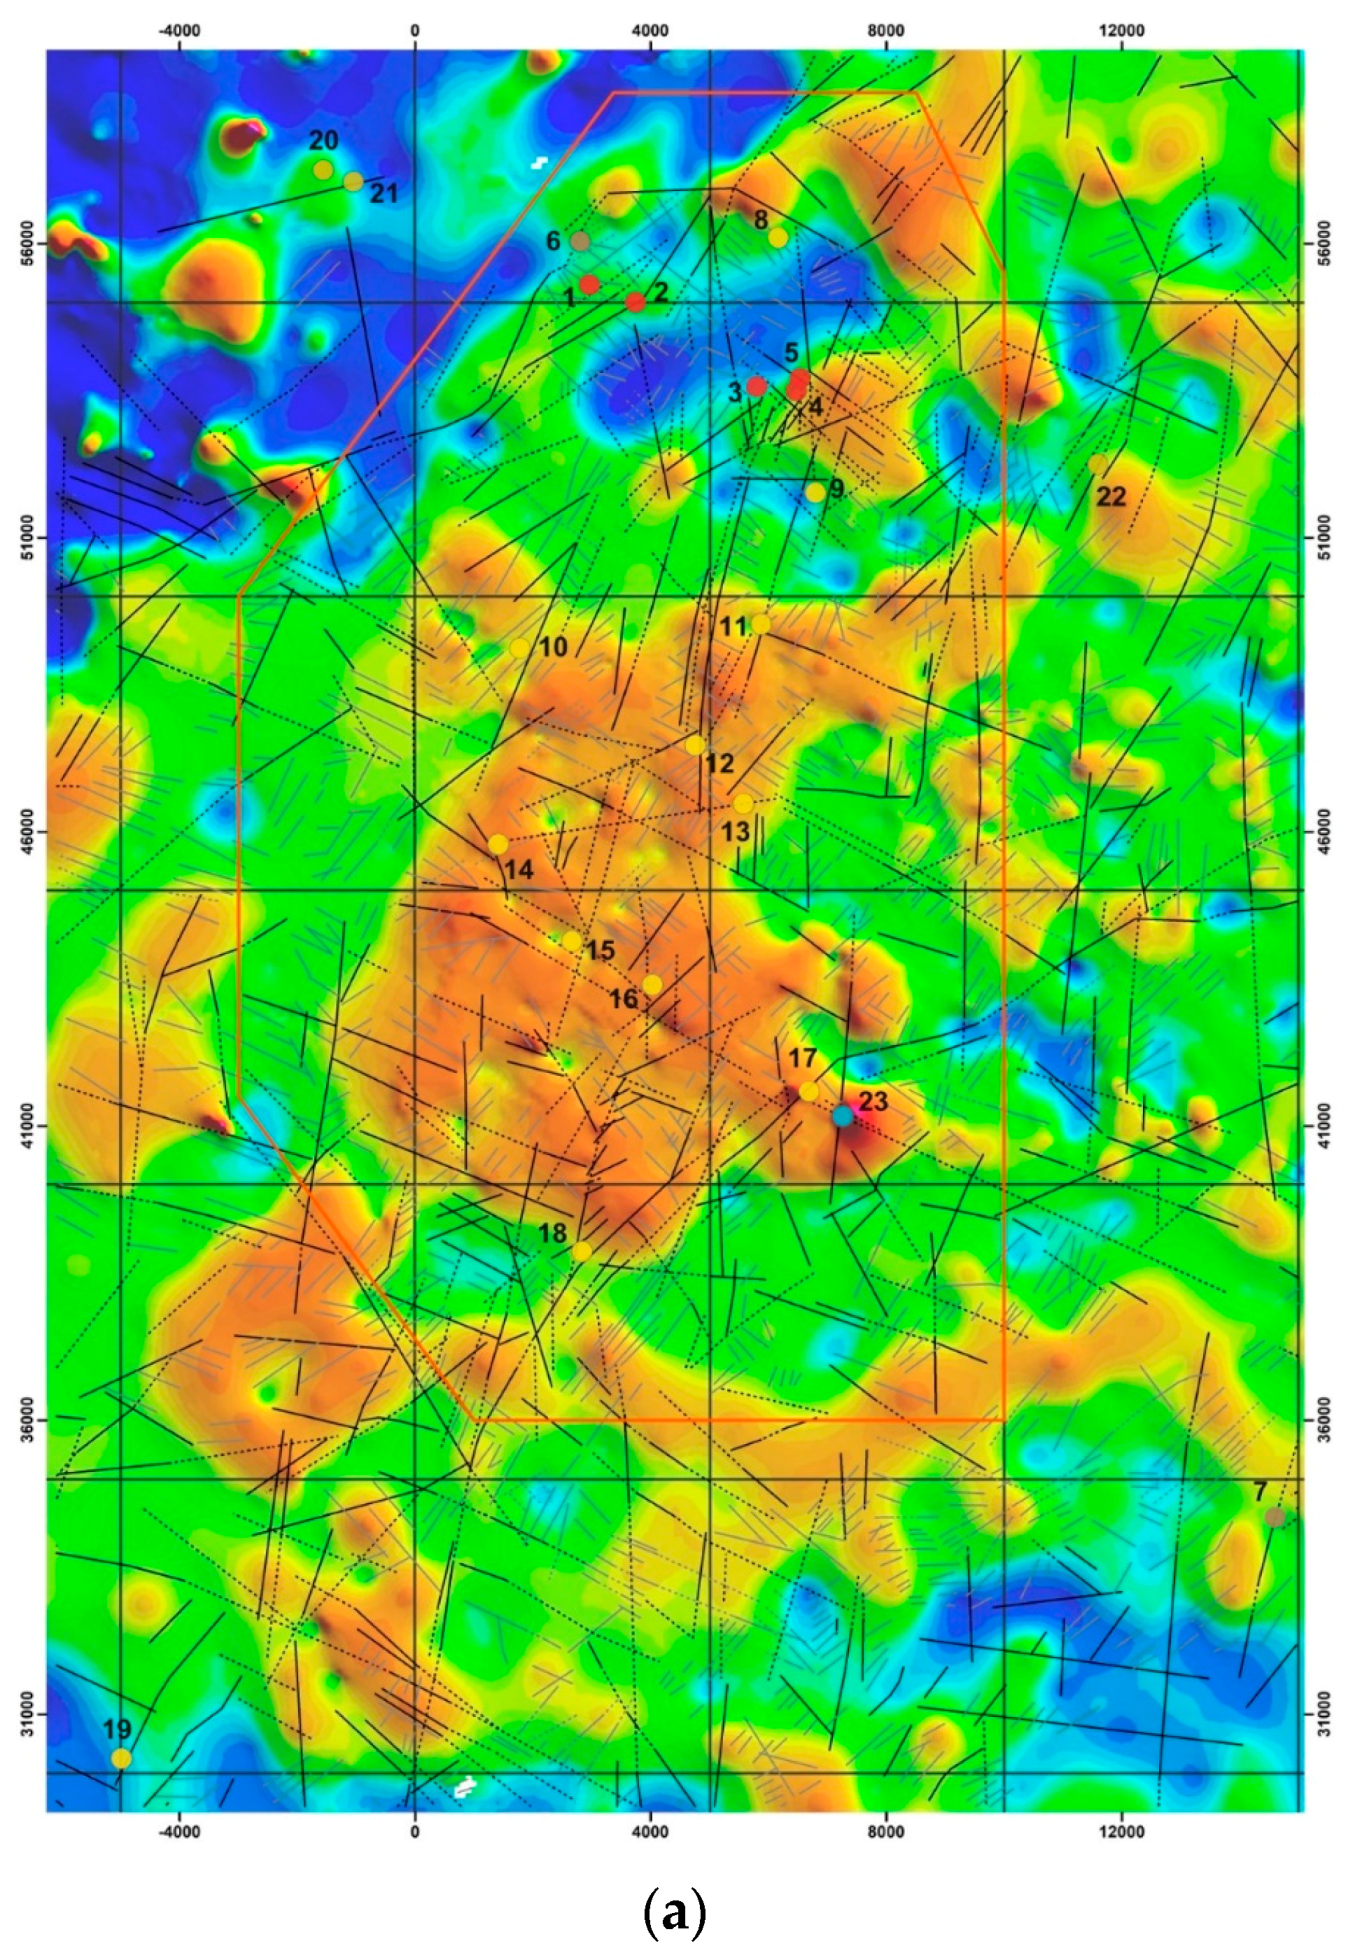
4.4.3. Lineaments and Radiometric Data
Surficial natural gamma radiation can be usually related to highly fractured areas and to the existence of a radioactive source in depth. Since, as it was mentioned in Section 2.1.1, it is possible that there is non-outcropping granite in the region [40,41,42], the simultaneous existence of high radiation values and high lineament density may be an indication for underlying granitic masses. On the other hand, high radiation values may also be related to superficial materials, namely black shales and siliciclastic sedimentary originating from the erosion of igneous rocks (arkoses) [62], which both occur in the region [63].
Figure 19 shows the natural gamma radiation map overlain by the known mineral occurrences and mapped lineaments and also the lineament density map. From Figure 19, a large concentration of high radiation values in the centre of the study area is rather evident. The fact that this regional anomaly seems to be bounded by very well marked lineaments, both to the north-west and the south-east (such as the Cebola fault), and since it can be directly correlated to the NNE–SSW alignment of lineament density, may indicate that it is possibly caused by a granite intrusion. Being, in fact, a granitic intrusion, its radiometric signature seems to be radically contrasting to that of the Coentral granite, which virtually cannot be distinguished from the regional background (see the western limit of the Escádia Grande mineral exploration area in Figure 19). Therefore, this possible granitic intrusion may be related to the more recent Variscan deformation stages and, thus, to possible mineral occurrences.
As seen in Section 4.4.2., four families of lineaments intersect in the area of Vale Pião–Cadafaz, thus resulting that this is the area with the highest lineament density of all the study area. The analysis of Figure 19 (mineral occurrences (5–9)) also reveals that this area includes a gamma radiation anomaly of very high values and of considerable dimensions. Therefore, all the present data, together with the already mentioned geophysical campaigns, seem to indicate that there should be a non-outcropping granite dome in this site, to which may be related both Sn-W and Au-Ag occurrences.
The fact that nearly all Au-Ag occurrences south of Cadafaz (Figure 19(9)) coincide with radiometric peaks and areas of high lineament density (intersection of NNE–SSW and NW–SW to WNW–ESE lineaments) should be duly emphasised.
Another high lineament density location is the south-western border of the Escádia Grande mineral exploration area. The fact that this density high does not match a significant radiometric anomaly, may, without any other data at the time, be explained by lithological contrasts. Notwithstanding, the south-eastern extremity of this density high matches a slight increase in radiation values, thus marking this location as another viable exploration target.
Despite the fact that they do not correspond to a high lineament density location, the occurrences of Fonte Limpa and Vale Torto (Figure 19—mineral occurrences (17,23)) are located at the intersection of regional-scale lineaments and also border the greatest radiation values of the entire area. Therefore, the surroundings of both these occurrences should also be targeted for exploration.
Other locations of high lineament density and radiation values occur near Vieiro (Figure 19(8)) and north-east of Colmeal (Figure 19(22)). Some radiation anomalies nearly aligned N–S and corresponding to mapped lineaments are also of note. The radiation positive anomaly to the east of Vale Pião (Figure 18(5)) should be a potential exploration target for it corresponds to the intersection of NNE–SSW and WNW–ESE lineaments. The NNW–SSE lineament roughly beginning near Senhora da Guia (Figure 19(2)) and already alluded to in the preceding subsection, should again be mentioned since it extends over a radiation peak that is roughly aligned with Vale Pião (Figure 19(5)).
The sharp boundary between the largest extent of low radiation values (blue tones in the NW corner of the study area) and the regional background of the Beiras Group (greenish tones) is quite distinctive and follows a clear NE–SW trend. This boundary is both marked in the lineament interpretation and it corresponds precisely to the Lousã–Seia fault, a feature of regional significance. Still regarding the low radiation values, the expressive signature of the block defined by the Piães–Senhora da Guia and by the Cabreira faults must be noted (see Figure 19—mineral occurrences (2,3)). This signature may be due to the interference of NE–SW structures that segment the region. The fact that the radiation values appear to increase towards the south-west of this anomaly and reach a peak of high values may indicate another possible target for exploration.
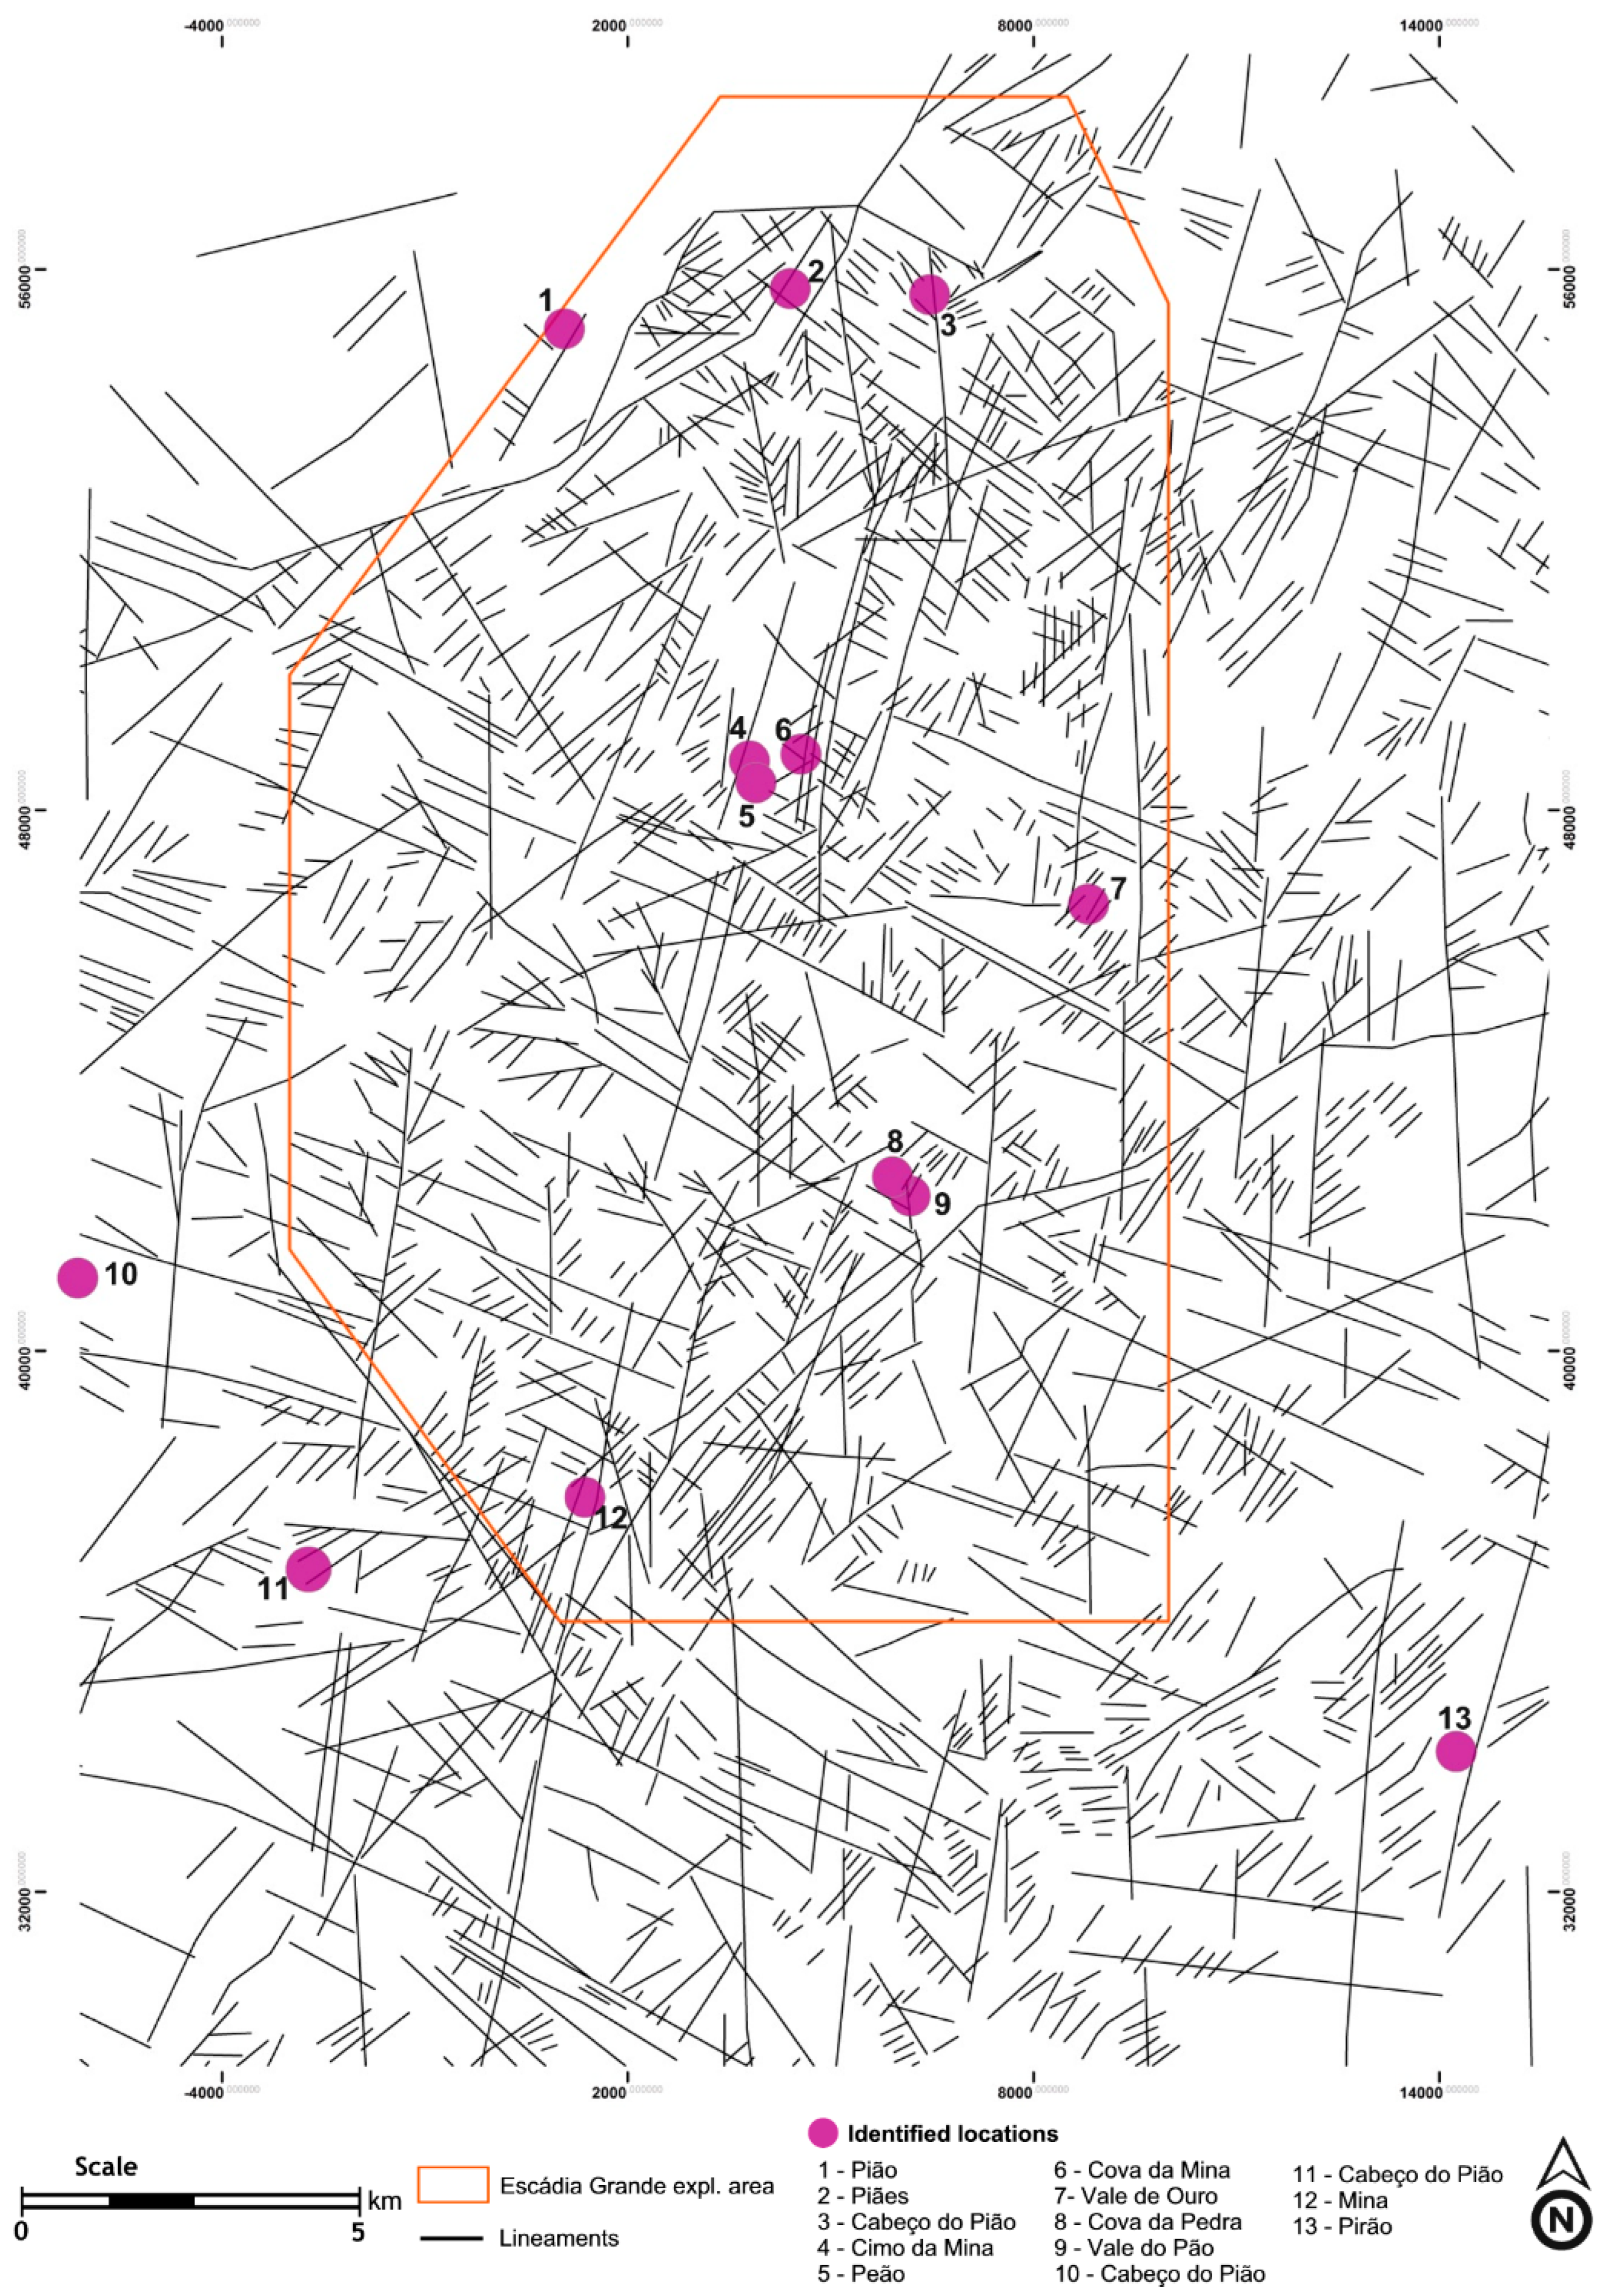
4.4.4. Lineaments and Toponymy
In the course of this work, the abundant use of particular Portuguese toponyms directly related to geology and even to possible mining works (mina and pião/peão) was noted. The association between these particular toponymies, their geographical positioning and their possible geological association became apparent after the superimposition over the lineament map. In Figure 19, which shows these places of particular toponymy (found in the 1:25,000 scale Portuguese Military Cartography), it can be easily seen that most of them appear to be related with the mapped lineaments, especially those comprising the Au-Ag metallogenic belt of Escádia Grande (Figure 20—locations (8,9)) and the NNW–SSE trending lineaments that, as previous mentioned in Section 4.4.2, may be closely related to Au-Ag occurrences (Figure 20—locations (4–6,12)).
4.5. Target Selection and Prioritisation
The data integration stages led to the establishment of five criteria in order to select the areas with the highest potential for mineralisation: (1) geology; (2) known mineral occurrences; (3) mapped lineaments; (4) radiometric data; and (5) toponymy.
- (1) Geology—geology was used as an exclusion criterion; the areas corresponding to the Meso-Cenozoic basins, the Ordovician Quartzites and the Coentral granite are most probably not related with any primary Sn-W or Au-Ag occurrences, and thus were excluded.
- (2) Mineral occurrences—areas of influence were created around all known mineral occurrences (1 km); the proximity to known mineral occurrences or the alignment according to trends similar to those of the ore bodies are factors that should be considered for they increase the probability for a given location to have mineral occurrences of interest. Zones with trends similar to those of adjacent metallogenic belt were also selected.
- (3) Lineaments—areas with high lineament density values (>4 km/km2) and locations near lineaments or lineament trends which may be directly related to metallogenic belts, were selected and considered to have a very high probability of mineral occurrences.
- (4) Radiometric data—places of positive radiation anomalies (total gamma radiation values greater than 67.4 nG/h) were considered possible locations of mineral occurrences.
- (5) Toponymy—areas of influence (500 m) were created around all locations where toponymy indicates a possible association with mineral occurrences or mining works.
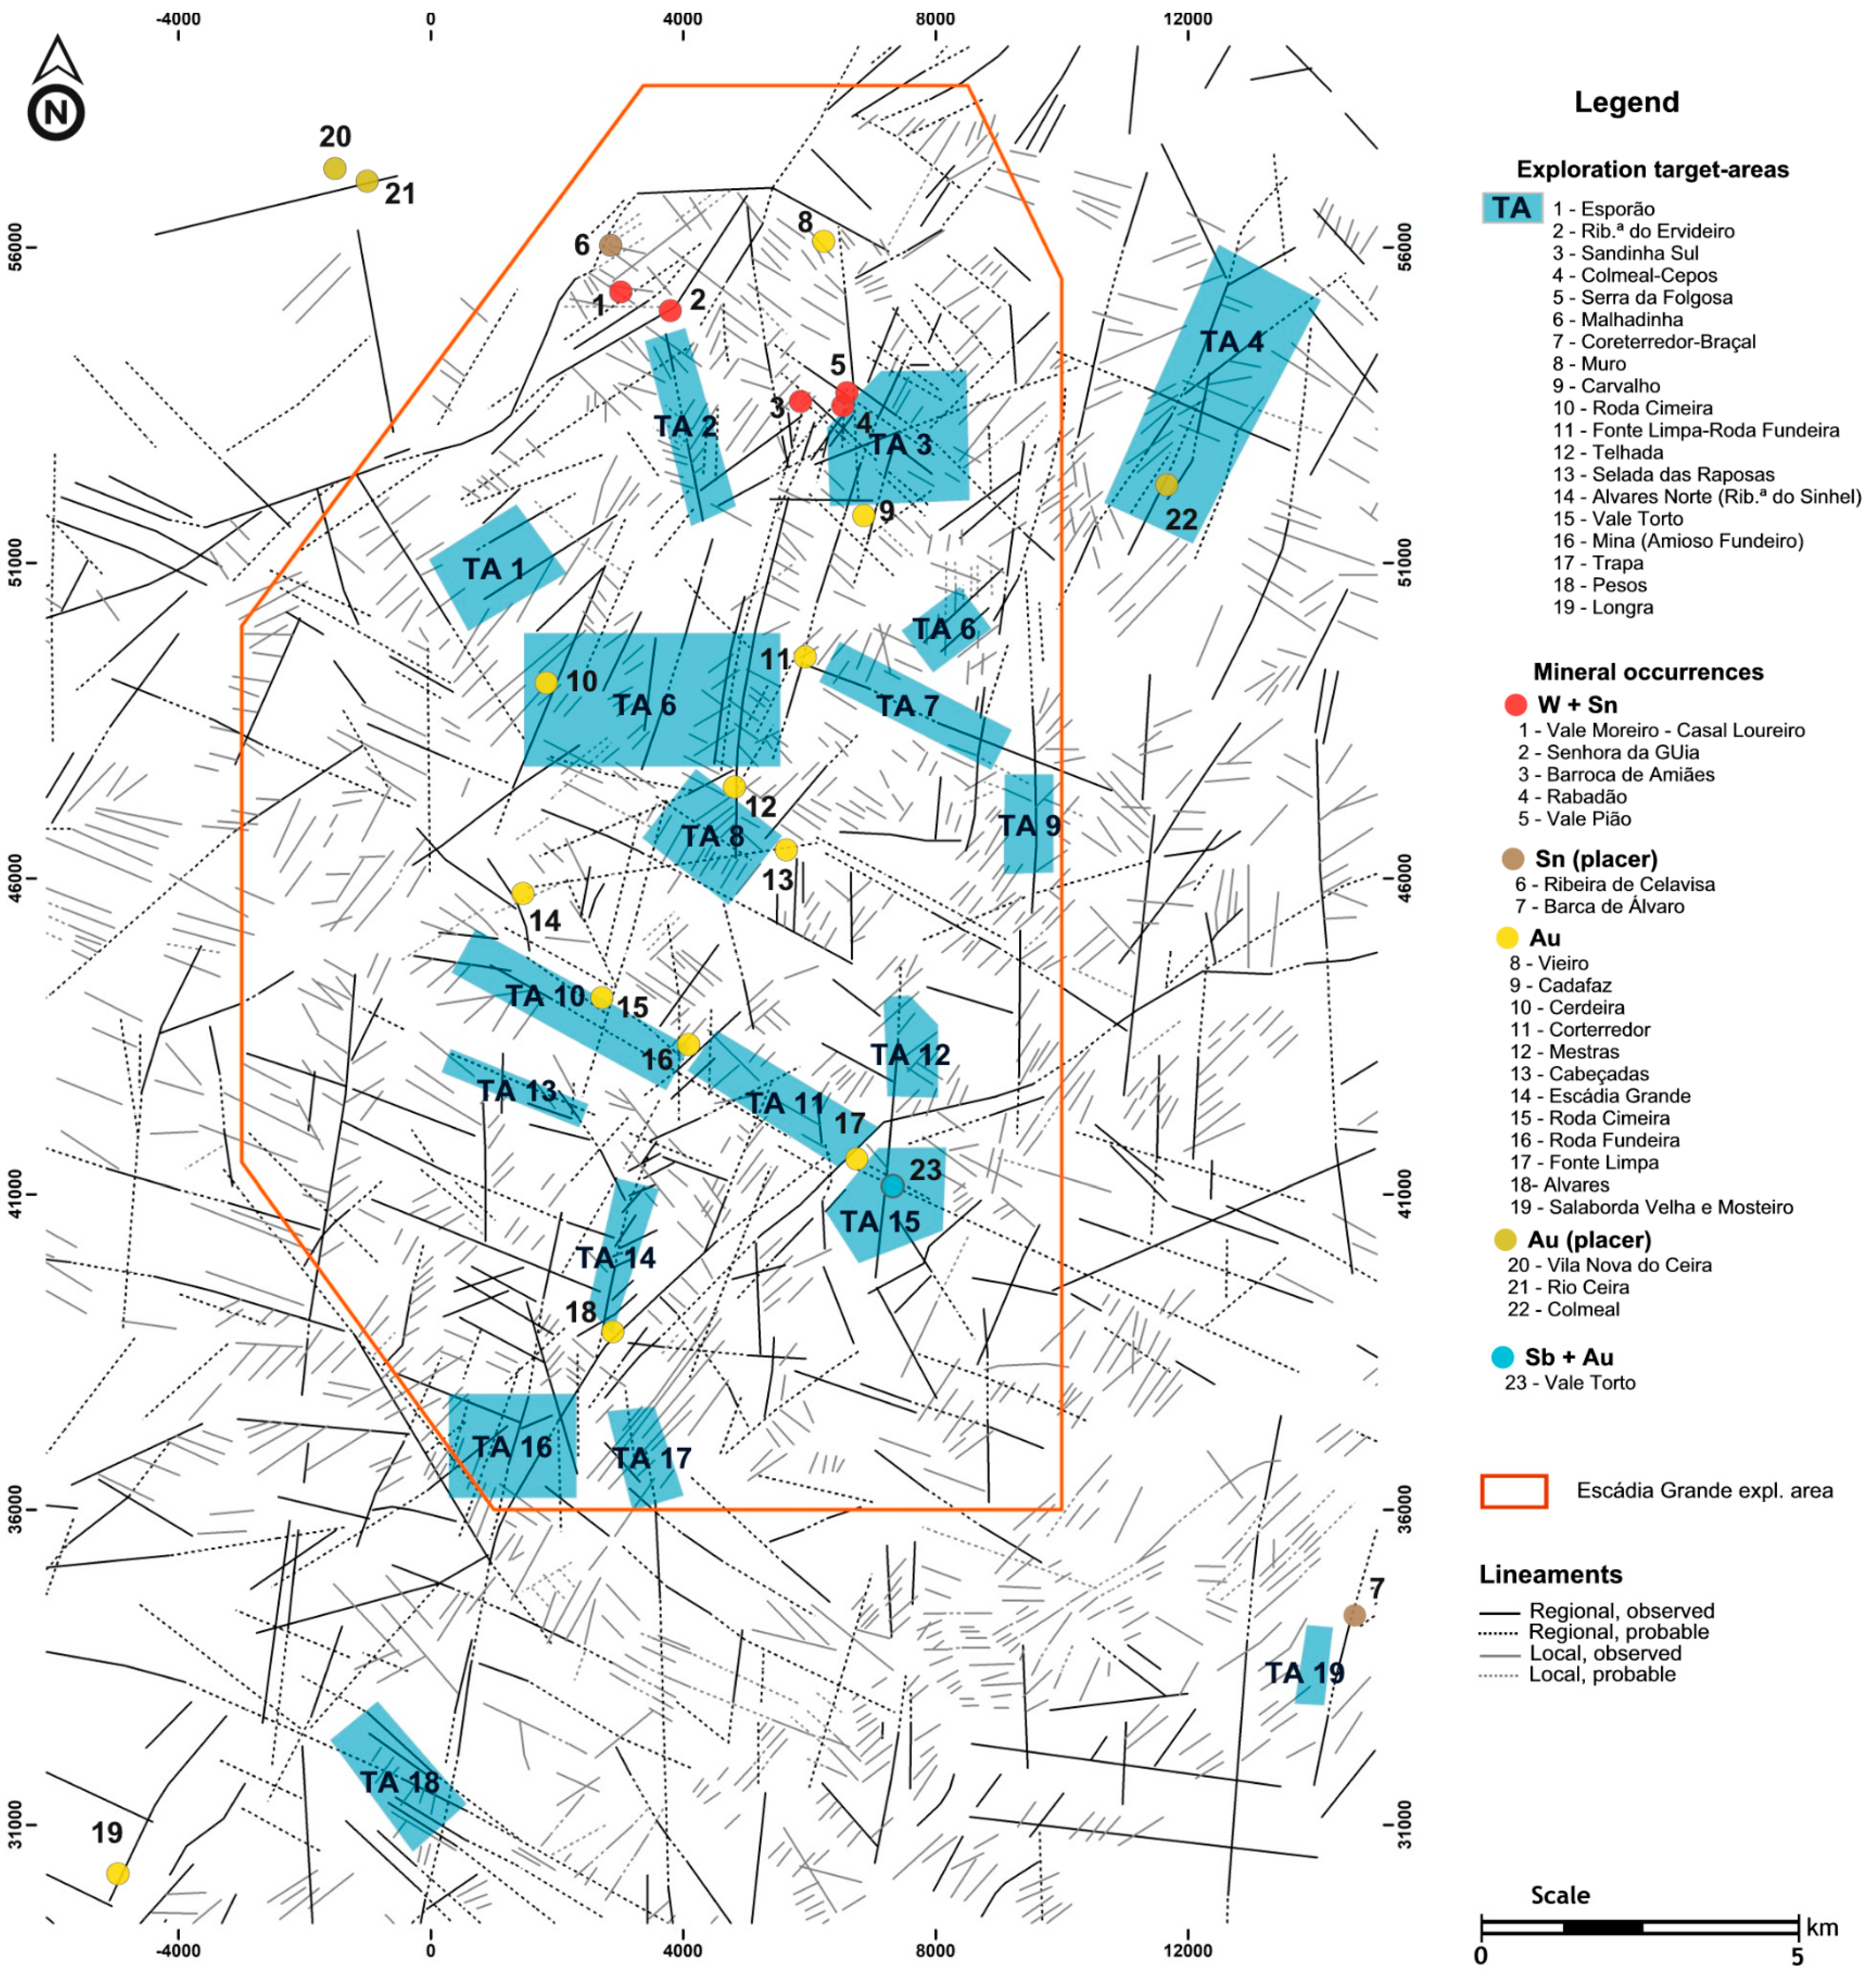
The use of these criteria allowed the definition of 19 target areas (see Figure 21) in which the development of more detailed mineral exploration works is proposed. By establishing these target areas, the original 627 km2 study area was decreased to only 50.5 km2, that is, a reduction to nearly 8% of the original extent.
Most of the target areas are included in the Escádia Grande exploration area and Au-Ag occurrences comprise the main object of exploration.
In order to rank the 19 target areas according to their mineral potential, the parameters and weights listed in Table 4 were used:
Since the mineral occurrences are de facto known and the lineament interpretation was considered sound by fieldwork validation, these are the parameters with less associated uncertainty, thus they have greater impact in the ranking. Although parallels have been drawn between the radiometric data, the superficial geology and interpreted lineaments, radiometric data was given an intermediary weight due to fact that geophysical models always have a degree of uncertainty associated with them. The relation to known metallogenic belts was evaluated according to the intersection of target areas and metallogenic belts. Even having been given the lesser weight and despite the fact that it does not consist of raw numerical data, toponymy was considered an important parameter due to the historical mining background of the whole region. Thus, the 19 areas were ranked according to their mineral potential, the top three being: (TA3) Sandinha Sul, (TA11) Fonte Limpa–Roda Fundeira and (TA15) Vale Torto (see Figure 21).
5. Conclusions
Despite the recognised abundance of primary Sn-W and Au-Ag mineral occurrences in Central Portugal, the detailed geology and metallogeny of the Góis–Castanheira de Pêra area are still poorly studied. Since the economic and strategic importance of these metals is unquestionable, this absence of detailed information may be due to the extent of the area and its mountainous terrain and very dense vegetation, factors that challenge all prospecting and exploration endeavours. Thus, in order to surpass these hindering conditions, the use of remote sensing techniques was proposed.
Consecutive digital image processing algorithms were applied to a Landsat 8 scene and to elevation data-derived products (digital terrain models and hill shade maps). Lineaments were extracted relying on geological photointerpretation criteria, which, after their duly fieldwork validation, allowed the identification of new geological–structural elements in the Góis–Castanheira de Pêra region. The integration of remote sensing data with other information sources led to the definition of locations possibly suitable for hosting Sn-W and Au-Ag mineral occurrences, effectively decreasing the extent of the original area to less than 10% of its original size.
As a final note, the authors would like to emphasise the importance of field validation of remotely sensed data and its integration with other kinds of data. This is the only way that remote sensing should be used as a decision support tool, leading to additional and more detailed mineral exploration work.
Acknowledgments
This work was developed as part of a collaboration protocol between Faculdade de Ciências e Tecnologia/Universidade NOVA de Lisboa and Empresa de Desenvolvimento Mineiro (EDM, S.A.), which resulted in the Master’s thesis “Contribuição da detecção remota na prospecção de Sn, W e Au na região de Góis”. The authors extend their most sincere gratitude to EDM, S.A. representatives. The co-authors are also thankful to GeoBiotec (UID/GEO/04035/2013/FCT). The authors would also like to thank the anonymous reviewers for their crucial comments and suggestions.
Author Contributions
Ricardo Manuel wrote this paper and took part in all research stages. Maria da Graça Brito was responsible for digital image processing and interpretation. Carlos Rosa was involved in the field geological work and, together with Martim Chichorro, provided the preliminary geological interpretation.
Conflicts of Interest
The authors declare no conflict of interest.
References
- Rajesh, H.M. Application of remote sensing and GIS in mineral resource mapping—An overview. J. Mineral. Petrol. Sci. 2004, 99, 83–103. [Google Scholar] [CrossRef]
- Vincent, R.K. Fundamentals of Geological and Environmental Remote Sensing; Prentice Hall: Upper Saddle River, NJ, USA, 1997; p. 366. ISBN 978-0133487800. [Google Scholar]
- Gupta, R.P. Remote Sensing Geology, 2nd ed.; Springer-Verlag: Berlin/Heidelberg, Germany, 2003; p. 655. ISBN 978-3-642-07741-8. [Google Scholar]
- Prost, G.L. Remote Sensing for Geoscientists—Image Analysis and Integration, 3rd ed.; CRC Press: Boca Raton, FL, USA, 2014; p. 622. ISBN 9781466561748. [Google Scholar]
- Manuel, R. Contribuição da Detecção Remota Para a Prospecção de Jazigos de Sn. W e Au na região de Góis. Master’s Degree, NOVA University of Lisbon, Lisbon, Portugal, December 2015. [Google Scholar]
- Martins, L. Mineral Resources of Portugal; DGEG: Lisbon, Portugal, 2012; p. 71.
- LNEG—Laboratório Nacional de Energia e Geologia. Available online: http://www.lneg.pt/ (accessed on 29 September 2017).
- Neiva, J.M.C. Jazigos portugueses de cassiterite e volframite. Comun. Serv. Geol. Port. 1944, 25, 251. [Google Scholar]
- Thadeu, D. Características da mineralização hipogénica estano-volframítica portuguesa. Bol. Ord. Eng. 1965, 10, 61–81. [Google Scholar]
- Carvalho, D. Lineament patterns and hypogene mineralization in Portugal. Est. Notas Trab. Serv. Fom. Min. 1974, 23, 91–106. [Google Scholar]
- Thadeu, D. Hercynian paragenetic units of the Portuguese part of the Hesperic Massif. Bol. Soc. Geol. Portg. 1976, 20, 247–276. [Google Scholar]
- Goinhas, J.; Viegas, L. Província metalogénica estanífera e tungsténica ibérica. Estudos, Notas e Trabalhos do SFM 1983, 25, 147–178. [Google Scholar]
- Mateus, A.; Noronha, F. Sistemas mineralizantes epigenéticos na Zona Centro-Ibérica; expressão da estruturação orogénica Meso- a Tardi-Varisca. In Ciências Geológicas-Ensino e Investigação e Sua História; Neiva, J.M.C., Ribeiro, A., Victor, M., Noronha, F., Ramalho, M., Eds.; Associação Portuguesa de Geólogos and Sociedade Geológica de Portugal: Lisbon, Portugal, 2010; Volume 2, pp. 47–61. [Google Scholar]
- Noronha, F.; Ribeiro, M.A.; Almeida, A.; Dória, A.; Guedes, A.; Lima, A.; Martins, H.C.; Sant’Ovaia, H.; Nogueira, P.; Martins, T.; et al. Jazigos filonianos hidrotermais e aplitopegmatíticos espacialmente associados a granitos (norte de Portugal). In Geologia de Portugal; Dias, R., Araújo, A., Terrinha, P., Kullberg, J.C., Eds.; Escolar Editora: Portugal, 2013; Volume 1, pp. 377–402. ISBN 9789725923641. [Google Scholar]
- European Commission. Report on Critical Raw Materials for the EU—Critical Raw Materials Profiles; European Commission: Brussels, Belgium, 2014; p. 205. [Google Scholar]
- European Commission. Report on Critical Raw Materials for the EU—Non-Critical Raw Materials Profiles; European Commission: Brussels, Belgium, 2014; p. 138. [Google Scholar]
- European Commission. Report on Critical Raw Materials for the EU. Report of the Ad Hoc Working Group on Defining Critical Raw Materials; European Commission: Brussels, Belgium, 2014; p. 41. [Google Scholar]
- Cunha, T.; Soares, A.F.; Marques, J.F.; Rocha, R.B.; Sequeira, A.J.D.; Sousa, M.B.; Pereira, E.; Santos, J.R. Sheet 19-D (Coimbra-Lousã), Geological Map of Portugal at 1:50,000 Scale; LNEG: Alfragide, Portugal, 2005.
- Oliveira, J.T.; Pereira, E.; Ramalho, M.; Antunes, M.T.; Monteiro, J.H. (Coord.). Geological Map of Portugal 1:500,000 Scale, 5th ed.; LNEG: Alfragide, Portugal, 1992.
- Meireles, C.; Sequeira, A.J.D.; Castro, P.; Ferreira, N. New data on the lithostratigraphy of Beiras Group (Schist Greywacke Complex) in the region of Góis-Arganil-Pampilhosa da Serra (Central Portugal). Cadernos Lab. Xeolóxico de Laxe 2013, 37, 105–124. [Google Scholar]
- Julivert, M.; Fontboté, J.M.; Ribeiro, A.; Conde, L. Mapa Tectónico de la Península Ibérica y Baleares; IGME: Madrid, Spain, 1974; p. 94. [Google Scholar]
- Oliveira, J.M.S. Geological, mineralogical and lithogeochemical studies in the Gois and Vila Pouca de Aguiar-Vila Real region, Portugal. Estudos, Notas e Trabalhos do SFM 1990, 32, 65–76. [Google Scholar]
- Medina, J.; Sequeira, A.; Silva, A.F.; Oliveira, J.T.; Rodriguez-Alonso, M.D. O Complexo Xisto-Grauváquico (CXG) da região de V.N. Poiares-Arganil-Mortágua. In Livro guia das excursões do V Congresso Nacional de Geologia; Oliveira, J.T., Pereira, E., Eds.; LNEG-LGM: Alfragide, Portugal, 1998; pp. 135–158. [Google Scholar]
- LNEG-LGM. Geological Map of Portugal 1:1,000,000, 3rd ed.; LNEG-LGM: Alfragide, Portugal, 2010.
- Gomes, E.M.C.; Antunes, I.M.H.R. O granito de Coentral revisitado: Idade U-Pb de zircão. In Proceedings of the VIII Congresso Ibérico de Geoquímica—Livro de Actas, Castelo Branco, Portugal, 24–28 September 2011; IPCB: Castelo Branco, Portugal, 2011; Volume 1, pp. 235–239. ISBN 972-989-8196-16-3. [Google Scholar]
- Ribeiro, A.; Kullberg, M.C.; Kullberg, J.C.; Manuppella, G.; Phipps, S. A review of Alpine tectonics in Portugal: Foreland detachment in basement and cover rocks. Tectonophysics 1990, 184, 357–366. [Google Scholar] [CrossRef]
- Cathelineau, M.; Boiron, M.C.; Palomero, F.G.; Urbano, R.; Florido, P.; Pereira, E.; Noronha, F.; Barriga, F.J.A.S.; Mateus, A.; Yardley, B.; et al. Multidisciplinary Studies of Au-Vein Formation. Application to the Western Part of the Hesperian Massif (Spain-Portugal). Project MA2M-CT90-0033, Multiannual R & D Programme (1990–1992) on Primary Raw Materials and Recycling of Nonferrous Metals, CEC, Final Report; Centro de Geologia da Universidade do Porto: Porto, Portugal, 1993; p. 391. [Google Scholar]
- Martínez Catalán, J.R. The Central Iberian arc, an orocline centered in the Iberian Massif and some implications for the Variscan belt. Int. J. Earth Sci. 2012, 101, 1299–1314. [Google Scholar] [CrossRef]
- Gutierréz-Alonso, G.; Collis, A.S.; Fernández-Suárez, J.; Pastor-Galán, D.; González-Clavijo, E.; Jourdan, F.; Weil, A.B.; Johnston, S.T. Dating of lithospheric buckling: 40Ar/39Ar ages of syn-orocline strike–slip shear zones in northwestern Iberia. Tectonophysics 2015, 643, 44–54. [Google Scholar] [CrossRef]
- Noronha, F.; Cathelineau, M.; Boiron, M.; Banks, D.; Dória, M.; Ribeiro, M.; Nogueira, P.; Guedes, A. A three-stage fluid flow model for Variscan gold metallogenesis in Northern Portugal. J. Geoch. Explor. 2000, 71, 209–224. [Google Scholar] [CrossRef]
- Freire, M.; Chichorro, M.; Matias, F.; Amaral, P.K.; Pereira, M.F.; Brandão, J.S. High resolution geological structural mapping for prospecting gold and arsenic in sheared granites: A case study of the Santo António gold deposits (Penedono). In Livro de Resumos do X Congresso Ibérico de Geoquímica/XVIII Semana de Geoquímica; LNEG: Alfragide, Portugal, 2015; pp. 84–87. ISBN 978-989-675-039-8. [Google Scholar]
- Sequeira, A.J.D.; Cunha, P.P.; Sousa, M.B. A reactivação de falhas, no intenso contexto compressivo desde meados do Tortoniano, na região de Espinhal-Corja-Caramulo (Portugal Central). Comun. Inst. Geol. Min. 1997, 83, 95–126. [Google Scholar]
- Cerveira, A. Notas sobre as minas de ouro da Serra da Louzã. Bol. Soc. Geol. Port. 1946, 6, 245–255. [Google Scholar]
- SIORMINP—Sistema de Informação de Ocorrências e Recursos Minerais Portugueses; LNEG: Alfragide, Portugal, 2000. Available online: http://geoportal.lneg.pt/geoportal/egeo/bds/siorminp/ (accessed on 29 September 2017).
- Parra, A.A.H.N. Resultados da aplicação do método mineralométrico com base em solos superficiais à prospecção de jazidas primárias de cassiterite, volframite e ouro na região de Góis. Estudos, Notas e Trabalhos 1990, 32, 83–92. [Google Scholar]
- Oliveira, M.A. Geological Report on Couto Mineiro de Gois; SFM: Lisbon, Portugal, 1969; p. 16. [Google Scholar]
- Carvalho, A.D. Trabalhos de Pesquisa na Região Mineira de Góis; DGGM—SFM, Sector de Avaliação de Recursos Minerais: Lisbon, Portugal, 1986; p. 26. [Google Scholar]
- Parra, A.A.H.N. Reconhecimento Prévio dos Filões Mineralizados em Volframite da Mina da Senhora da Guia; DGGM—SFM: Lisbon, Portugal, 1987; p. 15. [Google Scholar]
- Nogueira Ramos, J. Góis, Tempo de Volfrâmio. Entre Memória e História; Movimento de Cidadãos por Góis: Góis, Portugal, 2009; pp. 161–194. [Google Scholar]
- Bengala, J.A.M. Região de Góis (243)—Relatório do Perfil Gravimétrico OB N-78gr-W; DGGM—SFM, Divisão de Geofísica: Lisbon, Portugal, 1985; p. 4. [Google Scholar]
- Fonseca, J.D.; Rodrigues, L.F. Prospecção Por Reflexão Sísmica na Zona da Mina do Vale do Pião (Góis); LNEC, Departamento de Geotecnia: Lisbon, Portugal, 1986; p. 5. [Google Scholar]
- Torres, L.M. Relatório Preliminar da Prospecção Sísmica Executada no Couto Mineiro de Góis em Colaboração com o Laboratório Nacional de Engenharia Civil (LNEC); DGGM—SFM, Divisão de Geofísica: Lisbon, Portugal, 1985; p. 9. [Google Scholar]
- Carvalho, A.D. Mina de ouro da Escádia Grande—Apontamento Monográfico de Pesquisa; DGGM–SFM, Sector de Avaliação de Recursos Minerais: Lisbon, Portugal, 1986; p. 26. [Google Scholar]
- O’Leary, D.W.; Freidman, J.D.; Pohn, H.A. Lineament, linear, lineation: Some proposed new definitions for old terms. Geol. Soc. Am. Bull. 1976, 87, 1463–1469. [Google Scholar] [CrossRef]
- Rabaça, T.J.L.; Conde, L.N.; Pinto, A.F.F.; Pereira, A.J.S.C. Avaliação das potencialidades técnicas de detecção remota como suporte à cartografia geológica na região central de Portugal. e-Terra 2004, 2, 14. [Google Scholar]
- USGS/NASA. Landsat 8 (L8) Data User’s Handbook; USGS/NASA: Sioux Falls, SD, USA, 2015; p. 106.
- Batista, M.J.; Torres, L.; Leote, J.; Prazeres, C.; Saraiva, J.; Carvalho, J. Carta Radiométrica de Portugal (1:500,000); LNEG: Alfragide, Portugal, 2013.
- Andrade, R.S.N. Fotointerpretação Geológica da Região de Góis; DGGM–SFM: Lisbon, Portugal, 1985; p. 8. [Google Scholar]
- Andrade, R.S.N. Programa 2.1—Prospecção de Minérios Metálicos e Radioactivos. Projecto 2.1.3—Prospecção de Metais Nobres: Ouro e Prata. Relatório de Actividade Referente ao 2° Semestre de 1990; SFM: Lisbon, Portugal, 1990. [Google Scholar]
- Borralho, V.; Parra, A. Projecto 2.4.1. Reconhecimento e Avaliação de Recursos Minerais (Região de Góis). Plano de Actividades Para 1988; DGGM–SFM: Lisbon, Portugal, 1988; p. 36. [Google Scholar]
- Parra, A.A.H.N. Jazida Estano-Volframítica de Vale Pião. Aspectos Geológicos e Cálculo Preliminar de Reservas; DGGM–SFM: Lisbon, Portugal, 1988; p. 53. [Google Scholar]
- Parra, A.A.H.N. Resultados da aplicação do método mineralométrico com base em solos superficiais em rede detalhada à descoberta de jazidas primárias de cassiterite, volframite (scheelite) e ouro na região de Góis. Estudos, Notas e Trabalhos 1993, 35, 21–33. [Google Scholar]
- Lillesand, T.M.; Kiefer, R.W.; Chipman, J.W. Remote Sensing and Image Interpretation, 6th ed.; John Willey & Sons: Hoboken, NJ, USA, 2008; p. 756. [Google Scholar]
- Chavez, P.S.; Berlin, G.L.; Sowers, L.B. Statistical method for selecting Landsat MSS ratios. J. Appl. Photogr. 1982, 8, 23–30. [Google Scholar]
- Van der Meer, F.D.; van der Werff, H.M.A.; van Ruitenbeek, F.J.A.; Hecker, C.A.; Bakker, W.H.; Noomen, M.F.; van der Meijde, M.; Carranza, E.J.M.J.; de Smeth, B.; Woldai, T. Multi- and hyperspectral geologic remote sensing: A review. Int. J. Appl. Earth Obs. Geoinf. 2012, 14, 112–128. [Google Scholar] [CrossRef]
- Drury, S.A. Image Interpretation in Geology, 2nd ed.; Chapman & Hall: London, UK, 1993; p. 283. [Google Scholar]
- Schowengerdt, R.A. Remote Sensing: Models and Methods for Image Processing, 3rd ed.; Academic Press: Orlando, FL, USA, 2007; p. 515. [Google Scholar]
- Scanvic, J.Y. Aerospatial Remote Sensing in Geology; Balkema, A.A., Ed.; CRC Press: Boca Raton, FL, USA, 1997; p. 239. [Google Scholar]
- Cengiz, O.; Sener, E.; Yagmurlu, F. A satellite image approach to the study of lineaments, circular structures and regional geology in the Golcuk Crater district and its environs (Isparta, SW Turkey). J. Asian Earth Sci. 2006, 27, 155–163. [Google Scholar] [CrossRef]
- Richards, J.A.; Jia, X. Remote Sensing Digital Image Analysis, 4th ed.; Springer: Berlin, Germany, 2006; p. 454. [Google Scholar]
- Andrade, R.S.N. Interpretação Fotogeológica da Região Centro de Portugal. Estudos, Notas e Trabalhos do SFM 1983, 25, 227–245. [Google Scholar]
- Dentith, M.; Mudge, S.T. Geophysics for the Mineral Exploration Geoscientist; Cambridge University Press: Cambridge, UK, 2014; p. 438. [Google Scholar]
- Soares, A.F.; Marques, J.F.; Sequeira, A.J.D. Explanatory Booklet of the Sheet 19-D (Coimbra-Lousã), Geological Map of Portugal at 1:50,000 Scale; INETI: Lisbon, Portugual, 2007; p. 71. [Google Scholar]
Figure 1.
(a) Potential areas for precious and base metals in Portugal [6,7]); (b) areas without 1:50,000 geological mapping [7]).
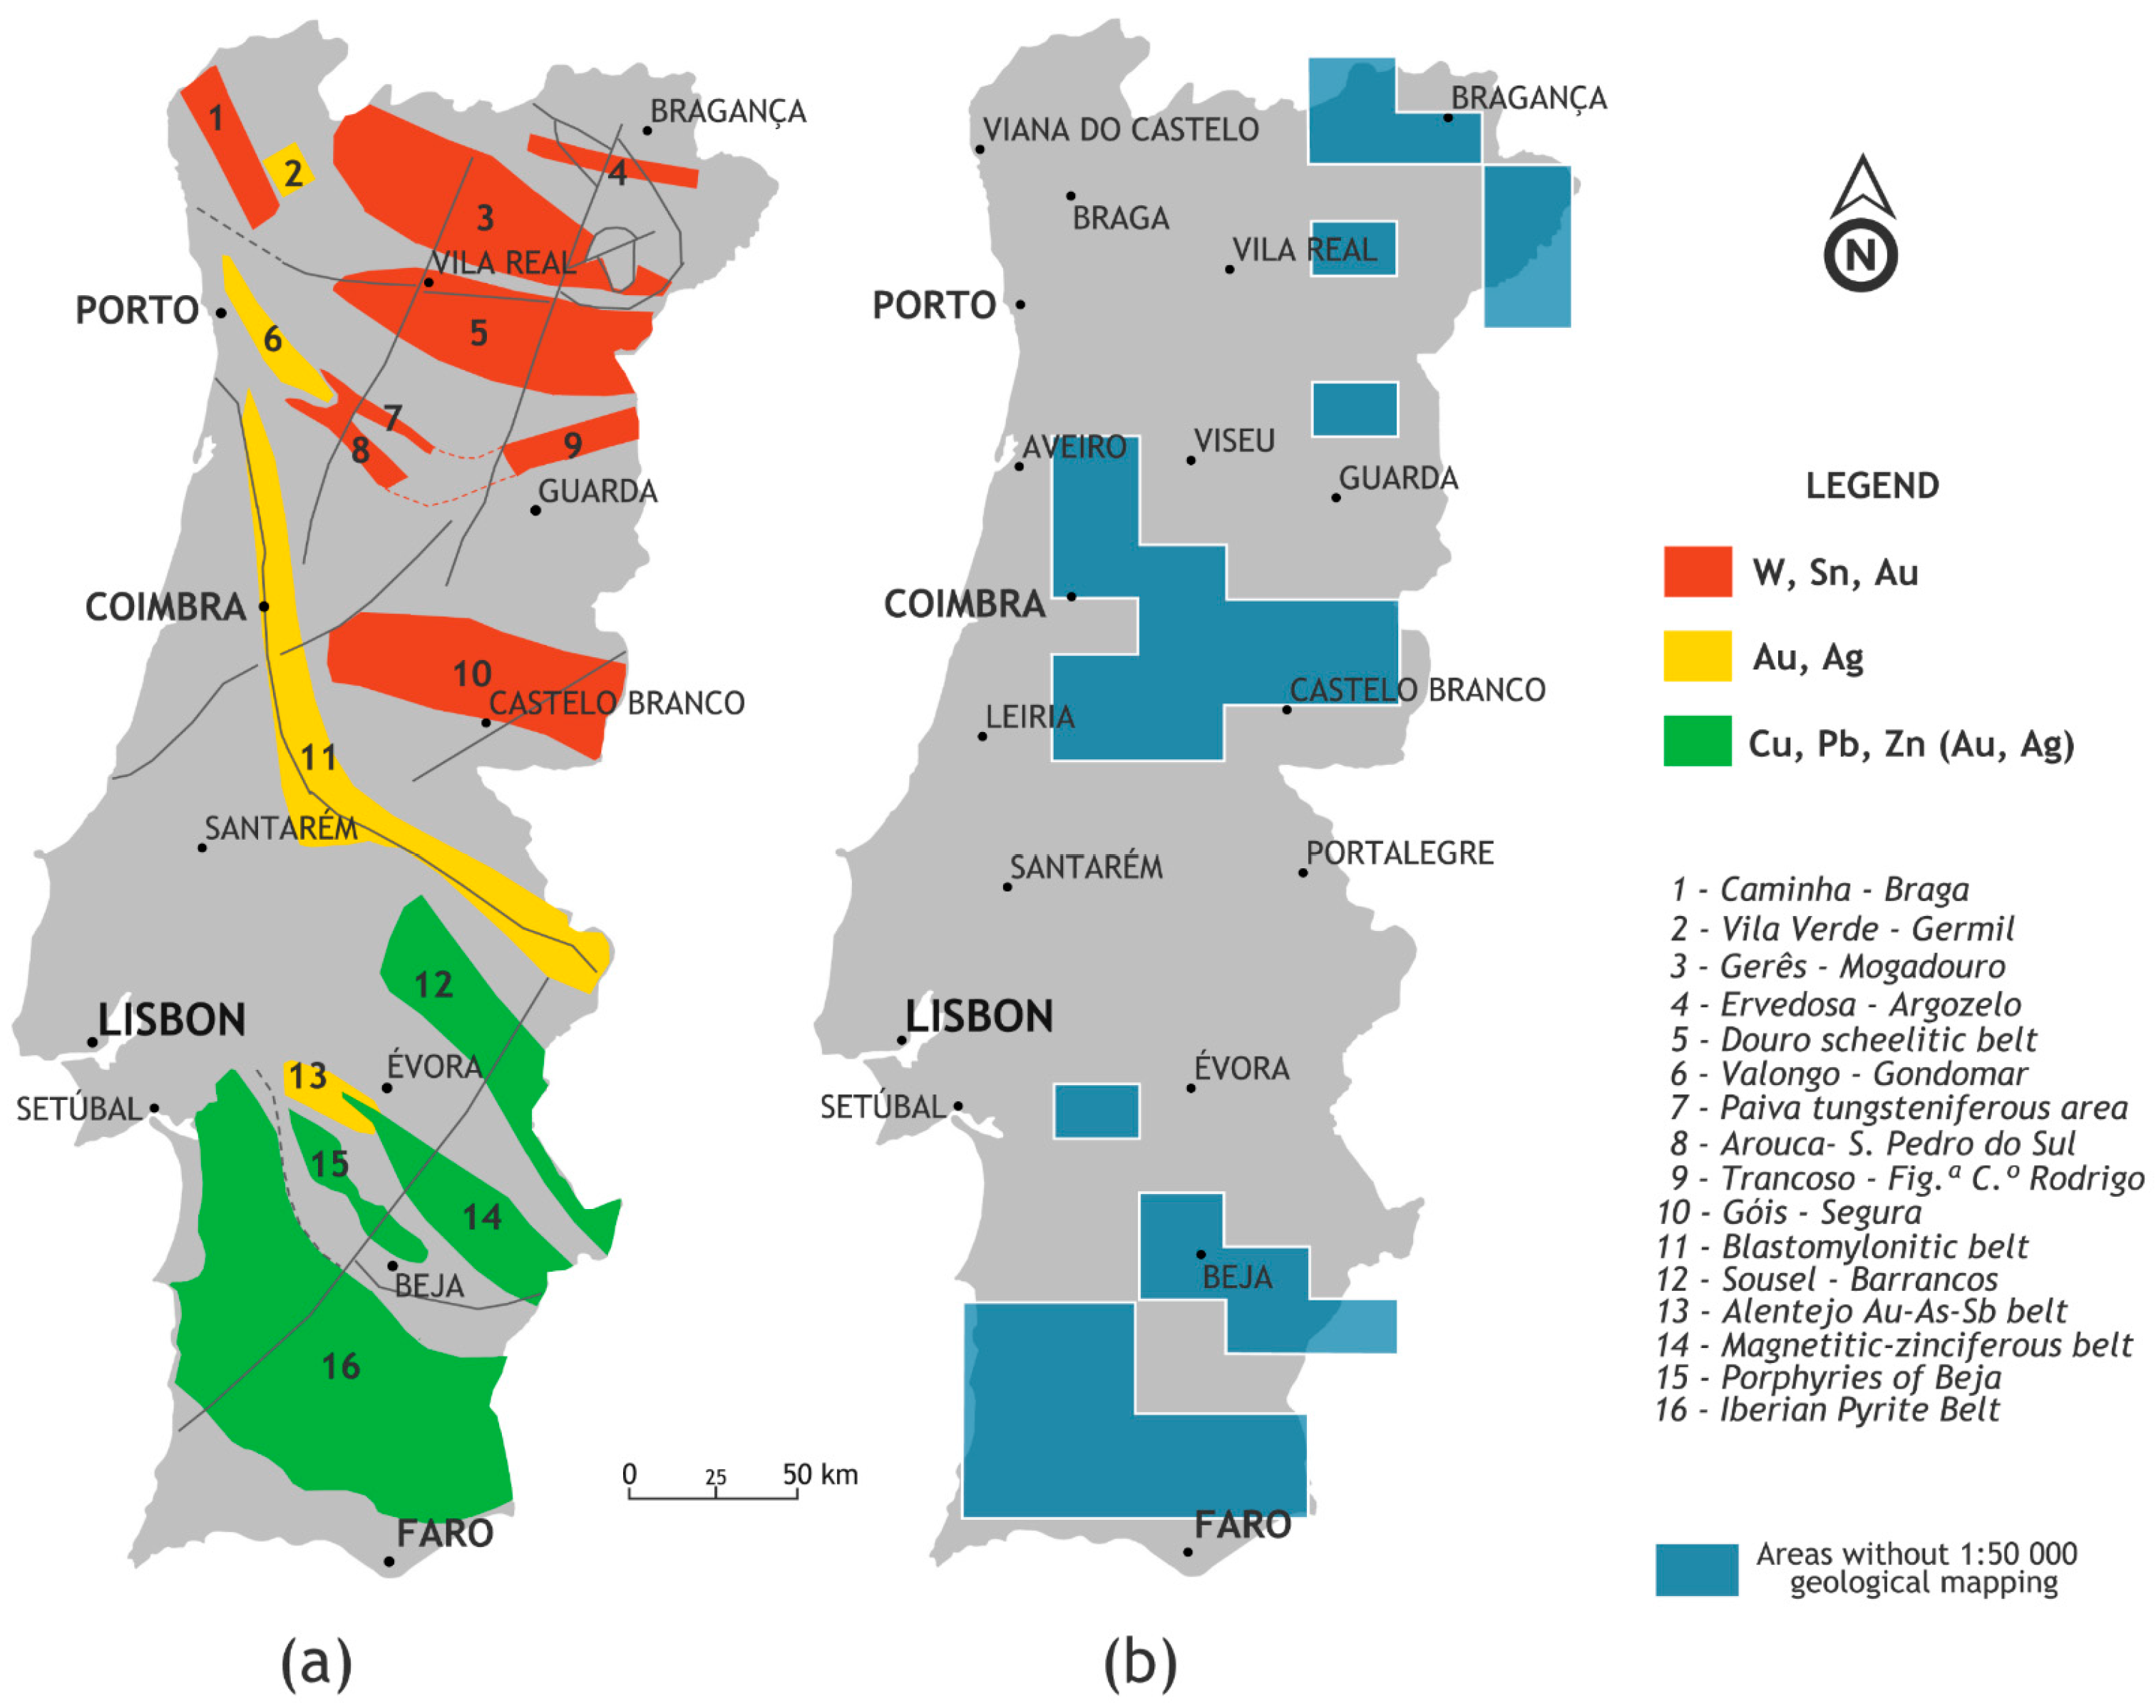
Figure 2.
Location of the study area (including the mineral exploration area of Escádia Grande), simplified lithostratigraphic column and geological map (after [17,18,19,20]). The major tectonic structures of the region are numbered.
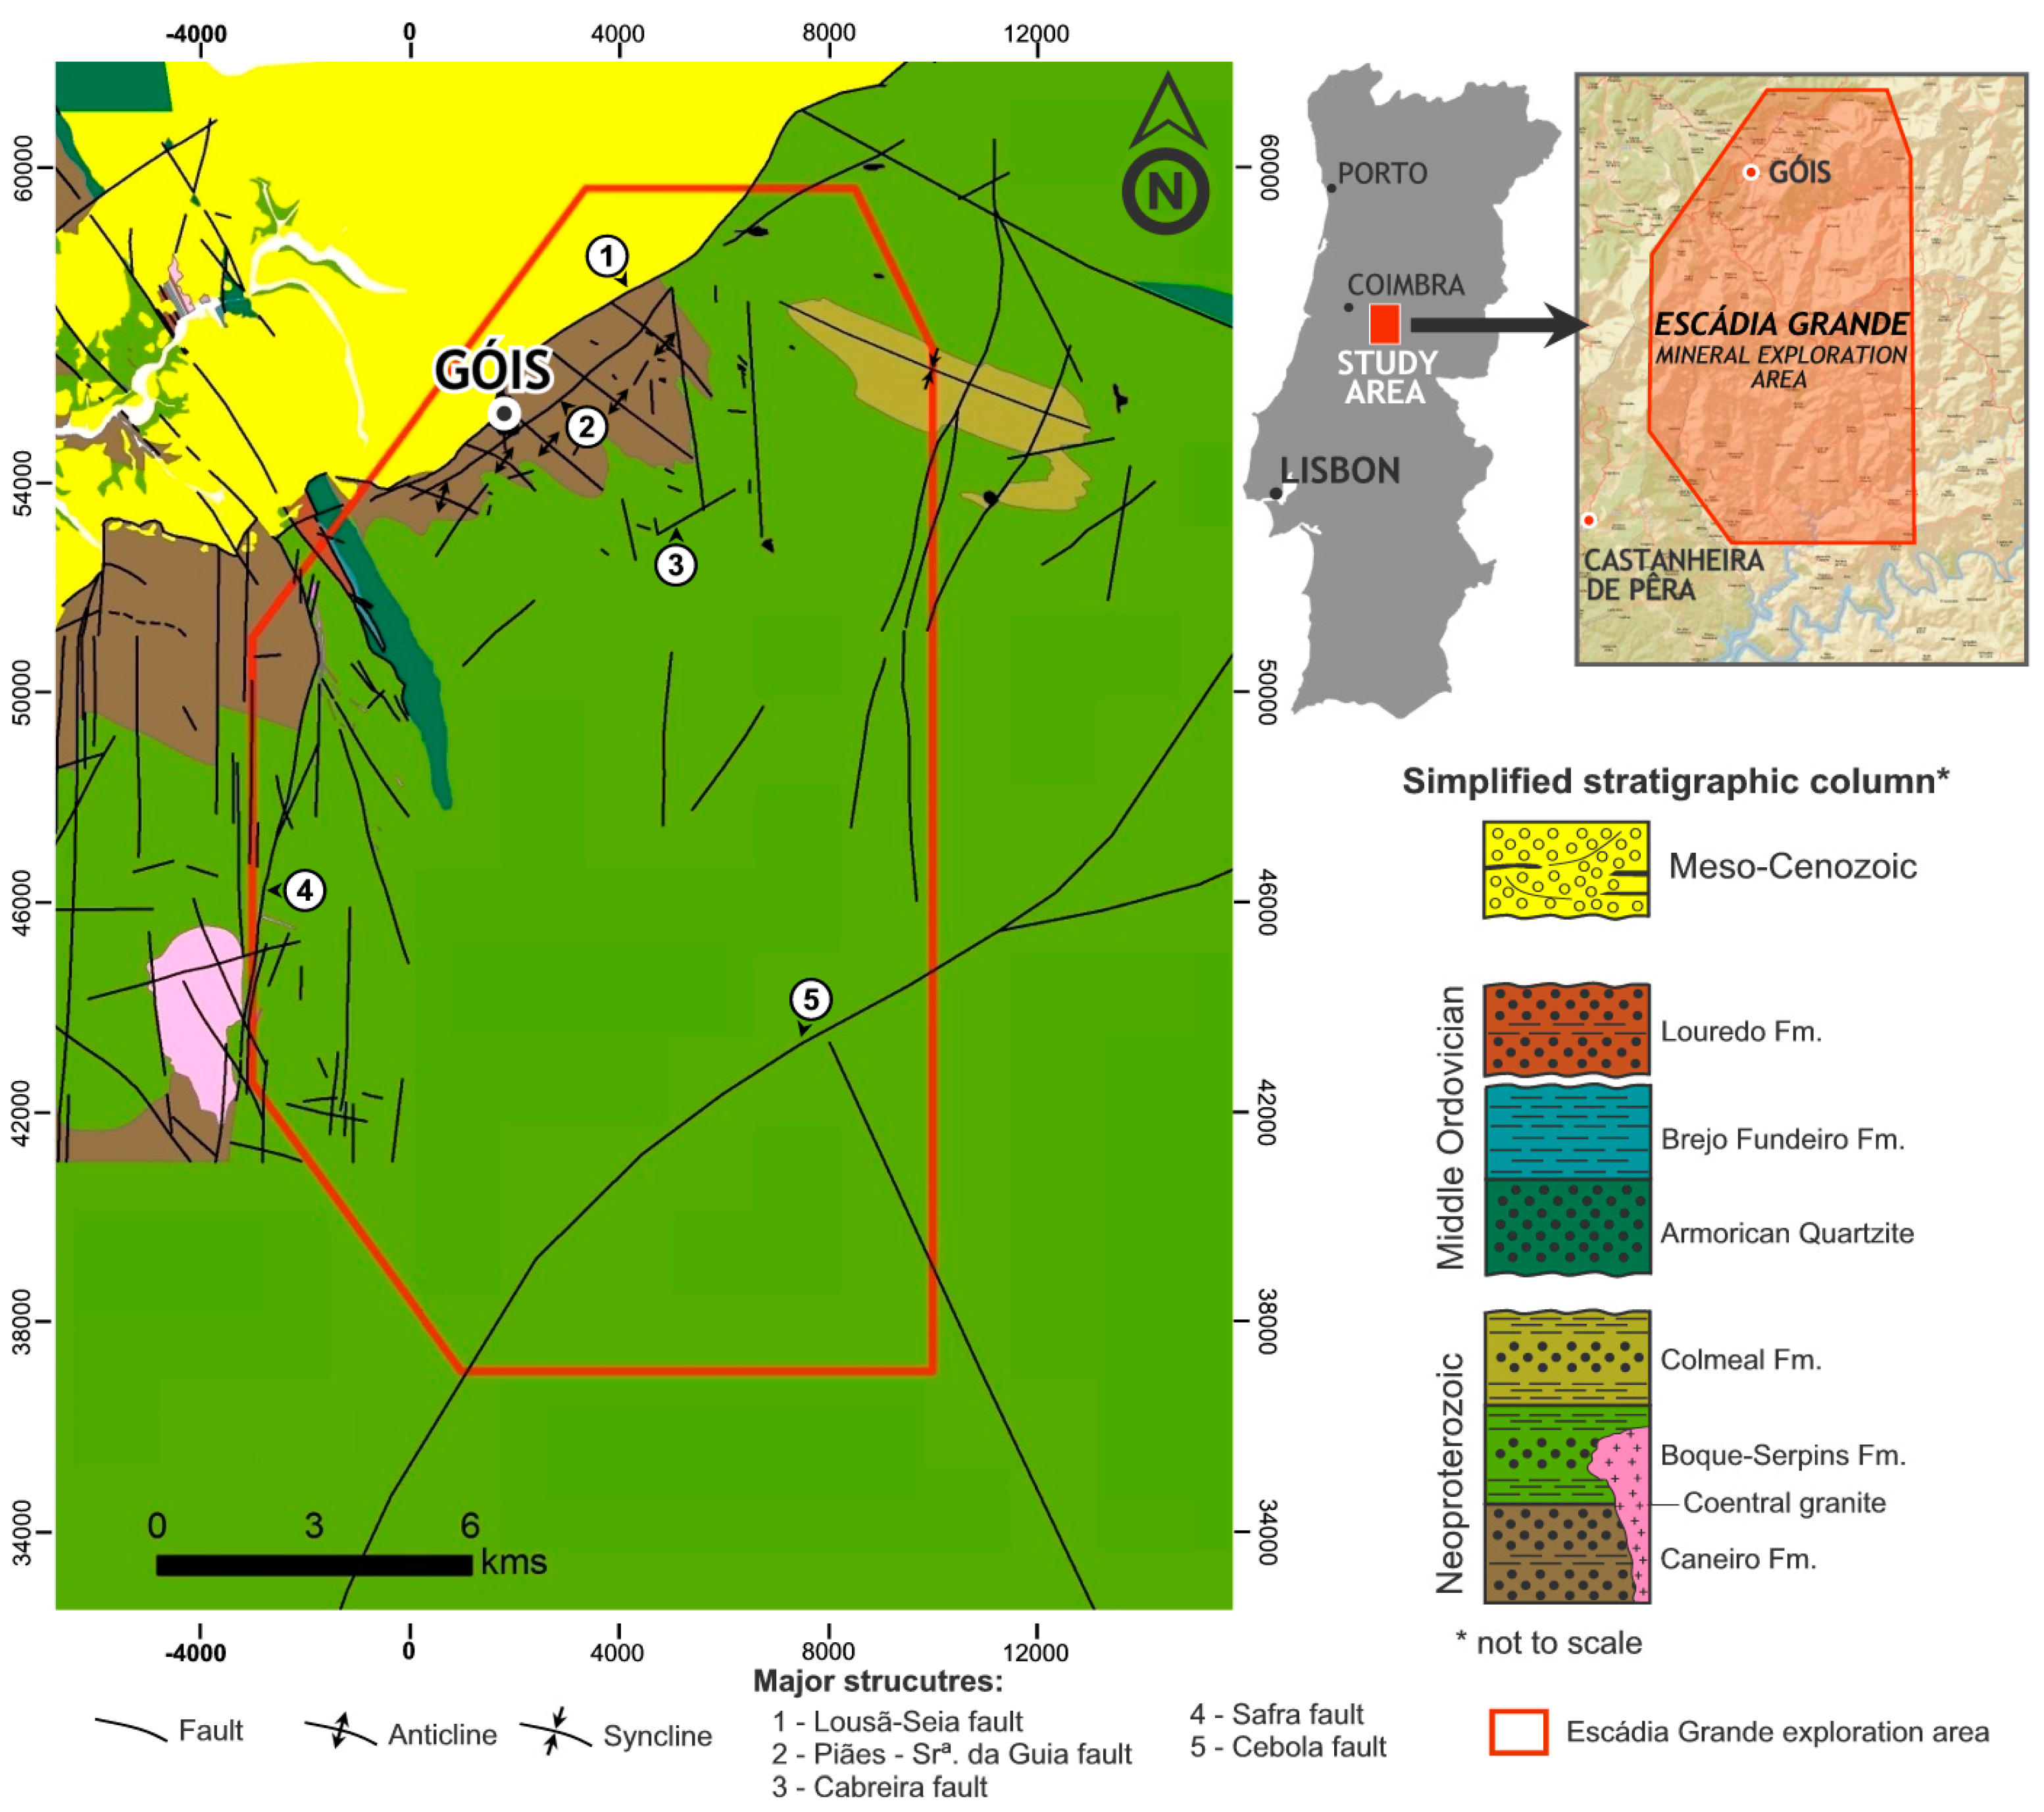
Figure 3.
Mineral occurrences and metallogenic belts within the Escádia Grande exploration area (locations of the mineral occurrences and metallogenic belts E.D.M., S.A. and SIORMINP [34]).
Figure 3.
Mineral occurrences and metallogenic belts within the Escádia Grande exploration area (locations of the mineral occurrences and metallogenic belts E.D.M., S.A. and SIORMINP [34]).

Figure 4.
Directional spatial filters applied to Landsat 8 imagery (after [60]).
Figure 4.
Directional spatial filters applied to Landsat 8 imagery (after [60]).
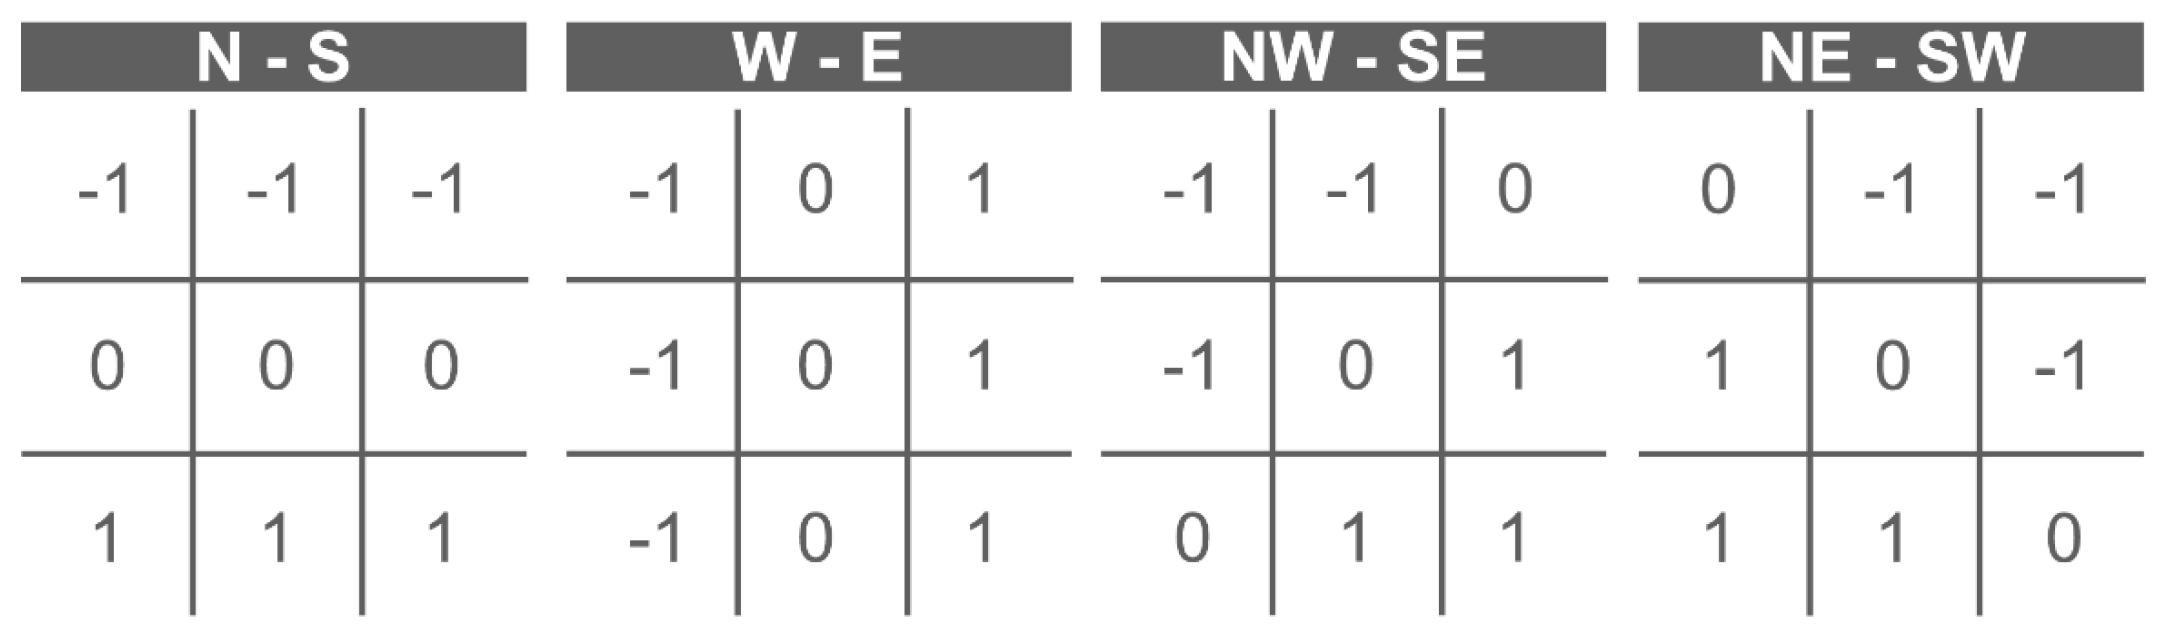
Figure 5.
RGB colour composites used for geological interpretation: (a) 6-5-10; (b) 5-7-11; (c) 5-8-10 and (d) 7-5-2.
Figure 5.
RGB colour composites used for geological interpretation: (a) 6-5-10; (b) 5-7-11; (c) 5-8-10 and (d) 7-5-2.

Figure 6.
True colour RGB composite (4-3-2) of the selected Landsat 8 scene.

Figure 7.
RGB colour composites using the first four Principal Components: (a) PC1-PC2-PC3; (b) PC4-PC1-PC3 and (c) PC4-PC2-PC3.
Figure 7.
RGB colour composites using the first four Principal Components: (a) PC1-PC2-PC3; (b) PC4-PC1-PC3 and (c) PC4-PC2-PC3.
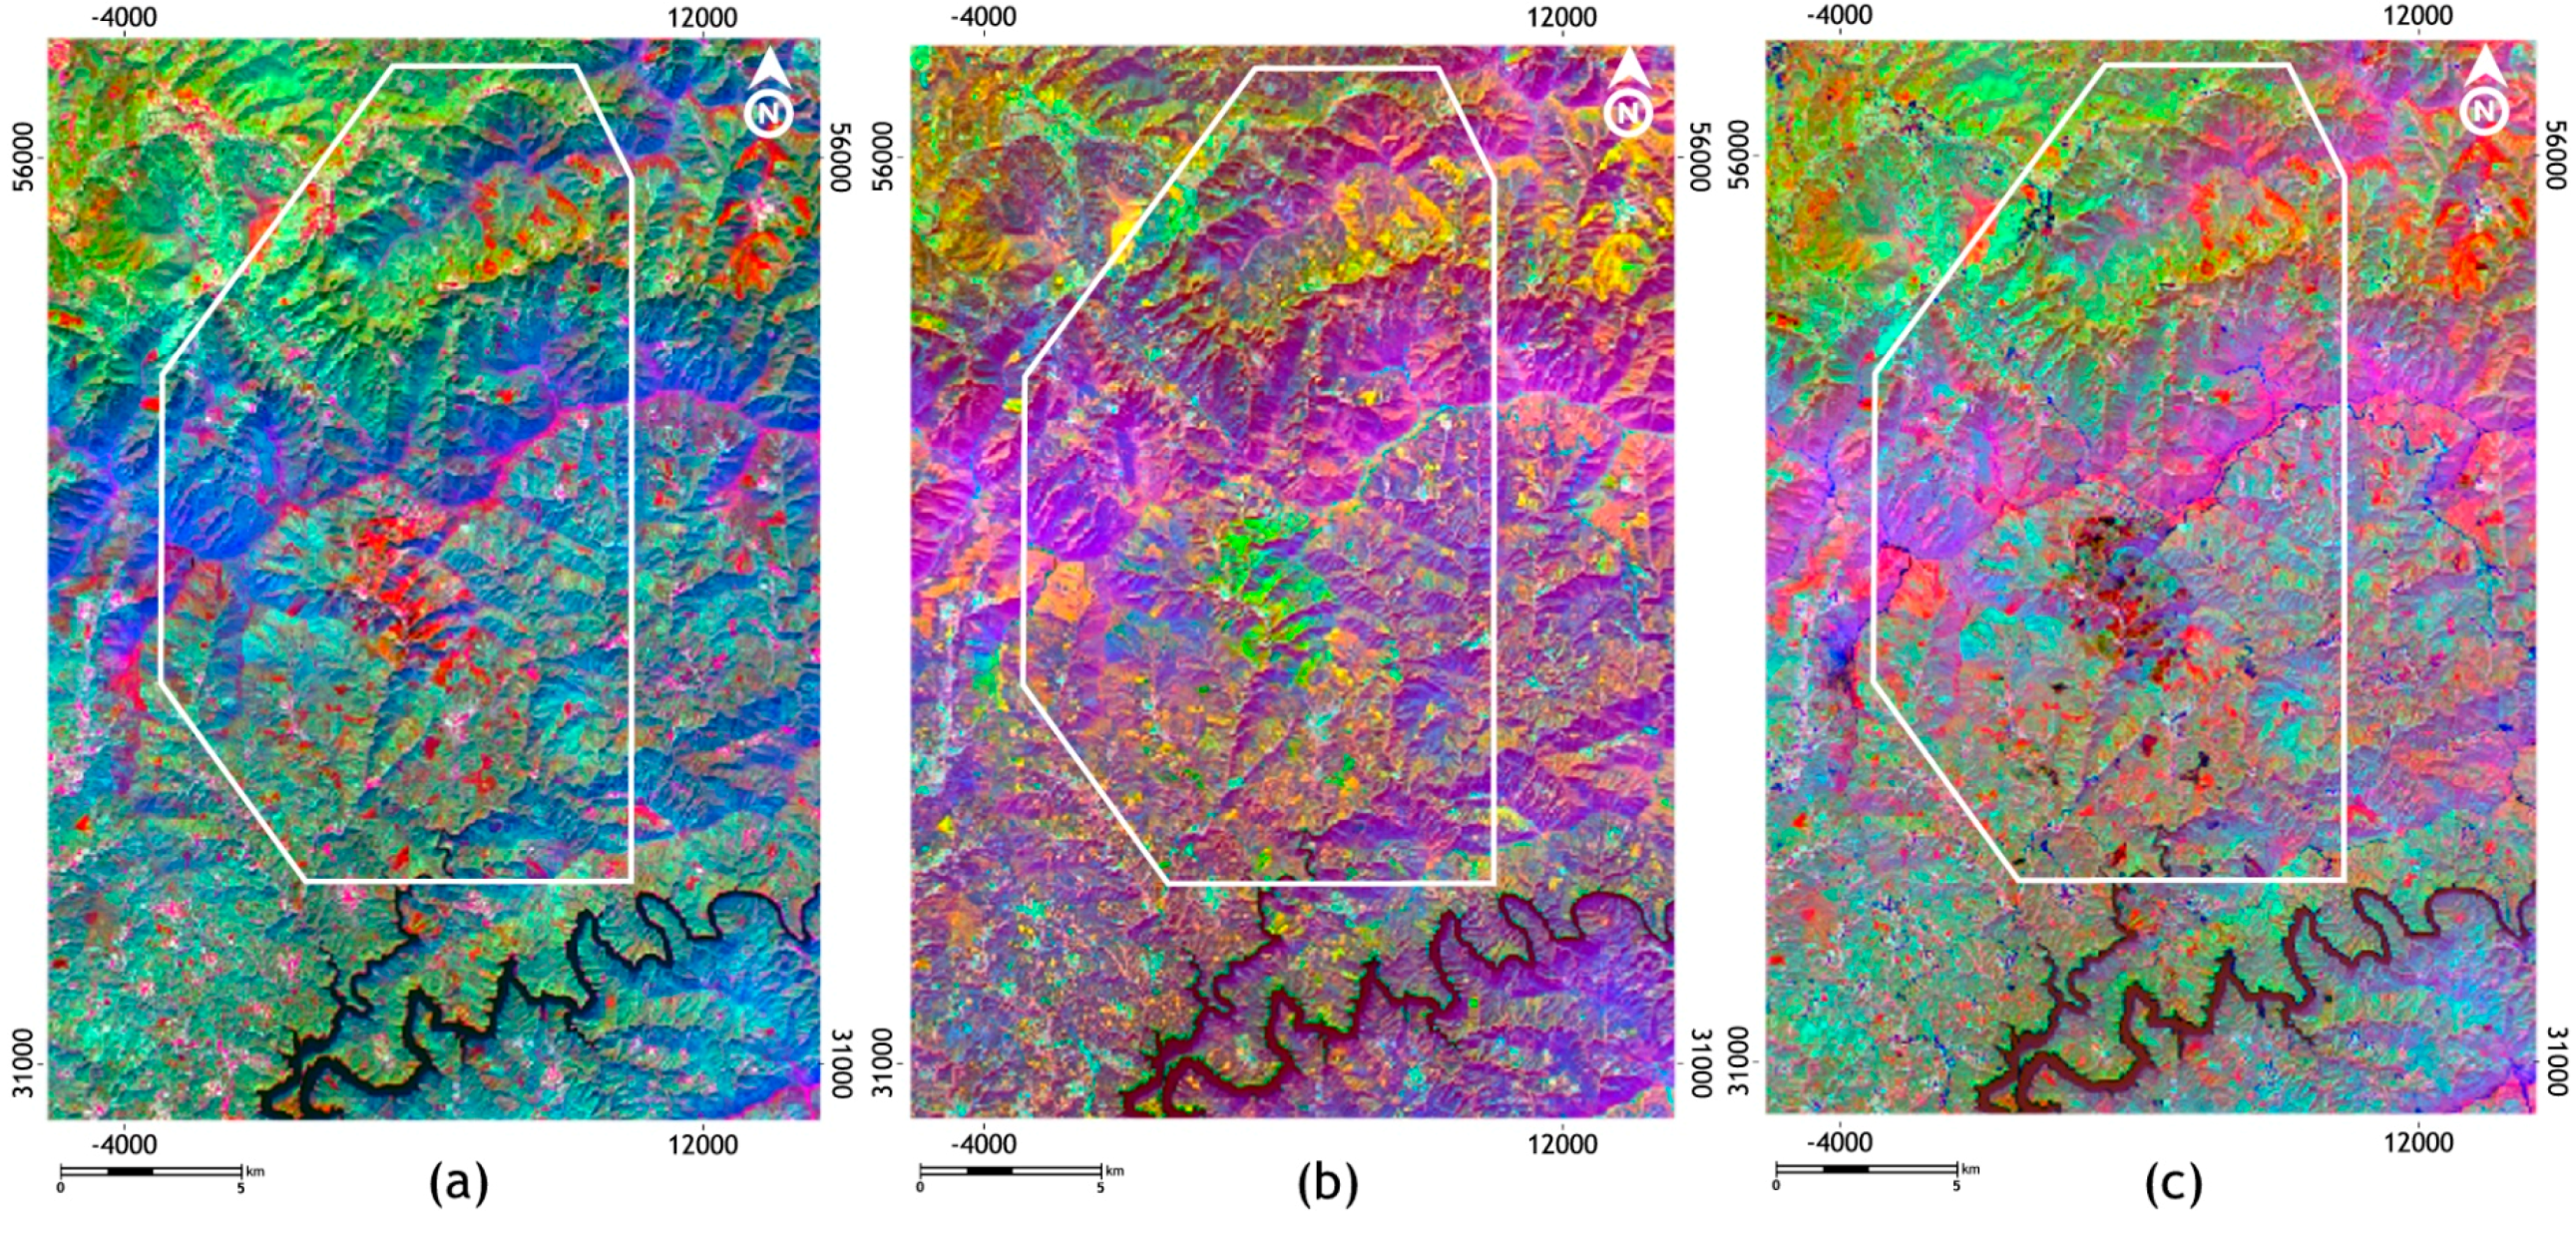
Figure 8.
Supervised classification (maximum likelihood) using Landsat 8/OLI bands B2–B8, 8 classes (see text for discussion).
Figure 8.
Supervised classification (maximum likelihood) using Landsat 8/OLI bands B2–B8, 8 classes (see text for discussion).
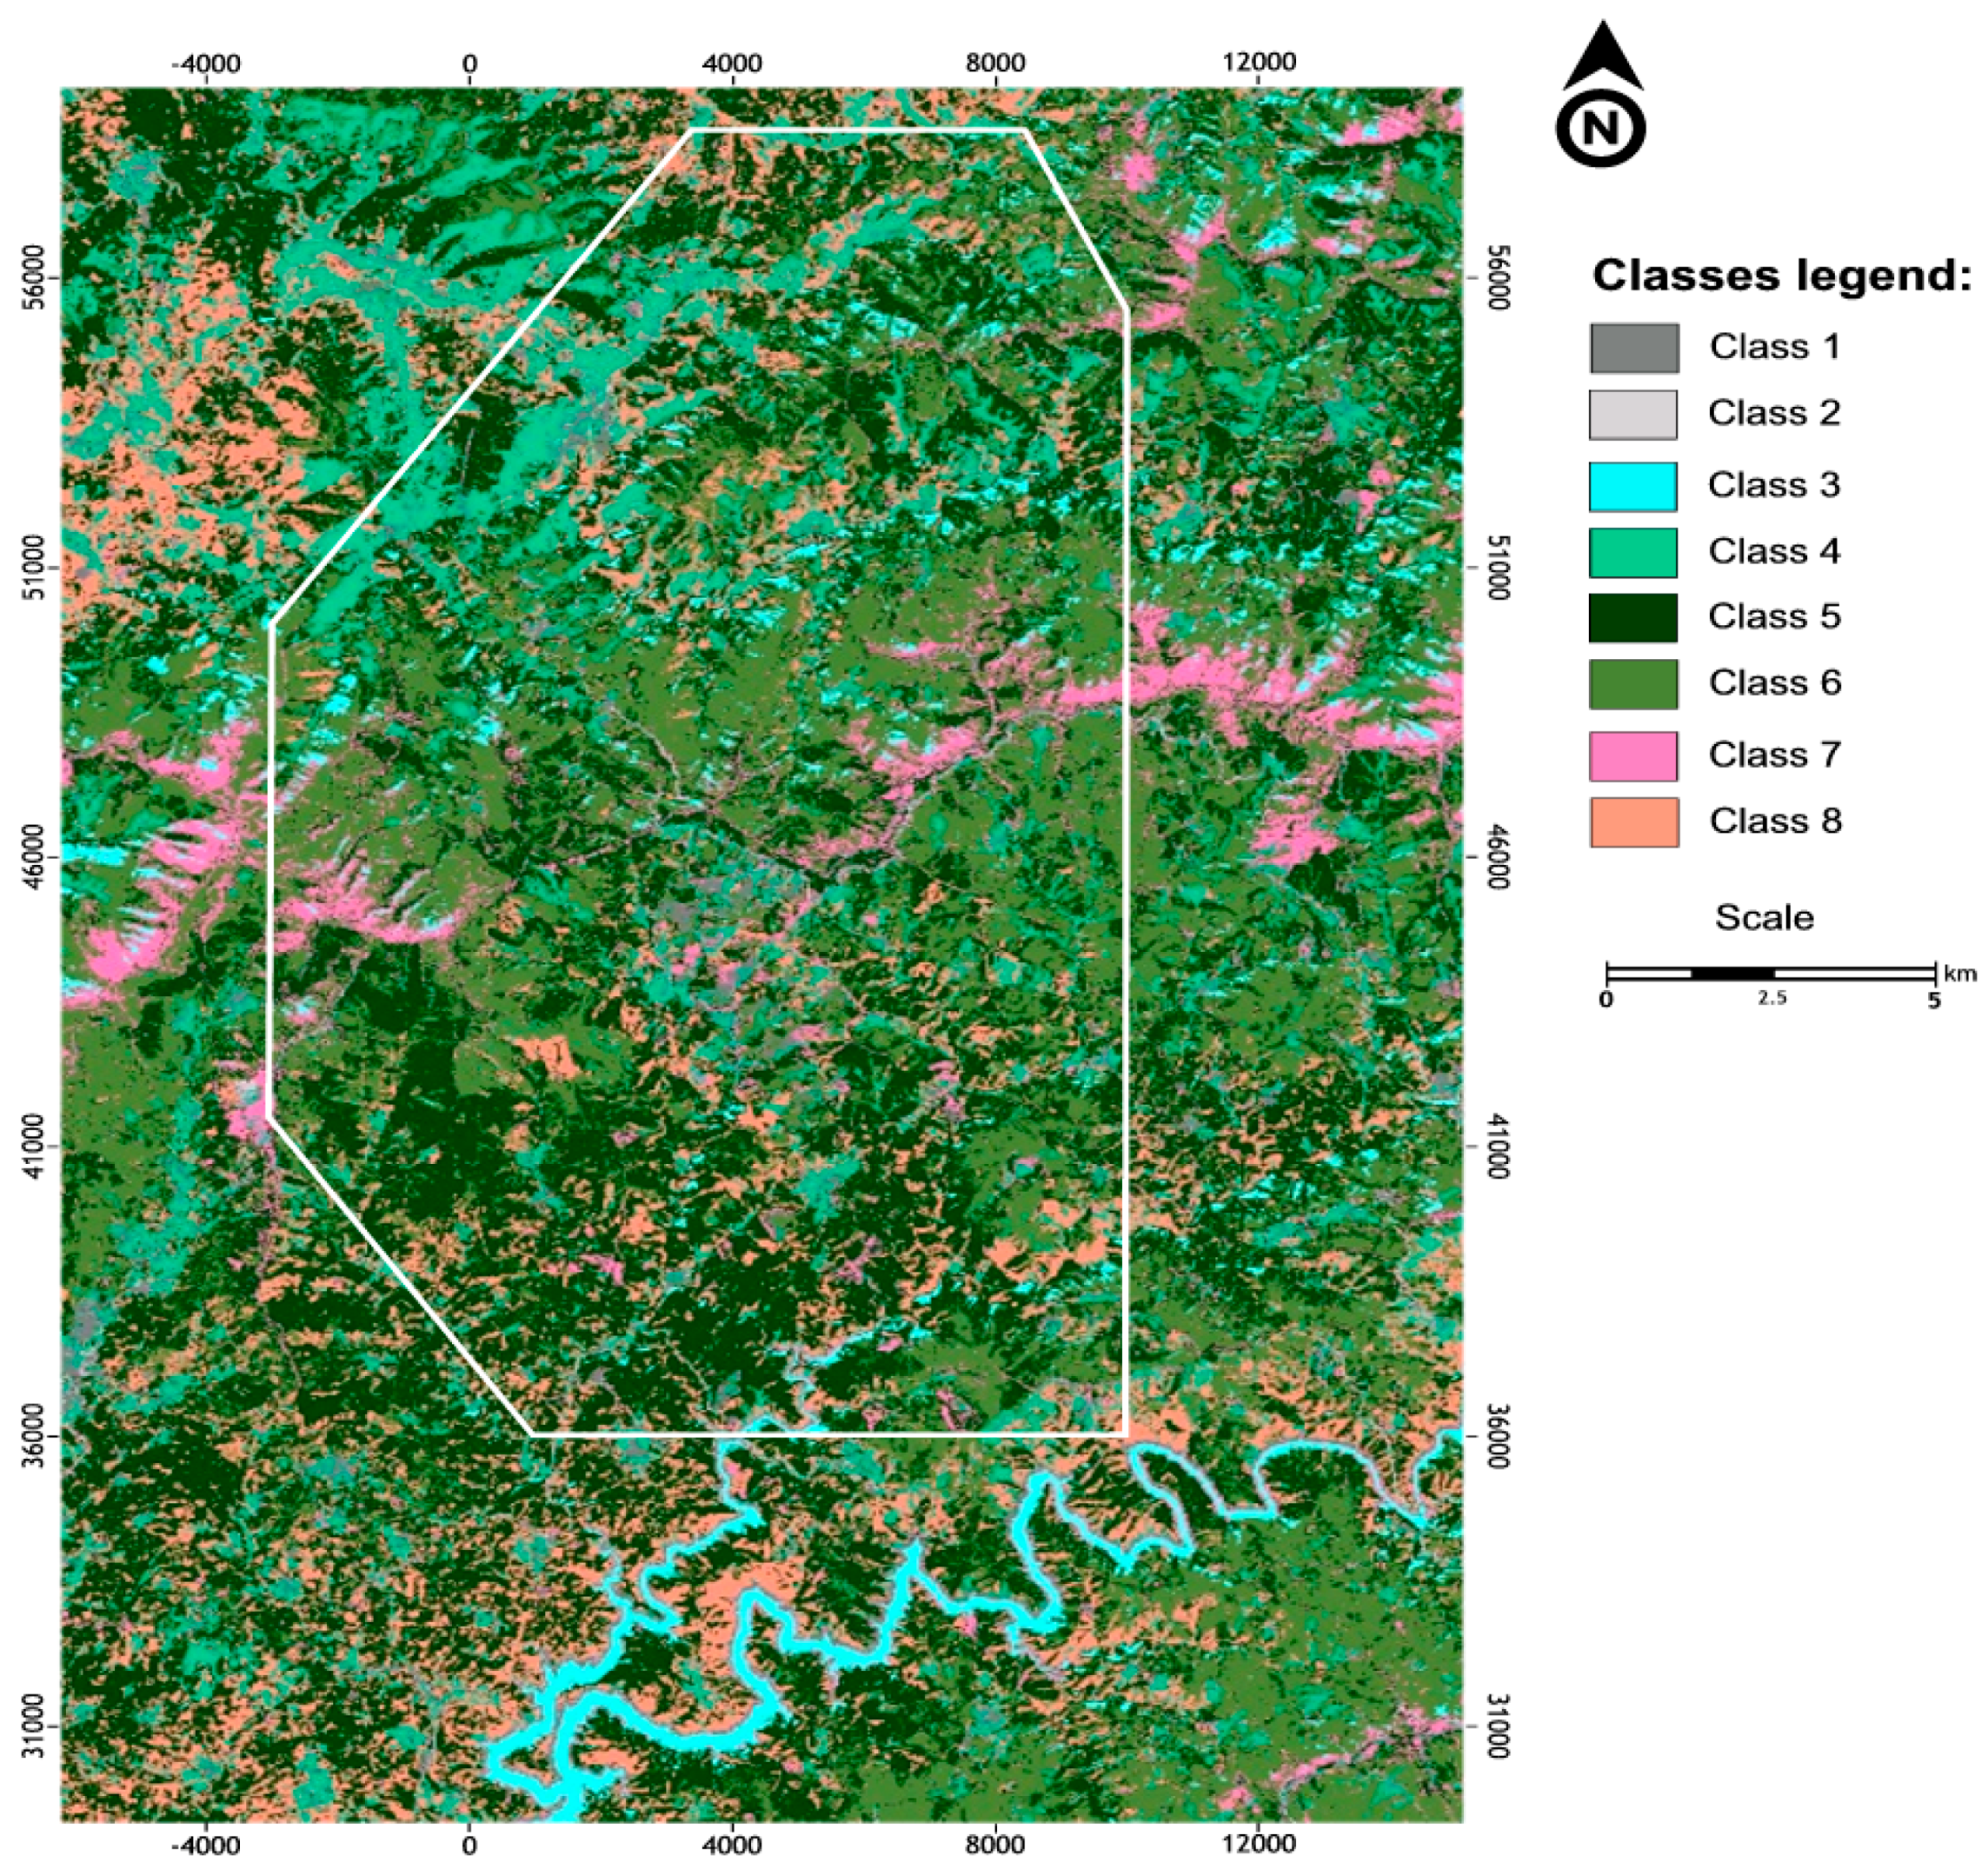
Figure 9.
Hill shade relief maps. Artificial illumination: (a) N–S; (b) NE–SW; (c) E–W and (d) SE–NW. Original elevation data from the Portuguese Military Cartography at 1:25,000 scale.
Figure 9.
Hill shade relief maps. Artificial illumination: (a) N–S; (b) NE–SW; (c) E–W and (d) SE–NW. Original elevation data from the Portuguese Military Cartography at 1:25,000 scale.

Figure 10.
Preliminary lineament mapping based on: (a) Landsat 8 (RGB colour composites); (b) Landsat 8 (directional filters—OLI band 6); (c) Landsat 8 (directional filters—band ratios) and (d) Hill shade relief maps.
Figure 10.
Preliminary lineament mapping based on: (a) Landsat 8 (RGB colour composites); (b) Landsat 8 (directional filters—OLI band 6); (c) Landsat 8 (directional filters—band ratios) and (d) Hill shade relief maps.
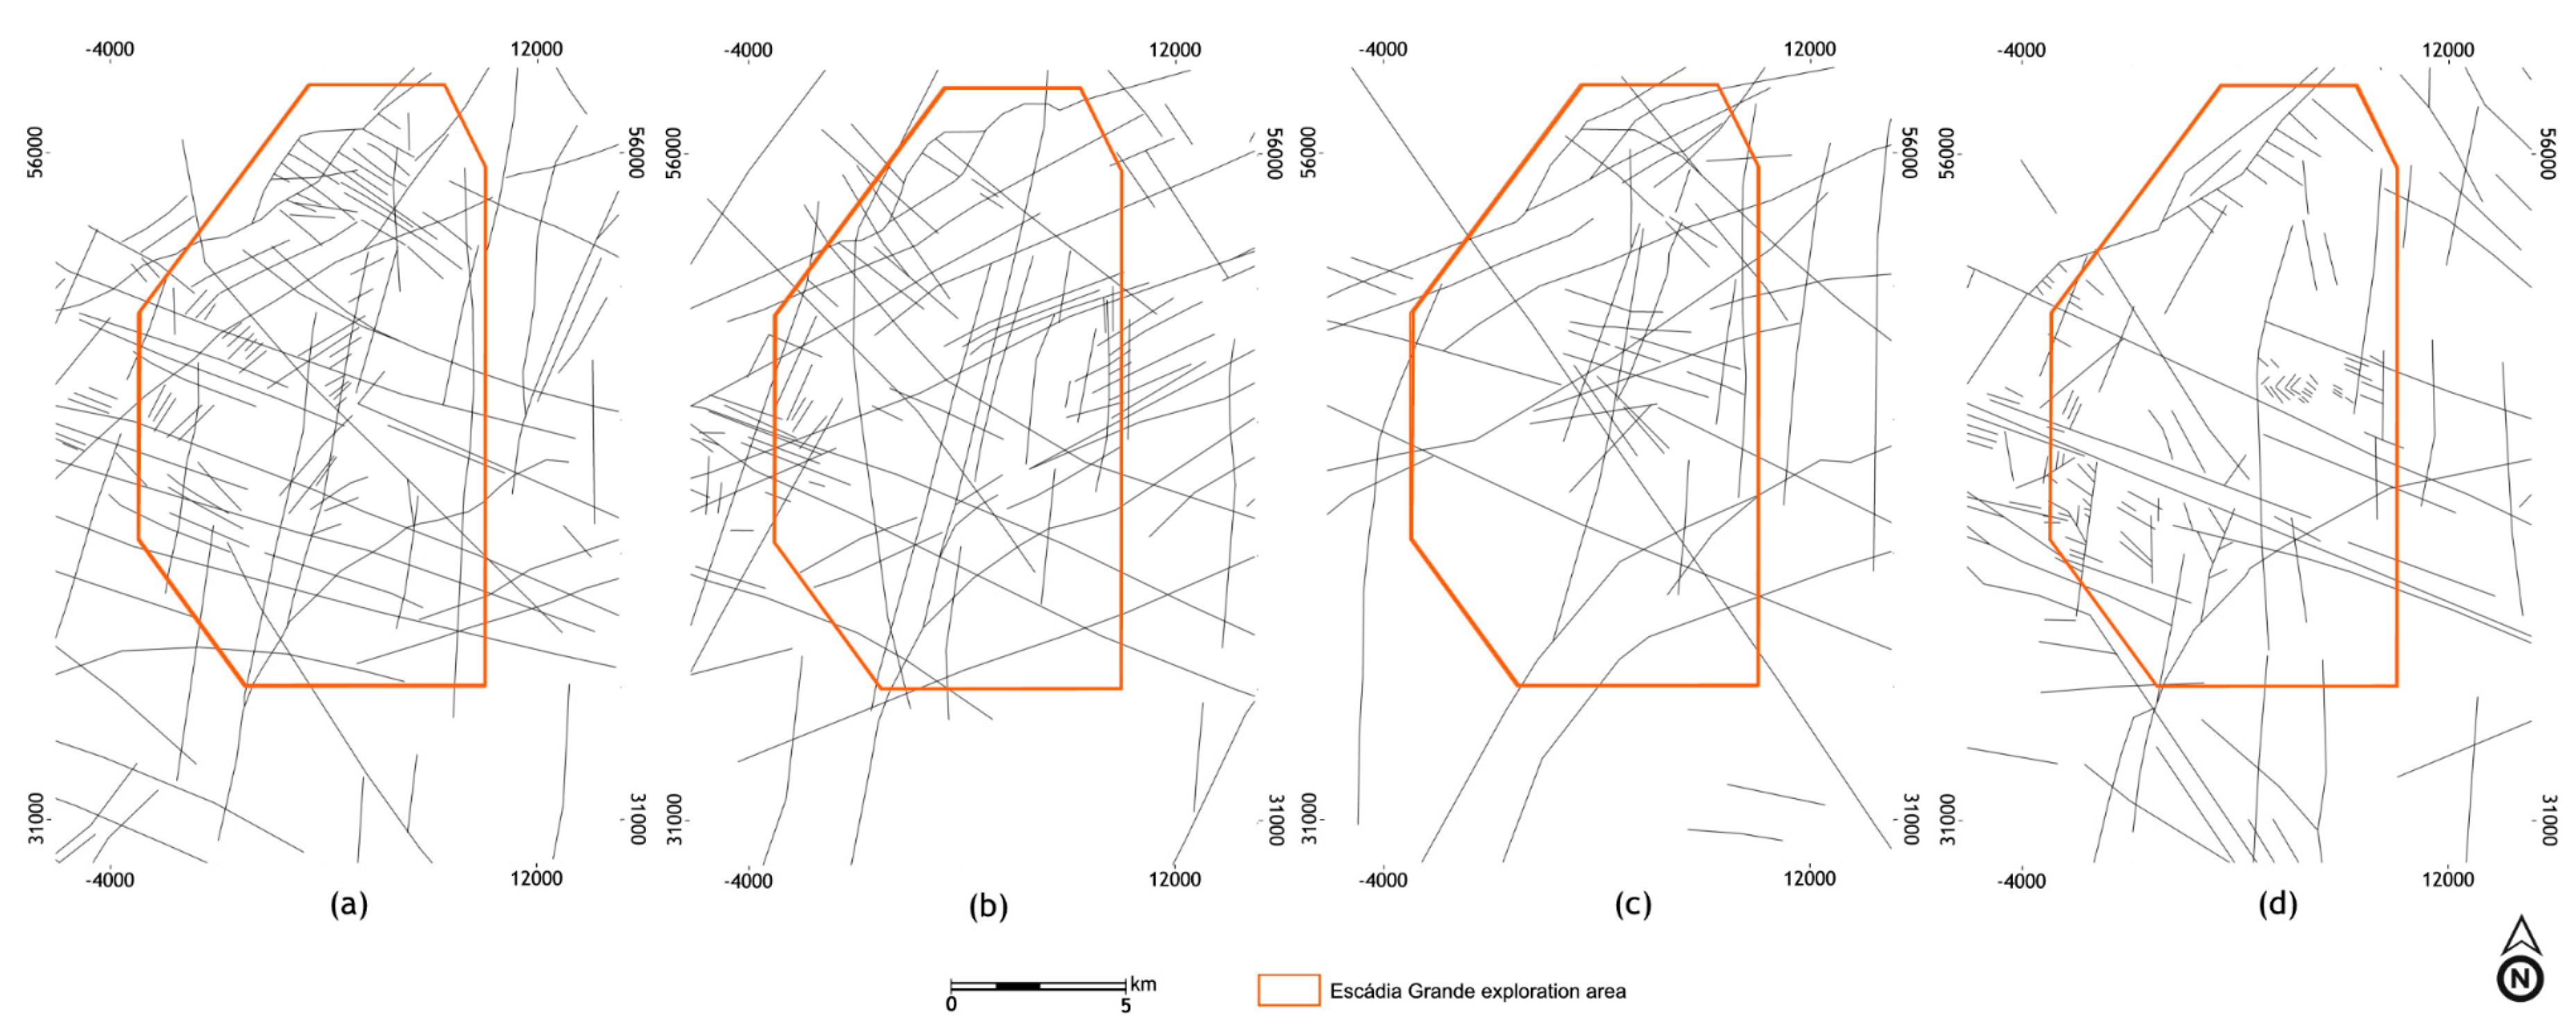
Figure 11.
Examples of geological structures or general trends identified in the field that were mapped as lineaments in the preliminary interpretations: (a) rectilinear N 60° E valley seen from Nossa Senhora da Guia; (b) N 60° W near-vertical fault, west of Cadafaz; (c) highly fractured zone related to a N 40° E trending fault near Cabeçadas; (d) structures found near Cabeçadas: A—N 25° W trending fault core, B—N 60–70° W trending shear zone, C—N–S trending shear zone; (e) N 10° E trending fault, oblique to the Cebola fault; (f) N–S rectilinear valley in Vale Pião.
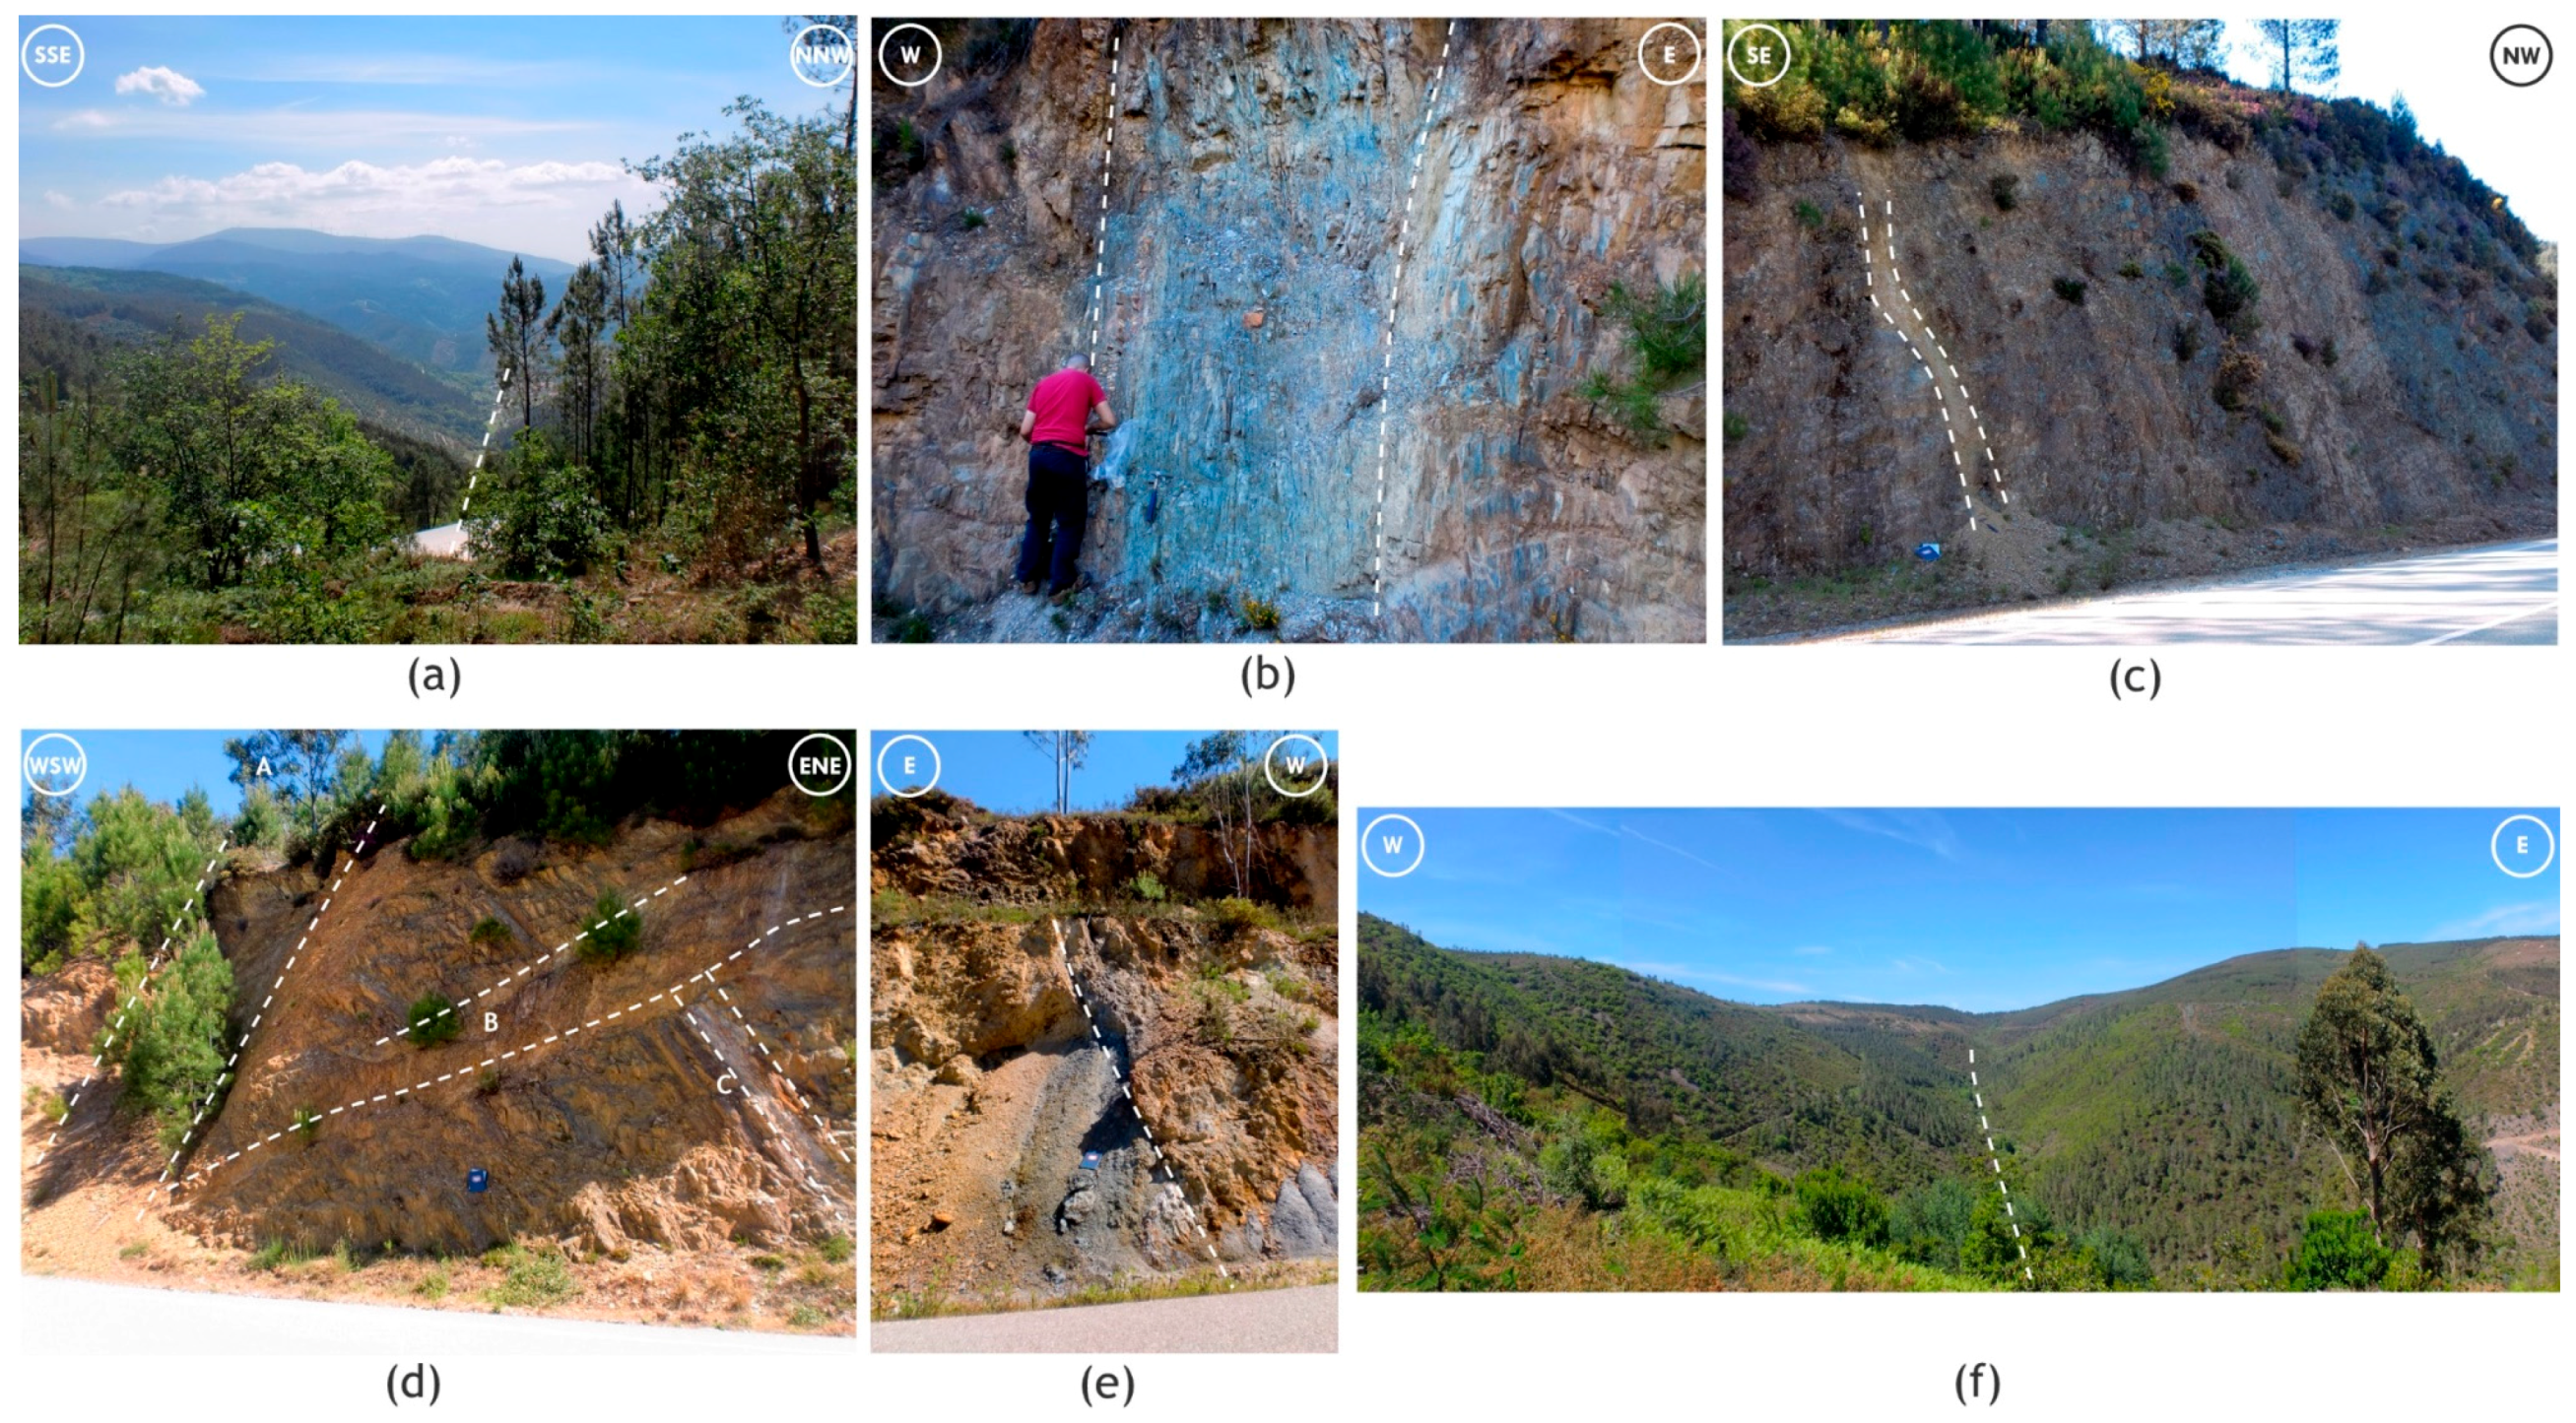
Figure 12.
Lineament reinterpretation based on: (a) Landsat 8 (RGB colour composites); (b) Landsat 8 (directional filters—OLI band 6); (c) Landsat 8 (directional filters—band ratios) and (d) hill shade relief maps. (1) Regional lineaments. (2) Local lineaments.
Figure 12.
Lineament reinterpretation based on: (a) Landsat 8 (RGB colour composites); (b) Landsat 8 (directional filters—OLI band 6); (c) Landsat 8 (directional filters—band ratios) and (d) hill shade relief maps. (1) Regional lineaments. (2) Local lineaments.
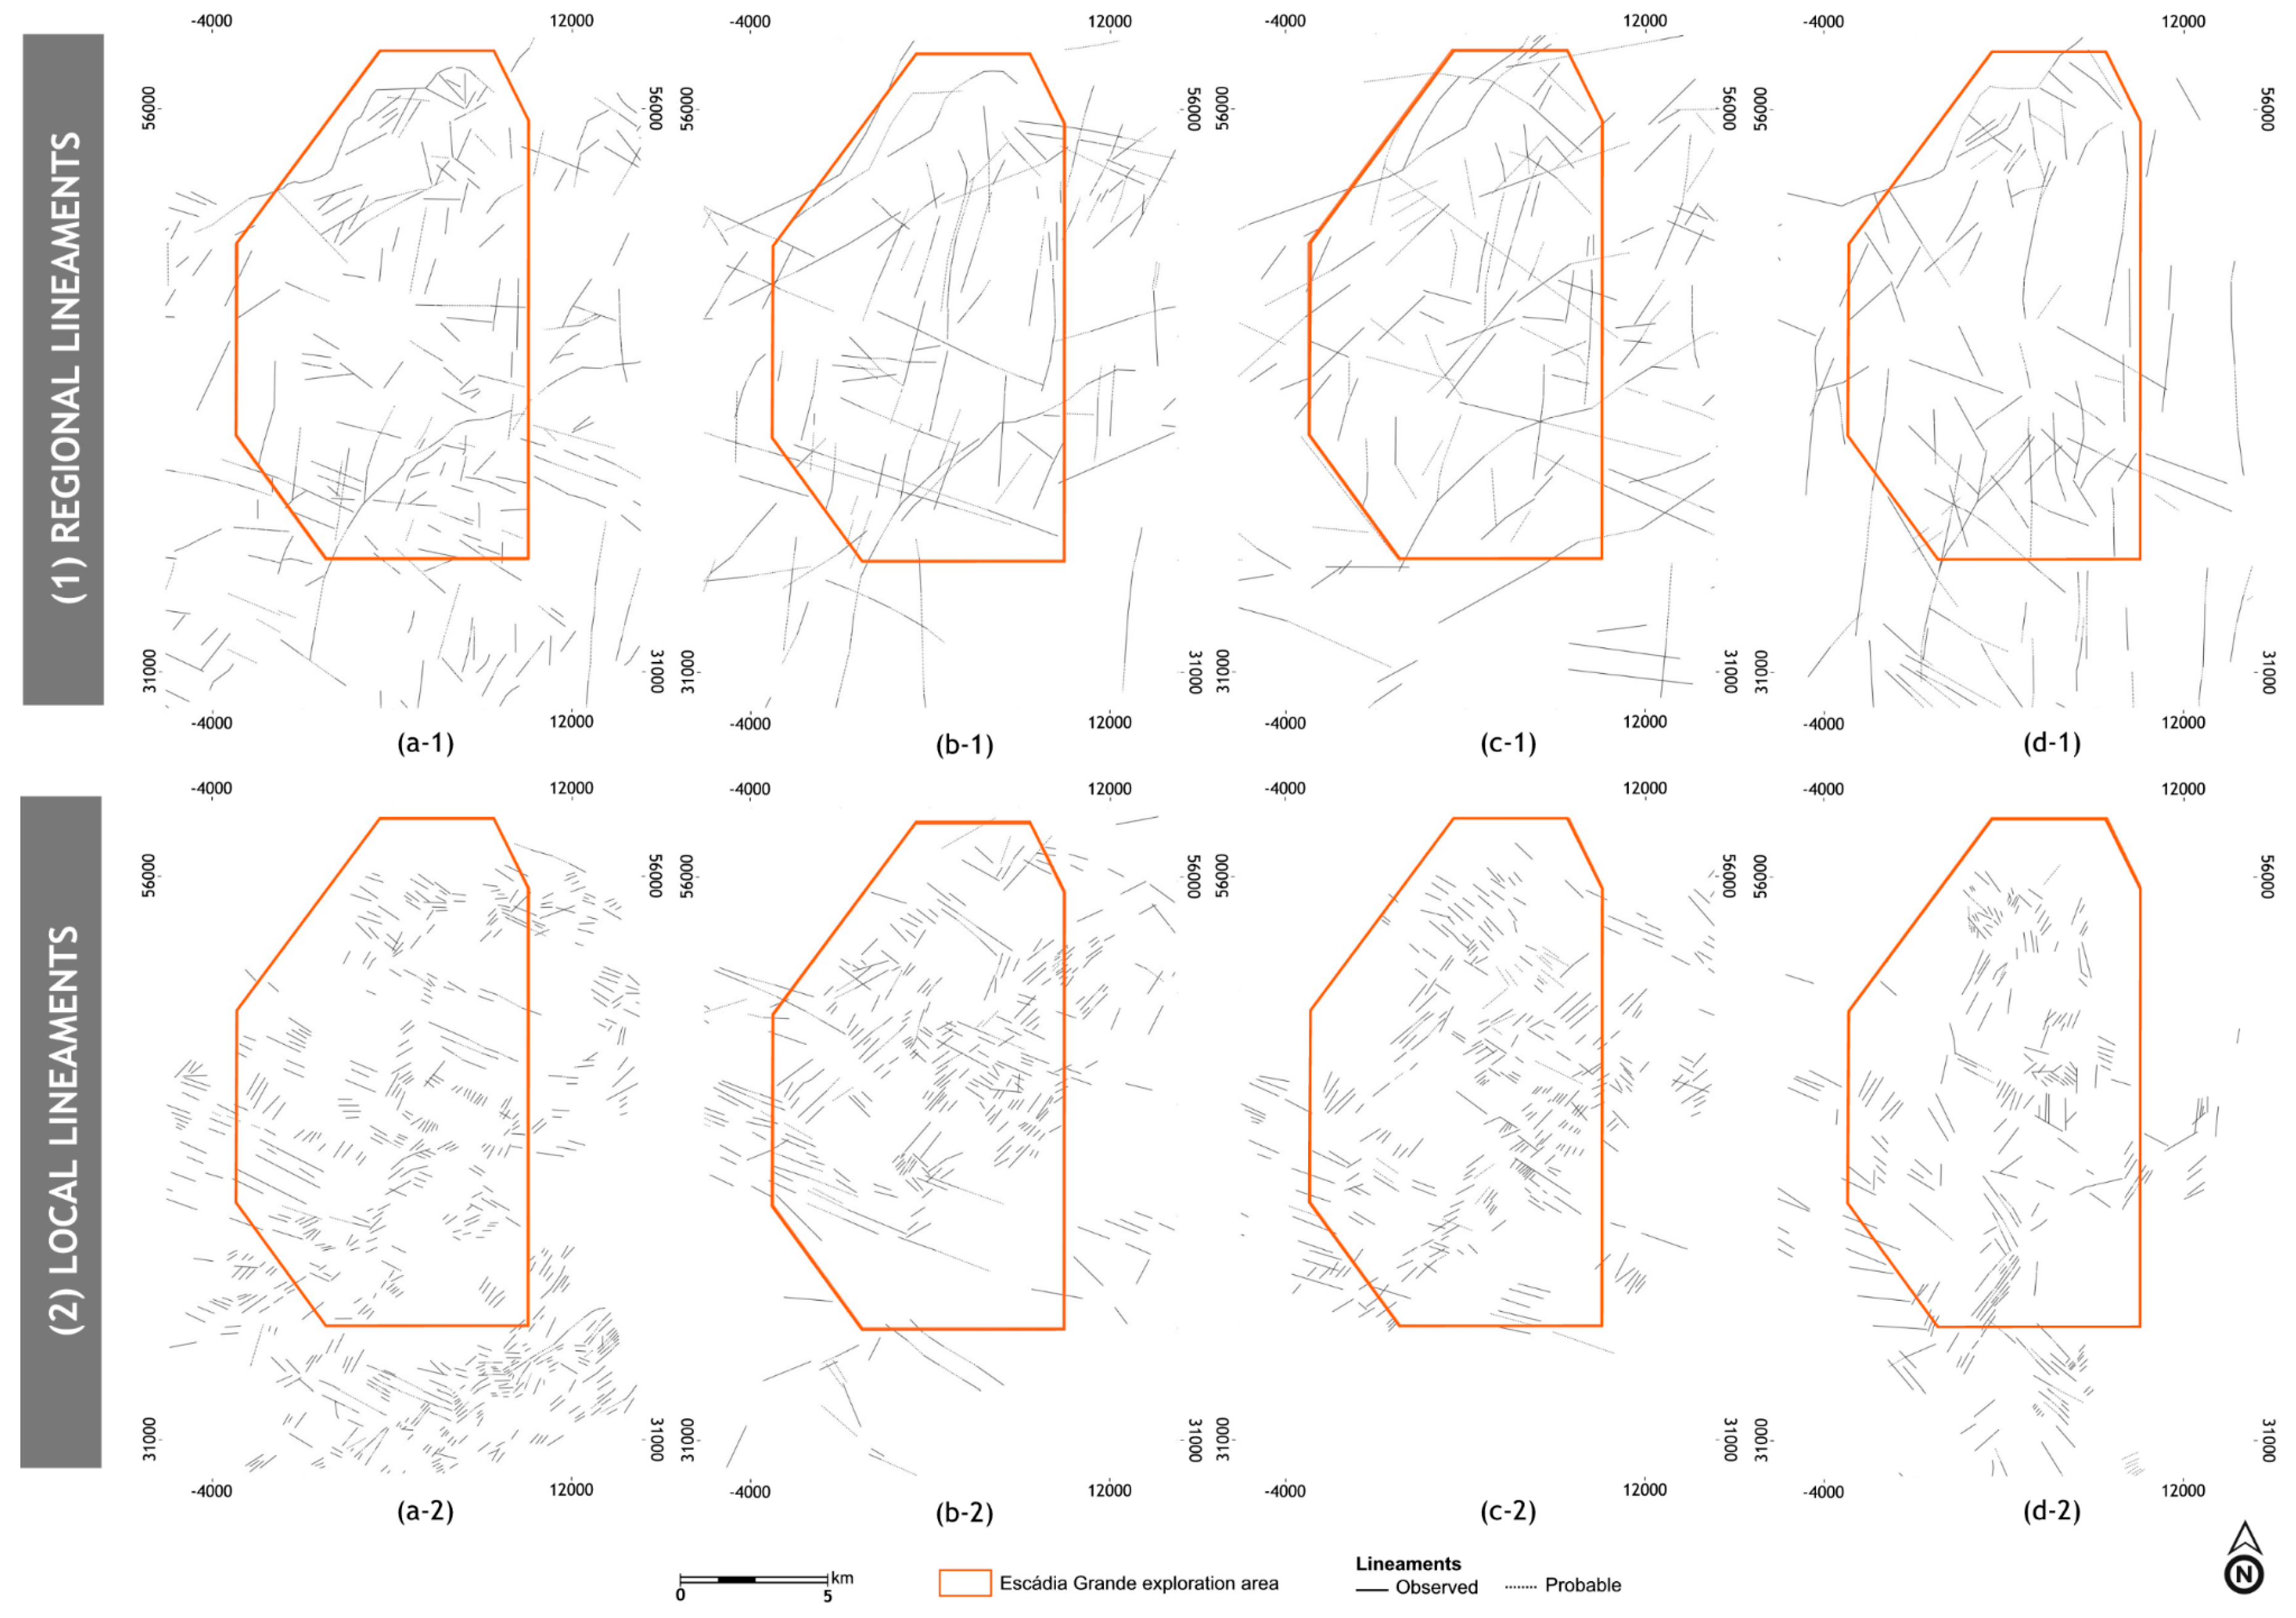
Figure 13.
Final lineament map.
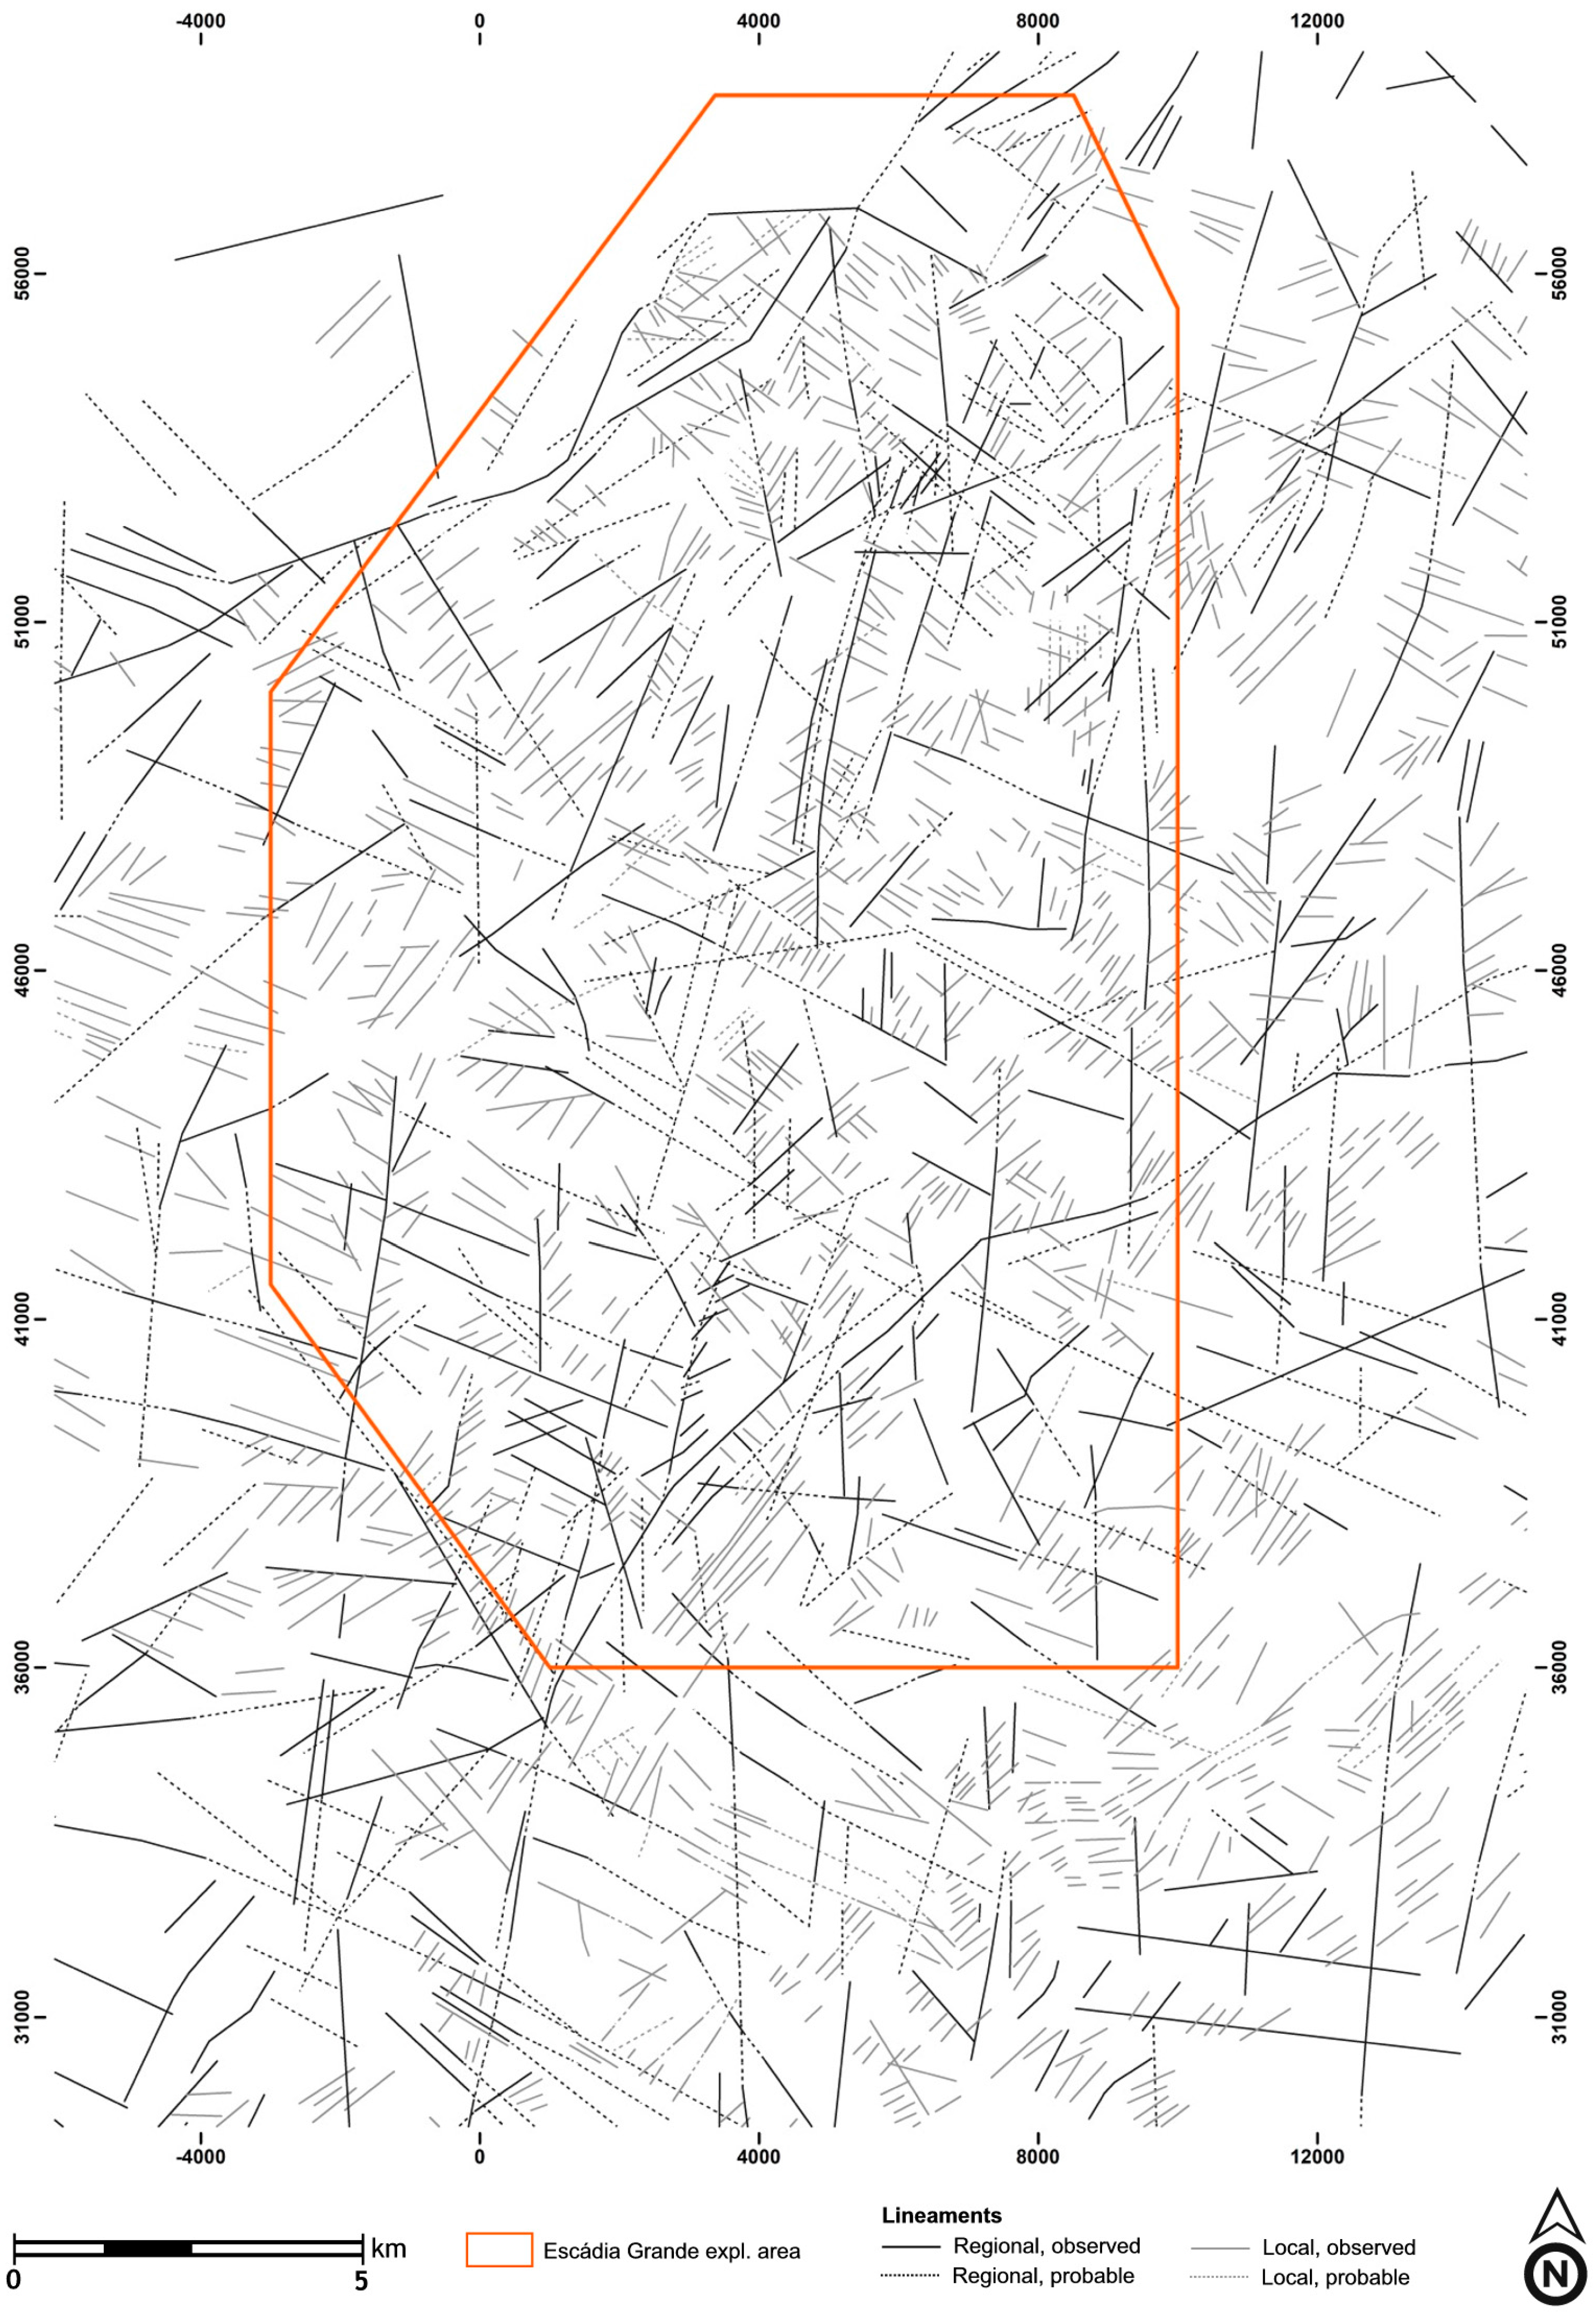
Figure 14.
Rose diagram for the final lineament map.

Figure 15.
Lineament maps grouped according to their trend, in classes of 30°.
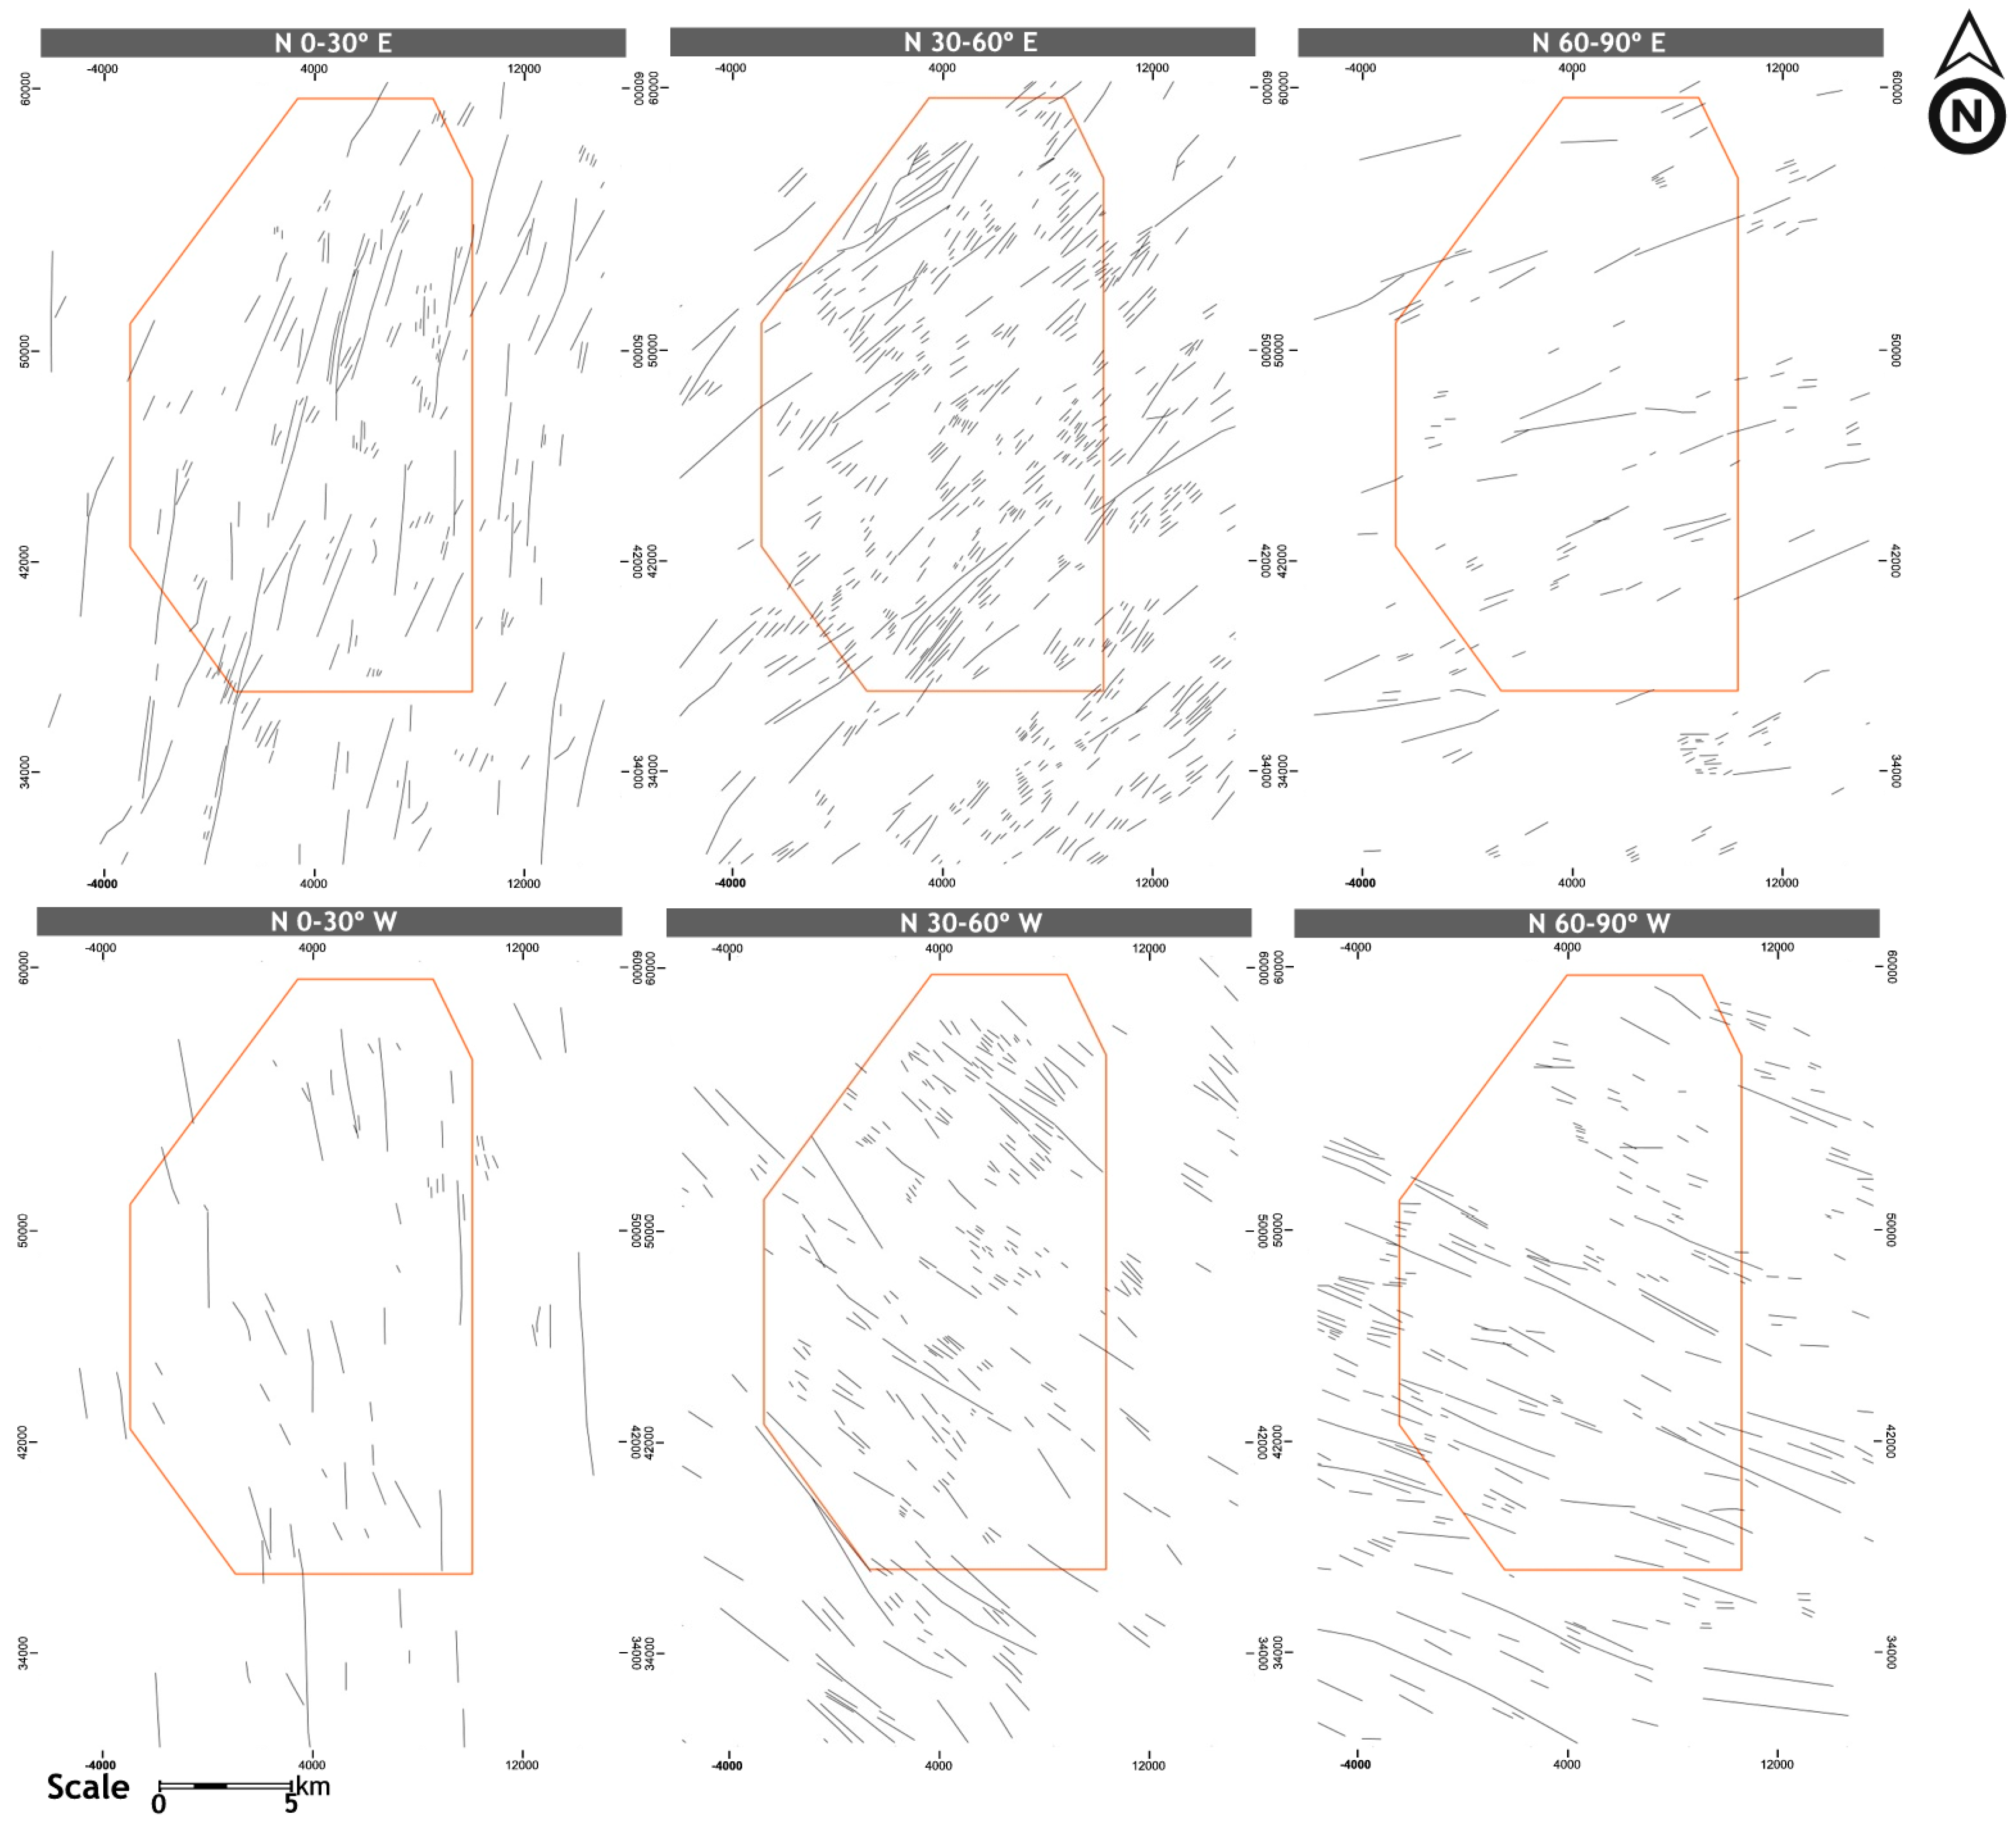
Figure 16.
Lineament density map.

Figure 17.
(a) Available geological base-information (Sheet19-D (Coimbra-Lousã), Geological map of Portugal 1:50,000; Geological map of Portugal 1:500,000; [18,19,20]); (b) mapped lineaments, as shown in Figure 13.
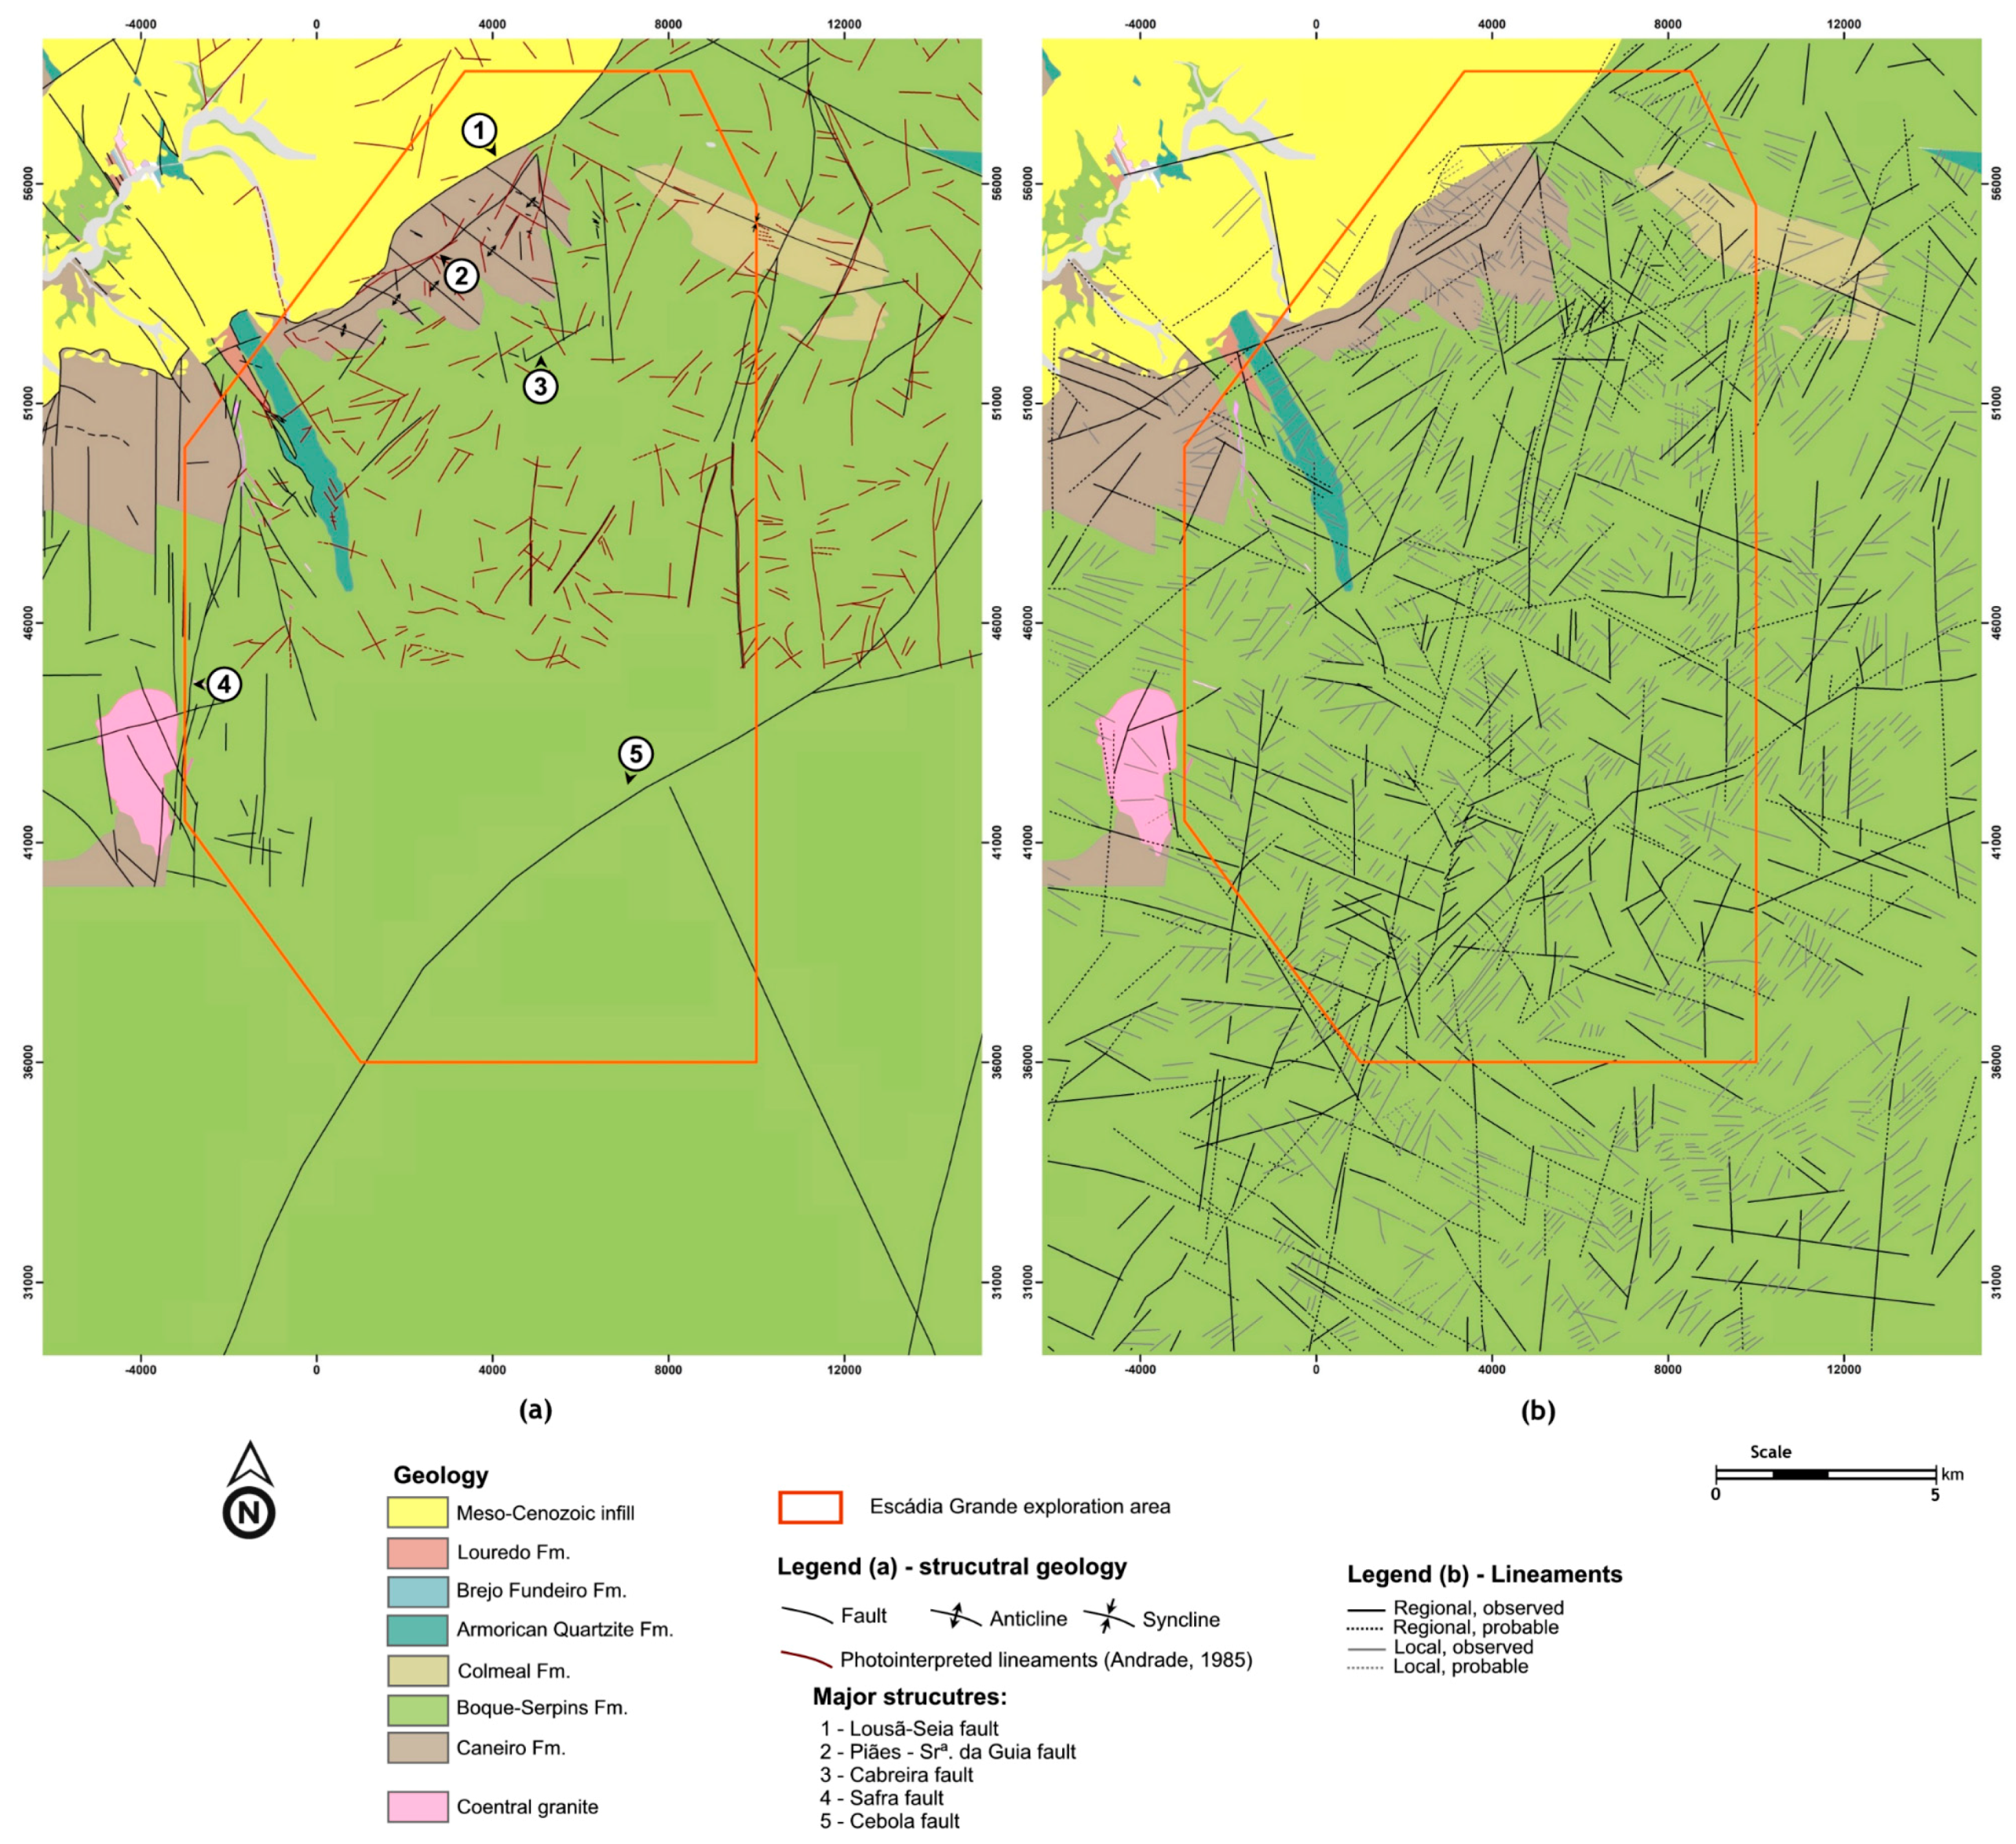
Figure 18.
Mapped lineaments and known mineral occurrences.

Figure 19.
(a) Radiometric data and known mineral occurrences; (b) lineament density map known mineral occurrences.
Figure 19.
(a) Radiometric data and known mineral occurrences; (b) lineament density map known mineral occurrences.

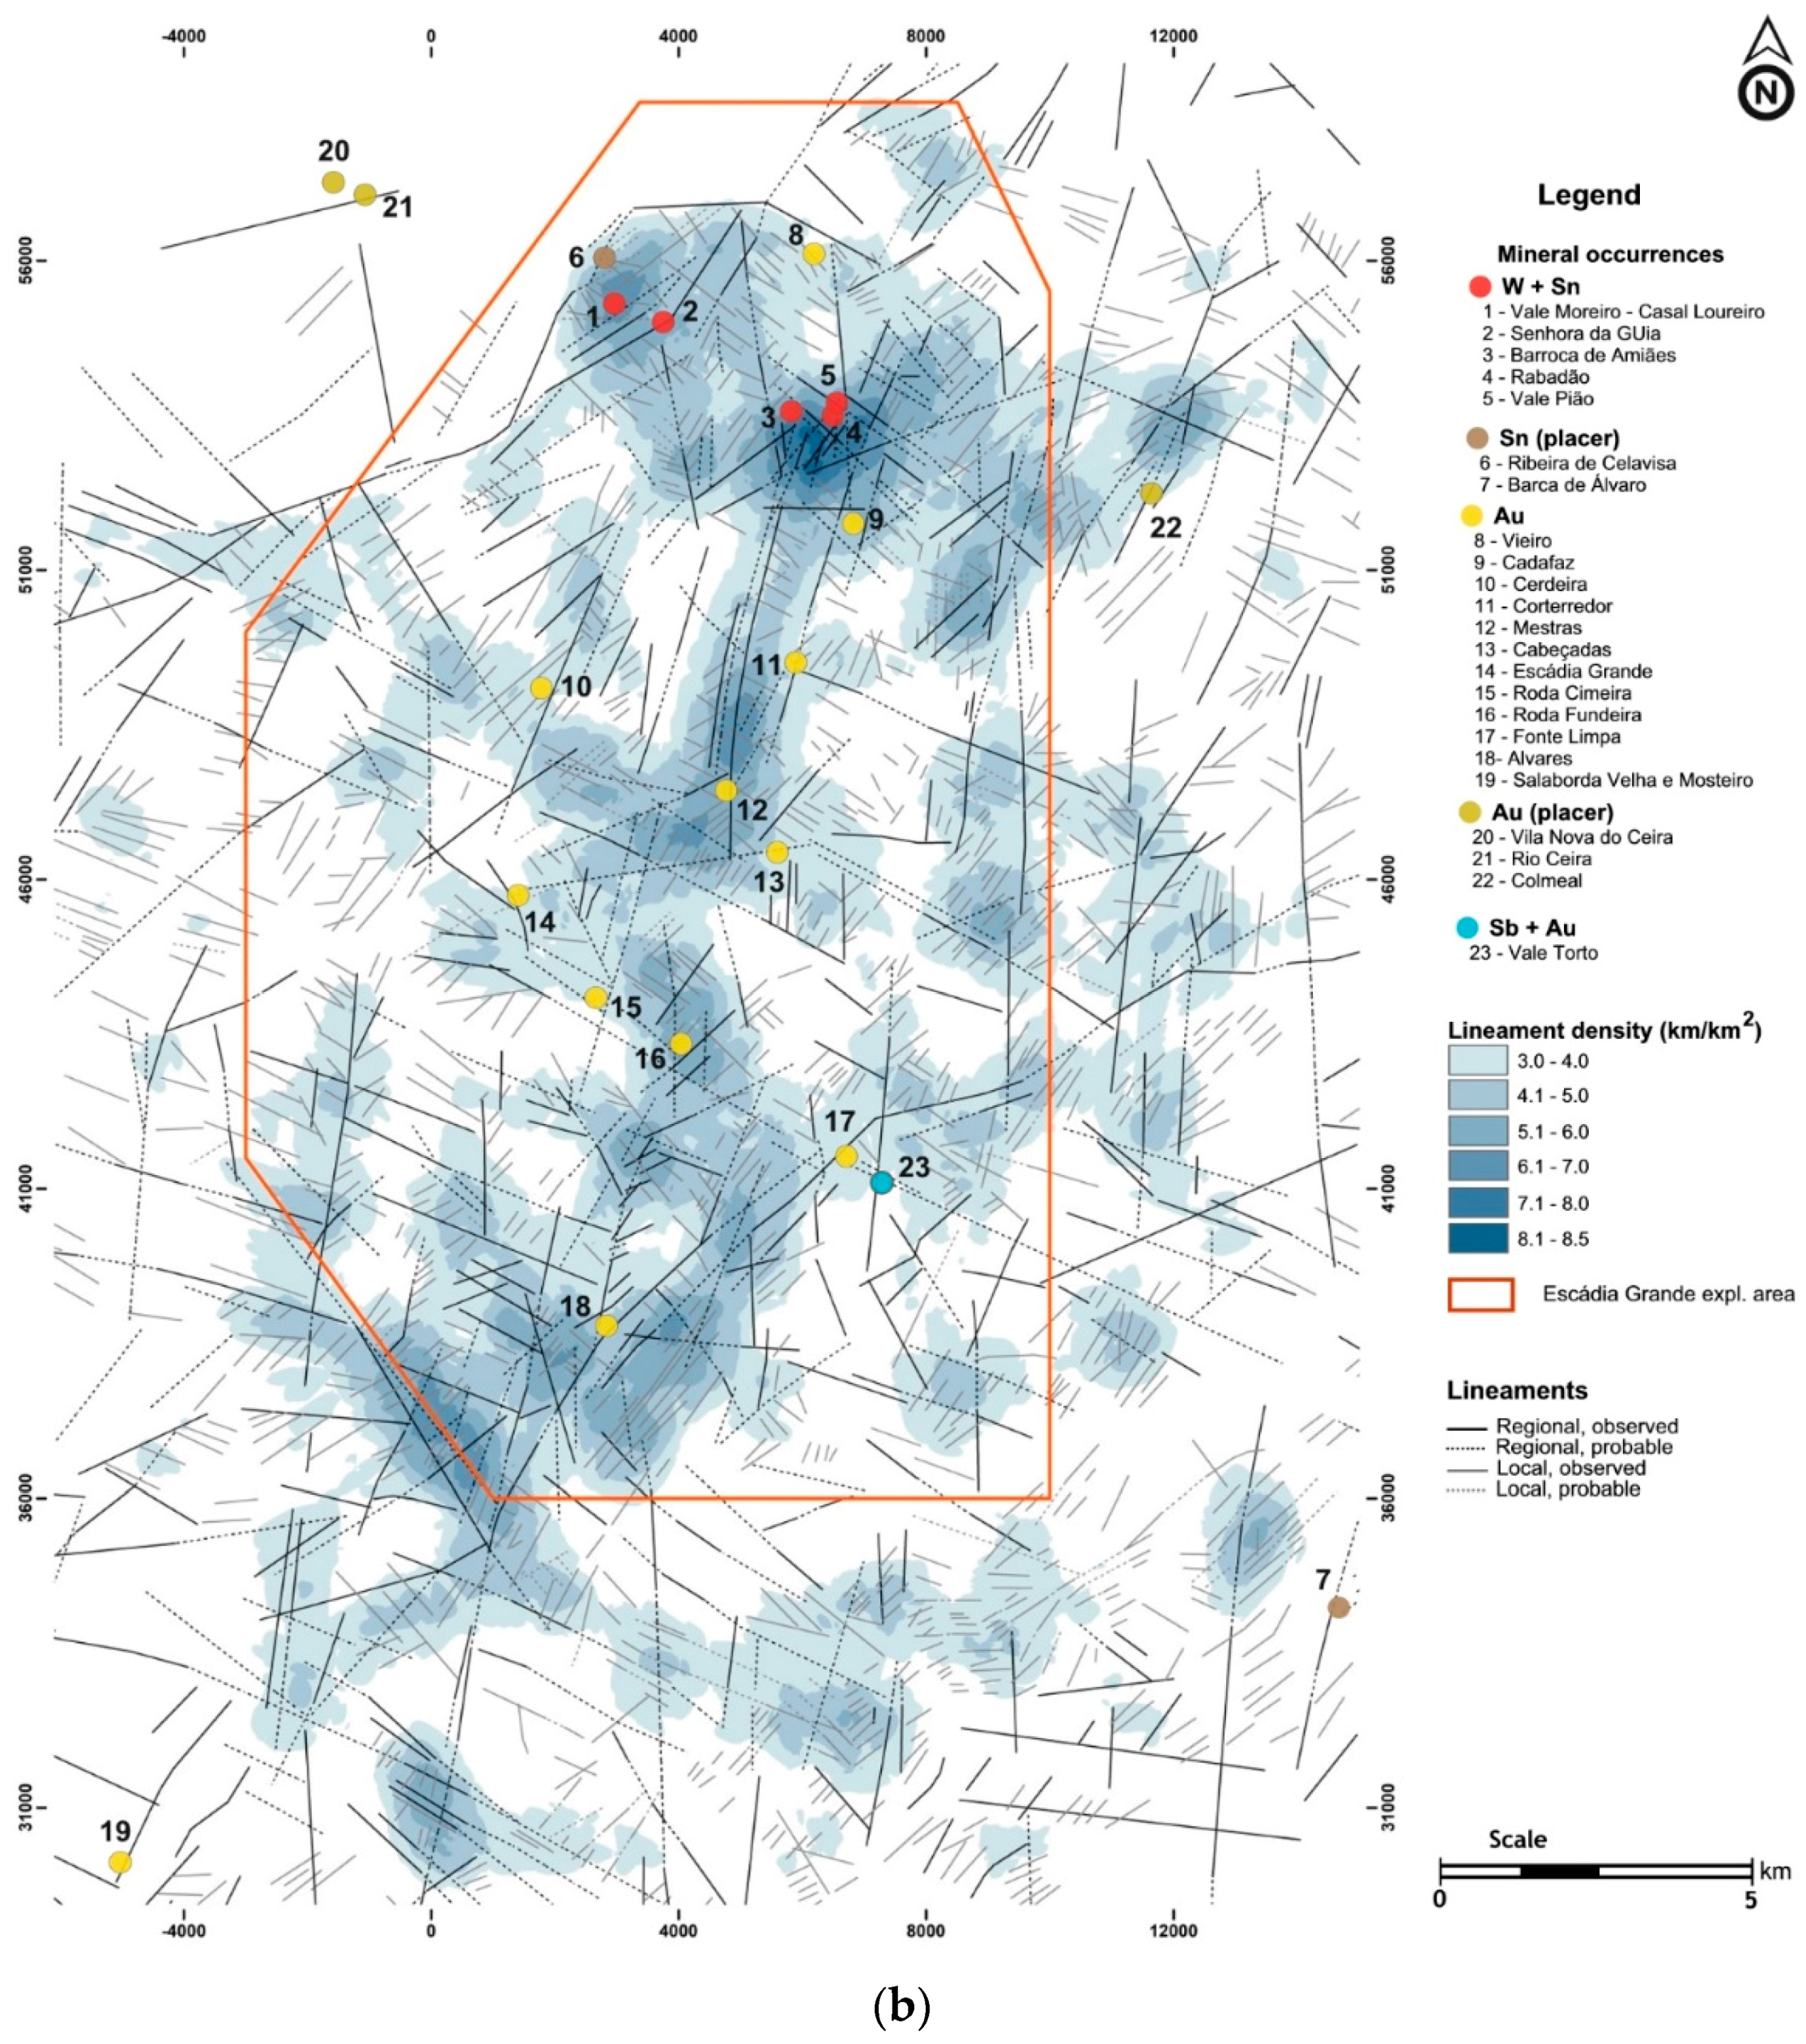
Figure 20.
Lineament map and locations with particular toponymy (based on the 1:25,000 scale Portuguese Military Cartography).
Figure 20.
Lineament map and locations with particular toponymy (based on the 1:25,000 scale Portuguese Military Cartography).

Figure 21.
Lineament map and target exploration areas.

Table 1.
Landsat 8 band specifications [46].
Table 1.
Landsat 8 band specifications [46].
| Sensor | Band | Spectral Resolution (µm) | Spatial Resolution (m) |
|---|---|---|---|
| OLI | Band 1—Coastal | 0.435–0.451 | 30 |
| Band 2—Blue | 0.452–0.512 | 30 | |
| Band 3—Green | 0.533–0.590 | 30 | |
| Band 4—Red | 0.636–0.673 | 30 | |
| Band 5—NIR | 0.851–0.879 | 30 | |
| Band 6—SWIR-1 | 1.566–1.651 | 30 | |
| Band 7—SWIR-2 | 2.107–2.294 | 30 | |
| Band 8—Pan | 0.503–0.676 | 15 | |
| Band 9—Cirrus | 1.363–1.384 | 30 | |
| TIRS | Band 10—TIR-1 | 10.60–11.19 | 100 |
| Band 11—TIR-2 | 11.50–12.51 | 100 |
Table 2.
Landsat 8 band combinations with the highest OIF values.
| Landsat 8 Band Combinations | OIF |
|---|---|
| 5-6-10 | 2354.41 |
| 5-7-10 | 2353.66 |
| 5-6-11 | 2260.84 |
| 5-7-11 | 2247.28 |
| 4-5-10 | 2157.02 |
Table 3.
First four principal components and respective eigenvectors.
| Bands | PC1 | Bands | PC2 | Bands | PC3 | Bands | PC4 |
|---|---|---|---|---|---|---|---|
| B6 | 0.61 | B5 | 0.79 | B5 | 0.22 | B6 | 0.51 |
| B5 | 0.55 | B10 | 0.08 | B6 | 0.13 | B10 | 0.05 |
| B7 | 0.40 | B11 | 0.07 | B7 | 0.07 | B11 | 0.03 |
| B4 | 0.20 | B9 | 0.00 | B4 | 0.02 | B7 | 0.02 |
| B10 | 0.18 | B1 | −0.06 | B3 | 0.01 | B9 | 0.00 |
| B8 | 0.17 | B2 | −0.09 | B8 | 0.01 | B5 | −0.10 |
| B3 | 0.16 | B3 | −0.11 | B9 | 0.00 | B1 | −0.27 |
| B11 | 0.14 | B8 | −0.15 | B2 | −0.05 | B2 | −0.31 |
| B2 | 0.10 | B4 | −0.21 | B1 | −0.07 | B3 | −0.35 |
| B1 | 0.08 | B6 | −0.34 | B10 | −0.59 | B4 | −0.43 |
| B9 | 0.00 | B7 | −0.39 | B11 | −0.76 | B8 | −0.50 |
Table 4.
Parameters and weights used for the ranking of selected areas.
| Parameters | Weights |
|---|---|
| Lineament density | 30% |
| Proximity to known occurrences | 30% |
| Radiometric data | 20% |
| Relation to known metallogenic belts | 12% |
| Relation to known metallogenic belts | 8% |
© 2017 by the authors. Licensee MDPI, Basel, Switzerland. This article is an open access article distributed under the terms and conditions of the Creative Commons Attribution (CC BY) license (http://creativecommons.org/licenses/by/4.0/).
Share and Cite
MDPI and ACS Style
Manuel, R.; Brito, M.D.G.; Chichorro, M.; Rosa, C. Remote Sensing for Mineral Exploration in Central Portugal. Minerals 2017, 7, 184. https://doi.org/10.3390/min7100184
AMA Style
Manuel R, Brito MDG, Chichorro M, Rosa C. Remote Sensing for Mineral Exploration in Central Portugal. Minerals. 2017; 7(10):184. https://doi.org/10.3390/min7100184
Chicago/Turabian StyleManuel, Ricardo, Maria Da Graça Brito, Martim Chichorro, and Carlos Rosa. 2017. "Remote Sensing for Mineral Exploration in Central Portugal" Minerals 7, no. 10: 184. https://doi.org/10.3390/min7100184
Note that from the first issue of 2016, this journal uses article numbers instead of page numbers. See further details here.