Insights into Alkali-Acid Leaching of Sericite: Dissolution Behavior and Mechanism


1
The School of Earth Science and Resources, Chang’an University, Xi’an 710064, China
2
School of Minerals Processing and Bioengineering, Central South University, Changsha 410083, China
3
Hunan Key Laboratory of Mineral Materials and Application, Central South University, Changsha 410083, China
*
Author to whom correspondence should be addressed.
Minerals 2017, 7(10), 196; https://doi.org/10.3390/min7100196
Submission received: 19 September 2017
/
Revised: 9 October 2017
/
Accepted: 11 October 2017
/
Published: 17 October 2017
Abstract
:Sericite is a typical silicate impurity in microcrystalline graphite ores, and its removal is important in the preparation of high-purity graphite preparations. Alkali-acid leaching is an effective method used to purify graphite and remove silicate minerals. In this study, the dissolution behavior and mechanism of sericite in alkali-acid leaching were investigated. The dissolution of sericite was mainly affected by alkali leaching temperature, sodium hydroxide concentration, and alkali leaching time. According to the XRD, FTIR, and SEM-EDS analyses, the dissolution mechanism of sericite is a three-stage process: (1) sericite is dissolved in the form of soluble silicate and aluminate; (2) the dissolved silicate and aluminate then react with each other to form aluminosilicate; and (3) finally the aluminosilicate mainly composed of hydroxycancrinite and sodalite is almost completely dissolved in the hydrochloric acid solution.
1. Introduction
Microcrystalline graphite is a natural graphite with a high degree of graphitization and consists of many isotropous microcrystals [1,2,3]. Ore deposits of microcrystalline graphite are generally found in metamorphic rocks or quartzites. Quartz, kaolinite, and sericite are minerals typically associated with microcrystalline graphite ores [4]. For microcrystalline graphite purification, the alkali-acid leaching process is an appropriate choice [5,6]. The dissolution behavior and phase transition of sericite in alkali-acid leaching are of great significance to understanding the chemical purification process of microcrystalline graphite.
Sericite is a highly refractive and natural ultrafine-grained muscovite [7]. The theoretical chemical formula of sericite is KSi3Al3O10(OH)2 and its charge density is close to 1.0 equivalent per O10(OH)2 [8]. Sericite belongs to the clay minerals, and the unit cell is composed of a T–O–T layer, where T represents tetrahedral (SiO4)4− and O represents octahedral (AlO3(OH)3) [9]. Although the dissolution behavior of sericite has been rarely reported, the dissolution of muscovite under acidic or alkaline conditions has been widely studied, thereby also benefitting the understanding of the dissolution mechanism of sericite [10]. Knauss [11] evaluated the effect of pH (1.4–11.8) on muscovite dissolution rate. Kalinowski [12] studied the kinetics of muscovite dissolution in acidic solutions (pH 1–4) and found that the dissolution rate depends on pH value. Muscovite dissolution in a high-temperature environment has also been reported [13]. Oelkers [14] found that dissolution rates at higher temperatures (333 K–474 K) and broad pH ranges (1–10.3) are functions of K, Si, and Al concentrations in reactive solutions. However, these studies were performed in low-alkaline conditions, and used highly undersaturated dilute solutions. The solubility property of muscovite in alkaline solutions under high temperatures and high alkaline concentration conditions has rarely been studied. The stability of the formed precursor complex is also unknown.
This study aims to advance our understanding of the dissolution behavior and mechanism of natural sericite under high-alkaline and high-temperature conditions. The characteristic of the transition phase formed in alkali leaching and its dissolving property in acidic solutions are also studied.
2. Materials and Methods
2.1. Materials and Reagents
The sericite used in the experiments was obtained from Chuzhou Grea Minerals Co., Ltd., Chuzhou, China. Unless otherwise specified, all chemicals used in the experiments and analysis were of analytical reagent grade (used as received without further purification) and de-ionized water was used in preparation of all solutions in the experiments.
Chemical compositions of raw sericite are given in Table 1. The principal compositions were SiO2, Al2O3, K2O, and Fe. From the XRD pattern of raw sericite (presented in Section 3.2.1), the characteristic diffraction peaks of sericite were clearly observed. The degree of crystallinity of raw sericite was high, and a little quartz existed in the sample.
2.2. Characterization
X-ray diffraction (XRD) analysis of powder samples was performed by scanning at 1°/min over 2θ of 3°–70° (Philips X’ Pert Pro Alpha, PANalytical, Almelo, The Netherlands) with Ni-filtered CuKα radiation (λ = 1.5406 Å, 35 kV, and 40 mA). The morphologies of the powder samples were determined by scanning electron microscopy (Nova NanoSEM 230, FEI Company, Hillsboro, OR, USA). The samples were gold-coated before the SEM-energy dispersive spectroscopy (EDS) analysis. The chemical compositions of the samples, calculated as major oxides, were further characterized by X-ray fluorescence analysis (PANalytical Axios mAX, PANalytical, Almelo, The Netherlands). The voltage and current of the X-ray tube were 25 kV and 144 mA respectively. The 740 Fourier transform infrared (FTIR) spectrometer by Nicolet (Thermo Nicolet Corporation, Madison, WI, USA) was applied to determine the functional groups of sericite over a wave number range of 4000–400 cm−1. A Unico UV–2600 ultraviolet spectrophotometer (Unico Instrument Co., Ltd., Shanghai, China) was applied to determine Si content in the solution, according to silicon-molybdenum blue spectrophotometer [15,16].
2.3. Procedure
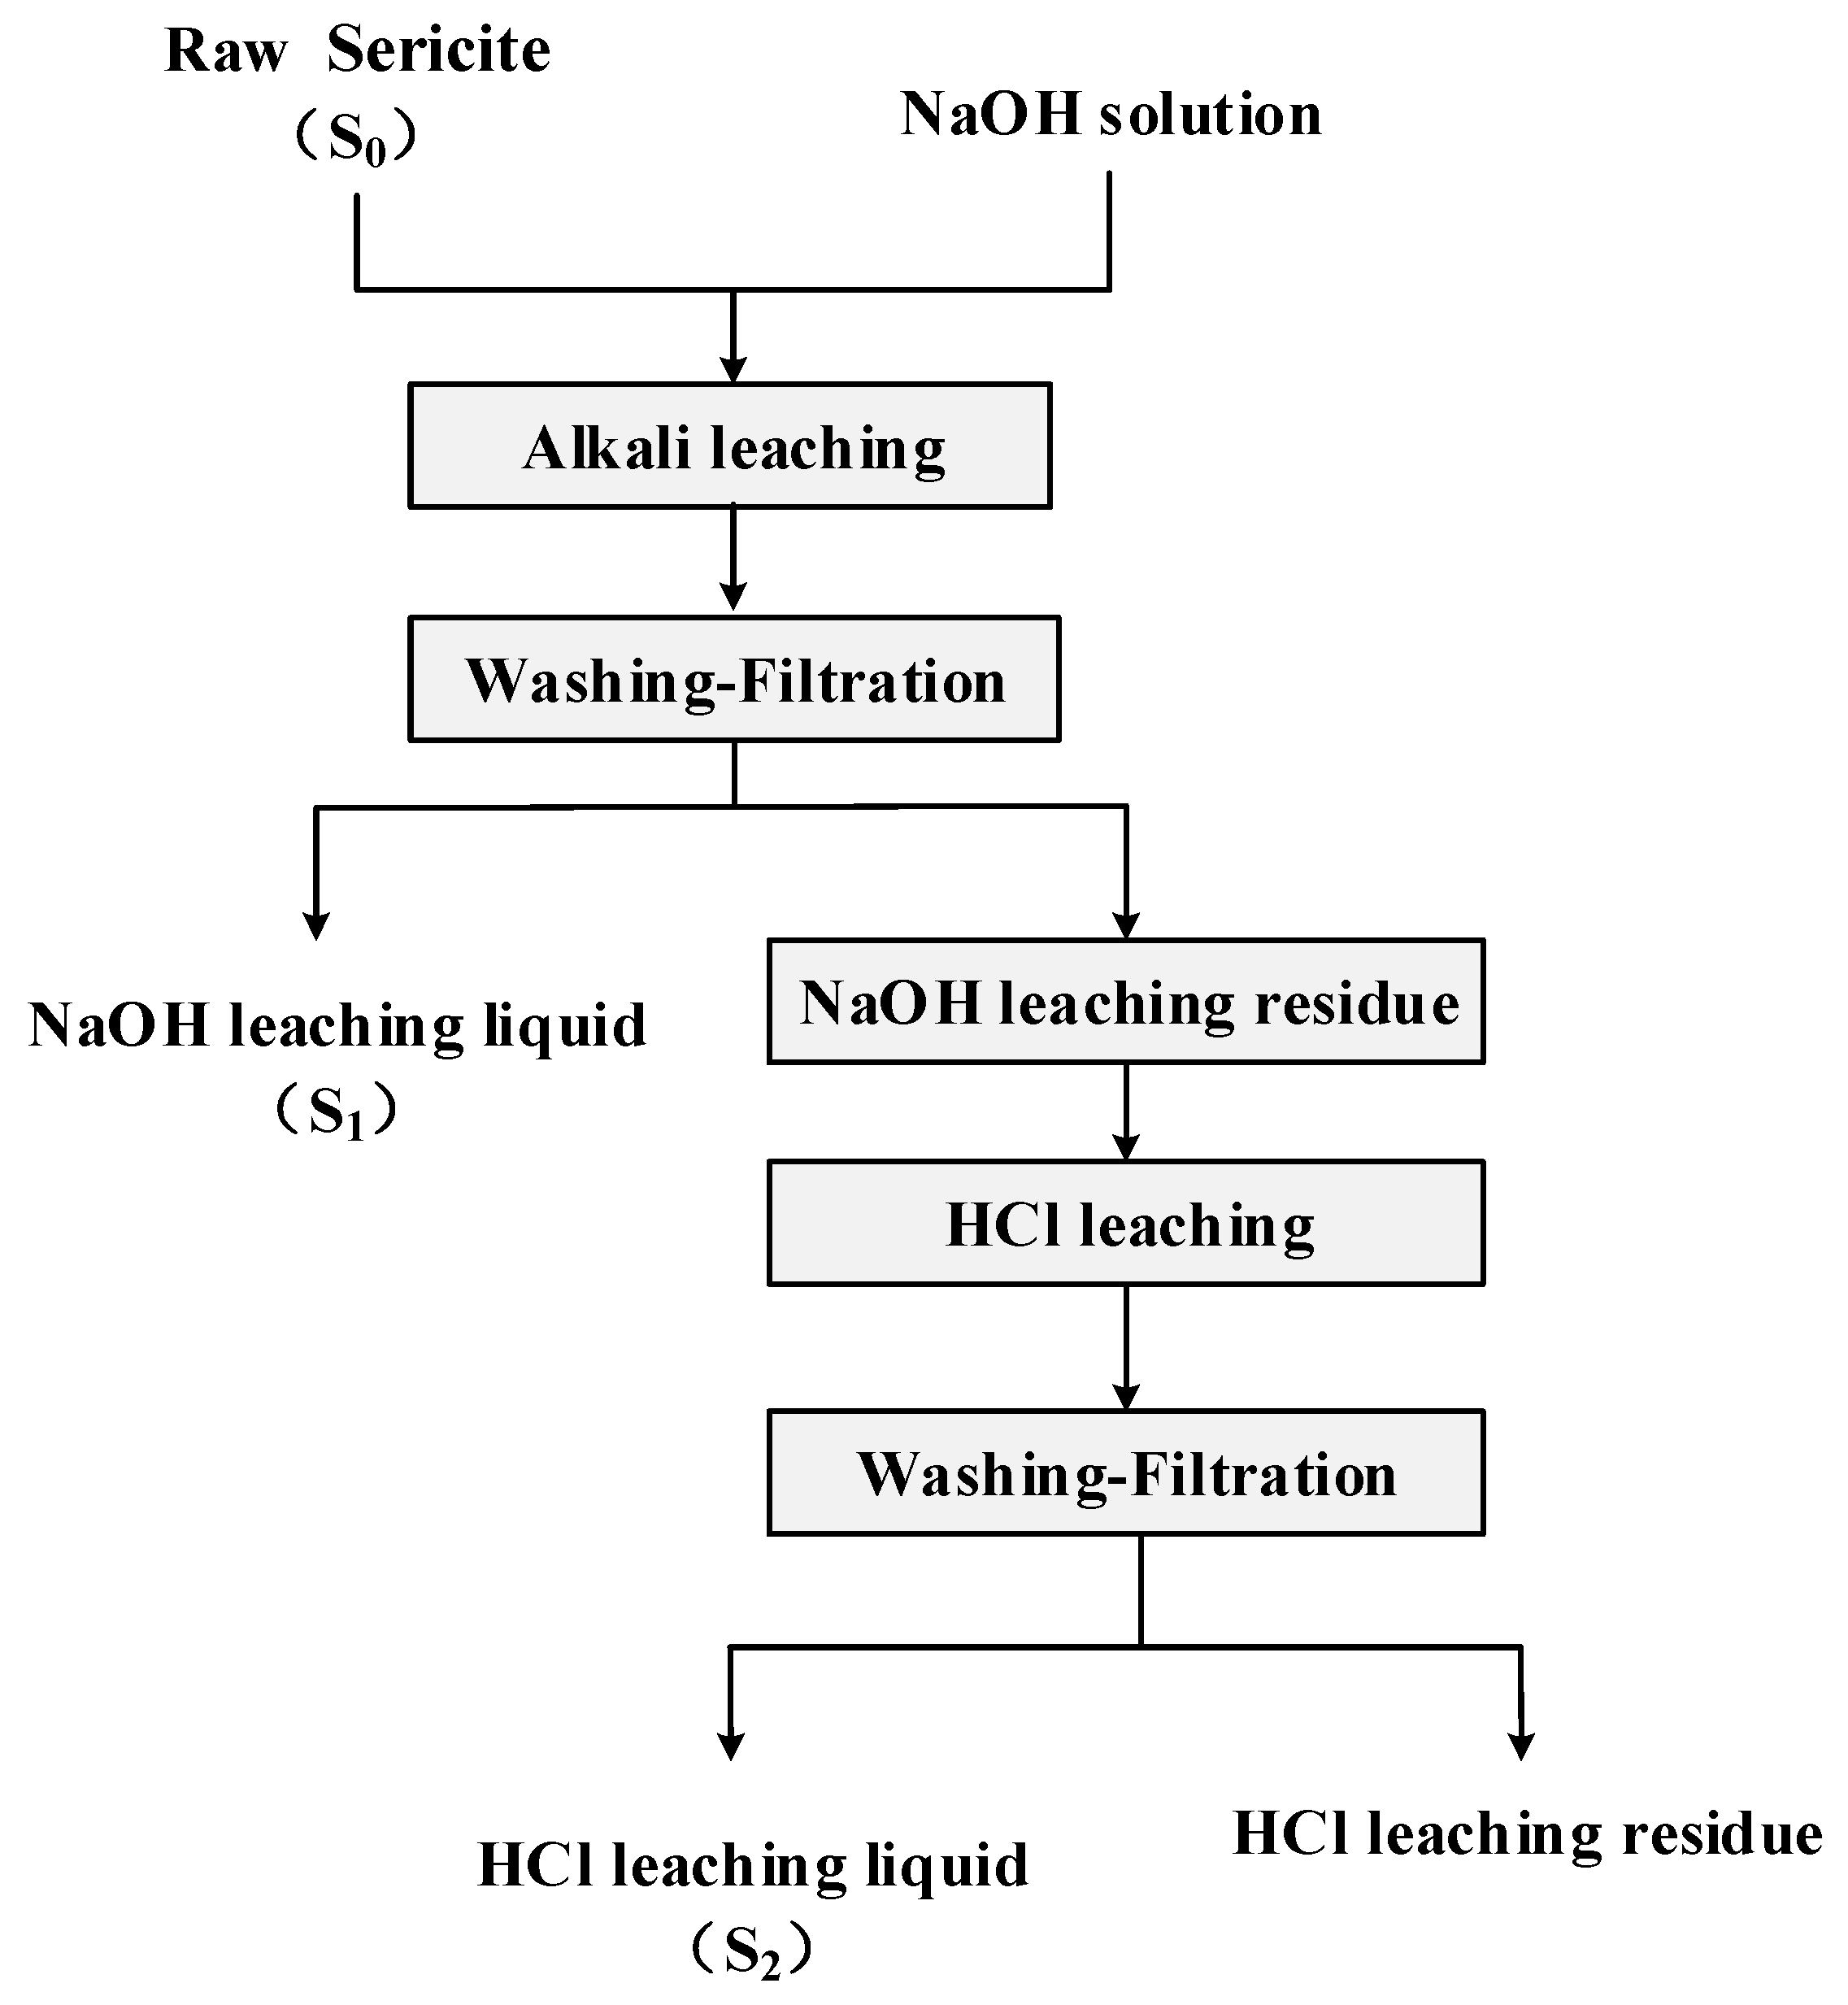
All dissolution experiments were performed in a laboratory autoclave with a volume of 200 mL (Xi’an Taikang Biotechnology Co., Ltd., Xi’an, China). The entire procedure included alkali leaching, water washing, acid leaching, water washing, and drying (Figure 1). The inlet solutions were composed of demineralized H2O, NaOH, and sericite. Sodium hydroxide and raw sericite powder were mixed in an autoclave. After leaching, the leached materials were washed to neutral by water to eliminate water-soluble components. The washed materials were then leached with hydrochloric acid solution in a conical flask. Finally, the acid-leached materials were washed to neutral and dried in an oven.
In previous studies involving an exhaustive analysis of the solubility of several aluminosilicate minerals in alkaline media, Si and Al dissolution has been synchronized in all cases [13]. The dissolution rate of Si in sericite was used to describe the solubility of sericite during leaching. The dissolution rate of Si in alkaline solution (ASi) and the dissolution rate of Si in both alkaline solution and acidic solutions (TSi) were calculated according to Equations (1) and (2), respectively:
where S0 is the amount of Si in raw sericite, S1 is the amount of Si in alkali-leached liquor, and S2 is the amount of Si in acid-leached liquor (Figure 1).
Single-factor experiments were used to investigate the effects of alkali leaching temperature, NaOH concentration, and alkali leaching time on the dissolution of sericite. The test procedures of the single-leaching experiment were as follows. In brief, 4 g of the sericite sample was mixed with sodium hydroxide solution (100 mL) and then leached at a certain temperature. The leached products were filtered and washed to neutral. After washing, the residues were leached with 2.4 mol/L hydrochloric acid solution (200 mL) at 313 K for 0.5 h. The alkali leaching temperature was within a range of 393 K–513 K, which is the suitable temperature range for aluminum production by the Bayer process [17,18,19,20].
3. Results and Discussion
3.1. Leaching Tests
When the alkali leaching temperature was increased from 393 K to 513 K, the ASi and TSi increased (Figure 2a). In this test, the concentration of NaOH solution was 3 mol/L, and leaching time was 1 h. When the alkali leaching temperature reached 513 K, TSi was about 74.45%. The next two series of tests on the influence of alkali concentration and leaching time were carried out at 513 K. The ASi and TSi increased rapidly with increasing NaOH concentration when the leaching time was 1 h (Figure 2b). When the NaOH concentration was increased from 2 mol/L to 6 mol/L, the TSi increased from 38.38% to 99.36%. The results indicate that a high NaOH concentration would facilitate the chemical reaction between sericite and NaOH solution, and significantly promote the solubility of Si in alkali leaching. When the alkali leaching time exceeded 2 h, the ASi decreased slightly, indicating that the precipitation rate of Si was faster than the dissolution rate of Si (Figure 2c). In this test, the concentration of NaOH solution was set as 3 mol/L. The TSi increased with increasing alkali leaching time, indicating that the precursor complex of Si formed during precipitation was dissolved in the acidic solution. The overall dissolution reaction of sericite under alkaline conditions can be expressed as Equation (3) [11]:
The dissolution rate of silicate minerals is proved to be affected by the concentration of the reagent and temperature [21]. This dependence is usually expressed mathematically in the following form (Equation (4)) for an irreversible reaction [13]:
where c represents the activity or concentration of a reactant (either dimensionless or mol/m3), k is the rate constant [mol(mol/m3)−n/(m2s)], n is the order of reaction, EA is the activation energy (kJ/mol), R is the gas constant (kJ/mol/K), and T is the temperature (K). The unit of rate is mol/m2/s. The order of the reaction indicates how the rate of reaction is dependent on the concentration of the reactant [22]. Any improvement in favor of promoting the reaction between NaOH and sericite will accelerate the dissolution of sericite in alkaline solutions. As a result, increasing the alkali leaching temperature, alkali concentration, and alkali leaching time would facilitate the dissolution rate of sericite. The processing parameters of microcrystalline graphite purification by alkali-acid leaching technology can be optimized accordingly. In the current work, increasing the alkali leaching temperature, alkali concentration and alkali leaching time were beneficial for purification. The XRD patterns of microcrystalline graphite before and after chemical purification, showed the complete removal of sericite impurity in the graphite concentrate.
3.2. Analysis of Alkali-Leached Residue
3.2.1. XRD Analysis of Alkali-Leached Residue
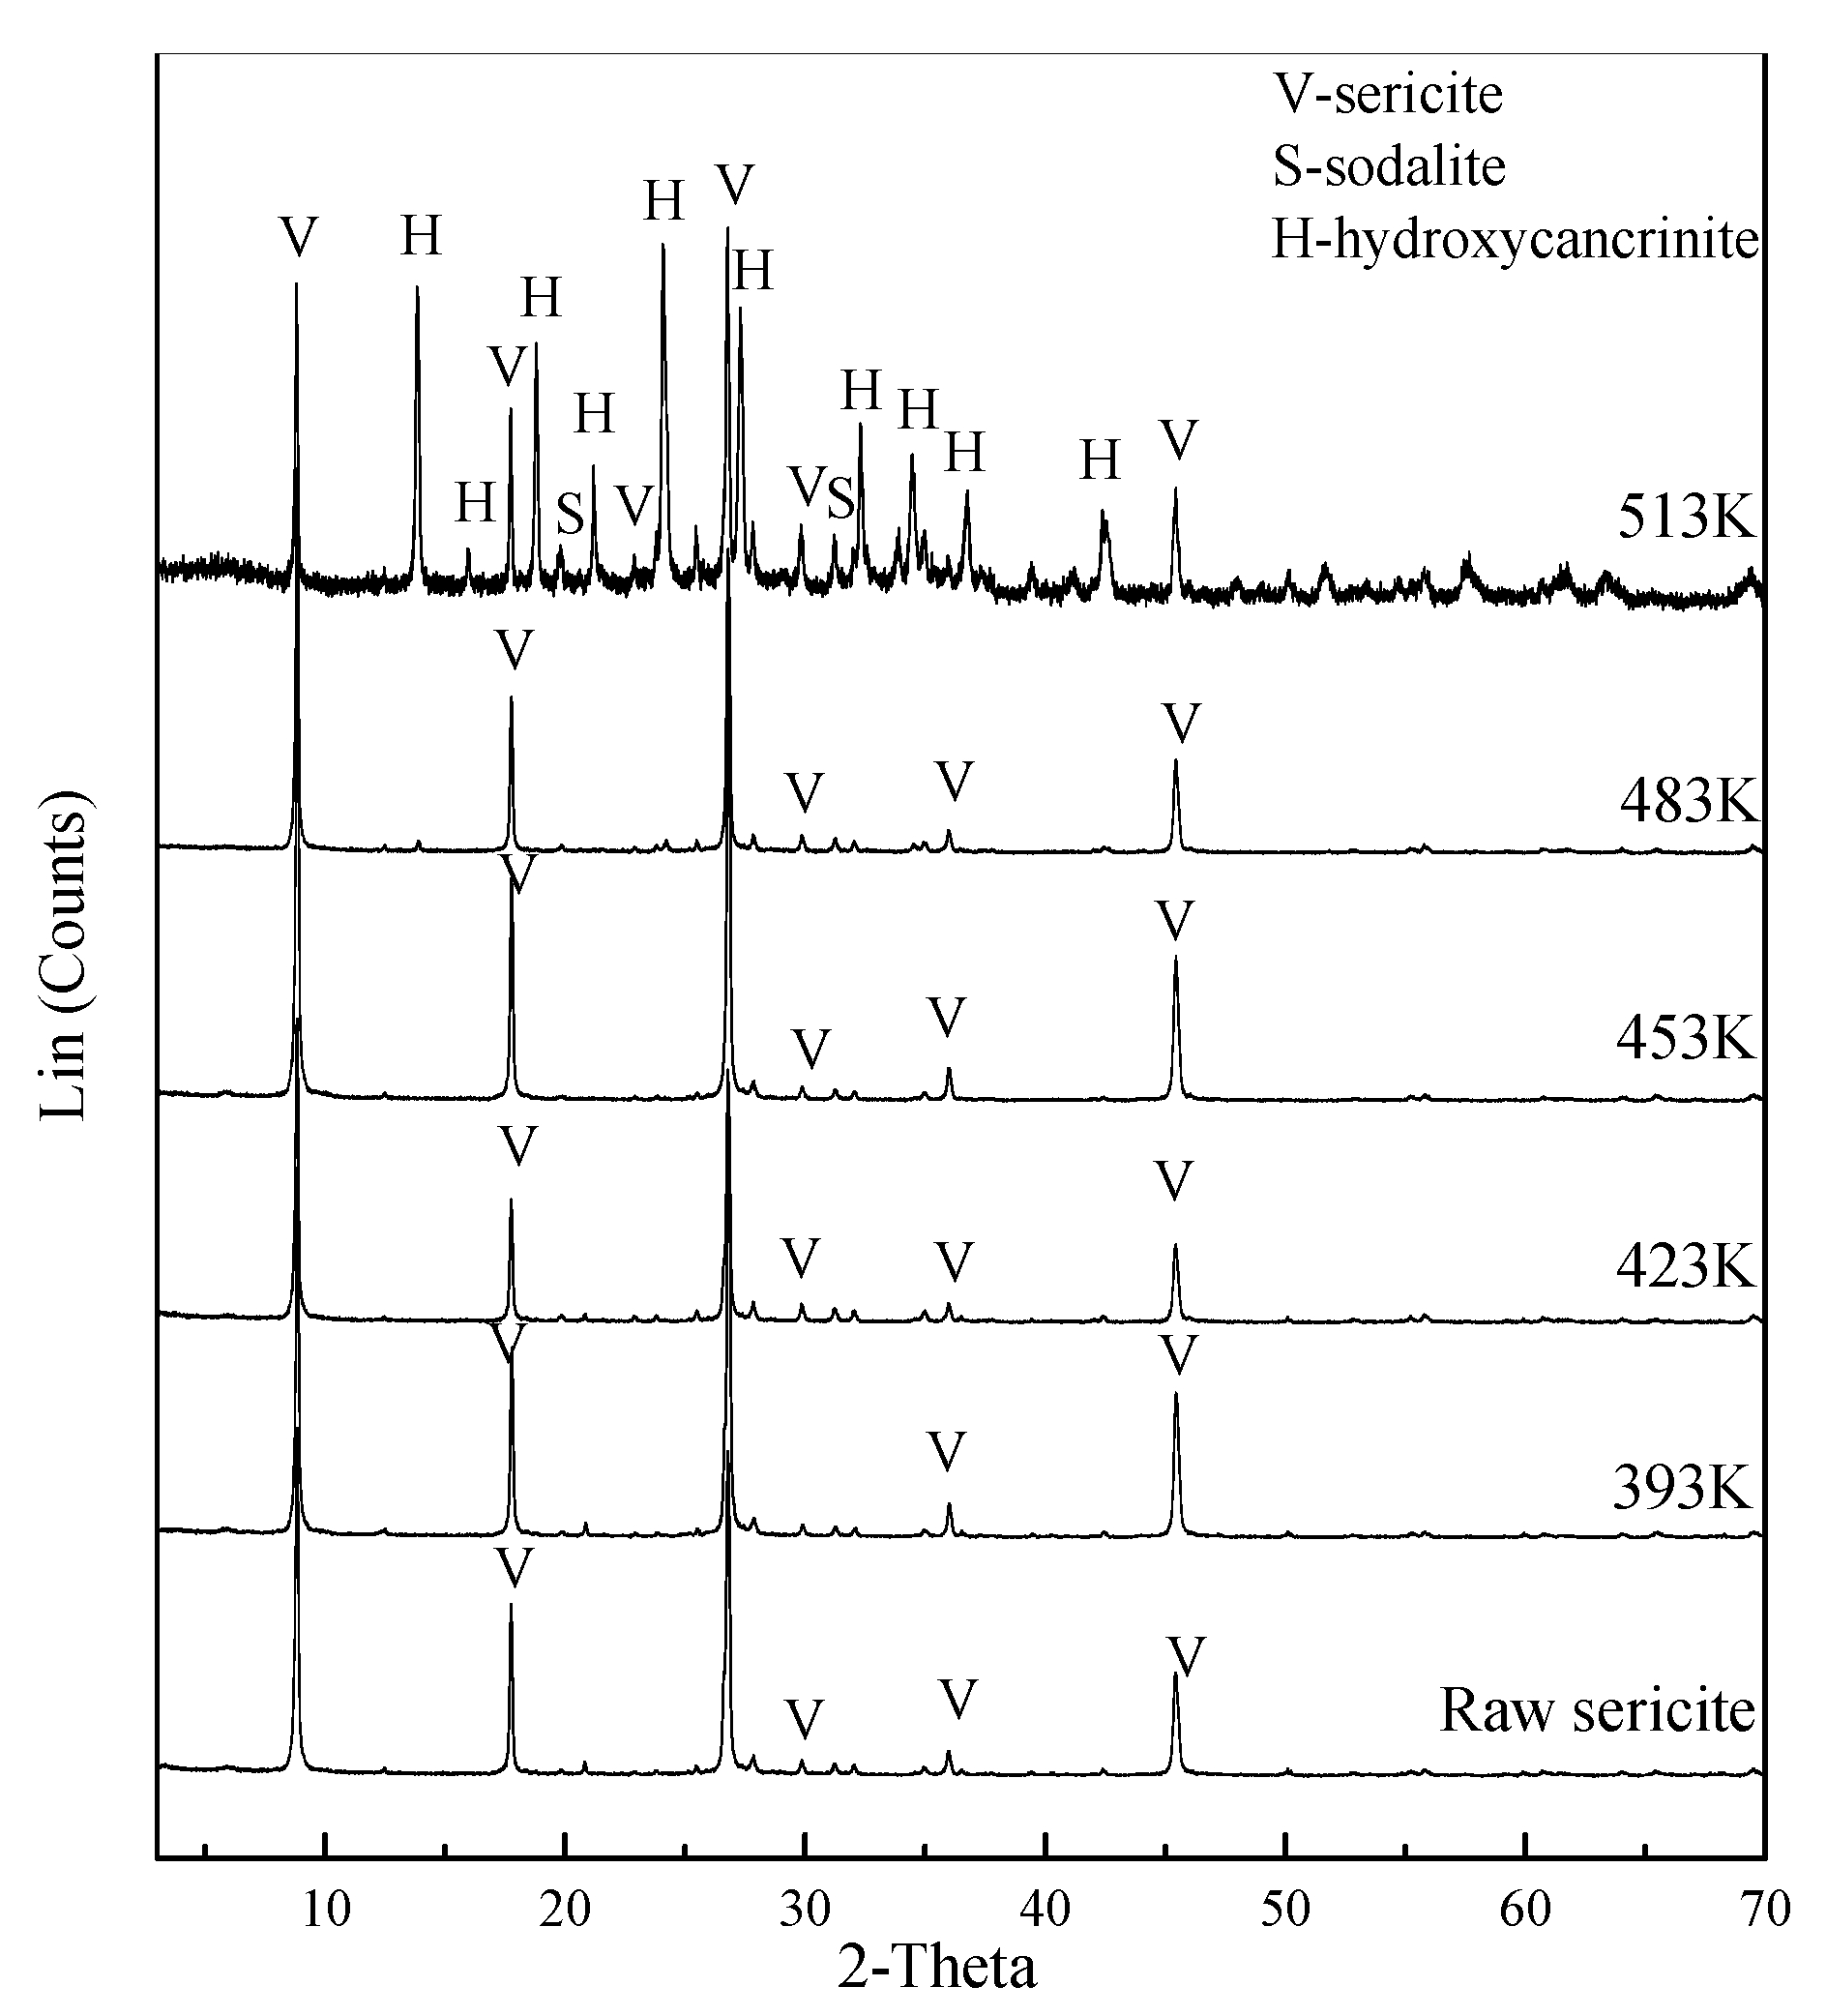
The XRD analysis of raw sericite and alkali-leached residue revealed the phase changes before and after the leaching process (Figure 3). Characteristic diffraction peaks of unreacted sericite, such as (002), (004), (006) and (008), were observed after the alkali leaching process. Characteristic diffraction peaks of the aluminosilicate phase were detected in the alkali-leached residue when the alkali leaching temperature was 513 K. At 513 K, hydroxycancrinite (Na14Al12Si13O516H2O, JCPDS 28-1036) and sodalite (Na7.66(Al6Si6O24)(HCO3)(CO3)0.58(H2O)4.02, JCPDS 70-5029) were detected. Alkali-leached residues treated with different NaOH concentrations and leaching times were also analyzed by XRD. The only difference was that hydroxycancrinite was the only aluminosilicate phase when the NaOH concentration exceeded 3 mol/L or when the alkali leaching time was longer than 1 h (shown in supplementary material).
Sericite dissolves in alkaline media to give rise to silica (SiO2(OH)2)2− and (SiO(OH)3)−, as well as aluminum [Al(OH)4]− monomers. These monomers can inter-react to yield an aluminosilicate, which precipitates in the form of Na2O–Al2O3–SiO2–H2O gel or zeolites. The aluminosilicate phase is a common equilibrium phase of the Na2O–Al2O3–SiO2–H2O system, which has been discovered in the deep desilication process of Bayer liquid [23,24,25,26]. The common aluminosilicates that form in alkaline solutions include sodalite, nepheline, cancrinite and noselite, collectively known as zeolites.
As seen in the XRD analysis, the aluminosilicates that formed in the alkaline solution were zeolites with Si/Al ≤ 1. The zeolite formation can be expressed as (Equation (5)) [27]:
where X can be , , , , respectively.
Silicate-based zeolites prepared through the hydrothermal synthesis method have been reported previously [28,29]. Different clay minerals were used as a starting material for zeolite synthesis: kaolinite, montmorillonite, bentonite, halloysite and interstratified illite-smectite. Although muscovite is seldom utilized, the utilization of illite with a similar T–O–T structure for zeolite synthesis has been reported previously [30]. The conditions for the hydrothermal synthesis of zeolites from natural illite through the fusion method were complicated and lengthy, i.e., the synthesis using specific molar ratios of Na2O/Al2O3, H2O/Na2O and SiO2/Al2O3; a 24 h gelification stage at room temperature; and a final crystallization stage (1, 2, 4, 6, 8, and 24 h) at different reaction temperatures (333, 363 and 383 K). The alkali leaching process in the current work only lasted a few hours, and the sericite was not activated in advance. Different types and crystallinities of aluminosilicate phases may precipitate together during the alkali leaching process. Zeolites are thermodynamically metastable [31]. Their nucleation and crystal growth are strongly affected by crystallization temperature and alkali concentration [32,33]. Changes in temperature and alkali concentration will both affect the crystal growth rate and nucleation rate of zeolites. Hence, the phase compositions of the alkali-leached residues in this work were metabolic under different conditions.
3.2.2. FTIR Analysis of Alkali-Leached Residue
The FTIR spectrum of the raw sericite and alkali-leached residue treated at different alkali leaching temperatures revealed changes in the functional groups before and after the alkali leaching process (Figure 4). The characteristic peak occurring at a frequency level of 3626 cm−1 indicated the O–H stretching in silanol (Si–OH) groups. A frequency band at 1018 cm−1 was ascribed to the asymmetric stretching vibrations of Si–O–Si in sericite [34,35]. Characteristic peaks emerged at 752 and 694 cm−1, indicating the deformation and bending in Si–O bonding. The peaks found at 532 and 471 cm−1 indicated the bending vibration between Al–O–Si and Si–O–Si. From the results, we can conclude that the functional groups of sericite were mainly composed of silanol (Si–OH) and aluminol (Al–OH) groups [36,37,38].
The spectra began to change significantly when the alkali leaching temperature was 513 K. After the alkali leaching process, the band derived from the OH groups at 3626 cm−1 almost disappeared, thereby indicating that the structure of sericite was destroyed under this condition. The strongest band located in the range of 1300−900 cm−1 was associated with the asymmetric stretching of the T–O–T bridges (v1), where T was tetrahedrally coordinated with the Si or Al atom [39]. For the alkali-leached residue leached at 513 K, the bands related to T–O–T bridges in this range were broadened, indicating that the solid phase became gradually amorphous [40]. Medium bands in the region of 850−650 cm−1 were essentially associated with the bend stretching of the T–O–T bridges (v2) mixed with symmetric stretching, which was split into two or three components. The actual position of the maximum and the shoulder is sensitive to the amount of Al(III) in the aluminosilicate framework [41]. When the Al(III) content is high, the position shifts down significantly. The presence of Na ions interacting with the oxygen atoms of T–O–T bridges may have an additional effect on the lowering of the position associated with vibrations. According to the XRD results, hydroxycancrinite was the main phase in the alkali-leached residue at 513 K. Compared to raw sericite, the Al(III) content and Na content declined and increased, respectively. This result is consistent with the results in Figure 4, which shows the positions for raw sericite at 831, 794, 752, and 694 cm−1 and for the alkali leached residue at 754, 687, 624, and 564 cm−1. Two other bands were observed in the range of 450−550 cm−1, which shifted down with the same trend as v2 (positions for raw sericite at 532 and 471 cm−1 and for the alkali-leached residue at 462 and 423 cm−1). The alkali-leached residues treated with different alkali concentrations and alkali leaching times were also analyzed by FTIR (shown in supplementary material).
3.2.3. SEM-EDS Analysis of Alkali-Leached Residue
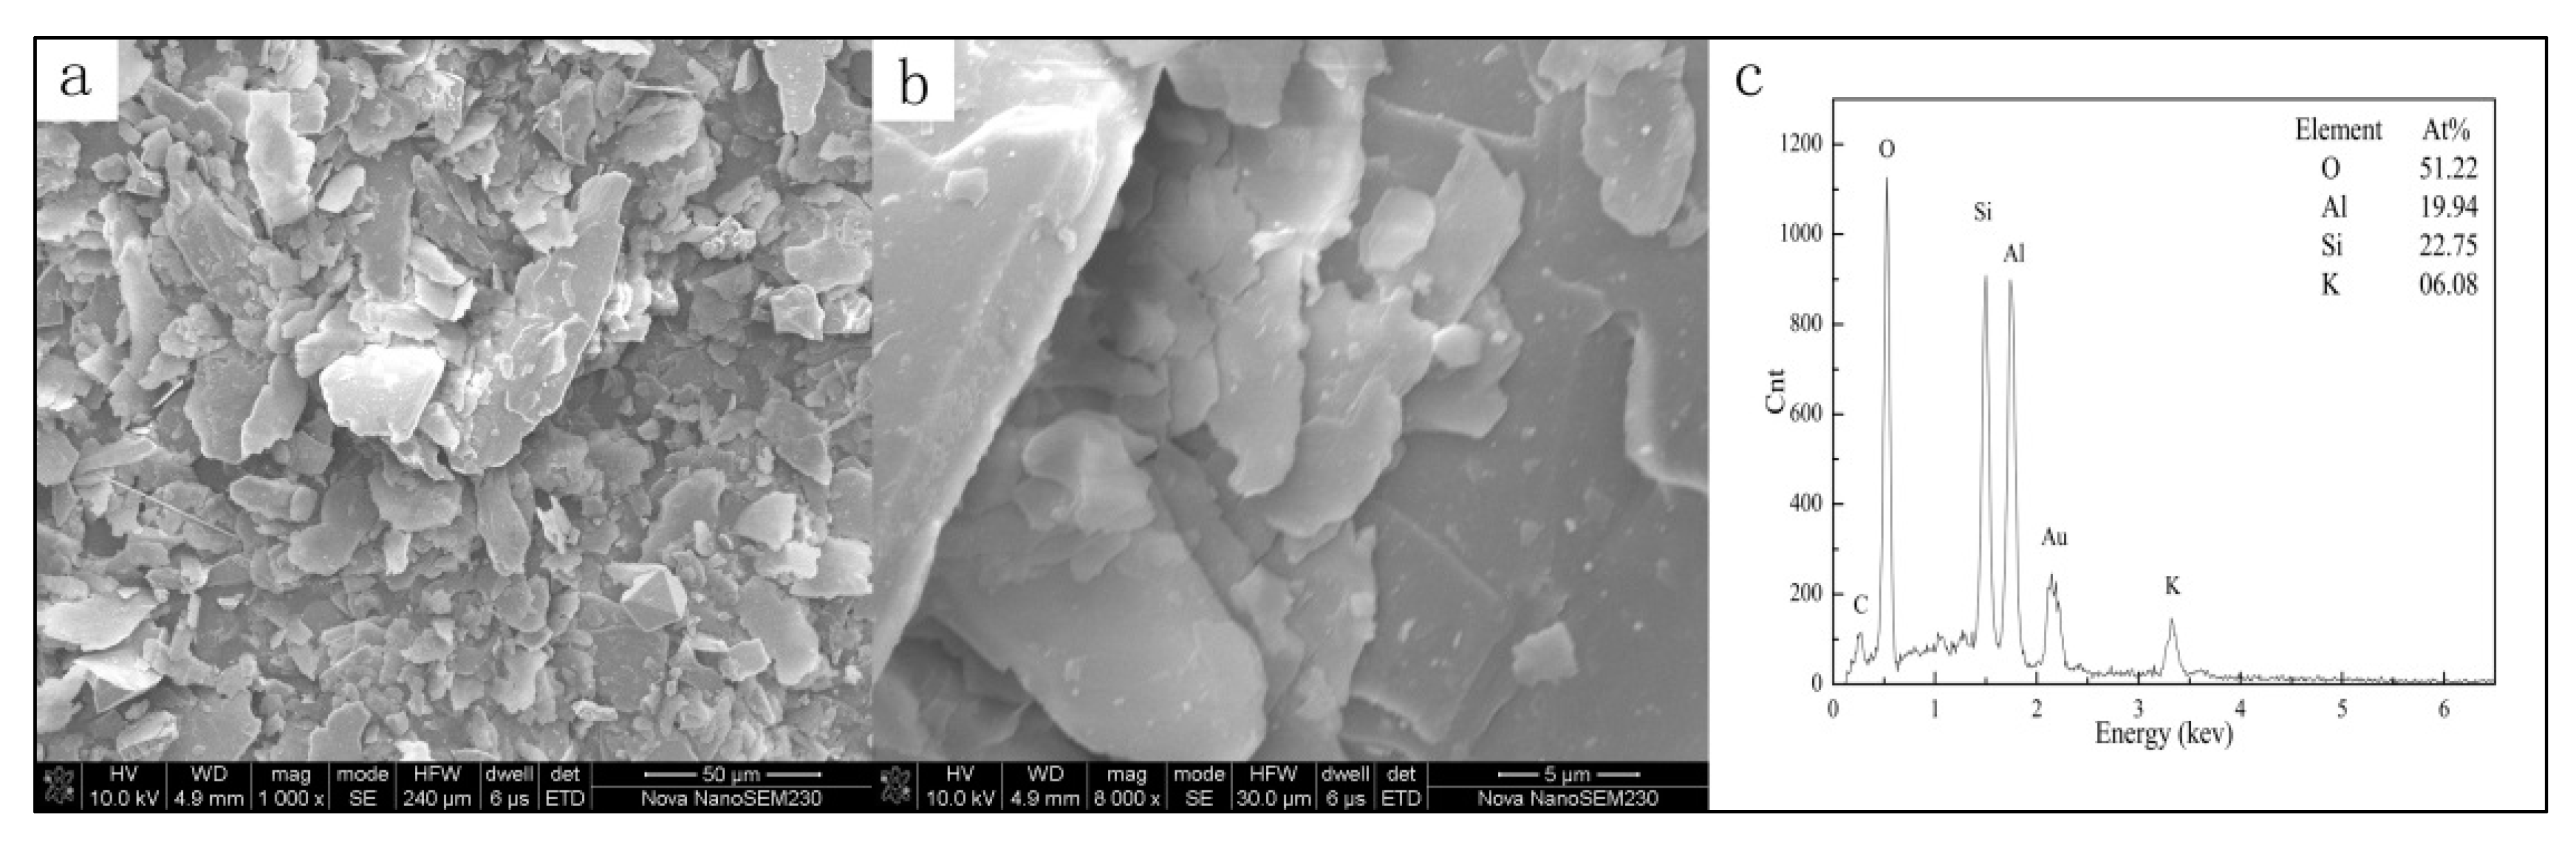
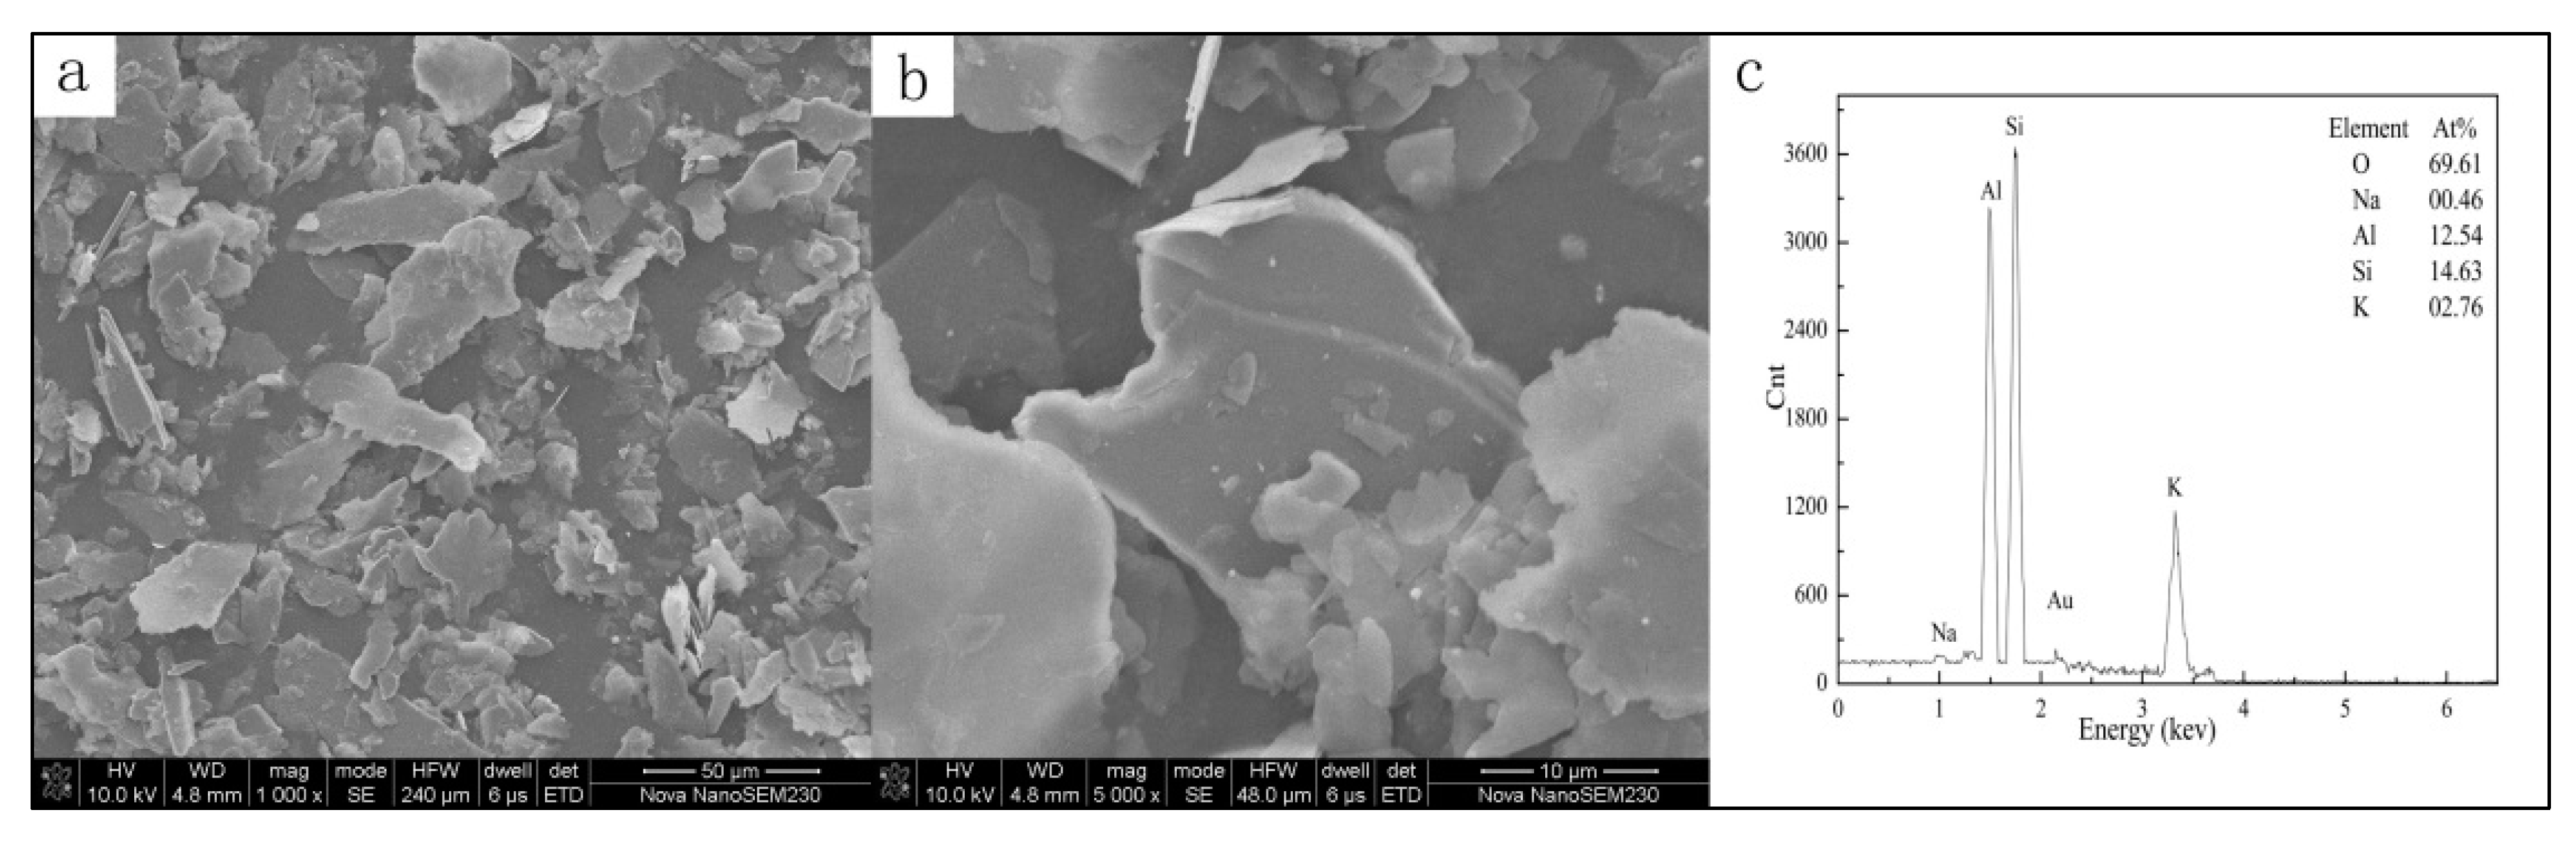
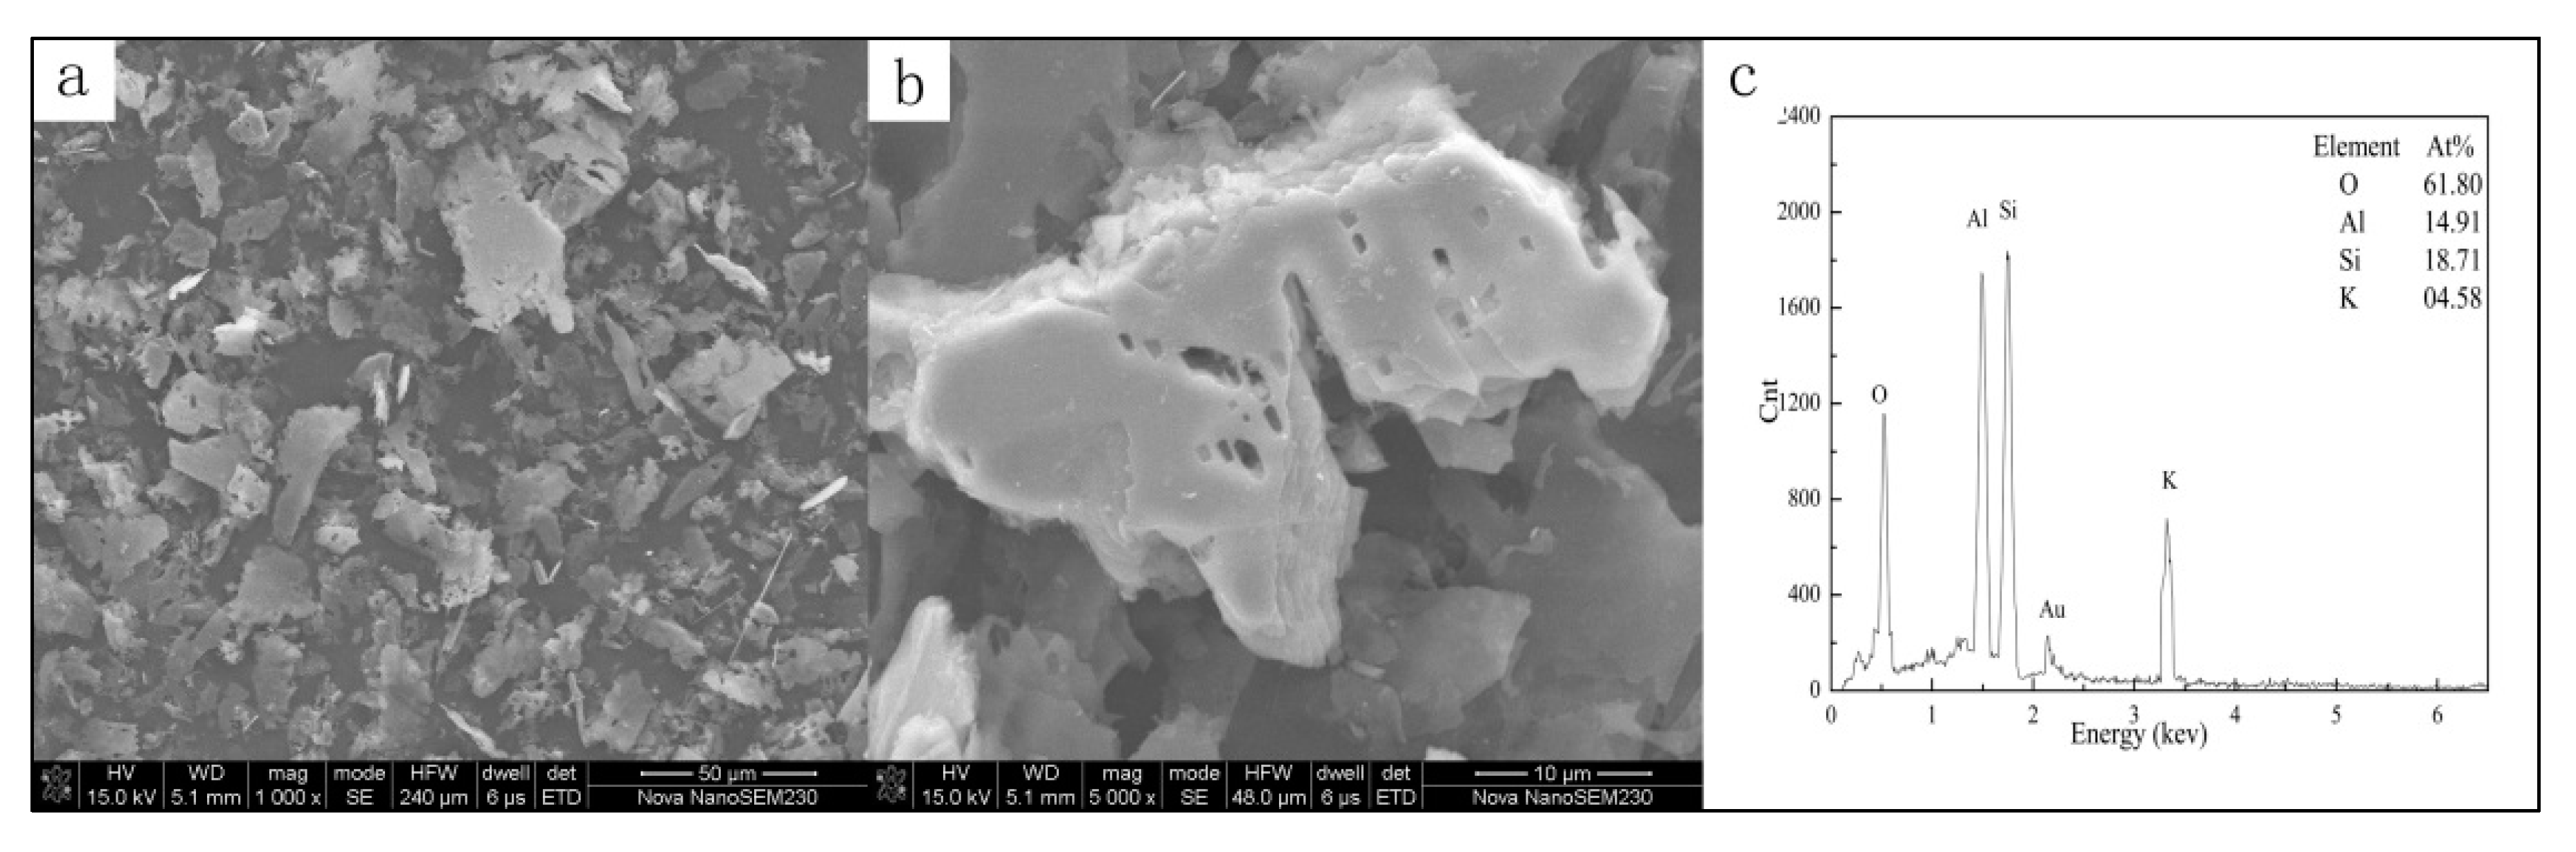
The SEM-EDS analysis of raw sericite and alkali-leached residue with different leaching conditions revealed the morphological changes before and after alkali leaching (Figure 5, Figure 6, Figure 7 and Figure 8). Alhough the particulates leached at 453 K (Figure 6a,b) retained their plate-like shape similar to the raw sericite particulates (Figure 5a,b), the edges of the particles in Figure 6a,b were coarse and irregular. Based on the in EDS patterns (Figure 5c and Figure 6c), trace amounts of Na were detected in the alkali-leached residue, and the K content decreased obviously, indicating that sericite reacted slightly with NaOH. Tiny hexagonal hydroxycancrinite needles and plate-like particulates were observed in the alkali-leached residue treated at 513 K (Figure 7a,b). Notably, the alkali-leached residue with needle-like morphology similar to that of the one-dimensional silica prepared from chrysotile [42] may have the potential to be used as a type of new material. An abundance of Na was detected by EDS analysis, along with the disappearance of K (Figure 7c). The SEM-EDS analysis of the residue leached at 513 K with 3 mol/L NaOH for 2 h was also conducted. The particle shape (tiny, hexagonal and plate-like) had no observable change, despite the alkali leaching time being doubled. Aggregations of cancrinite columns were observed in the residue leached with 6 mol/L NaOH (Figure 8a,b) and the results of the elemental analysis (Figure 8c) were similar to those in Figure 7c. Hydroxycancrinite belongs to the cancrinite framework in the ABC-6 family. The crystal structure of hydroxycancrinite is similar to a synthetic “basic cancrinite”, with lattice parameters a = 12.740(3) and c = 5.182(2) Å, and space group of P3 [43]. Compared to the standard, highly symmetric hexagonal cancrinite, the crystallinity of hydroxycancrinite formed in the alkali leaching process was incomplete.
3.3. Analysis of Acid-Leached Residue
About 25 wt % solid residue remained after hydrochloric acid leaching when the alkali leaching temperature, NaOH concentration and alkali leaching time were 513 K, 3 mol/L, and 1 h, respectively. The amount of acid-leached residue was mainly affected by the alkali leaching temperature and alkali concentration; it varied from 3% to 95%. The color of the residue was close to that of the raw sericite material. The SEM-EDS analysis of the acid-leached residue revealed the morpholical changes before and after the acid leaching process (Figure 9a,b). Different sizes of quadrate etch pits were observed on the particle surface. No aluminosilicate phase could be found in the acid-leached residue. The EDS analysis also proved that no Na existed in the acid-leached residue (Figure 9c). The SEM-EDS analysis of residue leached at 513 K with 3 mol/L NaOH for 2 h was also conducted. The particle shape (tiny hexagonal and plate-like) exhibited no obvious change even after the alkali leaching time was doubled. Kuwahara [44] studied the dissolution behavior of muscovite under alkaline conditions at 298 K−323 K by situ atomic force microscopy. The dissolution of muscovite took place only at the edge of surfaces, less than a few percent of the total surface area, whereas the basal surfaces were completely unreactive. In the current research, a similar regularity was demonstrated, with dissolution occurring in certain positions on the surface and expanding the surrounding etch pits. As proven by the SEM-EDS analysis, the aluminosilicate phase generated during the alkali leaching process was dissolved in acidic solution. Taking sodalite as an example, the dissolution mechanism of aluminosilicate in the HCl solution is suggested to be (Equation (6)) as follows [45]:
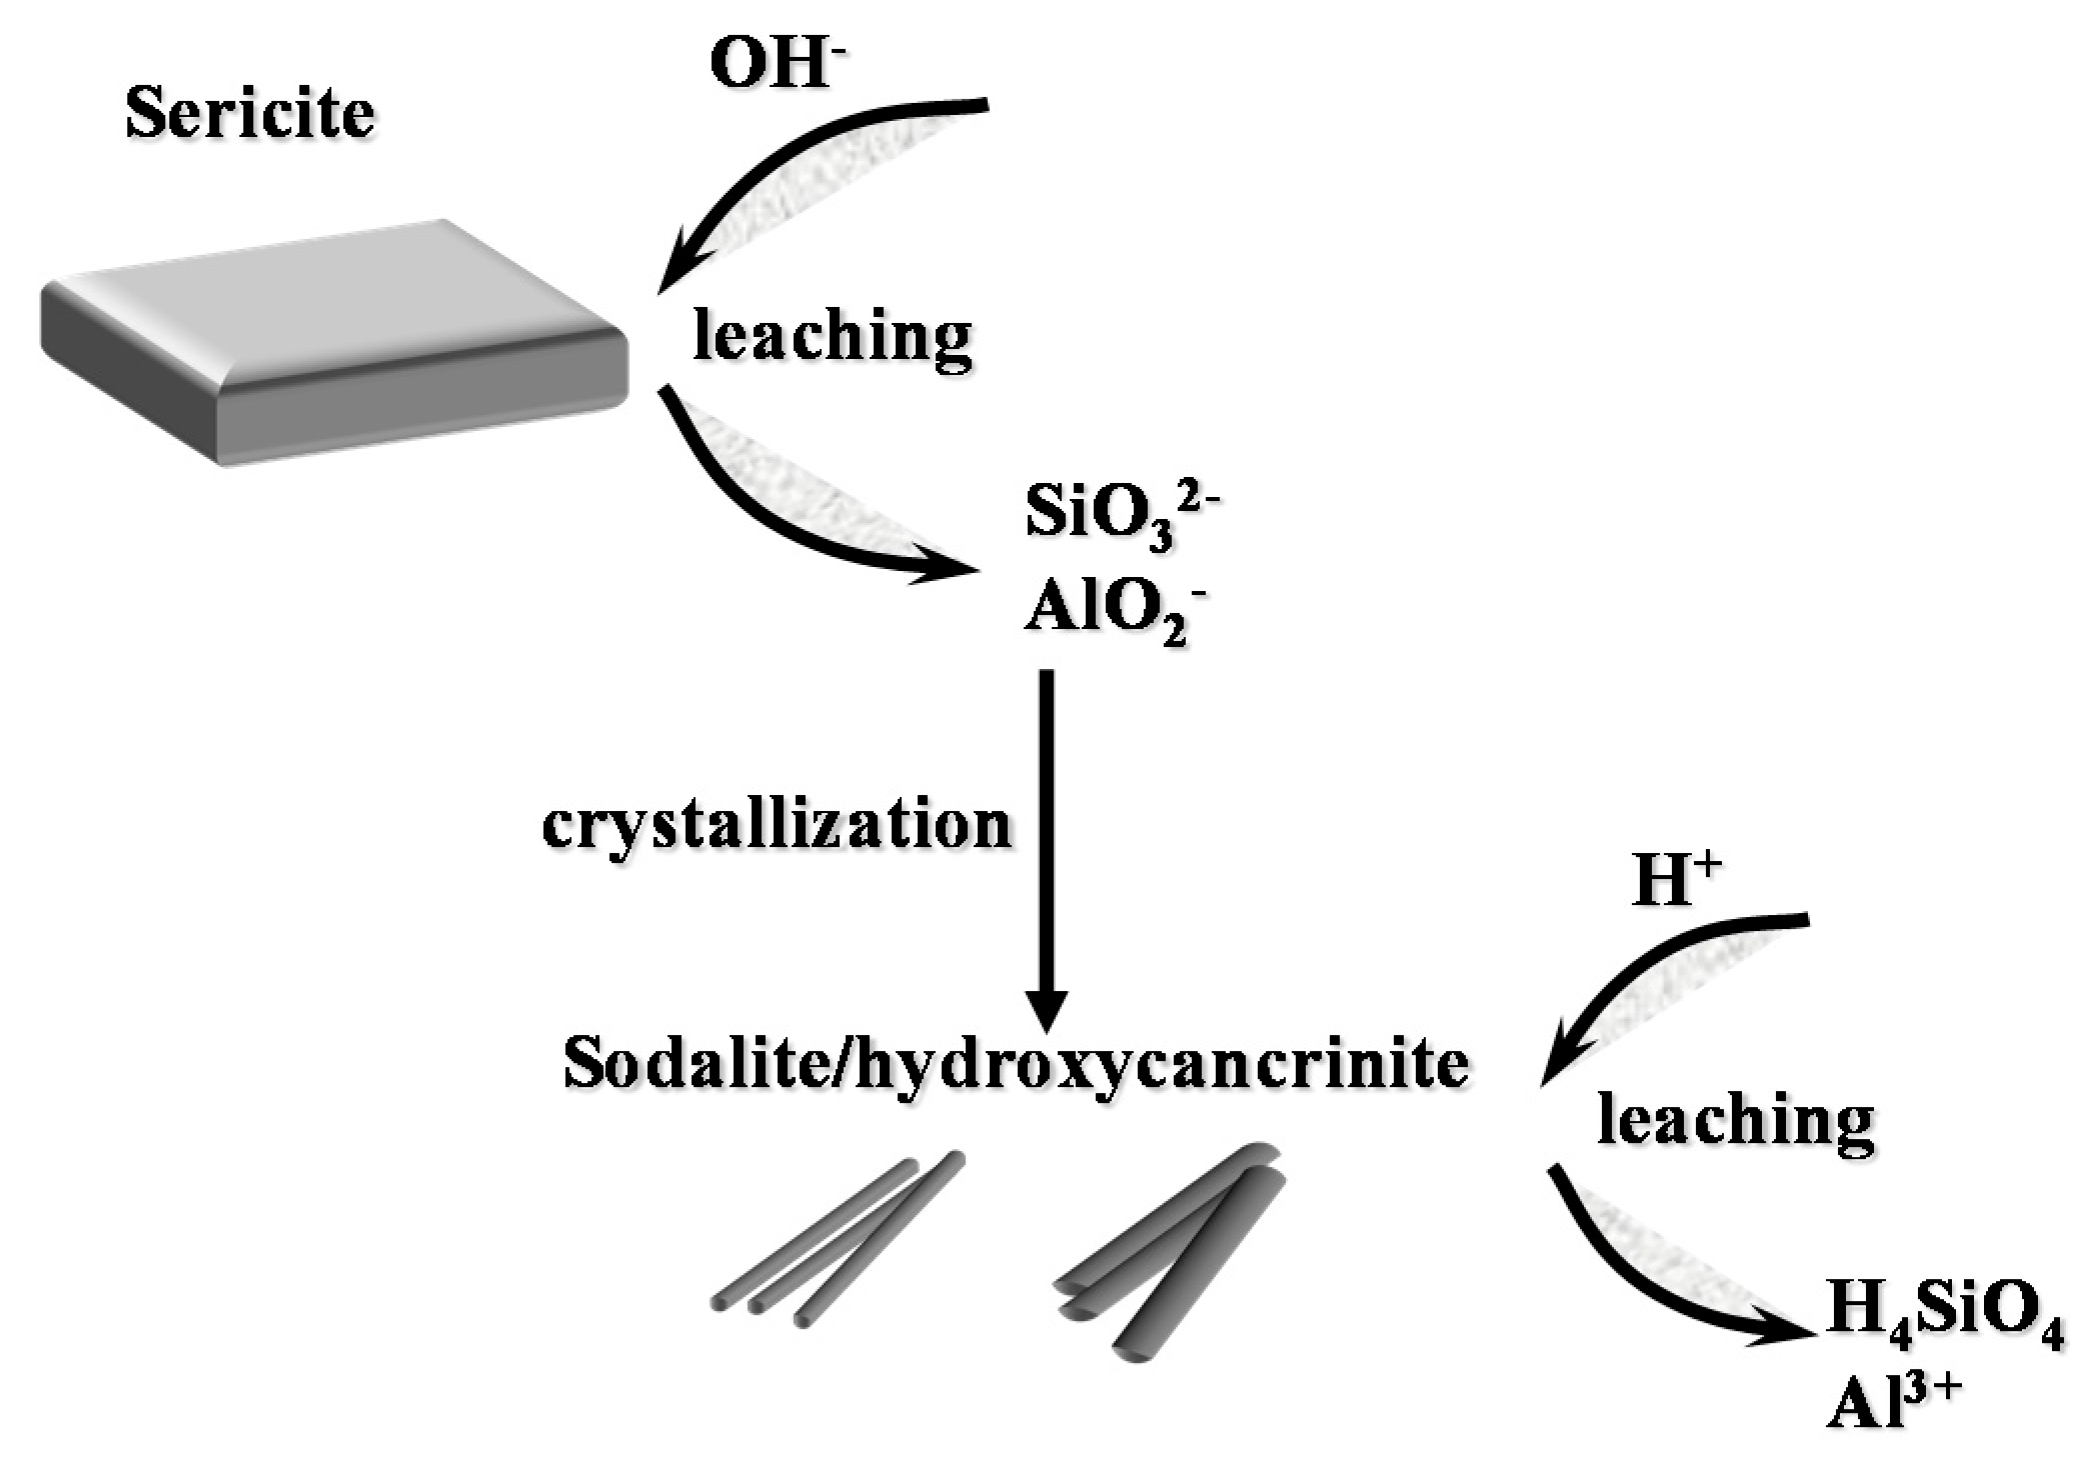
According to the properties mentioned above (Equations (4)–(6)), sericite is dissolved by alkali-acid leaching. The whole dissolution process of sericite by alkali-acid leaching is shown in Figure 10 step by step.
4. Conclusions
The dissolution behavior and mechanism of sericite in alkali-acid leaching were investigated in this work. Alkali leaching tests showed that silicon extraction of sericite was mainly affected by the alkali leaching temperature, sodium hydroxide concentration, and alkali leaching time. Increasing the alkali leaching temperature, alkali concentration and alkali leaching time increased the solubility of sericite. Sericite was almost completely dissolved in the alkali-acid leaching process under the test conditions.
Depending on the XRD, FTIR, and SEM-EDS analyses of the alkali-leached and acid-leached residues, the dissolution mechanism of sericite in alkali-acid leaching could be described as a three-stage process. First, the sericite was dissolved in the alkaline solution during the alkali leaching process. Second, the dissolved silicate and aluminate reacted with each other and formed new aluminosilicate phases. Third, the aluminosilicate phases were dissolved in hydrochloric acid solution during the acid leaching process.
Supplementary Materials
The following are available online at www.mdpi.com/2075-163X/7/10/196/s1, Figure S1: XRD analysis of alkali-leached residue treated with different alkali concentration, Figure S2: XRD analysis of alkali-leached residue treated with different alkali leaching time, Figure S3: FTIR spectrum of alkali-leached residue treated with different alkali concentration, Figure S4: FTIR spectrum of alkali-leached residue treated with different alkali leaching time.
Acknowledgments
This work was financially supported by the National Natural Science Foundation of China (No. 51774330), the Teacher Research Foundation of Central South University (2015), the Hunan Provincial Natural Science Foundation of China (No. 13JJ4015), and the Natural Science Basic Research Plan in Shaanxi Province of China (No. 2016JM5089).
Author Contributions
Kun Liu and Qiming Feng conceived and designed the experiments; Hao Wang performed the experiments and analyzed the data; Kun Liu and Qiming Feng contributed reagents/materials/analysis tools. All authors wrote the paper.
Conflicts of Interest
The authors declare no conflict of interest.
References
- Wang, X.; Gai, G.S.; Yang, Y.F.; Shen, W.C. Preparation of natural microcrystalline graphite with high sphericity and narrow size distribution. Powder Technol. 2008, 181, 51–56. [Google Scholar] [CrossRef]
- Song, S.H.; Jeong, H.K.; Kang, Y.G.; Cho, C.T. Physical and thermal properties of acid-graphite/styrene-butadiene-rubber nanocomposites. Korean J. Chem. Eng. 2010, 27, 1296–1300. [Google Scholar] [CrossRef]
- Vilar, E.O.; Cavalcanti, E.B.; Carvalho, H.R.; Sousa, F.B. Cr(VI) electrochemical reduction using RVG 4OOO graphite felt as the electrode. Braz. J. Chem. Eng. 2003, 20, 291–303. [Google Scholar] [CrossRef]
- Li, H.; Feng, Q.; Ou, L.; Long, S.; Cui, M.; Weng, X. Study on washability of microcrystal graphite using float-sink tests. Int. J. Min. Sci. Technol. 2013, 23, 855–861. [Google Scholar] [CrossRef]
- Wang, H.; Feng, Q.; Liu, K. The dissolution behavior and mechanism of kaolinite in alkali-acid leaching process. Appl. Clay Sci. 2016, 132–133, 273–280. [Google Scholar] [CrossRef]
- Chelgani, S.C.; Rudolph, M.; Kratzsch, R.; Sandmann, D.; Gutzmer, J. A review of graphite beneficiation techniques. Min. Proc. Ext. Met. Rev. 2016, 37, 58–68. [Google Scholar] [CrossRef]
- Shih, Y.J.; Shen, Y.H. Swelling of sericite by LiNO3-hydrothermal treatment. Appl. Clay Sci. 2009, 43, 282–288. [Google Scholar] [CrossRef]
- Tiwari, D.; Lalhmunsiama; Choi, S.I.; Lee, S.M. Activated sericite: An efficient and effective natural clay material for attenuation of cesium from aquatic environment. Pedosphere 2014, 24, 731–742. [Google Scholar] [CrossRef]
- Lee, S.M.; Tiwari, D. Organo and inorgano–organo-modified clays in the remediation of aqueous solutions: An overview. Appl. Clay Sci. 2012, 59–60, 84–102. [Google Scholar] [CrossRef]
- Li, Y.; Steefel, C.I. Kaolinite dissolution and precipitation kinetics at 22 °C and pH 4. Geochim. Cosmochim. Acta 2008, 72, 99–116. [Google Scholar]
- Knauss, K.G.; Wolery, T.J. Muscovite dissolution kinetics as a function of pH and time at 70 °C. Geochim. Cosmochim. Acta 1989, 53, 1493–1501. [Google Scholar] [CrossRef]
- Kalinowski, B.E.; Schweda, P. Kinetics of muscovite, phlogopite, and biotite dissolution and alteration at pH 1–4, room temperature. Geochim. Cosmochim. Acta 1996, 60, 367–385. [Google Scholar] [CrossRef]
- Cama, J.; Ganor, J. Dissolution Kinetics of Clay Minerals; Elsevier Ltd.: Amsterdam, The Netherlands, 2015; Chapter 4; Volume 8–9, pp. 1–6. [Google Scholar]
- Oelkers, E.H.; Schott, J.; Gauthier, J.M.; Herrero-Roncal, T. An experimental study of the dissolution mechanism and rates of muscovite. Geochim. Cosmochim. Acta 2008, 72, 4948–4961. [Google Scholar] [CrossRef]
- Yu, X.; Chen, J.; Ma, X.; Yang, D. Impurity engineering of Czochralski silicon. Mater. Sci. Eng. R Rep. 2013, 74, 1–33. [Google Scholar] [CrossRef]
- Lenchuk, O.; Rohrer, J.; Albe, K. Solubility of zirconium and silicon in molybdenum studied by first-principles calculations. Scripta Mater. 2015, 97, 1–4. [Google Scholar] [CrossRef]
- Hairi, S.N.M.; Jameson, G.N.L.; Rogers, J.J.; MacKenzie, K.J.D. Synthesis and properties of inorganic polymers (geopolymers) derived from Bayer process residue (red mud) and bauxite. J. Mater. Sci. 2015, 50, 7713–7724. [Google Scholar] [CrossRef]
- Okudan, M.D.; Akcil, A.; Tuncuk, A.; Deveci, H. Recovery of gallium and aluminum from electrofilter dust of alumina calcination plant in bayer process. Sep. Sci. Technol. 2015, 50, 2596–2605. [Google Scholar] [CrossRef]
- Liu, Z.; Li, W.; Ma, W.; Yin, Z.; Wu, G. Conversion of sulfur by wet oxidation in the bayer process. Metall. Mater. Trans. B 2015, 46, 1702–1708. [Google Scholar] [CrossRef]
- Gladyshev, S.V.; Akcil, A.; Abdulvaliyev, R.A.; Tastanov, E.A.; Beisembekova, K.O.; Temirova, S.S.; Deveci, H. Recovery of vanadium and gallium from solid waste by-products of Bayer process. Miner. Eng. 2015, 74, 91–98. [Google Scholar] [CrossRef]
- Crundwell, F.K. The dissolution and leaching of minerals: Mechanisms, myths and misunderstandings. Hydrometallurgy 2013, 139, 132–148. [Google Scholar] [CrossRef]
- Crundwell, F.K. The mechanism of dissolution of minerals in acidic and alkaline solutions: Part II Application of a new theory to silicates, aluminosilicates and quartz. Hydrometallurgy 2014, 149, 265–275. [Google Scholar] [CrossRef]
- Khajavi, S.; Kapteijn, F.; Jansen, J.C. Synthesis of thin defect-free hydroxy sodalite membranes: New candidate for activated water permeation. J. Membr. Sci. 2007, 299, 63–72. [Google Scholar] [CrossRef]
- Smith, P. The processing of high silica bauxites—Review of existing and potential processes. Hydrometallurgy 2009, 98, 162–176. [Google Scholar] [CrossRef]
- Samal, S.; Ray, A.K.; Bandopadhyay, A. Proposal for resources, utilization and processes of red mud in India—A review. Int. J. Miner. Process. 2013, 118, 43–55. [Google Scholar] [CrossRef]
- Liu, Y.; Naidu, R. Hidden values in bauxite residue (red mud): Recovery of metals. Waste Manag. 2014, 34, 2662–2673. [Google Scholar] [CrossRef] [PubMed]
- Barnes, M.C.; Addai-Mensah, J.; Gerson, A.R. The kinetics of desilication of synthetic spent Bayer liquor seeded with cancrinite and cancrinite/sodalite mixed-phase crystals. J. Cryst. Growth 1999, 200, 251–264. [Google Scholar] [CrossRef]
- Pan, F.; Lu, X.; Wang, Y.; Chen, S.; Wang, T.; Yan, Y. Organic template-free synthesis of ZSM-5 zeolite from coal-series kaolinite. Mater. Lett. 2014, 115, 5–8. [Google Scholar] [CrossRef]
- Wang, H.; Feng, Q.; Liu, K.; Li, Z.; Tang, X. Highly efficient fluoride adsorption from aqueous solution by nepheline prepared from kaolinite through alkali-hydrothermal process. J. Environ. Manag. 2017, 196, 72–79. [Google Scholar] [CrossRef] [PubMed]
- Mezni, M.; Hamzaoui, A.; Hamdi, N.; Srasra, E. Synthesis of zeolites from the low-grade Tunisian natural illite by two different methods. Appl. Clay Sci. 2011, 52, 209–218. [Google Scholar] [CrossRef]
- Novembre, D.; Sabatino, B.D.; Gimeno, D. Synthesis of Na-A zeolite from 10 Å halloysite and a new crystallization kinetic model for the transformation of Na-A into HS zeolite. Clays Clay Miner. 2005, 53, 28–36. [Google Scholar] [CrossRef]
- Rios, C.A.; Williams, C.D.; Fullen, M.A. Nucleation and growth history of zeolite LTA synthesized from kaolinite by two different methods. Appl. Clay Sci. 2009, 42, 446–454. [Google Scholar] [CrossRef]
- Johnson, C.D.; Mallon, A.J.; Worrall, F. Adhered zeolite preparation on and within a muscovite mica by hydrothermal growth. Clays Clay Miner. 2006, 54, 678–688. [Google Scholar] [CrossRef]
- Tang, X.; Feng, Q.; Liu, K.; Li, Z.; Wang, H. Fabrication of magnetic Fe3O4/silica nanofiber composites with enhanced Fenton-like catalytic performance for Rhodamine B degradation. J. Mater. Sci. 2018, 53, 369–384. [Google Scholar] [CrossRef]
- Tang, X.; Feng, Q.; Liu, K.; Luo, X.; Huang, J.; Li, Z. A simple and innovative route to remarkably enhance the photocatalytic performance of TiO2: Using micro-meso porous silica nanofibers as carrier to support highly-dispersed TiO2 nanoparticles. Micropor. Mesopor. Mater. 2018, 258, 251–261. [Google Scholar] [CrossRef]
- Tiwari, D.; Lee, S.M. Novel hybrid materials in the remediation of ground waters contaminated with As(III) and As(V). Chem. Eng. J. 2012, 204–206, 23–31. [Google Scholar] [CrossRef]
- Kim, J.O.; Lee, S.M.; Jeon, C. Adsorption characteristics of sericite for cesium ions from an aqueous solution. Chem. Eng. Res. Des. 2014, 92, 368–374. [Google Scholar] [CrossRef]
- Kwon, T.N.; Jeon, C. Adsorption characteristics of sericite for nickel ions from industrial waste water. J. Ind. Eng. Chem. 2013, 19, 68–72. [Google Scholar] [CrossRef]
- Astorino, E.; Peri, J.B.; Willey, R.J.; Busca, G. Spectroscopic characterization of silicalite-1 and titanium silicalite-1. J. Catal. 1995, 157, 482–500. [Google Scholar] [CrossRef]
- Król, M.; Minkiewicz, J.; Mozgawa, W. IR spectroscopy studies of zeolites in geopolymeric materials derived from kaolinite. J. Mol. Struct. 2016, 1126, 200–206. [Google Scholar] [CrossRef]
- Phung, T.K.; Carnasciali, M.M.; Finocchio, E.; Busca, G. Catalytic conversion of ethyl acetate over faujasite zeolites. Appl. Catal. A Gen. 2014, 470, 72–80. [Google Scholar] [CrossRef]
- Tang, X.; Feng, Q.; Liu, K.; Tan, Y. Synthesis and characterization of a novel nanofibrous TiO2/SiO2 composite with enhanced photocatalytic activity. Mater. Lett. 2016, 183, 175–178. [Google Scholar] [CrossRef]
- Oh, J.E.; Clark, S.M.; Monteiro, P.J.M. Determination of the bulk modulus of hydroxycancrinite, a possible zeolitic precursor in geopolymers, by high-pressure synchrotron X-ray diffraction. Cem. Concr. Compos. 2011, 33, 1014–1019. [Google Scholar] [CrossRef]
- Kuwahara, Y. In situ observations of muscovite dissolution under alkaline conditions at 25–50 °C by AFM with an air/fluid heater system. Am. Mineral. 2008, 93, 1028–1033. [Google Scholar] [CrossRef]
- Liang, W.; Couperthwaite, S.J.; Kaur, G.; Yan, C.; Johnstone, D.W.; Millar, G.J. Effect of strong acids on red mud structural and fluoride adsorption properties. J. Colloid Interface Sci. 2014, 423, 158–165. [Google Scholar] [CrossRef] [PubMed]
Figure 1.
Process flow of alkali leaching-acid leaching of sericite.

Figure 2.
Effect of (a) alkali leaching temperature; (b) alkali concentration and (c) leaching time on dissolution of sericite.
Figure 2.
Effect of (a) alkali leaching temperature; (b) alkali concentration and (c) leaching time on dissolution of sericite.
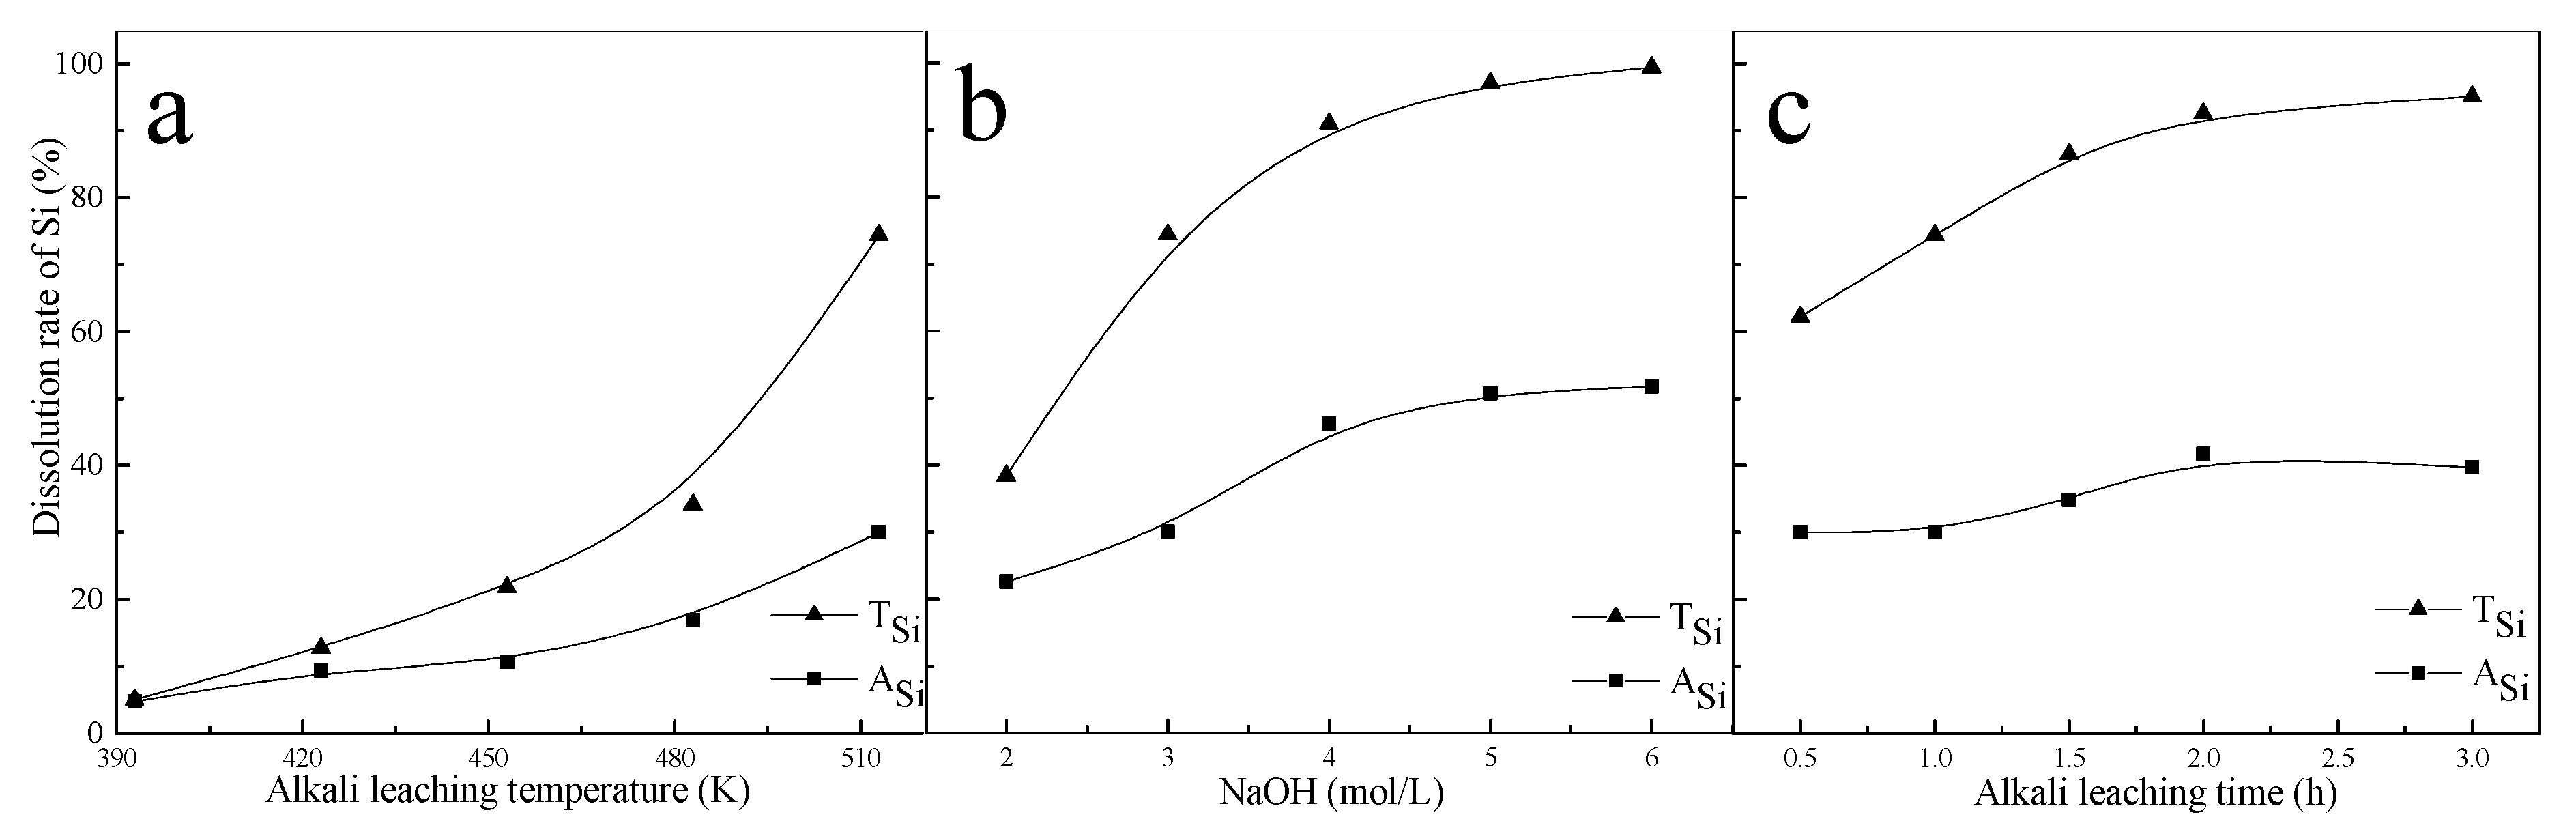
Figure 3.
XRD analysis of alkali-leached residue treated at different alkali leaching temperatures.

Figure 4.
FTIR spectrum of alkali leached residue treated at different alkali leaching temperature.
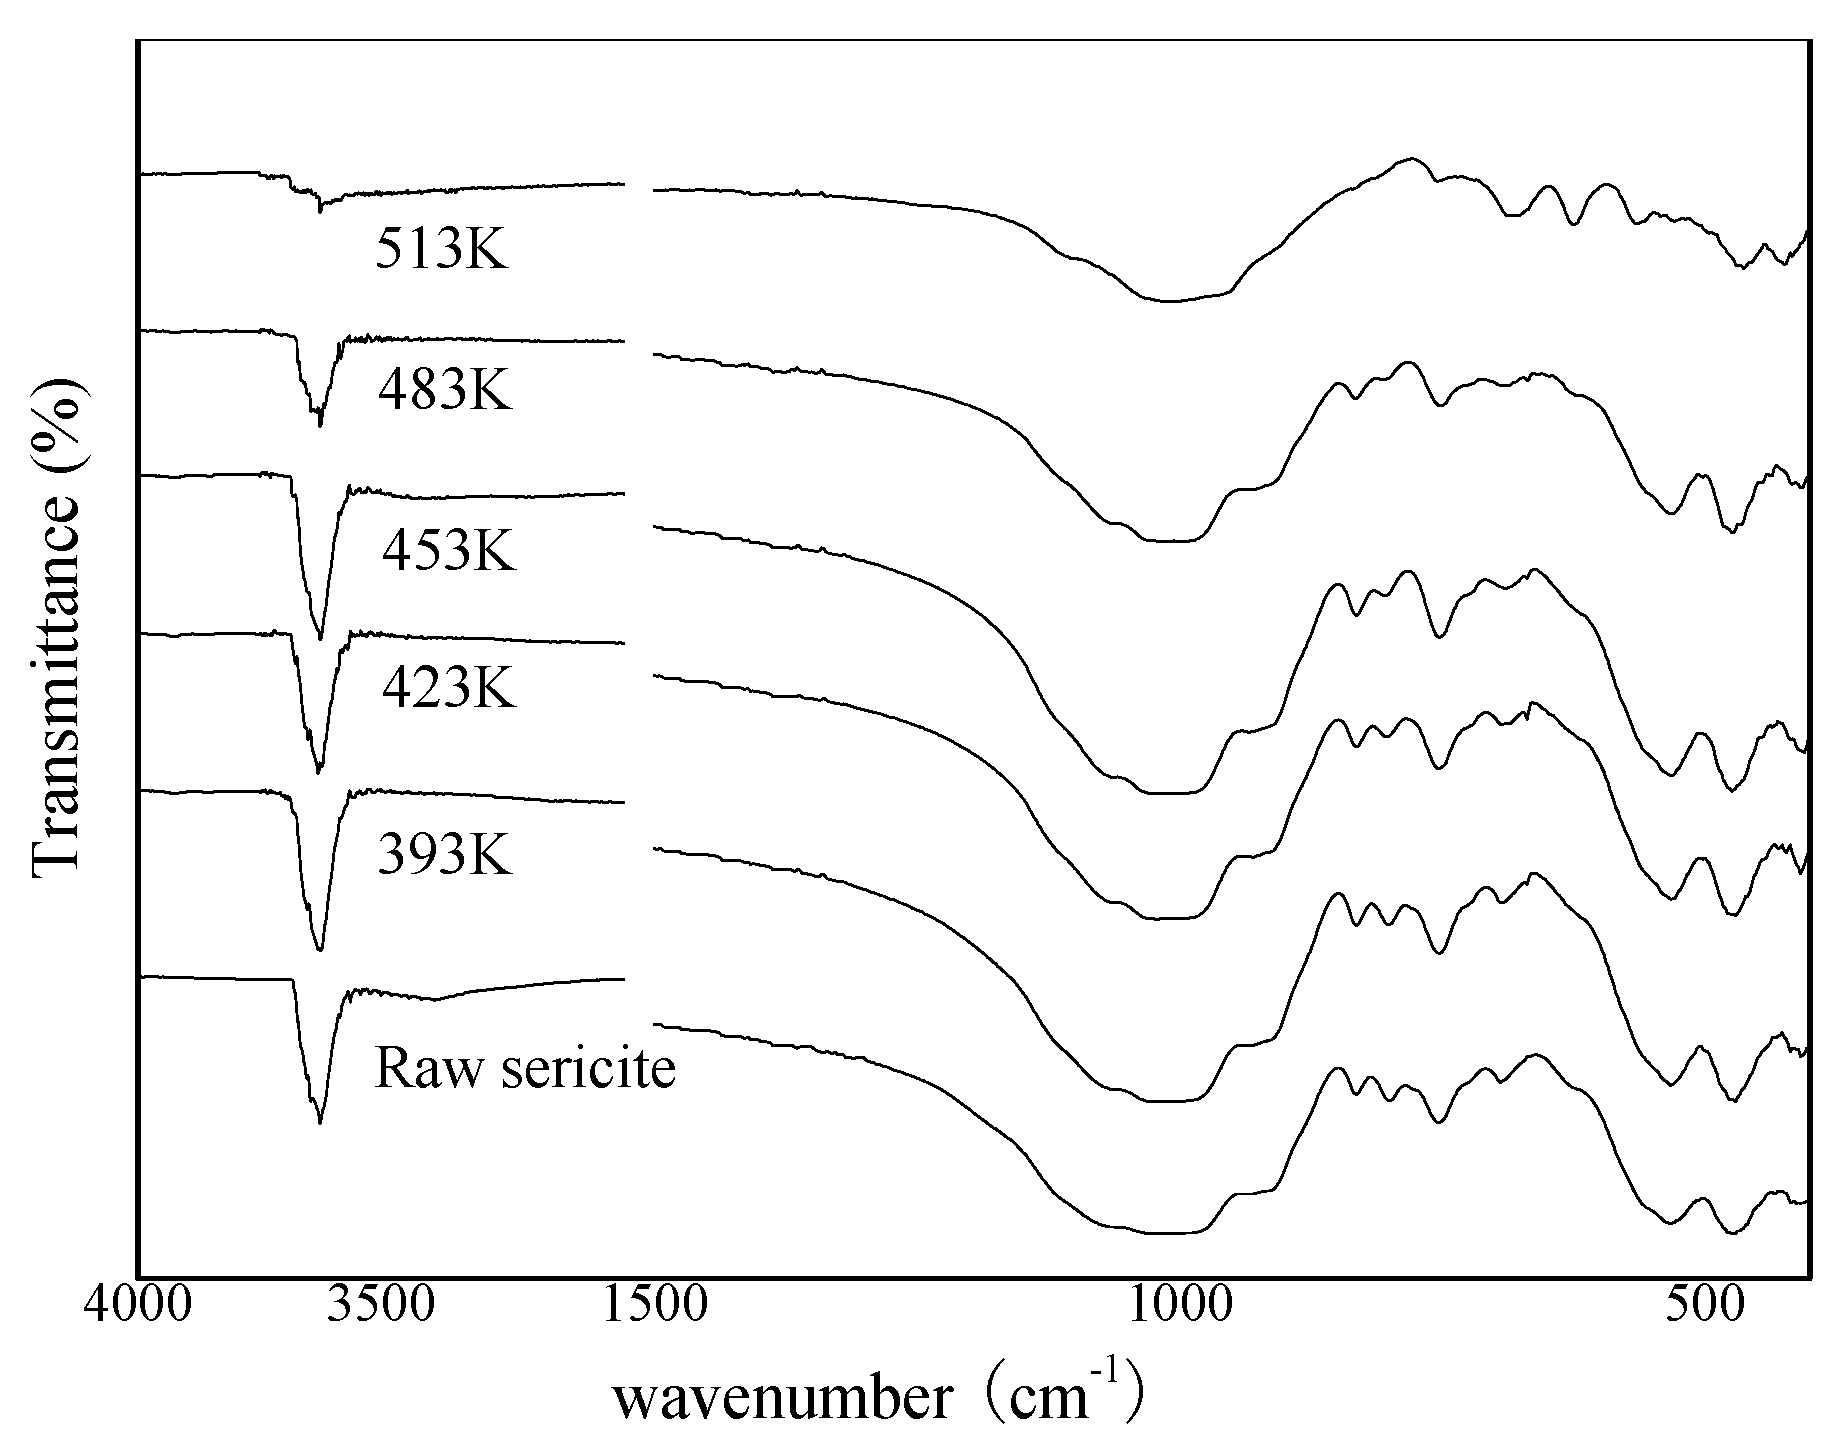
Figure 5.
SEM-EDS analysis of raw sericite: (a) Magnification is 1000 times and scale bar is 50 μm; (b) Magnification is 8000 times and scale bar is 5 μm; (c) EDS.
Figure 5.
SEM-EDS analysis of raw sericite: (a) Magnification is 1000 times and scale bar is 50 μm; (b) Magnification is 8000 times and scale bar is 5 μm; (c) EDS.

Figure 6.
SEM-EDS analysis of alkali leached residue: (a) Magnification is 1000 times and scale bar is 50 μm; (b) Magnification is 5000 times and scale bar is 10 μm; (c) EDS (Experiment condition: alkali leaching temperature: 453 K, NaOH: 3 mol/L, alkali leaching time: 1 h).
Figure 6.
SEM-EDS analysis of alkali leached residue: (a) Magnification is 1000 times and scale bar is 50 μm; (b) Magnification is 5000 times and scale bar is 10 μm; (c) EDS (Experiment condition: alkali leaching temperature: 453 K, NaOH: 3 mol/L, alkali leaching time: 1 h).

Figure 7.
SEM-EDS analysis of alkali leached residue: (a) Magnification is 1000 times and scale bar is 50 μm; (b) Magnification is 8000 times and scale bar is 5 μm; (c) EDS (Experiment condition: alkali leaching temperature: 513 K, NaOH: 3 mol/L, alkali leaching time: 1 h).
Figure 7.
SEM-EDS analysis of alkali leached residue: (a) Magnification is 1000 times and scale bar is 50 μm; (b) Magnification is 8000 times and scale bar is 5 μm; (c) EDS (Experiment condition: alkali leaching temperature: 513 K, NaOH: 3 mol/L, alkali leaching time: 1 h).
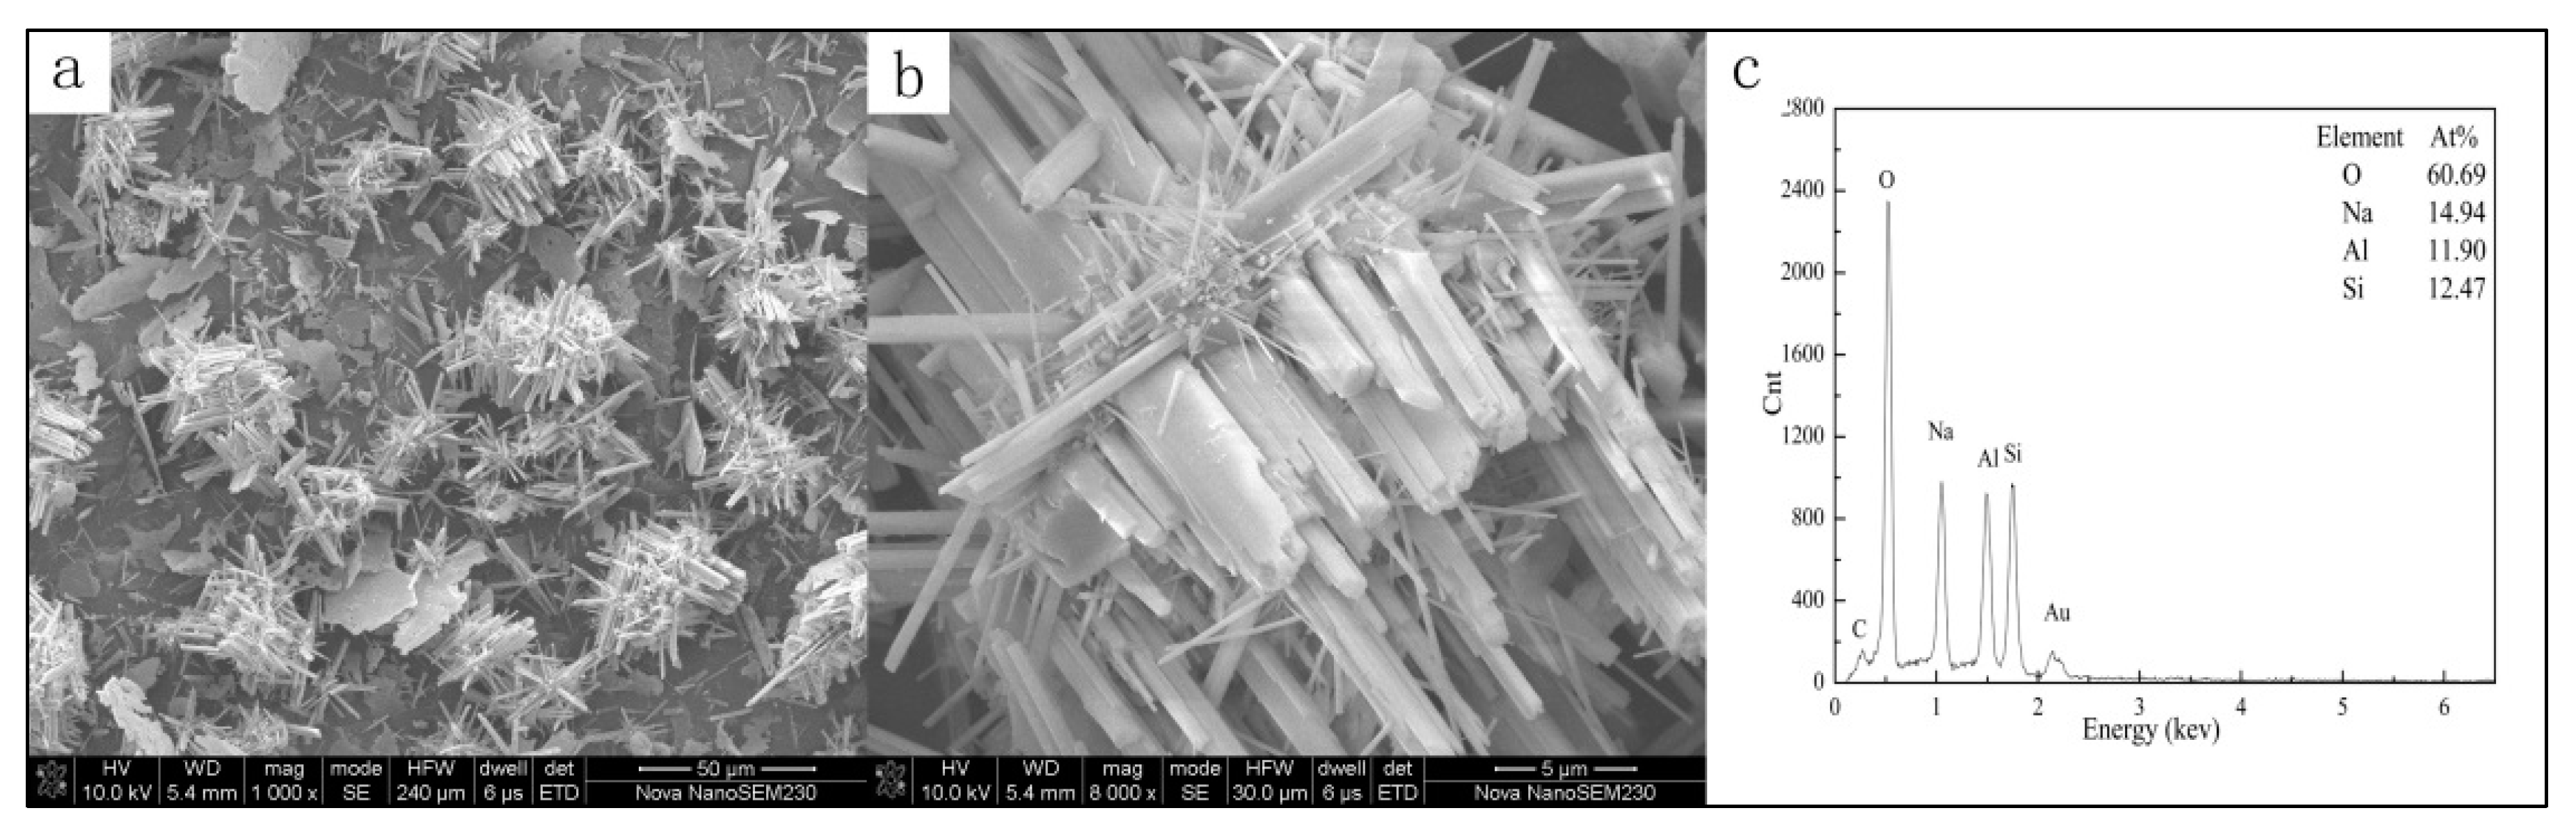
Figure 8.
SEM-EDS analysis of alkali leached residue: (a) Magnification is 1000 times and scale bar is 50 μm; (b) Magnification is 5000 times and scale bar is 10 μm; (c) EDS (Experiment condition: alkali leaching temperature: 513 K, NaOH: 6 mol/L, alkali leaching time: 1 h).
Figure 8.
SEM-EDS analysis of alkali leached residue: (a) Magnification is 1000 times and scale bar is 50 μm; (b) Magnification is 5000 times and scale bar is 10 μm; (c) EDS (Experiment condition: alkali leaching temperature: 513 K, NaOH: 6 mol/L, alkali leaching time: 1 h).
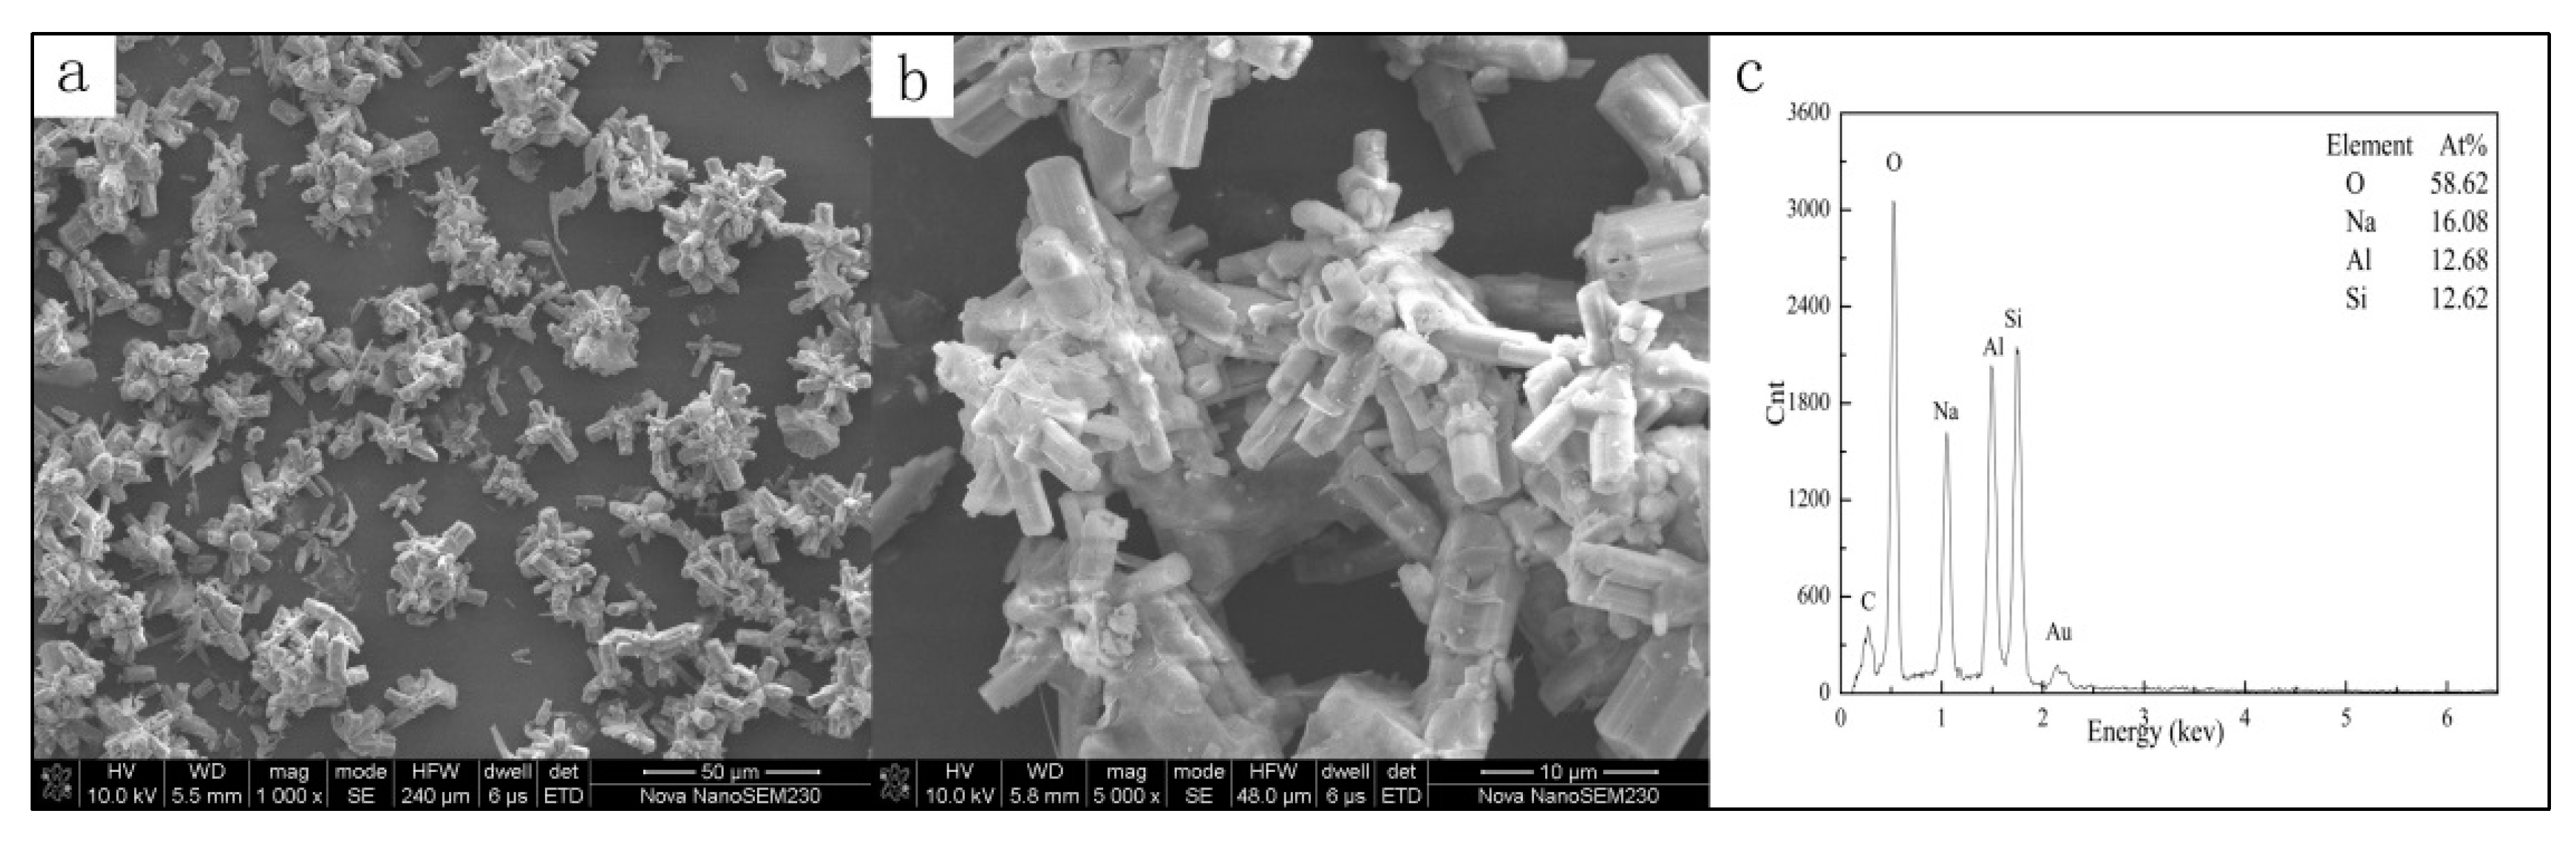
Figure 9.
SEM-EDS analysis of alkali leached residue: (a) Magnification is 1000 times and scale bar is 50 μm; (b) Magnification is 5000 times and scale bar is 10 μm; (c) EDS (Experiment condition: alkali leaching temperature: 513 K, NaOH: 3 mol/L, alkali leaching time: 1 h, acid leaching temperature: 313 K, HCl: 2.4 mol/L, acid leaching time: 0.5 h).

Figure 10.
Schematic diagram of the dissolution mechanism of sericite by alkali-acid leaching.


Table 1.
Chemical composition of sericite (%).
| Component | Al2O3 | SiO2 | Fe2O3 | TiO2 | CaO | MgO | Na2O | K2O | P2O5 | Loss on Ignition |
|---|---|---|---|---|---|---|---|---|---|---|
| Content | 28.99 | 50.95 | 2.91 | 0.44 | 0.16 | 0.79 | 0.18 | 7.94 | 0.05 | 7.59 |
© 2017 by the authors. Licensee MDPI, Basel, Switzerland. This article is an open access article distributed under the terms and conditions of the Creative Commons Attribution (CC BY) license (http://creativecommons.org/licenses/by/4.0/).
Share and Cite
MDPI and ACS Style
Wang, H.; Feng, Q.; Tang, X.; Zuo, K.; Liu, K. Insights into Alkali-Acid Leaching of Sericite: Dissolution Behavior and Mechanism. Minerals 2017, 7, 196. https://doi.org/10.3390/min7100196
AMA Style
Wang H, Feng Q, Tang X, Zuo K, Liu K. Insights into Alkali-Acid Leaching of Sericite: Dissolution Behavior and Mechanism. Minerals. 2017; 7(10):196. https://doi.org/10.3390/min7100196
Chicago/Turabian StyleWang, Hao, Qiming Feng, Xuekun Tang, Kesheng Zuo, and Kun Liu. 2017. "Insights into Alkali-Acid Leaching of Sericite: Dissolution Behavior and Mechanism" Minerals 7, no. 10: 196. https://doi.org/10.3390/min7100196
Note that from the first issue of 2016, this journal uses article numbers instead of page numbers. See further details here.