UMineAR: Mobile-Tablet-Based Abandoned Mine Hazard Site Investigation Support System Using Augmented Reality


1
Energy Resources Institute, Pukyong National University, Busan 48513, Korea
2
Korea Institute of Geoscience and Mineral Resources, Daejeon 34132, Korea
3
Department of Energy Resources Engineering, Pukyong National University, Busan 48513, Korea
*
Author to whom correspondence should be addressed.
Minerals 2017, 7(10), 198; https://doi.org/10.3390/min7100198
Submission received: 7 September 2017
/
Revised: 11 October 2017
/
Accepted: 16 October 2017
/
Published: 18 October 2017
(This article belongs to the Special Issue Geological Modelling)
Abstract
:Conventional mine site investigation has difficulties in fostering location awareness and understanding the subsurface environment; moreover, it produces a large amount of hardcopy data. To overcome these limitations, the UMineAR mobile tablet application was developed. It enables users to rapidly identify underground mine objects (drifts, entrances, boreholes, hazards) and intuitively visualize them in 3D using a mobile augmented reality (AR) technique. To design UMineAR, South Korean georeferenced standard-mine geographic information system (GIS) databases were employed. A web database system was designed to access via a tablet groundwater-level data measured every hour by sensors installed in boreholes. UMineAR consists of search, AR, map, and database modules. The search module provides data retrieval and visualization options/functions. The AR module provides 3D interactive visualization of mine GIS data and camera imagery on the tablet screen. The map module shows the locations of corresponding borehole data on a 2D map. The database module provides mine GIS database management functions. A case study showed that the proposed application is suitable for onsite visualization of high-volume mine GIS data based on geolocations; no specialized equipment or skills are required to understand the underground mine environment. UMineAR can be used to support abandoned-mine hazard site investigations.
1. Introduction
Augmented reality (AR) is an emerging technology that creates a type of virtual environment by extending the user’s perception with virtual information [1]. It enables the user to view the real world with virtual objects superimposed on it in real time. Among various AR technologies, mobile AR is particularly suited for onsite visualization of geospatial data in many areas of research and industry. Mobile AR development in recent years has been advanced by the evolution of information and communication technology, such as sensors (e.g., the global positioning system (GPS) and inertial sensors), embedded microsystems, wireless communication, and mobile devices (e.g., tablet PC and personal digital assistant) [2,3,4]. Development progress in mobile AR systems with tablet capabilities has fostered novel approaches to representing and interacting with geospatial data. Accordingly, AR technology can potentially provide significant advancements in underground resource development and facilities management, as well as in mobile gaming, tourism, and advertising.
The pursuit of an effective, scientific approach to investigation of abandoned mining hazard sites is a fundamental goal of the mining industry. A mine geographic information system (GIS) database is indispensable to understanding the distributions and networks of underground mine-related objects or elements (e.g., mine drifts, mine entrances, boreholes, groundwater, and subsidence) and the complexities of the subsurface environment, including geological structures that are normally hidden [5]. However, to date, mine GIS data are generally displayed in the form of a 2D map, which is used by site investigators for onsite inspection of the mine objects. Nevertheless, the actual environment engaged with by planners and field workers is three-dimensional. The conventional approach to investigating abandoned mine sites including human factor and errors is limited in several aspects [6,7]. It often requires numerous pieces of equipment and a large amount of hardcopy to locate and examine the target mine entrance and boreholes, as well as to identify multiple underground mine drift networks that are intricately distributed (horizontally dense and vertically overlapped) in three dimensions. In particular, geolocating and geological visualizing during operations in the minefield require expensive specialized equipment that is thus typically unfeasible to use [8]. Moreover, users may have difficulty locating their positions while surveying for mine objects in unfamiliar regions.
Since geological surveys and management of an abandoned mine site often require complicated geospatial analysis and interpretation, intuitive 3D visualization of existing various geospatial data of the mine objects is necessary. A mobile-tablet-based AR system dedicated to outdoor (abandoned mine site) applications can thus be used as a geospatial problem-solving support tool by displaying 3D interactive views of georeferenced virtual (invisible) objects integrated in a 3D real environment in real time for user viewing. However, the geospatial data from the GIS database cannot be directly visualized using AR because it consists of a collection of georeferenced features, such as 3D scenes composed of polylines, polygons, and other visual elements. This makes it challenging to visualize geospatial data from GIS using AR technology on existing mobile devices. Despite recent technological advances, developing a functional mobile AR system for use in a new environment remains a challenge. Therefore, it is necessary to develop an AR system that is appropriate for effective field surveying of abandoned mine sites.
Several studies have established a mobile AR-based system (application or software) for geological site investigation or underground utility maintenance and management. Lee et al. [3] developed a mobile tablet application, BoreholeAR, to effectively visualize a borehole database of South Korea in 2.5D using AR technology. Westhead et al. [9,10] proposed iGeology, an application developed by the British Geological Survey that provides interactive geological maps of the United Kingdom using an AR technique. Schall et al. [11] and Zhang et al. [12] proposed a mobile AR-based next-generation field information system for interactive visualization and effective management of underground infrastructures, such as pipelines. Behzadan and Kamat [13] investigated the application of GPS and three-degrees-of-freedom angular tracking to address the registration problem during interactive visualization of construction graphics in outdoor AR environments. Khalid et al. [14] examined the applications of an AR-based approach for the medical and gaming industries and to explore the potential of using AR in pre-construction work.
Despite the above achievements, few studies have focused on developing a mobile AR-based system that is dedicated to the mining industry. For this industry, Maptek [15] developed PerfectDig software, which compares an ongoing excavation with 3D open-pit mine design plans for conformance. In addition, Michalak [16] applied AR and radio frequency identification technologies in the maintenance of mining machines. Nevertheless, no previous studies have developed a mobile AR-based system for mining hazard site investigation or management of abandoned underground mining areas.
The objective of the present study was thus to develop a mining hazard site investigation support system based on mobile AR technology that can be utilized in abandoned underground mine sites. We developed a mobile tablet application called Underground Mine Augmented Reality (UMineAR). It is intended for outdoor applications and provides various functions, including onsite intuitive visualization of underground mine drifts, boreholes, and mining hazards. This paper describes the development details and functions of the UMineAR application.
2. Design of the UMineAR
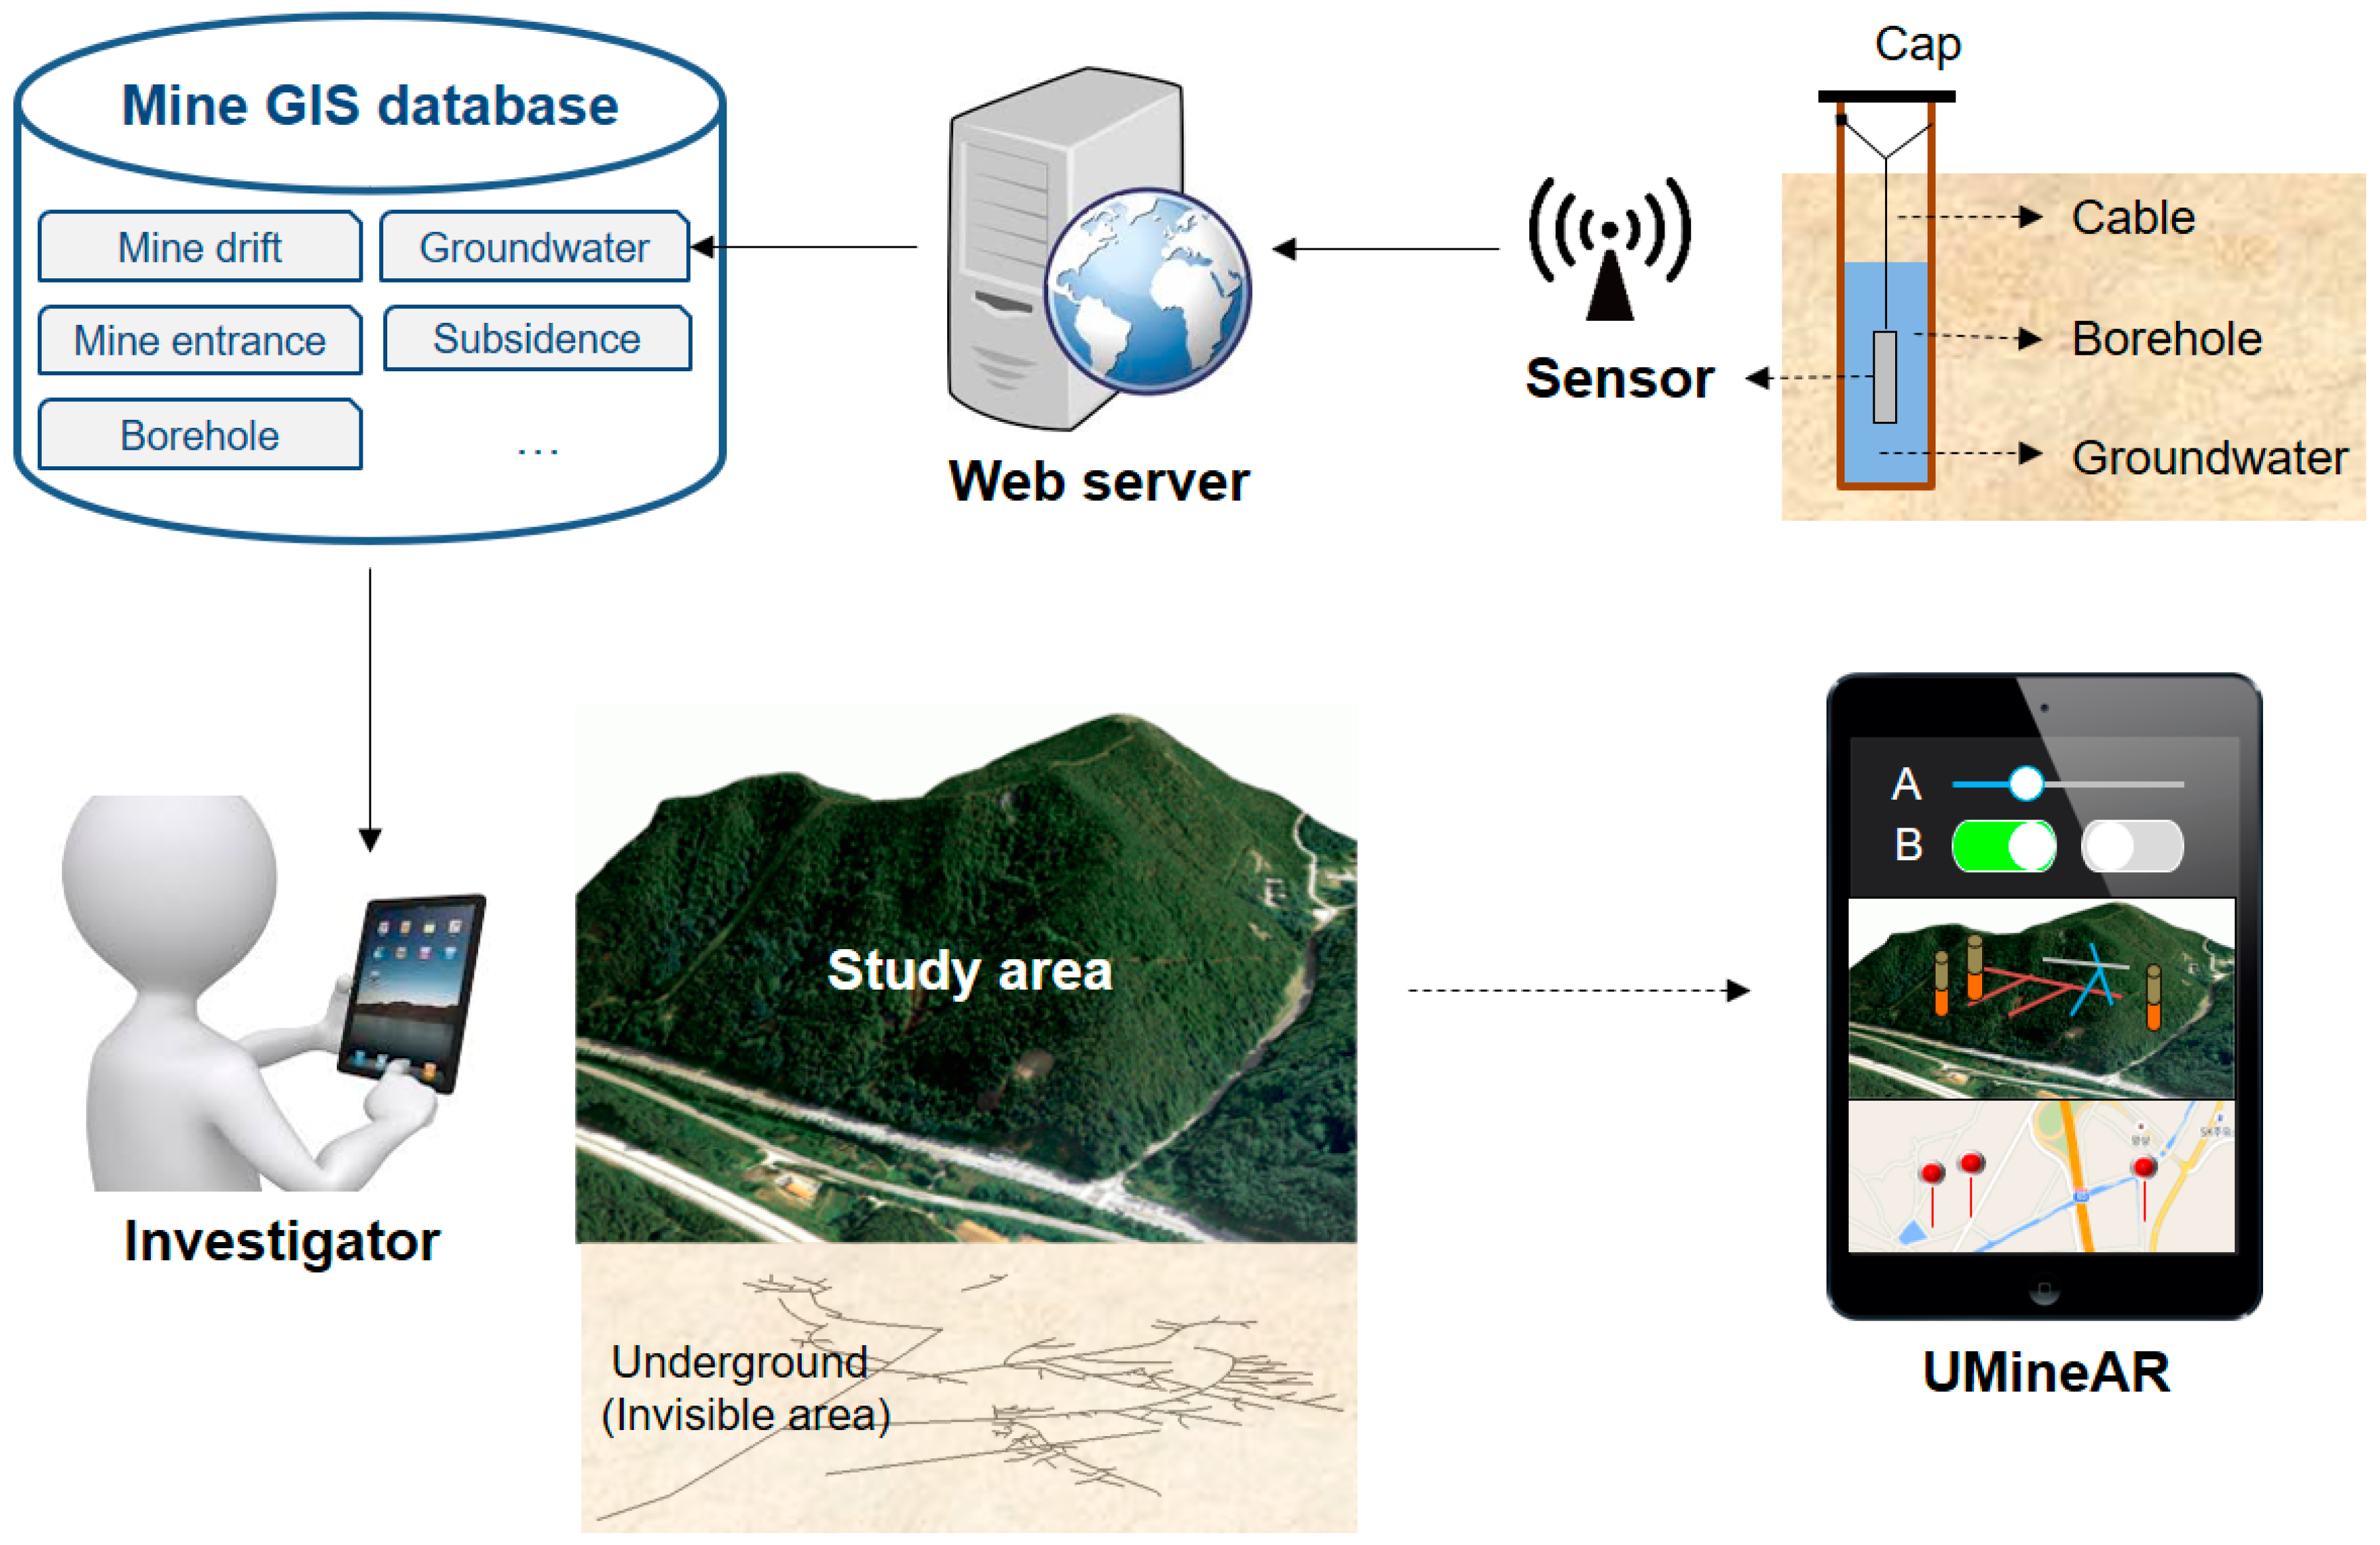
The UMineAR mobile tablet application shows underground mine drifts, mine entrances, boreholes, and mining hazard data based on existing mine GIS databases of 3D AR video images and 2D map images simultaneously (Figure 1). This application was conceived to enable easy identification of the locations of mine drifts, entrances, boreholes, and hazards as well as to improve the site investigation and management of abandoned mine areas. It is because, in practice, it is difficult to identify the location of underground mine objects and to understand the complex underground mine drift network in abandoned underground mine site.
Mining hazard site investigation support systems must accurately display mine geospatial data, quickly load a large mine GIS database, and provide appropriate information regarding the subsurface environment to enable intuitive visualization of relevant features. Specifically, it requires high-accuracy data and precise positioning of the user and their relation to the mobile device to ensure correct registration between reality and the data to be augmented. Details of the system development environment, libraries, and mine GIS databases used in this study are presented in Section 2.1.
2.1. Development Platform, Environment, and Library
UMineAR was developed on an iPad Pro (Apple, Cupertino, CA, USA), which has a built-in rear-facing camera, GPS receiver, accelerometer, and gyroscope (Table 1). Its required hardware specifications are generally included in recent mobile tablets and smartphones. Accordingly, the application can be developed on any other mobile device or platform. The advantage of the iPad Pro is that the device uses nearly the same operating system, hardware, and software as the iPhone; thus, the application (or code) can be easily ported to a smartphone environment. The iPad device provides the functionality that is required for mobile AR development, which is based on the camera rear-view orientation as determined by the device location and orientation. The development was conducted using Xcode 8.3.2 (Apple, Cupertino, CA, USA) which is an integrated development environment for macOS.
For development of the UMineAR database, interfaces, functions, and options, ten commonly used libraries (the framework) were adopted in this study. Table 2 summarizes these libraries and their roles in the development of UMineAR. Nine of the libraries are on-board iOS libraries; the other one is an external library that is not included in the iOS environment. The application was designed so that the external library that is not built into iOS can be integrated with the application upon installation of UMineAR on the user’s device. Proj.4 (Gerald Evenden, Woods Hole, MA, USA), an open source library (MIT X11 licensing), was adopted to convert geographic longitude and latitude coordinates into Cartesian coordinates of geospatial data. OpenGL for Embedded Systems (OpenGL ES) (Silicon Graphics, Sunnyvale, CA, USA), a cross-platform application programming interface, was used for rendering 2D and 3D vector-type mine geospatial data. The other eight onboard iOS libraries are commonly employed to implement AR-based applications in the iOS platform. For further information of the libraries and their utilization for the development of mobile AR-based systems, please see the work of Lee et al. [3].
2.2. Mine GIS database
A mine GIS database compiled by the Mine Reclamation Corporation (MIRECO) of South Korea was employed for the development of the UMineAR system. MIRECO constructed mine GIS databases that include the distribution of various types of mine drifts, geological maps, topographic maps, borehole data, and mining hazard inventory maps for areas with abandoned coal mines in South Korea [17]. These databases were developed to address increasing interest in preventing and managing damage caused by mining hazards in abandoned mine areas. During the last 20 years, mine GIS databases were compiled for more than 347 coal mine areas and 644 metal/non-metal mine areas in South Korea via total inspection works throughout South Korea as well as existing hardcopy format mine data [5]. Owing to this compilation of large spatial databases for abandoned mine areas, AR system studies in this field are now possible using the georeferenced geospatial data. Although the mine GIS database construction work was initiated in 2001, most field surveyors continue to employ hardcopy mine data (paper) in mining hazard site investigation and management.
This study adopted MIRECO’s mine GIS database schema, which is unique in South Korea, for the design of the UMineAR system database. It thus did not perform standardization of the mine GIS database. However, efforts to characterize and classify the number of items that should be retrieved, analyzed, and managed on mobile devices, based on the items in existing mine GIS databases, required a design that was appropriate for a mobile-based mine GIS database management system. Various attribute data elements and coordinate systems of the MIRECO mine GIS database were examined to account for the characteristics of the mining hazard site investigation works. This is because they have an important influence on the design and visualization of the mobile tablet system. Subsequently, additional essential layers and items were newly suggested and classification criteria were reestablished to define the appropriate mine GIS database for the mobile AR system in the present study.
The UMineAR database consists of a mine drift layer (the layer is the mechanism used to display geographic datasets in GIS and is a kind of file format), mine entrance layer, groundwater level layer (as in a borehole), and subsidence layer for each abandoned mine. The layer, items, code, and data type of the mine database for use in the UMineAR application are listed in Table 3. The mine database includes a total of 40 items organized in four different layers. In most cases, each mine site consists of multiple mine drifts and mine entrances, boreholes, and some mining hazards, such as groundwater rebound and ground subsidence. Therefore, each layer of the mine GIS database has a single mine code.
The subsidence layer includes not only the subsidence area, but also the influential zone. The subsidence area refers to the actual collapsed region surveyed by site investigators or unmanned aerial vehicle photogrammetry. The influential zone refers to virtual regions where the ground may be unstable, which is defined by the underground mine drift. The extent of the influential zone can be calculated using the depths of each underground mine drift (or cavity) and its angle of draw. Details of the calculation of the influential zone can be found in the work of Suh et al. [5].
UMineAR stores and utilizes these mine GIS databases that were previously constructed. This is possible because most elements are static data, such as mine drifts, mine entrances, boreholes, and subsidence occurrences. Unlike these data, the groundwater level continuously fluctuates on account of the weather conditions or pervious materials and subsurface geological structures. Therefore, Internet-of-Things-based sensor instruments were installed in each borehole to measure the groundwater level of each borehole every hour and to send these data to an existing web server for analyzing the groundwater rebound in this study. In addition, a server/client-type web database system (from sensor to server) was designed that enables access to newly updated groundwater-level data of the web server via a mobile tablet, where 3G or Wi-Fi data communication is available. For these groundwater level data, the schema of five items were designed and are presented in Table 3.
Basically, mine GIS data have a coordinate system for georeferencing each abandoned mine site. Most of MIRECO mine GIS data reference a Bessel 1841 spheroid as an ellipsoid and a transverse Mercator (TM) with a scale factor of 1.000 for the coordinate system. The database employed a modified Korean datum of 1985 (Korean 1985 central belt: latitude 38° and meridian 127°00′10.405″) as a horizontal reference geodetic datum [17]. It was found that several mine GIS databases use the World Geodetic System 1984 as a reference ellipsoid for specific purposes. The coordinate system can be identified by selecting an integer as an ID token (using, for example, the spatial reference system identifier) to prevent recording errors. The coordinates can be transformed to the default coordinate system of the mobile device system by referencing the ID. For the application, the Well-Known ID system suggested by Environmental Systems Research Institute (ESRI, Redland, CA, USA; a GIS solutions company) was utilized in this study [3].
3. Development of the UMineAR
3.1. System Architecture of UMineAR Components
The UMineAR system consists of four modules: a search option module, an AR module, a map module, and a database module. The search option module provides options and functions that enable the user to select data to be retrieved and visualized in the AR module and the map module. The AR module provides 3D visualizations of the mine drift data, borehole data with the groundwater level, subsidence data, and the background video image on the iPad screen. The map module shows the locations of corresponding borehole data on a 2D map. The database module in the UMineAR system, which is not related to a user interface, provides data management functions for mine GIS database files. Each module was separately developed to enable flexible arrangements of the screen. Figure 2 shows the overall structure of the system.
The UMineAR system start-up screen consists of three sub-screens. A search option interface is presented in the upper part of the screen. An AR video image of various geospatial data and corresponding borehole data on a 2D map are displayed in the lower part of the screen; these are displayed when a user initiates the application and faces the device in the direction in which the mine database exists. Details of each module are presented in the following sections.
3.2. Search Option Module
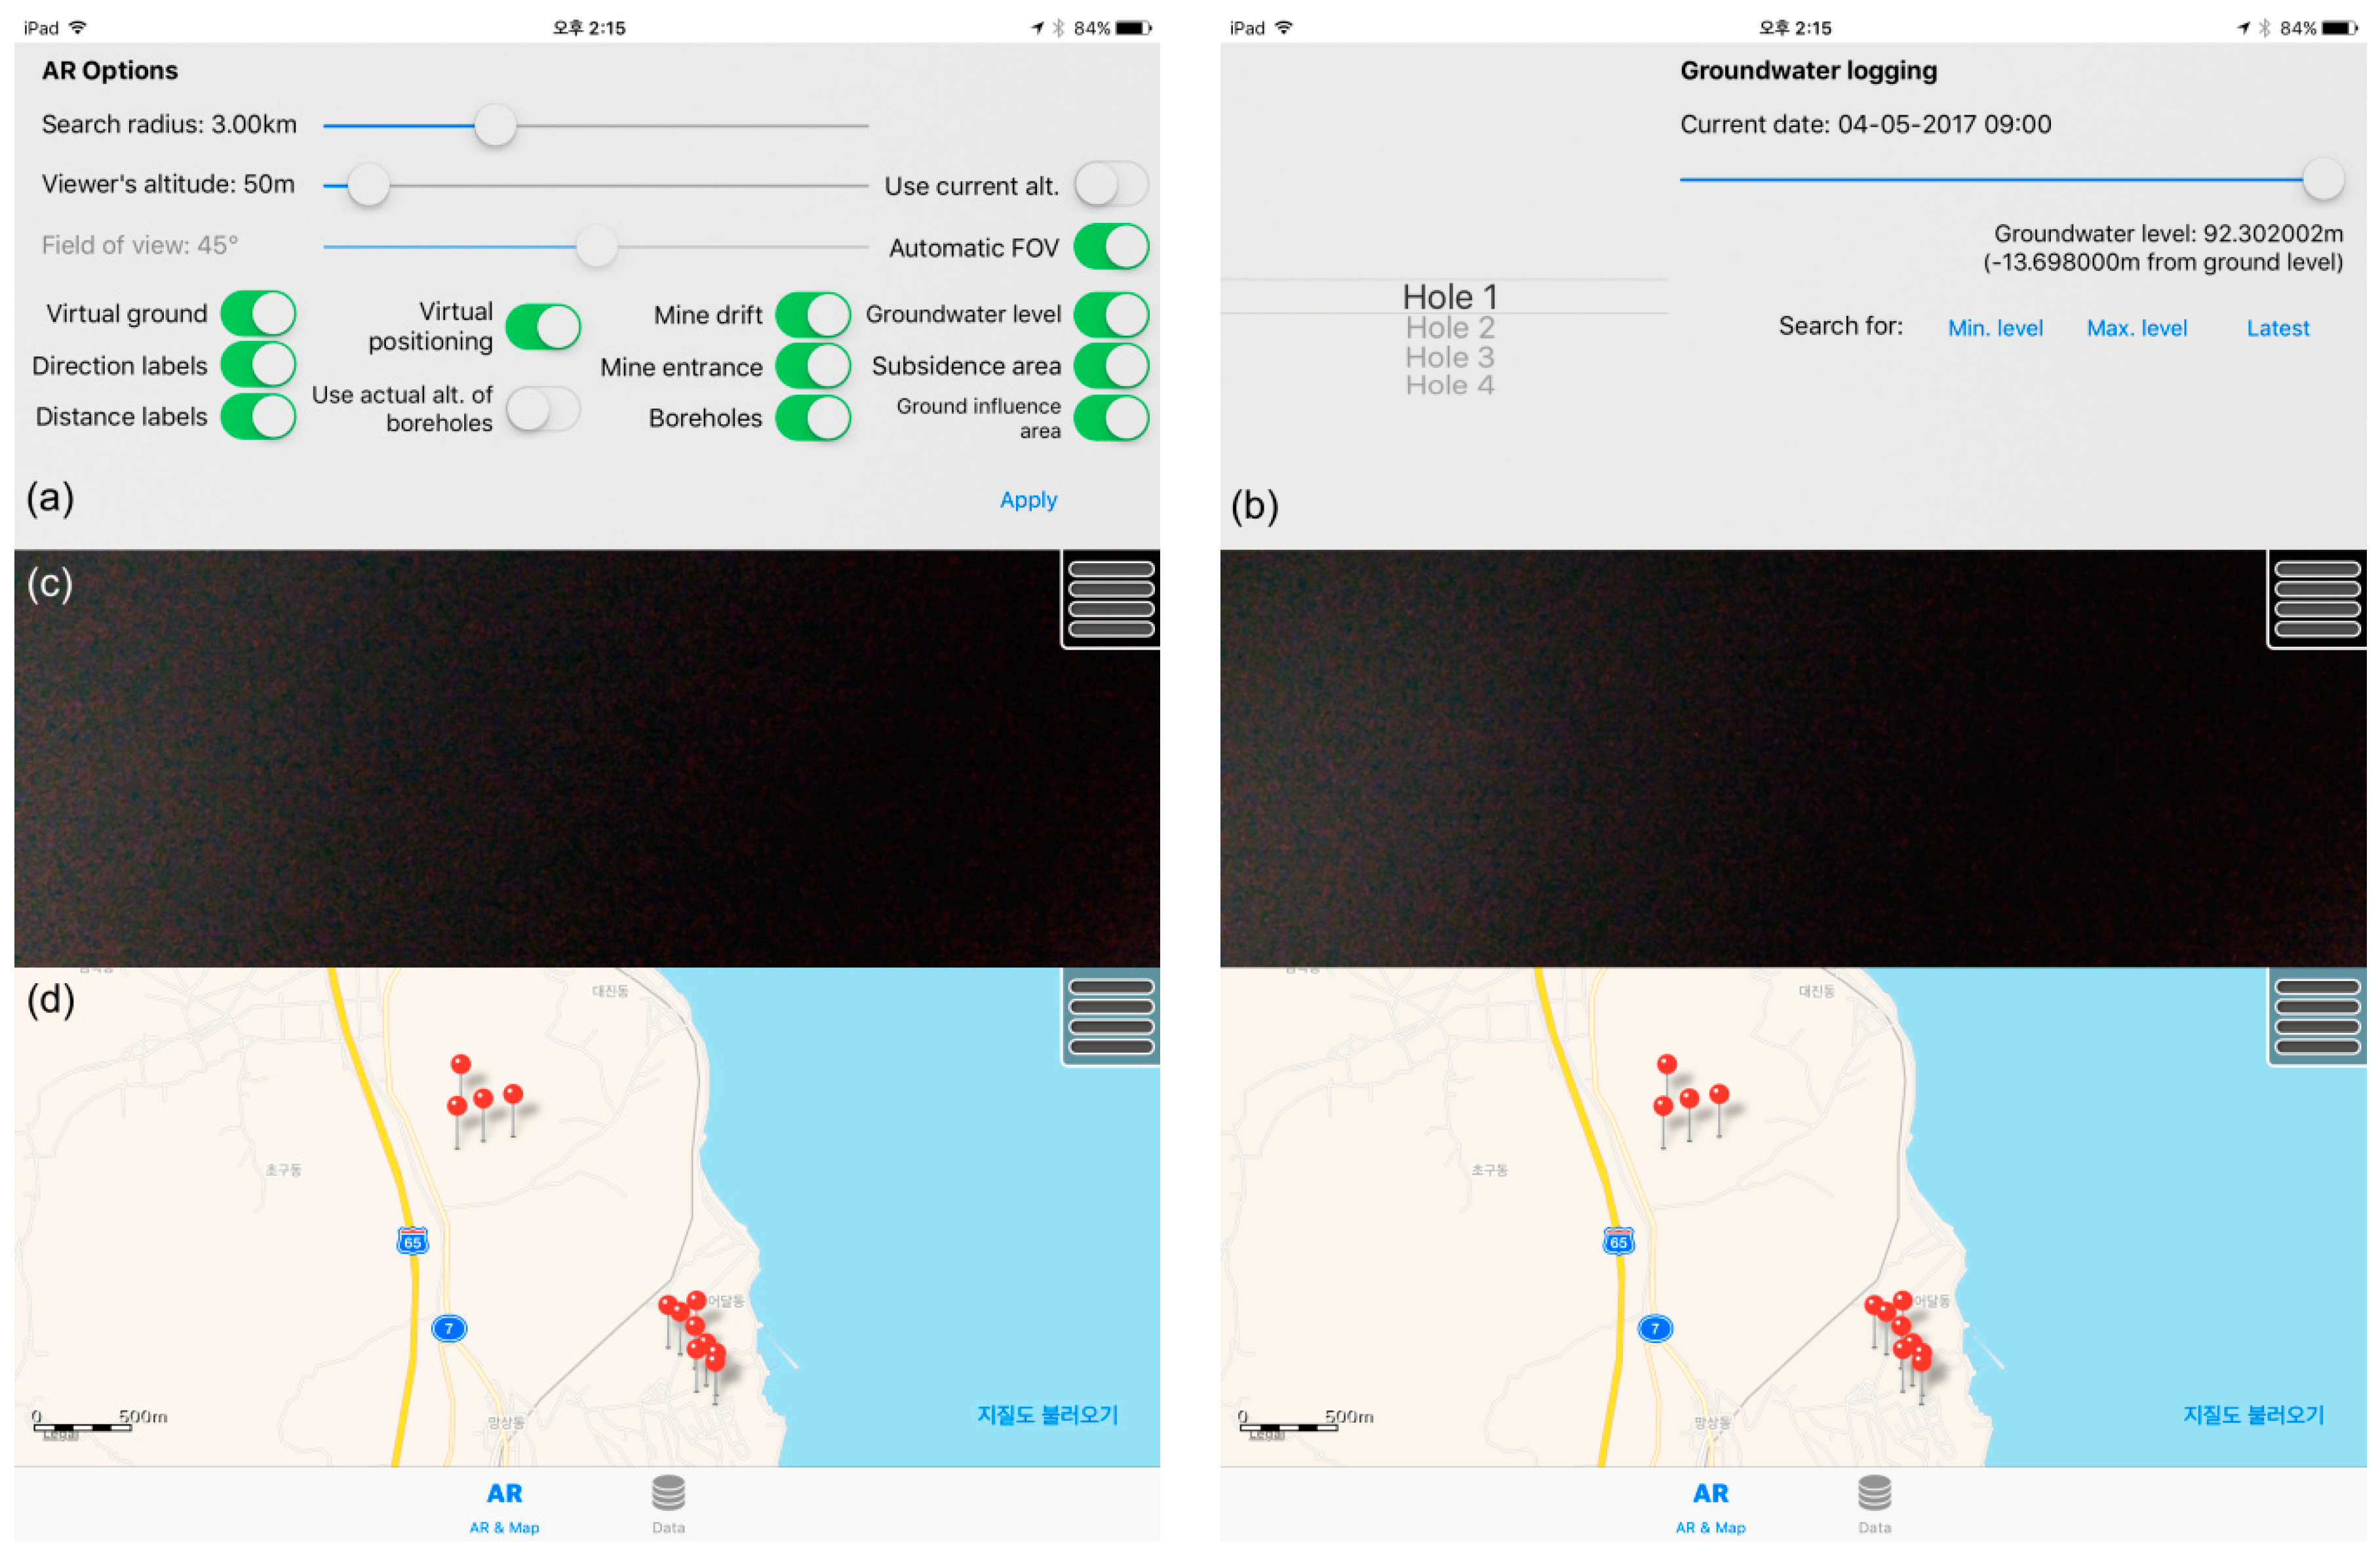
The search option module provides data retrieval and visualization setting functions, such as a data search radius bar, viewer altitude, field of view (FoV) bar, device virtual positioning, on/off toggles for each item of mine GIS data (e.g., mine drift, mine entrance, boreholes, groundwater level, subsidence area, and ground influence area by mine drift), and on/off toggles for direction labels and distance labels (Figure 2a).
The UMineAR system conducts location-based AR to visualize locations and attributes of the mine GIS data. As the subsurface mine drifts and boreholes in the real world are invisible, vision-based target detection is not available. When the user initiates the UMineAR system, 3D coordinates of the device can be automatically acquired from the built-in GPS receiver in a 3G cellular environment. In the case of an iPad with only a Wi-Fi module model (without 3G cellular), the accuracy of the device location is considerably decreased. The virtual positioning option enables the user to manually input the user’s 3D coordinates (latitude, longitude, viewer altitude) with device using the information obtainable from another GPS device or smartphone. The search radius indicates the value of the distances from the device. This facilitates control of the number of boreholes to be retrieved. The minimum and maximum values of the search radius are 0.01 km and 10 km, respectively. FoV indicates the degree of the angle between the orientation the device’s camera faces and the orientation of the visible areas at a particular position.
The orientation of the device is calculated from data on the acceleration of the device and the Earth’s magnetic field. The default FoV value is automatically adjusted according to the device because each device has a different camera module having a different FoV. The higher values of the FoV and search radius enable retrieval of more mine GIS data. In addition, the on/off toggles for each item of the mine GIS data provide options to retrieve and visualize each existing layer in both the AR module and map module. If the user activates the groundwater level toggle, the latest groundwater level data are retrieved from the web server. The direction labels and distance labels provide functions to visualize the orientation of the device’s camera and the distance from the device (with a distance of 50 m) in the AR interface, respectively.
All settings of the search options can be applied and displayed in the AR module and map module by clicking the button in the lower-right area of the search option interface. The search option interface disappears when a user touches the “Apply” button. By clicking the rectangle in the upper-right portion of the AR interface, the user can call the search option interface and change the search option settings.
The search option module provides another interface for groundwater logging (Figure 2b) that enables the user to retrieve and visualize real-time groundwater level logging data for each borehole measured every hour via sensors installed in the boreholes. The user can retrieve the hourly measured data of the groundwater level and depth of each borehole via the borehole selection box and time-line bar. The values of the groundwater level and groundwater depth from the ground are displayed in the right part of the groundwater logging interface. While groundwater level logging is enabled, the blue cylindrical groundwater level indicators are visualized at each borehole in the AR interface. In addition, it is possible to find the minimum, maximum, and current groundwater level of each borehole among the numerous logging data by selecting one of three options. When the user selects the borehole number and adjusts the time-line bar, the values and cylinder of the groundwater level simultaneously change.
3.3. AR Module
The AR module shows live video of 3D mine GIS data superimposed on camera imagery as viewed by the user using the device’s location and orientation (Figure 2c). Through the process of the aforementioned search option setting, this module provides intuitive 3D visualization of the mine drifts, entrance, borehole, groundwater level, subsidence, and ground influence area by mine drift. For the 3D visualization of the mine GIS data in the AR module, the Cartesian coordinate system is necessary, such as TM and Universal Transverse Mercator (UTM). This study employed the TM coordinate system since TM is more accurate for South Korea than UTM. Therefore, if the retrieved mine GIS data adopt a different coordinate system, such as the latitude and longitude coordinate system or the World Geodetic System (WGS) 1984 spheroid with UTM projection, the given coordinate system is automatically converted into the TM coordinate system (Bessel 1841 spheroid) and subsequently displayed in the AR module. When a user initiates the UMineAR system, the inbuilt GPS provides the coordinate of the device, which allows the map to be automatically centered at the location of the user. Because the target objects are also located by their geographical coordinates, the locations of the objects can be expressed in the 3D view using similar principles.
The distributions of mine drifts are represented by 3D polygons with different colors according to each mine drift group (level) on the AR video. The names of the mine entrances of the each mine group are linked to the corresponding mine entrance points. Boreholes are represented by cylindrical objects with different colored layer information in the AR video. The number of the borehole is linked to the corresponding borehole. Groundwater levels of each borehole are represented by 3D translucent blue colored cylindrical polygons with exaggerated diameters to be distinguished from the borehole. The subsidence area is represented by a 3D polygon with a red colored boundary. The ground influence area, defined by specific mine drift, is represented by a 3D yellow circular cone shaped on the specific mine drift. All size, thickness, and color of the mine GIS data, which are displayed in the AR module, are set by considering their original GIS data type, object distributions, and landscape and terrain characteristics for effective and intuitive visualization.
The UMineAR system can search for up to 1000 mine drift data, 5000 borehole logs in a single search result, and 10,000 days of groundwater logging data to optimize retrieval and simultaneous visualization in the mobile environment. The user can easily capture and save screenshot images of the results retrieved from the mine GIS database and send the saved photo image for sharing of the data.
3.4. Map Module
The map module shows the locations of corresponding borehole data on a 2D map with additional map layers (Figure 2d). For the development of the 2D map, UMineAR employs a built-in MapKit, which adopts the WGS 1984 spheroid as a reference ellipsoid and the longitude/latitude system. Accordingly, if the coordinate systems of the target object mine GIS data are different from that of the map, coordinate transformations are performed (e.g., from Bessel 1841 with TM to WGS 1984) before the visualization in the map module.
The device location is represented as a round blue point, and the boreholes retrieved by the application are represented as red pins. Because UMineAR shows borehole data on the 3D AR video and 2D map image simultaneously, the user can readily identify the borehole location. The underlying 2D map displays the main roads and highways as well as basic land cover information, such as rivers and seas. Consequently, it can improve the user’s understanding of the environment of nearby areas while performing field investigations using the AR view. Moreover, in the map module, the user can access the detailed boring log database by touching a specific borehole pin on the map. The user can easily and quickly retrieve a considerable amount of information about the subsurface environment from the database, such as details about the mine code, groundwater level, and rock types.
4. Application of the UMineAR
4.1. Study Area
The Waryong coal mine, located at Donghae-Si, Ganwon-Do, South Korea, was selected as the study area for the UMineAR application. Figure 3 shows the topography and distributions of mine drifts, boreholes, and zones of subsidence in the area. Underground coal mining was conducted in a wide area of the Waryong coal mine for nearly 25 years. The study area presents four mine drift groups with different levels and four mine entrances. All four mine openings were physically closed by collapse (Table 4) since 1989. The mine was abandoned without implementation of appropriate mine reclamation measures, such as mine opening sealing for mine water leakage and underground cavity filling. Consequently, some subsidence events, including trough-type and sinkhole-type collapses, have been reported. Moreover, numerous water problems, such as inundation of the mine drift, groundwater rebound, and mine water leakage, occurred since 2010 from rainfall and nearby groundwater inflow. To prevent and manage the aforementioned mine water problems, several mine reclamation works were considered, such as mine opening sealing, water piping, and biochemical treatment. In addition, measurement sensors were installed in four boreholes for the long-term monitoring of the groundwater level fluctuation in the study area.
4.2. Results of Mine GIS Data Retrieval and Visualization Using UMineAR
UMineAR was tested near the Waryong coal mine (37°34′13″N and 129°06′07″E). UMineAR respectively equipped with an iPad Pro Wi-Fi only model (without cellular) as well as a Wi-Fi + cellular model were tested to examine the applicability of both models (because the Wi-Fi only model is more widely used). Regardless of the model used, iPad Pro could recognize the approximate location of the device using the inbuilt GPS-based position information. However, the positional accuracy of the iPad Pro Wi-Fi only model was lower (owing to the insufficient calibration of the coordinate because few repeaters existed near the region) compared with that of the Wi-Fi + cellular model. That is, a more exact 3D coordinate of the device, obtainable from other equipment (not from inbuilt GPS-based coordinate), was required when using UMineAR with the Wi-Fi only model. Accordingly, the exact latitude, longitude, and elevation of the device were obtained using the information from Garmin GPS equipment (Garmin, Olathe, KS, USA). Subsequently, the longitude and latitude of the device were inputted by activating the “virtual positioning” toggle, and the device elevation was set using the “viewer’s altitude” function (deactivated with the “use current alt” option) of the search option module (Figure 2a). In the case of using UMineAR with the Wi-Fi + cellular model, the localization process was automatically performed by simply activating the “use current alt” toggle of the search option module. Therefore, the complex localization process could be omitted when using the Wi-Fi + cellular model.
The search radius was set to 500 m and the radius was increased up to 3000 m to retrieve mine drifts, groundwater level data, boreholes, and subsidences of the Waryong mine only (to exclude retrieval of the mine GIS database of the other mines). As a result, UMineAR searched for data on four mine drift groups (with different levels), four mine entrances corresponding to four mine drift groups, four boreholes with a temporal groundwater level, one subsidence, and one influential zone located within 3000 m of the user with the device. Figure 4a shows the cross-sectional view screenshots that were obtained on the UMineAR system with the aforementioned settings at a latitude of 37°34′8.76″ and a longitude of 129°5′52.58″. The figure shows the existing mine GIS datasets (i.e., three of four mine drifts, mine entrances, three boreholes with groundwater levels, a subsidence, and an influential zone by specific mine drift) superimposed onto the view of the Waryong coal mine on the AR interface. It was determined that the retrieved datasets corresponded to those found in the MIRECO mine GIS database.
On any AR application, coordinate of objects were computed before each frames are displayed. The iPad or other similar smart devices display live video at 30 frames per second. It means that every calculation tasks for displaying a frame should be finished in less than 0.03 second to display the contents with minimum time lag. To enable fast drawing of 2D or 3D graphic elements, a hardware acceleration technique can be used. This technique utilizes a dedicated hardware for graphic processing so the CPU can have more time to process the internal features rather than calculating each pixel to display, which takes a considerable number of calculations.
The file size of the mine GIS data influenced the load time of data into the mobile system. On average, the size of the dataset for a single mine drift group was less than 3 MB, a single borehole with groundwater level and rock type data was approximately 1 MB, a subsidence was less than 0.1 MB, and an influential zone was less than 0.2 MB. Accordingly, the overall size of the mine GIS datasets of the Waryong coal mine accounted for less than 20 MB. The data loading time of cellular network environments (e.g., 3G networks) limits the download capability of the application if vast amounts of mine GIS datasets are retrieved or needed. However, the UMineAR system is suited for the use of retrieving and visualizing a single mine at a time. Therefore, the data searching and loading times for visualization would be not a problem in cellular network environments in practice.
Approximately 4 s was required to search and display the entire Waryong mine GIS dataset of approximately 20 MB, and 1.5 s to 2 s was needed to search and display an individual layer (i.e., a mine drift layer, mine entrance layer, borehole layer, or subsidence layer) in the 3000 m of search radius. Basically, the data search time was proportional to the number of retrieved mine GIS dataset items since a calculation of the relative coordinate was required for every mine GIS data item. If the number of target objects was small, most of the time consumed by UMineAR was dedicated to the searching options settings. In general, it is predicted that less than 10 s is required to download mine GIS dataset of 50 MB in 3G environment in South Korea. Three test subjects with more than five years of experience with 2D hardcopy mine maps required more than 10 min on average to identify the distributions of the mine drifts and determine the exact locations of the mine entrance, boreholes and subsidence in the field.
Although 2D hardcopy mine maps provide information on the distributions of mine drifts in either a lateral (cross-sectional) view or a plane view, it is difficult to interpret and understand the mine drift networks, which are intricately distributed (vertically overlapping and horizontally dense) in 3D in the real world. Moreover, without UMineAR, the investigators may require additional time and effort to find the target mine drifts, boreholes, and subsidence; moreover, a large amount of hardcopy data is needed for elucidating the spatio-temporal groundwater level changes (or fluctuation patterns). Generally, new investigators who are unfamiliar with the study area may have difficulty locating their positions during searches for mine drifts, boreholes, and subsidence. The time required for geolocating and subsurface interpretating will vary depending on the characteristics of each site. It is thus concluded that UMineAR enables elucidation of the subsurface geological characteristics in abandoned mine sites and significantly reduces the total investigation time and cost for mine site investigations.
4.3. Results of Groundwater Rebound Analysis by Applying UMineAR
The hourly measurement of groundwater levels of boreholes was conducted on 26 October 2016 (BH-01) and 15 November 2016 (BH-02, BH-03, and BH-04). Representative groundwater level data of four boreholes retrieved from the groundwater monitoring database are summarized in Table 5. The difference between maximum and minimum values of the groundwater level of boreholes ranged from 1.2 m to 7.4 m. When the abandoned mine site received heavy rain, the groundwater levels of all four boreholes were generally high. However, as listed in Table 5, the date with the maximum (or minimum) groundwater levels for the four boreholes may not have differed because the subsurface geological characteristics (e.g., fracture zone, permeability, and discontinuity) for the regions of each borehole were different.
The elevation of each mine drift was compared with the groundwater level of the borehole adjacent to the mine drift using UMineAR to identify whether each mine drift was submerged. Data on the minimum, current, and maximum values of the groundwater level of borehole No. 2 are visualized in Figure 5. As shown in both Figure 3a and Figure 5c, BH-01 and BH-04 (unseen) are located near the new mine drift, and BH-02 is located in the vicinity of mine drift No. 3, No. 5, and new drift. In contrast, BH-03 is approximately 65 m horizontally from the nearest mine drift.
As shown in Figure 5c, the groundwater level of BH-01 (in the translucent blue cylinder) was higher than that of the new mine drift. The minimum value of the groundwater level of BH-01 was 91.79 m (Table 5), which exceeded the elevation of new mine drift (90 m) adjacent to BH-01. Thus, it is obvious that the new mine drift was submerged under 1 to 2 m of mine water, unless a large volume of inflow mine waters easily leak. This interpretation can be proved by the result of the mine water leakage investigation results in Table 4.
The groundwater levels of BH-02 fluctuated between 108.72 m and 113.70 m for eight months of monitoring. Although the mean value of the groundwater level of BH-02 did not exceed the elevation of neighboring mine drift No. 3 or No. 5, the difference between the maximum groundwater level of BH-02 (113.70 m) and the elevation of mine drift No. 5 (115 m) was calculated as only 1.3 m. Figure 5c also shows that the maximum groundwater level of BH-02 is similar to the elevation of mine drift No. 5. This indicates that mine drift No. 5 might be inundated when unexpected heavy rain occurs or when groundwater flows in the study area.
In the case of BH-04, the groundwater level exceeded 143 m. The inundation and mine water leakage of new mine drift was associated with this result. However, BH-04 was more than 100 m from the mine drift No. 3 or No. 5. Hence, it was difficult to analyze the association between the groundwater level of BH-04 and the possibility of inundation of mine drift No. 3.
When taking into account the overall results of changes in groundwater levels, the mine opening sealing for new mine drift (essentially) and No. 5 (conservative perspective) was needed to prevent and control the mine water leakages. Furthermore, continuous monitoring of the groundwater rebound of both boreholes and mine drifts, as well as mine water leakages though the mine entrances, was required.
5. Discussion
5.1. Accuracy of the UMineAR
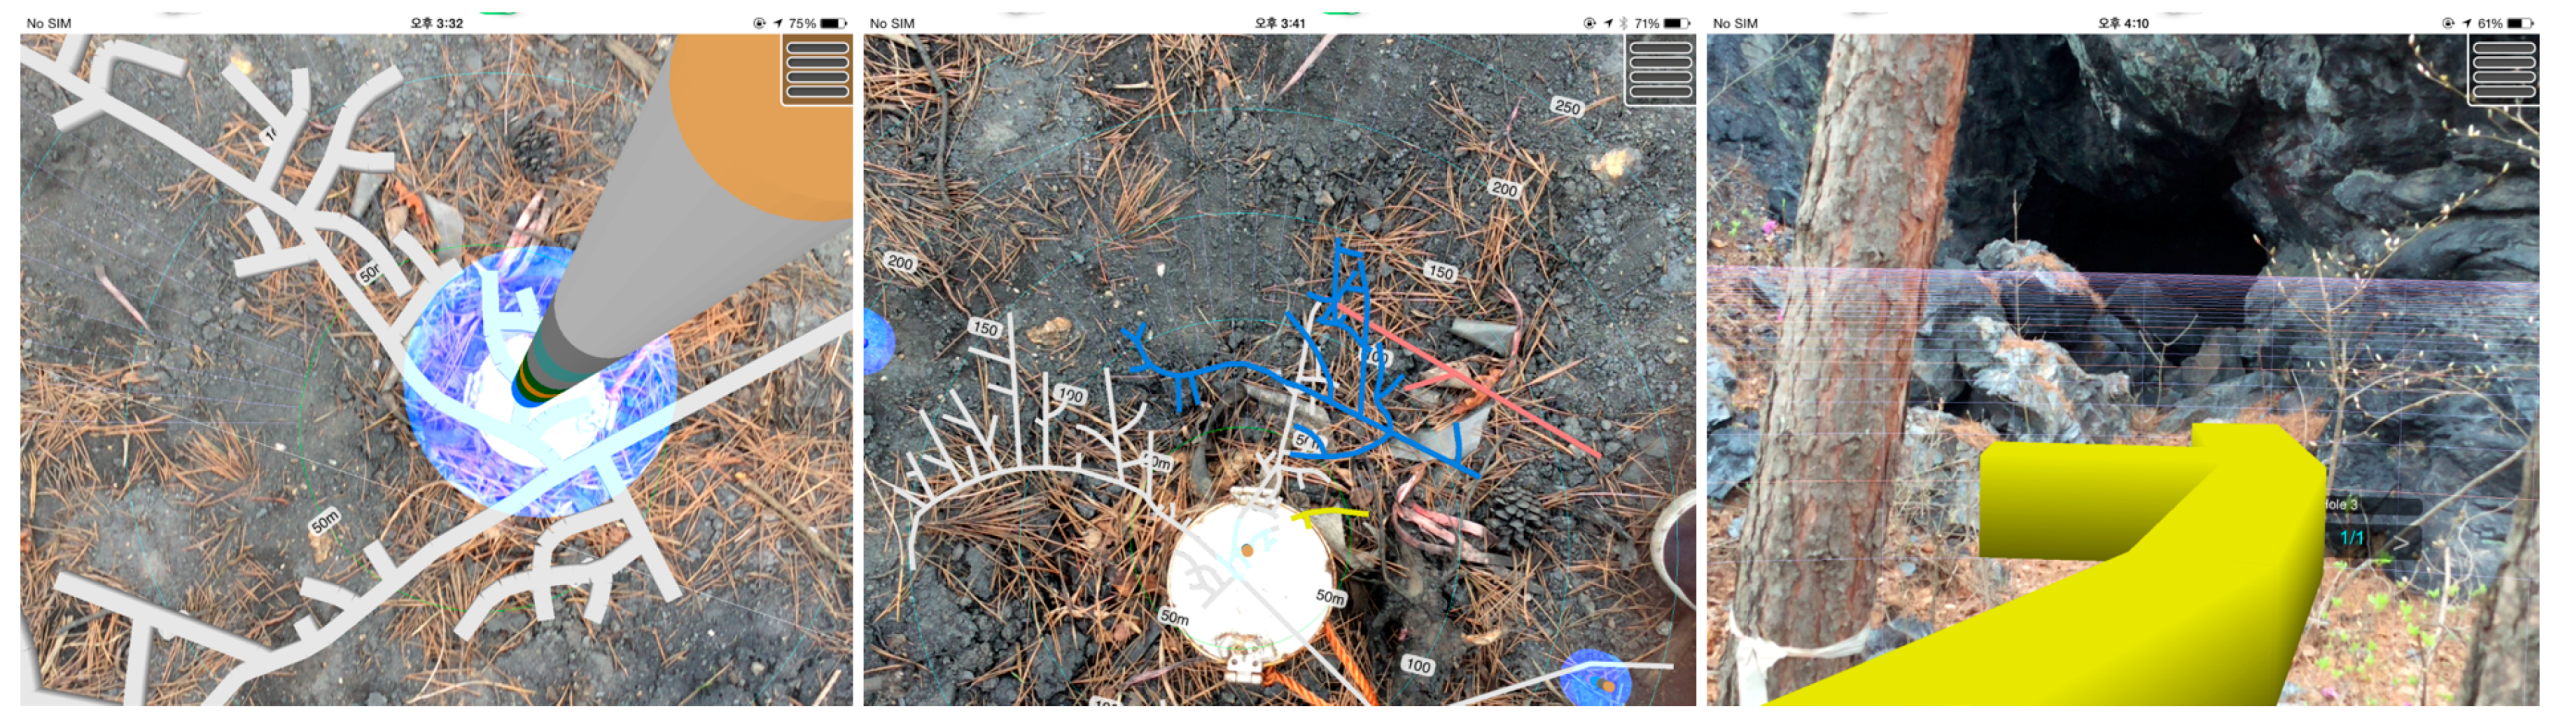
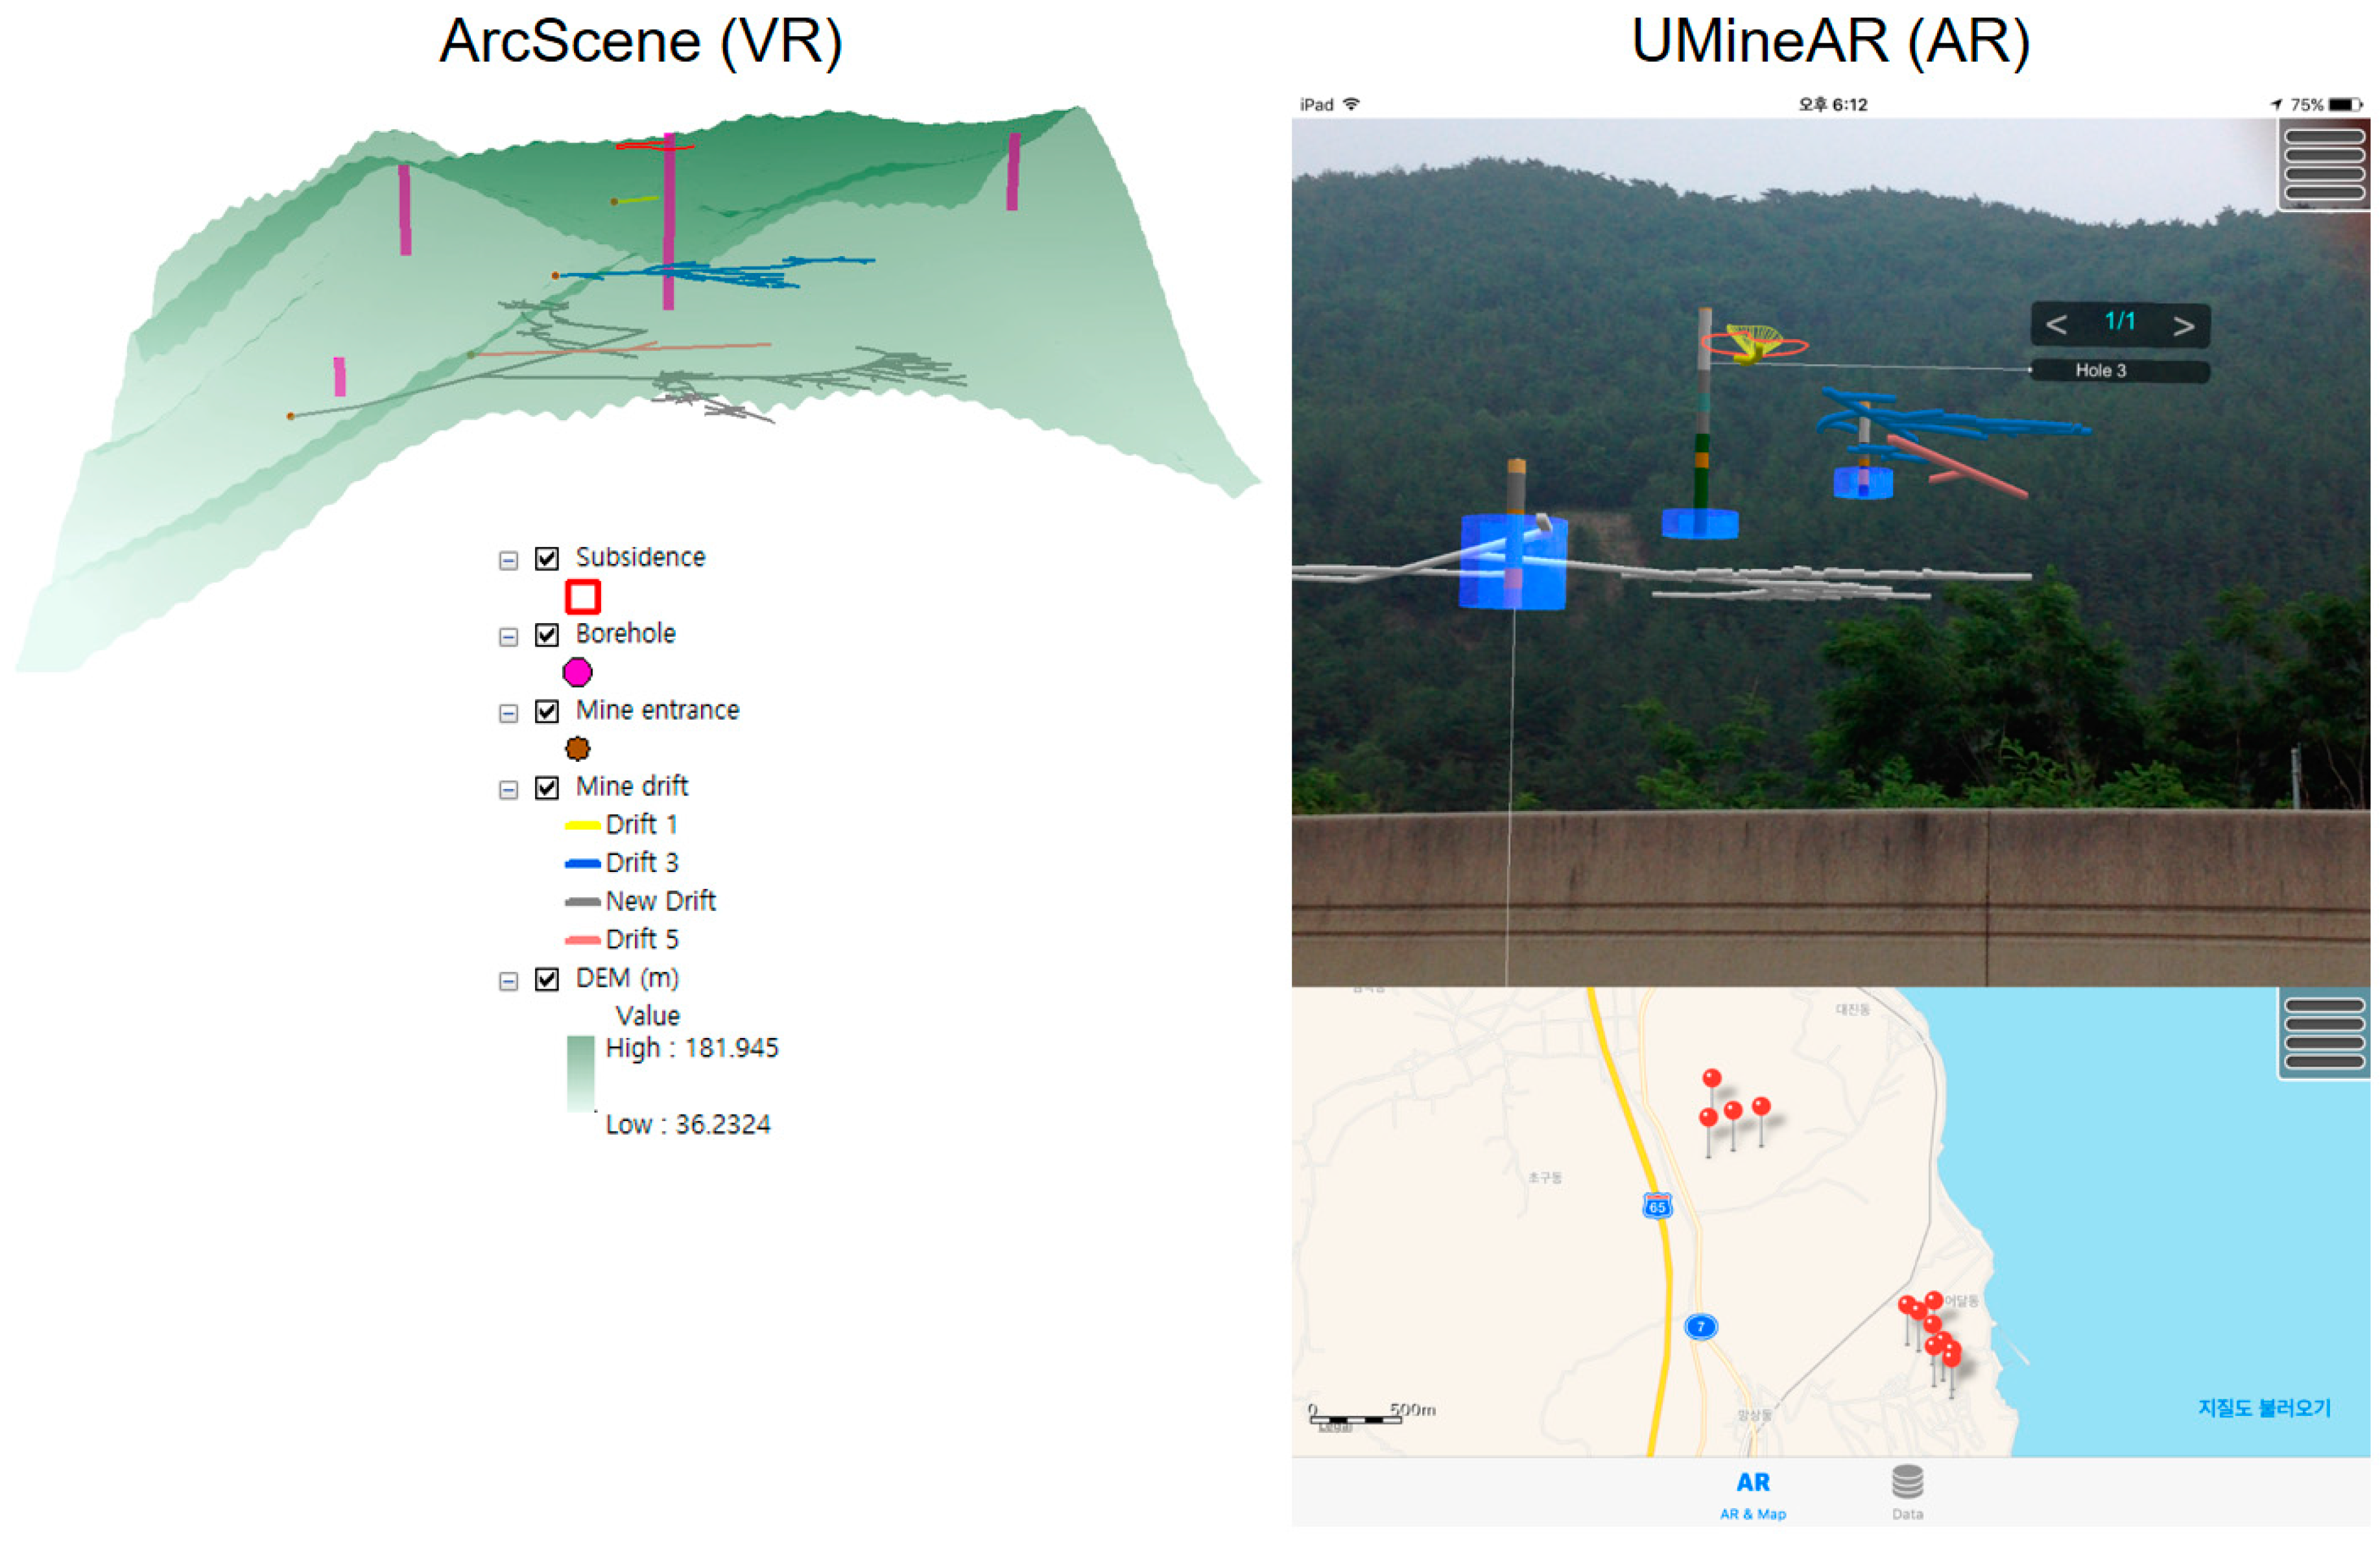
Registration and sensing errors are the most significant problems in building effective AR systems. The accuracy of UMineAR was qualitatively examined by comparing the locations of mine objects visualized in UMineAR with those of GIS features and the real world. Furthermore, the inherent positional error of the iPad device was quantitatively examined. Figure 6 shows the cross-sectional view of mine objects displayed in virtual reality (VR)-based ArcScene software (ESRI, Redland, CA, USA) and AR-based UMineAR. Both approaches show 3D visualization of subsurface features in the abandoned mine site. Unlike AR-based visualization, VR-based ArcScene software provides a simplified 3D model of geospatial data, including mine drifts and boreholes. A comparison of visualizations shows that the distributions of mine objects (e.g., mine relief as the background, mine drifts, and boreholes) displayed in AR roughly coincide with the distributions of GIS features of mine objects displayed in VR. Figure 7 shows a screenshot from UMineAR presenting the plane view of mine drifts and boreholes superimposed on the real world. From Figure 7, it is proven that the locations of the boreholes displayed in UMineAR coincide with the locations of actual boreholes in the real world. Unlike the borehole that was exposed to the ground, it was difficult to assess the positional accuracy of the mine drift since mine drift was invisible.
The accuracy of the UMineAR can be divided into two aspects; positional accuracy of x- and y-coordinates of the device and orientation accuracy (azimuth). The exact location of actual borehole and mine entrance exposed to the ground were compared with them displayed in UMineAR system. The positional accuracy of the iPad device was approximately ±7 m for the Wi-Fi only environment and ±5 m for the Wi-Fi + Cellular network environment while outdoors when the Global Navigation Satellite System (GNSS) service was available. The positional accuracy while indoors was not assessed because UMineAR was dedicated to a mobile outdoor application. The error in the determination of the mine entrance (or borehole) orientation (direction) fluctuated between 0° and 10° when the target object was located within a distance of 50 m. The degree of positional accuracy of the UMineAR was similar to that of the BoreholeAR application [3]. The variation in values appears related to magnetic interferences of metal structures near the device, and to internal electronic components of the device. Interferences caused by magnetic structures, such as ferromagnetic pillars, influence the geomagnetic field data and result in measurement errors [18]. Therefore, further studies to reduce the variations in such values are necessary to improve the reliability of the proposed mobile system.
5.2. Advantages and Limitations of UMineAR
The advantages of UMineAR in mining hazard site investigation compared with the conventional approach can be summarized in the four aspects of data sharing, location awareness, enhanced understanding, and effective survey work. First, the proposed system enables the easy construction and visual presentation of large amounts of mine GIS data (maps), available to a user in a 2D map and 3D real-time video, through data streaming using the mobile device. Second, it offers intuitive information in locating the user position during the abandoned mine survey, and it assists the user in elucidating the environment of nearby areas. Third, it provides a novel method for exploring invisible underground mine objects in the field. Users can thus intuitively understand underground geological structures or networks. Moreover, it negates the need to understand mapping techniques when referencing 3D models to the above ground. Fourth, it eases the overall inspection process (i.e., geolocating, data retrieving, visualizing, understanding, and subsurface interpretation) by significantly reducing the time and cost required to run a geological site investigation. Table 6 summarizes a comparison between mining hazard management based on the conventional method and UMineAR.
Despite advances in effective visualization, it remains challenging to improve the positional accuracy and analytical functions for a mining hazard site investigation support system when compared with the state of the art. From several field surveyors who investigated the Waryong mine using UMineAR, we obtained some feedback and comments to improve applicability of the developed system. First, the accuracy of the representation of mine object locations depends on the quality of the data on the mobile device’s location and orientation. Thus, more stable compensation methods are required to improve the usability of the system. Second, although this study employed a standard method of AR visualization, the application of an advanced data visualization method, such as the dig box, multi-view technique [19], is required to display the underground mine GIS data more effectively and intuitively. Third, the attribute data retrieval option of mine drifts, boreholes, and groundwater levels is necessary to analyze the groundwater rebound problem and maximize the applicability of UMineAR to mining hazard site investigation.
UMineAR differs from the BoreholeAR application developed in a previous study [3] in terms of the main functions, AR-based visualization dimensions and items, and database elements (Table 7). UMineAR is intended to assist in investigating and managing mining hazard sites and visualizing various object mine drifts, mine entrances, boreholes with groundwater levels, subsidence, and influential zones in a 3D realistic view in abandoned mine areas using both static and dynamic mine GIS datasets. Conversely, BoreholeAR was developed to visualize the locations of boreholes as a point only in a 2.5D view, thereby only assisting in examining the static borehole information with text data.
6. Conclusions
The UMineAR application provides an intuitive visualization of the various mine objects (i.e., mine drifts, mine entrances, borehole with groundwater levels, subsidences, and influential zones by the mined cavity) in 3D AR video and the 2D map simultaneously. The user can thus readily identify and understand the distributions of the mine objects and mining hazards. The proposed mobile outdoor AR application is particularly applicable to supporting mining hazard site investigation activities since it is suited for on-site visualization of large quantities of mine GIS data based on the geolocation. No specialized equipment or skills are required to understand and interpret the 3D mine GIS data presented by the application. From this standpoint, the UMineAR application can serve as a next-generation mining hazard site investigation support system if abundant mine GIS databases, including hazard information, are constructed. In addition, the hardware specifications required for UMineAR are generally included in recent smartphones or mobile tablets. Furthermore, the system development toolkit (SDK) of the Android system allows for utilizing various module codes for each function needed to develop AR-based system. Therefore, this application can be developed on any other mobile platform such as Android environment. However, the programming language and code of Android SDK are different from that of iOS and thus the library and code (except Proj.4 library for the use of coordinate transform) used in this study cannot be directly re-used in developing an Android-based AR system.
Despite the advantageous aspects of UMineAR, work is still required to improve the accuracy, visualization techniques, and functionality. Furthermore, if current geophysical prospecting data (e.g., resistivity data) over the given area were added to the application, it would be helpful to complement the application to interpret and manage mining hazard sites. With current development of UMineAR, the proposed approach cannot be substituted for the conventional method, which remains necessary to survey and manage mining hazard sites. The methods should be employed in combination for site investigation works to date.
Acknowledgments
This work was supported by the (1) Basic Science Research Program through the National Research Foundation of Korea (NRF) funded by the Ministry of Education (2015R1D1A1A01061290), the (2) Korea Energy and Mineral Resources Engineering Program funded by the Ministry of Trade, Industry and Energy and the (3) Basic Research Project of the Korea Institute of Geoscience and Mineral resources (KIGAM) funded by the Ministry of Science, ICT and Future Planning of Korea.
Author Contributions
Jangwon Suh and Yosoon Choi conceived and designed the application; Sangho Lee developed the application; Jangwon Suh and Yosoon Choi analyzed the data; Jangwon Suh and Yosoon Choi wrote the paper.
Conflicts of Interest
The authors declare no conflict of interest.
References
- Azuma, R.T. A Survey of Augmented Reality. Presence Teleoperators Virtual Environ. 1997, 6, 355–385. [Google Scholar] [CrossRef]
- Ababsa, F.; Zendjebil, I.; Didier, J.Y.; Pouderoux, J.; Vairon, J. Outdoor augmented reality system for geological applications. In Proceedings of the IEEE/ASME International Conference on Advanced Intelligent Mechatronics, AIM, Kaohsiung, Taiwan, 11–14 July 2012; pp. 416–421. [Google Scholar]
- Lee, S.; Suh, J.; Park, H.D. BoreholeAR: A mobile tablet application for effective borehole database visualization using an augmented reality technology. Comput. Geosci. 2015, 76, 41–49. [Google Scholar] [CrossRef]
- Huang, W.; Alem, L.; Livingston, M.A. Human Factors in Augmented Reality Environments; Springer Science and Business Media: Berlin, Germany, 2012. [Google Scholar]
- Suh, J.; Choi, Y.; Park, H.-D. GIS-based evaluation of mining-induced subsidence susceptibility considering 3D multiple mine drifts and estimated mined panels. Environ. Earth Sci. 2016, 75, 890–908. [Google Scholar] [CrossRef]
- Hitchcock, L.; Sanders, M. Survey of Human Factors in Underground Bituminous Coal Mining; Naval Ammunition Depot: Crane, IN, USA, 1971. [Google Scholar]
- Alem, L.; Tecchia, F.; Huang, W. Remote Tele-assistance System for Maintenance Operators in Mines. In Proceedings of the 11th Underground Coal Operators’ Conference, University of Wollongong and the Australasian Institute of Mining and Metallurgy, New South Wales, Australia, 10–11 February 2011; pp. 171–177. [Google Scholar]
- Mathiesen, D.; Myers, T.; Atkinson, I.; Trevathan, J. Geological visualisation with augmented reality. In Proceedings of the 2012 15th International Conference on Network-Based Information Systems, NBIS 2012, Melbourne, Australia, 26–28 September 2012; pp. 172–179. [Google Scholar]
- Westhead, R.K.; Smith, M.; Shelley, W.A.; Pedley, R.C.; Napier, B. Mapping the geological space beneath your feet. In Proceedings of the International Conference on Information Society, London, UK, 2012; pp. 3–6. [Google Scholar]
- Westhead, R.; Smith, M.; Shelley, W.; Pedley, R.; Ford, J.; Napier, B. Mobile spatial mapping and augmented reality applications for environmental geoscience. J. Internet Technol. Secur. Trans. 2013, 2, 185–190. [Google Scholar]
- Schall, G.; Zollmann, S.; Reitmayr, G. Smart Vidente: Advances in mobile augmented reality for interactive visualization of underground infrastructure. Pers. Ubiquitous Comput. 2013, 17, 1533–1549. [Google Scholar] [CrossRef]
- Zhang, X.; Han, Y.; Hao, D.S.; Lv, Z. ARGIS-based outdoor underground pipeline information system. J. Vis. Commun. Image Represent. 2016, 40, 779–790. [Google Scholar] [CrossRef]
- Behzadan, A.H.; Kamat, V.R. Georeferenced Registration of Construction Graphics in Mobile Outdoor Augmented Reality. J. Comput. Civ. Eng. 2007, 21, 247–258. [Google Scholar] [CrossRef]
- Khalid, C.M.L.; Fathi, M.S.; Mohamed, Z. Integration of Cyber-Physical Systems Technology with Augmented Reality in the Pre-Construction. In Proceedings of the 2014 2nd International Conference on Technology, Informatics, Management, Engineering and Environment, Bandung, Indonesia, 19–21 August 2014; pp. 151–156. [Google Scholar]
- Maptek. What is PerfectDig? Available online: http://www.maptek.com/products/perfectdig/perfectdig_faq.html (accessed on 30 August 2017).
- Michalak, D. Applying the Augmented Reality and RFID Technologies in the Maintenance of Mining Machines. In Proceedings of the World Congress on Engineering and Computer Science 2012, San Francisco, CA, USA, 24–26 October 2012; pp. 24–26. [Google Scholar]
- MIRECO (Mine Reclamation Corporation). Database Guideline of Mine Geographic Information System; Mine Reclamation Corporation: Wonju, Korea, 2010; pp. 20–39. [Google Scholar]
- Barthold, C.; Subbu, K.P.; Dantu, R. Evaluation of gyroscope-embedded mobile phones. In Proceedings of the 2011 IEEE International Conference on Systems, Man, and Cybernetics (SMC), Anchorage, AK, USA, 9–12 October 2011; pp. 1632–1638. [Google Scholar]
- Eren, M.T.; Cansoy, M.; Balcisoy, S. Multi-view augmented reality for underground exploration. In Proceedings of the IEEE Virtual Reality, Orlando, FL, USA, 16–20 March 2013; pp. 117–118. [Google Scholar]
Figure 1.
Conceptual (architectural) diagram of the mobile-tablet-based UMineAR (Underground Mine Augmented Reality).
Figure 1.
Conceptual (architectural) diagram of the mobile-tablet-based UMineAR (Underground Mine Augmented Reality).

Figure 2.
Components of UMineAR. (a) search option interface for the mine GIS database; (b) search option interface for groundwater monitoring data only; (c) AR interface; (d) map interface.
Figure 2.
Components of UMineAR. (a) search option interface for the mine GIS database; (b) search option interface for groundwater monitoring data only; (c) AR interface; (d) map interface.

Figure 3.
Distribution of mine drifts, mine entrances, boreholes, and subsidence in the study area (2D view in GIS).
Figure 3.
Distribution of mine drifts, mine entrances, boreholes, and subsidence in the study area (2D view in GIS).
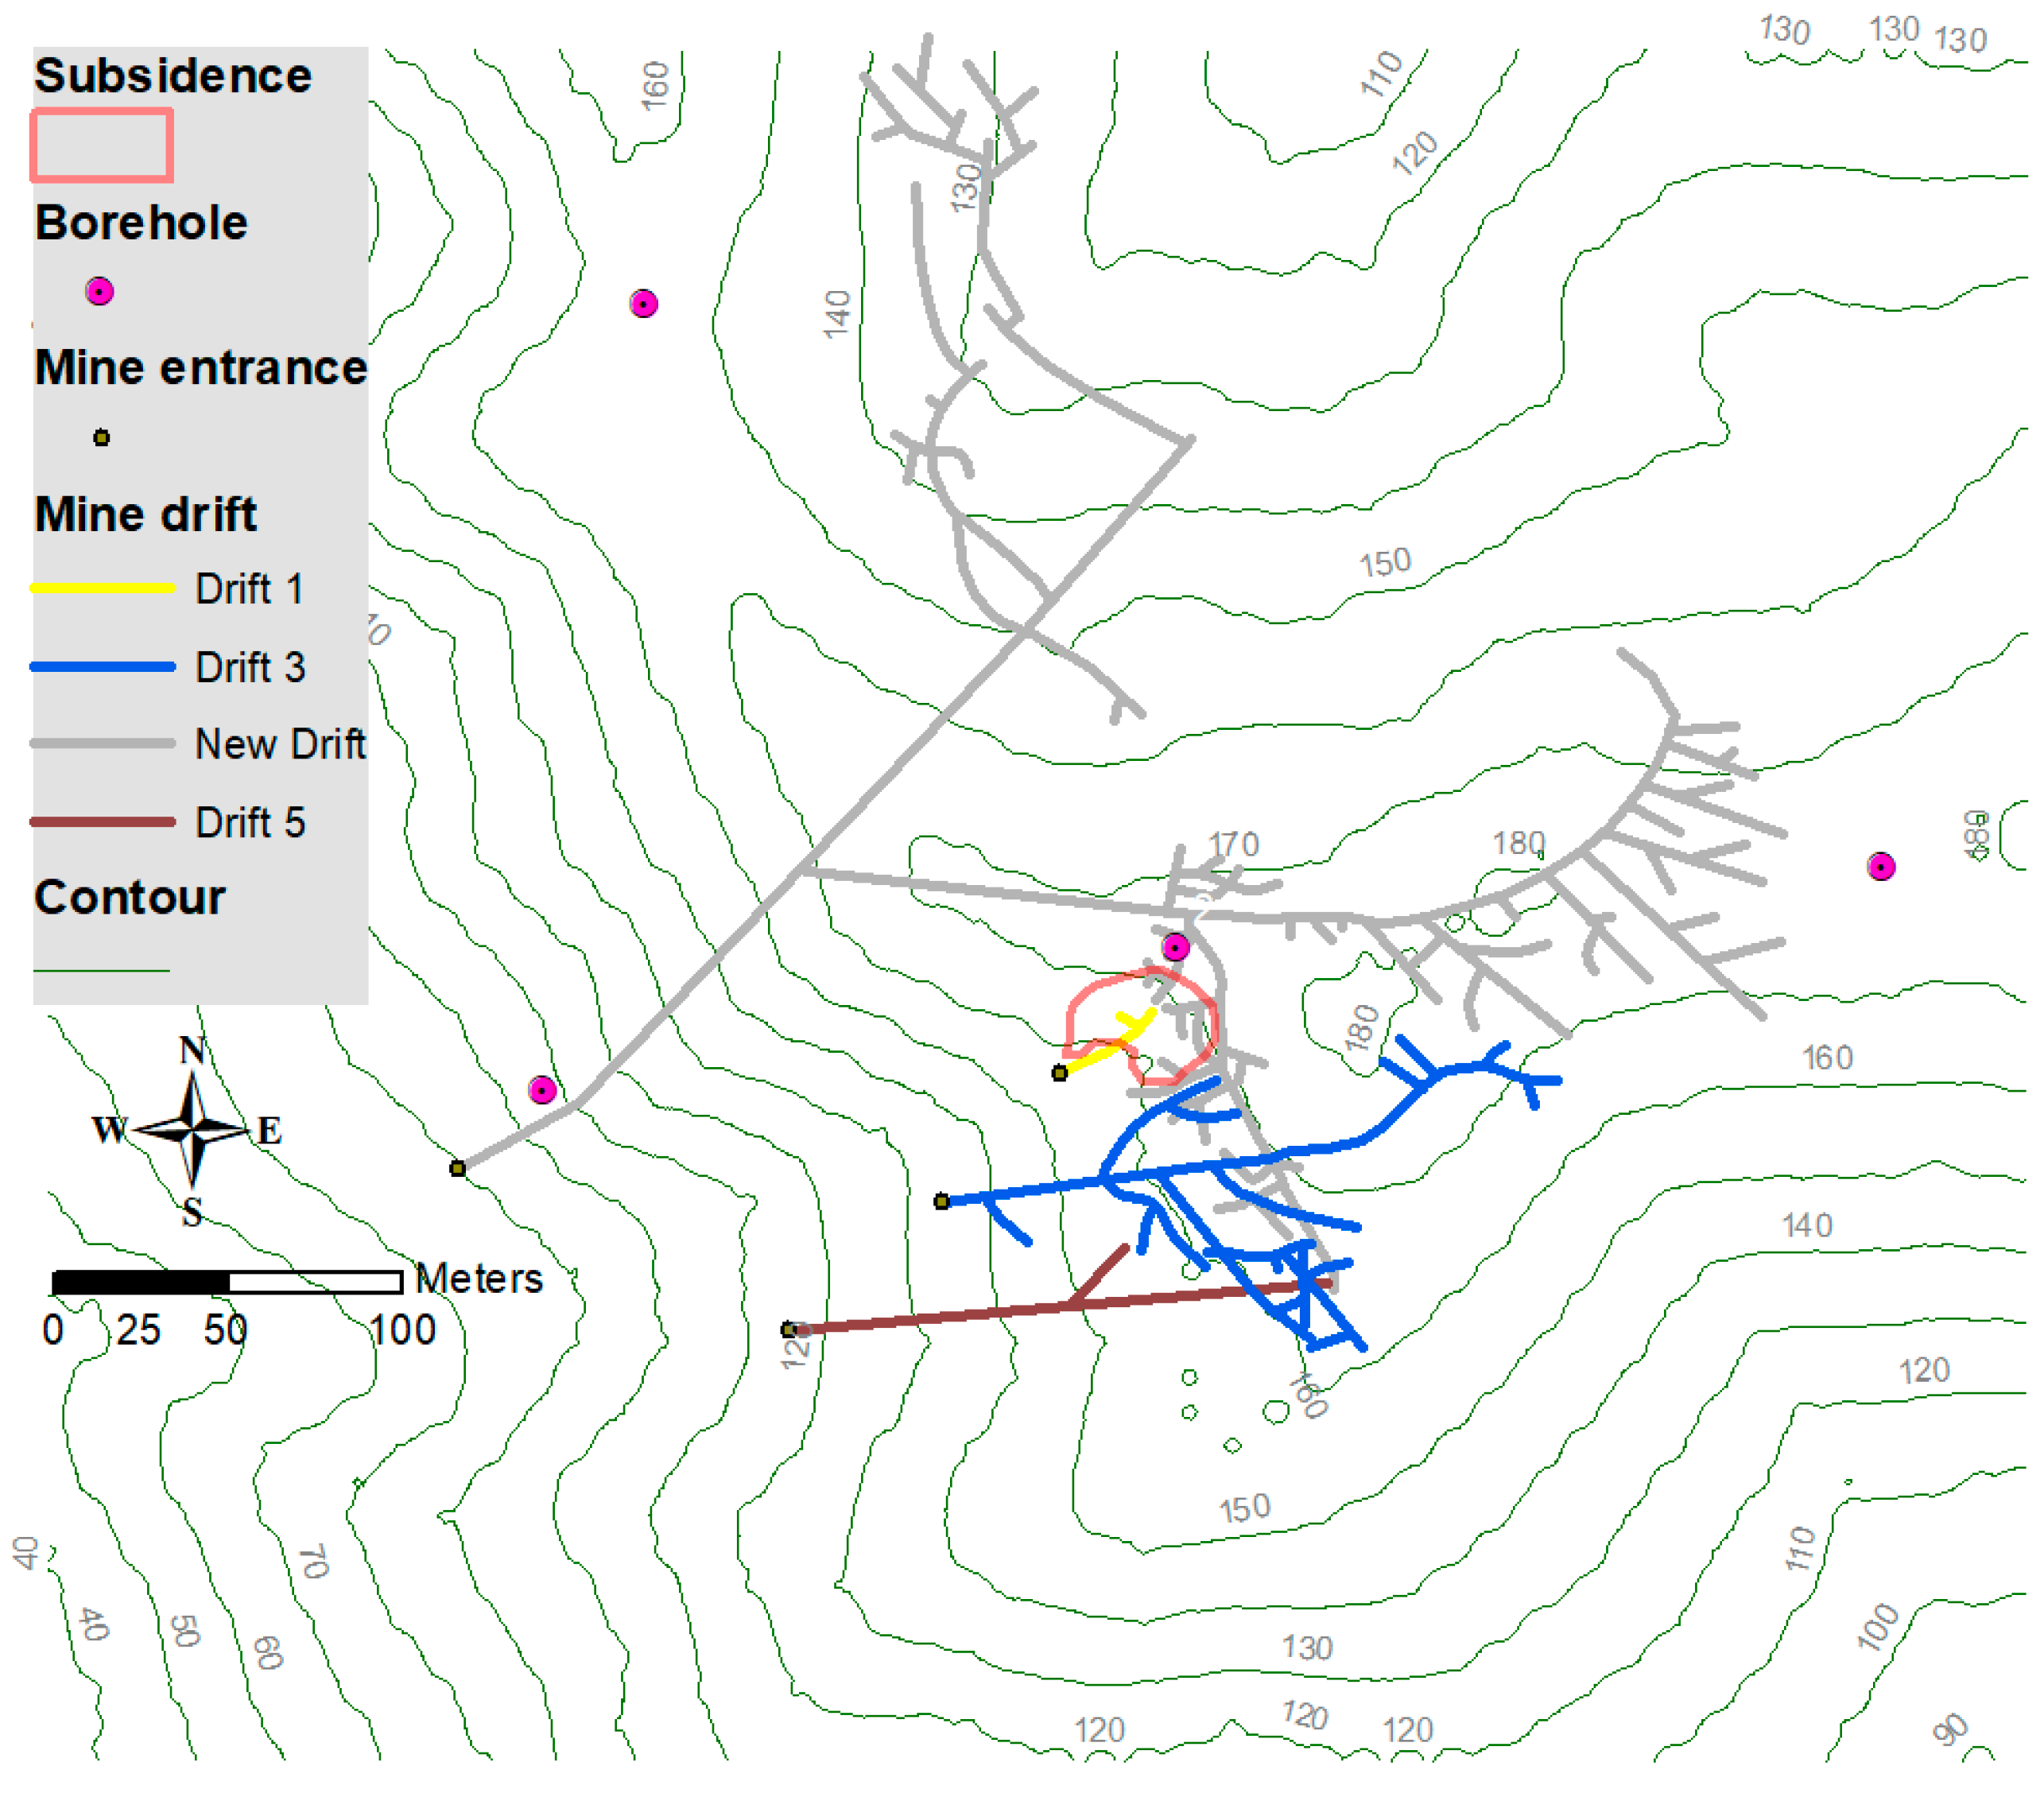
Figure 4.
Visualization of the mine GIS dataset of the Waryong coal mine using UMineAR. (a) screenshot showing a lateral (cross-section) camera view with superimposed mine drifts, boreholes, and subsidence (top inset) and a 2D map of the device location (bottom inset); (b) photo of investigation.
Figure 4.
Visualization of the mine GIS dataset of the Waryong coal mine using UMineAR. (a) screenshot showing a lateral (cross-section) camera view with superimposed mine drifts, boreholes, and subsidence (top inset) and a 2D map of the device location (bottom inset); (b) photo of investigation.
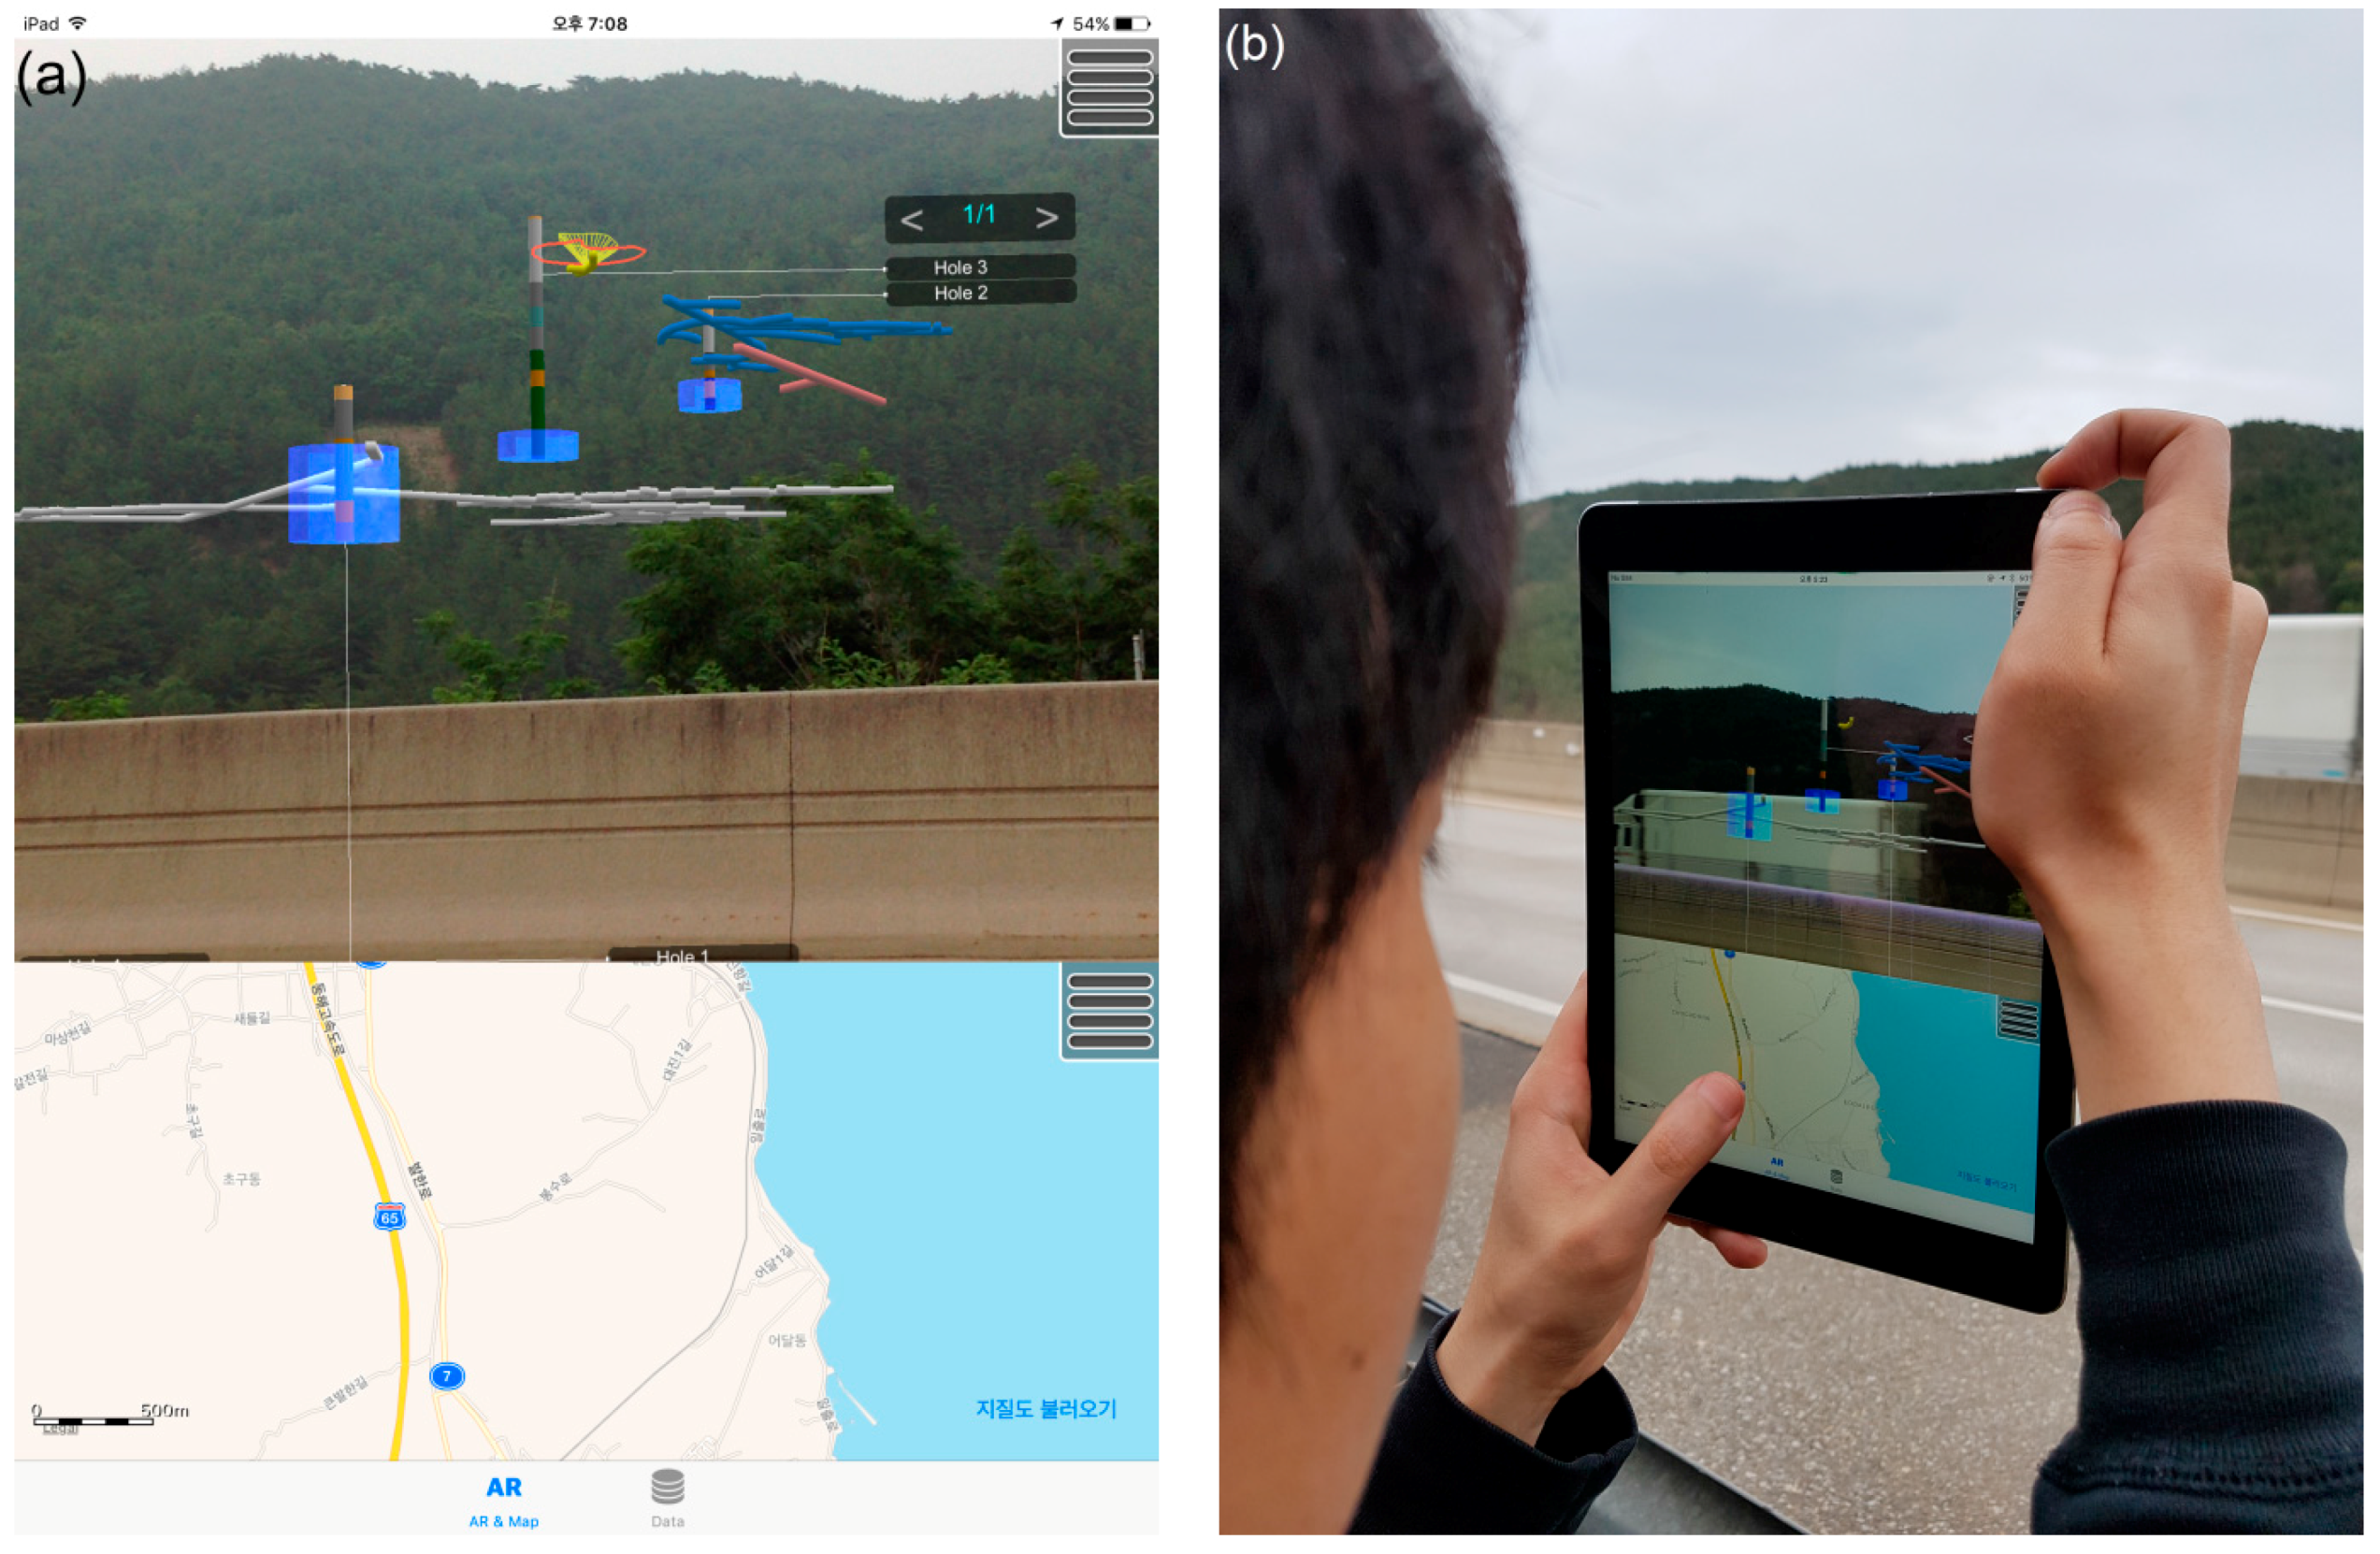
Figure 5.
Results of groundwater level fluctuations of borehole No. 2: (a) minimum (18 April 2017); (b) current (20 June 2017); (c) maximum (15 November 2016).
Figure 5.
Results of groundwater level fluctuations of borehole No. 2: (a) minimum (18 April 2017); (b) current (20 June 2017); (c) maximum (15 November 2016).
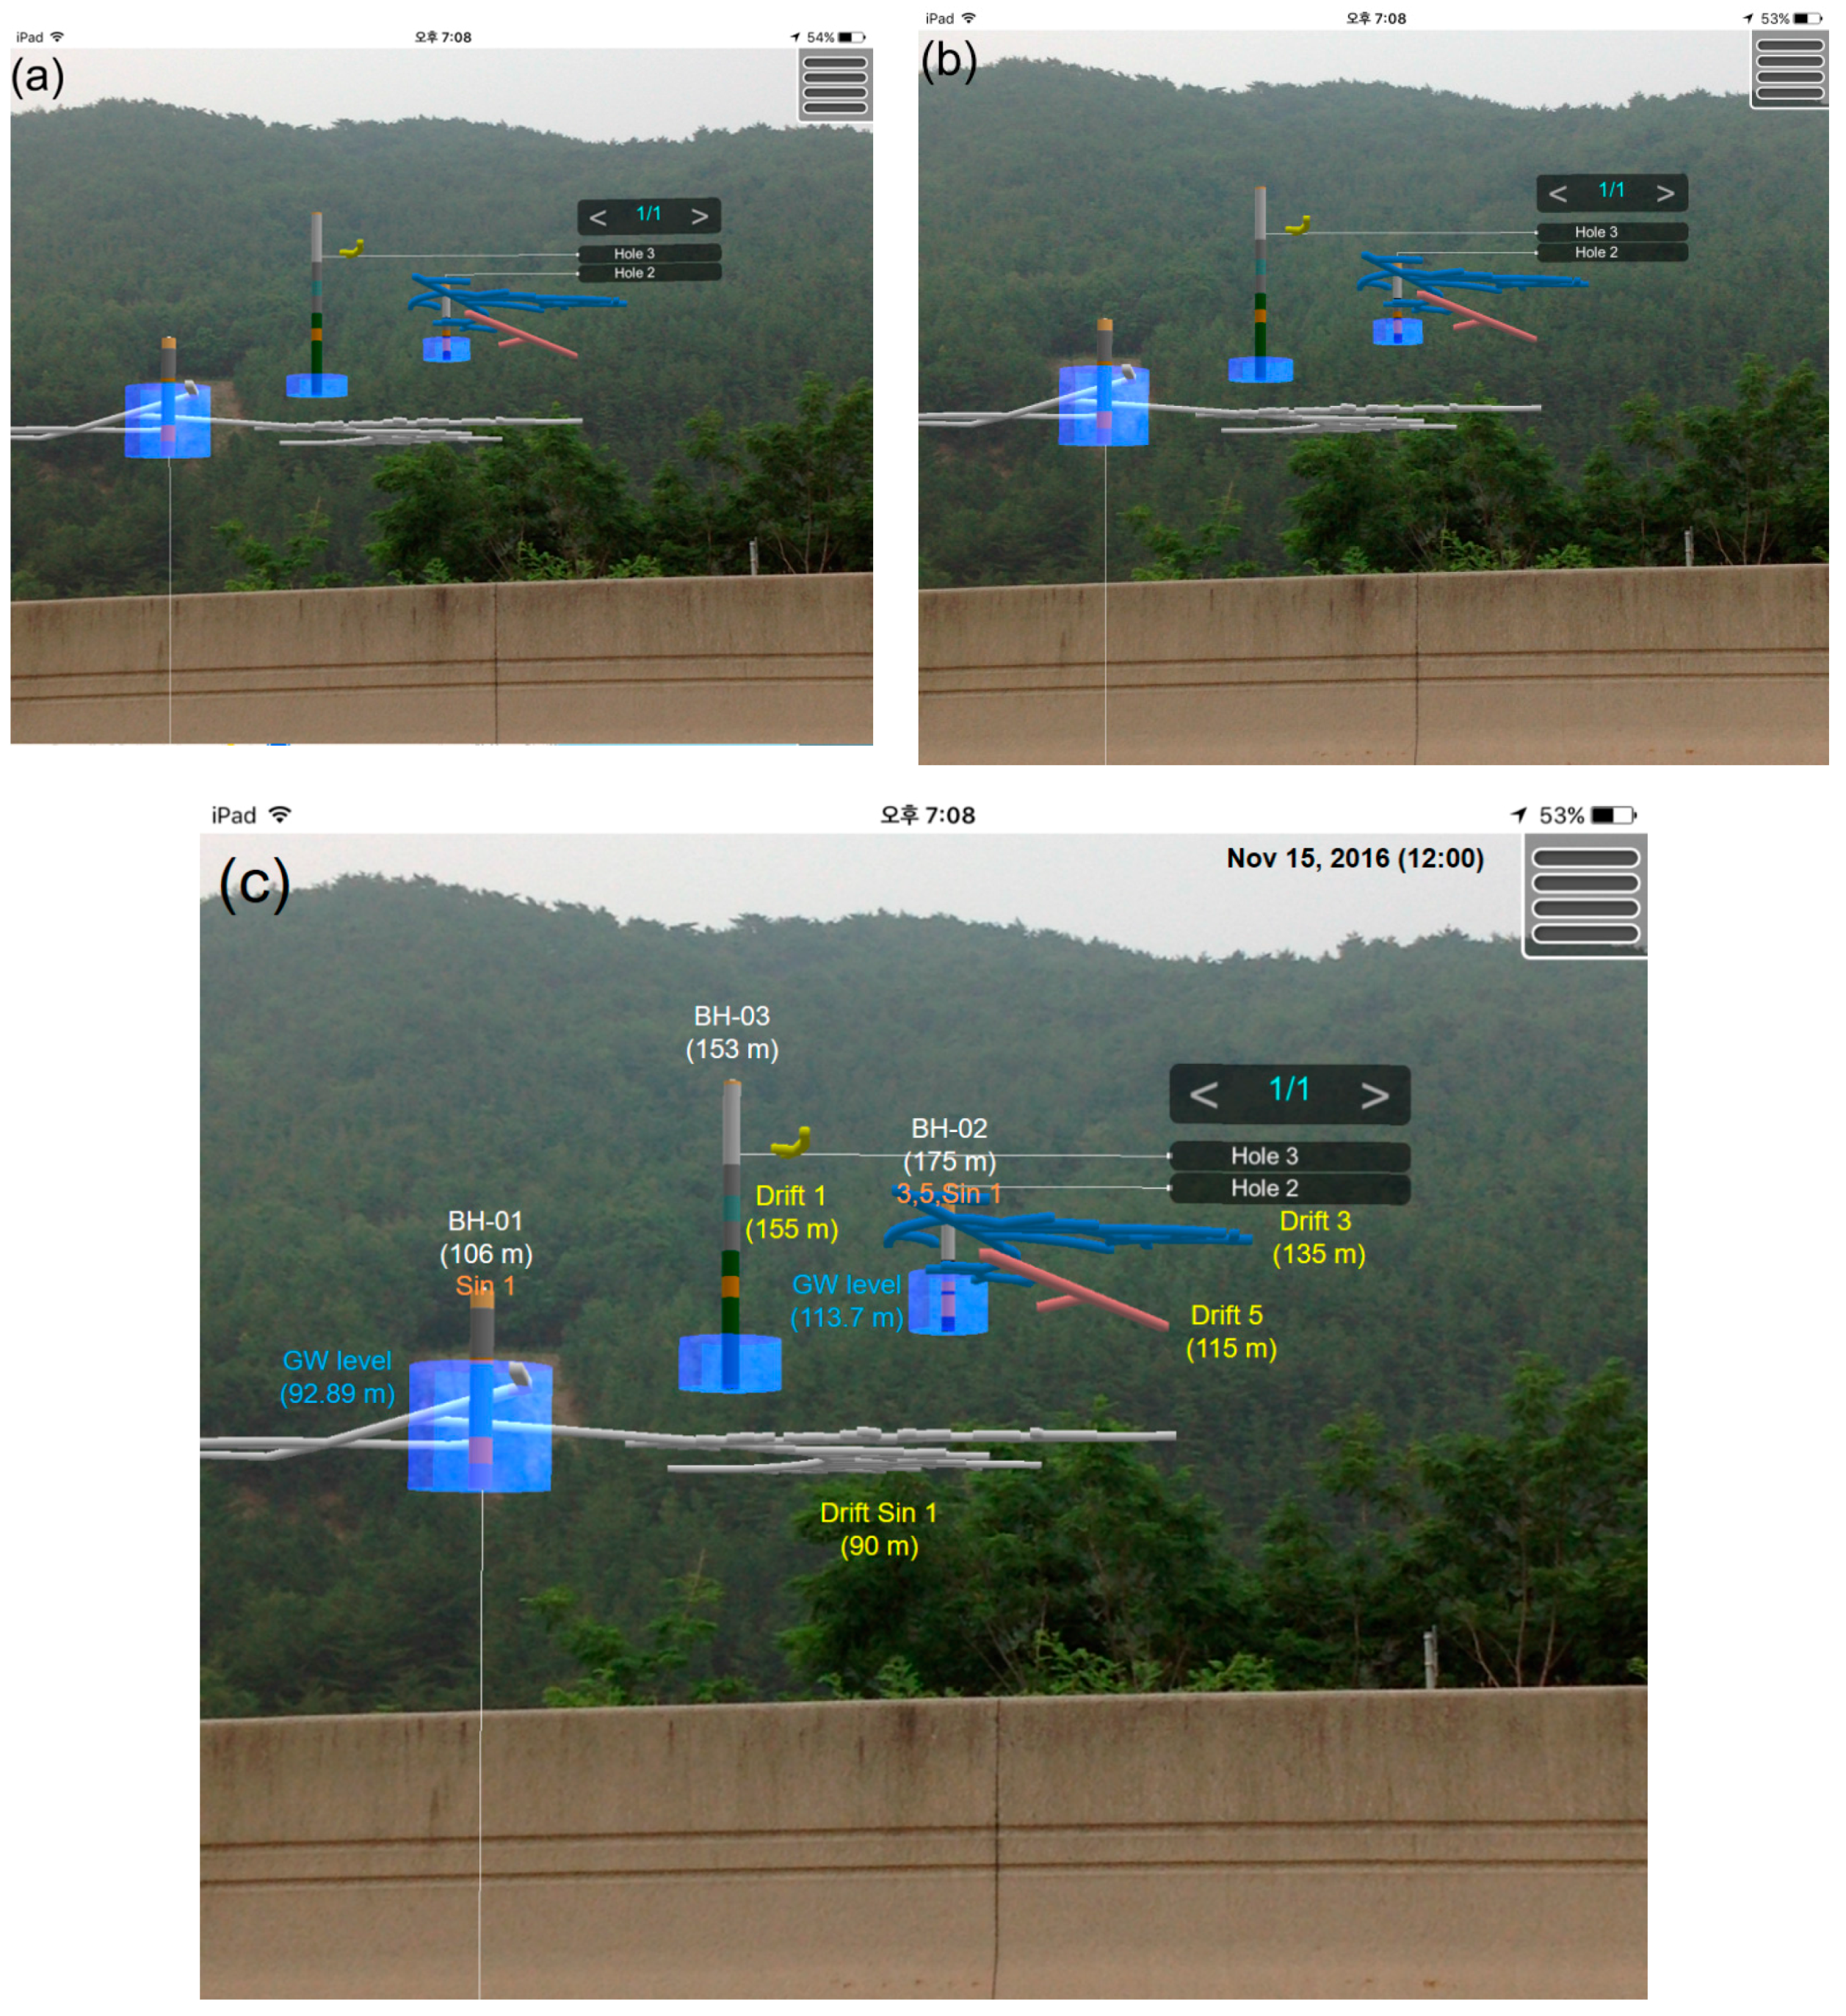
Figure 6.
Comparison of mine drifts, mine entrances, boreholes, and subsidence visualized in ArcScene software (VR) and UMineAR (AR).
Figure 6.
Comparison of mine drifts, mine entrances, boreholes, and subsidence visualized in ArcScene software (VR) and UMineAR (AR).

Figure 7.
Comparison of the location of boreholes, mine drifts, and mine entrances in the real world (reality) and UMineAR (AR).
Figure 7.
Comparison of the location of boreholes, mine drifts, and mine entrances in the real world (reality) and UMineAR (AR).

Table 1.
Summary of hardware specifications of the iPad Pro used as the platform in this study.
| Model | Wi-Fi + Cellular |
|---|---|
| System-on-chip | Apple A10X Fusion |
| Memory | 2GB LPDDR4 RAM |
| Screen Resolution | 2224 × 1668 pixels (264 ppi) |
| Camera | Rear: 12 megapixels; Front: 7 megapixels |
| Global Navigation Satellite System | Assisted GPS, GLONASS |
| Accelerometer | 3-axis accelerometer |
| Gyroscope | 3-axis gyroscope |
Table 2.
List of libraries and their utilization for the development of UMineAR (added from [3]).
Table 2.
List of libraries and their utilization for the development of UMineAR (added from [3]).
| Library | Classification | Utilization | Details |
|---|---|---|---|
| CoreMotion | On-board | AR | Accelerometer, compass, gyroscope |
| CoreLocation | On-board | AR, map | Assist GPS |
| CoreGraphics | On-board | AR, map | AR user interface |
| AVFoundation | On-board | AR | Camera |
| MapKit | On-board | Map | Mapping |
| OpenGL ES | On-board | 3D graphic drawing | 3D drawing of vector data |
| Proj.4 | External | AR, map | Coordinate transform |
| Foundation | On-board | iOS App fundamental | iOS basic function and design |
| UIKit | On-board | iOS App fundamental | iOS basic function and design |
Table 3.
Items selected and added for the UMineAR database from mine database of MIRECO (added from [17]).
Table 3.
Items selected and added for the UMineAR database from mine database of MIRECO (added from [17]).
| Layer | Items | Code | Data Type | Source |
|---|---|---|---|---|
| Mine drift | Mine code | MIN_ID | VARCHAR2(8) | |
| Coal mine code | MIN_CDE | VARCHAR2(8) | ||
| Mine drift sequential number | GAN_SEQ | VARCHAR2(6) | ||
| Mineral classification | MIN_CLS | VARCHAR2(1) | ||
| Mine drift code | GAN_CDE | VARCHAR2(3) | ||
| Mine group (Level) sequential number | LEV_SEQ | VARCHAR2(2) | ||
| Mine drift name | GAN_NAM | VARCHAR2(50) | ||
| Mine group (Level) name | LEV_NAM | VARCHAR2(50) | ||
| Code for type of mine drift | GAN_CLS | VARCHAR2(2) | ||
| Elevation | WTR_LEV | NUMBER(19,5) | ||
| Geographical coordinate | GAN_POS | VARCHAR2(254) | ||
| Mine entrance | Mine code | MIN_ID | VARCHAR2(8) | |
| Coal mine code | MIN_CDE | VARCHAR2(8) | ||
| Mine entrance sequential number | GAN_CDE | NUMBER(4) | ||
| Mine entrance name | GAN_NAM | VARCHAR2(50) | ||
| Mineral classification | MIN_CLS | VARCHAR2(1) | ||
| Elevation | WTR_LEV | NUMBER(7,2) | ||
| Status of closure | GAN_NOT | VARCHAR2(1) | ||
| Description for location | GAN_POS | VARCHAR2(254) | ||
| Groundwater level in a borehole | Mine code | MIN_ID | VARCHAR2(8) | |
| Coal mine code | MIN_CDE | VARCHAR2(8) | ||
| Investigation code | JSK_CDE | VARCHAR2(4) | ||
| Investigation site code | JJK_CDE | VARCHAR2(2) | ||
| Borehole code | BOH_CDE | VARCHAR2(6) | ||
| Borehole number | BOH_NUM | VARCHAR2(50) | ||
| Date | DAT_VAL | VARCHAR2(8) | Added | |
| Time | TIM_VAL | VARCHAR2(4) | Added | |
| Groundwater level | GWL_VAL | VARCHAR2(8) | Added | |
| Groundwater elevation from | GEF_VAL | NUMBER(19,5) | Added | |
| Groundwater elevation to | GET_VAL | NUMBER(19,5) | Added | |
| Elevation | WTR_LEV | NUMBER(19,5) | ||
| Geographical coordinate | GAN_POS | VARCHAR2(254) | ||
| Subsidence | Mine code | MIN_ID | VARCHAR2(8) | |
| Coal mine code | MIN_CDE | VARCHAR2(8) | ||
| Subsidence code | SUB_CDE | VARCHAR2(4) | Added | |
| Subsidence number | SUB_NUM | VARCHAR2(50) | Added | |
| Influential zone number | IFZ_NUM | VARCHAR2(50) | Added | |
| Mine drift sequential number | GAN_SEQ | VARCHAR2(6) | Added | |
| Elevation | WTR_LEV | NUMBER(19,5) | ||
| Geographical coordinate | GAN_POS | VARCHAR2(254) |
Table 4.
Status of mine drifts, mine entrances, and mine water leakage in study area.
| Name of Drift | Elevation (ML) | Type | Mine Opening Sealing | Mine Water Leakage | Reinforcement |
|---|---|---|---|---|---|
| Drift No. 1 | 155 | Horizontal | Closed by collapse | No | No |
| Drift No. 3 | 135 | Horizontal | Closed by collapse | No | No |
| Drift No. 5 | 115 | Horizontal | Closed by collapse | No | No |
| New Drift | 90 | Horizontal | Closed by collapse | Yes | Partially |
Table 5.
Summary of groundwater level data for four boreholes obtained from sensor measurement.
| Borehole No. | Borehole Elev. (m) | Date and Time | Groundwater Level (m) | Statistics | Monitoring from |
|---|---|---|---|---|---|
| BH-01 | 106.00 | 2017-06-20 12:00 | 91.79 | Min | 26 October 2016 |
| 2017-06-20 12:00 | 91.79 | Latest | |||
| 2016-10-27 09:00 | 93.02 | Max | |||
| BH-02 | 175.00 | 2017-04-18 16:00 | 108.72 | Min | 15 November 2016 |
| 2017-06-20 12:00 | 108.87 | Latest | |||
| 2016-11-15 12:00 | 113.70 | Max | |||
| BH-03 | 153.00 | 2017-06-01 15:00 | 113.34 | Min | 15 November 2016 |
| 2017-06-20 12:00 | 113.49 | Latest | |||
| 2017-01-18 3:00 | 117.86 | Max | |||
| BH-04 | 178.00 | 2017-04-18 15:00 | 143.20 | Min | 15 November 2016 |
| 2017-06-20 12:00 | 143.34 | Latest | |||
| 2016-11-30 04:00 | 150.60 | Max |
Table 6.
Comparison between the conventional survey and UMineAR-based approach for mine hazards site investigation.
Table 6.
Comparison between the conventional survey and UMineAR-based approach for mine hazards site investigation.
| Requirements and Investigation Steps | Conventional Investigation | UMineAR |
|---|---|---|
| GPS equipment | Have to be prepared separately | Integrated |
| Mine GIS maps | ||
| Groundwater level monitoring data | ||
| Location awareness | Manually performed | Automated |
| Data retrieval | ||
| Visual detection of mine objects | Difficult unless the mine objects are obviously exposed or explicitly marked on site | Locations of all mine objects are visible on the AR view |
| Data interpretation | Various types of data have to be interpreted without visual aid | Integrated data are displayed on a single screen |
| Overall inspection | Time and cost effective |
Table 7.
Primary difference between BoreholeAR application [3] and UMineAR (present study).
Table 7.
Primary difference between BoreholeAR application [3] and UMineAR (present study).
| Items | BoreholeAR | UMineAR |
|---|---|---|
| Usage | Borehole investigation | Abandoned mining hazards site investigation and management |
| AR visualization dimension | 2.5D view | 3D view |
| AR visualization items | Borehole | Borehole, mine drift, mine entrance, groundwater level, subsidence, and influential zone |
| AR visualization of borehole | 2D point | 3D object |
| AR visualization of subsurface layer | No (text in DB) | 3D object (as in borehole) |
| AR visualization of groundwater level | No (text in DB) | 3D object (as in borehole) |
| Groundwater level database | A single max value for each borehole | Numerous temporal real-time monitoring values using sensors for each borehole |
© 2017 by the authors. Licensee MDPI, Basel, Switzerland. This article is an open access article distributed under the terms and conditions of the Creative Commons Attribution (CC BY) license (http://creativecommons.org/licenses/by/4.0/).
Share and Cite
MDPI and ACS Style
Suh, J.; Lee, S.; Choi, Y. UMineAR: Mobile-Tablet-Based Abandoned Mine Hazard Site Investigation Support System Using Augmented Reality. Minerals 2017, 7, 198. https://doi.org/10.3390/min7100198
AMA Style
Suh J, Lee S, Choi Y. UMineAR: Mobile-Tablet-Based Abandoned Mine Hazard Site Investigation Support System Using Augmented Reality. Minerals. 2017; 7(10):198. https://doi.org/10.3390/min7100198
Chicago/Turabian StyleSuh, Jangwon, Sangho Lee, and Yosoon Choi. 2017. "UMineAR: Mobile-Tablet-Based Abandoned Mine Hazard Site Investigation Support System Using Augmented Reality" Minerals 7, no. 10: 198. https://doi.org/10.3390/min7100198
Note that from the first issue of 2016, this journal uses article numbers instead of page numbers. See further details here.