REE Incorporation into Calcite Individual Crystals as One Time Spike Addition


_Migdisov.png)
1
Department of Geosciences, Mississippi State University, Mississippi State, MS 39762, USA
2
ARC Centre of Excellence for Coral Reef Studies, The University of Western Australia, Crawley, WA 6009, Australia
3
Los Alamos National Laboratory, Los Alamos, NM 87545, USA
*
Author to whom correspondence should be addressed.
Minerals 2017, 7(11), 204; https://doi.org/10.3390/min7110204
Submission received: 15 September 2017
/
Revised: 21 October 2017
/
Accepted: 22 October 2017
/
Published: 26 October 2017
(This article belongs to the Special Issue Rare-Earth Carbonates)
Abstract
:Experiments on the incorporation of trace elements into calcite were performed, and rare earth elements (REE) were used to mark the growth zones of individual crystals. Experiments were conducted at different pH (7.7 to 8.8) and temperatures (2 °C to 24.6 °C) in NH4Cl + CaCl2 solutions, where REE were rapidly consumed by growing calcite. LA-ICP-MS line-scans yielded the distribution of (REE/Ca)calcite within individual crystals in a manner consistent with the addition of REE into fluid. A sharp decrease of (REE/Ca)calcite toward the crystal edge suggests the fast depletion of (REE/Ca)fluid due to strong REE consumption by growing calcite. An attempt was made to estimate the lower limit of the partition coefficients between calcite and fluid using selected REE/Ca data within individual calcite crystals and the amount of REE added into fluid.
1. Introduction
The incorporation of rare earth elements (REE) into calcite at ambient temperatures has important applications as geochemical tracers in terrestrial and marine waters (e.g., [1]). Furthermore, the crystallochemical properties of REE3+ are similar to those of trivalent actinides, which present at this oxidation state (i.e., +3) when the oxidation reduction potential at the geological disposal site is low, e.g., [2]. It was shown that some actinides and lantanides readily incorporate into calcite, e.g., [3,4]. Once trapped, an impurity cannot escape the grain of calcite due to the very slow diffusion of atoms in the crystal lattice, e.g., [5]. Therefore, calcite has a great potential to sequester trace elements, including plutonium (Pu), neptunium (Np), americium (Am), and curium (Cm), which contribute to long-term radiotoxicity [6]. The strict policy on working with actinide elements makes the studies on the incorporation of lantanides into calcite particularly useful for predicting the behavior of actinides.
The existing data in the literature showed a large range of apparent REE partition coefficients between calcite and fluid at KREE = (REE/Ca)calcite/(REE/Ca)fluid [7,8,9,10]. The reason for normalizing to Ca is that trace elements often substitute Ca in the calcite lattice. Such substitution is likely valid for REE3+ with the involvement of a charge balance mechanism. For example, the proposed incorporation mechanisms for Eu3+ involve: (i) the formation of vacancies (Eu2x(CO3)3)solid, e.g., [3]; (ii) the incorporation of OH− (EuOHCO3)solid, e.g., [3]; and (iii) the incorporation of Na+ with a formation of EuNa(CO3)2 [2,11]. Spectroscopic data [11,12], as well as a recent experimental study [10], suggest the incorporation of REE into calcite accompanied by the incorporation of Na+. The reported values of KREE vary by more than an order of magnitude and depend on the concentration of REE in solution and the saturation state of the fluid with respect to calcite (Ωcalcite). No temperature effect on KREE was previously investigated.
In our experiments, REE were used as chemical spikes to label growth zones and calcite in order to determine the crystal growth rate. REE concentrations in fluid were not measured. Nevertheless, we made an effort to estimate the apparent partition coefficients, considering the amount of REE added into the calcite growth media. The previously reported experimental data were obtained by bulk analyses of calcite and fluid or by analyses of fluids only. Here we present REE data obtained within individual calcite crystals with LA-ICP-MS line-scans. Our study has two novel aspects: (1) REE incorporated into calcite grown from low-Na and low-REE solutions at different temperatures and (2) in situ analyses were performed on different faces of the experimental crystals.
2. Materials and Methods
2.1. Calcite Precipitation
The experiments were conducted using the modified method of Gruzenskiy [13]. The calcite growth medium was prepared by dissolving NH4Cl in deionized (DI) H2O to the concentration of 0.5 mol/L, along with minor amounts of reagent grade CaCl2·2H2O (0.01), MgCl2·6H2O (10−3), SrCl2·6H2O (10−4), BaCl2·2H2O (2 × 10⁻⁵), LiOH·H2O (5 × 10⁻⁴), H3BO3 (0.01), and U standard (10−5) for inductively coupled plasma mass spectrometry (ICP-MS) (values in parentheses are concentrations in mol/L). ICP-MS standard consisted of 1000 ppm of U dissolved in 2% HNO3. The pH of the solution was initially adjusted to 5.5 by the addition of reagent grade NaOH to match the pH from the study of Paquette and Reeder [14]. Large calcite crystals (up to 1.5 mm in size) grew, while CO2 and NH3 (decomposition products of ammonium carbonate) diffused into non-stirred growth media (Figure 1). In all other experimental works, the fluids were continuously stirred, resulting in the precipitation of small calcite crystals (a few µm in size) [8,9,10], with an exception of a study by Terakada and Masuda [7]. REE elements were introduced into the fluid one time each in the following order: Sm, La, Nd, Tb, Pr using 60 mL syringe with luerlock tubing. A few injections and withdrawals of growth medium were applied in order to homogenize the solution in REE [15]. The REE concentrations in the growth media were in the interval between 6.9 × 10⁻¹⁰ and 3.1 × 10⁻⁹ mol/kg H2O immediately after their addition (Table 1). Those REE concentrations, which were already close to the detection limit of ICP-MS, decreased too much lower values toward the end of the experiments, so the REE contents in the later-formed calcite were undistinguishable from the background (LA-ICP-MS). The experiments were conducted at 2 °C, 21.7 °C, and 24.6 °C. The solution’s pH (at NBS scale) was measured at the same time as the addition of REE. The values of pH were 8.01 to 8.16 (run DC-1), 8.74 to 8.76 (run DC-2), and 7.70 to 7.83 (run DC-3) during the addition of those REE that were detected in calcite with LA-ICP-MS (for details see Results). The concentration of Ca and the total alkalinity in selected filtered fluid sub-samples (runs DC-1, and DC-3) were measured with ICP-OES and described in Gabitov et al. [15]. Alkalinity was measured in DC-1 only, where the calculated calcite saturation state (Ωcalcite) did not change much after the addition of Sm: Ωcalcite = 1.8 ± 0.29.
Crystals grew in the shape of truncated pyramids on the walls of the flasks and at the interface between the fluid and the gas (i.e., air + CO2 + NH3) (Figure 1 and Figure 2). The sizes of the crystals vary from a few hundreds of µm to 1.6 mm. Calcite grew from a few days (run DC-3) to a few months (runs DC-1 and DC-2). After the termination of the experiments, the fluids were extracted and filtered with 0.2 µm Teflon filter. The crystals were rinsed with DI H2O three times, removed from the walls with plastic spatula, and dried. Selected crystals were mounted into epoxy in such a way that the crystal side adjacent to the flask wall was exposed for LA-ICP-MS analysis at the University of Cambridge (Cambridge, UK).
2.2. Analyses of Fluids
Calcium analyses of the fluids were performed using inductively coupled plasma optical emission spectrometry (ICP-OES) (Varian VISTA PRO™, Edinburgh, UK) at the School of GeoSciences, University of Edinburgh. The ICP-OES was configured using the standard protocol [16] for trace metal analyses in biogenic carbonates to obtain the best precision for the Me/Ca measurements. The following settings are used to run the ICP-OES: coil power 1.2 kW; plasma flow 15 L/min; auxiliary flow 1.5 L/min; and nebulizer flow 0.8 L/min. The samples were introduced at a rate of 420 μL/min using a MicroMist nebulizer and a Cinnabar Cyclonic spray chamber (Glass Expansion™, Santa Clara, CA, USA). External errors were estimated at 1% 1 s.d. for ratio measurement and 2% to 5% for Ca concentrations. Dissolved inorganic carbon (DIC) was determined using the custom made coulometric SOMMA (Single-Operator Multi-Metabolic Analyzer) system in the Biogeochemistry Laboratory at University of California Los Angeles (UCLA) [17]. Pure CO2 gas and DIC reference samples (Certified Reference Material, CRMs, produced by Andrew Dickson, Scripps Institution of Oceanography, La Jolla, CA, USA) were used to calibrate the measurements. The analytical precision of the DIC measurements was determined to be better than 0.8 μmol/kg, and 149 comparisons with the CRMs indicate an accuracy of the method of better than ±2.1 μmol/kg.
2.3. Analyses of Solids
The REEs/Ca ratios of calcite were measured using a laser ablation inductively coupled plasma mass spectrometry (LA-ICP-MS) system at the Department of Earth Science at the University of Cambridge. This high-resolution depth profiling technique employs Analyte G2 excimer laser (Teledyne Photon Machines Inc, (Omaha, NE, USA)) coupled with Thermo i-CapQ ICP-MS to measure the trace metal elemental profiles in calcium carbonates. The isotopes 43Ca, 139La, 140Ce, 141Pr, 146Nd, 147Sm, and 159Tb were measured along the laser profile tracks or as spot measurements. The Laser Ablation system was optimised for high spatial resolution using an aperture slit of 135 μm × 10 μm aligned to the direction of the crystal growth and a 9Hz frequency with 1.8 J/cm2 laser fluence. The laser speed scan along the tracks was setup at 5 μm/s, resulting in a similar spatial resolution for the REEs/Ca measurements. The spot measurements were done using a 40 μm × 40 μm aperture and 6 Hz laser frequency with a 1.8 J/cm2 laser fluence. Approximately the top 1 μm of the crystal calcite was removed using preablation, with a 150 μm × 30 μm laser spot to avoid any potential surface contamination. This preablation significantly improved the signal stability and eliminated the spikes in the REEs, which are commonly associated with surface contamination during cutting and polishing samples. The ICP-MS sensitivity was optimised using NIST-SRM612 reference glass material for maximum sensitivity across the Mg–U mass range and maintaining ThO/Th < 0.5% and a Th/U ratio of ~1. Data reduction involved the initial screening of spectra for outliers, subtraction of the mean background intensities (measured with the laser turned off) from the analysed isotope intensities, internal standardisation to 43Ca, and external standardisation using the NIST-SRM612 glass reference material. In-house OKA calcite standards (collected at Oka carbonatite complex Quebec, Canada) and NIST-SRM614 were used to monitor the reproducibilities of the long-term standards, which were 1.0, 0.9, 1.2, 1.2, 1.4, and 1.1 RSD % (relative standard deviation) for La/Ca, Ce/Ca, Pr/Ca, Nd/Ca, Sm/Ca, Tb/Ca, respectively.
3. Results
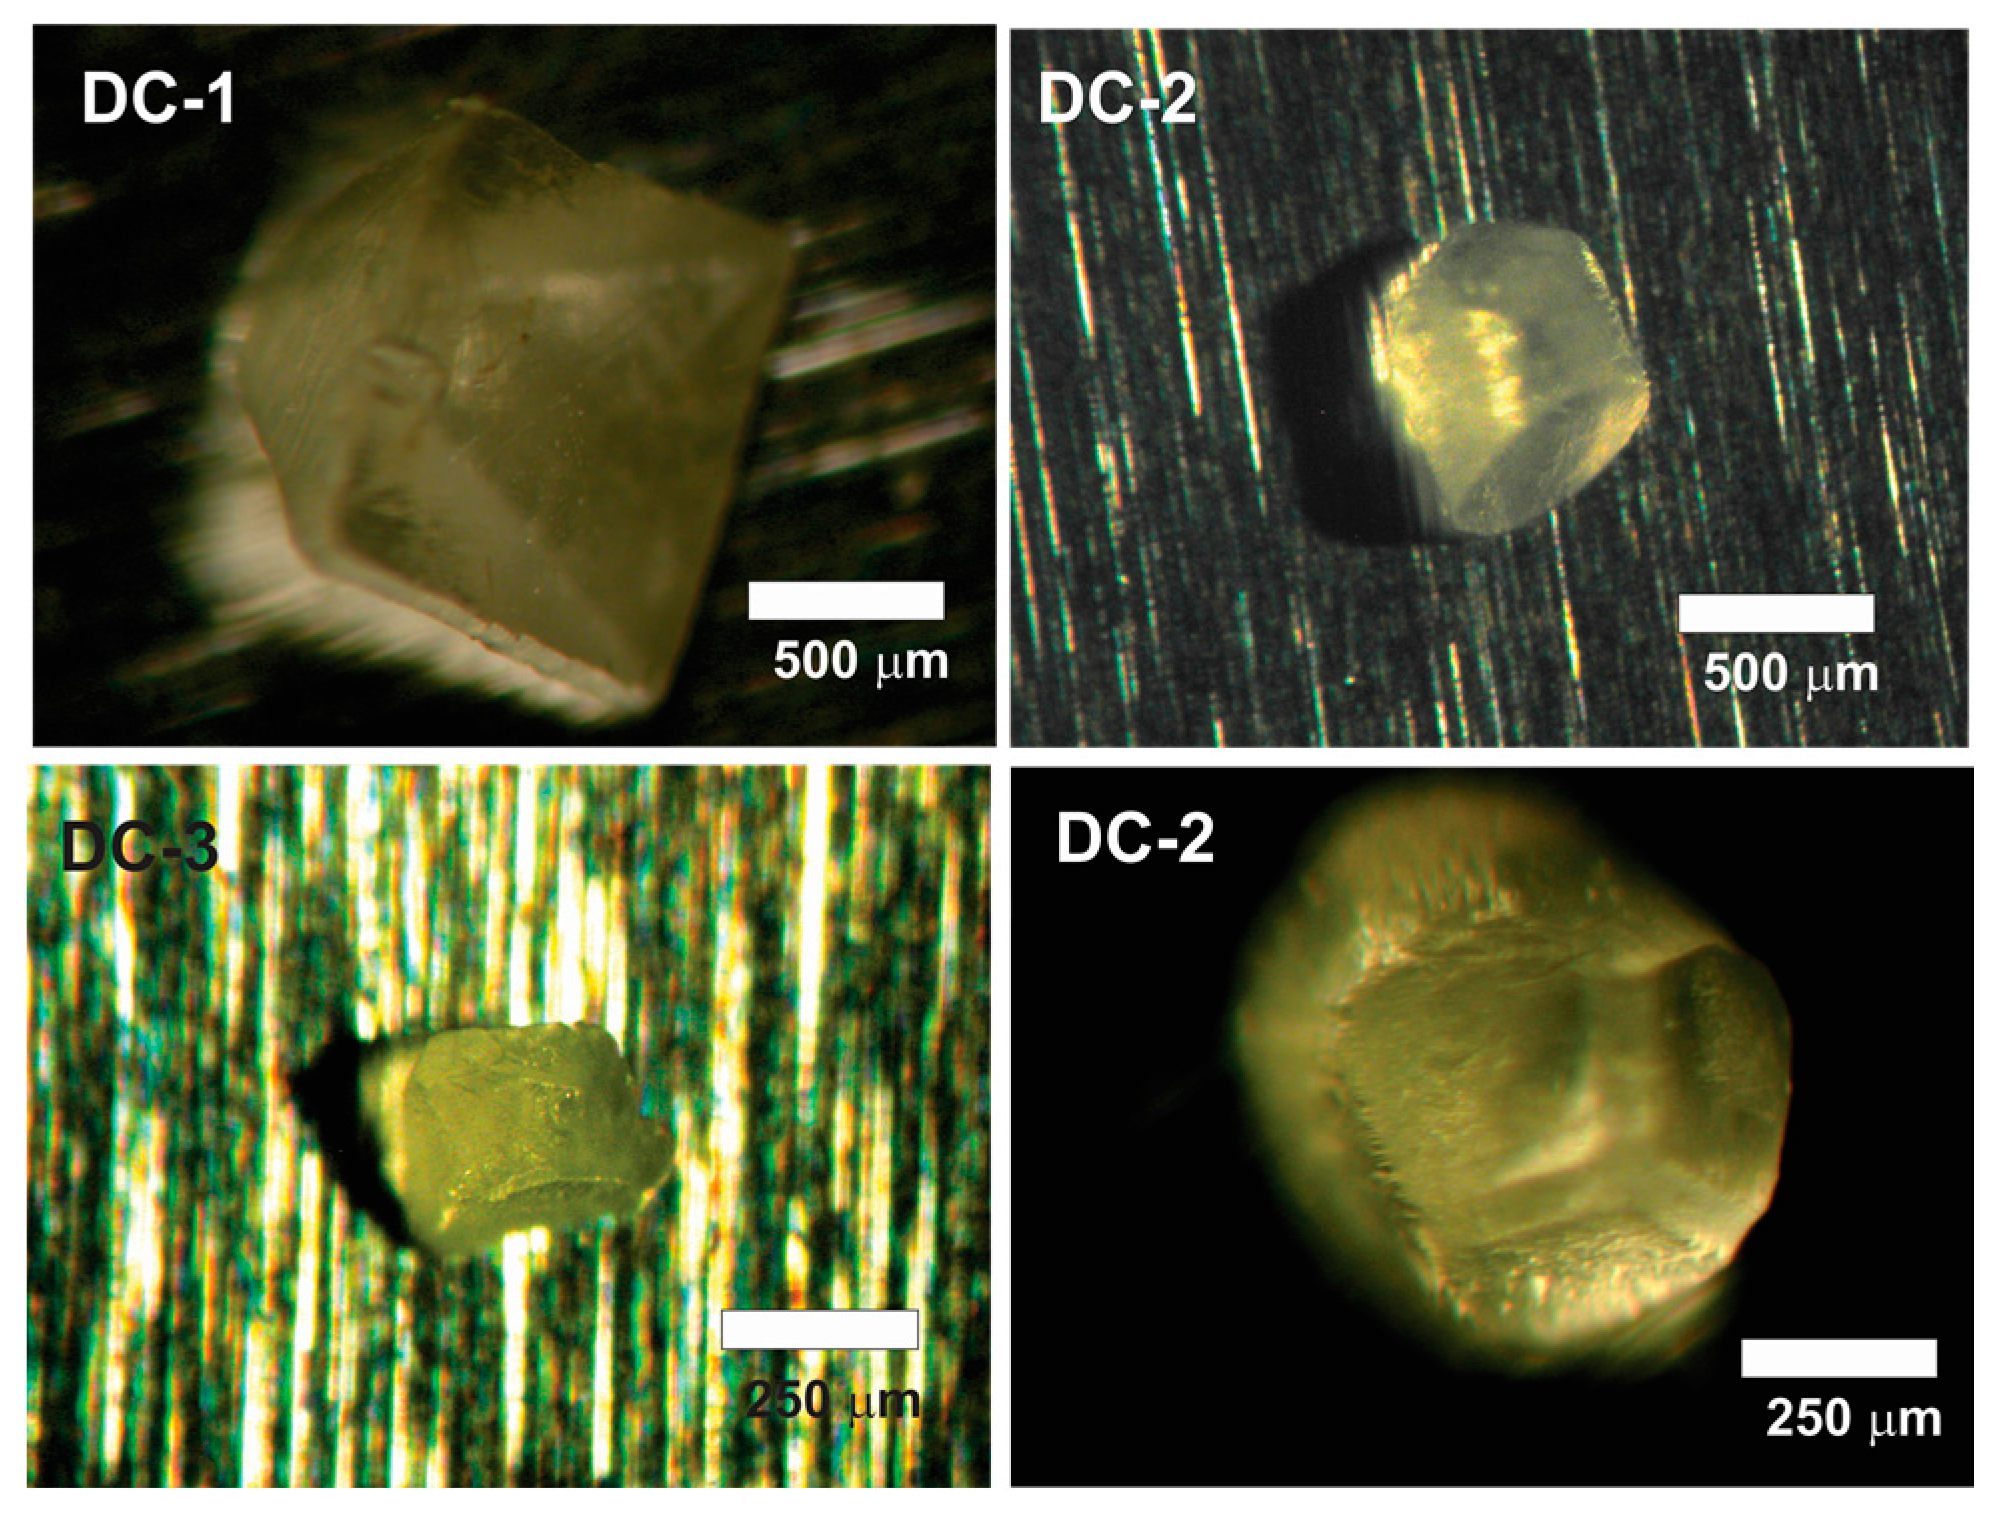
Figure 2 shows example photomicrographs of individual crystals from all three experiments. The crystals sides that used to be attached to the wall of the container during calcite growth are exposed on the Figure 2 (DC-1, DC-3, and DC-2 top). Crystals from DC-1 and DC-3 have the shape of truncated pyramids with clear visible individual crystal face planes; crystals from the low temperature experiment (DC-2) are rounded but show individual faces on the opposite crystal side from the crystal beaker boundary (Figure 2, DC-2 bottom). Overall, the crystal shapes from runs DC-1 and DC-3 are more similar to each other compared with crystals from run DC-2.
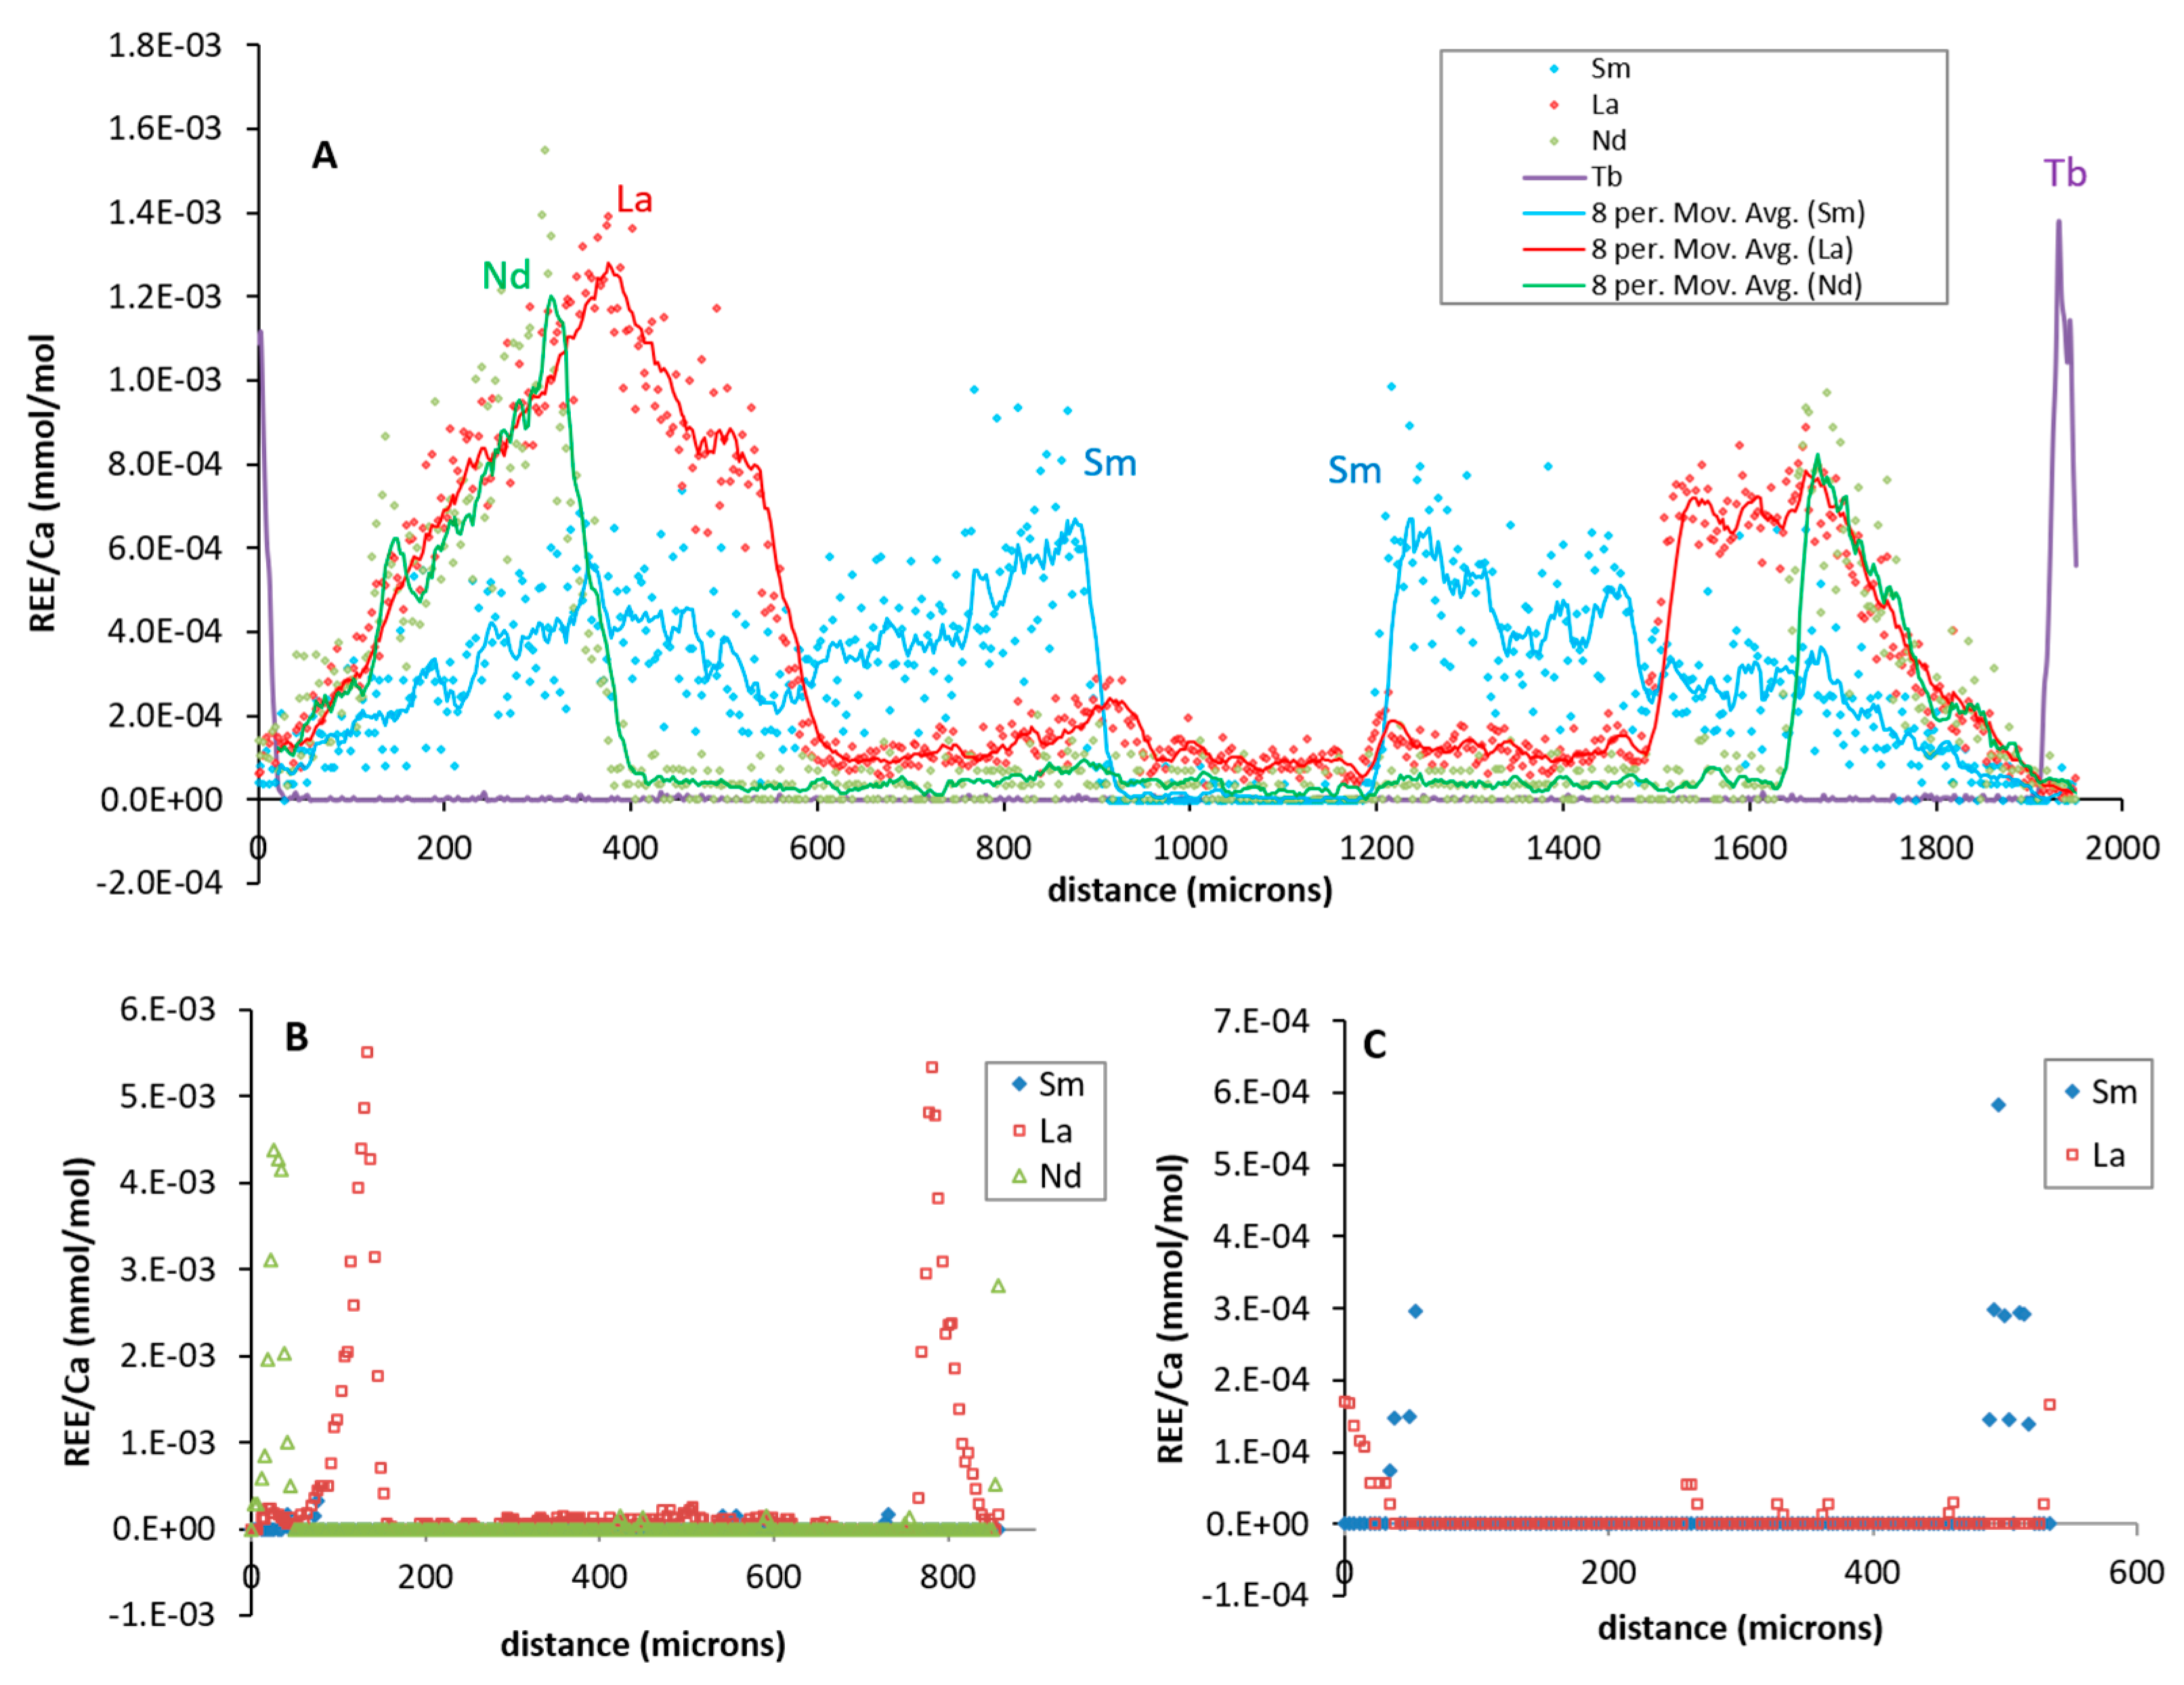
The LA-ICP-MS analytical profiles across the calcite crystals yielded an REE/Ca distribution consistent with the addition of REE spiked into the fluid from which calcite grew. An example of an REE/Ca profile is shown on the Figure 3; the rest of the profiles can be found in the supplemental materials (Figure S1). Here REE/Ca is close to the background level in the central zone of the crystal, which grew prior to the addition of REE. REE/Ca spikes appear during crystal growth in the sequence (Sm, La, Nd, and Tb) of their addition into growth medium (run DC-1, Figure 3A). A Tb peak is visible at the edge of the crystal. The spike of Pr was not observed at the outermost layer of the calcite. The distribution of REE/Ca within individual crystals is not perfectly symmetrical relative to the center, which is likely because of the sample preparation procedure, i.e., crystal mounting always yields at least a small degree of tilting.
The maximum concentrations of REE/Ca in individual crystals correspond to calcite that grew after the addition of REE into fluid. REE entrapment by calcite is shown by the rapid increase in (REE/Ca)calcite corresponding to the introduction of REE in the fluid, followed by a slower decrease corresponding to the consumption of REE by calcite. La and Nd show small spikes at 740 µm and 960 µm within the crystals (i.e., when Sm was added into fluid), which suggest the contamination of Sm-bearing salt with other REE in the run (Figure 3A). This is not surprising considering the similar chemical behaviour of REE. The magnitudes of the REE/Ca spikes are not necessarily equivalent within a single crystal and are not the same between different experiments. The absence of Sm in crystals from DC-2 run suggests that nucleation occurs after Sm was introduced into fluid and consumed by the growth of other calcite crystals, thus only La and Nd spikes were detected in the calcite (Figure 3B). The calcite grew at a fast rate in experiment DC-3, and only an outer layer of the crystals (thickness <30 µm) contains REE (Figure 3C). Both La/Ca and Nd/Ca in the DC-2 run are higher than in DC-1 by about a factor of four, which is consistent with the amount of La and Nd added into the fluids (i.e., ~10−4 and 4 × 10⁻⁴ ppm respectively) (see Table 1). Surprisingly, the maximum values of REE/Ca in calcite from run DC-3 are lower than those in run DC-2 by an order of magnitude, which is not consistent with the difference in the REE concentration in the fluids. No REE “hot spots” were observed with LA-ICP-MS, suggesting the absence of precipitation of REE-rich mineral phases with calcite.
The Na in the fluids was analysed together with Ca, showing that the Na concentration in solutions varies between 4.1 × 10⁻³ mol/kg and 8.8 × 10⁻³ mol/kg; this Na content is more than an order of magnitude lower than in other studies, where NaCl = 0.1 M to 0.6 M [7,8,9,10]. The fluid concentrations of Ca for experiments at 21.7 °C and 24.6 °C were reported by Gabitov et al. [15] and are shown in Table 1.
4. Discussion
The speciation of REE in aqueous phase was evaluated based on the data reported in [18,19,20,21]. The calculations were based on the initial concentrations of REE in aqueous phase, determined during the experiments from the concentrations of Ca and carbonate and from the initial bulk composition of the solutions. The concentrations of carbonate and chloride species of Ca, Mg, Sr, and Li were evaluated based on the reported data [17]. Our calculations show that more than 99% of the total dissolved REE carbonate species is in the REECO3+ aqueous complex. This is in agreement with the calculations reported in the literature [10], which eliminates the difference in the speciation control of REE incorporation while comparing our data.
4.1. Calculating of Partition Coefficinets
The lowest limit for REE partition coefficients (KLa, KNd, and KSm) was calculated by dividing the maximum (REE/Ca)calcite in an individual crystal (later referred as (REE/Ca)calcite) by (REE/Ca)fluid in two experiments (Table 2). Here (REE/Ca)calcite is the maximum value in the REE/Ca peak in a calcite layer grown after the addition of an REE spike but before the rapid depletion of REE in the fluid caused by an REE/Ca decrease in the calcite. For example, the values at the peaks labeled Sm, La, Nd, and Tb were used as (REE/Ca)calcite in crystal-1 of experiment DC-1 (Figure 3A). The other regions of calcite were not considered because the REE/Ca ratios in the fluid were not monitored but were expected to decrease quickly due to the intensive consumption of REE by growing calcite. Since Cafluid was not measured in experiment DC-2, the lowest partitioning limit was expressed as the Nernst partition coefficient (D = REEcalcite/REEfluid), wherein REEfluid was estimated based on the amount of added REE (similar to DC-1 and DC-3). It should be noted however, that, due to the uptake of REE by growing calcite, the concentrations of REE in the solutions decreased, and REE became highly depleted at the end of each run. Due to this, we discuss the lowest limit of the REE partitioning coefficient suggested by our data, rather than the true values of Kd.
4.2. Comparison of REE Partitioning Values between Three Experiments
Significant variability in the maximum REE/Ca values was observed for different calcite crystals; therefore the REE/Cacalcite, KREE, and DREE values are presented as intervals rather than as single values with error. The REE distribution around the center of the crystals is not always symmetrical (Figure 3). This suggests heterogeneous REE incorporation into different crystal sectors. This phenomenon was observed for the incorporation of divalent cations and anions into calcite, e.g., [14,22,23], and is potentially possible for REE3+. The DREE intervals overlap in calcites from runs DC-1 (25 °C) and DC-2 (2 °C), suggesting that temperature is not a key factor in REE partitioning. However, the DREE values from run DC-3 (21.7 °C) are significantly lower than in those determined in the two aforementioned experiments, which could be explained by: (1) a fast growth rate or (2) sector selective incorporation.
The first scenario is possible if the growth rate (i.e., the velocity of the advancing crystal surface, V) is prevalent over solid-state diffusion in the calcite near-surface region (Ds) or the dehydration rate of REECO3+ (potentially the main specie in NH4Cl solution under experimental conditions). The phenomenon of “surface entrapment” was described by Watson and co-workers, which lead to the establishment of a growth entrapment model (GEM), sometimes referred as a surface entrapment model (SEMO) [24,25,26]. Briefly, X-ray reflectivity data showed that the monolayer of calcite at the surface is structurally different from calcite lattice [27]. Therefore, it is reasonable to consider that the concentration of impurity (i.e., REE) in the near-surface layer is different from that in crystal lattice at equilibrium (i.e., slow crystal growth rate). At fast growth rates, the composition of the near-surface layer is entirely entrapped by growing crystal and buried in the lattice (100% entrapment). If the crystal grows at slow rate, then Ds is high enough to move the impurity back to the surface once it is entrapped, and no burying occurs (0% entrapment). When V is “comparable” with Ds, then the degree of entrapment is controlled by competition between V and Ds. This process was supported by ab-initio simulation of the binding energies of Ti in quartz as a function of distance from the crystal surface [28] and by fitting the experimental data for calcite and aragonite with a GEM, e.g., [29,30]. However, this growth rate hypothesis is not in agreement with previous studies, which reported the lack of dependence of KREE on the bulk precipitation rate [3,10]. One alternative explanation for the first scenario is the effect of Ωcalcite on KREE, observed by Voigt et al. [10]. Although Ωcalcite is known in run DC-1 only, it is expected that the fluid in run DC-3 had the highest saturation state because the crystals there grew for a few days in comparison to the few months in other experiments. An increase of the crystal growth rate with Ωcalcite was reported in several studies, e.g., [31]. Therefore, the low KREE in run DC-3 is in agreement with the data of Voight et al. [10], where KREE decreases from ~1000 to 100 with Ωcalcite increasing from ~1 to 5 (Table 3). However, the use of their Ωcalcite–KLa relationship for our Ωcalcite yields a La partition coefficient two orders of magnitude higher than our KREE. Therefore, extra caution needs to be taken while applying published Ωcalcite–KLa relationships to systems that are not chemically identical. Finally, rapid growth could cause the formation of a diffusive boundary layer in proximity to the crystal’s surface. In general, the diffusion rates of ions in fluids are fast enough to preclude the formation of a chemically distinct (ion transport limited) fluid boundary layer. However, if the crystal’s growth rate exceeds 2 nm/s, then the consumption of certain ions by rapidly grown calcite could create a depleted zone around calcite crystals [30,32,33]. This was not the case for experiments DC-1 (0.001 < V < 0.1 nm/s) and DC-2 (VLa-Nd = 0.035 ± 0.05 nm/s), in which the crystal growth rate of the studied zones of calcite was low. However, the formation of a diffusion boundary layer is possible in experiment DC-3, in which the average growth rates were estimated as ≥2 nm/s. In this case, the difference in ion diffusivities can play an important role in the incorporation of REE into calcite. According to Li and Gregory [34], the diffusion coefficients (×10−6 cm2/s) at 25 °C in infinite dilute aqueous solution are as follows: Na+ = 13.3; Li+ = 10.3; Ca2+ = 7.93; La3+ = 6.17; Mg2+ = 7.05; Sr2+ = 7.94; and CO32− = 9.55. Based on those data, REE diffusion is the slowest, and the diffusion coefficients of La are lower than those of Ca by 22%. This potentially could explain the low KREE values in rapidly grown calcite from run DC-3. Overall, the growth rate related scenario includes the entrapment of a near-surface solid layer, the saturation state of the solution, and the formation of a liquid diffusive boundary layer. All those factors cannot be ruled out while explaining the depletion of REE/Ca in rapidly grown calcite (run DC-3) relative to slower growing crystals (runs DC-1 and DC-2).
The second scenario considers the selective incorporation of REE3+ into different calcite faces. The non-equivalent morphology of crystals precipitated in different experiments may cause the exposure of various crystal faces (or sectors within a single face), which is in agreement with the non-symmetrical REE pattern around the centers of individual crystals (Figure 3 shows the most symmetrical plots). It was shown that the incorporation of trace and minor elements could be selective with respect to the geometry of calcite growth steps. In the simplest case, a small ion has a greater affinity to being trapped by a growth step with an acute angle; similarly an ion larger than Ca2+ preferentially incorporates a growth step with an obtuse angle, e.g., [14]. However, this is not always the case, at least for neutral or negatively charged boron species [22]. The difference in a solid-state diffusion at a near surface layer of calcite partially explained the site selective incorporation of boron [32].
4.3. Comparison with Other Studies
Although our KREE values are probably far from equilibrium and represent the lower limit of KREE, we made an effort to compare our data with that available in literature. Our KREE are close to those reported by Terakado and Masuda [7], which lie at the low end of the range of previously reported data (Table 3). However, the insufficient information on aqueous carbonate chemistry in the study of Terakado and Masuda precludes a comparison of their Ωcalcite with those of our and other studies, where the ranges of Ωcalcite overlap. Despite the similarity in Ωcalcite, there is a strong disagreement between data from the literature and our data, suggesting that our KREE represent the lowest partitioning limit rather than the true KREE.
There are three main differences between our methods and those from the aforementioned studies: (1) we conducted microscale analyses on individual crystals; (2) our fluids were not continuously stirred; and (3) our calcites precipitated from NH4Cl-based fluids. First, we determined the REE/Ca distribution within individual crystals (compared to bulk analysis in other studies), thus eliminating the appearance of REE-rich phases (hydroxylbastnasite: REECO3(OH)) of other minerals at a micron scale, which is possible considering the 1% detection limit of X-ray diffraction (XRD, the technique being used in most of the studies for mineral identification). Although the formation of hydroxylbastnasite was not supported by our thermodynamic calculations and those of Voigt et al. [35], our observation provides direct evidence on the absence of an REE-rich phase at the microscale.
Second, the fluids in our experiments were not stirred, and this is an important difference from other works. An exception is the study of Terakada and Masuda [7], in which stirring of the fluids was not mentioned and calcite grew on the walls of the beaker. In other experimental works, the fluids were continuously stirred or/and gas mixtures were bubbling through the growth medium. Interestingly, the REE partition coefficients from Terakada and Masuda [7] are relatively small, which is in agreement with our data. This raises the question about the difference in the diffusion rates between CO32−, Ca2+, and REE3+ in the fluid, i.e., the rates of ion delivery to the calcite surface. As discussed earlier in the text, the formation of a diffusive boundary layer is only possible at the surface of rapidly grown calcite in run DC-3; therefore we cannot explain the large difference in KREE between our study (runs DC-1 and DC-2) and the data in the literature [8,10].
Third, the main component of our fluid was NH4Cl instead of NaCl, which potentially affected the mechanism of charge balance for REE substitution into calcite (REE3+ + Na+ + 2Cas2+ → REEs3+ + Nas+ + 2Ca2+, where “s” stands for solid). Low Na in our solutions can explain why our KREE values are on to two orders of magnitude lower than the KREE values reported in most of the previous studies [8,9,10]. However, this hypothesis is not in agreement with the similarity of our KREE values to those reported by Terakado and Masuda [7], wherein calcite was precipitated from Na-rich fluid, suggesting that the coupled incorporation of REE with Na is not necessarily prevalent. Other elements presented in our solution potentially could affect REE partitioning by the distortion of the calcite structure in our study, as well as in the work of Zhong and Mucci, who used artificial seawater doped with major and minor seawater elements, including Sr and Mg [8,36]. Our growth medium contained Li in a concentration an order of magnitude lower than the concentration of Na; both elements are incompatible into calcite (K ~ 10−3), especially in comparison to REE [37,38]. Therefore, it is unlikely that Li contributed significantly to REE partitioning. Moreover, the correlation of Li and Na partitioning with salinity suggests that those elements incorporate into calcite interstitially, i.e., not to the Ca site [37,38]. Although those facts do not rule out the potential effects of Na, Li, Mg, and Sr on the incorporation of REE into calcite, the amount of data is insufficient for making conclusions on this subject, especially because the fluid REE concentration dropped rapidly during our experiments, which precludes developing relationships between REE and other elements in calcite.
5. Conclusions
No precipitation of REE-rich phase with calcite was identified at 40 µm spatial resolution, providing direct evidence of REE incorporation into calcite lattice. The lowest partitioning limits for La, Nd, Sm, and Tb were determined between 40 µm and 500 µm layers of calcite grown from one time REE-spiked solution. In spite of a low Na content, our estimated partitioning values are within the previously reported range, suggesting that the substitution of 2Ca2+ with REE3+ and Na+ is not necessarily a prevalent mechanism. No temperature effect on the incorporation of REE was observed at 2 °C to 24.6 °C. The low level of Sm and La incorporation into rapidly precipitated crystals (run DC-3) suggests that REE entrapment by calcite could be limited in stagnated, highly supersaturated solutions.
Supplementary Materials
The following are available online at www.mdpi.com/2075-163X/7/11/204/s1, Figure S1: Example of rare earth elements (REE)/Ca analytical profiles shown through individual calcite crystals for DC-1, DC-2, and DC-3.
Acknowledgments
We would like to thank the UCLA SIMS (secondary ion mass spectrometry) laboratory and the U.S. National Science Foundation Division of Earth Sciences (NSF, EAR), and Instrumentation and Facilities Program for providing space and supporting the crystallization experiments. We gratefully acknowledge Walter Geibert (ICP-OES laboratory at the University of Edinburgh) for his support in the fluid Na and Ca measurements; Anita Leinweber (UCLA) for measuring DIC (these analyses were covered by Eidgenössische Technische Hochschule (ETH) grant no. 4 443869-AL-20600); Mississippi State University for supporting the XRD analyses; guest editor Juan Diego Rodriguez-Blanco and three anonymous reviewers for providing feedback on the manuscript. Finally, we thank Dihan Gabitov for her help with the preparation of the text.
Author Contributions
Gabitov conceived, designed, and performed the experiments; Sadekov and Migdisov analyzed the data; Gabitov and Sadekov contributed reagents/materials/analysis tools; Gabitov, Sadekov, and Migdisov wrote the paper.
Conflicts of Interest
The authors declare no conflicts of interest.
References
- Elderfield, H.; Upstill-Goddard, R.; Sholkovitz, E.R. The rare earth elements in rivers, estuaries, and coastal seas and their significance to the composition of ocean waters. Geochim. Cosmochim. Acta 1990, 54, 971–991. [Google Scholar] [CrossRef]
- Hellebrandt, S.E.; Hofmann, S.; Jordan, N.; Barkleit, A.; Schmidt, M. Incorporation of Eu(III) into Calcite under Recrystallization conditions. Sci. Rep. 2016, 6, 33137. [Google Scholar] [CrossRef] [PubMed]
- Lakshtanov, L.Z.; Stipp, S.L.S. Experimental study of europium(III) coprecipitation with calcite. Geochim. Cosmochim. Acta 2004, 68, 819–827. [Google Scholar] [CrossRef]
- Balboni, E.; Morrison, J.M.; Wang, Z.; Engelhard, M.H.; Burns, P.C. Incorporation of Np(V) and U(VI) in carbonate and sulfate minerals crystallized from aqueous solution. Geochim. Cosmochim. Acta 2015, 151, 133–149. [Google Scholar] [CrossRef]
- Cherniak, D.J. REE diffusion in calcite. Earth Planet. Sci. Lett. 1998, 160, 273–287. [Google Scholar] [CrossRef]
- François, J.L.; Guzmán, J.R.; Martín-del-Campo, C. Study of the radiotoxicity of actinides recycling in boiling water reactors fuel. Nucl. Eng. Des. 2009, 239, 1911–1915. [Google Scholar] [CrossRef]
- Terakado, Y.; Masuda, A. The coprecipitation of rare-earth elements with calcite and aragonite. Chem. Geol. 1988, 69, 103–110. [Google Scholar] [CrossRef]
- Zhong, S.; Mucci, A. Partitioning of rare earth elements (REEs) between calcite and seawater solutions at 25 °C and 1 atm, and high dissolved REE concentrations. Geochim. Cosmochim. Acta 1995, 59, 443–453. [Google Scholar] [CrossRef]
- Toyama, K.; Terakado, Y. Experimental study of rare earth element partitioning between calcite and sodium chloride solution at room temperature and pressure. Geochem. J. 2014, 48, 463–477. [Google Scholar] [CrossRef]
- Voigt, M.; Mavromatis, V.; Oelkers, E.H. The experimental determination of REE partition coefficients in the water calcite system. Chem. Geol. 2017, 462, 30–43. [Google Scholar] [CrossRef]
- Schmidt, M.; Stumpf, T.; Marques Fernandes, M.; Walther, C.; Fanghänel, T. Charge Compensation in Solid Solutions. Angew. Chem. Int. Ed. 2008, 47, 5846–5850. [Google Scholar] [CrossRef] [PubMed]
- Marques Fernandes, M.; Stumpf, T.; Rabung, T.; Bosbach, D.; Fanghänel, T. Incorporation of trivalent actinides into calcite: A time resolved laser fluorescence spectroscopy (TRLFS) study. Geochim. Cosmochim. Acta 2008, 72, 464–474. [Google Scholar] [CrossRef]
- Gruzensky, P.M. Growth of calcite crystals. J. Phys. Chem. Solids 1967, S1, 365–367. [Google Scholar]
- Paquette, J.; Reeder, R.J. Relationship between surface structure, growth mechanism, and trace element incorporation in calcite. Geochim. Cosmochim. Acta 1995, 59, 735–749. [Google Scholar] [CrossRef]
- Gabitov, R.I.; Watson, E.B.; Sadekov, A. Oxygen isotope fractionation between calcite and fluid as a function of growth rate and temperature: An in situ study. Chem. Geol. 2012, 306–307, 92–102. [Google Scholar] [CrossRef]
- De Villiers, S.; Greaves, M.; Elderfield, H. An intensity ratio calibration method for the accurate determination of Mg/Ca and Sr/Ca of marine carbonates by ICP-AES. Geochem. Geophys. Geosyst. 2002, 3. [Google Scholar] [CrossRef]
- Johnson, K.M.; Wills, K.D.; Butler, D.B.; Johnson, W.K.; Wong, C.S. Coulometric total carbon dioxide analysis for marine studies, maximizing the performance of an automated gas extraction system and coulometric detector. Mar. Chem. 1993, 44, 167–187. [Google Scholar] [CrossRef]
- Klungness, G.D.; Byrne, R.H. Comparative hydrolysis behavior of the rare earths and yttrium: The influence of temperature and ionic strength. Polyhedron 2000, 19, 99–107. [Google Scholar] [CrossRef]
- Liu, X.; Byrne, R.H. Comparative carbonate complexation of yttrium and gadolinium at 25 °C and 0.7 mol dm−3 ionic strength. Mar. Chem. 1995, 51, 213–221. [Google Scholar] [CrossRef]
- Luo, Y.-R.; Byrne, R.H. Yttrium and rare earth element complexation by chloride ions at 25 °C. J. Solut. Chem. 2001, 30, 837–845. [Google Scholar] [CrossRef]
- Luo, Y.-R.; Byrne, R.H. Carbonate complexation of yttrium and the rare earth elements in natural waters. Geochim. Cosmochim. Acta 2004, 68, 691–699. [Google Scholar] [CrossRef]
- Hemming, N.G.; Reeder, R.J.; Hart, S.R. Growth-step-selective incorporation of boron on the calcite surface. Geochim. Cosmochim. Acta 1998, 62, 2915–2922. [Google Scholar] [CrossRef]
- Wasylenki, L.E.; Dove, P.M.; Wilson, D.S.; De Yoreo, J.J. Nanoscale effects of strontium on calcite growth: An in situ AFM study in the absence of vital effects. Geochim. Cosmochim. Acta 2005, 69, 3017–3027. [Google Scholar] [CrossRef]
- Watson, E.B. Surface enrichment and trace-element uptake during crystal growth. Geochim. Cosmochim. Acta 1996, 60, 5013–5020. [Google Scholar] [CrossRef]
- Watson, E.B. A conceptual model for near-surface kinetic controls on the trace element and stable isotope composition of abiogenic calcite crystals. Geochim. Cosmochim. Acta 2004, 68, 1473–1488. [Google Scholar] [CrossRef]
- Watson, E.B.; Liang, Y. A simple model for sector zoning in slowly growing crystals: Implications for growth rate and lattice diffusion, with emphasis on accessory minerals in crustal rocks. Am. Mineral. 1995, 80, 1179–1187. [Google Scholar] [CrossRef]
- Fenter, P.; Geissbuhler, P.; Dimasi, E.; Srajer, J.; Sorensen, L.B.; Sturchio, N.C. Surface speciation of calcite observed in situ by high-resolution X-ray reflectivity. Geochim. Cosmochim. Acta 2000, 64, 1221–1228. [Google Scholar] [CrossRef]
- Lanzillo, N.A.; Watson, E.B.; Thomas, J.B.; Nayak, S.K.; Curioni, A. Near-surface controls on the composition of growing crystals: Car–Parrinello molecular dynamics (CPMD) simulations of Ti energetics and diffusion in alpha quartz. Geochim. Cosmochim. Acta 2014, 131, 33–46. [Google Scholar] [CrossRef]
- Gabitov, R.I.; Gaetani, G.A.; Watson, E.B.; Cohen, A.L.; Ehrlich, H.L. Experimental determination of growth rate effect on U6+ and Mg2+ partitioning between aragonite and fluid at elevated U6+ concentration. Geochim. Cosmochim. Acta 2008, 72, 4058–4068. [Google Scholar] [CrossRef]
- Gabitov, R.I.; Sadekov, A.; Leinweber, A. Crystal growth rate effect on Mg/Ca and Sr/Ca partitioning between calcite and fluid: An in situ approach. Chem. Geol. 2014, 367, 70–82. [Google Scholar] [CrossRef]
- Burton, E.A.; Walter, L.M. Relative precipitation rates of aragonite and Mg calcite from seawater: Temperature or carbonate ion control? Geology 1987, 15, 111–114. [Google Scholar] [CrossRef]
- Gabitov, R.I.; Rollion-Bard, C.; Tripati, A.; Sadekov, A. In situ study of boron partitioning between calcite and fluid at different crystal growth rates. Geochim. Cosmochim. Acta 2014, 137, 81–92. [Google Scholar] [CrossRef]
- Watson, E.B.; Müller, T. Non-equilibrium isotopic and elemental fractionation during diffusion-controlled crystal growth under static and dynamic conditions. Chem. Geol. 2009, 267, 111–124. [Google Scholar] [CrossRef]
- Li, Y.-H.; Gregory, S. Diffusion of ions in sea water and in deep-sea sediments. Geochim. Cosmochim. Acta 1974, 38, 703–714. [Google Scholar]
- Voigt, M.; Rodriguez-Blanco, J.D.; Vallina, B.; Benning, L.G.; Oelkers, E.H. An experimental study of hydroxylbastnasite solubility in aqueous solutions at 25 °C. Chem. Geol. 2016, 430, 70–77. [Google Scholar] [CrossRef]
- Kesler, D.R.; Duedall, I.W.; Connors, D.N.; Pitkowicz, R.M. Preparation of artificial seawater. Limnol. Oceanogr. 1967, 12, 176–179. [Google Scholar]
- Marriott, C.S.; Henderson, G.M.; Crompton, R.; Staubwasser, M.; Shaw, S. Effect of mineralogy, salinity, and temperature on Li/Ca and Li isotope composition of calcium carbonate. Chem. Geol. 2004, 212, 5–15. [Google Scholar] [CrossRef]
- Ishikawa, M.; Ichikuni, M. Uptake of sodium and potassium by calcite. Chem. Geol. 1984, 42, 137–146. [Google Scholar] [CrossRef]
Figure 1.
Experimental schematics.
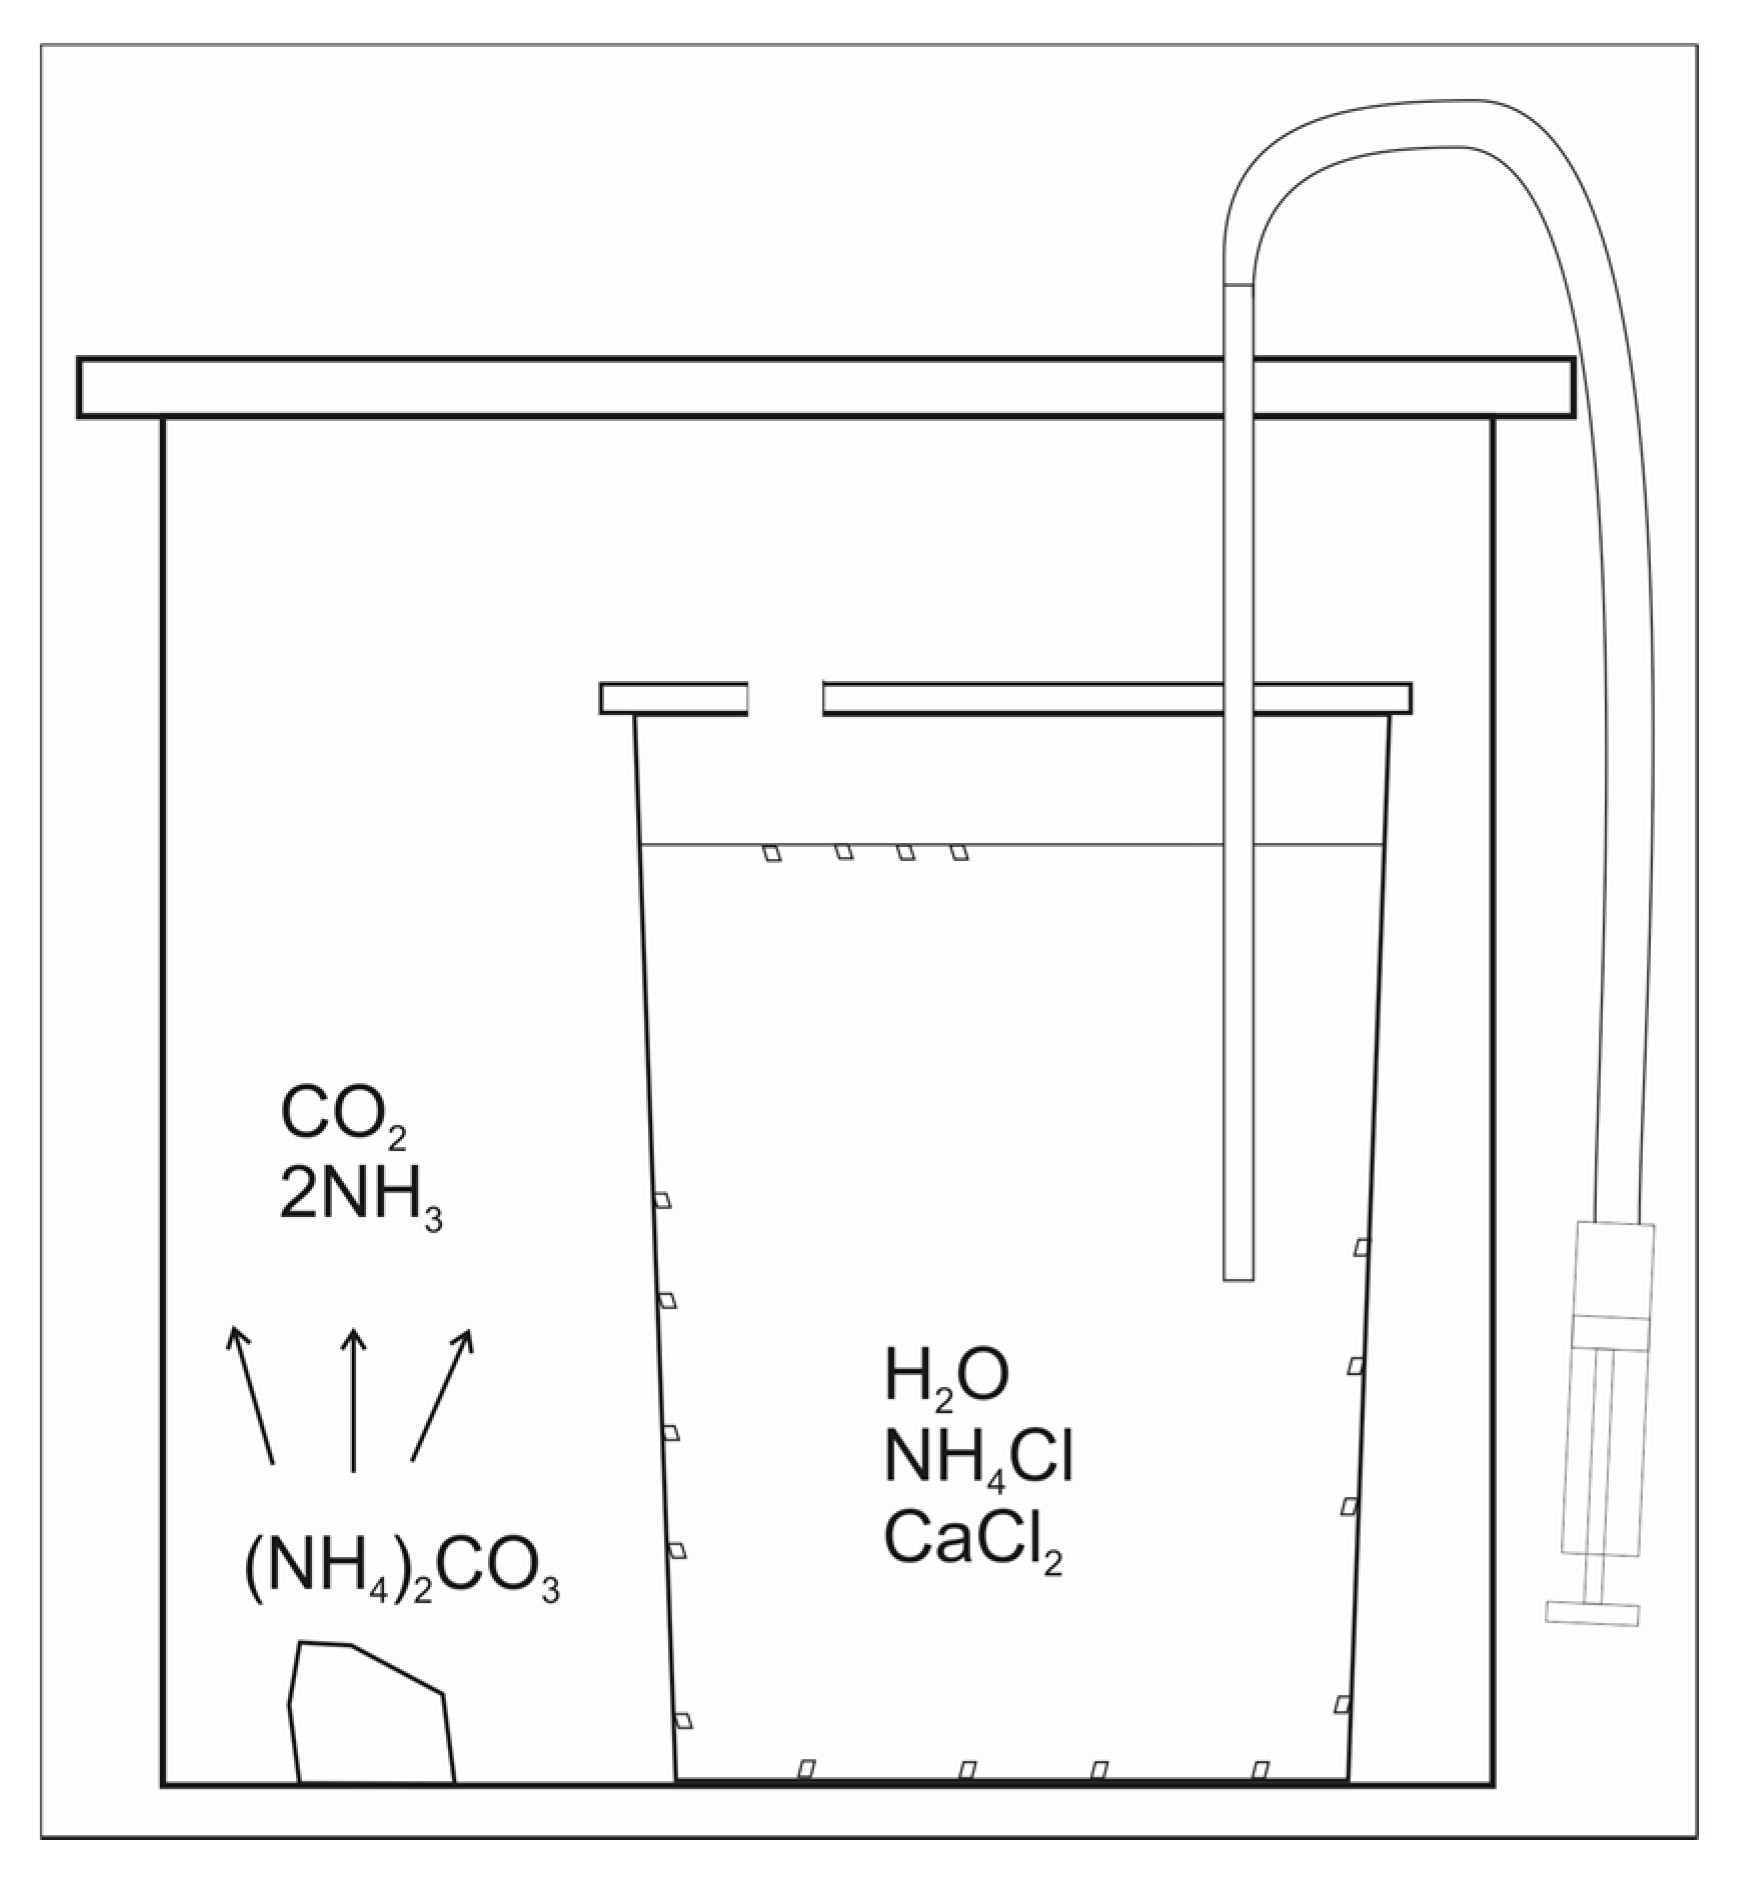
Figure 2.
Optical micrographs of individual crystals from experiments DC-1, DC-2, and DC-3. The crystal plane that was in contact with the beaker wall is exposed in all images except DC-2 (lower), in which the crystal side opposite to crystal/beaker boundary is exposed.
Figure 2.
Optical micrographs of individual crystals from experiments DC-1, DC-2, and DC-3. The crystal plane that was in contact with the beaker wall is exposed in all images except DC-2 (lower), in which the crystal side opposite to crystal/beaker boundary is exposed.

Figure 3.
Example of rare earth elements (REE)/Ca analytical profiles shown through individual calcite crystals for DC-1 (a), DC-2 (b), and DC-3 (c). For additional profiles see Figure S1.
Figure 3.
Example of rare earth elements (REE)/Ca analytical profiles shown through individual calcite crystals for DC-1 (a), DC-2 (b), and DC-3 (c). For additional profiles see Figure S1.


Table 1.
Experimental setup and fluid data at the moment of REE addition.
| t | REE | pH | Volume (spike) | REE (spike) | Volume (gr.med.) | REE * (gr.med.) | REE (gr.med.) | Ca# (gr.med.) |
|---|---|---|---|---|---|---|---|---|
| days | mL | ppm | mL | ppm | mol/kg H2O | mol/kg H2O | ||
| DC-1, 24.6 °C | ||||||||
| 0 | Sm | 8.01 | 1 | 0.2 | 1940 | 1.03 × 10⁻⁴ | 6.86 × 10⁻¹⁰ | 5.90 × 10⁻³ |
| 24 | La | 8.02 | 1 | 0.2 | 1895 | 1.06 × 10⁻⁴ | 7.60 × 10⁻¹⁰ | 5.11 × 10⁻³ |
| 36 | Nd | 8.05 | 1 | 0.2 | 1721 | 1.16 × 10⁻⁴ | 8.06 × 10⁻¹⁰ | 4.76 × 10⁻³ |
| 86 | Tb | 8.15 | 1 | 0.5 | 1514 | 3.30 × 10⁻⁴ | 2.08 × 10⁻⁹ | 3.52 × 10⁻³ |
| DC-2, 2 °C | ||||||||
| 32 | La | 8.76 | 1 | 0.2 | 465 | 4.30 × 10⁻⁴ | 3.10 × 10⁻⁹ | n/a |
| 63 | Nd | 8.74 | 1 | 0.2 | 455 | 4.40 × 10⁻⁴ | 3.05 × 10⁻⁹ | n/a |
| DC-3, 21.7 °C | ||||||||
| 0 | Sm | 7.83 | 1 | 0.2 | 840 | 2.38 × 10⁻⁴ | 1.58 × 10⁻⁹ | 2.09 × 10⁻³ |
| 1.2 | La | 7.70 | 1 | 0.2 | 820 | 2.44 × 10⁻⁴ | 1.76 × 10⁻⁹ | 1.90 × 10⁻³ |
t is time; t = 0 when crystals become visible, and the Sm spike is introduced to the growth medium (gr. med.); (*) The REE concentration was estimated from the amount introduced as a spike. (#) Ca was calculated using the fitting of selected analytical data (see Gabitov et al. [15]); n/a, data are not available.
Table 2.
The lower limits of the partition coefficients between REE and fluid.
| REE | (REE/Ca)fluid | (REE/Ca)calcite | KREE | DREE |
|---|---|---|---|---|
| DC-1, 24.6 °C (2 crystals) | ||||
| Sm | 1.16 × 10⁻⁴ | (0.93–4.1) × 10−3 | 8.0.2–35.34 | 13,418–59,153 |
| La | 1.49 × 10⁻⁴ | (1.4–3.2) × 10−3 | 10.74–21.48 | 20,867–41,734 |
| Nd | 1.69 × 10⁻⁴ | (1.5–2.2) × 10−3 | 8.88–13.02 | 18,446–27,055 |
| Tb | 5.90 × 10⁻⁴ | (1.4–4.1) × 10−3 | 2.03–3.81 | 6671–19,538 |
| DC-2, 2 °C (2 crystals) | ||||
| La | n/a | (5.32–5.51) × 10−3 | n/a | 17,010–17,617 |
| Nd | n/a | (4.38–5.79) × 10−3 | n/a | 14,234–18,816 |
| DC-3, 21.7 °C (3 crystals) | ||||
| Sm | 7.57 × 10⁻⁴ | (5.82–5.90) × 10−4 | 0.769–0.0779 | 8241–8354 |
| La | 9.22 × 10⁻⁴ | 6.58 × 10⁻⁴ | 0.714 | 2104 |
The REE/Ca ratios in calcite and fluid are in mmol/mol; KREE = (REE/Ca)calcite/(REE/Ca)fluid; DREE = (REE)calcite/(REE)fluid; n/a, data are not available.
Table 3.
Partitioning data from the literature and the experimental conditions.
| Gr.med. | Ca, mol/kg | REE, mol/kg | pH | pCO2 | Ω | T °C | KREE | Study |
|---|---|---|---|---|---|---|---|---|
| 0.5 M NH4Cl | (2.7–5.9) × 10−3 | (6.8–8.1) × 10−10 | 8.01–8.05 | n/a | 1.8 ± 0.29 | 24.6 | 8.02–35.34 | 1 |
| 0.11 M NaCl | 8.73 × 10⁻³ | (0.6–3) × 10−10 | 7.5–8.5 | n/a | n/a | 21–26 | 3.5–10 | 2 |
| ASW | 1.06 × 10⁻² | (0.0001–1) × 10−7 | 7.4–7.8 | 0.0031 | 3.5–15 | 25 | 1585–2512 | 3 |
| 0.27 M NaCl | 2.25 × 10⁻³ | (1.8–2.0) × 10−11 | 8.4–8.5 | n/a | n/a | 25 | 86–94 | 4 |
| 0.1 M NaCl | 2.08 × 10⁻² | (0.01–1) × 10−7 | 6.0 | 0.91 | 1–5 | 25 | 100–1000 | 5 |
| 0.1 M NaClO4 | 1.00 × 10⁻² | (0.1–7) × 10−9 | 6.0 | 1 | 1 | 25 | 477–1575 | 6 |
Gr. med.: growth medium in which calcite precipitation took place; ASW: artificial seawater; 1: this study (run DC-1) (La, Nd, Sm, Tb); 2: Tekarado and Masuda [7] (La, Nd, Sm); 3: Zhong and Mucci [8] (La, Nd, Sm); 4: Toyama et al. [9] (La, Nd, Sm); 5: Voigt et al. [10] (La); 6: Lakshtanov and Stipp [3] (Eu).
© 2017 by the authors. Licensee MDPI, Basel, Switzerland. This article is an open access article distributed under the terms and conditions of the Creative Commons Attribution (CC BY) license (http://creativecommons.org/licenses/by/4.0/).
Share and Cite
MDPI and ACS Style
Gabitov, R.I.; Sadekov, A.; Migdisov, A. REE Incorporation into Calcite Individual Crystals as One Time Spike Addition. Minerals 2017, 7, 204. https://doi.org/10.3390/min7110204
AMA Style
Gabitov RI, Sadekov A, Migdisov A. REE Incorporation into Calcite Individual Crystals as One Time Spike Addition. Minerals. 2017; 7(11):204. https://doi.org/10.3390/min7110204
Chicago/Turabian StyleGabitov, Rinat I., Aleksey Sadekov, and Artas Migdisov. 2017. "REE Incorporation into Calcite Individual Crystals as One Time Spike Addition" Minerals 7, no. 11: 204. https://doi.org/10.3390/min7110204
Note that from the first issue of 2016, this journal uses article numbers instead of page numbers. See further details here.