CO2 Mineralization Using Brine Discharged from a Seawater Desalination Plant

Change Mitigation and Sustainability Division, Korea Institute of Geoscience and Mineral Resources (KIGAM), 124 Gwahang-no, Yuseong-gu, Daejeon 34132, Korea
*
Author to whom correspondence should be addressed.
Minerals 2017, 7(11), 207; https://doi.org/10.3390/min7110207
Submission received: 12 September 2017
/
Revised: 16 October 2017
/
Accepted: 27 October 2017
/
Published: 30 October 2017
(This article belongs to the Special Issue Carbon Capture and Storage via Mineral Carbonation)
Abstract
:CO2 mineralization is a method of sequestering CO2 in the form of carbonated minerals. Brine discharged from seawater desalination is a potential source of Mg and Ca, which can precipitate CO2 as forms of their carbonate minerals. The concentration of Mg and Ca in brine are twice those in the seawater influent to desalination process. This study used a cycle for CO2 mineralization that involves an increase in the pH of the brine, followed by CO2 bubbling, and, finally, filtration. To the best of our knowledge, this is the first time that non-synthesized brine from a seawater desalination plant has been used for CO2 mineralization. The resulting precipitates were CaCO3 (calcite), Mg5(CO3)4(OH)2·4H2O (hydromagnesite), and NaCl (halite) with these materials being identified by X-ray Diffraction (XRD), Fourier transform infrared (FTIR) and thermo gravimetric-differentail thermal Analysis (TGA)-DTA. Despite the presence of Ca with Mg in brine being unfavorable for the precipitation of Mg carbonate, Mg reacted with CO2 to form hydromagnesite at a yield of 86%. Most of the Ca formed calcite, at 99% yield. This study empirically demonstrates that brine from seawater desalination plants can be used for CO2 mineralization.
1. Introduction
Climate change and abnormal weather phenomena have been worsening, owing to increased CO2 emissions around the world. Typically, the Korean peninsula is not a region that is known to suffer from water shortages [1]. However, since in the last few years there have been severe annual droughts, especially in west-coast areas, with increased CO2 emissions being blamed. Several methods of preserving water resources have been examined, and seawater desalination has been found to be a successful candidate [2,3]. Seawater desalination processes remove the salts from seawater by distillation, membrane separation, and/or reverse osmosis (RO) to produce useful water that is suitable for drinking and industrial purposes [3,4,5]. One result of these processes is that concentrated seawater (i.e., brine) is also produced, in which the rejected salts in seawater have been concentrated. Desalination consumes large amounts of energy, meaning that large-scale desalination plants are often placed near power stations [2], and also leads to the emission of massive amounts of CO2, which will eventually exacerbate the problems that desalination is attempting to solve. Methods of limiting CO2 emissions or removing CO2 from desalination plants are, therefore, of great interest.
CO2 mineralization is one such method of sequestering CO2. In this method, CO2 reacts with calcium and/or magnesium to form calcium carbonate and/or magnesium carbonate [6]. The rate of CO2 mineralization can be accelerated when the reaction takes place in the aqueous phase, as happens in typical chemical reactions. Ionization of CO2 to CO32− takes place under alkaline conditions. This is essential for CO2 mineralization, as it allows ionic reactions between CO32− and Ca2+ and/or Mg2+. For this reason, alkaline chemicals such as NaOH or NH4OH are applied to increase the pH of the aqueous phase in CO2 mineralization [7,8].
Meanwhile, using Ca and Mg from industrial waste such as waste concrete, slags from steel production, and liquid wastes is preferable when attempting to design feasible CO2 mineralization processes [9,10,11,12,13]. Detailed principles and applications of CO2 mineralization using alkaline waste have been summarized by Pan et al. [14]. Some pretreatment steps, such as crushing, sieving, activation, and/or digestion are required to extract Ca and Mg from solid waste [13,15,16]. When using liquid waste, such pretreatment procedures are not required because the Ca and/or Mg are already present as ions. For this reason, the use of brine for CO2 mineralization is a promising route for investigation [6,8,17]. In the implementation of this technology, both engineering and economic factors are important, as is environmentally balanced performance [18].
It is reported that the concentrations of the rejected salts in brine from desalination plants using reverse osmosis (RO) systems are 2–2.5 times higher than those in influent seawater [19], suggesting that brine could be a promising material for CO2 mineralization. If Mg alone is present in a solution, it readily reacts with CO2 to precipitate Mg carbonates; the reaction between MgCl2·6H2O solution and CO2 produced nesquehonite (MgCO3·3H2O), dypingite (Mg5(CO3)4(OH)2·5H2O), dypingite-like (Mg5(CO3)4(OH)2·8H2O), and hydromagnesite (Mg5(CO3)4(OH)2·4H2O) crystal phases, depending on the reaction conditions [20]. When considering brine for CO2 mineralization, it is worth noting that in previously reported studies, materials in a replica brine solution with coexisting Mg and Ca were not readily carbonated. Liu and Maroto-Valer [21] synthesized oil-field brine and conducted CO2 mineralization experiments under mimicked underground conditions to precipitate calcite. An artificial brine containing metal ions such as Na+, Mg2+, Ca2+, K+, and Sr2+, and anions including Cl−, SO42−, Br−, BO33−, F−, and HCO3− was unfavorable for the precipitation of Mg carbonates, but was favorable for CaCO3 precipitation [22]. In the same manner, simulated brine composed of NaCl, MgCl2, CaCl2, Na2SO4, and KCl precipitated CaCO3 by the primary separation of Mg(OH)2 from the Ca2+ solution [23]. Owing to the significantly higher concentration of Mg than Ca in seawater and brine, Mg would allow much more CO2 mineralization than Ca does. However, this does not necessarily mean that more precipitating Mg carbonates than Ca carbonates will be produced, because Ca carbonates are more sparingly soluble than Mg carbonates (for example, Ksp (hydromagnesite) = 1.26 × 10⁻⁵ [24], and Ksp (calcite) = 3.36 × 10⁻⁹ at 25 °C each [25]).
This paper introduces the first use of non-synthesized brine discharged from a functional seawater desalination plant for CO2 mineralization; we have particularly focused on the precipitation of Mg carbonates. Repeated cycles involved the pH adjustment of brine, and the injection of CO2 microbubbles showed that Mg carbonation could be achieved alongside Ca. Various analytical techniques were used for the identification of the precipitates, including X-ray diffraction (XRD) analysis. We have empirically proved that CO2 mineralization using brine for CO2 sequestration.
2. Experimental
The brine used in this study was collected from an ongoing seawater RO process for industrial water supplementation in Korea. The major cations and anions in this brine and their concentrations as measured by inductively coupled plasma atomic emission spectroscopy (ICP-OES; Optima 8300, PerkinElmer, Shelton, CT, USA) are listed in Table 1. The concentrations of Sr, Si, Li, Cu, and rare earth elements such as W, Mo, and Rb were also measured, but the values obtained were not significant. Anion concentrations were measured by ion chromatography (IC; Dionex ICS-5000+, Thermo Fisher Scientific, Sunnyvale, CA, USA), and the SO42− concentration was measured using IC equipped with an Ag cartridge (Dionex OnGuard II Ag, Thermo Fisher Scientific).
NaOH solution (1 M) was prepared for use as an alkaline chemical by dilution of NaOH (96%, Junsei Chemicals, Tokyo, Japan) with deionized water (Milli-Q Gradient-A10, Millipore, Billerica, MA, USA). The pH of 0.25 L of brine was increased from an initial value of 8.2 to 10–13.5 (measured by Orion Star A215, Thermo Scientific, Singapore) by adding the 1 M NaOH solution to the brine in a beaker with a lid at a rate of 4 mL/min using a peristaltic pump (EMP-2000W, EMS-tech, GyeongGi, Korea) at ambient temperature and pressure. The brine was stirred while the NaOH solution was added, and as the pH of the brine increased, a suspension of white precipitates was formed. Once the target pH was reached, the suspension was filtered with a 0.45 μm pore nylon membrane (Whatman, Brentford, UK) to allow the concentrations of the metal ions listed in Table 1 to be measured by ICP-OES. However, only the concentrations of Mg, Ca, and Na changed with pH and, as such, only the concentrations of these three elements are reported in the results section.
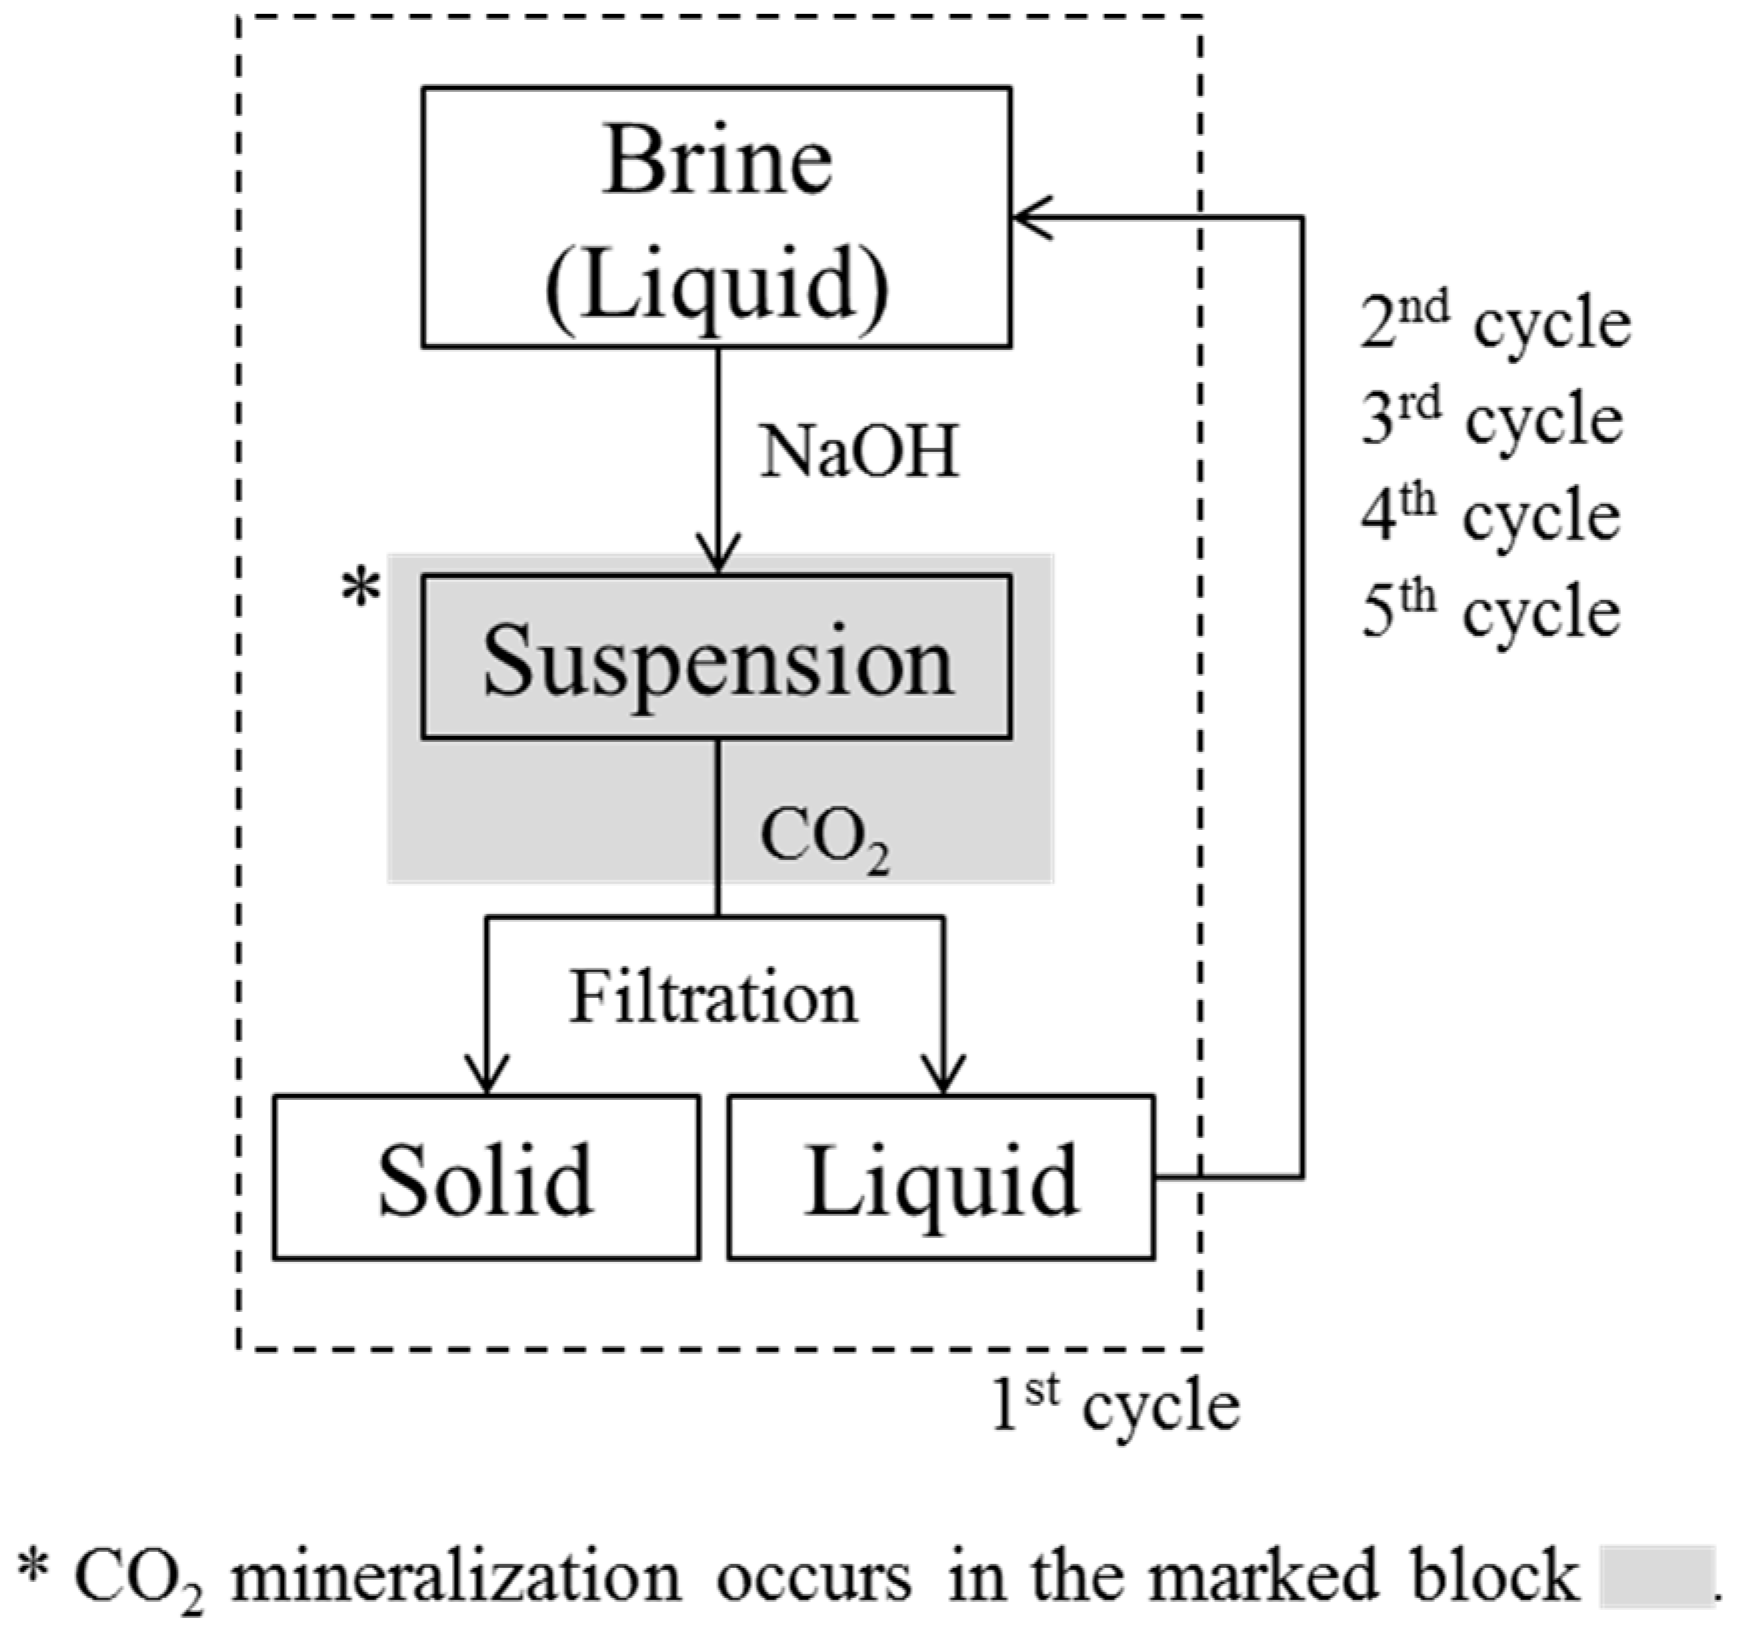
In the cyclic CO2 mineralization experiments, as 1 L of brine reached pH 10.5, we reacted the suspension with CO2 (99%, Gasco) instantly, and monitored for further pH changes at atmospheric pressure. A jacket reactor was used for CO2 mineralization, with a coolant at 1 °C being circulated between the walls by a chiller, and a lid being placed on the upper part of the reactor. As CO2 microbubbles were injected into the suspension using a microbubble generator, the pH decreased rapidly, as has already been shown in the literature [7,26,27]. CO2 injection was stopped once the pH of the brine had decreased to 8. This was because we found that we were unable to collect the CO2-reacted precipitates when CO2 injection was stopped at pH 7, which was the value we had used in previous studies [7,26]. The final products, which consisted of precipitates and transparent solutions, were obtained by filtering the brine through a 0.45 μm nylon filter. The experimental cycle was then begun again, with the pH of the solution being increased to 10.5, CO2 bubbling taking place, and the precipitate formed being filtered off. This cycle was repeated until no precipitates were obtained on addition of NaOH, which occurred during the 5th cycle. This indicated that there were no divalent ions such as Mg or Ca that were able to form hydroxides; thus, CO2 bubbling did not lead to the formation of particles. Therefore, in our experiment, four cycles were sufficient to remove all divalent ions from the brine through the formation of particles. The experimental cycle is shown in Figure 1. We decided not to consider the effect of dissolved CO2 from atmosphere during the experiments, because we believed that Mg2+, which was 3 times more abundant than Ca2+ in the brine, would not be carbonated by atmospheric CO2 under the experimental conditions.
After the reaction with CO2, the suspension was filtered, the concentrations of Mg, Ca, and Na in the filtered liquid samples were analyzed, and the filter cake was dried in an oven at 80 °C for 24 h, then characterized using XRD (X’pert MPD, Philips, EA Almelo, The Netherlands), a field emission scanning electron microscope (FESEM; JSM-7800 FPRIME, JEOL, Tokyo, Japan) equipped with an energy dispersive spectrometer (EDS; X-MaxN, Oxford), thermogravimetric analysis (TGA; DTG-60H, Shimadzu, Kyoto, Japan) at argon environment (10 °C/min heating rate), and Fourier transform infrared spectroscopy (FTIR; NICOLET 380, Thermo Fisher Scientific Inc., Costa Mesa, CA, USA).
3. Results and discussion
3.1. Concentrations of Mg, Ca, and Na in Brine with Different pH Values
Initial experiments aimed to obtain information on the changes in the concentrations of Mg and Ca as the pH was varied from 10–13.5 by adding NaOH solution to brine. This resulted in the formation of a white suspension. The suspension thickened as the amount of NaOH solution added increased. ICP-OES was used to measure the concentrations of the ions; the results are shown in Figure 2. The label “raw” on the horizontal axis represents the untreated brine (i.e., no NaOH solution had been added). The left vertical axis shows the concentrations of Mg and Ca, while the right vertical axis shows the concentration of Na. It can be seen that the concentrations of Mg and Ca were reproducible; however, the concentration of Na showed large standard deviations because the solutions were prepared for ICP-OES measurement by diluting them by a factor of 1000. It was expected that the concentration of Na would increase as the pH increased, owing to the addition of NaOH solution to the brine.
It is likely that as the measured concentrations of Mg and Ca decreased as NaOH was added to the brine, the Mg and Ca ions had formed their hydroxides. If a brine suspension with a specific pH resulted in a substantial reduction in the concentration of one ion, it would strongly suggest that this was the optimal pH for isolating Mg and Ca from each other.
CO2 mineralization is an ionic reaction between CO32− and (divalent) metal ions. CO2 will change its form depending on the pH environment it is exposed to, as shown in the middle column of Table 2. Therefore, increasing the pH is essential when attempting to enhance the transformation of injected gaseous CO2 into its ionic form, CO32−. The pH can be increased by the addition of alkaline agents, which will dissolve and yield OH− in aqueous solutions. If a reactant contains metal ions, metal hydroxide particles will precipitate after reaction with existing OH−. Consequently, there is an increase in pH results in the formation of metal hydroxides and ionization of CO2. This is the reason that addition of NaOH is required.
When the pH was increased from 10 to 10.5, the concentration of Mg decreased by approximately 2000 mg/L, and when the pH was increased to 11, the concentration decreased by a further 180 mg/L. After this, the Mg concentration remained relatively constant up to pH 13.5. The concentration of Ca did not change significantly as the pH was varied. Consequently, we chose pH 10.5, to allow Mg from brine to form Mg(OH)2 without significantly altering the concentration of Ca. Relatively pure Mg(OH)2 can facilitate the production of pure Mg-carbonated particles by CO2 injection. This is the reason for the separation or isolation of Mg and Ca from each other by pH adjustment before CO2 injection.
We used the equations below by calculating the ion selectivity of Mg and Ca in hydroxide salts at pH 10.5 and 11.
According to Equation (1), at pH 10.5, 90% of Mg and 23% of Ca in brine precipitated as their hydroxides. As the pH was increased to 11, 99% of Mg and 29% of Ca had formed their hydroxides. Equation (1) seems to indicate that pH 11 would be more favorable for the recovery of Mg and Ca from brine. However, the precipitated ratio does not give enough information to allow a useful pH for the separation of Mg and Ca to be selected: in this study, CO2 mineralization requires relatively pure Mg- and Ca-hydroxides to ensure that pure carbonated particles are obtained.
Equation (2) shows that at pH 10.5, the precipitated particles were composed of 92.3% Mg(OH)2 and 7.70% Ca(OH)2. Meanwhile, at pH 11, the precipitated particles were composed of 91.5% Mg(OH)2 and 8.50% Ca(OH)2. Therefore, the Mg(OH)2 obtained was purer at pH 10.5. In addition, adjusting the pH to 10.5 required 36.1 ± 0.5 mL of 1 M NaOH solution for 0.25 L brine, while adjusting to pH 11 required 42.0 ± 0.6 mL of 1 M NaOH solution. Therefore, increasing the pH from 10.5 to 11 required an additional 5.90 mL of NaOH solution: this would increase the operational cost for the process.
3.2. Bubbling CO2 through a Suspension at pH 10.5
CO2 mineralization was performed by bubbling CO2 microbubbles through a brine suspension at pH 10.5. In our previous studies on the precipitation of CaCO3 by CO2 mineralization, we found that as the pH of the suspension of Ca(OH)2 into which CO2 was injected approached neutral, all the particles had formed CaCO3, leading us to regard this as the end of the reaction. We therefore discontinued CO2 injection at this point [7,26]. On the basis of this experience, we initially intended to stop CO2 injection when the pH of the brine approached neutral. However, in contrast to our previous experiments, we found that no particles were suspended at this neutral pH. We therefore decided to stop CO2 injection at a higher pH of 8. CO2 at 600 mL/min was injected for 4.5, 5, 7, 9 mins for four experimental cycles.
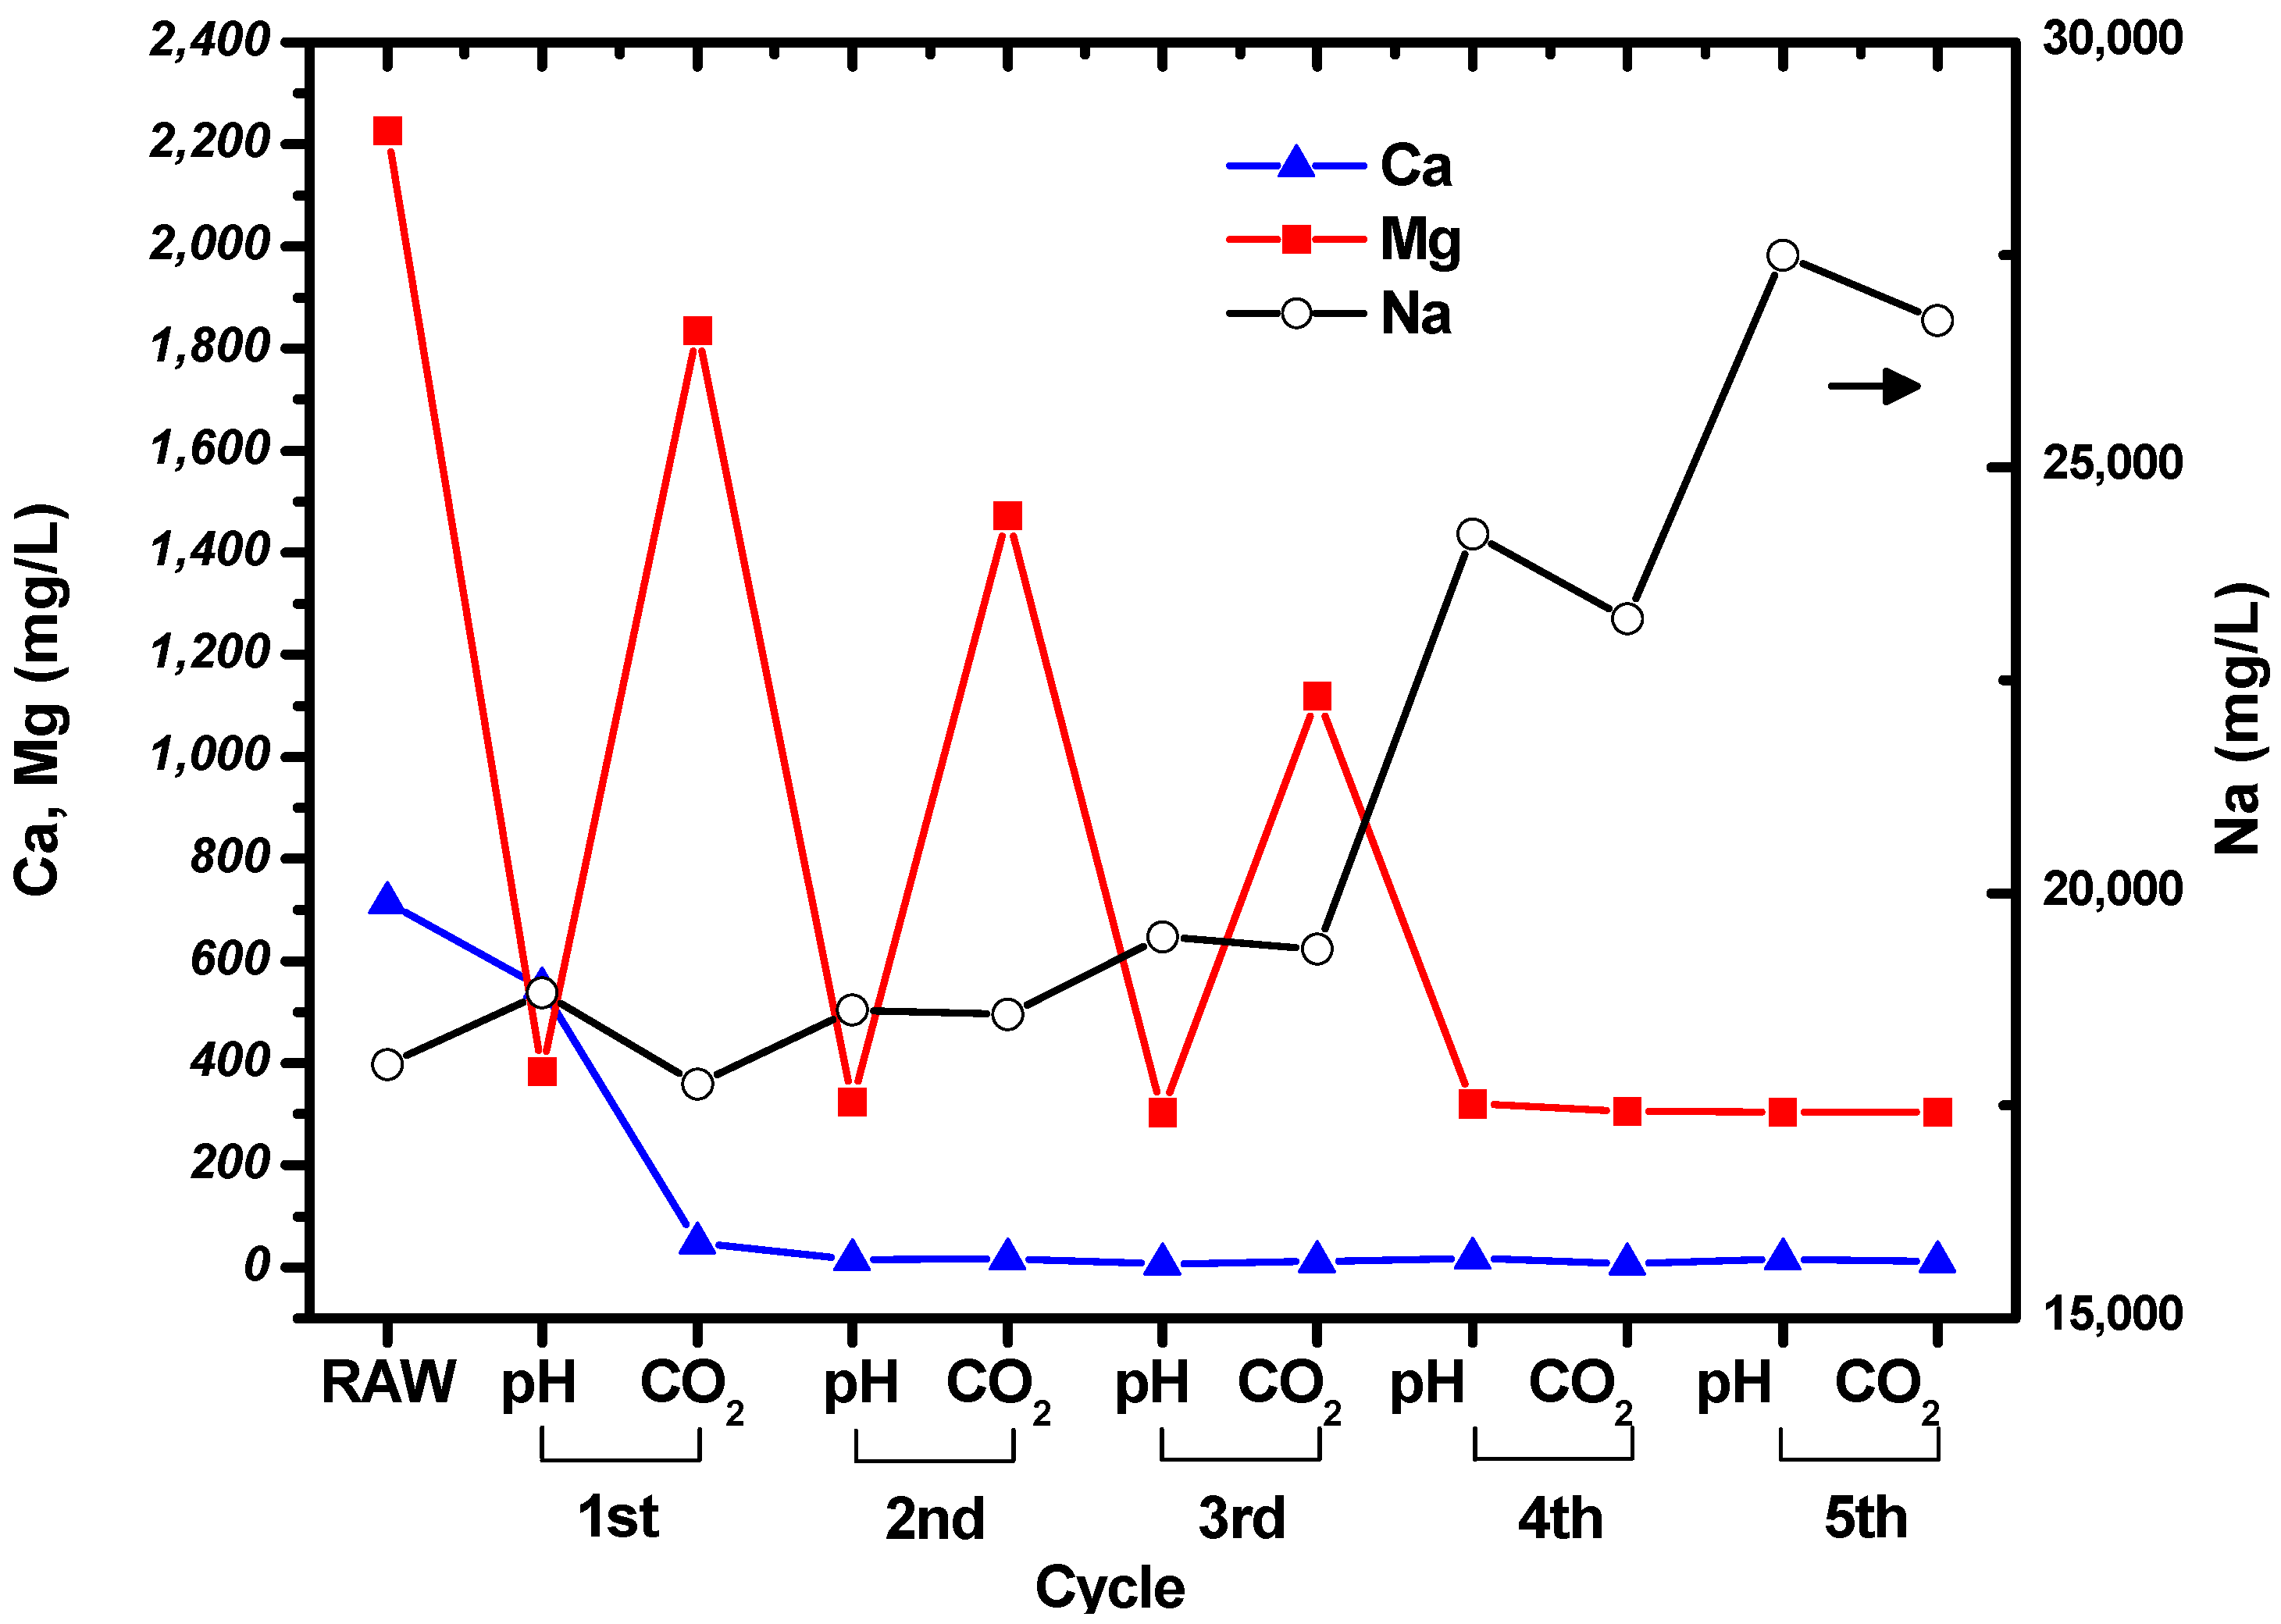
The concentrations of Mg, Ca, and Na in the suspension were measured at the end of each step in the cycle shown in Figure 1. The measured results are shown in Figure 3, and the concentrations of the ions in the raw, untreated brine are given for comparison. It can be seen that the concentrations of Mg and Ca decreased during the cycles, while the concentration of Na increased owing to the addition of NaOH solution. Filtration was used to collect the particles after the CO2 bubbling step in each cycle.
The concentration of Ca decreased to tens of mg/L after the first cycle, and then remained constant. This indicates that all the Ca in the brine had precipitated. Interestingly, the concentrations of Mg fluctuated during the cycles. The concentration of Mg in the suspension decreased when the pH was increased to 10.5, and then increased as CO2 was bubbled through the brine. The Mg concentration at pH 10.5 remained constant at around ~300 mg/L, while the concentration after CO2 bubbling decreased as the number of cycles increased. It seems that precipitation of carbonated Mg particles was less favorable than precipitation of carbonated Ca particles. However, it can be seen from the Mg and Ca concentrations measured after CO2 bubbling that Mg carbonate precipitated during the cycles. No particles were formed after increasing the pH and bubbling CO2 through the solution during the fifth cycle.
Based on the brine that we used, 10 million tons of brine contains 22,260 tons of Mg and 7140 tons of Ca. If assume that Mg and Ca precipitate as MgCO3 and CaCO3, each ion ideally reacts with 40,306 and 7854 tons of CO2. According to the measured concentration of remained Mg and Ca in brine after the fourth cycle, 19,260 and 7080 tons of Mg and Ca react with 34,874 and 7788 tons of CO2, respectively. The estimated amount of MgCO3 and CaCO3 are 66,816 and 17,700 tons by CO2 mineralization.
3.3. Characterization of Suspended Particles from CO2 Mineralization
After each pH increasing/CO2-bubbling cycle, the particles in the suspensions were collected via filtration and characterized. It should be noted that too few particles were formed during the first cycle for full characterization to be carried out.
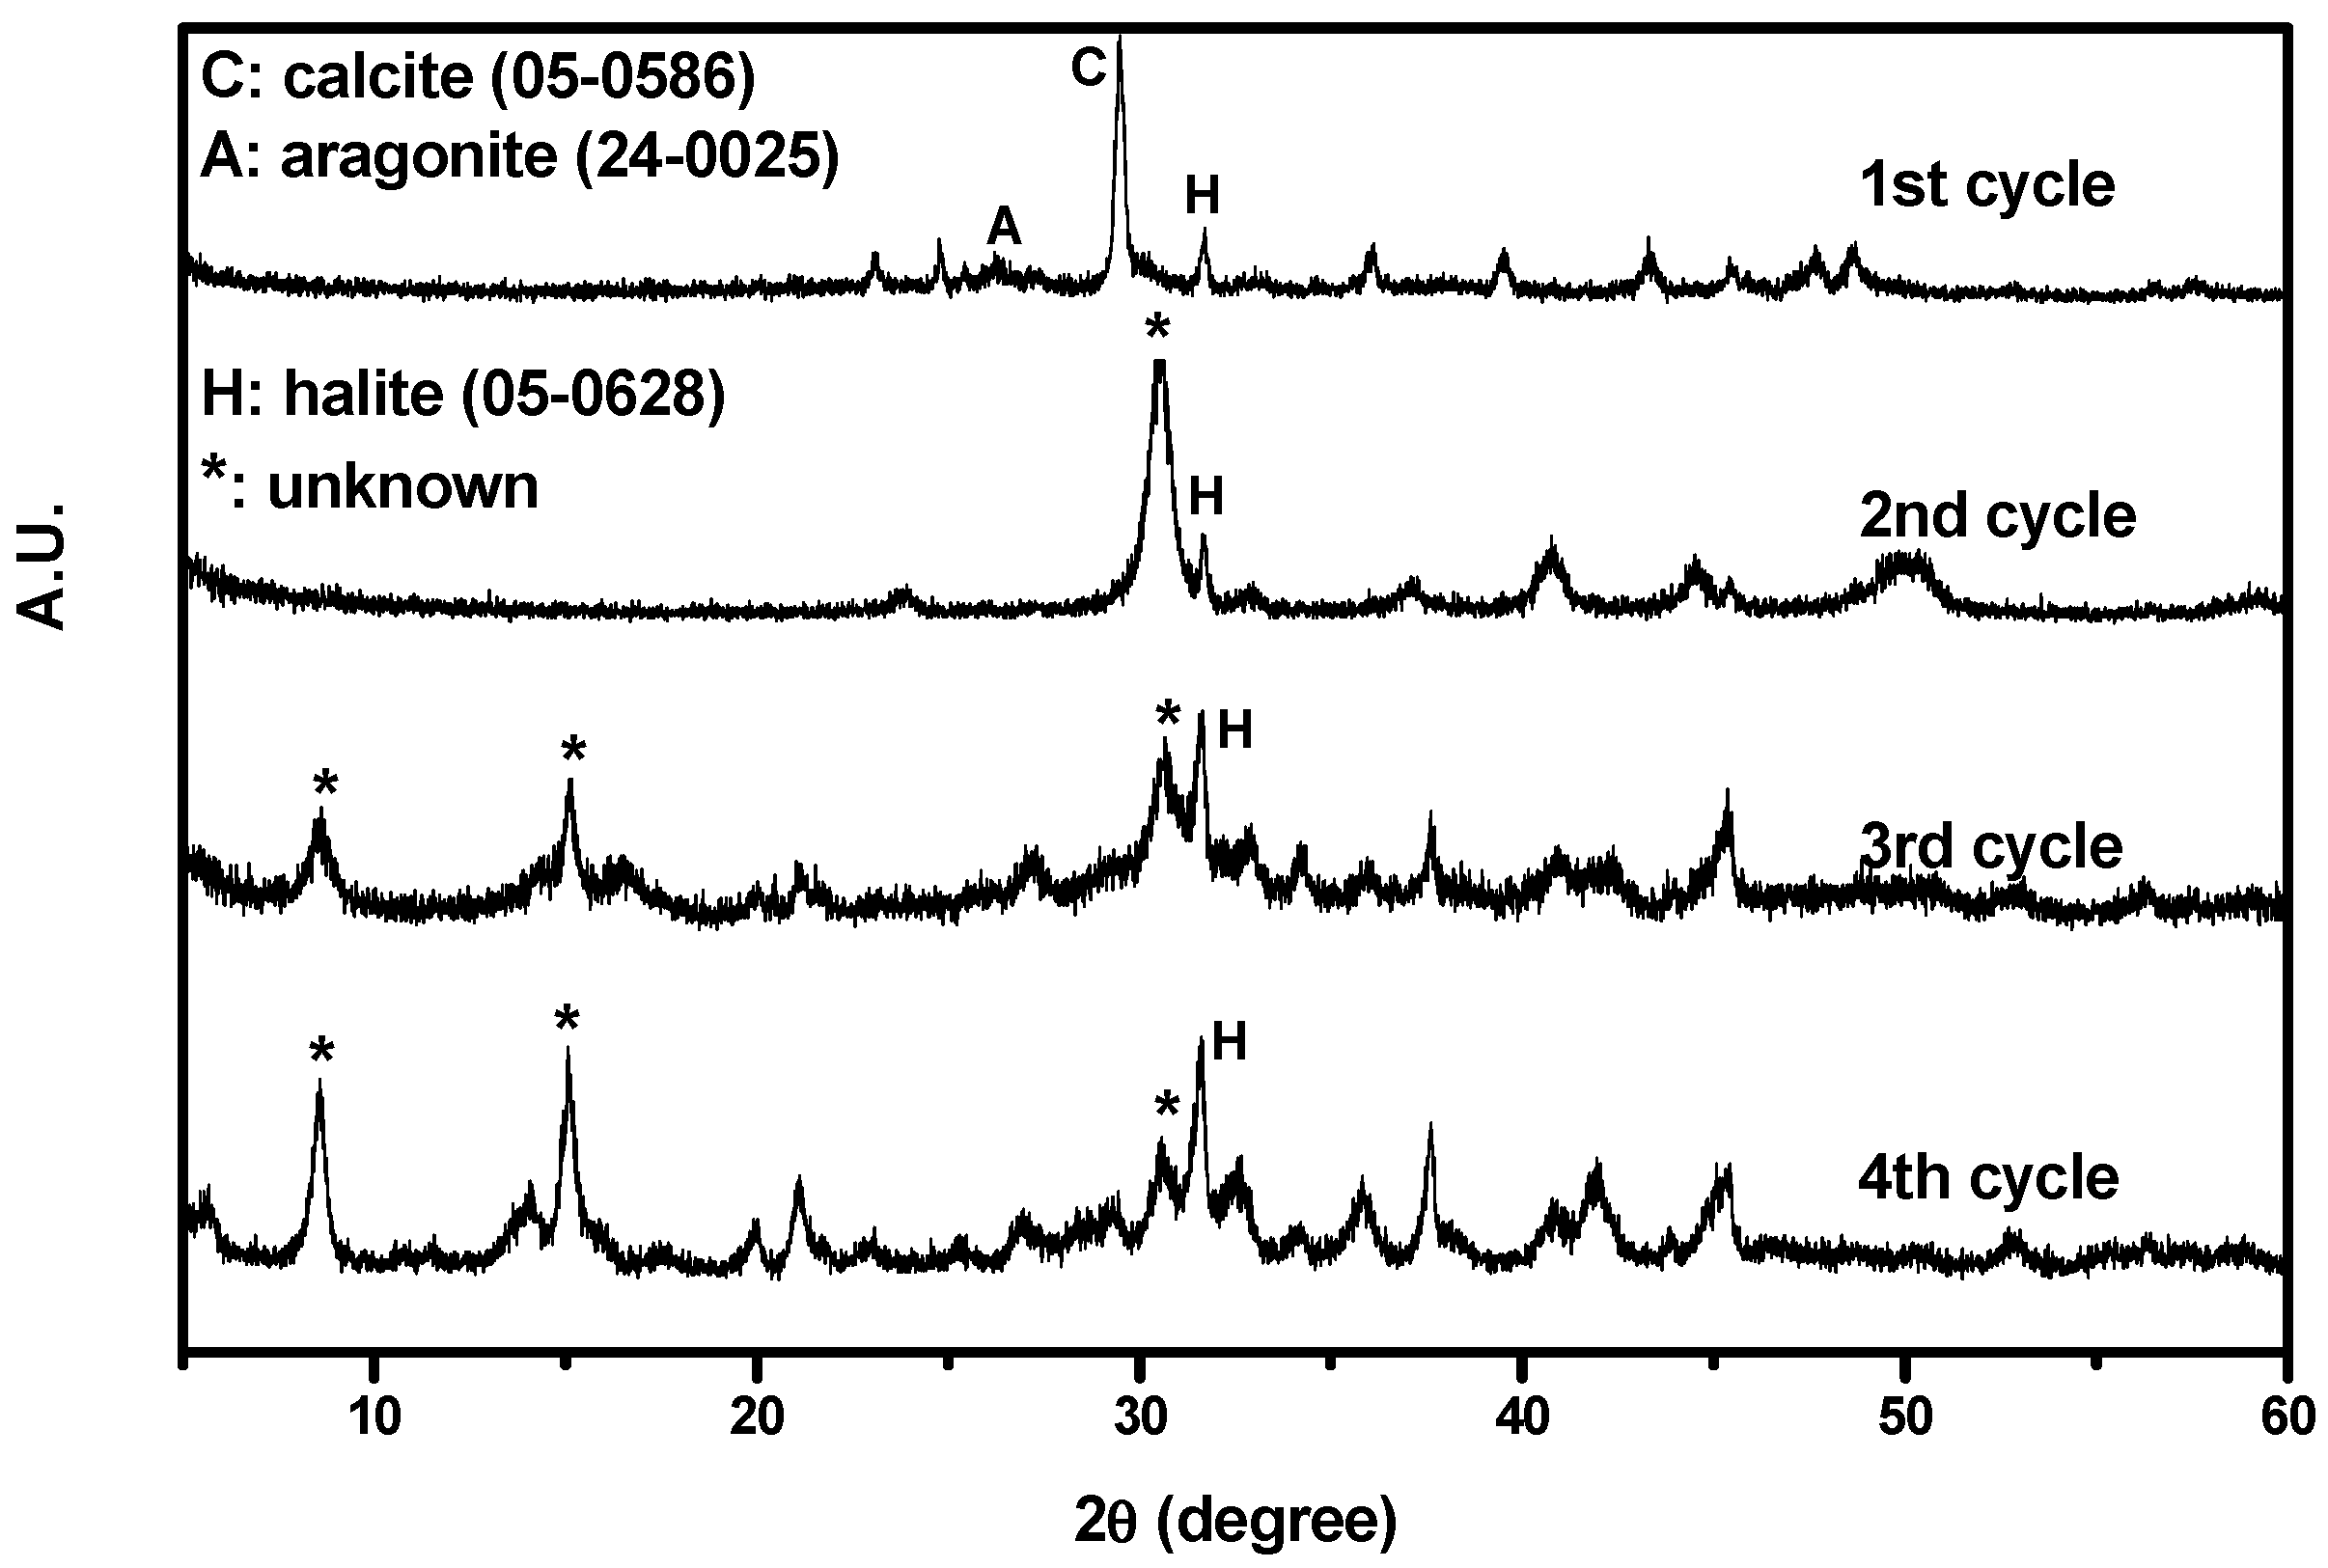
Figure 4 shows the XRD results. As depicted in the figure, the particles collected from the first cycle consisted of calcite and halite. In addition, some aragonite had crystallized owing to the coexistence of Mg and Ca ions [28]. The CaCO3 successfully precipitated from the non-synthesized brine during CO2 mineralization. However, particles collected from other cycles could not be identified positively by standard Joint Committee on Powder Diffraction Standards (JCPDS). Only halite phase was identified. As the number of cycles increased, the halite signal became more intense.
Mg carbonates have been reported to form many crystal phases, depending on the conditions such as pressure, temperature, water content, and agitation of the reactant liquid phase [29,30,31,32]. We utilized other analytical methods that would provide information regarding the presence of Mg carbonates in the particles.
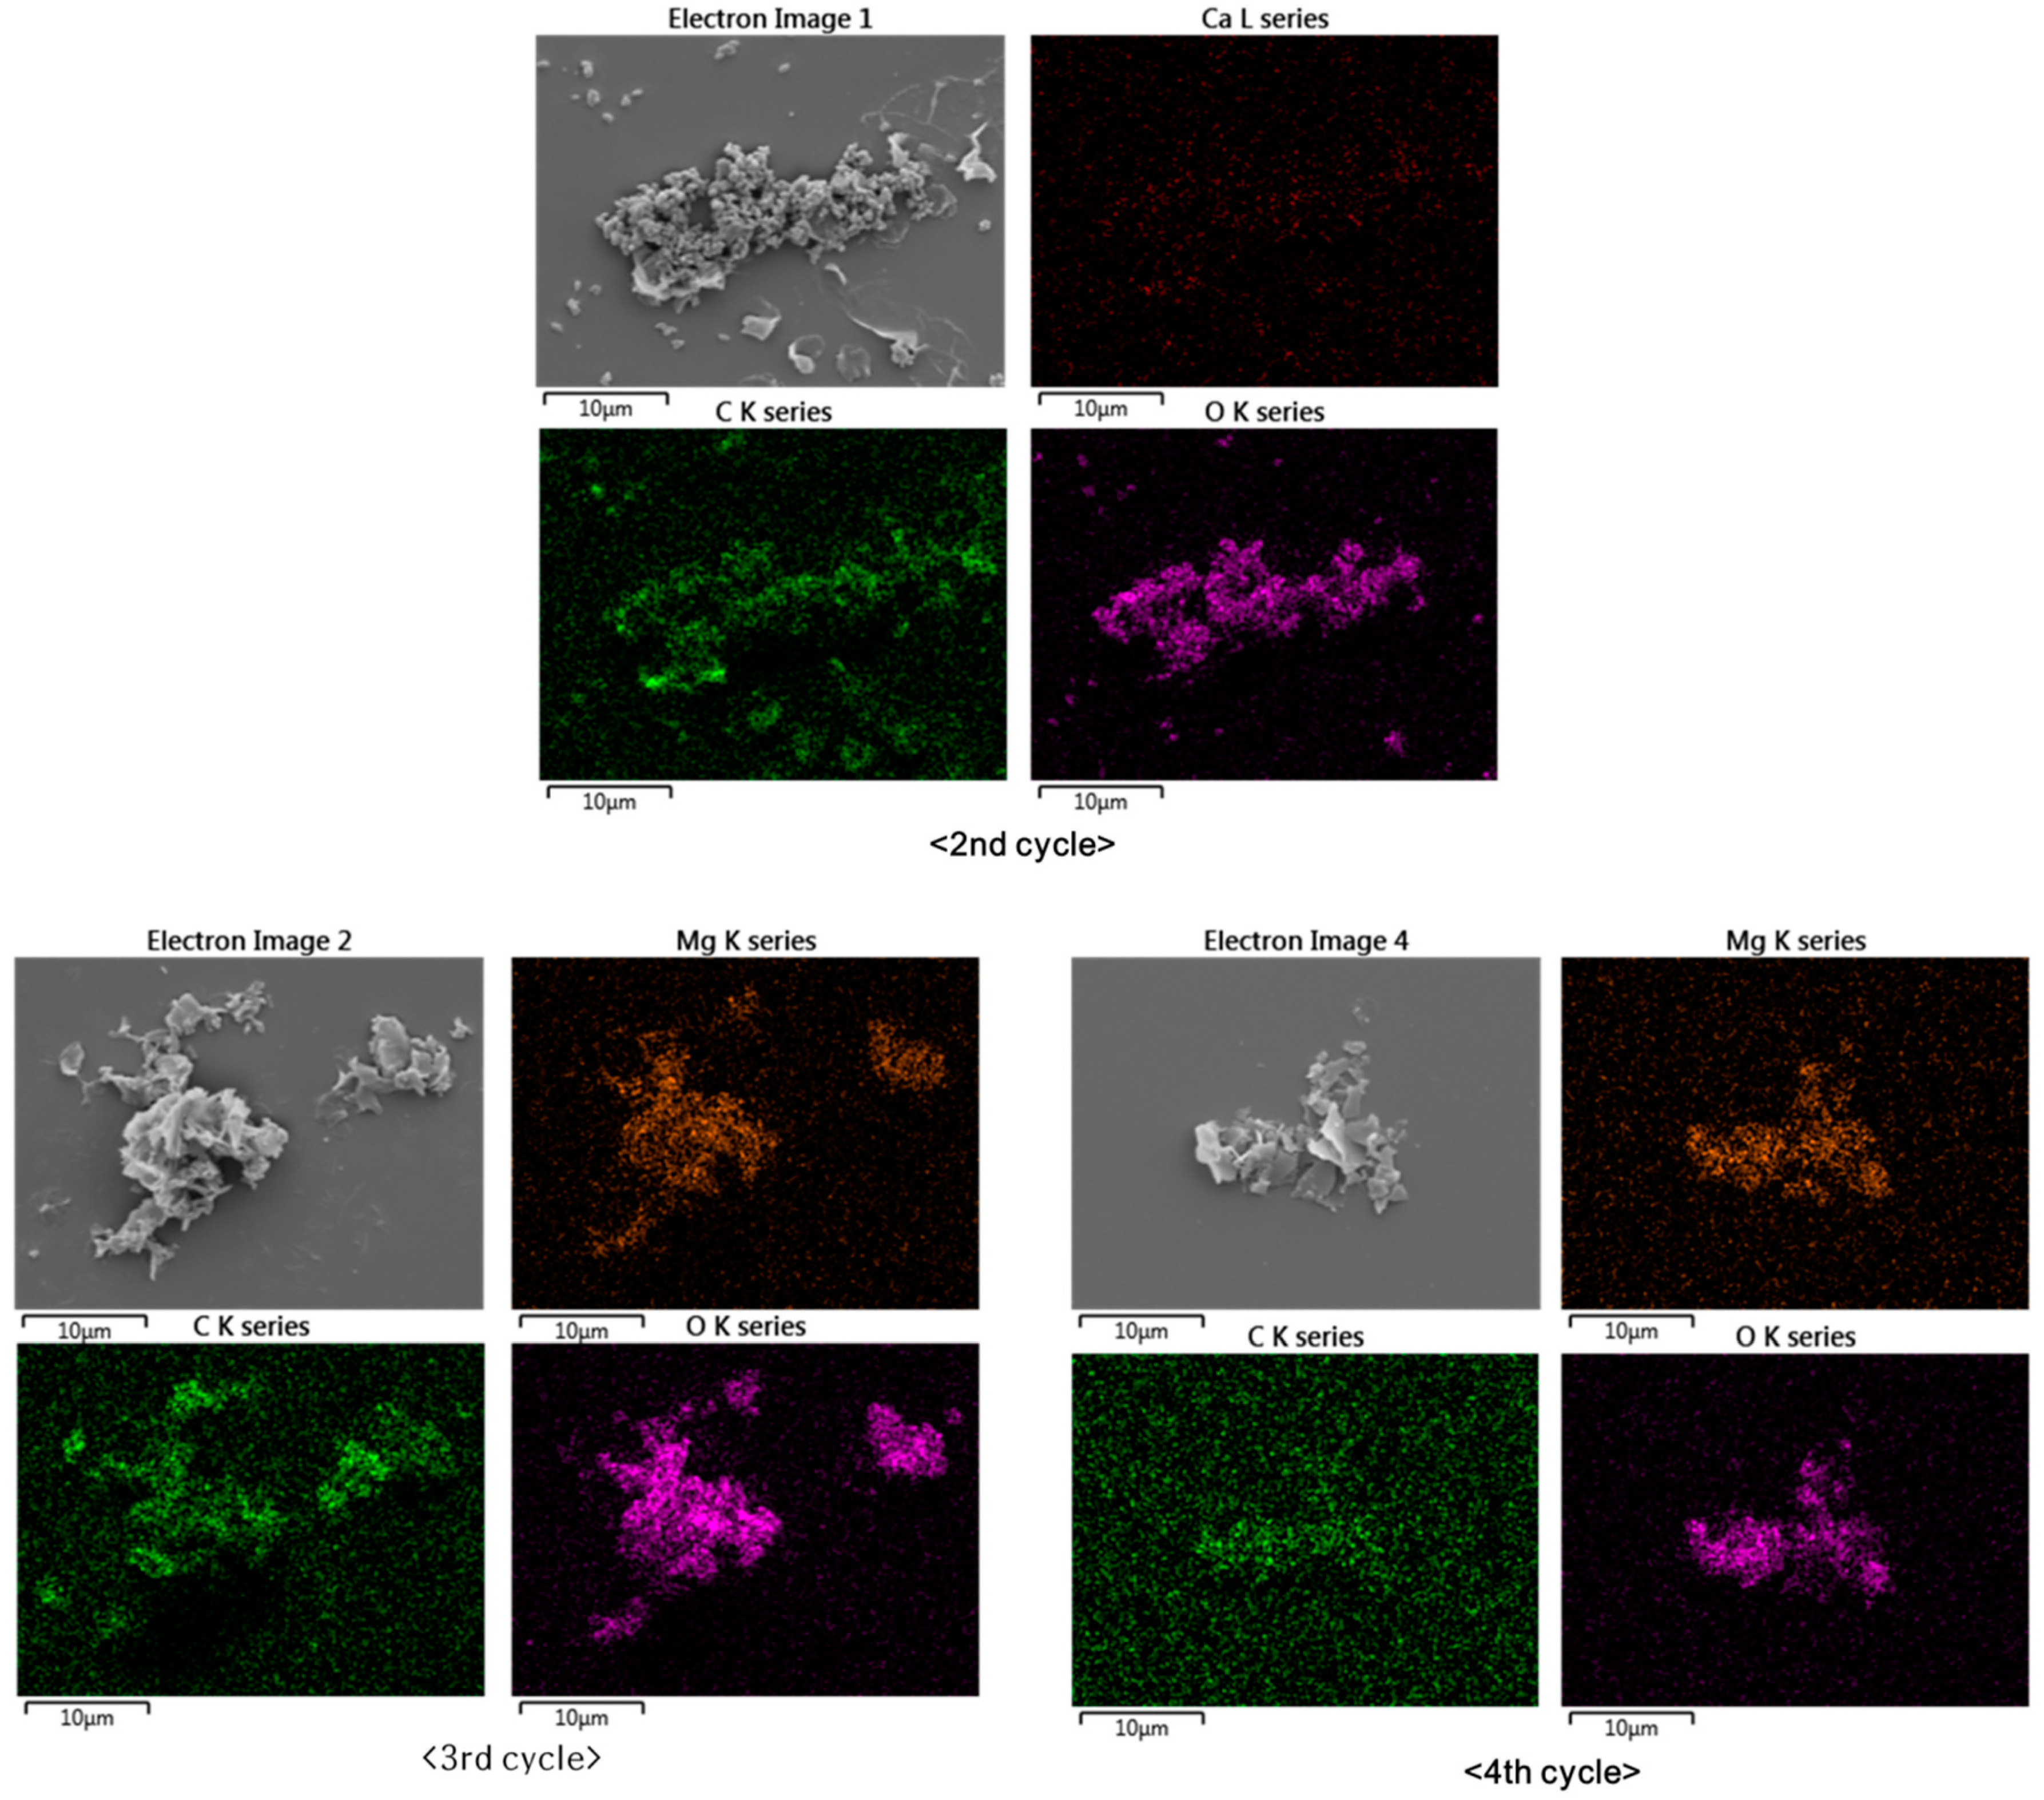
Elemental mapping by SEM-EDS revealed that the particles from the second, third, and fourth cycles consisted of Ca and Mg carbonates (Figure 5). This shows that the Mg formed carbonates, despite the fact that the precipitation of Mg carbonates is less favorable than the precipitation of Ca carbonates because Mg carbonates are more soluble than Ca carbonates and hydrated Mg ions possess more energy [33]. Figure 5 shows that the elemental distributions of Ca, Mg, C, and O were broadly similar. The second cycle produced Ca carbonate, while the third and fourth cycles produced Mg carbonate. The samples were prepared on silicon wafers to prevent the appearance of the carbon signal from the commonly used carbon adhesive tape.
The particles were also subjected to FTIR analysis; the results are shown in Figure 6. The particles that precipitated during the second cycle showed FTIR absorption bands at 727, 873, and 1406 cm−1. Several research papers that identified Mg carbonates using FTIR analysis suggest that the peak at 727 cm−1 was likely caused by the presence CaCO3 in the structure. Long et al. [34] reported that peaks at 724, 726, and 730 cm−1 were obtained from calcite particles including 30 mol% Mg. Similarly, Gunasekaran et al. [34,35] and Xu and Poduska [36] reported dolomite peaks at 729 and 730 cm−1, respectively. These peaks arose from CO32−. Consequently, it is possible to assign the IR peak at 727 cm−1 to Mg carbonates. In addition, the peaks at 873 and 1406 cm−1 were from the CO32− ions in CaCO3 [35,37], which was already known to be present due to XRD analysis.
The particles obtained after the third and fourth cycles both showed peaks at 852 and 877 cm−1. In these cycles, both Ca and Mg carbonates formed. The peak at 852 cm−1 was due to calcite that included Mg. Long et al. [34] reported that calcite including Mg at 20 and 39 mol% absorbed IR at 852 cm−1. CO32− ions in dolomite also absorbed IR near this position, at 853 cm−1. Meanwhile, the peak at 877 cm−1 indicates the presence of CaCO3 [35,36,38,39,40]. Although we expected that the third and fourth cycles would produce Mg carbonates that excluded Ca, some of the Ca remaining in the suspension after the second cycle managed to participate in the carbonation of Mg. The peaks at 1418 and 1479 cm−1 are typical absorption peaks of hydromagnesite. In addition, the peak at 3647 cm−1 provides further evidence of the presence of hydromagnesite. Mg from brine successfully precipitated as hydromagnesite, indicating that brine could be a useful resource for CO2 mineralization.
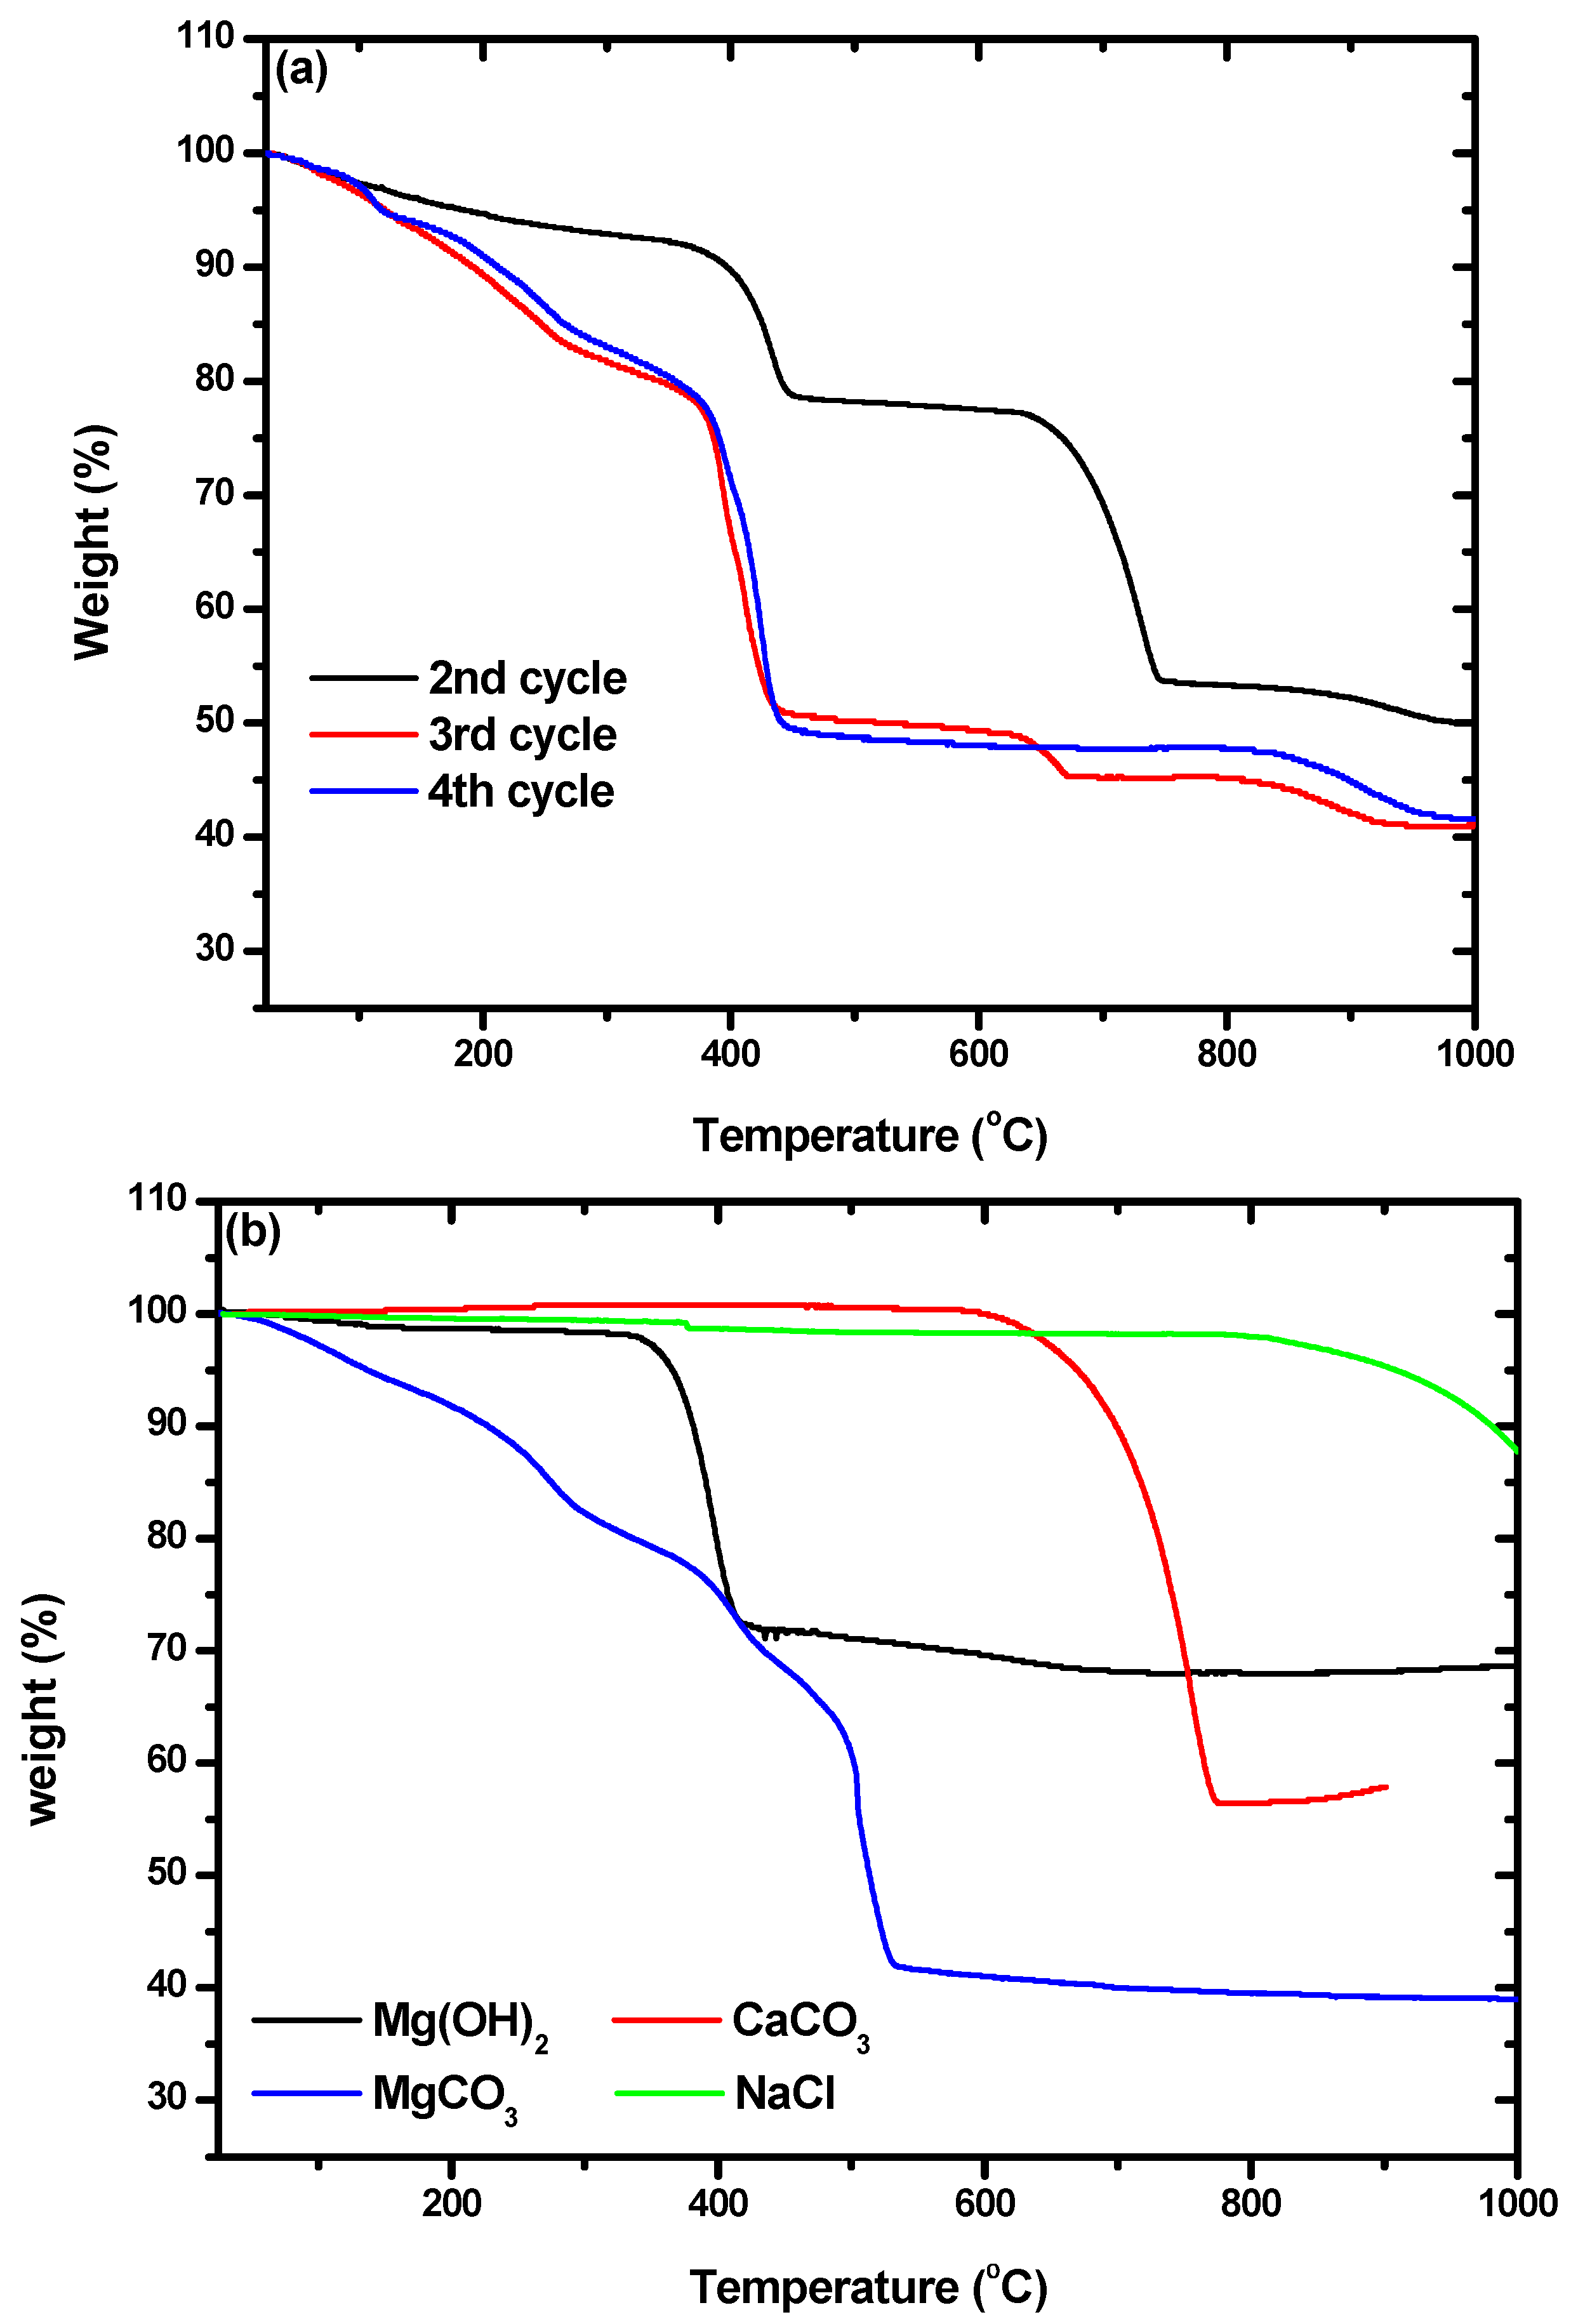
In addition, characterization by TGA was used to confirm the presence of hydromagnesite. The weight losses of the particles we obtained, shown in Figure 7a, were compared with those of commercial Mg(OH)2, CaCO3, MgCO3, and NaCl, which are shown in Figure 7b. Weight loss due to Mg(OH)2 occurred between 328 and 422 °C. Losses at 589–778 °C and 180–524 °C were due to CaCO3 and hydromagnesite, respectively. By comparing Figure 7a,b, it can be seen that the particles from the second cycle were composed of Mg(OH)2 and CaCO3. A small amount of NaCl was included in all the particles, as shown by the weight losses that began at 810 °C. The TGA curves of the particles from the third and fourth cycles were quite different from that obtained for the particles from the second cycle. The weight losses at ~450 °C in the curves of the particles from the third and fourth cycles did not quite match with what would be expected for the loss of hydromagnesite. Montes-Hermandez et al. [41] synthesized hydromagnesite and characterized particles of it using TGA. They found that hydromagnesite exhibited weight loss at 450 °C with some fluctuation at around 375 °C, which precisely matched the results shown for the particles from the third and fourth cycles in Figure 7a. There were also some differences between the TGA curves obtained for the particles from the third and fourth cycles. The curve for cycle three indicated an additional weight loss of 4.5% in the range of 635–665 °C, which indicates the coexistence of calcite and hydromagnesite. As the number of cycles increased, the purity of the hydromagnesite that precipitated increased.
4. Conclusions
Non-synthesized brine from a functional RO seawater desalination plant was used for CO2 mineralization to fix CO2 under ambient temperature and pressure. To the best of our knowledge, this is the first time that non-synthesized brine has been used for CO2 mineralization. Cycles consisting of an increase in pH followed by CO2 injection and finally filtration precipitated 99% of Ca and 86% of Mg from the brine, using them to fix CO2 in the form of carbonated minerals. CO2 was successfully mineralized with Ca to yield CaCO3 and with Mg to produce hydromagnesite. This was shown by the characterization of the precipitates obtained from the cycles by XRD, SEM-EDS, FTIR, and TGA-DTA.
It was thought that co-presence of Ca with Mg was not favorable for the precipitation of Mg carbonates. In this study, we precipitated hydromagnesite followed by precipitation of calcite from brine. This means that the concentrations of Mg and Ca in brine are twice those in influent seawater, making it a good source of divalent ions for CO2 mineralization. According to our experiments, 42,662 tons of CO2 could be sequestered from 10 million tons of the brine used for a year. Moreover, 17,700 tons of CaCO3 and 66,816 tons of MgCO3 would be obtained.
Acknowledgments
This research was supported by the Basic Research Project (17-3422) of the Korea Institute of Geoscience and Mineral Resources (KIGAM), funded by the Ministry of Science and Information and Communications Technologies (ICT).
Author Contributions
Jun-Hwan Bang and Soochun Chae conceived and designed the experiments; Yeongsuk Yoo, Seung-Woo Lee and Kyungsun Song performed experiments and analyzed the data; Jun-Hwan Bang wrote the paper.
Conflicts of Interest
The authors declare no conflict of interest.
References
- Ko, D.-H. Drought Causes Water Shortage Crisis in Southern Korea; The Korea Times: Seoul, Korea, 2017. [Google Scholar]
- Papapetrou, M.; Cipollina, A.; la Commare, U.; Micale, G.; Zaragoza, G.; Kosmadakis, G. Assessment of methodologies and data used to calculate desalination costs. Desalination 2017, 419, 8–19. [Google Scholar] [CrossRef]
- Charcosset, C. A review of membrane processes and renewable energies for desalination. Desalination 2009, 245, 214–231. [Google Scholar] [CrossRef]
- Alkhudhiri, A.; Darwish, N.; Hilal, N. Membrane distillation: A comprehensive review. Desalination 2012, 287, 2–18. [Google Scholar] [CrossRef]
- Piyadasa, C.; Ridgway, H.F.; Yeager, T.R.; Stewart, M.B.; Pelekani, C.; Gray, S.R.; Orbell, J.D. The application of electromagnetic fields to the control of the scaling and biofouling of reverse osmosis membranes—A review. Desalination 2017, 418, 19–34. [Google Scholar] [CrossRef]
- Sanna, A.; Uibu, M.; Caramanna, G.; Kuusik, R.; Maroto-Valer, M.M. A review of mineral carbonation technologies to sequester CO2. Chem. Soc. Rev. 2014, 43, 8049–8080. [Google Scholar] [CrossRef] [PubMed] [Green Version]
- Bang, J.-H.; Kim, W.; Song, K.S.; Jeon, C.W.; Chae, S.C.; Cho, H.-J.; Jang, Y.N.; Park, S.-J. Effect of experimental parameters on the carbonate mineralization with CaSO4⋅2H2O using CO2 microbubbles. Chem. Eng. J. 2014, 244, 282–287. [Google Scholar] [CrossRef]
- Druckenmiller, M.L.; Maroto-Valer, M.M. Carbon sequestration using brine of adjusted pH to form mineral carbonates. Fuel Process. Technol. 2005, 86, 1599–1614. [Google Scholar] [CrossRef]
- Dri, M.; Sanna, A.; Maroto-Valer, M.M. Mineral carbonation from metal wastes: Effect of solid to liquid ratio on the efficiency and characterization of carbonated products. Appl. Energy 2014, 113, 515–523. [Google Scholar] [CrossRef] [Green Version]
- Zevenhoven, R.; Wiklund, A.; Fagerlund, J.; Eloneva, S.; Veen, B.I.; Geerlings, H.; van Mossel, G.; Boerrigter, H. Carbonation of calcium-containing mineral and industrial by-products. Front. Chem. Eng. China 2010, 4, 110–119. [Google Scholar] [CrossRef]
- Baciocchi, R.; Costa, G.; di Bartolomeo, E.; Polettini, A.; Pomi, R. The effects of accelerated carbonation on CO2 uptake and metal release from incineration APC residues. Waste Manag. 2009, 29, 2994–3003. [Google Scholar] [CrossRef] [PubMed]
- Baciocchi, R.; Costa, G.; Lategano, E.; Marini, C.; Polettini, A.; Pomi, R.; Postorino, P.; Rocca, S. Accelerated carbonation of different size fractions of bottom ash from RDF incineration. Waste Manag. 2010, 30, 1310–1317. [Google Scholar] [CrossRef] [PubMed]
- Bang, J.-H.; Lee, S.-W.; Jeon, C.; Park, S.; Song, K.; Jo, W.; Chae, S. Leaching of Metal Ions from Blast Furnace Slag by Using Aqua Regia for CO2 Mineralization. Energies 2016, 9, 996. [Google Scholar] [CrossRef]
- Pan, S.-Y.; Chang, E.; Chiang, P.-C. CO2 capture by accelerated carbonation of alkaline wastes: A review on its principles and applications. Aerosol Air Qual. Res. 2012, 12, 770–791. [Google Scholar] [CrossRef]
- Bałdyga, J.; Henczka, M.; Sokolnicka, K. Utilization of carbon dioxide by chemically accelerated mineral carbonation. Mater. Lett. 2010, 64, 702–704. [Google Scholar] [CrossRef]
- Lee, S.; Kim, J.-W.; Chae, S.; Bang, J.-H.; Lee, S.-W. CO2 sequestration technology through mineral carbonation: An extraction and carbonation of blast slag. J. CO2 Util. 2016, 16, 336–345. [Google Scholar] [CrossRef]
- Soong, Y.; Fauth, D.L.; Howard, B.H.; Jones, J.R.; Harrison, D.K.; Goodman, A.L.; Gray, M.L.; Frommell, E.A. CO2 sequestration with brine solution and fly ashes. Energy Convers. Manag. 2006, 47, 1676–1685. [Google Scholar] [CrossRef]
- Li, P.; Pan, S.-Y.; Pei, S.; Lin, Y.J.; Chiang, P.-C. Challenges and perspectives on carbon fixation and utilization technologies: An overview. Aerosol Air Qual. Res. 2016, 16, 1327–1344. [Google Scholar] [CrossRef]
- Shenvi, S.S.; Isloor, A.M.; Ismail, A.F. A review on RO membrane technology: Developments and challenges. Desalination 2015, 368, 10–26. [Google Scholar] [CrossRef]
- Morrison, J.; Jauffret, G.; Galvez-Martos, J.L.; Glasser, F.P. Magnesium-based cements for CO2 capture and utilisation. Cem. Concr. Res. 2016, 85, 183–191. [Google Scholar] [CrossRef]
- Liu, Q.; Maroto-Valer, M.M. Studies of pH buffer systems to promote carbonate formation for CO2 sequestration in brines. Fuel Process. Technol. 2012, 9, 6–13. [Google Scholar] [CrossRef]
- Wang, W.; Liu, X.; Wang, P.; Zheng, Y.; Wang, M. Enhancement of CO2 Mineralization in Ca2+-/Mg2+-Rich Aqueous Solutions Using Insoluble Amine. Ind. Eng. Chem. Res. 2013, 52, 8028–8033. [Google Scholar] [CrossRef]
- Xie, H.; Liu, T.; Hou, Z.; Wang, Y.; Wang, J.; Tang, L.; Jiang, W.; He, Y. Using electrochemical process to mineralize CO2 and separate Ca2+/Mg2+ ions from hard water to produce high value-added carbonates. Environ. Earth Sci. 2015, 73, 6881–6890. [Google Scholar] [CrossRef]
- Langmuir, D. Stability of Carbonates in the System MgO-CO2-H2O. J. Geol. 1965, 73, 730–754. [Google Scholar] [CrossRef]
- Lide, D.R. CRC Handbook of Chemistry and Physics; CRC Press: Boca Raton, FL, USA, 1997. [Google Scholar]
- Bang, J.-H.; Jang, Y.N.; Kim, W.; Song, K.S.; Jeon, C.W.; Chae, S.C.; Lee, S.-W.; Park, S.-J.; Lee, M.G. Precipitation of calcium carbonate by carbon dioxide microbubbles. Chem. Eng. J. 2011, 174, 413–420. [Google Scholar] [CrossRef]
- Bang, J.-H.; Song, K.; Park, S.; Jeon, C.; Lee, S.-W.; Kim, W. Effects of CO2 Bubble Size, CO2 Flow Rate and Calcium Source on the Size and Specific Surface Area of CaCO3 Particles. Energies 2015, 8, 12304. [Google Scholar] [CrossRef]
- Santos, R.M.; Bodor, M.; Dragomir, P.N.; Vraciu, A.G.; Vlad, M.; van Gerven, T. Magnesium chloride as a leaching and aragonite-promoting self-regenerative additive for the mineral carbonation of calcium-rich materials. Miner. Eng. 2014, 59, 71–81. [Google Scholar] [CrossRef]
- Cheng, W.; Li, Z. Nucleation kinetics of nesquehonite (MgCO3·3H2O) in the MgCl2-Na2CO3 system. J. Cryst. Growth 2010, 312, 1563–1571. [Google Scholar] [CrossRef]
- Hales, M.C.; Frost, R.L.; Martens, W.N. Thermo-Raman spectroscopy of synthetic nesquehonite —Implication for the geosequestration of greenhouse gases. J. Raman Spectrosc. 2008, 39, 1141–1149. [Google Scholar] [CrossRef] [Green Version]
- Coleyshaw, E.E.; Crump, G.; Griffith, W.P. Vibrational spectra of the hydrated carbonate minerals ikaite, monohydrocalcite, lansfordite and nesquehonite. Spectrochim. Acta Part A Mol. Biomolecul. Spectroscop. 2003, 59, 2231–2239. [Google Scholar] [CrossRef]
- Hopkinson, L.; Kristova, P.; Rutt, K.; Cressey, G. Phase transitions in the system MgO–CO2–H2O during CO2 degassing of Mg-bearing solutions. Geochim. Cosmochim. Acta 2012, 76, 1–13. [Google Scholar] [CrossRef]
- Xu, J.; Yan, C.; Zhang, F.; Konishi, H.; Xu, H.; Teng, H.H. Testing the cation-hydration effect on the crystallization of Ca–Mg–CO3 systems. Proc. Natl. Acad. Sci. USA 2013, 110, 17750–17755. [Google Scholar] [CrossRef] [PubMed]
- Long, X.; Nasse, M.J.; Ma, Y.; Qi, L. From synthetic to biogenic Mg-containing calcites: A comparative study using FTIR microspectroscopy. Phys. Chem. Chem. Phys. 2012, 14, 2255–2263. [Google Scholar] [CrossRef] [PubMed]
- Gunasekaran, S.; Anbalagan, G.; Pandi, S. Raman and infrared spectra of carbonates of calcite structure. J. Raman Spectrosc. 2006, 37, 892–899. [Google Scholar] [CrossRef]
- Xu, B.; Poduska, K.M. Linking crystal structure with temperature-sensitive vibrational modes in calcium carbonate minerals. Phys. Chem. Chem. Phys. 2014, 16, 17634–17639. [Google Scholar] [CrossRef] [PubMed] [Green Version]
- Pandey, S.; Sengupta, J. Fourier transform infrared spectroscopy: A tool for detection of lime content in hot mix asphalt. In Proceedings of the 26th ARRB Conference, Sydney, Australia, 19–22 October 2014; p. 11. [Google Scholar]
- Bourrata, X.; Qiao, L.; Feng, Q.; Angellier, M.; Dissaux, A.; Beny, J.-M.; Barbin, V.; Stempflé, P.; Rousseau, M.; Lopez, E. Origin of growth defects in pearl. Mater. Charact. 2012, 72, 94–103. [Google Scholar] [CrossRef] [Green Version]
- Junfeng, J.; Yun, G.; Balsam, W.; Damuth, J.E.; Jun, C. Rapid identification of dolomite using a Fourier transform infrared spectrophotometer (FTIR): A fast method for identifying Heinrich events in IODP Site U1308. Mar. Geol. 2009, 258, 60. [Google Scholar]
- Bang, J.-H.; Song, K.S.; Lee, M.G.; Jeon, C.W.; Jang, Y.N. Effect of Critical Micelle Concentration of Sodium Dodecyl Sulfate Dissolved in Calcium and Carbonate Source Solutions on Characteristics of Calcium Carbonate Crystals. Mater. Trans. 2010, 51, 1486–1489. [Google Scholar] [CrossRef]
- Montes-Hernandez, G.; Renard, F.; Chiriac, R.; Findling, N.; Toche, F. Rapid Precipitation of Magnesite Microcrystals from Mg(OH)2-H2O-CO2 Slurry Enhanced by NaOH and a Heat-Aging Step (from ~20 to 90 °C). Cryst. Growth Des. 2012, 12, 5233–5240. [Google Scholar] [CrossRef] [Green Version]
Figure 1.
Experimental cycles showing increase in pH, CO2 injection, and filtration after CO2 mineralization.
Figure 1.
Experimental cycles showing increase in pH, CO2 injection, and filtration after CO2 mineralization.

Figure 2.
Concentrations of Mg, Ca, and Na as the pH of brine was increased by the addition of NaOH solution. Error bars represent one standard deviation.
Figure 2.
Concentrations of Mg, Ca, and Na as the pH of brine was increased by the addition of NaOH solution. Error bars represent one standard deviation.
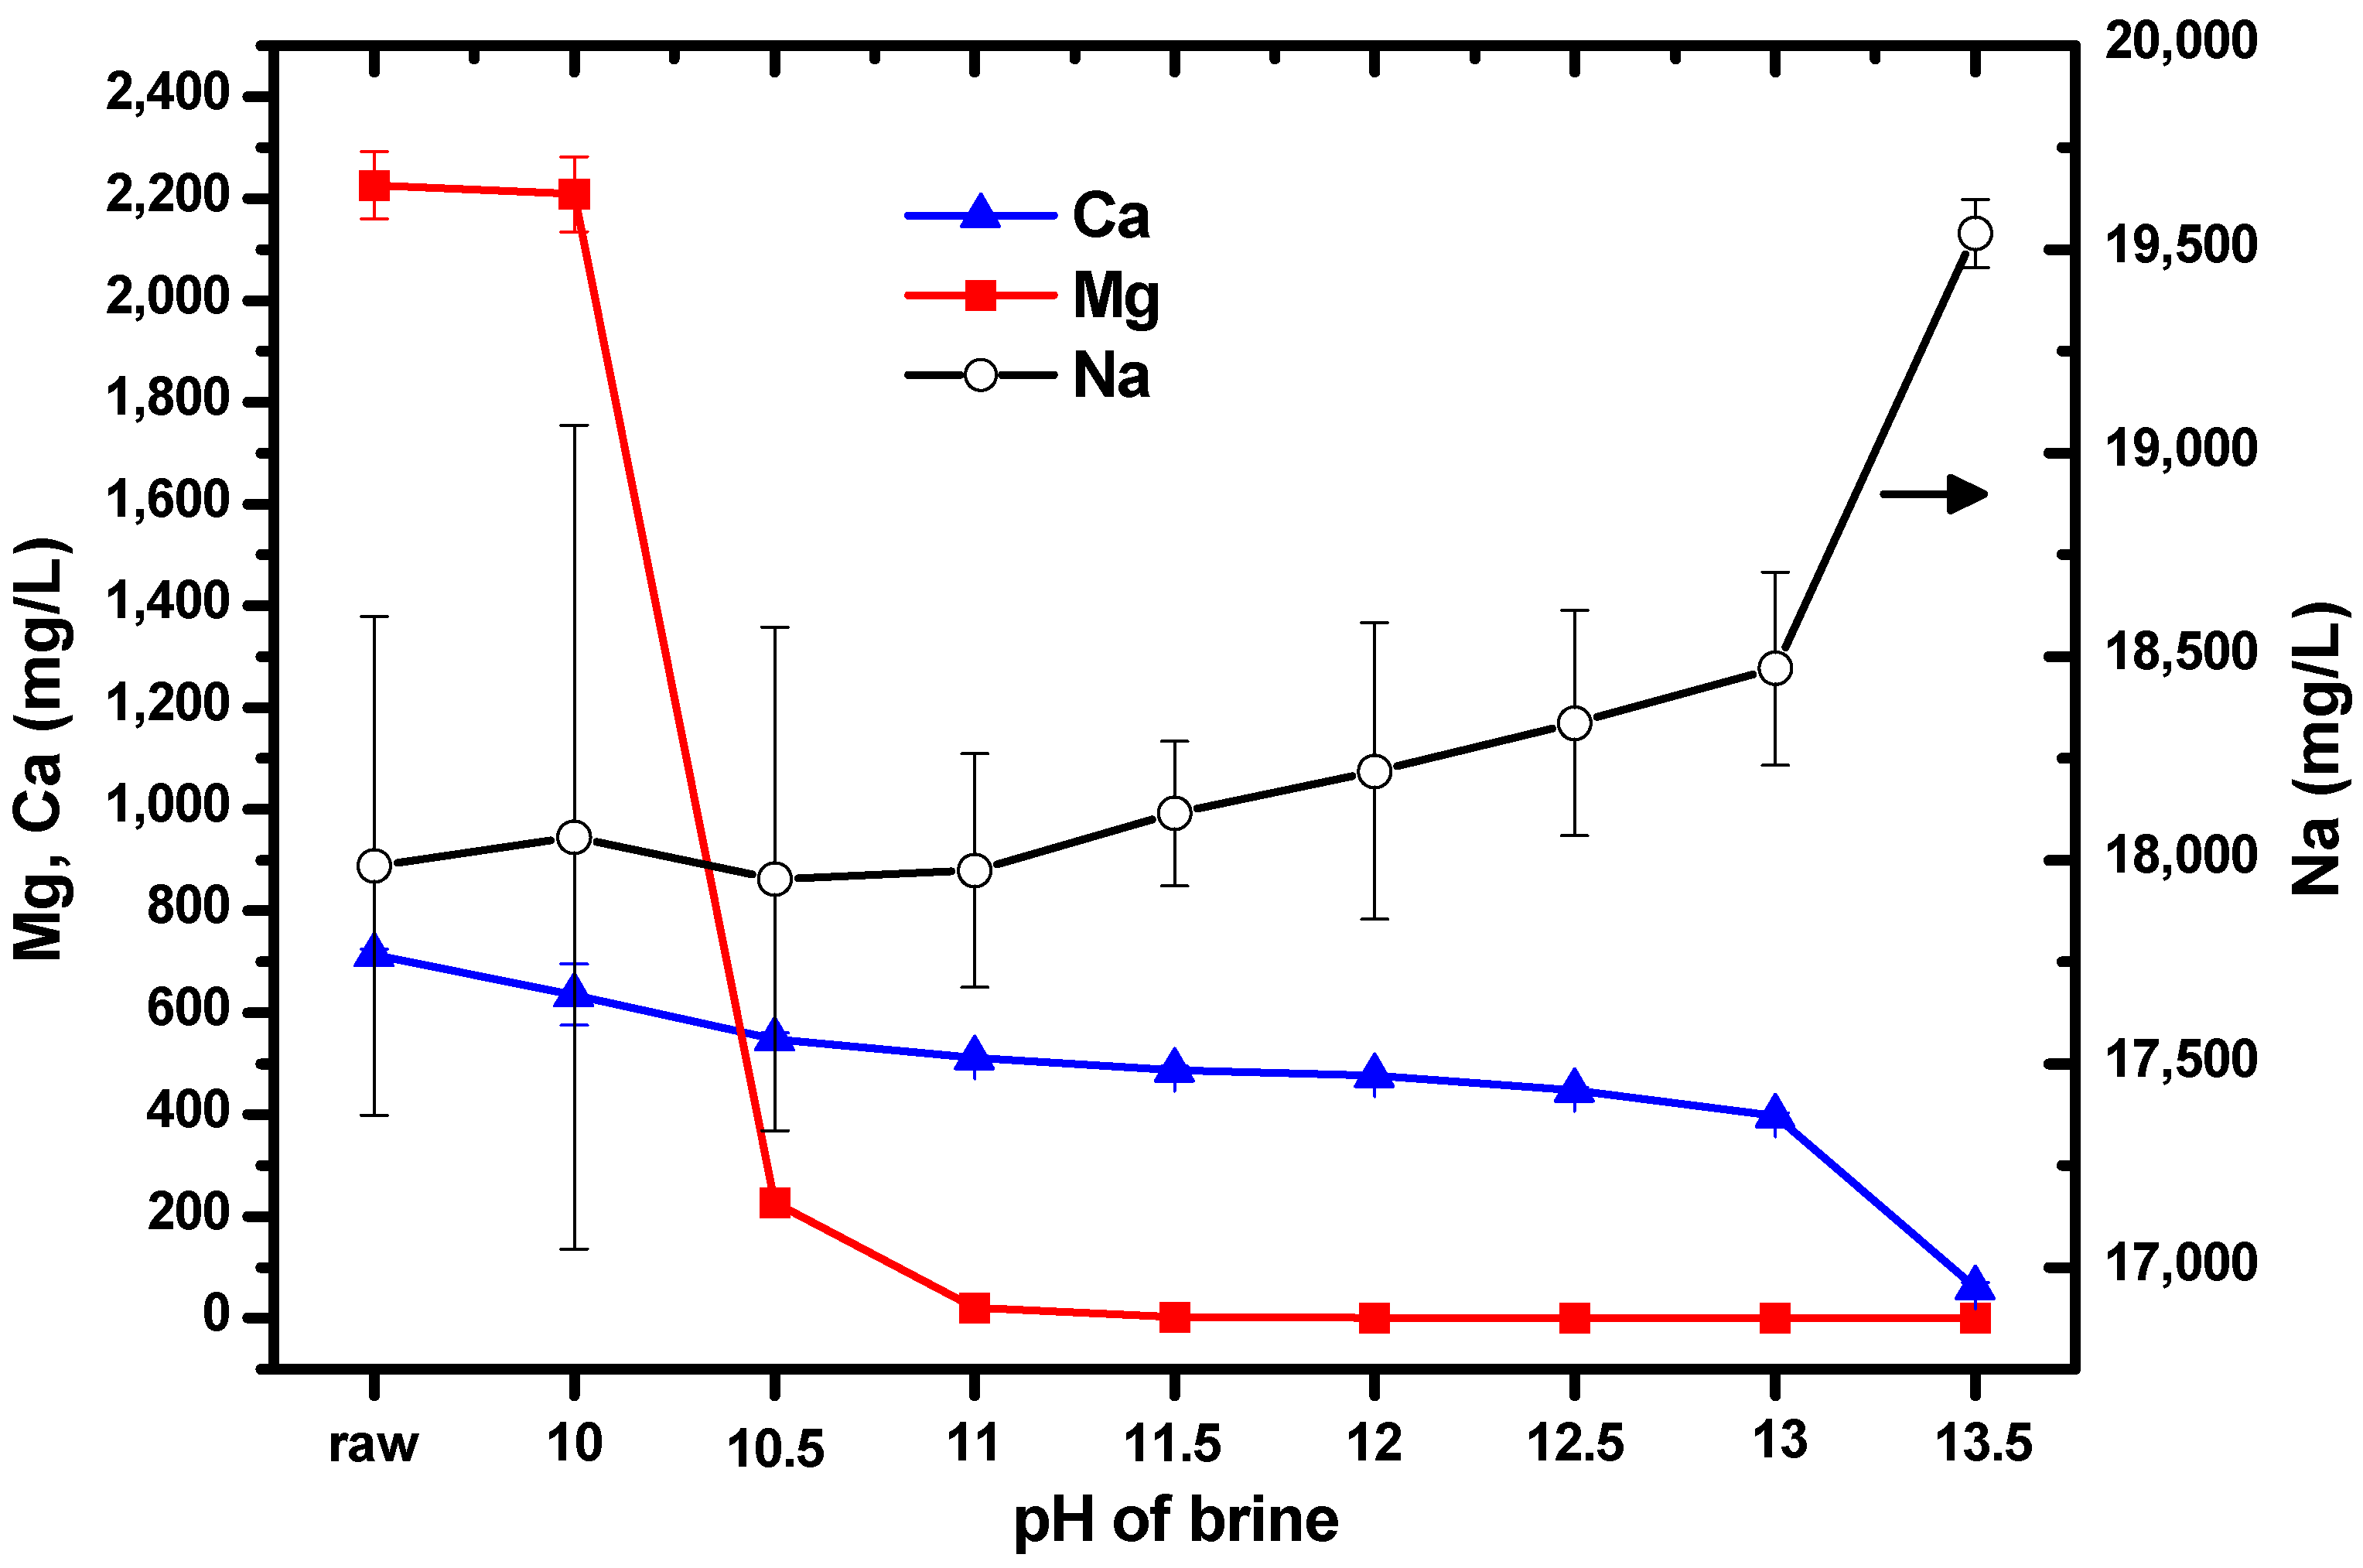
Figure 3.
Changes in the concentrations of Mg, Ca, and Na during the cycles shown in Figure 1.
Figure 3.
Changes in the concentrations of Mg, Ca, and Na during the cycles shown in Figure 1.

Figure 4.
XRD results of the particles collected from the first to fourth cycles.

Figure 5.
Elemental distributions of Mg, Ca, C, and O in particles produced during the experimental cycles.
Figure 5.
Elemental distributions of Mg, Ca, C, and O in particles produced during the experimental cycles.

Figure 6.
FTIR spectra of particles from the second, third, and fourth carbonation cycles.
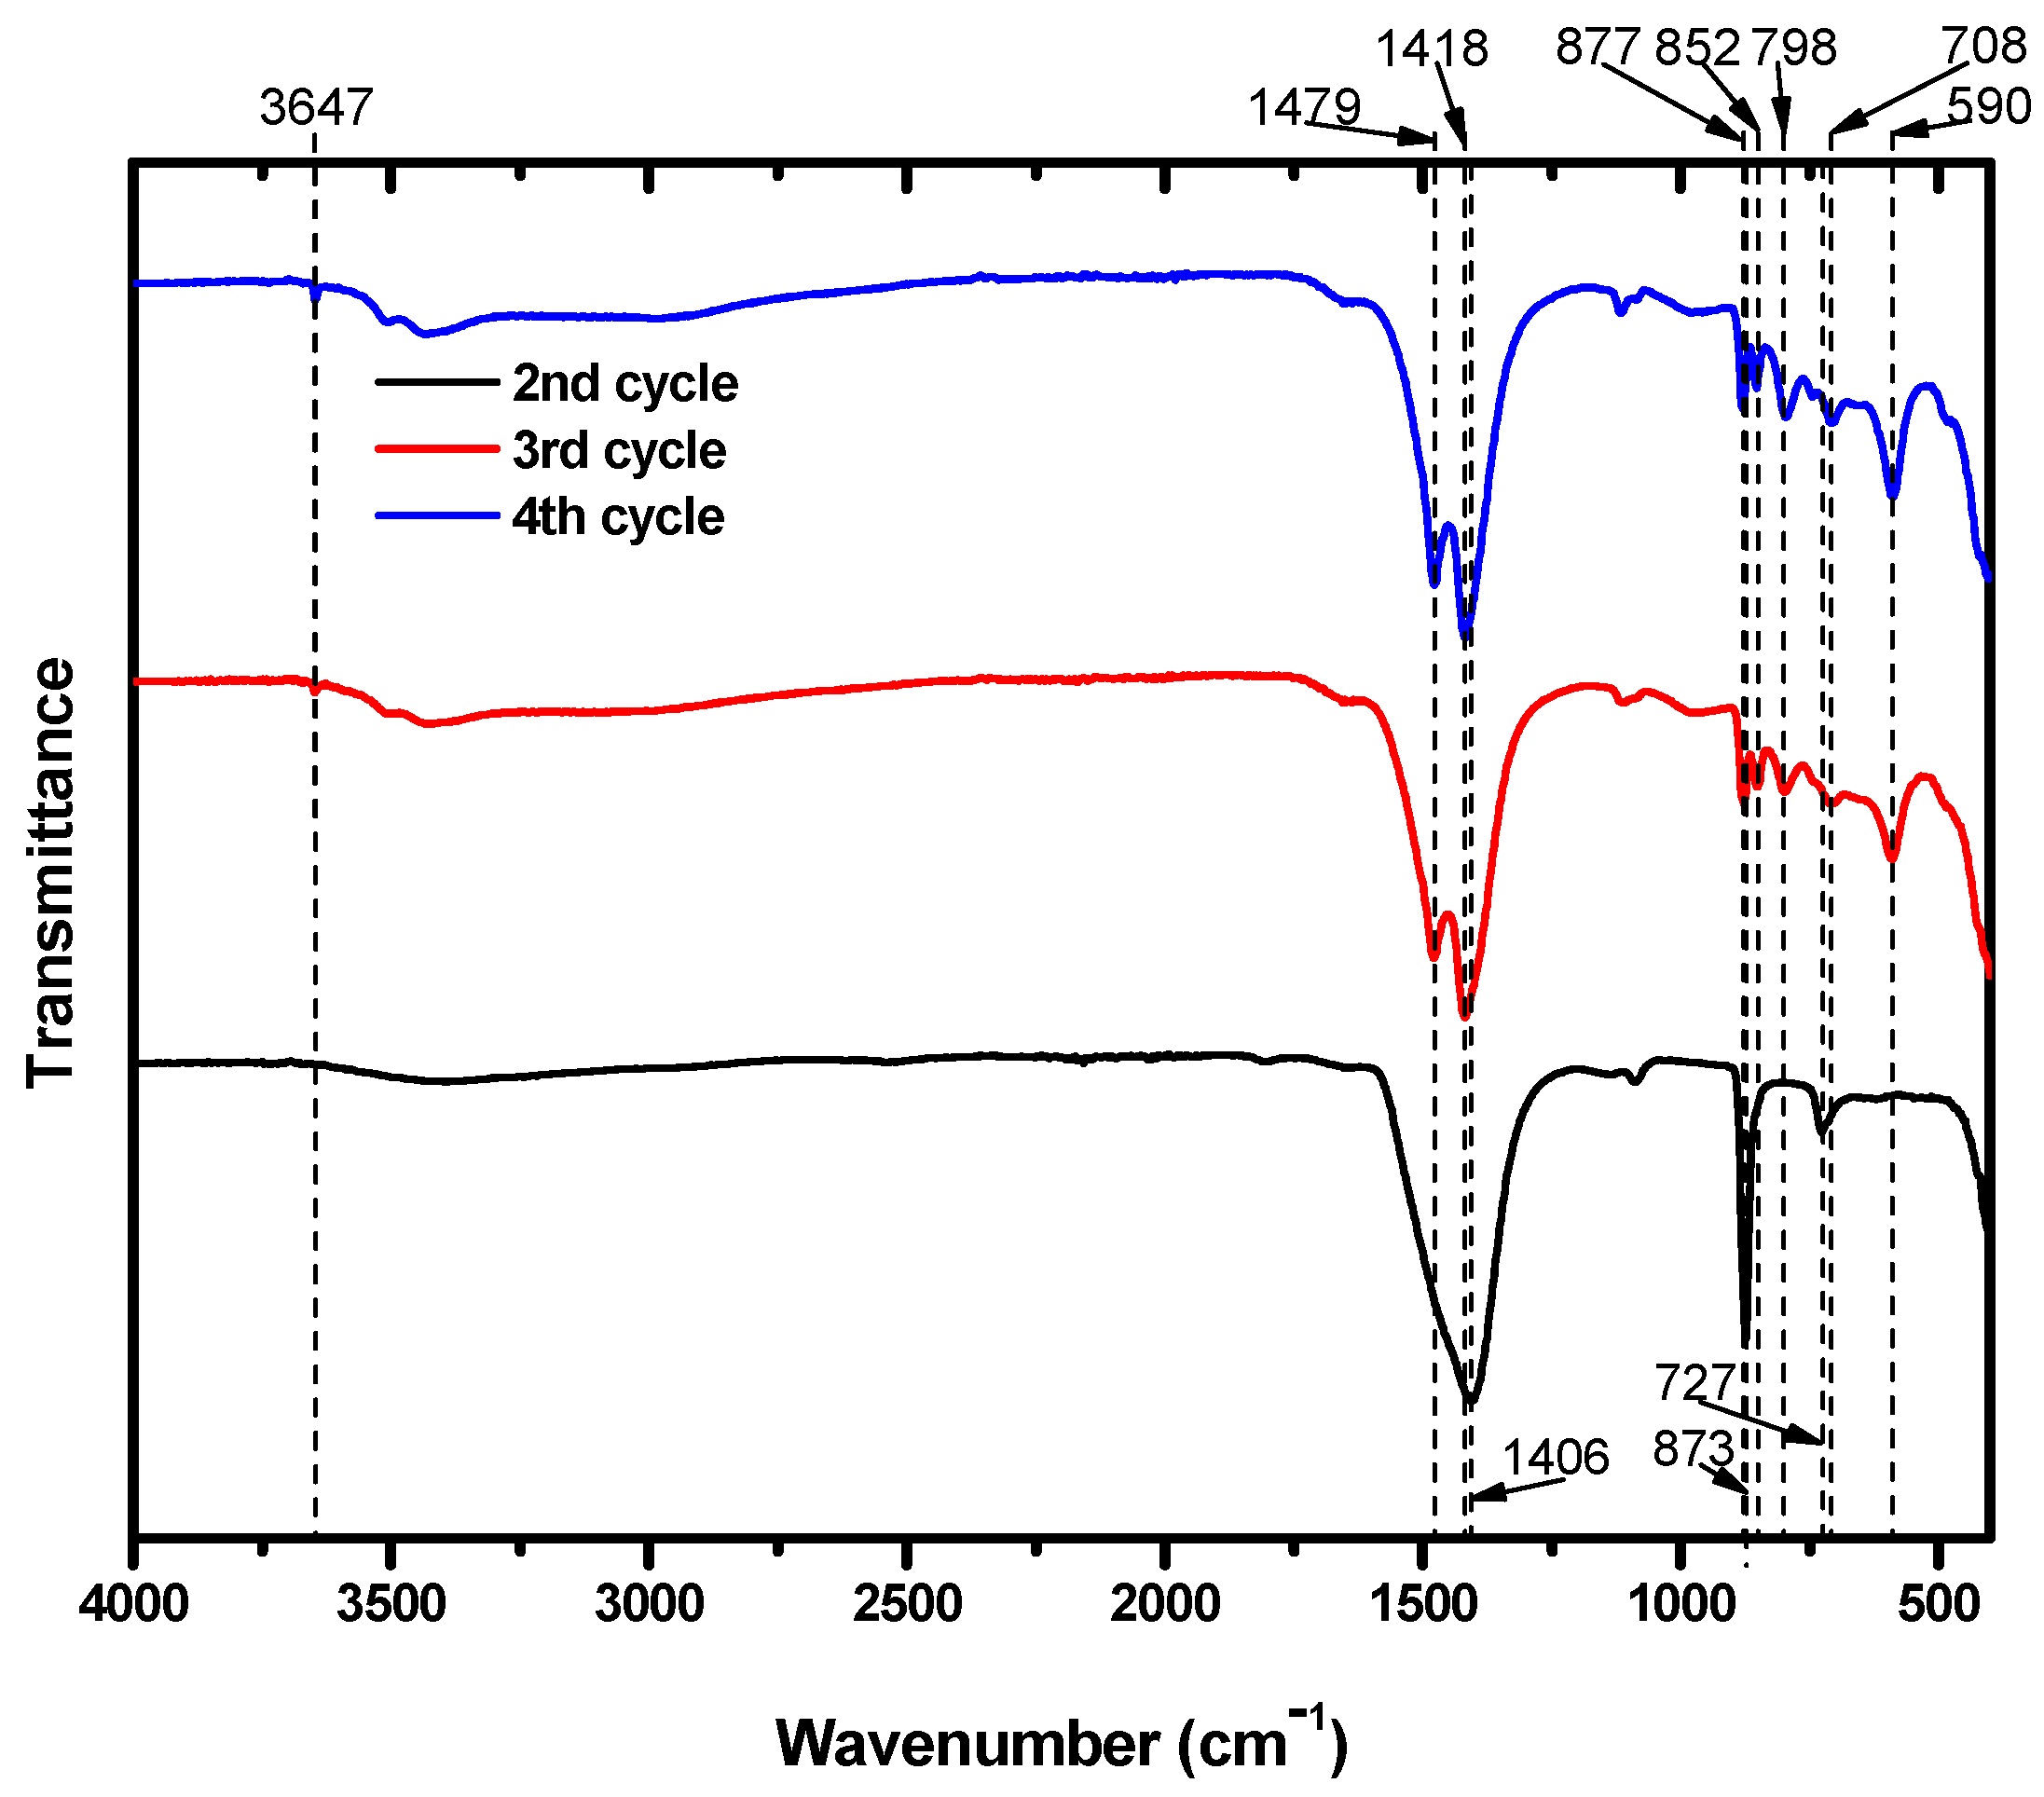
Figure 7.
Thermogravimetric analysis (TGA) curves of (a) the precipitates obtained from the second, third, and fourth cycles; and (b) the commercial reagents of Mg(OH)2, MgCO3, CaCO3, and NaCl.
Figure 7.
Thermogravimetric analysis (TGA) curves of (a) the precipitates obtained from the second, third, and fourth cycles; and (b) the commercial reagents of Mg(OH)2, MgCO3, CaCO3, and NaCl.

Table 1.
Concentrations of the major cations and anions in the brine.
| Ions | Mg | Ca | Na | K | Cl | SO4 |
|---|---|---|---|---|---|---|
| Concentration (mg/L) | 2226 | 714 | 17,987 | 858 | 32,220 | 4766 |
Table 2.
Forms of CO2 varied at pH changes and their reactions with divalent ions.
| pH | Forms of CO2 | Ion Reactions |
|---|---|---|
| Less than neutral (~<6.35) | CO2 + H2O → H2CO3 | H2CO3 + H2O + M2+ → H2CO3 + H2O + M2+ |
| Neutral to weak alkali | H2CO3 + OH− → HCO3− + H2O (pKa1 = 6.4) | 2HCO3− + 2H2O + 2M2+ → M(HCO3)2 ↓ + 2H2O + M2+ |
| Strong alkali (~10.33<) | HCO3− + OH− → CO32− + H2O (pKa2 = 10.2) | 2CO32− + 2H2O + 2M2+ → 2MCO3 ↓ + 2H2O |
M2+ represents divalent ions such as Mg2+ or Ca2+.
© 2017 by the authors. Licensee MDPI, Basel, Switzerland. This article is an open access article distributed under the terms and conditions of the Creative Commons Attribution (CC BY) license (http://creativecommons.org/licenses/by/4.0/).
Share and Cite
MDPI and ACS Style
Bang, J.-H.; Yoo, Y.; Lee, S.-W.; Song, K.; Chae, S. CO2 Mineralization Using Brine Discharged from a Seawater Desalination Plant. Minerals 2017, 7, 207. https://doi.org/10.3390/min7110207
AMA Style
Bang J-H, Yoo Y, Lee S-W, Song K, Chae S. CO2 Mineralization Using Brine Discharged from a Seawater Desalination Plant. Minerals. 2017; 7(11):207. https://doi.org/10.3390/min7110207
Chicago/Turabian StyleBang, Jun-Hwan, Yeongsuk Yoo, Seung-Woo Lee, Kyungsun Song, and Soochun Chae. 2017. "CO2 Mineralization Using Brine Discharged from a Seawater Desalination Plant" Minerals 7, no. 11: 207. https://doi.org/10.3390/min7110207
Note that from the first issue of 2016, this journal uses article numbers instead of page numbers. See further details here.