The Use of Univariate and Multivariate Analyses in the Geochemical Exploration, Ravanj Lead Mine, Delijan, Iran


1
Department of Earth Sciences, Shiraz University, Shiraz 71454, Iran
2
Department of Geology, Brandon University, Brandon, MB R7A 6A9, Canada
*
Author to whom correspondence should be addressed.
Minerals 2017, 7(11), 212; https://doi.org/10.3390/min7110212
Submission received: 31 August 2017
/
Revised: 21 October 2017
/
Accepted: 27 October 2017
/
Published: 3 November 2017
Abstract
:A geochemical exploration program was applied to recognize the anomalous geochemical haloes at the Ravanj lead mine, Delijan, Iran. Sampling of unweathered rocks were undertaken across rock exposures on a 10 × 10 meter grid (n = 302) as well as the accessible parts of underground mine A (n = 42). First, the threshold values of all elements were determined using the cut-off values used in the exploratory data analysis (EDA) method. Then, for further studies, elements with lognormal distributions (Pb, Zn, Ag, As, Cd, Co, Cu, Sb, S, Sr, Th, Ba, Bi, Fe, Ni and Mn) were selected. Robustness against outliers is achieved by application of central log ratio transformation to address the closure problems with compositional data prior to principle components analysis (PCA). Results of these analyses show that, in the Ravanj deposit, Pb mineralization is characterized by a Pb-Ba-Ag-Sb ± Zn ± Cd association. The supra-mineralization haloes are characterized by barite and tetrahedrite in a Ba-Th-Ag-Cu-Sb-As-Sr association and sub-mineralization haloes are comprised of pyrite and tetrahedrite, probably reflecting a Fe-Cu-As-Bi-Ni-Co-Mo-Mn association. Using univariate and multivariate geostatistical analyses (e.g., EDA and robust PCA), four anomalies were detected and mapped in Block A of the Ravanj deposit. Anomalies 1 and 2 are around the ancient orebodies. Anomaly 3 is located in a thin bedded limestone-shale intercalation unit that does not show significant mineralization. Drilling of the fourth anomaly suggested a low grade, non-economic Pb mineralization.
1. Introduction
Geochemical exploration targets anomalous elements; chemical properties of these elements control their primary geochemical dispersion, metal zoning and simultaneous precipitation [1,2]. Carbonate hosted Pb-Zn deposits are attractive exploration targets. These deposits are typically hosted in dolostone and limestone in platform sequences [3]. The dispersion haloes of metals around these deposits are generally small (less than 50–75 m [4,5]), reflecting high acid-buffering reactions of limestone. However, locally, Zn-bearing hydrothermal dolomite in some deposits extend to several kilometers (e.g., Upper Silesia district) [3]. A small number of investigations have focused on the analysis of primary geochemical haloes as an exploration tool for detecting blind Pb-Zn orebodies hosted by carbonate rocks [5,6,7,8,9,10].
For decades, six known orebodies of the Ravanj deposit, A, Bn, Bs, Bw, Cn, and Cs, have provided ore for the Ravanj lead smelter. Several exploration programs have been undertaken in different parts of the Ravanj deposit. Despite detecting some geo-electrical anomalies, geo-electrical exploration (IP method) did not produce positive results [11]. Therefore, geochemical exploration was applied to find blind orebodies in the Ravanj area. In this paper, geochemical haloes and their relation to a possible hidden Pb-mineralization in Block A of the Ravanj lead mine are discussed in details. Combined single- and multi-element geochemical data with geological and structural controls of mineralization provide a basis to explore for new orebodies.
2. The Ravanj Pb Deposit
2.1. Geology
The Ravanj deposit is part of the Ravanj anticline located in the Urumieh-Dokhtar magmatic arc (UDMA), Western Iran (Figure 1). The Jurassic shale and sandstone occur in the core of this anticline [12]. The lower Cretaceous sequences start with a 50 m thick unit including conglomerate, sandstone and dolomite that unconformably overlay Jurassic shales; this unit is covered by a 250 m thick shale-limestone unit. The lower Cretaceous sequence is followed by 130 m thick rudist-bearing massive limestone, which is covered by further shale-limestone intercalations [13]. The lower Cretaceous sequence of the Ravanj anticline is similar to that in the Pb-Zn deposits of the Sanandaj-Sirjan zone. In the Ravanj region, middle and upper Cretaceous strata are not present. The main ore zone (3–5 m thick) of the Ravanj deposit is hosted by thick to massive rudist-bearing limestone of lower Cretaceous. After deposition of the upper shale, sedimentation continued by formation of the Eocene conglomerate. The Eocene series include basal conglomerate, shale strata, green tuffs, and sandstone. The red beds of the Lower Red Formation and marl-limestone of the Qom Formation are equivalent to the Oligo-Miocene strata of the Ravanj anticline. The Lower Miocene granodiorite stocks and quartz porphyry dykes crosscut Jurassic to lower Miocene sequences [12]. Post Cretaceous sequences of the Ravanj anticline do not show any evidence of Pb mineralization.
2.2. Mineralization and Ore Zoning
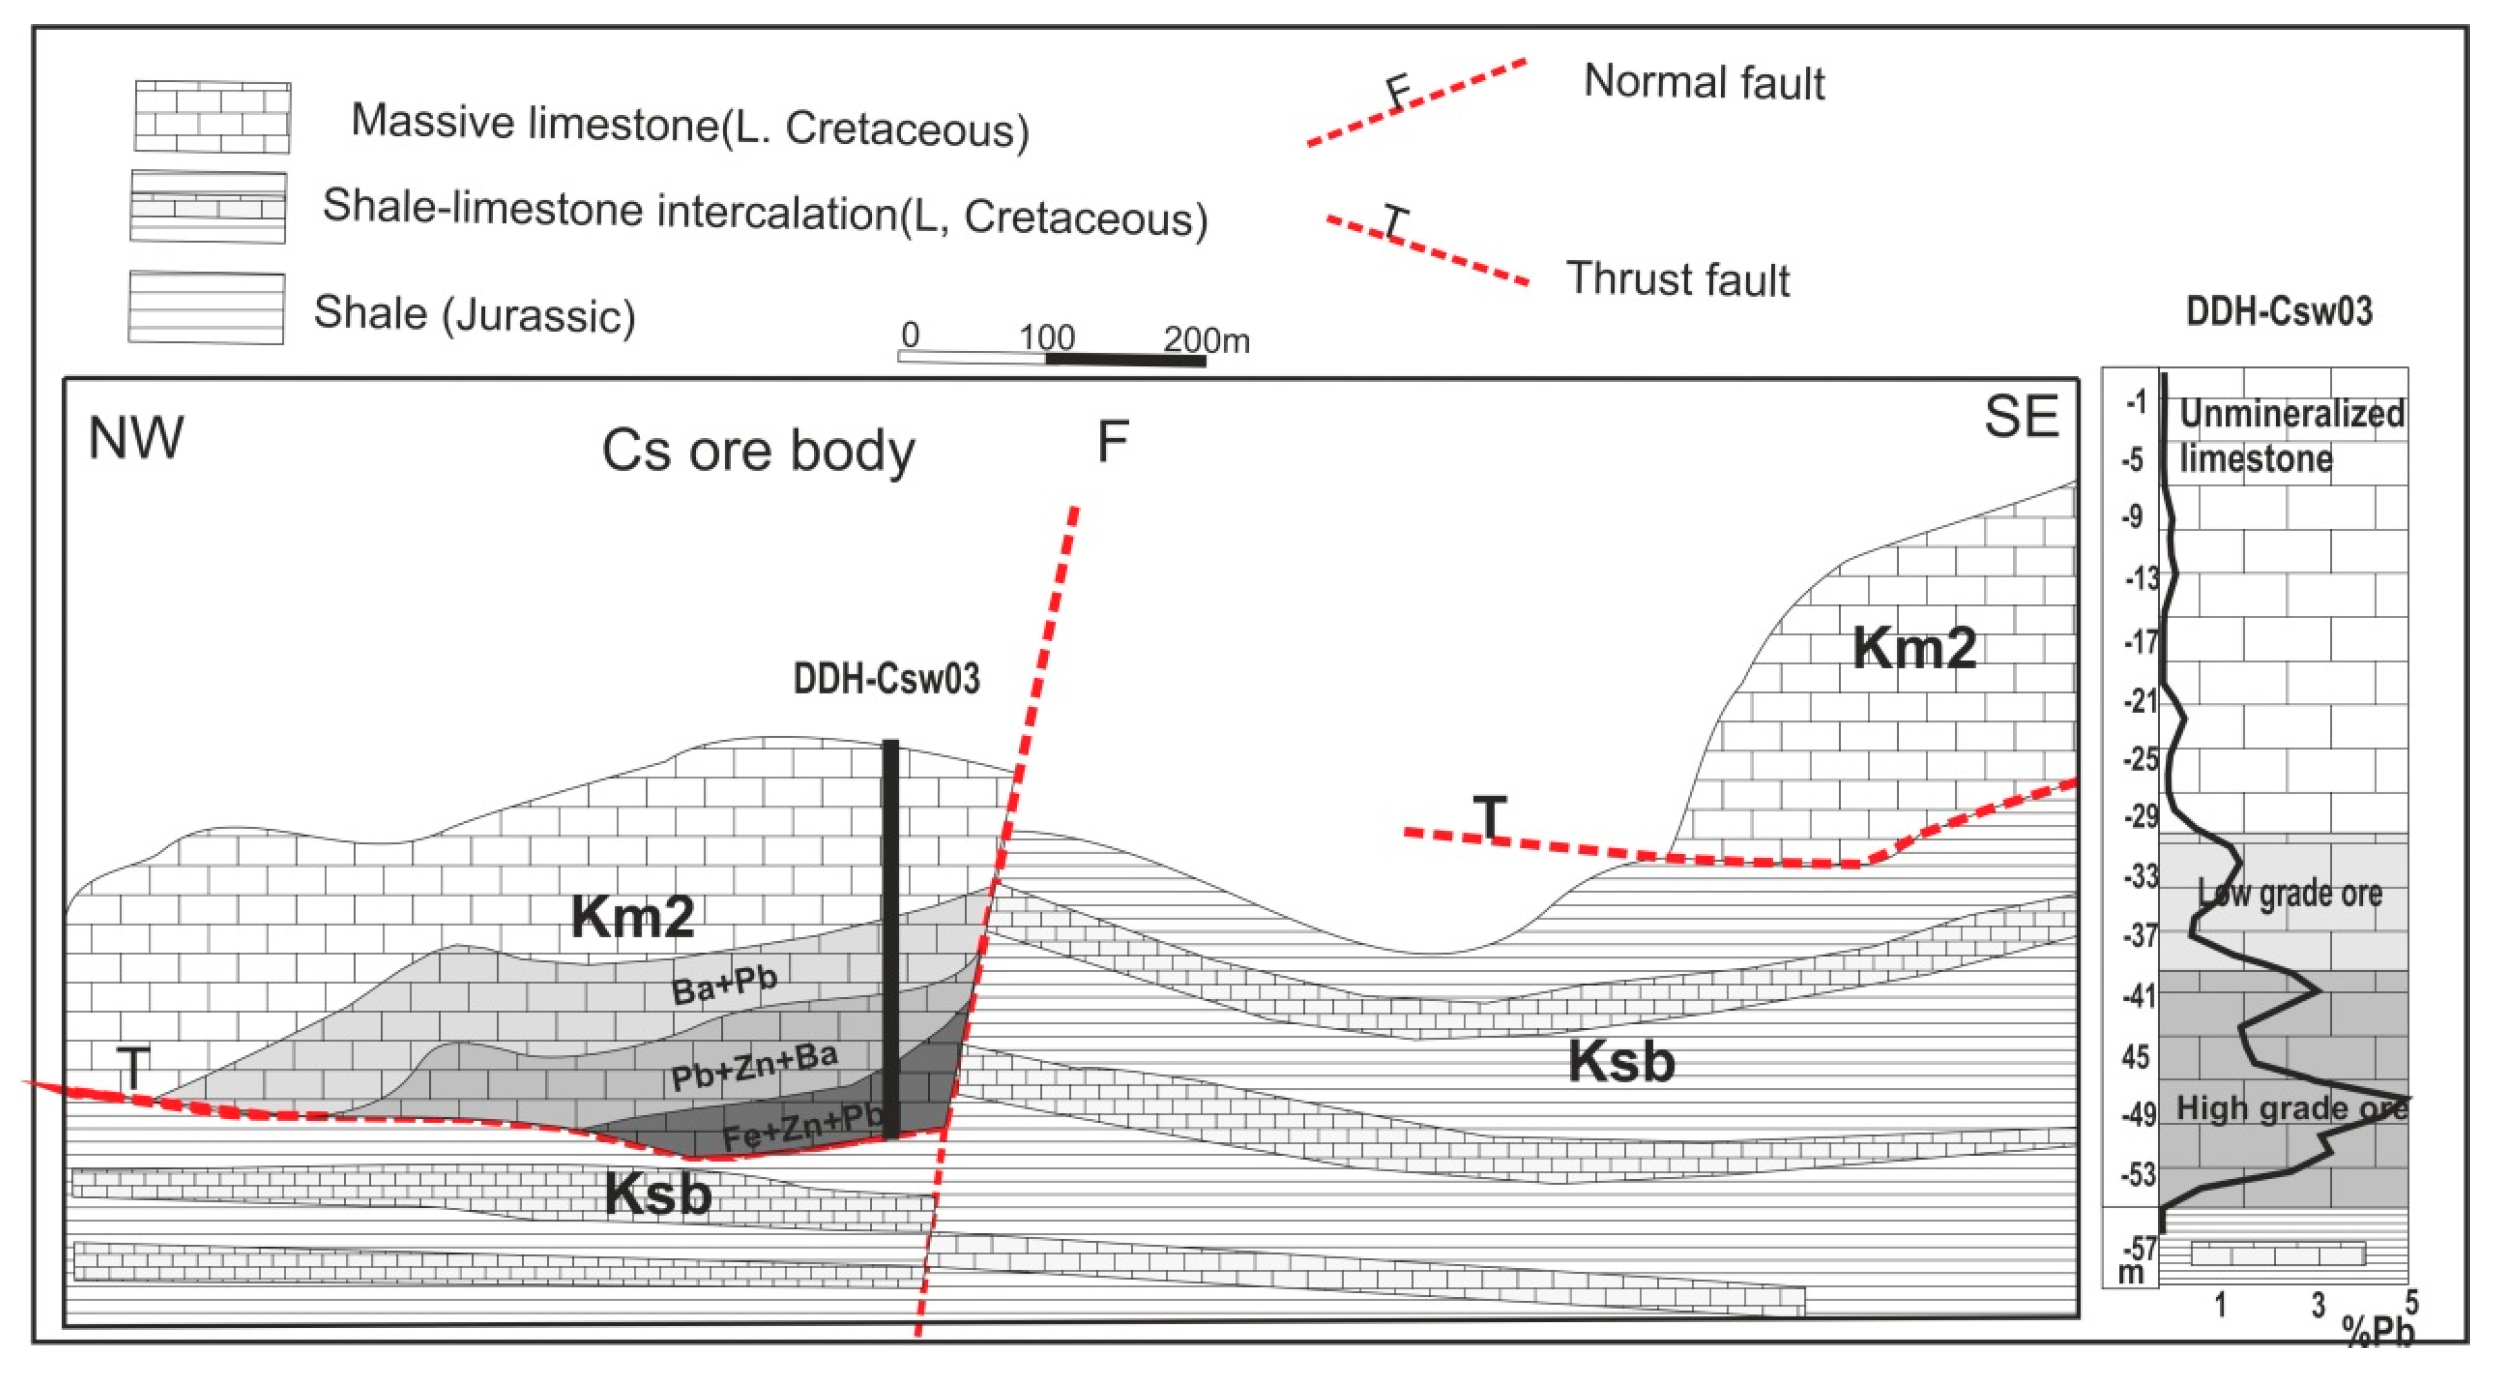
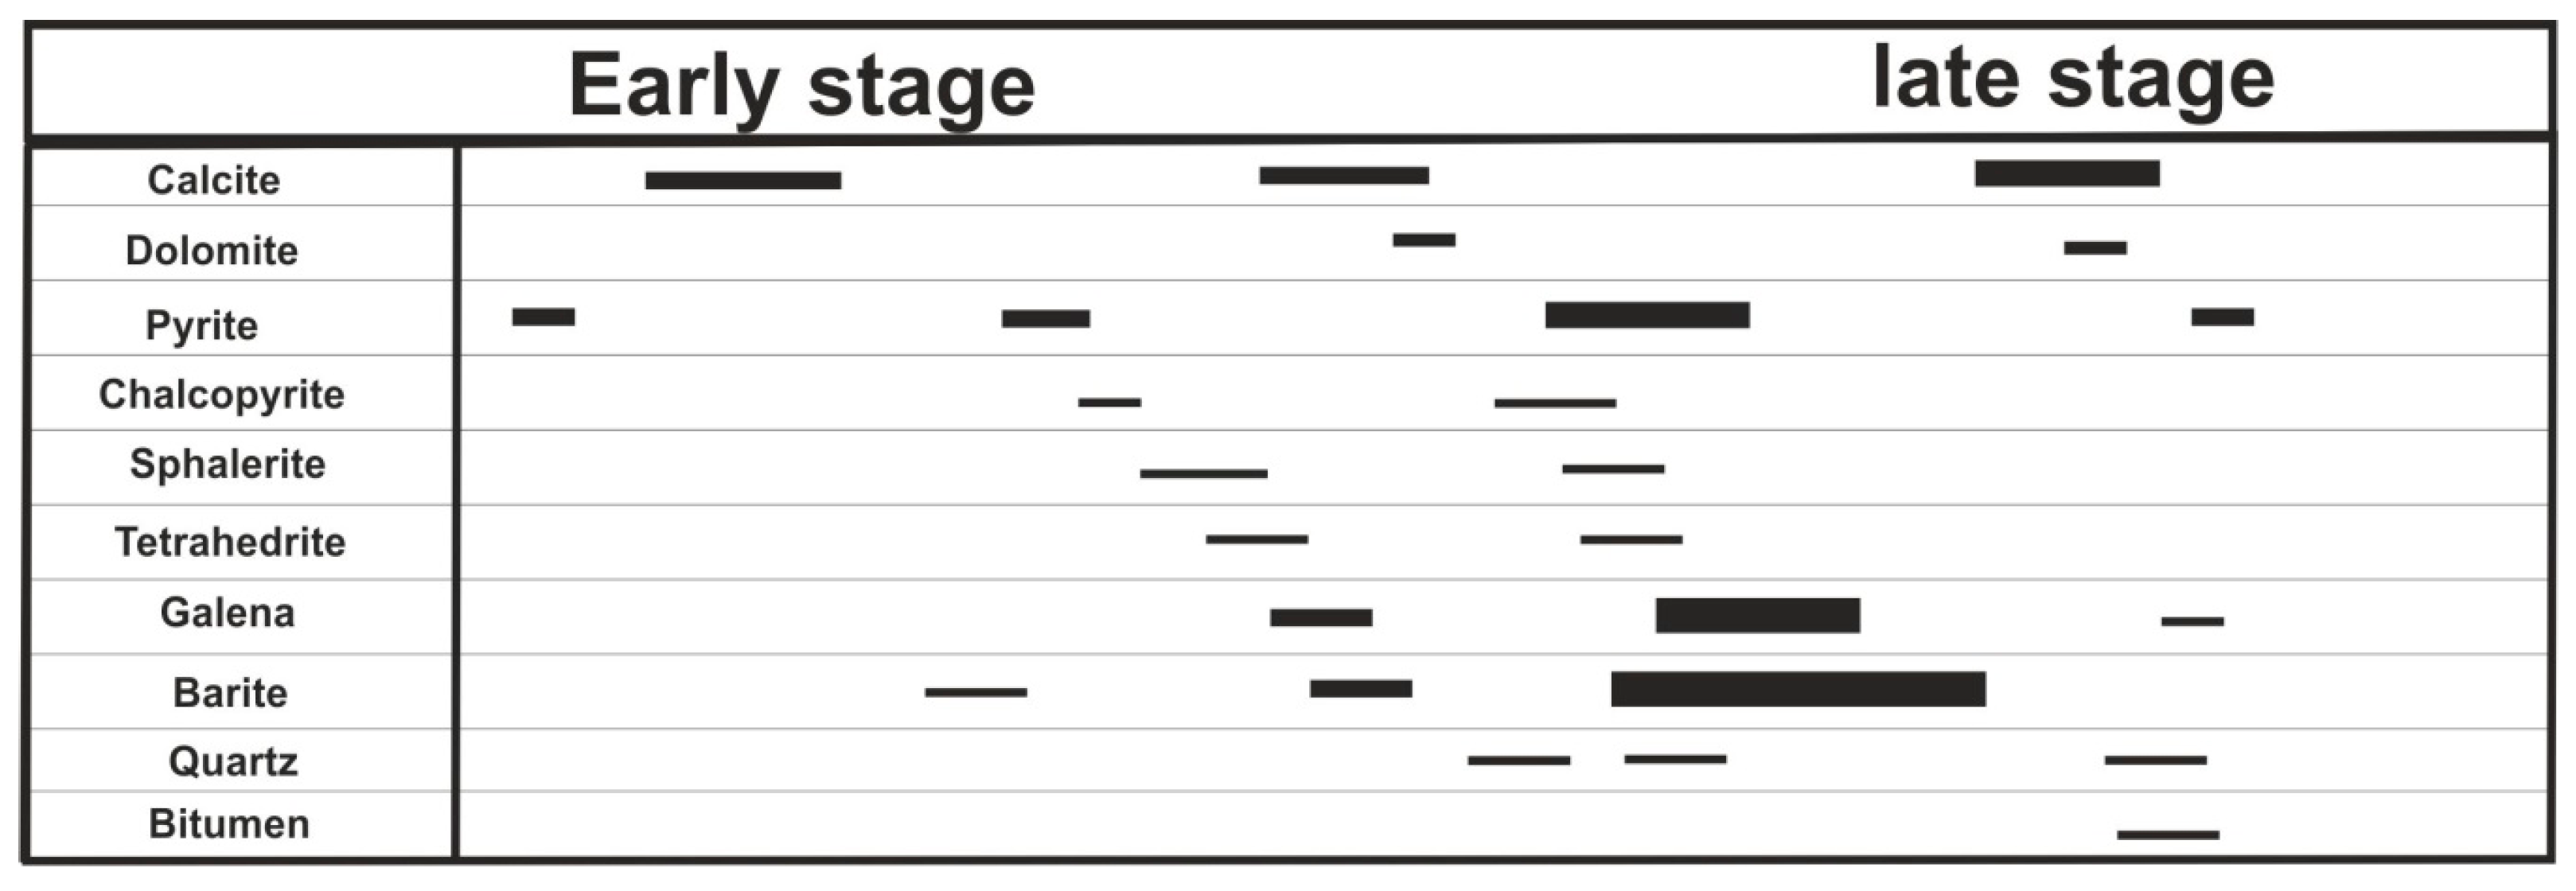
The Ravanj ore deposit is a series of concordant to semi-concordant ore bodies in the lower part of the massive limestone (Figure 1). Minor uneconomic mineralization occurs locally in other units of the lower Cretaceous sequence. Mineralization in the Ravanj deposit consists of galena and barite with some pyrite, sphalerite and tetrahedrite. In individual mining block, the relation between mineralization and faults is not clear. The massive limestone thrusts over the shale and limestone layers possibly due to the Alpine orogeny [14,15]. As a result, the lower part of the massive limestone is strongly brecciated. The orebodies occur at the thrust contact between the massive limestone and shale. Breccia filling and replacement textures shown mainly by fine-grained galena and barite are the main textural features of the Ravanj deposit (Figure 2). Ore mineralization in most orebodies, such as BW and Cs, has a relatively sharp contact with country rocks in northwest, but it continues as branches to the southeast. It appears that the mineralization was controlled by NE-SW trending faults. These normal faults dip ~60° to the SE and crosscut the host rock and thrust faults [16]. In all orebodies, a distinct zoning between barite and galena was identified. Barite generally increases towards top of the orebodies in the massive limestone, whereas Pb decreases. In the Cs orebody, sphalerite and pyrite are also common; in NW of Cs orebody, Zn/(Zn + Pb) is more than 0.3, with abundant pyrite. The sphalerite content gradually decreases toward outside and southeast of the orebody where Zn/(Zn + Pb) drops to less than 0.05 (Figure 3). Cross cutting relationships and microscopic evidence show that galena formed after sphalerite and pyrite (Figure 2 and Figure 4). This suggests that the mineral zoning is likely due to evolving hydrothermal fluid, which migrated through the NE-SW trending normal faults into the thrust zone.
2.3. Ore Genesis
The δ34S values of the Ravanj sulfide minerals vary from −27‰ to −11‰ suggesting a bacteriogenic sulfate reduction [16]. The δ34S value of barite is around +20‰ which is within the range of Tertiary marine sulfates [17,18]. The average homogenization temperature of fluid inclusions in calcite is 165 °C (ranges from 120 to 220 °C) and salinities average is 8.4 wt % NaCl equivalents (ranges from 0.66 to 18 wt % NaCl equivalent)(Table 1). This data support mixing of two different fluids as precipitation mechanism of galena and barite. The Ravanj deposit is comparable with Pb-rich Mississippi Valley-type deposits [3,14,15].
3. Geochemical Analysis
3.1. Sampling and Analytical Method
Medium-density sampling (32 samples per hectare) yielded 302 unweathered surface samples from the host limestone in Block A. In addition, 42 samples were collected from the mineralized tunnel sections from 2353 m and 2391 m levels of the orebody A. Due to the small size of orebodies, the sampling network was selected as a 10 × 10 meter grid along cross-sections spaced 50 m apart and perpendicular to the geological outcrops (NW-SE trend). Field observations (e.g., vein type and rock fabric) and sample descriptions (rock type, color, texture, dolomitization, calcitization, and weathering) were recorded for each sample. Visual characteristics such as presence of sulfide minerals, iron-oxides, and secondary Cu-minerals were used to collect rock samples which included unaltered limestone as well as mineralized altered limestone and excluded weathered samples. Samples were crushed, pulverized and analyzed at LabWest, Perth, Western Australia for 42 elements using inductively couple plasma mass spectrometry (ICP-MS) after four-acid digestion (hydrofluoric, nitric, perchloric and hydrochloric acids). The detection limit for major and trace elements was 100 ppm and 1–0.1 ppm, respectively. The precision and accuracy of the analyses using blank and standards range from 0.2% to 6% at the 95% confidence level. To overcome the problem associated with censored data, less or greater than minimum and maximum values were treated using the method described by Horn et al. [19].
3.2. Anomaly Recognition Methods
Selecting a suitable method to discriminate background and anomaly values is the first and most important step in mineral exploration [6]. Because of large data sets in geochemical exploration projects, it is crucial to identify geochemical background and potential analytical and sampling errors [20,21,22]. Several procedures can be used to identify data outliers. The calculation of mean and standard deviation [23], cumulative distribution functions (CDF) [24,25] and Exploratory Data Analysis (EDA) methods [6,26,27,28,29,30,31] are the most recognized statistical methods.
EDA was used to estimate the range of background values and anomaly thresholds in this research. This method uses inter-quartile data and is a more robust statistical method compared to non-robust methods such as mean and standard deviation [32]. In this method, the value is constant even if 50% of the data are outliers. In other words, the inverse limit is 50% for the median and 0% for the mean [6,33,34]. Robust methods are appropriate for areas like the Ravanj deposit where distribution of ore minerals cause anomalous zones [30]. When enrichment values are used in exploration programs, proper estimation of the inner and outer fences is critical [33]. In this method, outliers are those which lie beyond the outer and inner fences, upper (u) and lower (l) outliers, respectively. These fences are estimated using the following equations [6,26,27,28,29,30]:
Inner fences: fl = Ql − (k × IQR); fu = Q3 + (k × IQR), with k = 1.5
Outer fences: Fl = Ql − (k × IQR); Fu = Q3 + (k × IQR), with k = 3
In these equations, Q1 and Q3 are the first and third quartiles or 25th and 75th percentiles of the data, respectively. The IQR (interquartile ranges) is obtained as the difference between Q1 and Q3. The data between the inner and outer fences are mild outliers, while the data beyond the outer fences are far outliers (anomaly).
3.3. Results from Principal Component Analysis
Univariate statistical analyses are used for a single element to extract information from one data set of values. However, most geochemical data sets have more than one variable determined for each sample and geochemical anomalies are commonly expressed in more than one element [21,35,36] as processes that generate the anomalies commonly form an association of elements [37]. Therefore, interpretation can be more complicated for multi-elemental interrelations; in such cases, multivariate analyses including Principle Component Analysis (PCA) [2] are applied.
The PCA method is one of the most common multivariate methods employed to unravel the multi-element associations [38,39]. The main purpose of PCA is data reduction to determine new efficient synthetic variables. The PCA method uses the correlations or covariances of the data to analyze the relations between variables. Using multivariate statistical methods for raw compositional data can lead to misleading results. Geochemical data are typically part of a total composition (e.g., ppm, weight percent) and are subject to the problems of closure in multivariate statistical analysis of compositional datasets [40,41]. The raw data make no statistical sense with compositional data sets [2,42]. Therefore, to alleviate the skewness of the data and the problem of data composition, transformation from log ratio methods is necessary before PCA can be done [40].
The PCA has been done on the anomalous elements of surface and tunnel samples of the Ravanj deposit. In this study, robustness against outliers is achieved by application of central log ratio transformation prior to PCA [2,43]. Orthogonal rotation using Varimax rotation often facilitates PCA [8,44]. Only Principal Components (PCs) with eigenvalues higher than 1 were used for interpretation [45]. This meaning PCs that explain more than one variable are considered important. The broken-stick method was used to determine significant PC loadings [45].
Finally, PCA was combined with mineral paragenesis to investigate the multi-element interrelations in the data [44]. Statistical analyses were undertaken using SPSS 19.0 software and in the R-statistical environment.
3.4. GIS Application
Raster distribution maps of the PCs were created using moving average interpolation techniques, e.g., the inverse distance weighting (IDW) interpolation in Arc GIS software [2,46,47]. Raster maps show high content values of PCA obtained from different elements and, therefore, the optimal anomaly locations for drilling [48,49,50,51].
4. Discussion
4.1. Anomalous Elements
In the Ravanj deposit, distribution of major elements is normal. However, in the mineralized areas, trace elements show non-normal distributions, which can be used for geochemical exploration of hidden Pb orebodies. The statistical parameters (Table 2) suggest that Co, Mo, Bi, Sb, As, Ag, Pb, Zn, Cd, Cu, Ni, Ba, Sr and Th have multiple population and non-normal distributions, which is supported by strong skewness of the data (Table 2 and Figure 5). To alleviate this skewness in the data and to overcome the problem of closure, a central log ratio transformation is used [2].
Analysis of the systematic samples of boreholes in the Cs orebody shows that, outside of the orebody, Pb levels fall rapidly to local background values (Figure 3). The high local background of Pb is due to disseminated galena grains in the calcareous host of the Ravanj deposit. The median value of Pb in host limestone of Block A is 319 ppm and the threshold value is 690 ppm, which are respectively 40 and 86 times higher than that in normal limestone in the world (8 ppm). Similarly, disseminated mineralization of sphalerite has been reported in deposits of the Ozark region [52]. A local threshold was estimated for each element by using the unmineralized carbonate rocks of the study area. Surface samples are depleted in Bi, Fe, Mn, Mo and Cu and enriched in Pb, Zn, Cd, Ag, As, Ba, Ni, Th, Sr, Sb and S (Table 2) due to interaction of hydrothermal fluids with carbonate host rock. Mineralized tunnel samples are enriched in all elements (Table 3).
4.2. Trace Element Association
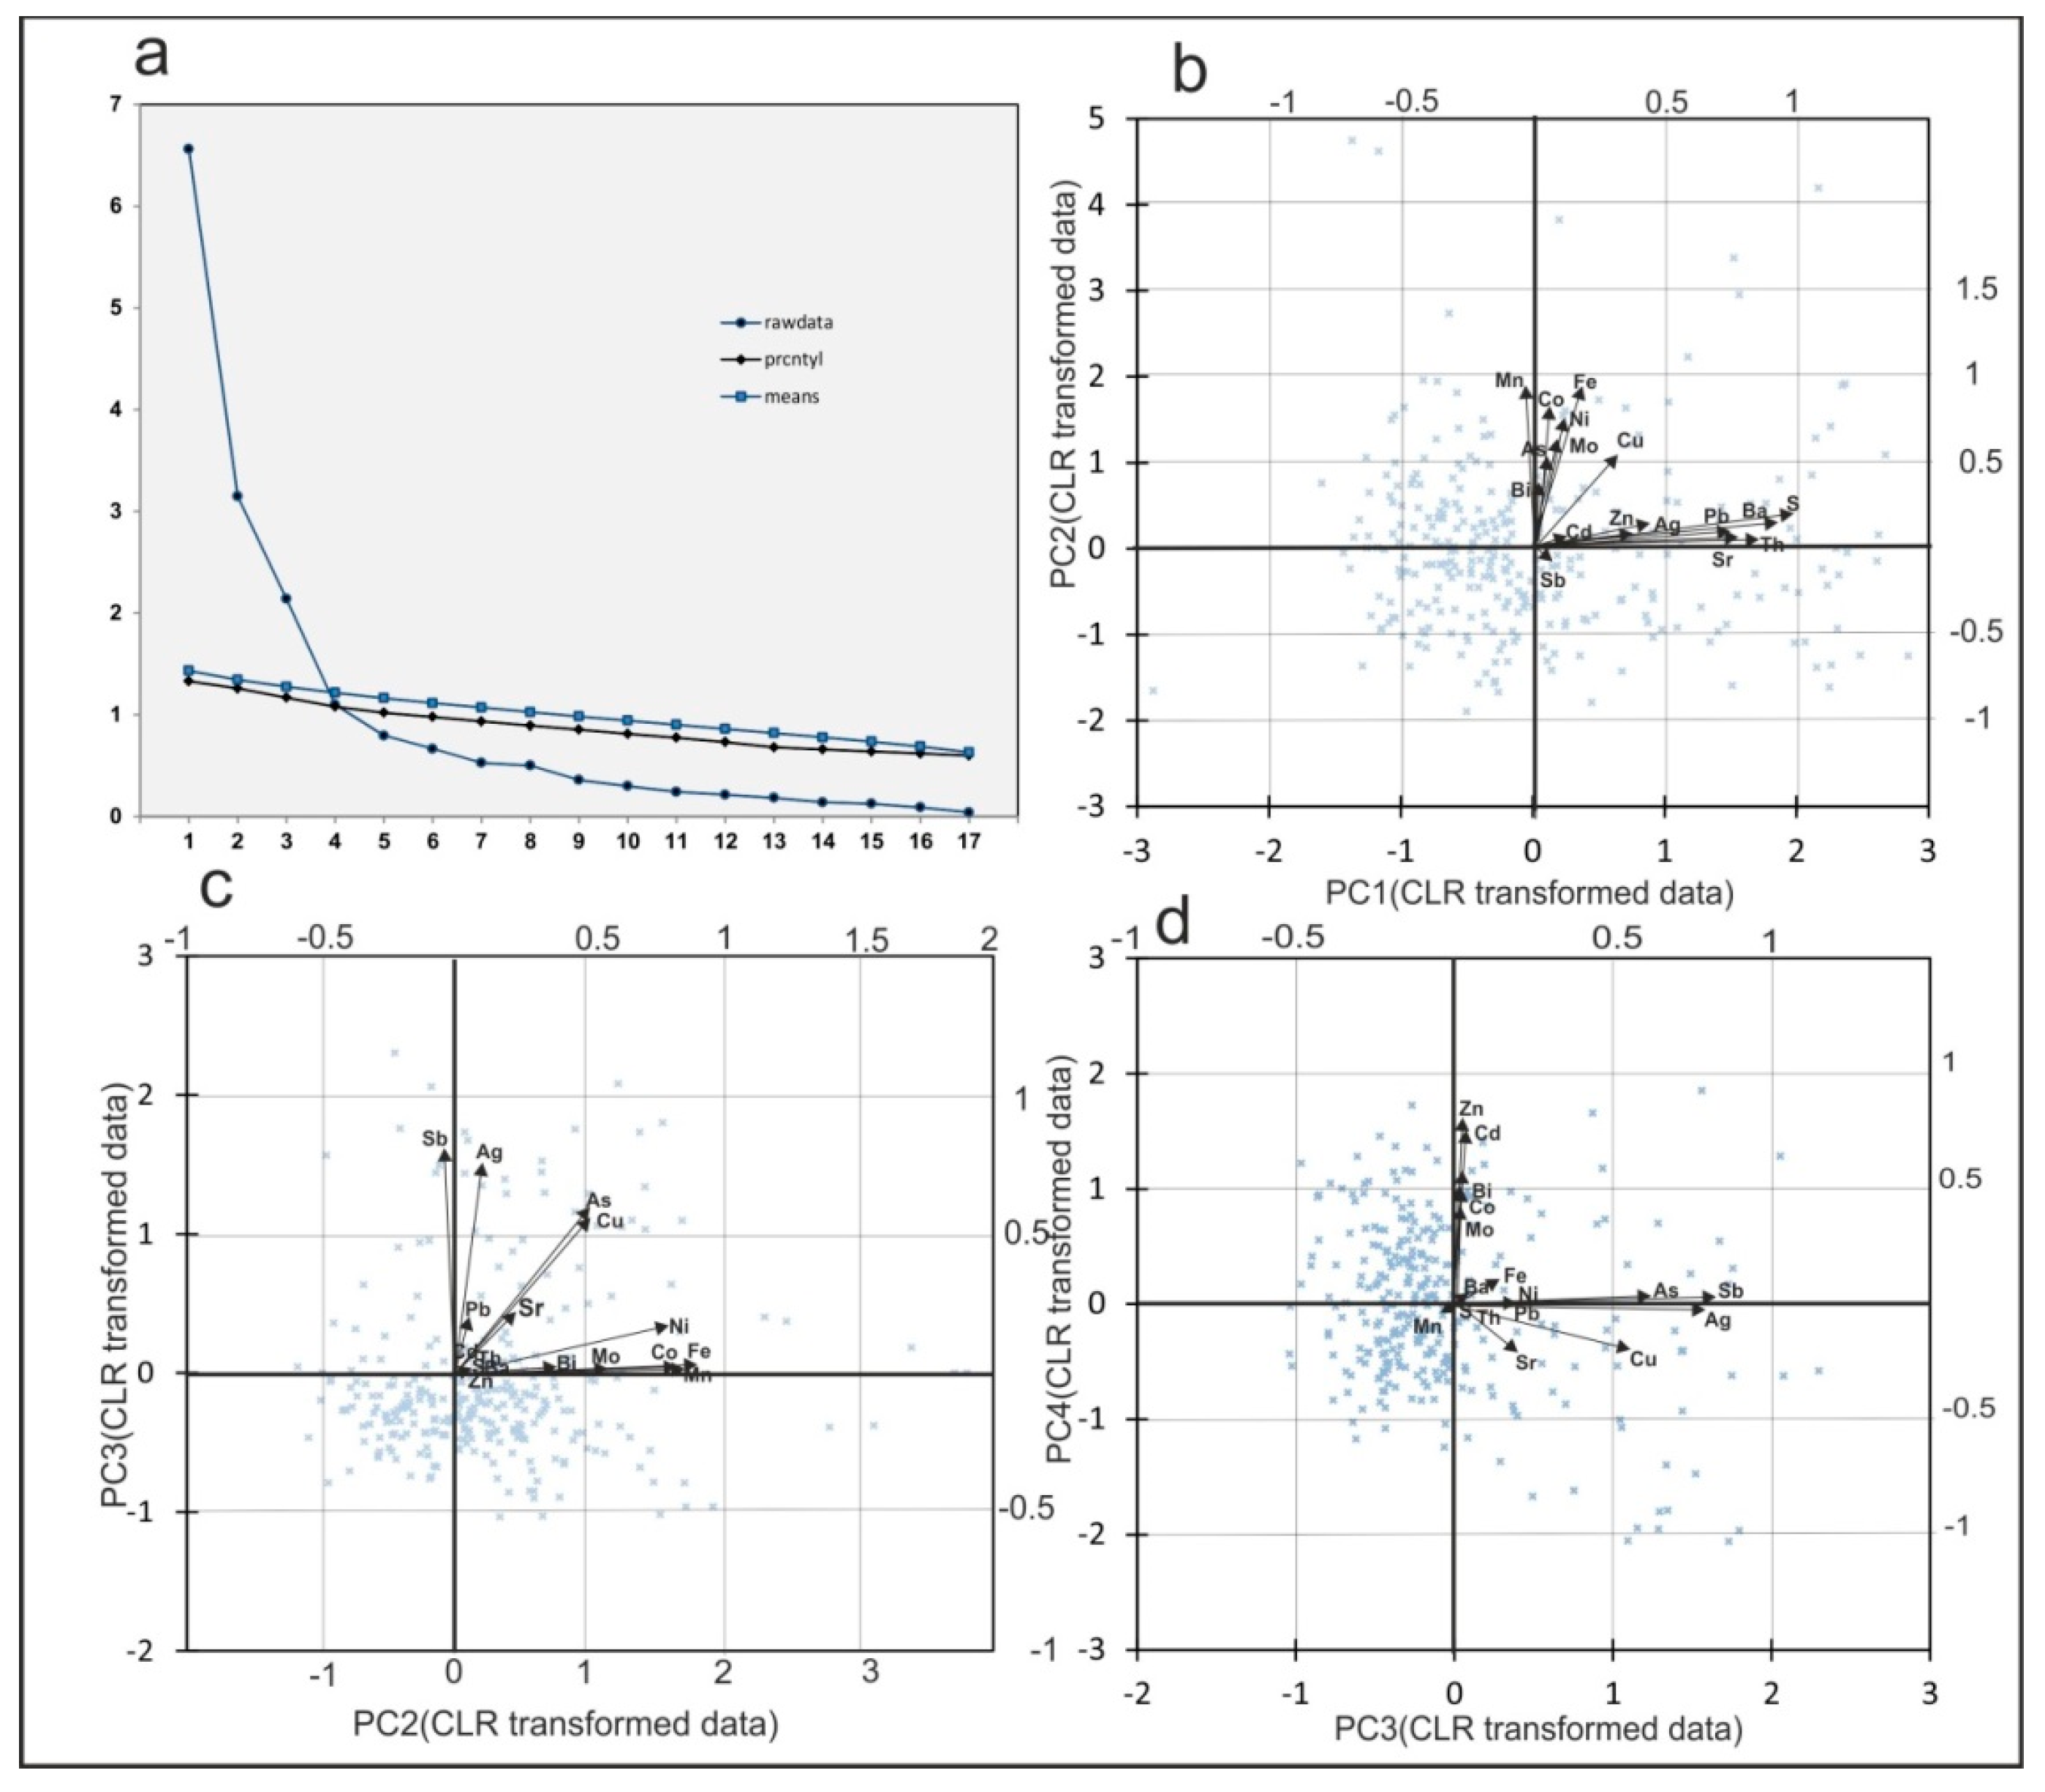
The scree plot of the PCs (Figure 6a) shows that anomalous surface samples are characterized by four significant components (PCA calculation of all elements are given in Supplementary Materials, Table S1 and Figure S1). These components explain 75% of the variability of the data (Table 4). PC1 explains 38.6% of multivariate data variability and represents Ba-Th-Sr-S-Pb(-Ag) association, which probably reflects barite mineralization around the main orebodies and disseminated galena. PC2 explains 18.5% of the multivariate data variability and represents Fe-Mn-Co-Ni-As-Cu-Mo(-Bi) association. PC3 explains 12.6% of multivariate data variability and represents Ag-Sb-As-Cu association. Silver shows a similar distribution with Pb and Sb. Silver occurs mainly in galena and as inclusions of Ag-bearing minerals such as tetrahedrite [53]. Sb, As and Cu show similar distribution pattern with Ag, and based on the paragenetic sequence of mineralization, the PC3 likely reflects tetrahedrite mineralization (Ag mineralization). PC4 explains 5.7% of multivariate data variability and represents Cd-Zn-(Mo-Co-Bi) association. PC2 and PC4, probably reflect pyrite and sphalerite mineralization as sub-ore halos.
A biplot of the first and second components (Figure 6) represents 57% of the overall variability and shows the multi-element associations and relative enrichment of the: (i) Pb-Zn-Ba-Th-Ag association related to the base metal sulfide mineralization; and (ii) Ni-Co-Mo-Fe association related to pyrite deposition as sub-ore haloes. PC1 shows high values near the ancient orebodies of Block A and also relatively high values in the center of Block A above the underground tunnels (Figure 7). PC3 and PC4 anomalies are located in the SW corner.
The mineralized samples of underground tunnels are described by four PCs (Table 5 and Figure 8). PC1 explains 25.02% of cumulative data variability and represents Cu-Ni-Fe-As-Bi-Sb(-Ag) association, which likely reflects pyrite and tetrahedrite mineralization. PC2 explains 23.4% of cumulative data variability and represents Pb-Ag-S and Ba-Th-Sr associations, which reflect galena and barite mineralization, respectively (Figure 2 and Figure 3). PC3 explains 18% of cumulative data variability and represents Mn-Mo-Co-Fe(Ni-As-Bi) association. PC4 explains 14% of cumulative data variability and represents Cd-Zn(-Sb-Ag-Pb) association, which likely reflects sphalerite and galena mineralization (Figure 2).
4.3. Vertical Variation of Indicator Elements
Beus and Grigurian [54] proposed that elements such as Ba, Th, Ag, As, Ba, Hg and Sb are more mobile than Pb, Zn, Fe, Ni, Co, Bi, Mo and develop supra-ore haloes. Comparison of data from surface and underground tunnel samples yields two associations: (1) Co-Ni-Bi-As-Mn-Mo-Fe association which is mainly related to the pyrite mineralization; and (2) Ba-Pb-Cu,-Sb-Ag-Zn-Th-Sr-Cd association related to the main-stage galena, sphalerite and tetrahedrite mineralization (Figure 2, Figure 3 and Figure 4). In the Ravanj ore deposit, the stronger loadings of Ba-Th-Pb-Sr-Ag association on PC1 of the surface samples compared to those of the tunnel samples (deep dataset) suggest that these elements were more mobile during hydrothermal mineralization and precipitated mostly at the shallower levels. The mobility of these elements in the surface samples is not related to the shallow level solubility mechanisms because elements such as Ba, Sr (barite-celestite solid solution) and Th are more insoluble and immobile under oxidized surface conditions [55]. In addition, Pb, Ag and Zn are very immobile in the limestone host rock due to the high pH-buffering reactions of limestone and high PCO2 [5,56,57,58]. The samples of mineralized underground tunnels have stronger loadings of Cu, Ni, Fe, As, Bi and Sb on PC1 and antipathetic high loadings of Ba, Sr and Th on PC2 than to those of surface samples. On PC1, surface samples show higher variability (ca. 38.6%) than mineralized tunnel samples (ca. 25%). These results suggest the presence of Ag, Ba, Sr and Th on sub-ore haloes around Pb mineralization, but Cu, Ni, Fe, As, Mo, Co and Bi occur mainly at the deeper levels. Sulfur has a close relationship with Ba in the surface samples reflecting the presence of barite. However, this relationship is obscured in the underground samples due to abundance of sulfides. It appears that the distribution of elements from surface to depth is as follows:
Ba, Sr, Th, S → Cu, Sb, Ag, Pb (S) → Zn, Cd (S) → Fe (Bi, Ni, Co, Mo, As, S)
Surface Depth
Surface Depth
4.4. Anomaly Testing
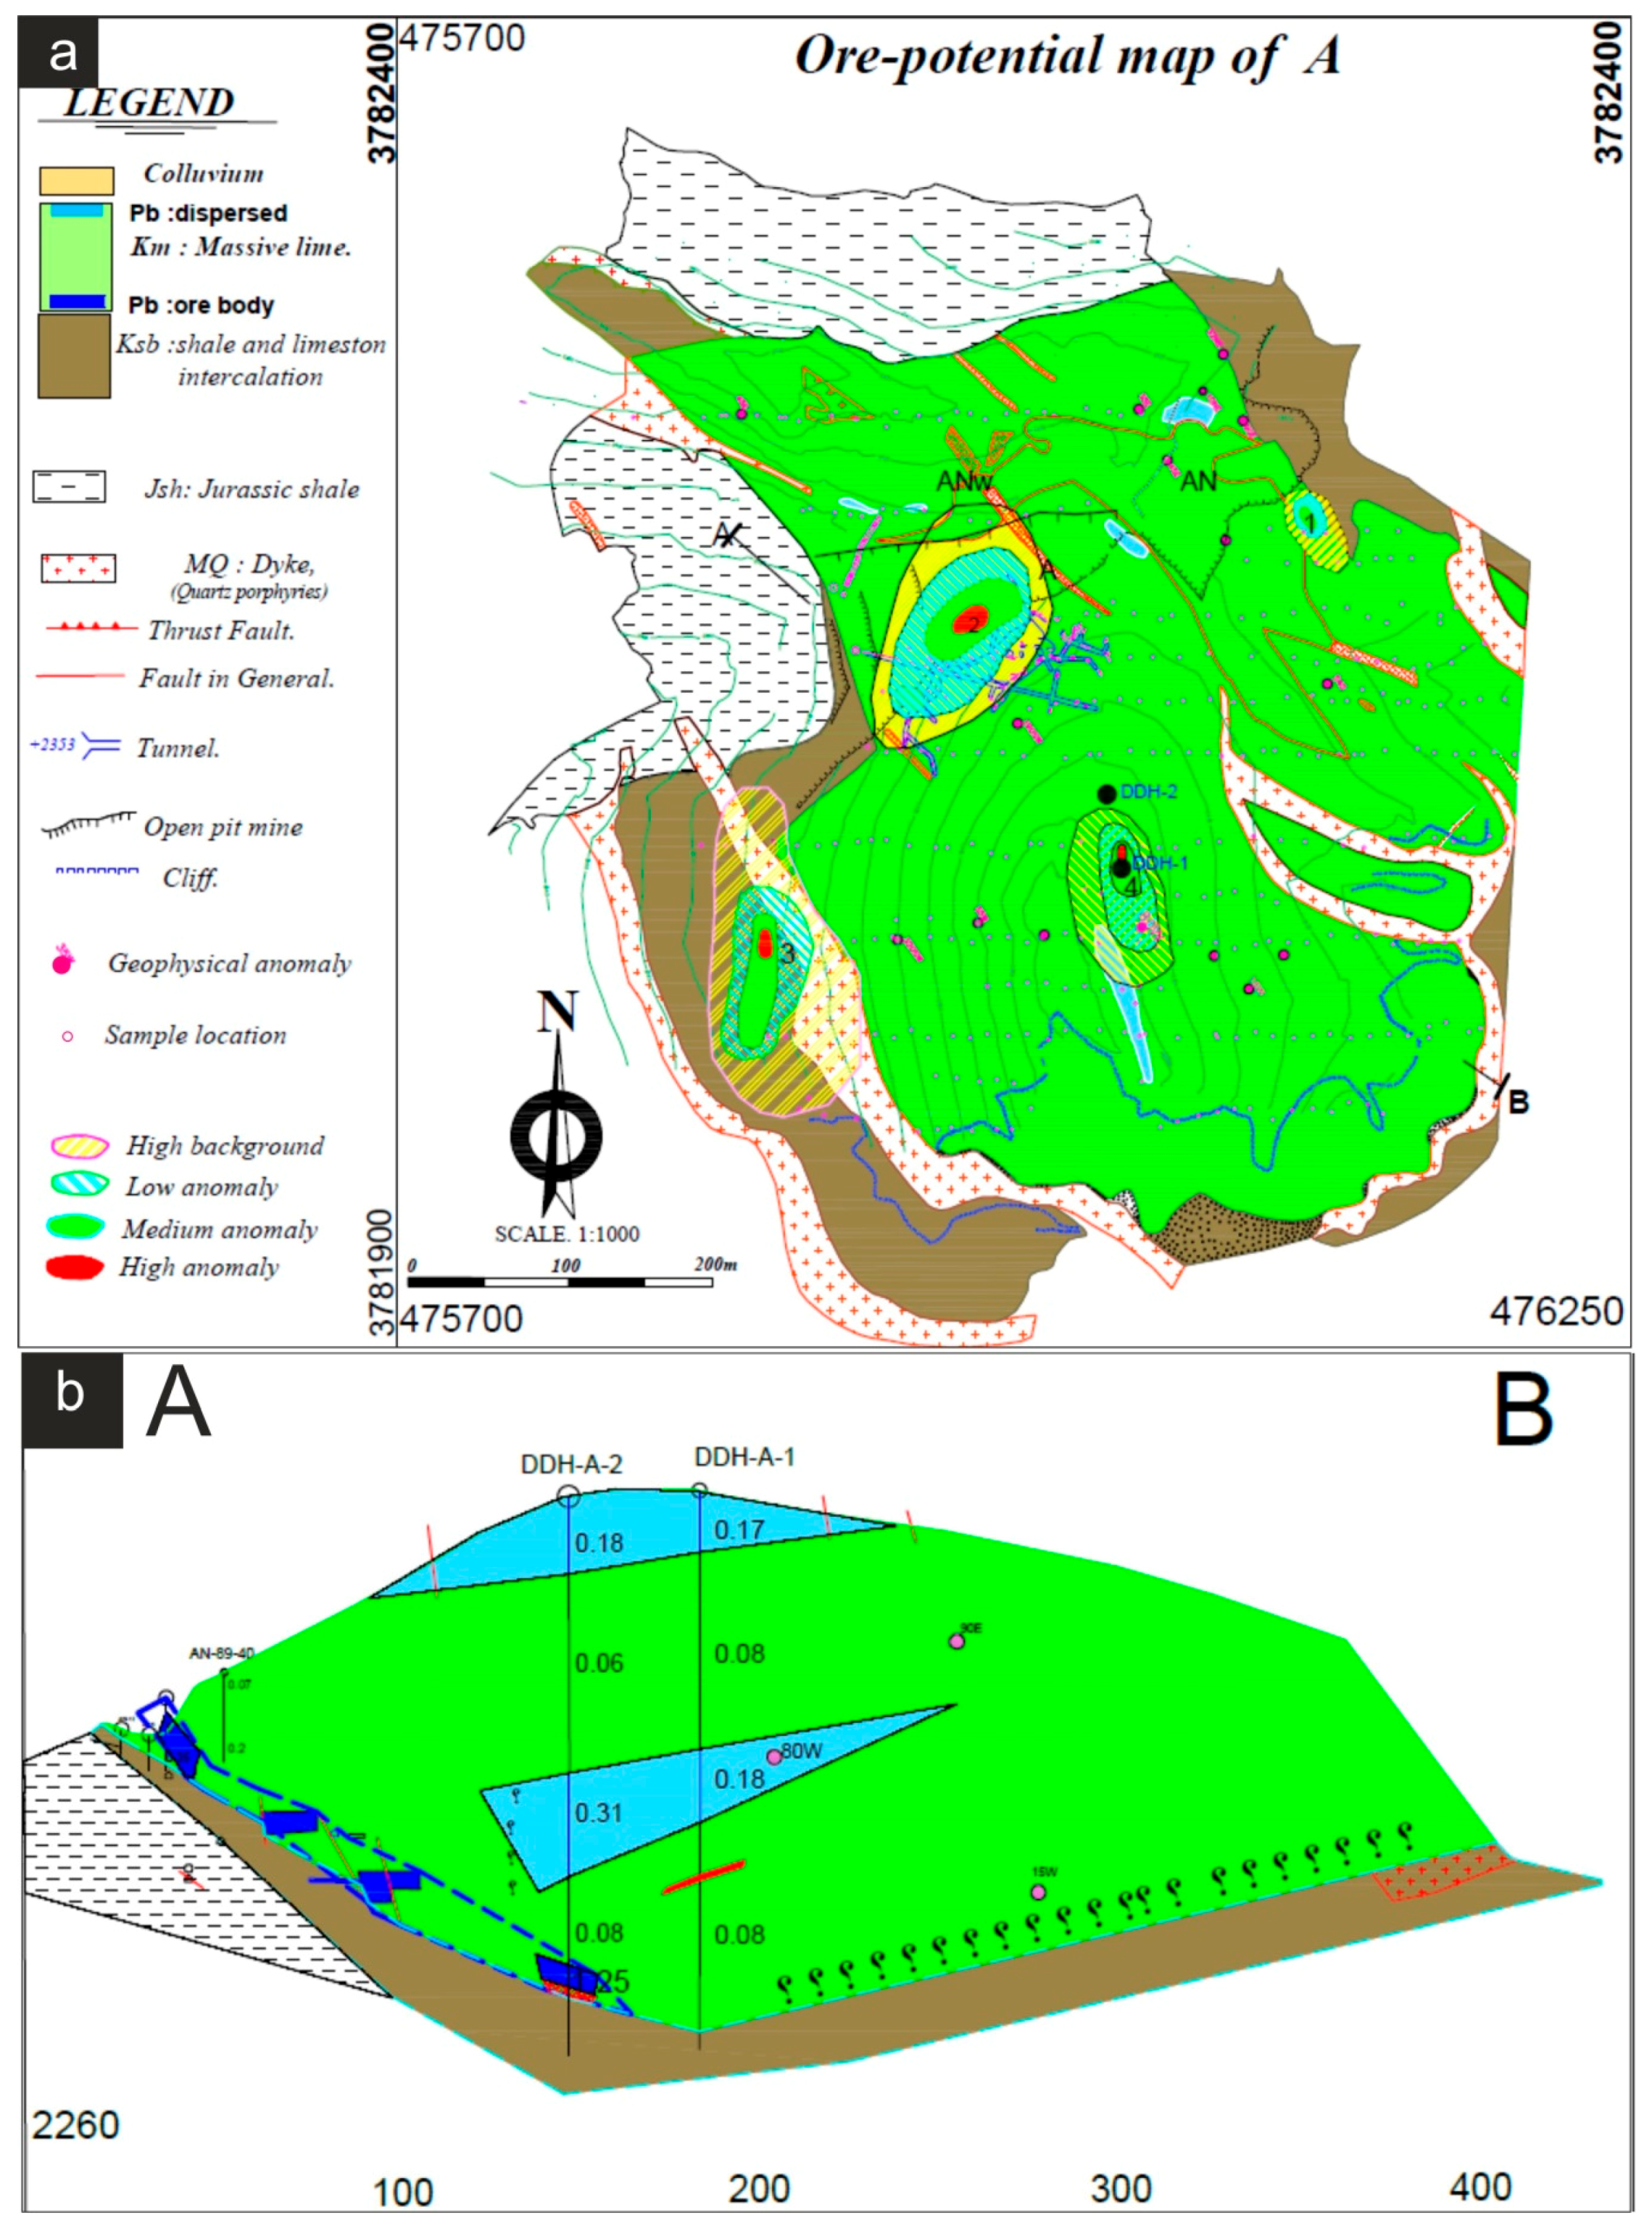
Three orebodies have been previously recognized in the Block A of the Ravanj deposits: AN (Northern A orebody), A (orebody A) and ANW (Northwest A orebody). AN and ANW orebodies have been mined by open pit, whereas orebody A is an active underground site. After combining the elemental maps and using the four Principal Components, four anomalies were identified in Block A of the Ravanj deposit (Figure 9).
- The first anomaly is located in the northeast margin of open pit A. The existence of this ore is confirmed by previous drilling. This small orebody, dipping 29° SE, is a branch of the previously extracted orebody which is situated at a depth of 16–25 m. The maximum recorded anomaly on this orebody is considered as medium anomaly. Because a medium intensity anomaly represents an ore in depth of approximately 25 m, a low intensity anomaly and high background values may reflect the presence of ore at depths greater than 25 m (Figure 9).
- The second anomaly is around the old tunnels of the orebody A. Based on the geological section (Figure 9), the thickness of massive limestone increases from NW to SE. As a result, intensity of anomaly is maximum on top of the NW area and it becomes low and finally drops to the background values in the SE area (Figure 9).
- The third anomaly occurs in the thin layered limestone-shale intercalation in the western end of the Block A. Significant orebody has not been detected in these strata. However, rotary air blast drilling does not show an orebody other than minor disseminated galena and barite with the mean Pb of 0.45%.
- The fourth anomaly, located at the center of Block A, is a high intensity anomaly, which coincides with the previously detected geophysical anomaly called 80 W [21]. In the Ravanj deposit, mineralization occurs in the lower part of the massive limestone where it thrusts over the shale strata. The thickness of host limestone in this part was estimated 100 m however, a diamond drilling of 155.6 m hole (DDH-A-1; Figure 9) in this anomaly showed that the limestone is 150 m thick. Mean of Pb in the first 18 m of the hole is 0.17%, which represents a near surface mineralization. In addition, the mean value of Pb is 0.18% in depth interval of 75–86 m. The thickness of limestone in the second drill hole (DDH-A-2; Figure 9) is 133 m. Similar to the first drill hole, the mean value of Pb is 0.18% in the first 20 m of this hole. The mean Pb is 0.31% in the 88–105 m depth interval, which possibly represents extension of the ore zone from depth interval of 75–86 m in the first hole. Stronger Pb mineralization (mean of 1.25%) was encountered at 126–131 m depth interval. This mineralized zone represents the extension of the ore which was previously mined in orebody A (Figure 9). It appears that both of the shallower ore zones are dipping towards the mined orebody A.
5. Conclusions
Concordant to semi-concordant orebodies were deposited above the thrust contact in the massive limestone of lower Cretaceous in the Ravanj area. Fine-grained galena and barite replaced carbonate host rock and filled open-spaces of tectonically fractured and hydrothermally dissolved breccias. Pyrite, sphalerite and tetrahedrite are common minor sulfide minerals. Distinct zonation in both mineralogy and metal contents are recognized; pyrite-sphalerite nears the SW-NE trending faults and galena-barite away from the faults. The primary dispersion haloes of metals around the orebodies are suitable geochemical exploration keys in the Ravanj Pb deposit.
Geochemical exploration keys were tested to identify geochemical anomalies of deep-seated source in the Ravanj deposit. The EDA method was used to select geochemically anomalous ranges of element concentrations. Multi-element associations of non-normal distributed elements (Pb, Zn, Ag, As, Cd, Co, Cu, Sb, S, Sr, Th, Ba, Bi, Fe, Ni and Mn), were investigated by PCA method. Characteristics of primary geochemical haloes provided the best targets for drilling. Four anomalies were identified for drilling in Block A. Two of the anomalies were recognized above the previous mined orebodies. The intensity of these anomalies is medium to high and the depth of orebodies is 16–25 m. It appears that low anomaly and high-background values can reflect hidden orebodies (deeper than 25 m). The third anomaly is in the lower thin layered limestone. The fourth anomaly overlaps the previously identified geophysical anomaly. Diamond drilling of two boreholes confirmed the relationship between these anomalies with previously mined orebody of tunnels.
Supplementary Materials
The following are available online at www.mdpi.com/2075-163X/7/11/212/s1, Figure S1: (a) Scree plot of parallel analysis (eigenvalues Mont-Carlo simulation) using PCA on CLR from the surface samples in Block A of the Ravanj deposit. Eigenvalues upper than raw data line are significant. (b) Biplot of PC1 vs. PC2. (c) Biplot of PC2 vs. PC3. (d) Biplot of PC3 vs. PC4, Table S1: Results of Robust PC analyses of surface samples from Block A of the Ravanj deposit (using the broken-stick method, [45]). Extraction Method: Principal Component Analysis. Rotation Method: Varimax with Kaiser Normalization.
Acknowledgment
Authors acknowledge the financial support from the Research Committee of Shiraz University. The CEO of Ravanj mine, H. Slami Ghane, is thanked for providing unlimited access to the Ravanj deposit, maps and analytical data, as well as M. Hosseini for help during fieldwork. The authors would like to express their gratitude to Chief Editor of “Minerals” journal and two anonymous reviewers for critical review to improve the manuscript.
Author Contributions
Mostafa Nejadhadad, Batoul Taghipour and Alireza Karimzadeh Somarin conceived and designed the experiments; Mostafa Nejadhadad and Batoul Taghipour contributed reagents/materials/analysis tools; Mostafa Nejadhadad, Batoul Taghipour and Alireza Karimzadeh Somarin wrote the paper.
Conflicts of Interest
The authors declare no conflict of interest.
References
- Levinson, A.A. Introduction to Exploration Geochemistry, 2nd ed.; Applied Publishing Company: Calgary, AB, Canada, 1980; p. 924. [Google Scholar]
- Wang, C.; Carranza, E.J.M.; Zhang, S.; Zhang, J.; Liu, X.; Zhang, D.; Sun, X.; Duan, C. Characterization of primary geochemical haloes for gold exploration at the Huanxiangwa gold deposit, China. J. Geochem. Explor. 2013, 124, 40–58. [Google Scholar] [CrossRef]
- Leach, D.L.; Sangster, D.F.; Kefiglley, K.D.; Large, R.R.; Garven, G.; Allen, C.R.; Gutzmer, J.; Walters, S. Sediment-hosted lead–zinc deposits: A global perspective. Econ. Geol. 2005, 100th Anniv. Vol., 561–608. [Google Scholar]
- Mavrogenes, J.A.; Hagni, R.D.; Dingess, P.R. Mineralogy, paragenesis, and mineral zoning of the West Fork mine. Viburnum Trend, Southeast Missouri. Econ. Ceol. 1992, 87, 113–124. [Google Scholar]
- Lavery, N.C.; Leach, D.L.; Saunders, J.A. Lithogeochemical investigations applied to exploration for sediment-hosted lead-zinc deposits. In Society for Geology Applied to Mineral Deposits Special Publication; Springer: Berlin/Heidelberg, Germany, 1994; pp. 393–428. [Google Scholar]
- Yusta, I.; Velasco, F.; Herrero, J.-M. Anomaly threshold estimation and data normalization using EDA statistics: Application to lithogeochemical exploration in Lower Cretaceous Zn-Pb carbonate-hosted deposits, Northern Spain. Appl. Geochem. 1998, 13, 421–439. [Google Scholar] [CrossRef]
- Feltrin, L. Predictive modeling of prospectivity for Pb-Zn deposits in the Lawn Hill region, Queensland, Australia. Ore Geol. Rev. 2008, 34, 399–427. [Google Scholar] [CrossRef]
- Decree, S.; Mariganc, C.; De Putter, T.; Deloule, E.; Liegeois, J.P.; Demaiffe, D. Pb-Zn mineralization in a Miocene regional extensional context: The case of the Sidi Driss and the Douahria ore deposits, Nefza mining district, northern Tunisia. Ore Geol. Rev. 2008, 34, 285–303. [Google Scholar] [CrossRef]
- Pirajno, F. Hydrothermal Processes and Mineral Systems; Springer: Berlin, Germany, 2009; p. 1250. [Google Scholar]
- Billstrom, K.; Broman, C.; Schneider, J.; Pratt, W.; Skogsmo, G. Zn-Pb ores of Mississippi valley type in the Lycksele-Storuman District, Northern Sweden: A possible rift-related Cambrian mineralization event. Minerals 2012, 1, 169–207. [Google Scholar] [CrossRef]
- Samimi Namin, M. Geoelectrical report of the Ravanj lead mine. In Unpublished Reports of the Ravanj Mine; Soojmiran Co.: Tehran, Iran, 1997. (In Farsi) [Google Scholar]
- Emami, M.H. Kahak Map 1:100,000; Geological Survey and Mineral Exploration of Iran: Tehran, Iran, 1996. [Google Scholar]
- Modabberi, S. Geology, Facies Analysis, Mineralogy, Geochemistry and Genesis of Ravandje Pb-Ag Deposit, Central Iran. Master’s Thesis, Tarbiat Modarres University, Tehran, Iran, 1995. (In Farsi). [Google Scholar]
- Alavi, M. Tectonics of Zagros Orogenic belt of Iran, new data and interpretation. Tectonophysics 1994, 229, 211–238. [Google Scholar] [CrossRef]
- Golonka, J. Plate tectonic evolution of the southern margin of Eurasia in the Mesozoic and Cenozoic. Tectonophysics 2004, 381, 235–273. [Google Scholar] [CrossRef]
- Nejadhadad, M.; Taghipour, B.; Zarasvandi, A.; Karimzadeh Somarin, A. Geological, geochemical, and fluid inclusion evidences for the origin of the Ravanj Pb-Ba-Ag deposit, north of Delijan city, Markazi Province, Iran. Turkish J. Earth Sci. 2016, 24, 1501–1526. [Google Scholar] [CrossRef]
- Claypool, G.E.; Holser, W.T.; Kaplan, I.R.; Sakai, H.; Zak, I. The age curves of sulfur and oxygen isotopes in marine sulfate and their mutual interpretation. Chem. Geol. 1980, 28, 199–260. [Google Scholar] [CrossRef]
- Seal, R.R. Sulfur Isotope Geochemistry of Sulfide Minerals. Rev. Mineral. Geochem. 2006, 61, 633–677. [Google Scholar] [CrossRef]
- Hron, K.; Templ, M.; Filzmoser, P. Imputation of missing values for compositional data using classical and robust methods. Comput. Stat. Data Anal. 2010, 54, 3095–3107. [Google Scholar] [CrossRef]
- Aitchison, J.; Barceló-Vidal, C.; Martín-Fernandez, J.; Pawlowsky-Glahn, V. Logratio analysis and compositional distance. Math. Geol. 2000, 32, 271–275. [Google Scholar] [CrossRef]
- Buccianti, A.; Grunsky, E. Compositional data analysis in geochemistry: Are we sure to see what really occurs during natural processes? J. Geochem. Explor. 2014, 141, 1–5. [Google Scholar] [CrossRef]
- Blake, S.; Henry, T.; Murray, J.; Flood, R.; Muller, M.R.; Jones, A.G.; Rath, V. Compositional multivariate statistical analysis of thermal groundwater provenance: A hydrogeochemical case study from Ireland. Appl. Geochem. 2016, 75, 171–188. [Google Scholar] [CrossRef]
- Hawkes, H.E.; Webb, J.S. Geochemistry in Mineral Exploration; Harper and Row: New York, NY, USA, 1962. [Google Scholar]
- Reimann, C.; Filzmoser, P.; Garrett, R.G. Factor analysis applied to regional geochemical data: Problems and possibilities. Appl. Geochem. 2002, 17, 185–206. [Google Scholar] [CrossRef]
- Reimann, C.; Garrett, R.G. Geochemical background-concept and reality. Sci. Total Environ. 2005, 350, 12–27. [Google Scholar] [CrossRef] [PubMed]
- Tukey, J.W. Exploratory Data Analysis; Addison-Wesley: Reading, MA, USA, 1977. [Google Scholar]
- Hoaglin, D.C.; Iglewicz, B.; Tukey, J.W. Performance of some resistant rules for outlier labeling. J. Am. Stat. Assoc. 1986, 81, 991–999. [Google Scholar] [CrossRef]
- Wurzer, F. Application of robust statistics in the analysis of geochemical data. In Quantitative Analysis of Mineral and Energy Resources; Chung, C.F., Fabbri, A.G., Sinding-Larsen, R., Eds.; Reidel Publishing Company: Dordrecht, The Netherlands, 1988; pp. 131–143. [Google Scholar]
- Hoaglin, D.; Mosteller, F.; Tukey, J. Understanding Robust and Exploratory Data Analysis, 2nd ed.; Wiley & Sons: New York, NY, USA, 2000. [Google Scholar]
- Reimann, C.; Filzmoser, P.; Garrett, R.G. Background and threshold: Critical comparison of methods of determination. Sci. Total Environ. 2005, 346, 1–16. [Google Scholar] [CrossRef] [PubMed]
- Mrvić, V.; Kostić-Kravljanac, L.; Čakmak, D.; Sikirić, B.; Brebanović, B.; Perović, V.; Nikoloski, M. Pedogeochemical mapping and background limit of trace elements in soils of Branicevo Province (Serbia). J. Geochem. Explor. 2011, 109, 18–25. [Google Scholar] [CrossRef]
- Kurzl, H. Exploratory data analysis: Recent advances for the interpretation of geochemical data. J. Geochem. Explor. 1988, 30, 309–322. [Google Scholar] [CrossRef]
- Kotz, S.; Johnson, N.L. Encyclopedia of Statistical Sciences; John Wiley and Sons: New York, NY, USA, 1985; pp. 136–137. [Google Scholar]
- Cook, S.J.; Fletcher, W.K. Distribution and behavior of platinum in soils, sediments and waters or the Tulameen ultramafic complex, southern British Columbia, Canada. J. Geochem. Explor. 1993, 46, 279–308. [Google Scholar] [CrossRef]
- Templ, M.; Filzmoser, P.; Reimann, C. Cluster analysis applied to regional geochemical data: Problems and possibilities. Appl. Geochem. 2008, 23, 2198–2213. [Google Scholar] [CrossRef]
- Fresia, B.; Ross, P.S.; Gloaguen, E.; Bourke, A. Lithological discrimination based on statistical analysis of multi-sensor drill core logging data in the Matagami VMS district, Quebec, Canada. Ore Geol. Rev. 2016. [Google Scholar] [CrossRef]
- Reimann, C.; Filzmoser, P. Normal and lognormal data distribution in geochemistry: Death of a myth. Consequences for the statistical treatment of geochemical and environmental data. Environ. Geol. 2000, 39, 1001–1014. [Google Scholar] [CrossRef]
- Howarth, R.J.; Sinding-Larsen, R. Multivariate analyses. In Statistics and Data Analysis in Geochemical Prospecting: Handbook of Exploration Geochemistry; Howarth, R.J., Ed.; Elsevier: Amsterdam, The Netherlands, 1983; pp. 207–289. [Google Scholar]
- Day, S.J.A.; McCurdy, M.W.; Friske, P.W.B.; McNeil, R.J.; Hornbrook, E.H.W.; Lynch, J.J. Regional lake sediment and water geochemical data, Melville Peninsula, Nunavut (parts of NTS 046 N, O, P, 047A and B). Geol. Surv. Can. Open File 2009, 12, 6269. [Google Scholar]
- Filzmoser, P.; Hron, K.; Reimann, C. Principal component analysis for compositional data with outliers. Environmetrics 2009, 20, 621–632. [Google Scholar] [CrossRef]
- Grunsky, E.C.; Mueller, U.A.; Corrigan, D. A study of the lake sediment geochemistry of the Melville Peninsula using multivariate methods: Applications for predictive geological mapping. J. Geochem. Explor. 2014, 141, 15–41. [Google Scholar] [CrossRef]
- Filzmoser, P.; Hron, K.; Reimann, C. Univariate statistical analysis of environmental (compositional) data: Problems and possibilities. Sci. Total Environ. 2009, 407, 6100–6108. [Google Scholar] [CrossRef] [PubMed]
- Martín-Fernández, J.A.; Thió-Henestrosa, S. Compositional Data Analysis. In Springer Proceedings in Mathematics & Statistics; Springer: London, UK, 2015; Volume 187, p. 211. [Google Scholar]
- Jolliffe, I.T. Principal Component Analysis, 2nd ed.; Springer: London, UK, 2002. [Google Scholar]
- Peres-Neto, P.R.; Jackson, D.A.; Somers, K.M. Giving meaningful interpretation to ordination axes: Assessing loading significance in principal component analysis. Ecology 2003, 84, 2347–2363. [Google Scholar] [CrossRef]
- Hronsky, J.M.A. The science of exploration targeting. In SEG 2004, Predictive Mineral Discovery under Cover: Publication, 33; Muhling, J., Ed.; University of Western Australia: Crawley, Australia, 2004; pp. 129–133. [Google Scholar]
- Carranza, E.J.M. Geochemical Anomaly and Mineral Prospectivity Mapping in GIS; Elsevier: Amsterdam, The Netherlands, 2008. [Google Scholar]
- Grunsky, E.C. The interpretation of geochemical survey data. Geochem. Explor. Environ. Anal. 2010, 10, 27–74. [Google Scholar] [CrossRef]
- Hosseini-Dinani, H.; Aftabi, A. Vertical lithogeochemical halos and zoning vectors at Goushfil Zn-Pb deposit, Irankuh district, southwestern Isfahan, Iran: Implications for concealed ore exploration and genetic models. Ore Geol. Rev. 2016, 72, 1004–1021. [Google Scholar] [CrossRef]
- Cameron, E.M.; Hamilton, S.M.; Leybourne, M.I.; Hall, G.E.M.; McClenaghan, M.B. Finding deeply buried deposits using geochemistry. Geochem. Explor. Environ. Anal. 2004, 4, 7–32. [Google Scholar] [CrossRef]
- Carranza, E.J.M.; Owusu, E.A.; Hale, M. Mapping of prospectivity and estimation of number of undiscovered prospects for lode gold, southwestern Ashanti Belt, Ghana. Miner. Depos. 2009, 44, 915–938. [Google Scholar] [CrossRef]
- Viets, J.G.; Leach, D.L. Genetic implications of regional and temporal trends in ore fluid geochemistry of Mississippi Valley-type deposits in Ozark region. Econo. Geol. 1990, 85, 842–861. [Google Scholar] [CrossRef]
- Klein, C.; Hurlbut, C.S. Manual of Mineralogy; John Wiley & Sons: Hoboken, NJ, USA, 1993; p. 681. [Google Scholar]
- Beus, A.A.; Grigorian, S.V. Geochemical Exploration Methods for Mineral Deposits; Applied publishing Company: Wilmette, IL, USA, 1977; 287 p. [Google Scholar]
- Hanor, J.S. Barite-celestine geochemistry and environments of formation. Rev. Miner. Geochem. 2000, 40, 193–275. [Google Scholar] [CrossRef]
- Scheffer, F.; Schachtschabel, P. Lehrbuch der Bodenkunde; Spektrum Akademischer Verlag: Heidelberg, Germany, 2002; 494p. (In German) [Google Scholar]
- Boni, M. Non-sulfide Zinc Deposits: A new-(old) type of economic mineralization. SGA News 2003, 15, 6–11. [Google Scholar]
- Reichert, J.; Borg, G. Numerical simulation and a geochemical model of supergene carbonate-hosted non-sulfide zinc deposits. Ore Geol. Rev. 2008, 33, 134–151. [Google Scholar] [CrossRef]
Figure 1.
Geological map of the Ravanj anticline and location of the study area (after [13]). The lithostratigraphic columnar section shows relative position of known mineralization in the Ravanj lower Cretaceous sequence.
Figure 1.
Geological map of the Ravanj anticline and location of the study area (after [13]). The lithostratigraphic columnar section shows relative position of known mineralization in the Ravanj lower Cretaceous sequence.
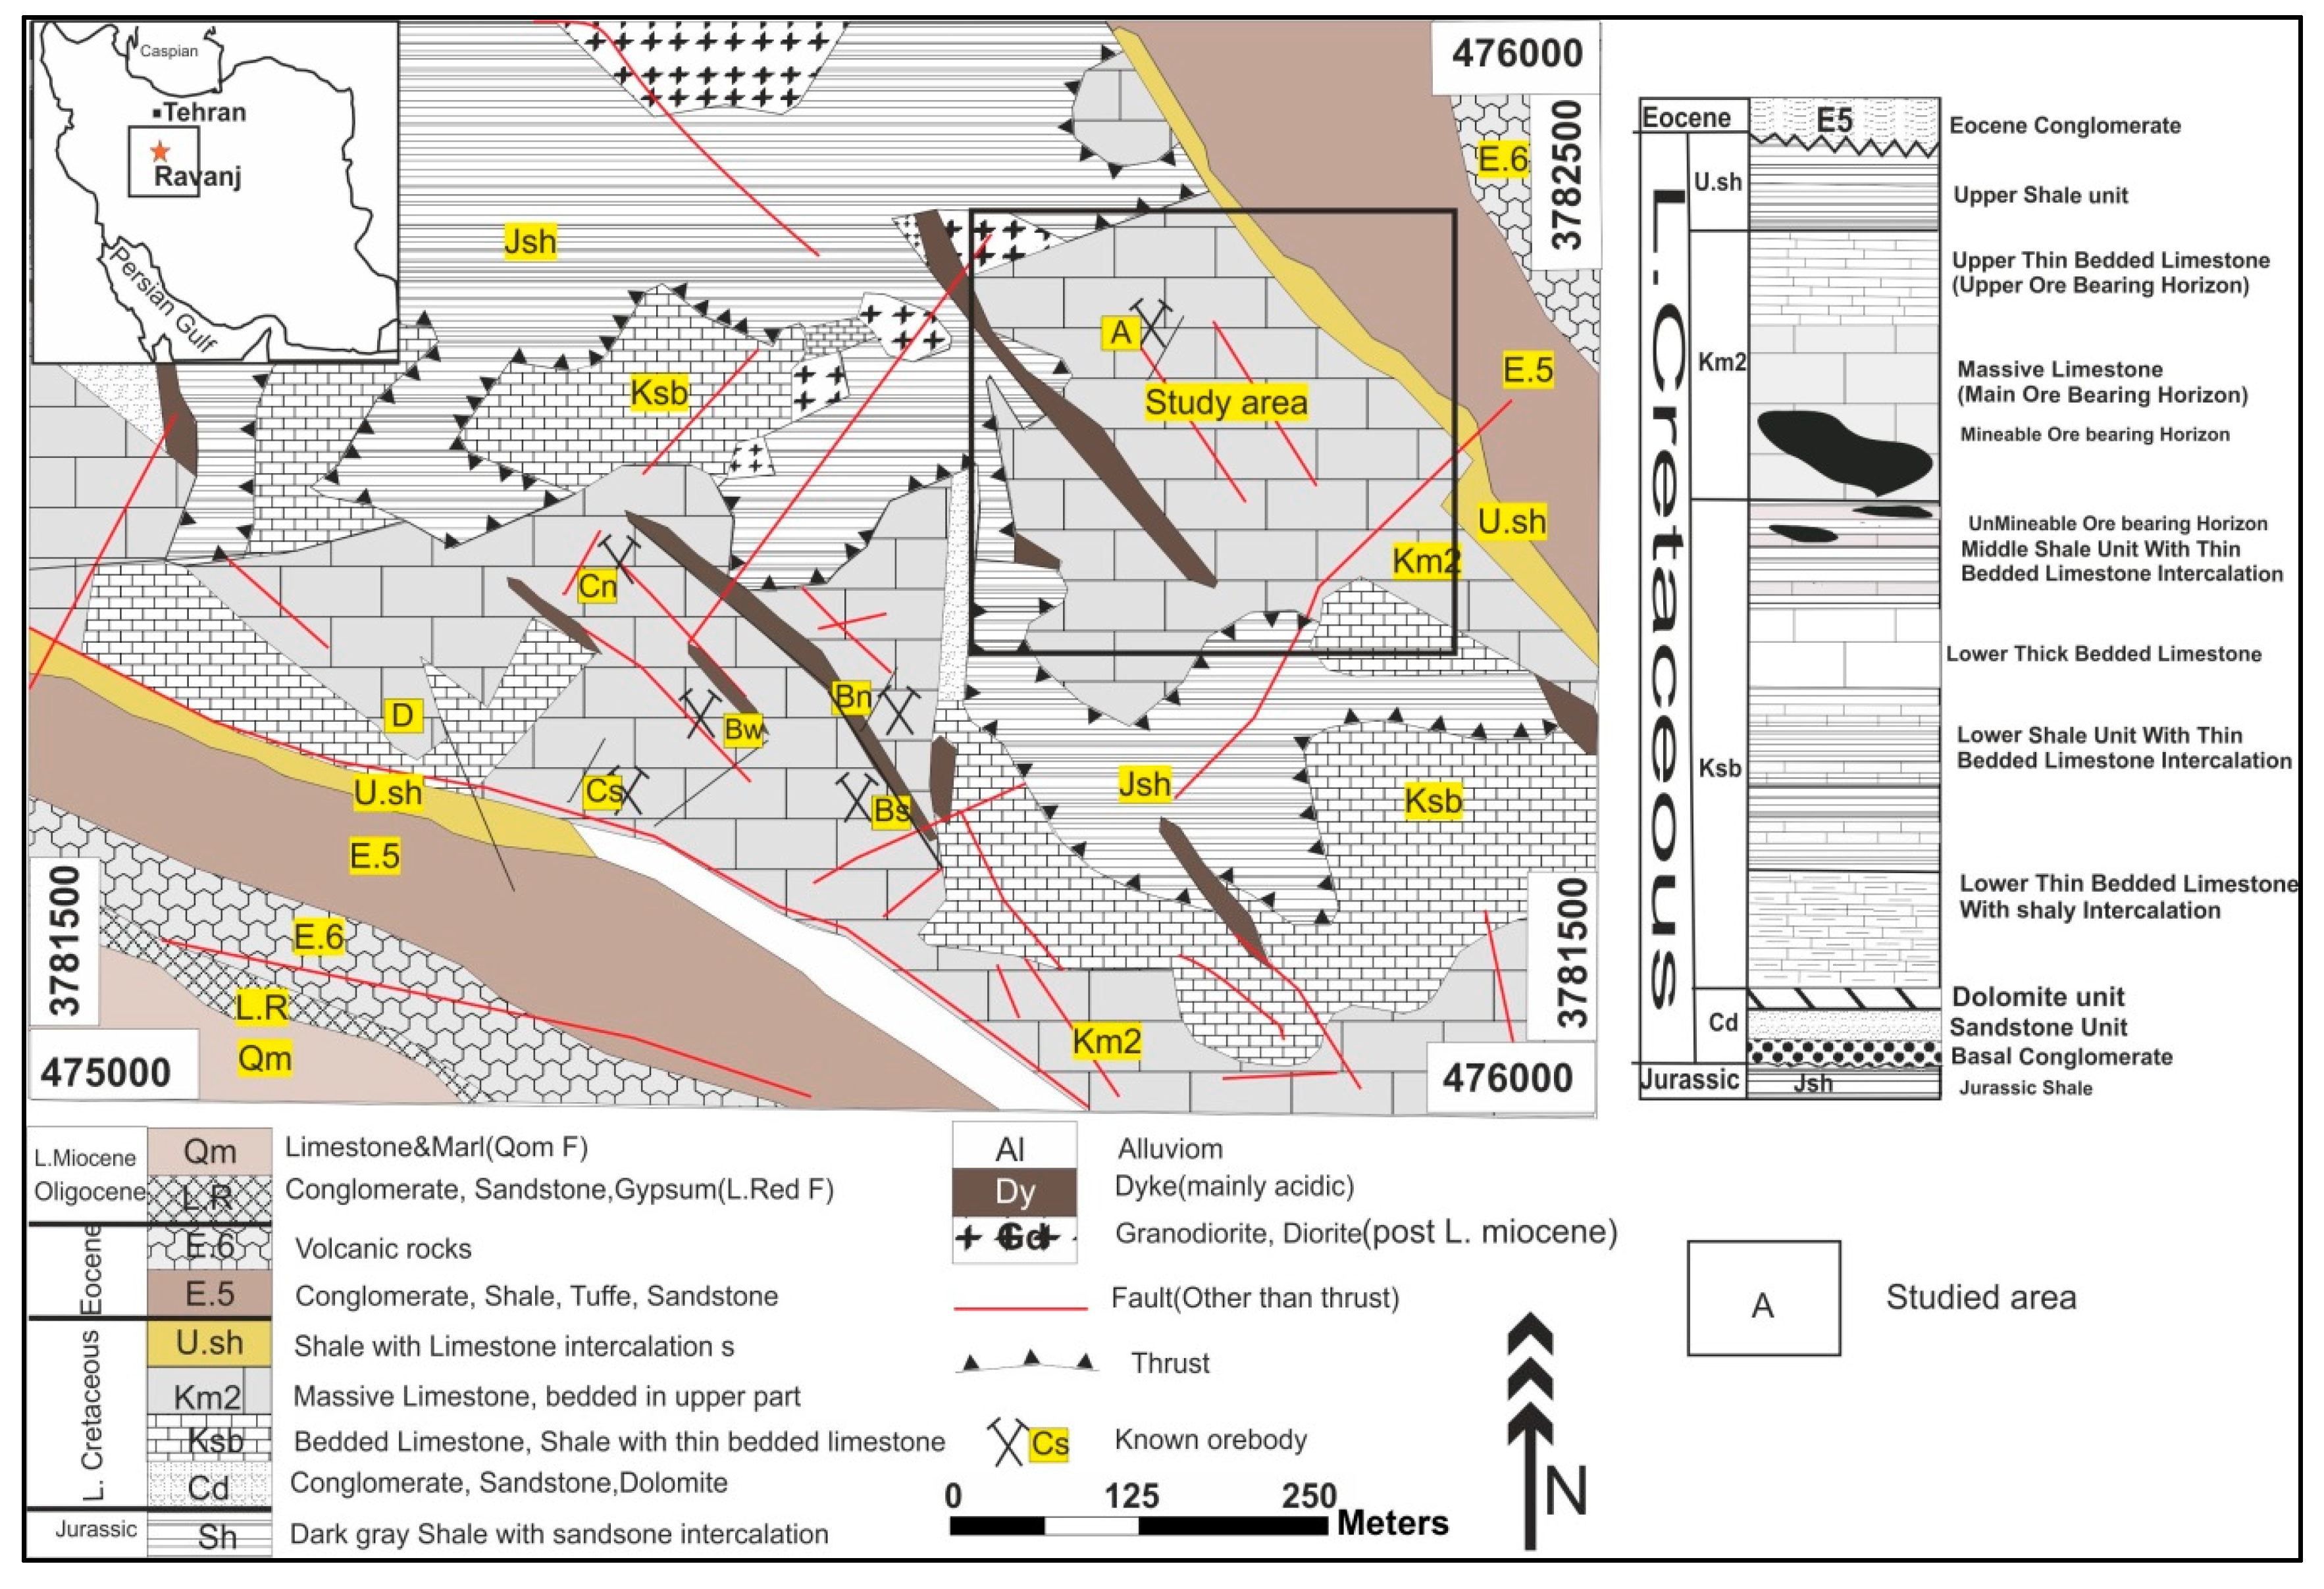
Figure 2.
(A) Pyrite-bearing veins on the ore body; (B) rhythmic deposition of calcite, pyrite, galena and late stage calcite; (C) barite (Ba) and galena (Gn) on the photo; (D) photomicrograph showing sphalerite and tetrahedrite hosted by galena; (E) sphalerite intergrowth with galena engulfed pyrite; and (F) late-stage open space filling galena whiteout sulfide mineral inclusion. H: Host rock; Ca: Calcite; C2: stage II calcite; C3: stage III calcite; Ba: Barite; D: Dolomite; Py: Pyrite; Gn: Galena; Sp: Sphalerite; T: Tetrahedrite. D–F under the Plan Polarized Light (ppl).
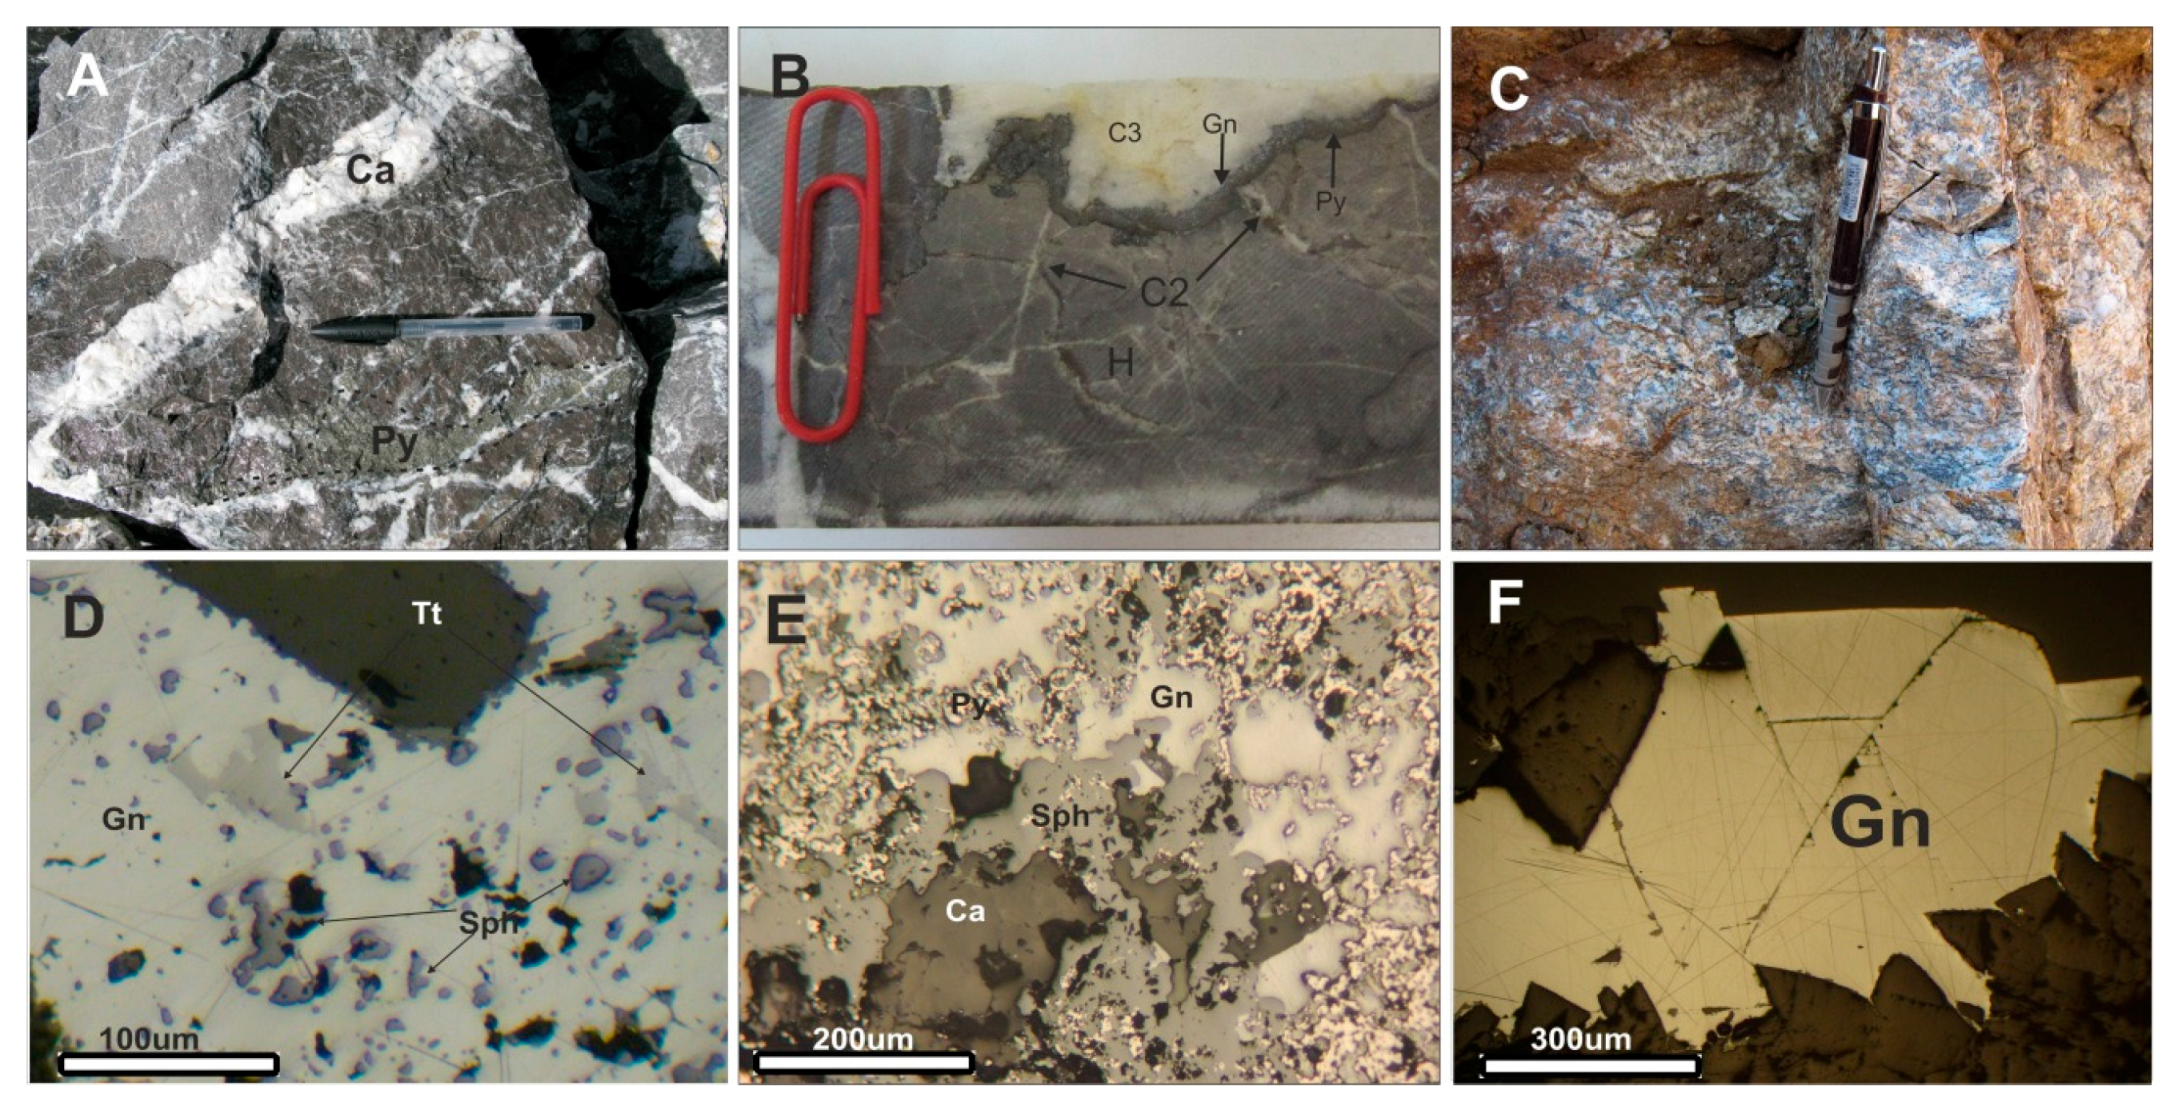
Figure 3.
Schematic cross sections of the Cs ore body of the Ravanj deposit. Change in content of Pb (%) from the bottom to top of the massive limestone in the Csw03 drill hole (data from the Soojmiran Co. drill core loges).
Figure 3.
Schematic cross sections of the Cs ore body of the Ravanj deposit. Change in content of Pb (%) from the bottom to top of the massive limestone in the Csw03 drill hole (data from the Soojmiran Co. drill core loges).

Figure 4.
Summary of mineralization paragenesis in the Ravanj deposit (modified after [16]).
Figure 4.
Summary of mineralization paragenesis in the Ravanj deposit (modified after [16]).

Figure 5.
Box-plot of anomalous element contents (data are in ppm transformed to base 10 logarithms) in the surface (n = 302) and tunnel (n = 42) specimens in Block A of the Ravanj deposit.
Figure 5.
Box-plot of anomalous element contents (data are in ppm transformed to base 10 logarithms) in the surface (n = 302) and tunnel (n = 42) specimens in Block A of the Ravanj deposit.
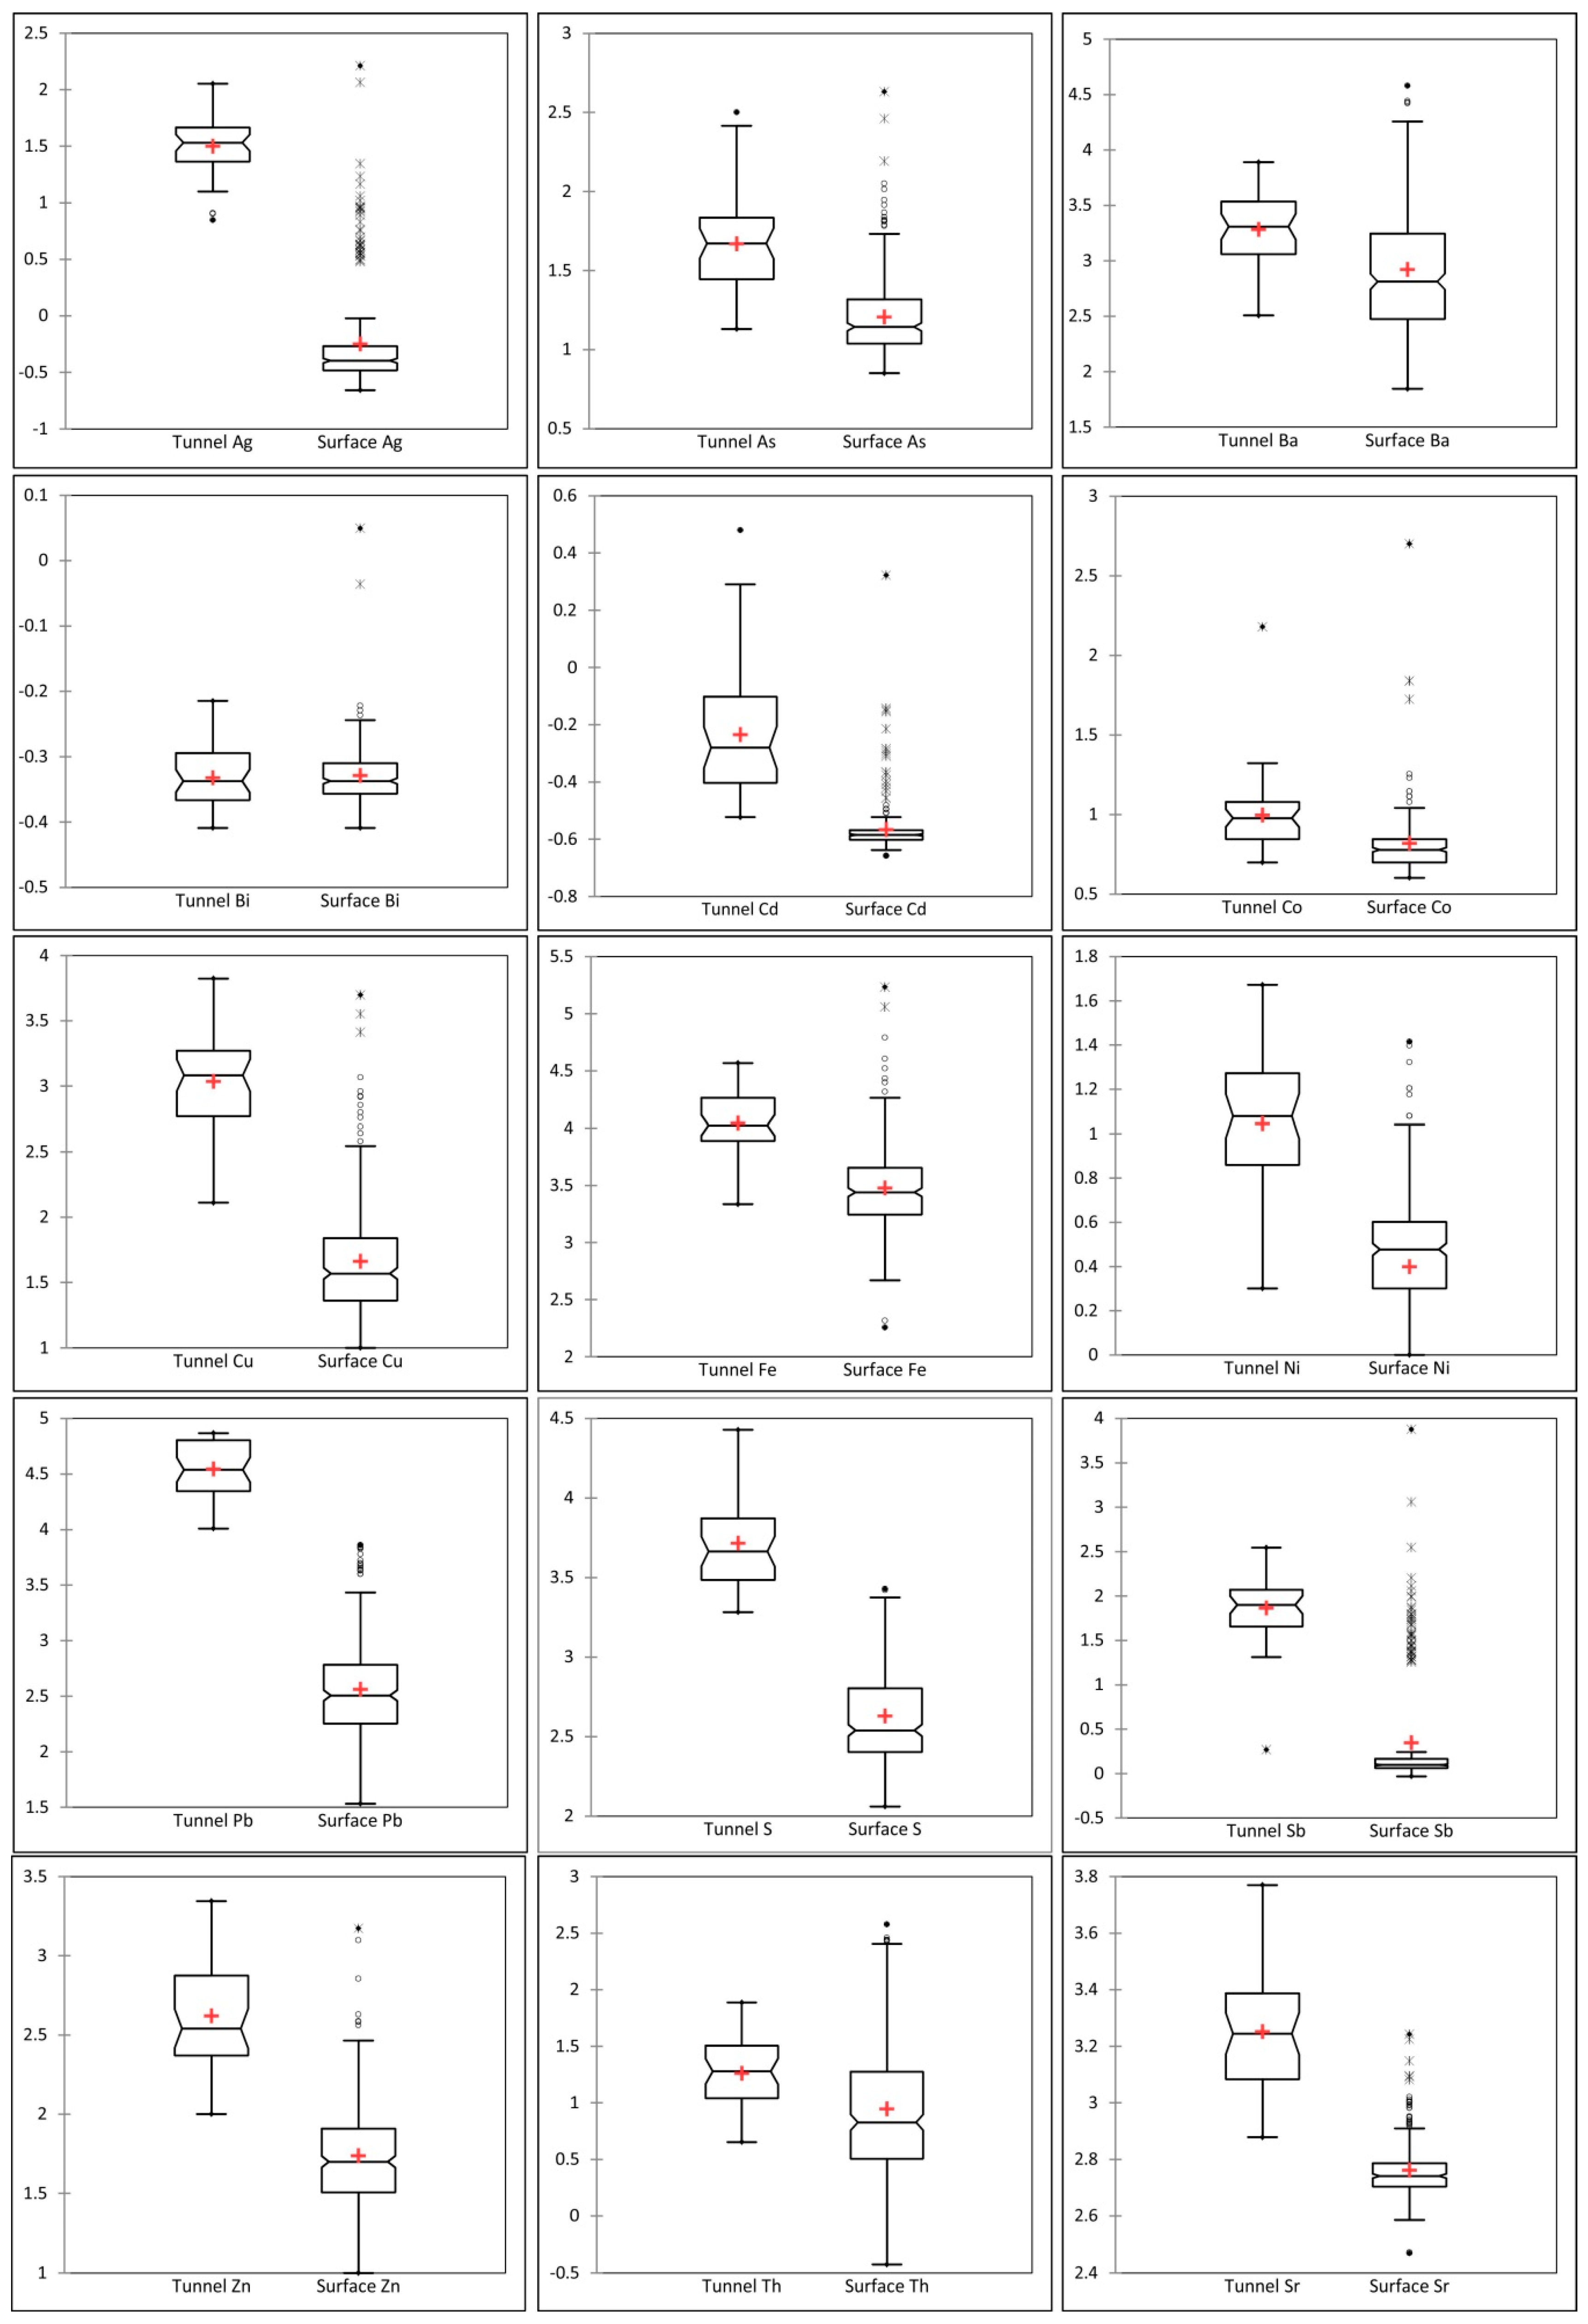
Figure 6.
(a) Scree plot of parallel analysis (eigenvalues Mont-Carlo simulation) using PCA on CLR from the surface samples in Block A of the Ravanj deposit. Eigenvalues upper than raw data line are significant; (b) Biplot of PC1 vs. PC2; (c) Biplot of PC2 vs. PC3; and (d) Biplot of PC3 vs. PC4.
Figure 6.
(a) Scree plot of parallel analysis (eigenvalues Mont-Carlo simulation) using PCA on CLR from the surface samples in Block A of the Ravanj deposit. Eigenvalues upper than raw data line are significant; (b) Biplot of PC1 vs. PC2; (c) Biplot of PC2 vs. PC3; and (d) Biplot of PC3 vs. PC4.

Figure 7.
Spatial distribution of the varimax rotated PCs 1–4 of the surface samples in Block A of the Ravanj deposit.
Figure 7.
Spatial distribution of the varimax rotated PCs 1–4 of the surface samples in Block A of the Ravanj deposit.
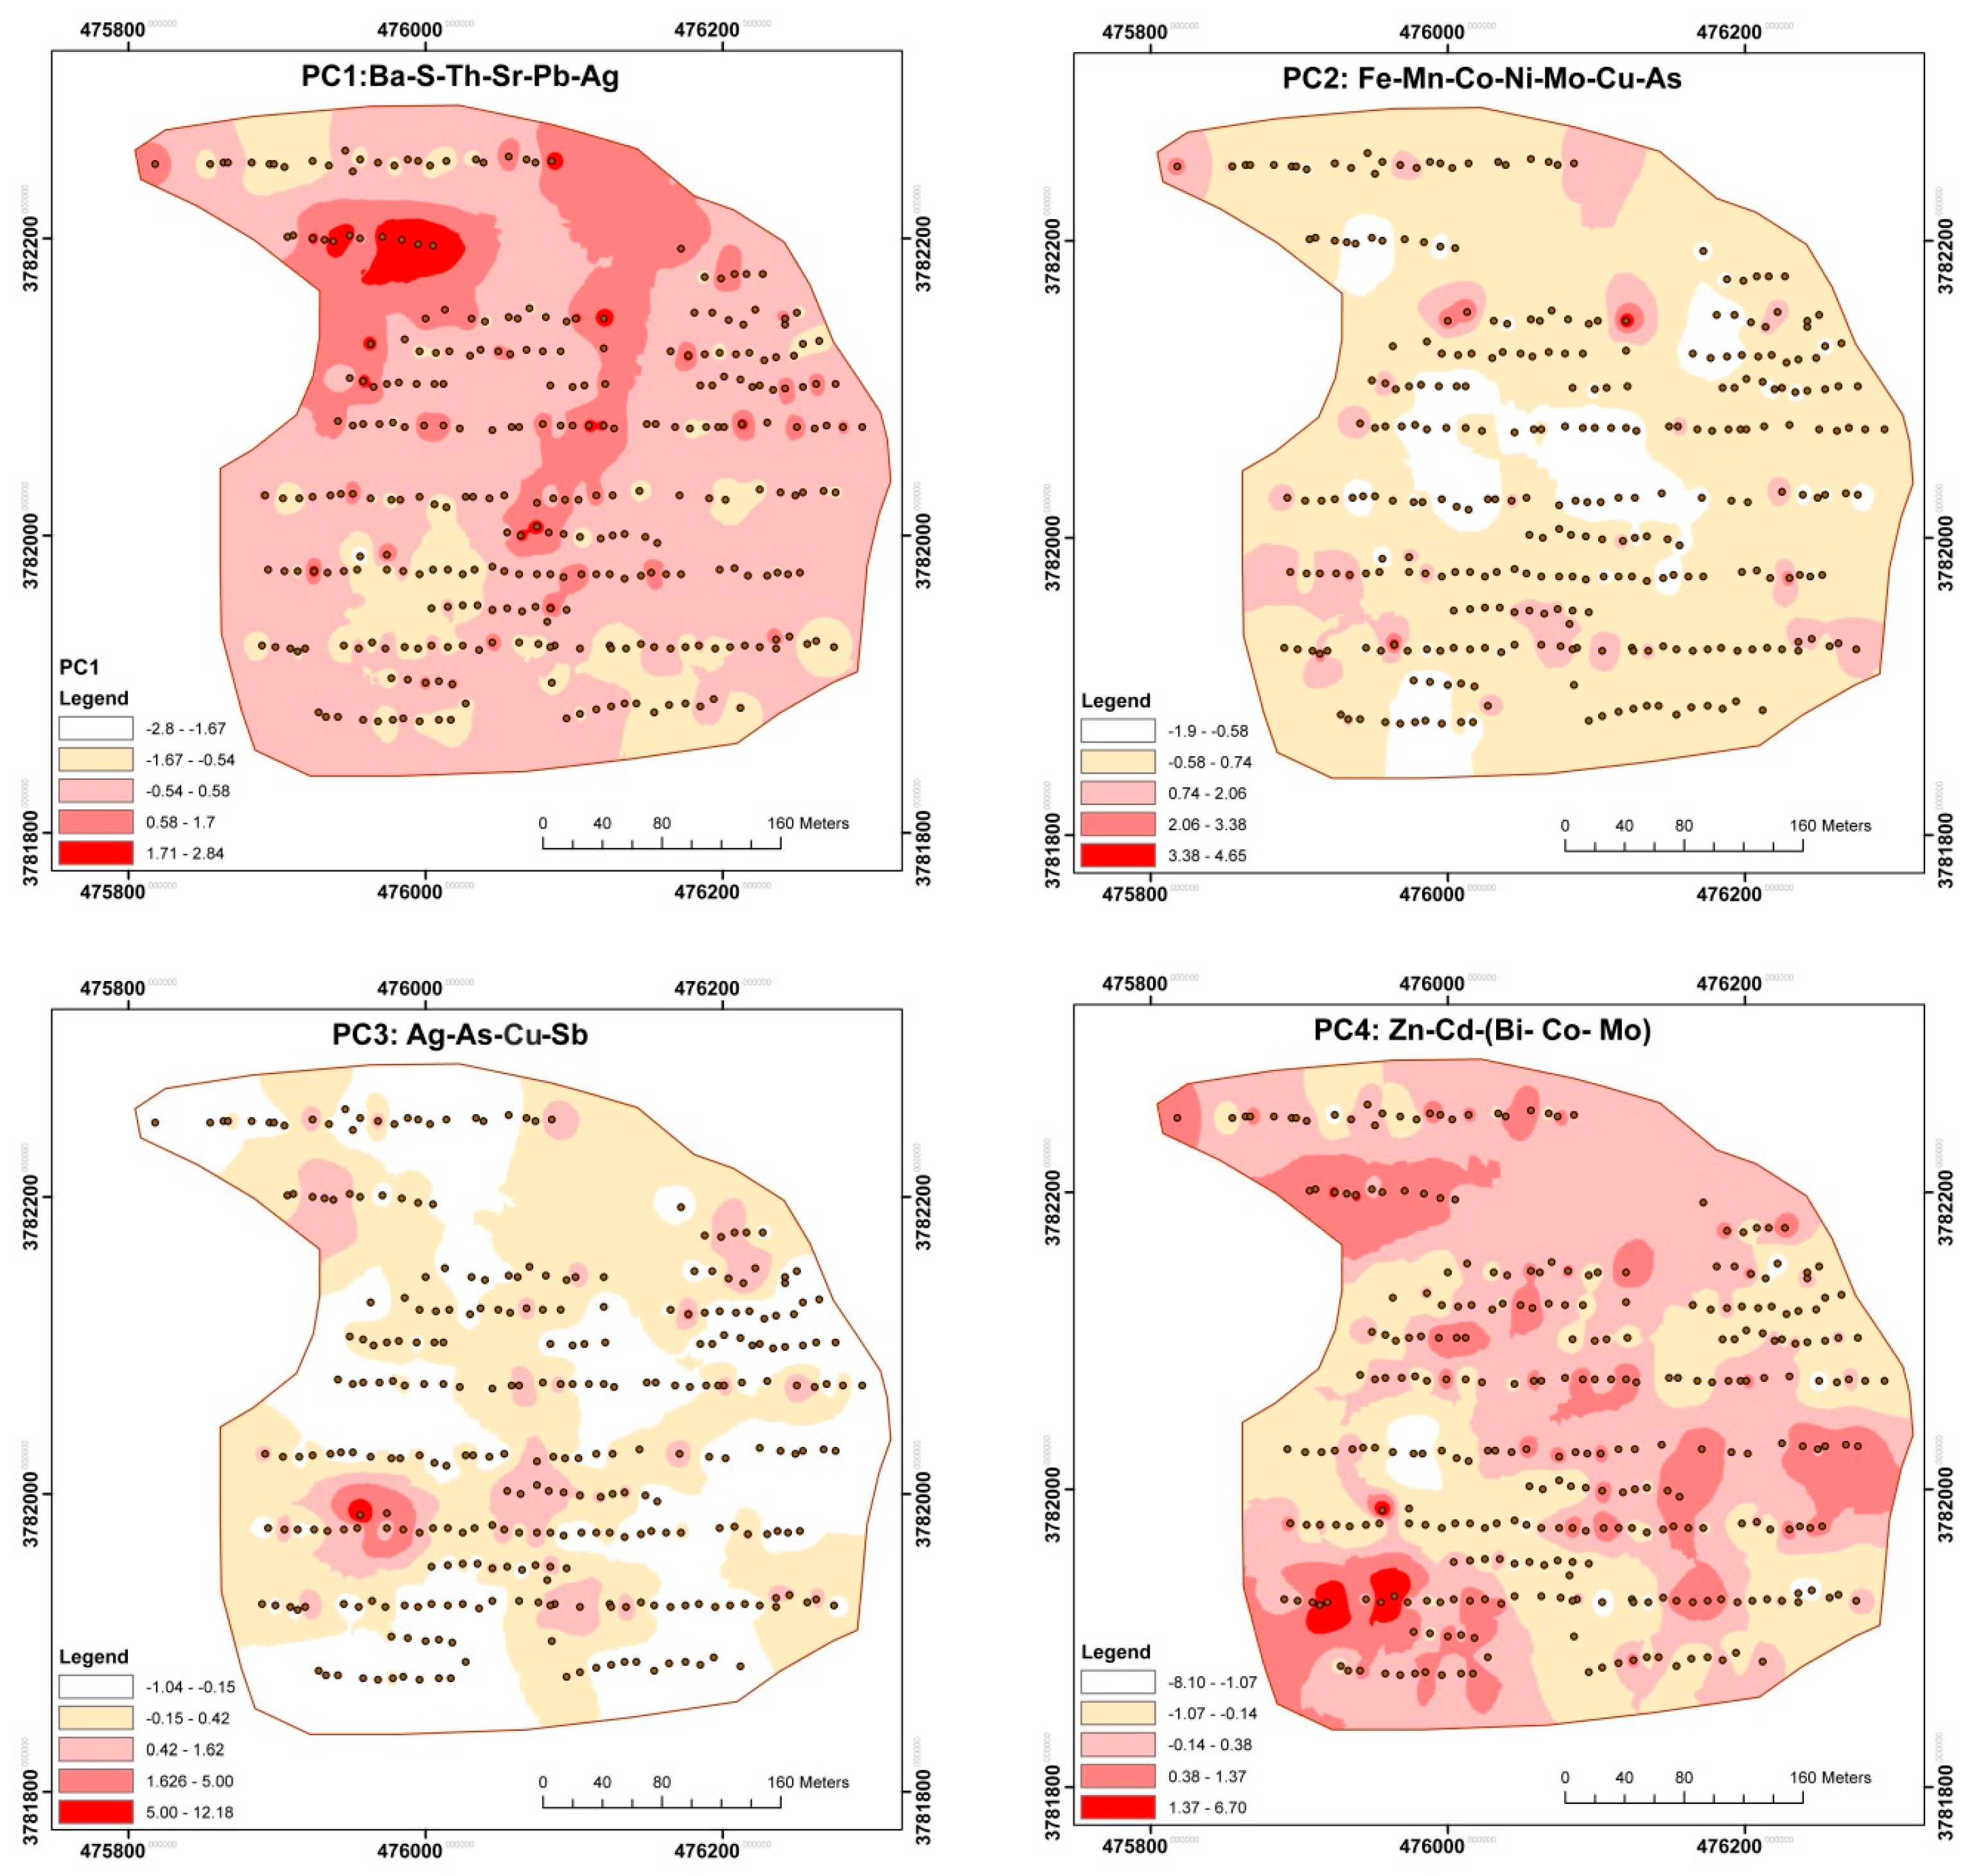
Figure 8.
(a) Scree plot of eigenvalues (higher than raw data line) using PCA on CLR from the tunnel samples in Block A of the Ravanj deposit; (b) Biplot of PC1 vs. PC2; (c) Biplot of PC2 vs. PC3; and (d) Biplot of PC3 vs. PC4.
Figure 8.
(a) Scree plot of eigenvalues (higher than raw data line) using PCA on CLR from the tunnel samples in Block A of the Ravanj deposit; (b) Biplot of PC1 vs. PC2; (c) Biplot of PC2 vs. PC3; and (d) Biplot of PC3 vs. PC4.
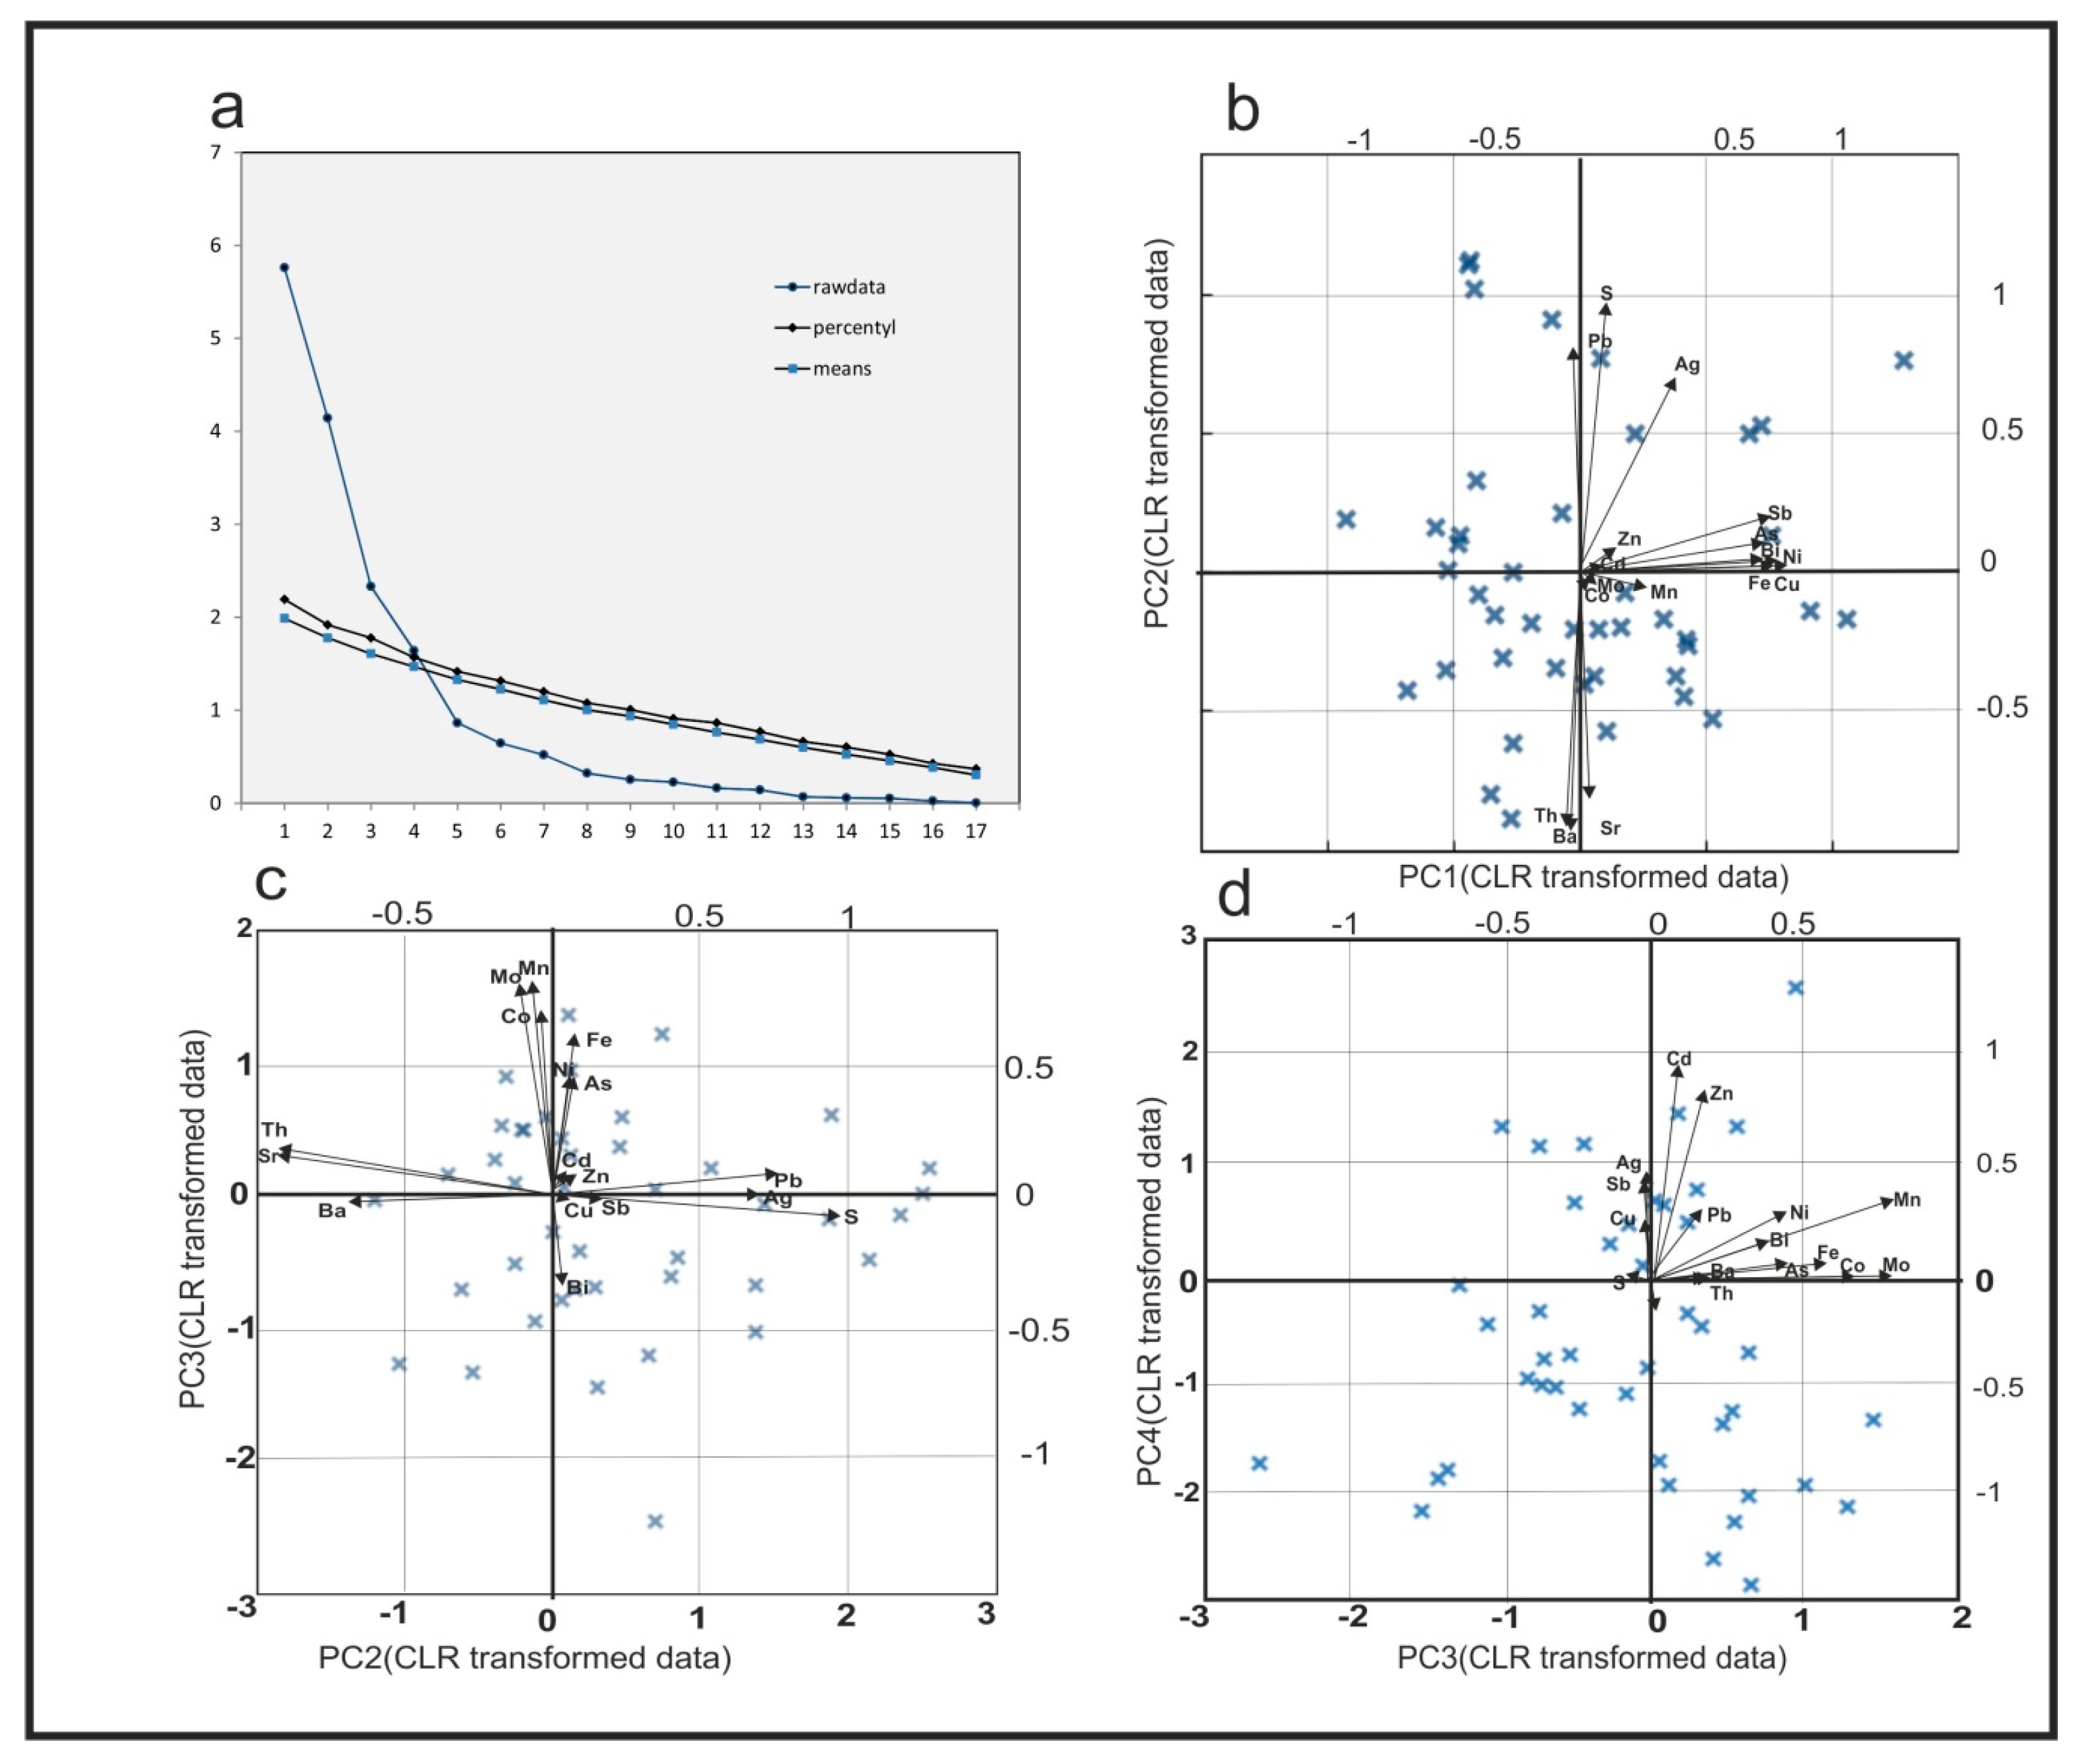
Figure 9.
(a) Ore potential map of Block A of the Ravanj deposit; and (b) cross section of the Block A along the orebody which intersected first and second anomalies.
Figure 9.
(a) Ore potential map of Block A of the Ravanj deposit; and (b) cross section of the Block A along the orebody which intersected first and second anomalies.

Table 1.
Summary of microthermometric data of the Ravanj deposit [16].
Table 1.
Summary of microthermometric data of the Ravanj deposit [16].
| Host Mineral | Inclusion Type | Tm, Carb | Tm, Clath (°C) | Te (°C) | Tm, Ice (°C) | Th (°C) | Salinity (wt % NaCl Equiv.) | N |
|---|---|---|---|---|---|---|---|---|
| Stage 2 calcite | L + V | - | - | - | −3.3/−13.8 | 123.7–204.8 | 5.2–17.9 | 55 |
| Stage 3 calcite | L + V | - | - | −37.2/−52.8 | −0.4/−19.8 | 120.7–220.4 | 0.66–22.2 | 21 |
| Barite | L + V | - | - | - | −1.8/11.9 | 141–200.8 | 2.95–15.95 | 17 |
| Stage 2 calcite | L1 + L2 + V | −56.7/−58.1 | 4.2/7.3 | - | - | 173–194.6 | 5.2–10.2 | 5 |
| Stage 3 calcite | L1 + L2 + V | −56.7/−57.8 | 1.9/6.3 | - | - | 177.1–202 | 6.87–13.2 | 3 |
Note: Tm, carb: first CO2 melting; Tm, clath: last clathrate melting; Th, CO2: melting temperature of CO2 phase; Te: first ice melting; Tm, ice: last ice melting; Th, total: total homogenization; Th: homogenization to liquid; Ts, NaCl: halite dissolution; N: number of measurements.
Table 2.
Statistical parameters for surface samples from Block A of the Ravanj deposit (in ppm). n, number of samples; Q1, 1st quartile; Q3, 3rd quartile; MAD, median of absolute deviation from data median; EF, enrichment factor.
Table 2.
Statistical parameters for surface samples from Block A of the Ravanj deposit (in ppm). n, number of samples; Q1, 1st quartile; Q3, 3rd quartile; MAD, median of absolute deviation from data median; EF, enrichment factor.
| n = 302 | Minimum | Q1 | Median | Q3 | Maximum | Mean | Std.dev. | MAD | Skewness | EF |
|---|---|---|---|---|---|---|---|---|---|---|
| Ag | 0.22 | 0.33 | 0.40 | 0.54 | 162.8 | 2.06 | 11.63 | 0.09 | 11.91 | 1.41 |
| As | 7.10 | 10.83 | 13.85 | 20.80 | 426.7 | 21.50 | 32.74 | 4.15 | 8.59 | 1.30 |
| Ba | 70.00 | 314.00 | 693.50 | 1876.25 | 28047 | 2235.88 | 4018.39 | 485.50 | 3.22 | 2.46 |
| Be | 0.2 | 0.28 | 0.31 | 0.35 | 0.52 | 0.32 | 0.05 | 0.03 | 0.75 | 1.2 |
| Bi | 0.22 | 0.44 | 0.46 | 0.49 | 1.12 | 0.47 | 0.06 | 0.02 | 5.09 | 0.93 |
| Ca | 324,579 | 367,052 | 380,302 | 391,574 | 405,603 | 377,820 | 16,769 | 11,682 | −0.76 | - |
| Cd | 0.12 | 0.25 | 0.26 | 0.27 | 2.10 | 0.28 | 0.12 | 0.01 | 11.07 | 1.17 |
| Ce | 6 | 7 | 8 | 9 | 12 | 8.2 | 1.40 | 1 | 0.55 | 0.78 |
| Co | 3.00 | 5.00 | 6.00 | 7.00 | 502 | 8.74 | 29.06 | 1.00 | 16.35 | 1.00 |
| Cr | 2 | 4 | 5 | 6 | 8 | 5.34 | 1.136 | 1.00 | 0.56 | 0.43 |
| Cu | 10.00 | 23.00 | 37.00 | 68.75 | 4971 | 114.67 | 396.4857 | 18.00 | 9.24 | 0.75 |
| Fe | 180.00 | 1750.75 | 2754.50 | 4510.25 | 170,931 | 5165.87 | 12,757.74 | 1150.50 | 9.83 | 0.93 |
| K | 1039 | 1600 | 1931 | 2409 | 4177 | 2061 | 658 | 414 | 0.93 | - |
| Mg | 2013 | 2332 | 2695 | 2974 | 4325 | 2713 | 477.5 | 334 | 0.89 | - |
| Mn | 194.00 | 481.00 | 669.00 | 941.00 | 5698 | 811.15 | 629.44 | 203.50 | 4.22 | 0.73 |
| Mo | 0.58 | 1.20 | 1.26 | 1.34 | 5.50 | 1.32 | 0.37 | 0.07 | 8.50 | 1.06 |
| Ni | 1.00 | 1.25 | 3.00 | 4.00 | 26 | 3.29 | 3.18 | 1.00 | 3.78 | 1.25 |
| P | 64 | 105 | 123 | 147 | 256 | 129 | 33.73 | 21 | 0.87 | 0.57 |
| Pb | 28.00 | 177.50 | 319.50 | 606.25 | 7272 | 754.21 | 1296.57 | 185.50 | 3.37 | 8.52 |
| Rb | 77 | 100 | 109 | 124 | 148 | 111 | 15.6 | 11 | 0.09 | 1.05 |
| S | 115.00 | 253.25 | 346.00 | 635.50 | 2690 | 588.73 | 558.24 | 131.00 | 1.85 | 1.67 |
| Sb | 0.93 | 1.15 | 1.25 | 1.46 | 7527 | 37.90 | 437.49 | 0.13 | 16.75 | 1.01 |
| Sr | 295.00 | 505.00 | 550.00 | 610.75 | 1747 | 594.53 | 173.59 | 51.50 | 3.06 | 1.11 |
| Th | 0.38 | 3.20 | 6.80 | 18.73 | 275 | 21.47 | 39.24 | 4.55 | 3.68 | 2.52 |
| Ti | 22 | 43 | 54 | 66.75 | 120 | 56 | 17.2 | 12 | 0.66 | 0.85 |
| V | 6 | 9 | 11 | 12 | 19 | 10.9 | 2.37 | 2 | 0.76 | 0.76 |
| W | 1.15 | 1.3 | 1.34 | 1.37 | 1.61 | 1.34 | 0.056 | 0.04 | 0.76 | 0.97 |
| Zn | 10.00 | 32.00 | 50.00 | 81.00 | 1487 | 79.62 | 129.23 | 21.00 | 7.50 | 2.88 |
Table 3.
Statistical parameters for tunnel samples from 2391 m and 2353 levels (n = 42) from Block A of the Ravanj deposit (in ppm). n, number of samples; Q1, 1st quartile; Q3, 3rd quartile; MAD, median of absolute deviation from data median; EF, enrichment factor.
Table 3.
Statistical parameters for tunnel samples from 2391 m and 2353 levels (n = 42) from Block A of the Ravanj deposit (in ppm). n, number of samples; Q1, 1st quartile; Q3, 3rd quartile; MAD, median of absolute deviation from data median; EF, enrichment factor.
| n = 42 | Minimum | Q1 | Median | Q3 | Maximum | Mean | Std.dev. | MAD | Skewness | EF |
|---|---|---|---|---|---|---|---|---|---|---|
| Ag | 7.04 | 23.27 | 33.56 | 46.11 | 112.94 | 37.58 | 23.00 | 12.12 | 1.47 | 235.9 |
| As | 13.5 | 28.1 | 49.2 | 69.65 | 317 | 68.77 | 69.74 | 21 | 2.36 | 4.0 |
| Ba | 322 | 1149 | 2107 | 3477.5 | 7753 | 2470.88 | 1622.93 | 1087 | 1.12 | 24.8 |
| Bi | 0.39 | 0.43 | 0.46 | 0.51 | 0.61 | 0.47 | 0.05 | 0.04 | 0.55 | 19.1 |
| Cd | 0.3 | 0.4 | 0.53 | 0.78 | 3.02 | 0.69 | 0.50 | 0.16 | 2.85 | 118.6 |
| Co | 5 | 7 | 10 | 12 | 151 | 13.34 | 21.58 | 2 | 6.25 | 1.1 |
| Cu | 129 | 622 | 1250 | 1849 | 6654 | 1643.88 | 1500.45 | 636 | 1.70 | 4.0 |
| Fe | 2165 | 7747 | 10,717 | 18,731 | 36,970 | 13,993.6 | 8783.16 | 5853 | 0.89 | 2.9 |
| Mn | 444 | 1046 | 1404 | 1774 | 4169 | 1592.46 | 783.56 | 368 | 1.34 | 1.1 |
| Mo | 1.24 | 1.67 | 1.99 | 5.2 | 16 | 3.97 | 3.85 | 0.46 | 1.89 | 1.1 |
| Ni | 2 | 7.5 | 12 | 19 | 47 | 14.67 | 10.03 | 6 | 1.26 | 6.0 |
| Pb | 10,208 | 22,174.5 | 31,953 | 63,297.5 | 73,763 | 40,793.93 | 20,879.95 | 17,046 | 0.11 | 1665.8 |
| S | 1917 | 3013 | 4567 | 7386 | 26,833 | 6429.58 | 5303.43 | 1851 | 2.25 | 27.1 |
| Sb | 1.85 | 46.335 | 80.73 | 122.035 | 350.22 | 100.42 | 74.61 | 36.92 | 1.47 | 69.0 |
| Sr | 755 | 1218.5 | 1737 | 2408 | 5891 | 2006.11 | 1105.60 | 563 | 1.96 | 1.9 |
| Th | 4.5 | 11.4 | 19.5 | 32.45 | 77 | 23.23 | 15.54 | 10.7 | 1.31 | 14.8 |
| Zn | 100 | 236.5 | 354 | 753.5 | 2213 | 557.86 | 442.33 | 183 | 1.70 | 211.0 |
Table 4.
Results of Robust PC analyses of surface samples from Block A of the Ravanj deposit (using the broken-stick method, [45]). Significant values are in bold. Only PCs with eigenvalues > 1 are displayed.
Table 4.
Results of Robust PC analyses of surface samples from Block A of the Ravanj deposit (using the broken-stick method, [45]). Significant values are in bold. Only PCs with eigenvalues > 1 are displayed.
| Rotated Component Matrix of Surficial Samples | ||||
|---|---|---|---|---|
| Component | 1 | 2 | 3 | 4 |
| Ag | 0.451 | 0.161 | 0.749 | −0.149 |
| As | 0.193 | 0.559 | 0.626 | 0.138 |
| Ba | 0.905 | 0.104 | 0.064 | 0.083 |
| Bi | 0.038 | 0.380 | 0.085 | 0.473 |
| Cd | 0.142 | 0.056 | 0.089 | 0.714 |
| Co | 0.098 | 0.778 | 0.095 | 0.475 |
| Cu | 0.329 | 0.565 | 0.570 | −0.214 |
| Fe | 0.154 | 0.865 | 0.135 | 0.207 |
| Mn | −0.070 | 0.829 | -0.019 | −0.012 |
| Mo | 0.125 | 0.634 | 0.004 | 0.443 |
| Ni | 0.127 | 0.752 | 0.214 | 0.011 |
| Pb | 0.715 | 0.069 | 0.231 | 0.076 |
| S | 0.945 | 0.078 | 0.095 | -0.006 |
| Sb | −0.147 | −0.072 | 0.789 | 0.144 |
| Sr | 0.757 | 0.253 | 0.266 | −0.283 |
| Th | 0.823 | 0.052 | 0.104 | −0.041 |
| Zn | 0.299 | 0.119 | 0.053 | 0.772 |
| Component | Eigenvalues | Percent of Variance | Cumulative Percent | |
| 1 | 6.56 | 38.6 | 38.6 | |
| 2 | 3.15 | 18.5 | 57.1 | |
| 3 | 2.14 | 12.6 | 69.7 | |
| 4 | 1.13 | 5.67 | 75.3 | |
Table 5.
Results of Robust PC analyses of tunnel samples (n = 42) from Block A of the Ravanj deposit (by using the broken-stick method, [45]). Significant values are shown in bold. Only PCs with eigenvalues > 1 are displayed.
Table 5.
Results of Robust PC analyses of tunnel samples (n = 42) from Block A of the Ravanj deposit (by using the broken-stick method, [45]). Significant values are shown in bold. Only PCs with eigenvalues > 1 are displayed.
| Rotated Component Matrix of Underground Tunnel Samples | ||||
|---|---|---|---|---|
| Component | 1 | 2 | 3 | 4 |
| Cu | 0.81 | 0.09 | −0.07 | 0.24 |
| Ni | 0.78 | 0.16 | 0.45 | 0.25 |
| Fe | 0.75 | 0.04 | 0.60 | 0.10 |
| As | 0.74 | 0.15 | 0.46 | 0.11 |
| Sr | 0.11 | −0.73 | −0.02 | −0.17 |
| Bi | 0.72 | −0.13 | 0.35 | −0.18 |
| Sb | 0.70 | 0.20 | −0.07 | 0.42 |
| S | 0.15 | 0.95 | −0.13 | 0.05 |
| Ba | −0.11 | −0.95 | 0.18 | 0.03 |
| Th | −0.07 | −0.94 | 0.20 | 0.02 |
| Pb | −0.16 | 0.77 | 0.18 | 0.31 |
| Ag | 0.39 | 0.70 | −0.01 | 0.45 |
| Mn | 0.24 | −0.11 | 0.79 | 0.31 |
| Mo | 0.04 | −0.13 | 0.78 | 0.03 |
| Co | 0.09 | −0.08 | 0.68 | 0.05 |
| Cd | 0.09 | 0.05 | 0.14 | 0.92 |
| Zn | 0.20 | 0.21 | 0.23 | 0.84 |
| Component | Eigenvalues | Percent of Variance | Cumulative Percent | |
| 1 | 4.25 | 25.02 | 25.02 | |
| 2 | 3.97 | 23.38 | 48.40 | |
| 3 | 3.07 | 18.06 | 66.46 | |
| 4 | 2.39 | 14.04 | 80.50 | |
© 2017 by the authors. Licensee MDPI, Basel, Switzerland. This article is an open access article distributed under the terms and conditions of the Creative Commons Attribution (CC BY) license (http://creativecommons.org/licenses/by/4.0/).
Share and Cite
MDPI and ACS Style
Nejadhadad, M.; Taghipour, B.; Karimzadeh Somarin, A. The Use of Univariate and Multivariate Analyses in the Geochemical Exploration, Ravanj Lead Mine, Delijan, Iran. Minerals 2017, 7, 212. https://doi.org/10.3390/min7110212
AMA Style
Nejadhadad M, Taghipour B, Karimzadeh Somarin A. The Use of Univariate and Multivariate Analyses in the Geochemical Exploration, Ravanj Lead Mine, Delijan, Iran. Minerals. 2017; 7(11):212. https://doi.org/10.3390/min7110212
Chicago/Turabian StyleNejadhadad, Mostafa, Batoul Taghipour, and Alireza Karimzadeh Somarin. 2017. "The Use of Univariate and Multivariate Analyses in the Geochemical Exploration, Ravanj Lead Mine, Delijan, Iran" Minerals 7, no. 11: 212. https://doi.org/10.3390/min7110212
Note that from the first issue of 2016, this journal uses article numbers instead of page numbers. See further details here.