Quantification and Prediction of Bulk Gold Fineness at Placer Gold Mines: A New Zealand Example

1
Department of geology, University of Otago, P.O. Box 56, Dunedin 9054, New Zealand
2
Waikaia Gold Ltd., Gore 9777, New Zealand
*
Author to whom correspondence should be addressed.
Minerals 2017, 7(11), 226; https://doi.org/10.3390/min7110226
Submission received: 15 October 2017
/
Revised: 5 November 2017
/
Accepted: 16 November 2017
/
Published: 19 November 2017
(This article belongs to the Special Issue Geometallurgy)
Abstract
:This study documents the bulk Au fineness (Au parts per thousand) of the bullion from a placer gold mine in southern New Zealand. The compositions of doré bars produced approximately every 10 days over nearly three years is compared to the range of compositions of gold particles which have been extracted. Silver is the principal impurity in the gold, and the doré bars contained 2–3 wt % Ag over the period examined. At the scale of a typical individual 0.5 mm gold particle, there are three different types of gold: an Ag-bearing core (2–9 wt % Ag), a 10–50 µm wide Ag-poor rim (typically <1 wt % Ag), and micron scale overgrowth gold (0% Ag). The overgrowths are volumetrically negligible, and the average Ag content of a gold particle is controlled principally by the proportions of core and rim gold. The rims have been formed by recrystallisation of deformed core gold, with associated leaching of the Ag from the recrystallised gold. The volumetric proportion of cores has decreased with increasing flattening of gold particles, and highly flattened and folded flakes have little or no remnant cores. The bulk Au fineness of doré bars from the mine has decreased from ~980 to ~970 as the mine progressed upstream in a Pleistocene paleochannel because the upstream gold has been less flattened than the downstream gold.
1. Introduction
Metallic gold in mineral deposits generally contains other metals in addition to Au, especially silver (Ag), as natural amalgams [1,2,3,4]. The proportion of gold in ore is typically recorded as Au fineness (Au parts per thousand by weight), and this can vary from pure gold (Au fineness = 1000) to electrum that contains more than 50% Ag (Au fineness < 500) [3,4,5]. Such variations in Au fineness are important for the economics of a mine and are therefore of geometallurgical significance during mine planning and development. The principal on-site products of gold mining operations are doré bars formed from the melting of concentrated gold, and the Au fineness of these doré bars reflects the average bulk Au fineness of the ore [2]. This average bulk Au fineness may be different from that observed in individual gold particles observed at the hand specimen scale at the exploration stage because of geologically-driven variability in the bulk ore. Hence, there is a need for geometallurgical studies of the relationships between the different observational scales of Au fineness: single gold particles versus bulk mine products.
Gold particles in placer deposits can display very wide ranges in Au fineness for a range of reasons, principally related to the following factors: (a) inherent variability of a particular basement source; (b) erosional derivation of gold particles from multiple sources with differing Au fineness ranges; and/or (c) variations in fineness as a result of transport-related processes [6,7,8,9,10,11,12,13,14,15,16]. Variations in placer particle Au fineness, and the nature and proportions of amalgamated minor metals, have been used extensively for relating detrital gold to sources(s) for exploration purposes [9,11,13,14,15,17,18]. However, there has been little previous work on geometallurgical aspects of placer gold compositions, especially with respect to relationships between gold particle Au fineness variations and the Au fineness of bulk mine production. The little previous work that has been done has been directed primarily at relating compositions of ancient Au artefacts to generalised potential regional goldfield sources [19,20,21,22]. These artefacts could be seen as an ancient equivalent of the doré bars of modern mines.
The principal aim of this study is to link bulk gold compositional data from doré bars at a placer gold mine to the compositions of the natural gold particles from which these bars were derived. In particular, we investigate which of the above reasons for gold particle compositional variations are most responsible for variations in compositions of doré bars: source-related compositional variations, or transport-related processes. We show that despite some wide ranges in Au fineness at the particle scale, the bulk Au fineness is broadly consistent over large volumes of processed alluvial gravel. Further, there has been a small but systematic change in bulk Au fineness at the mine with time, and our observations provide some explanation and quantification of the reasons behind this bulk Au fineness change. These observations at the particle and mine scales, and the interpretations arising from the observations, are relevant to geometallurgical studies of placer gold exploration projects and mining operations in general.
2. General Setting
The mine from which the bulk Au data for doré bars were obtained is located in southern New Zealand, on the southwestern side of the Otago Schist goldfield (Figure 1a–c and Figure 2a) [23]. This goldfield is one of the giant placer goldfields of the circum-Pacific region, with historic production of >8 million ounces (~250 tonnes) of gold [24,25]. The Waikaia mine of this study has been developed in the narrow Waikaia River valley that is surrounded by high (up to 1800 m) actively rising mountain ranges consisting of schist basement (Figure 1b). Cenozoic-Holocene uplift of these ranges has shed gold from basement sources and recycled detrital gold from older uplifted auriferous sediments [26], and some of that gold was transported south-west and focused into the Waikaia valley (Figure 1b).
The Waikaia mine has extracted gold from a Late Pleistocene paleochannel (~100 ka) that is subparallel to the modern Waikaia River course (Figure 1c and Figure 2a) [23]. Placer gold is enriched at the base of the paleochannel, where it rests on Cenozoic sediments and/or schist basement. The gold-bearing basal gravel are buried beneath ~20 m of younger gravels, which are removed during mining (Figure 2a). The mine was initiated at the southern end of the paleochannel and is centred on a processing plant floating in a pond at the base of the excavation (Figure 1 and Figure 2a). The active excavation site, the pond, and the floating plant have migrated progressively upstream (Figure 1c and Figure 2a), and the stripped overburden gravels have been used to fill the excavation behind the active site and rehabilitate the surface for revegetation.
The gold extracted from the mine has particle sizes that range from ~50 μm to 2 mm, with most particles consisting of thin flattened flakes between 0.2 mm and 1 mm across (Figure 1d and Figure 2b) [23]. The mine has produced 10–12 kg of doré bar gold per week (Figure 2c), and assay data were obtained from a shipment of doré bars to a mint every 1–2 weeks (Figure 3a,b).
3. Approach and Methods
This study was conducted using two samples (~0.1 g) of natural gold flakes obtained from the bulk mine concentrate: one from soon after the mine was opened in 2014, and one in August 2017 (Figure 4a–e). These run-of-mine samples were selected randomly, and have been used in this study to characterise the nature and composition of the gold at the scale of individual flakes, in the context of the bulk assay data obtained from the doré bars produced around the times of sampling and between those times (Figure 3a,b). The samples of flakes provide insight into the key parameters that contribute to the internal variability of the gold, and the bulk assay data show the results of averaging all the combined concentrated flakes for a 1–2 week production period.
To examine the details of the internal structure of the flakes, mounting blocks were produced by sprinkling subsamples of gold on to sticky tape to ensure that most flakes were at least partly standing on an edge, then embedding the flakes in resin. The resin blocks were ground to expose the interiors of most of the gold flakes, revealing 102 particles in the 2014 sample, and 143 particles in the 2017 sample. The exposed surfaces were polished to remove grinding scratches. The polished surfaces were then etched with 50% aqua regia to remove the smeared polishing surface layer and expose the internal textures (Figure 4a–e) [16]. Due to the small subsample sizes used in preparing these resin blocks, compared to bulk gold recovery (Figure 2b), we have no way of knowing how representative these subsamples are of the particular production periods, and we make no claim that there are discernible differences between the studied subsamples in Figure 4a–e. Rather, we present the images and subsequent data to show that there are similar features in gold particles both subsamples.
The internal textures were examined with an incident light microscope, then the mounted blocks were carbon-coated and examined in a Zeiss scanning electron microscope (SEM) with energy dispersive analytical facility (EDS) at the Otago Centre for Electron Microscopy, University of Otago [16]. Electron backscatter diffraction (EBSD) maps of the crystallographic orientations of grains within gold particles were obtained by SEM using the instrument, settings and preparation procedures described in [16]. EBSD map pixels were digitally coloured according to crystallographic Euler angles.
The analytical component of this study was focussed on variations in Ag contents determined using surface mapping and line traverses that were calibrated with spot analyses using a 3 μm electron beam at 15 kV for 20 s counting time. Spot analyses have a detection limit of ~0.5 ± 0.5 wt % Ag, and Ag contents <1 wt % are difficult to quantify in this material because of significant background interference. In addition, small (μm scale) deposits of Ag-rich residues from the aqua regia etching remain in some cracks and polishing pits. The presence of these Ag-rich residues precludes more detailed and higher precision electron probe microanalysis. No Hg was detectable during these analyses as the low Hg levels are obscured by substantial overlap of the Au spectrum on the Hg spectrum in the EDS system.
The external textures of the gold particles were examined with a light stereoscopic microscope and the Zeiss SEM. Spot analyses of Ag contents of the exterior surfaces were obtained by the same methods as above, although these are less reliable as the exterior surface were not planar or oriented exactly perpendicular to the electron beam.
4. Doré Bar Compositions
The gold doré bars have a fineness between 970 and 980 parts per thousand Au, and compositions remained in this range throughout the studied mining period (Figure 3a). However, there was a general decrease in fineness as the mine site migrated upstream in the paleochannel (Figure 3a). This fineness decrease, while minor, was particularly pronounced during the last year of data recording (Figure 3a). It was this relatively pronounced change in fineness that prompted the present more detailed analysis of the doré bars, showing that they contain Ag as the principal impurity (2–3 wt %; Figure 3b). There was a distinct increase in the Ag content of the doré bars over time, especially over the last year of data, and this Ag increase accounts for essentially all of the observed change in bulk fineness of the doré bars (Figure 3a,b). The doré bars also contain 0.2 wt % Hg [23]. Minor additional Hg was vaporised during the production of the doré bars on the mine site.
5. Internal Gold Textures and Compositions
5.1. Cores and Rims
Gold particles, when viewed in sections, typically consist of distinctly separate cores and rims that were accentuated by the aqua regia etching (Figure 4a–e). Differences in the appearances of cores in Figure 4a–e are partly a result of different degrees of etching: the August 2017 sample was etched slightly longer than the October 2014 sample, and within these samples there was differential etching of variably exposed gold crystal faces. The rims, which are generally 20–50 μm thick and continuous around the exteriors of particles, were etched to lesser degrees than the cores in both samples.
The cores vary in size depending on the overall shapes of particles, and the most flattened flakes have cores that are only a few microns wide and strongly elongated parallel to flake long dimensions (Figure 4b,d,e). These flattened flakes are dominated volumetrically by their rims, and some such flake have little or no core visible in sections. Less flattened particles have relatively large cores, and these particles are dominated volumetrically by their cores (Figure 4a–e). Some of the observed sections are undoubtedly cut oblique to the shortest dimensions of the particles, and these sectional views yield an appearance of wider cores than would a perpendicular view. Nevertheless, there is clearly a wide range of proportions of core and rim in the particles from both of the gold samples examined (Figure 4a–e).
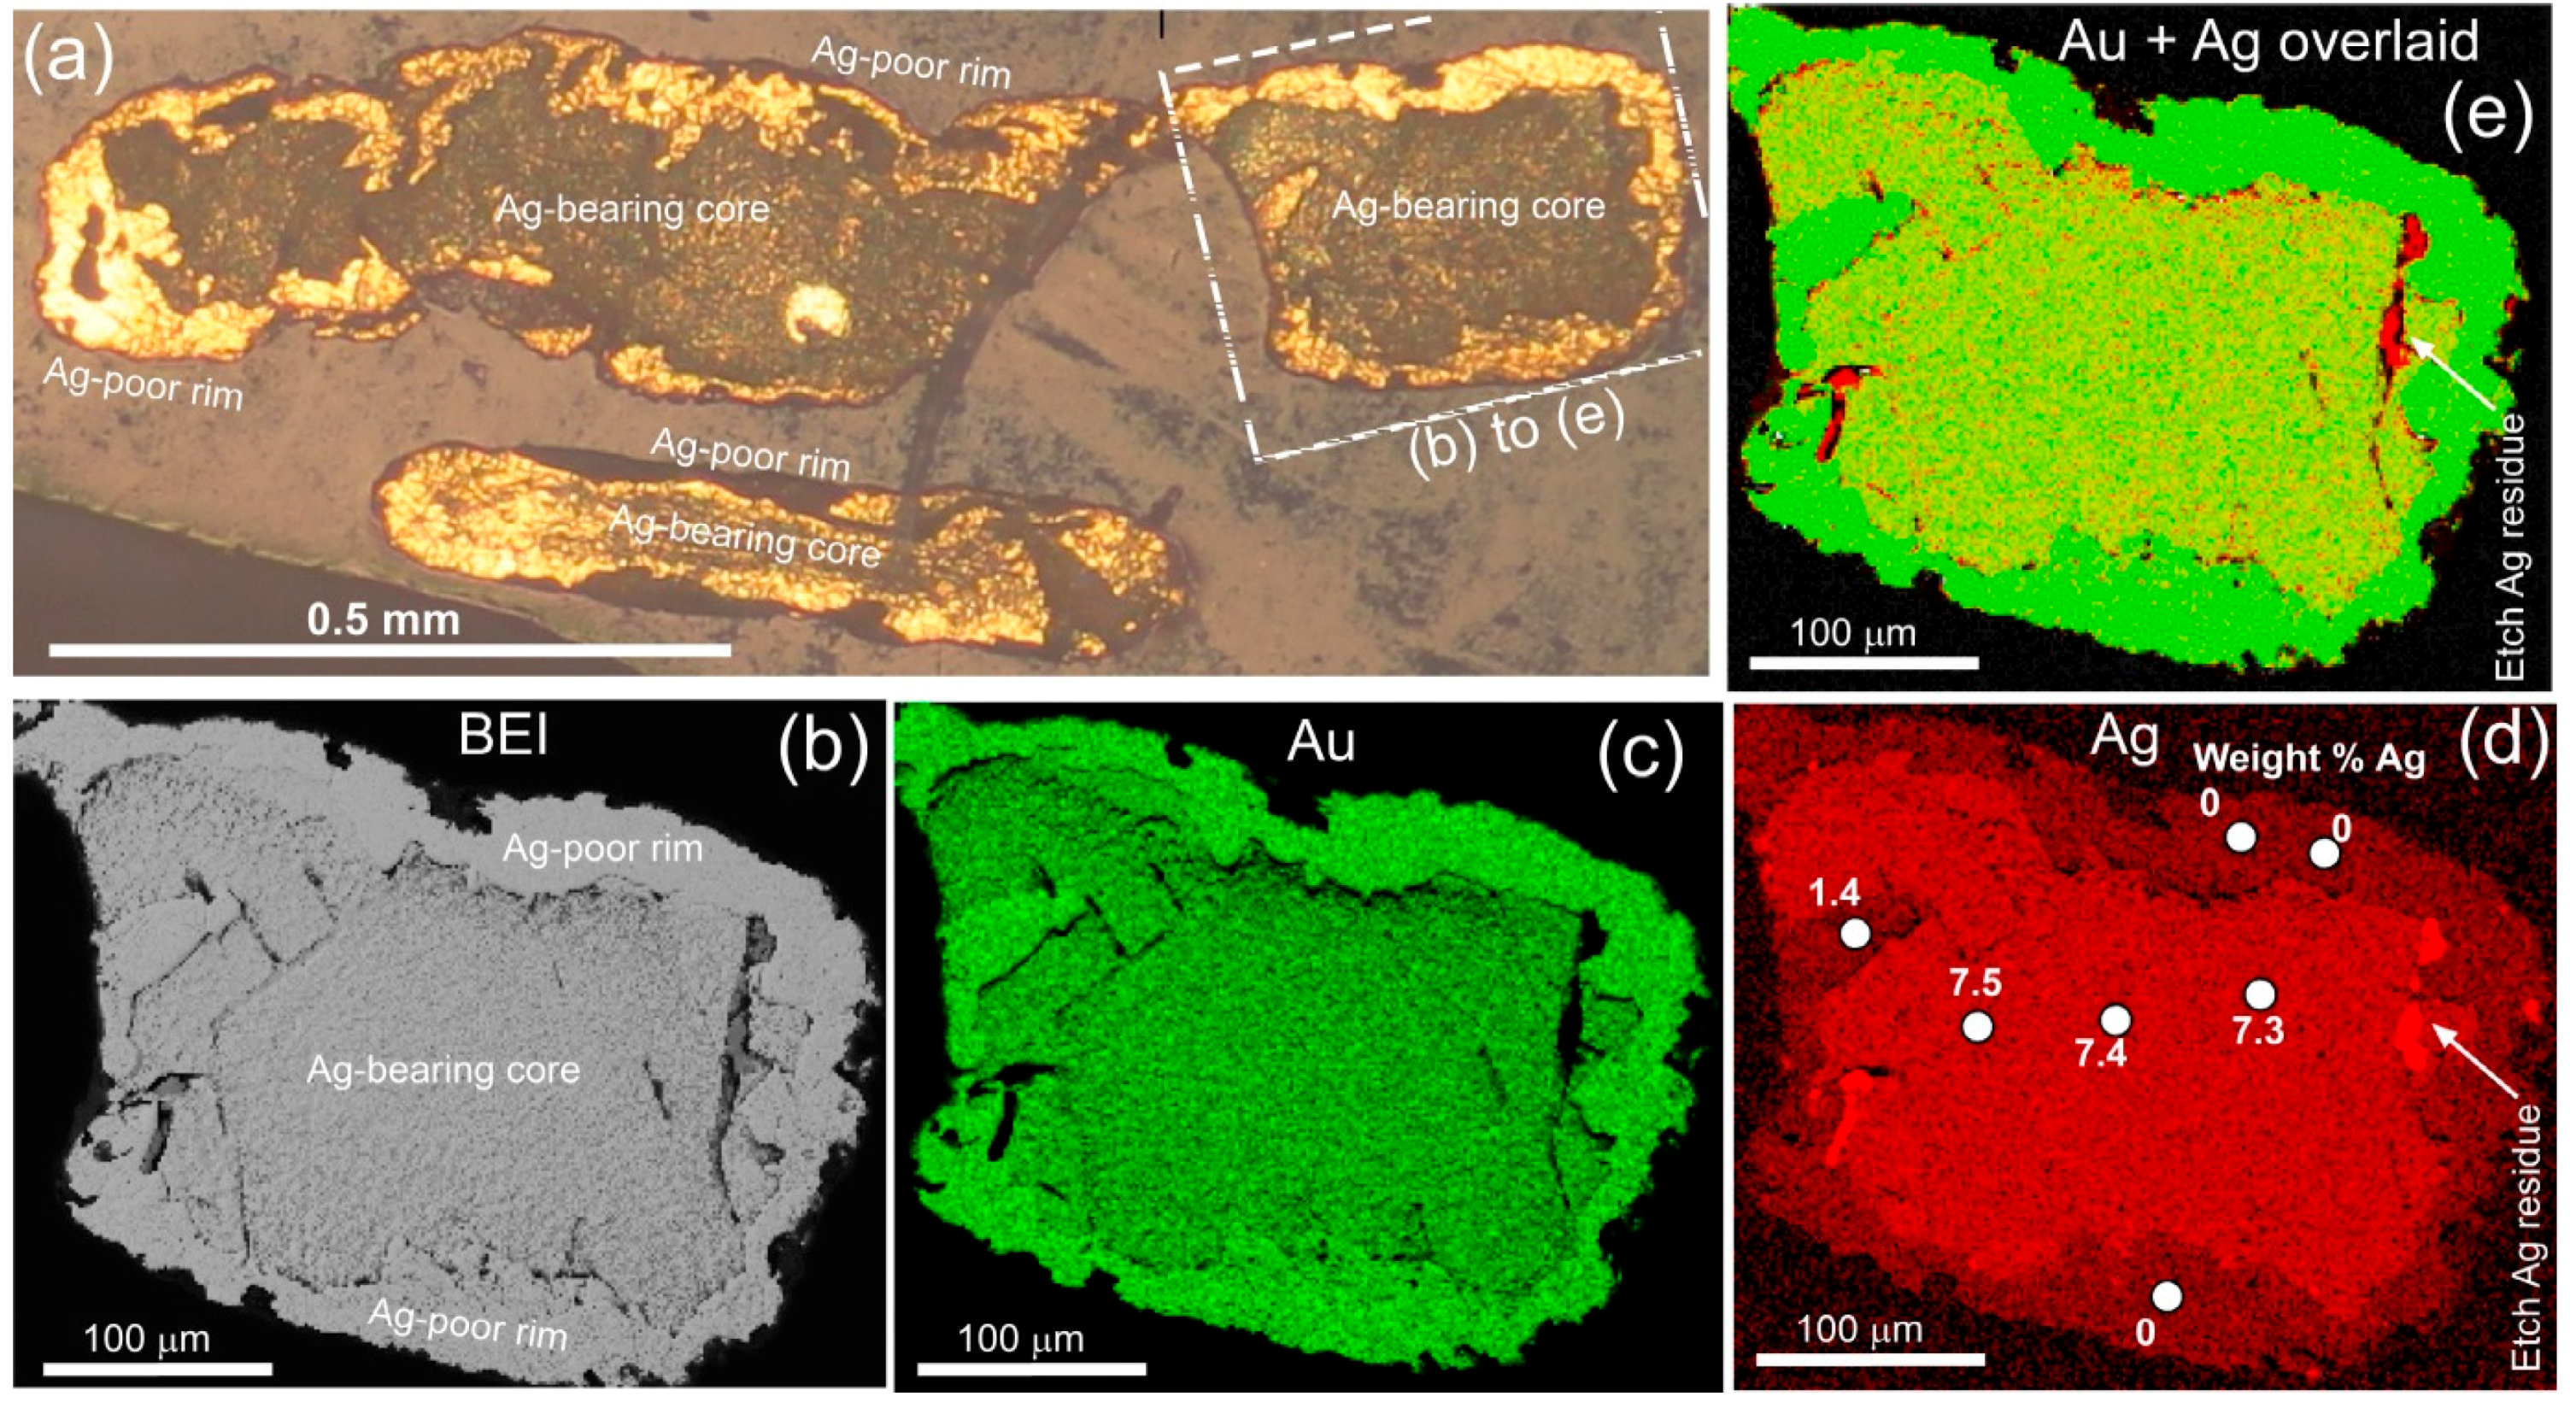
Cores and rims have clearly different Ag contents, with rims having little or no detectable Ag and cores having relatively elevated Ag contents (Figure 5a–d and Figure 6a–d). The cores have internally constant Ag contents, which generally vary by <1 wt % Ag from point to point (Figure 5b,d and Figure 6d). However, different particles have distinctly different core Ag contents that range from 2 to 9 wt % (Figure 5b,d and Figure 6d). Most particles have core Ag contents between 3 wt % and 6 wt %. Particles with cores that have the highest Ag contents have been more deeply etched than those with low core Ag contents, and this Ag-controlled differential etching has contributed to the textural differences between cores and the Ag-poor rims (Figure 5a–d and Figure 6a–d). The etching of high-Ag cores has resulted in more abundant Ag-rich etching artefacts on the particle surfaces, that further enhances the textural distinctions between cores and rims (Figure 5b and Figure 6a–d). At least some of the variations in the apparent Ag contents of cores in analytical transects across particles are a result of this surficial contamination, as well as significant background noise (e.g., Figure 5b–d).
5.2. Grain Structure
The gold particles are made up of intergrown grains with divergent crystallographic orientations. These divergent orientations are displayed in EBSD maps of typical core and rim gold (Figure 7a). The different colours on these maps depict grains with different crystallographic orientations and sharp intervening grain boundaries (Figure 7a–c). In addition, deformed crystal structures are shown on the maps as gradational changes in colour across individual grains (Figure 7a). Hence, the EBSD maps can define the grain shapes and sizes within the gold particles (Figure 7a–c).
The EBSD maps show the strong contrasts in grain size between particle rims (typically 1–20 μm) and particle cores (typically 50–200 μm). Further, the rim grains are generally undeformed internally, whereas the core grains are almost all deformed internally to some extent (Figure 6a,c). Accurate delineation of grain boundaries in a particle rim (Figure 7a) enabled targeting of the clear centres of grains for spot analyses, thereby avoiding Ag-bearing residues that preferentially accumulated in cracks and along grain boundaries. The results of some of these targeted spot analyses showed that there was no detectable Ag in that rim gold. Similarly, a flattened flake with no recognisable core consists entirely of recrystallised rim gold with no detectable Ag (Figure 7b,c).
6. External Gold Particle Textures
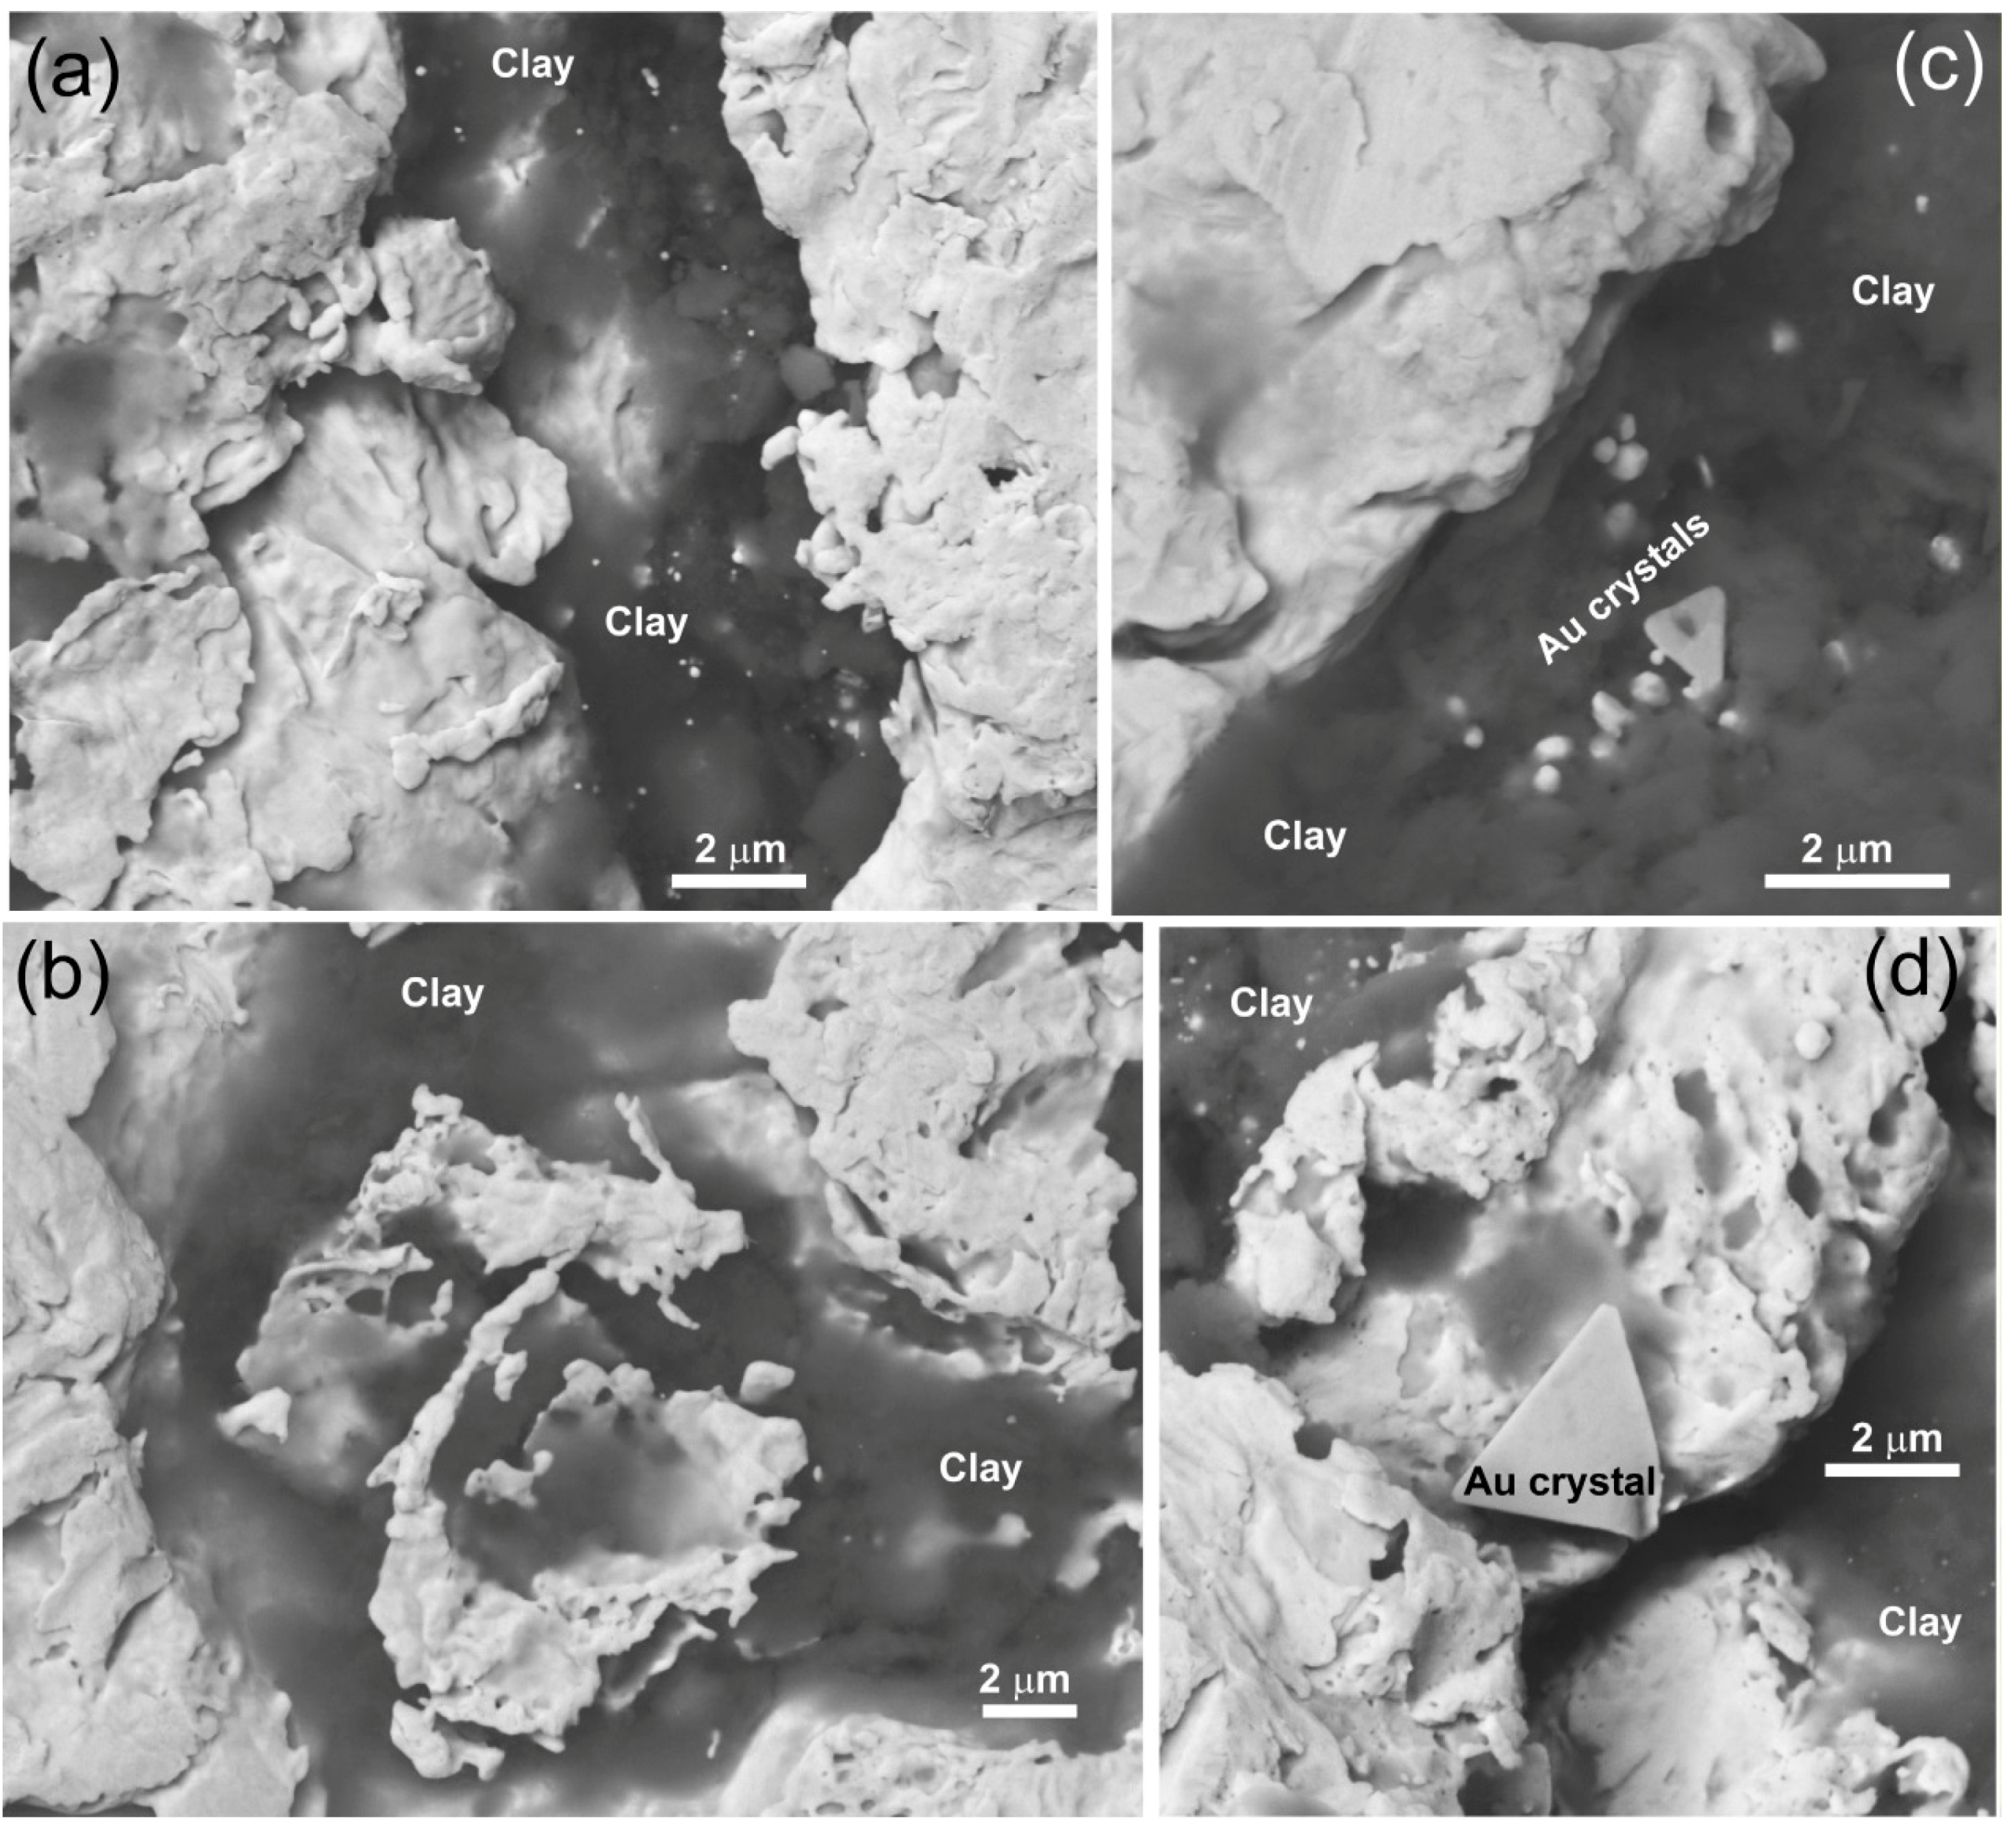
The exterior surfaces of the gold particles have been extensively rounded and smoothed by transport in the fluvial system. This rounding and smoothing is accompanied by flattening and folding of most of the particles, and folded flakes have been further rounded and flattened after folding. Some minor indentations and cavities remain on particle surfaces, and many of these are partially filled with clay minerals (Figure 8a–d). Angular gold particles with more equant shapes, some with attached angular quartz particles, are commonly found in the gold concentrates, but these form only a minor component (<<1%) of the concentrates.
Small (micron and submicron scale) gold overgrowths have formed on the exterior surfaces of many of the flakes, particularly in cavities where they commonly adhere to and are intergrown with clay minerals (Figure 8a–d). The gold overgrowths are typically irregular in shape, although some have triangular or dodecahedral shapes (Figure 8b,c). Overgrowth gold deposits locally merge into gold plates that coat larger areas (1–10 μm2) but are only ~1 μm thick (Figure 8a–d). The overgrowths and the underlying exterior gold flake surfaces have no detectable Ag in EDS spot analyses. Ag-poor overgrowths like those observed on this Waikaia mine gold are found on almost all gold from the Otago Schist goldfield, and have been formed by authigenic Au dissolution and redeposition in situ from groundwater geochemical processes [16,26,27,28,29]. Similar gold overgrowths are common elsewhere and are thought to be of bacteriogenic origin [30,31,32].
7. Discussion
7.1. Key Parameters Controlling Particle Au Fineness
The detrital gold particles have three principal components that are potentially relevant for defining mine bulk fineness: the cores, the rims, and the overgrowths. The overgrowths are extremely small and volumetrically trivial, so we consider them to be negligible in the context of bulk fineness. These overgrowths, with their apparent lack of Ag, can be considered to be a very minor component of the Ag-poor rims to which the overgrowths adhere. Hence, the net Au fineness of a gold particle is defined by the Au fineness of the core, and the proportion of that core in relation to the Ag-poor rim (Figure 4, Figure 5 and Figure 6).
The particle cores examined in this study have a narrow range of compositions, from 2% to 9% Ag, with most cores having between 3% and 6% Ag. No attempt was made to do a statistical evaluation of the range of Waikaia gold particle core compositions because of the small numbers of particles sampled. However, the observed overall range and the common values of 3% to 6% Ag are typical of gold throughout the Otago Schist goldfield [16,29,33]. The bulk composition of the gold in Waikaia mine doré bars is consistently <3 wt % Ag (Figure 3b), so the contribution of rim gold to the bulk gold composition must be substantial. We conclude that the ratio of rim gold to core gold is the critical parameter controlling the Au fineness of the Waikaia mine doré bars.
Rims have formed on gold particles as a result of the recrystallisation of highly deformed large grains to smaller undeformed grains (Figure 7a–c) [16]. Silver is expelled from the new undeformed grains during this recrystallisation process [16]. With increasing transport of the detrital gold particles, further deformation is imposed on the internal grain structure, and the width of the recrystallised rims increases at the expense of the original Ag-bearing core [16]. Hence, the proportions of cores and rims of gold particles are strongly related to the shape of the particles, as the cores are largest in less-flattened particles (Figure 4, Figure 5, Figure 6 and Figure 7). With strong folding and flattening, the core can be largely obliterated and a particle can become almost entirely, or even totally, made up of Ag-poor rim gold (Figure 5d).
The observed changes in doré bar compositions are most pronounced over the last year of the data set used in this study (Figure 3a,b). Prior to that last year, the doré bar compositions, and associated Ag contents, were still variable but within a narrower range (Figure 3a,b).This suggests that there is not a linear downstream increase in the proportion of flattened particles with higher proportions of rims. In addition, there may be sedimentological effects that have concentrated flattened flakes in the downstream portion of the paleochannel and/or concentrated less flattened particles in the upstream portion. The details of the sedimentology of the auriferous basal gravels are not visible in the mine as they are excavated from below water level (Figure 2a). Hence, further evaluation of possible sedimentological controls on differential particle shape accumulations are not possible at this site.
7.2. Modelling Bulk Au Fineness
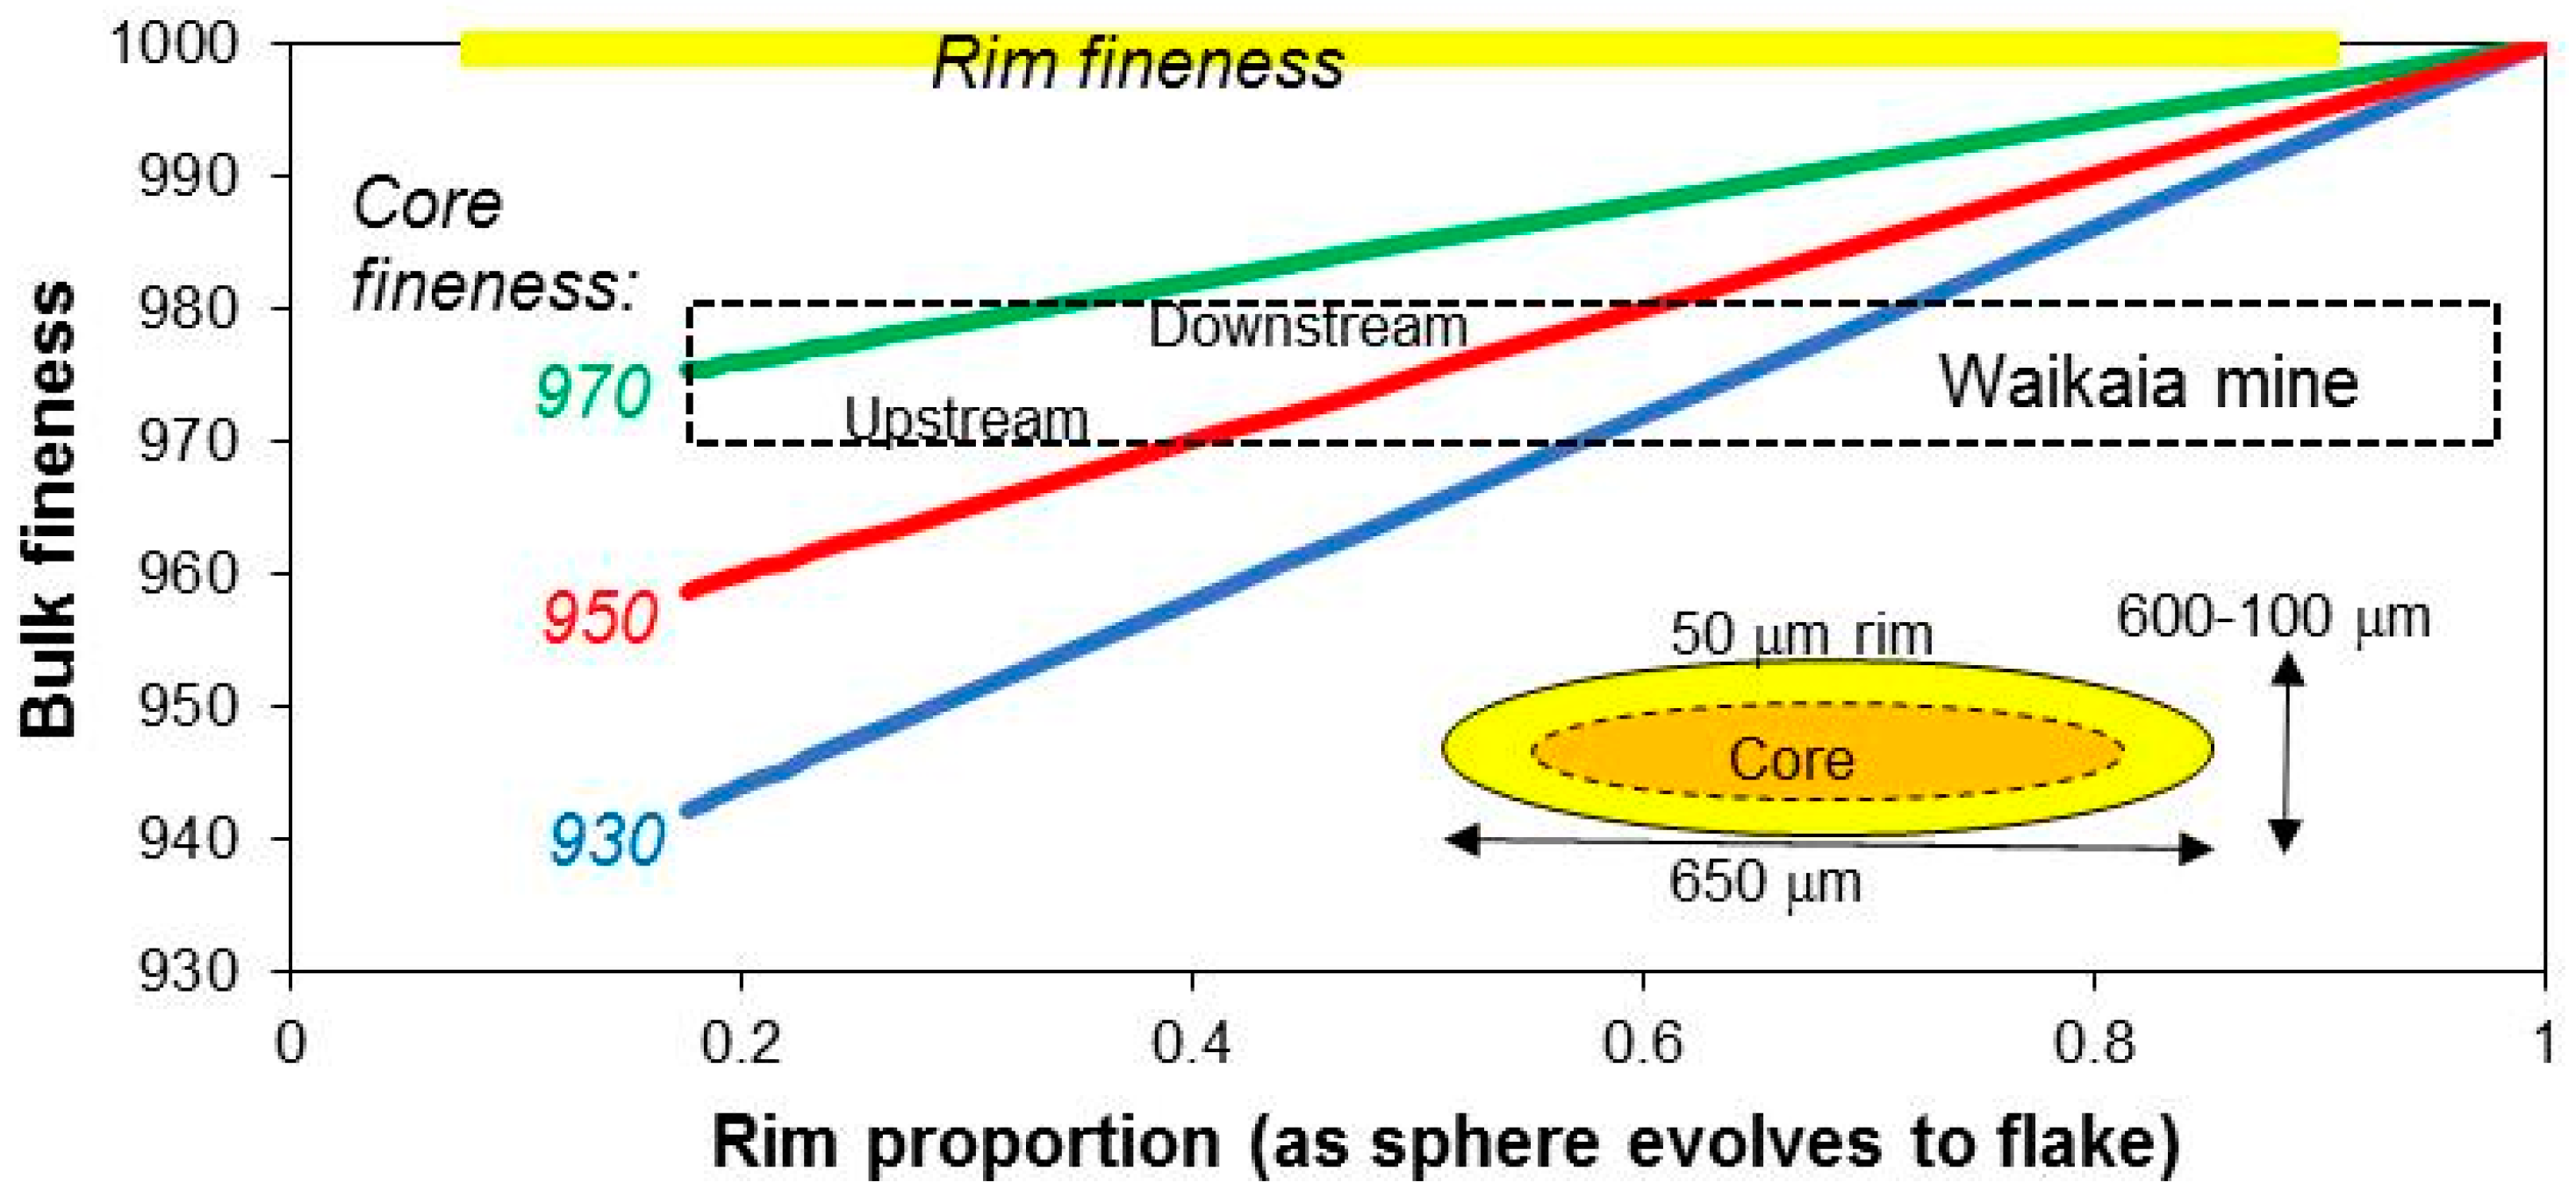
Since the proportion of rim gold has a major effect on the Au fineness of individual particles, the bulk Au fineness of the doré bars from a mine is largely controlled by this proportion, as long as the core compositions have a narrow range, as they do at the Waikaia mine (Figure 3a,b). Consequently, it is possible to construct a relatively simple numerical model to quantify the bulk Au fineness that will result from different proportions of rim gold (Figure 9). This model was calculated using relative volumetric rim and core proportions of progressively flattened spheroids with fixed rim widths and decreasing core volumes (Figure 9). To maintain uniform diameters of the resultant flakes (or broadly uniform particle size; Figure 1d), the model assumes that particle volume decreases with increasing flattening. This latter assumption is reasonable because, in a dynamic fluvial environment the gold particles are sorted by size, and particles that have larger surface areas because of flattening are swept farther downstream [34].
The model in Figure 9 has been constructed with three different values for average core Au fineness that are plausible for the Waikaia gold, of which the Au fineness of 950 is the most likely (Figure 4, Figure 5, Figure 6 and Figure 7). If it is assumed that this average value has remained constant through the life of the Waikaia mine, then the small but consistent decrease in bulk Au fineness of the doré bars (Figure 3a) can be interpreted to reflect changes in relative proportions of rims and cores along the course of the mined paleochannel (Figure 1c). The gold deposited by the river system at the upstream end of the mined paleochannel (the most recent doré bars and August 2017 sample) apparently has a higher proportion of cores than the gold deposited at the downstream end of the mined paleochannel (earliest doré bars and October 2014 sample). In the model of Figure 9, with an average core Au fineness of 950, the observed bulk doré bar compositional variations (Figure 3a) imply that the upstream gold had ~40% rim gold in bulk, and the downstream gold had ~60% rim gold in bulk. This relative difference between upstream and downstream samples is consistent with expected increased flattening with downstream transport [18,34]. Direct comparison between the upstream sample (e.g., subsample in Figure 4a) and the downstream sample (e.g., subsample in Figure 4b) suggests that the downstream gold contains more flattened flakes than the upstream gold, but the small samples examined in this study make this a somewhat speculative assertion. Nevertheless, these data and observations suggest that continued mining upstream will yield doré bars with progressively lower bulk Au fineness. This general downstream increase in both flattening and fineness, with associated Ag-poor rim development, has been noted elsewhere [1,7,8,9,17,18].
8. Conclusions
The bulk Au fineness of the product of a mining operation is reflected in the composition of the gold bars poured on a mine site (doré bars). In a placer mine, the resultant doré bar compositions are an average of the compositions of individual detrital particles in the sedimentary deposit being mined. In this study, we documented the compositions of doré bars produced approximately every 10 days over nearly three years while the mine moved progressively upstream in a Pleistocene paleochannel. The bulk Au fineness of doré bars from the mine has shown a consistent downward trend, with some fluctuations, from ~980 to ~970 during that time. Silver is the principal impurity in the doré bars, with 0.2 wt % Hg and minor additional Hg was volatilised during production of the doré bars.
The gold particles recovered from the deposit are mostly 0.2–1 mm flakes, with a high proportion ~0.5 mm across. At the scale of a typical individual 0.5 mm gold particle, there are three different types of gold present. Almost all particle cores contain silver and range from 2 to 9 wt % Ag, with most cores having 3–6 wt % Ag. All particles have a silver-poor rim that is typically 10–50 μm wide, with <1 wt % Ag. Common but volumetrically insignificant micron scale overgrowths of pure gold occur on many particle surfaces, especially in cavities where the gold is intergrown with clay.
The particle rims have been formed by the recrystallisation of deformed core gold, with associated leaching of the Ag from the recrystallised gold. The grain size of crystalline gold in the rims (typically 10–20 μm) is smaller than that of the deformed gold in the cores (typically >100 μm). Recrystallisation on particle rims after transport-induced deformation has progressively encroached on the larger core grains, with a progressive loss of Ag from more-flattened particles. Highly flattened and folded flakes have little or no Ag-bearing core gold remaining.
The average Ag content of an individual gold particle, and therefore the bulk Au fineness of the bullion produced from the mine, is controlled principally by the proportions of core and rim gold. Most of the gold particles have approximately equal volumetric proportions of core and rim gold, so the bulk Au fineness of the mine product is approximately half the typical Ag content of particle cores. The volumetric proportion of cores has decreased with increasing flattening of gold particles as they were transported downstream. Hence, as the mine progressed upstream in the paleochannel, the bulk Au fineness has decreased because the upstream gold has been less flattened than the downstream gold. A continued downward trend in bulk Au fineness is predicted as the mine progresses upstream unless gold derived from a different source is encountered.
Acknowledgments
This study would not have been possible without the friendly co-operation of the staff of Waikaia gold mine, especially Noel Becker. The research was supported financially by the Marsden Fund administered by the Royal Society of New Zealand and the NZ Ministry for Business Innovation and Employment. Scanning electron microscopy was done at the Otago Centre for Electron Microscopy, University of Otago. Brent Pooley provided expert technical assistance with sample preparation. Helpful reviews by Rob Chapman and an anonymous referee improved the presentation of the ms.
Author Contributions
This research project was conceived by D.C. and N.B. to address specific questions about mine production. Laboratory work was carried out by C.M. under the supervision of D.C. and M.N., and M.N. provided the expertise for specialist techniques on the SEM.
Conflicts of Interest
The authors declare no conflict of interest.
References
- Boyle, R.W. The geochemistry of gold and its deposits. Geol. Surv. Can. Bull. 1979, 280, 579. [Google Scholar]
- Yannopoulos, J.C. The Extractive Metallurgy of Gold; Springer: New York, NY, USA, 1991; p. 281. [Google Scholar]
- Morrison, G.W.; Rose, W.J.; Jaireth, S. Geological and geochemical controls on the silver content (fineness) of gold in gold-silver deposits. Ore Geol. Rev. 1991, 6, 333–364. [Google Scholar] [CrossRef]
- Palyanova, G. Physicochemical modeling of the coupled behavior of gold and silver in hydrothermal processes: Gold fineness, Au/Ag ratios and their possible implications. Chem. Geol. 2008, 255, 299–313. [Google Scholar] [CrossRef]
- Sack, R.O.; Brackebusch, F.W. Fahlore as an indicator of mineralization temperature and gold fineness. CIM Bull. 2004, 97, 78–83. [Google Scholar]
- Fisher, N.H. The fineness of gold with special reference to the Morobe goldfield, New Guinea. Econ. Geol. 1945, 40, 449–495. [Google Scholar] [CrossRef]
- Desborough, G.A. Silver depletion indicated by microanalysis of gold from placer occurrences, western United States. Econ. Geol. 1970, 65, 304–311. [Google Scholar] [CrossRef]
- Groen, J.C.; Craig, J.R.; Rimstidt, R.D. Gold-rich rim formation on electrum grains in placers. Can. Minerl. 1990, 28, 207–228. [Google Scholar]
- Grant, A.H.; Lavin, O.P.; Nichol, I. The morphology and chemistry of transported gold grains as an exploration tool. J. Geochem. Explor. 1991, 40, 73–94. [Google Scholar] [CrossRef]
- Santosh, M.; Philip, R.; Jacob, M.K.; Omana, P.K. Highly pure placer gold formation in the Nilambur Valley, Wynad Gold Field, southern India. Miner. Depos. 1992, 27, 336–339. [Google Scholar] [CrossRef]
- Knight, J.B.; Morison, S.R.; Mortensen, J.K. Lode and placer gold composition in the Klondike District, Yukon Territory, Canada: Implications for the nature and genesis of Klondike placer and lode gold deposits. Econ. Geol. 1999, 94, 635–648. [Google Scholar] [CrossRef]
- Lange, I.M.; Gignoux, T. Distribution, characteristics, and genesis of high fineness gold placers, Ninemile Valley, Central-Western Montana. Econ. Geol. 1999, 94, 375–386. [Google Scholar] [CrossRef]
- Chapman, R.J.; Leake, R.C.; Moles, N.R.; Earls, G.; Cooper, C.; Harrington, K.; Berzins, R. The application of microchemical analysis of gold grains to the understanding of complex local and regional gold mineralization: A case study in Ireland and Scotland. Econ. Geol. 2000, 95, 1753–1773. [Google Scholar]
- Chapman, R.J.; Mortensen, J.K.; LeBarge, W.P. Styles of lode gold mineralization contributing to the placers of the Indian River and Black Hills Creek, Yukon Territory, Canada as deduced from microchemical characterization of placer gold grains. Miner. Depos. 2011, 46, 881–903. [Google Scholar] [CrossRef]
- Chapman, R.J.; Mortensen, J.K. Characterization of gold mineralization in the Northern Cariboo Gold District, British Columbia, Canada, through integration of compositional studies of lode and detrital Gold with historical placer production: A template for evaluation of orogenic gold districts. Econ. Geol. 2016, 111, 1321–1345. [Google Scholar]
- Stewart, J.; Kerr, G.; Prior, D.; Halfpenny, A.; Pearce, M.; Hough, R.; Craw, D. Low temperature recrystallisation of alluvial gold in paleoplacer deposits. Ore Geol. Rev. 2017, 88, 43–56. [Google Scholar] [CrossRef]
- Townley, B.K.; Herail, G.; Maksaev, V.; Palacios, C.; de Parseval, P.; Sepuldeva, F.; Orellana, R.; Rivas, P.; Ulloa, C. Gold grain morphology and composition as an exploration tool: Application to gold exploration in covered areas. Geochem. Explor. Environ. Anal. 2003, 3, 29–38. [Google Scholar] [CrossRef]
- Garnett, R.H.T.; Bassett, N.C. Placer Deposits. Econ. Geol. 2005, 100th Anniv Vol, 813–843. [Google Scholar]
- Pingel, V. Technical aspects of prehistoric gold objects on the basis of material analyses. In Prehistoric Gold in Europe; Morteani, G., Northover, J.P., Eds.; Kluwer Academic Publishers: Dordrecht, The Netherlands, 1995; pp. 385–398. [Google Scholar]
- Warner, R.B. Irish gold artefacts: Observations from Hartmann’s analytical data. In From Megaliths to Metal; Roche, H., Grogan, E., Bradley, J., Coles, J., Raferty, B., Eds.; Oxbow: Liverpool, NY, USA, 2004. [Google Scholar]
- Chapman, R.J.; Leake, R.C.; Warner, R.A.; Cahill, M.C.; Moles, N.R.; Shell, C.A.; Taylor, J.J. Microchemical characterisation of natural gold and artefact gold as a tool for provenancing prehistoric gold artefacts: A case study in Ireland. Appl. Geochem. 2006, 21, 904–918. [Google Scholar] [CrossRef]
- Kuleff, I.; Tonkova, M.; Stoyanov, T. Chemical composition of gold breast plates from ancient Thrace (5th–4th Century BC). Archaeol. Bulg. 2009, 2, 11–20. [Google Scholar]
- Becker, N.; Batt, W. Waikaia placer gold mine, Southland. Australas. Inst. Min. Metall. Monogr. 2016, 31, 387–394. [Google Scholar]
- Williams, G.J. Economic Geology of New Zealand. Australas. Inst. Min. Metall. Monogr. 1974, 4, 490. [Google Scholar]
- Henley, R.W.; Adams, J. On the evolution of giant gold placers. Trans. Inst. Min. Metall. 1979, 88, B41–B50. [Google Scholar]
- Craw, D.; Hesson, M.; Kerr, G. Morphological evolution of gold nuggets in proximal sedimentary environments, southern New Zealand. Ore Geol. Rev. 2016, 80, 784–799. [Google Scholar] [CrossRef]
- Falconer, D.M.; Craw, D. Supergene gold mobility: A textural and geochemical study from gold placers in southern New Zealand. In Supergene Environments, Processes and Products; Titley, S.R., Ed.; Society of Economic Geologists: Littleton, CO, USA, 2009; Volume 14, pp. 77–93. [Google Scholar]
- Craw, D.; Kerr, G.; Reith, F.; Falconer, D. Pleistocene paleodrainage and placer gold redistribution, western Southland, New Zealand. N. Z. J. Geol. Geophys. 2015, 58, 137–153. [Google Scholar] [CrossRef]
- Craw, D.; Lilly, K. Gold nugget morphology and geochemical environments of nugget formation, southern New Zealand. Ore Geol. Rev. 2016, 79, 301–315. [Google Scholar] [CrossRef]
- Lengke, M.; Southam, G. The deposition of elemental gold from gold (I)-thiosulfate complexes mediated by sulfate-reducing bacterial conditions. Econ. Geol. 2007, 102, 109–126. [Google Scholar] [CrossRef]
- Reith, F.; Stewart, L.; Wakelin, S.A. Supergene gold transformation: Secondary and nanoparticulate gold from southern New Zealand. Chem. Geol. 2012, 320, 32–45. [Google Scholar] [CrossRef]
- Shuster, J.; Reith, F.; Cornelis, G.; Parsons, J.E.; Parson, J.M.; Southam, G. Secondary gold structures: Relics of past biogeochemical transformations and implications for colloidal gold dispersion in subtropical environments. Chem. Geol. 2017, 450, 154–164. [Google Scholar] [CrossRef]
- Kerr, G.; Malloch, K.; Lilly, K.; Craw, D. Diagenetic alteration of a Mesozoic fluvial gold placer deposit, southern New Zealand. Ore Geol. Rev. 2017, 83, 14–29. [Google Scholar] [CrossRef]
- Youngson, J.H.; Craw, D. Variation in placer style, gold morphology, and gold particle behaviour down gravel bed-load rivers: An example from the Shotover/Arrow–Kawarau–Clutha River system, Otago, New Zealand. Econ. Geol. 1999, 94, 615–634. [Google Scholar] [CrossRef]
Figure 1.
Location and deposit characteristics of the Waikaia placer gold mine, southern New Zealand, summarised from [23]. (a) Location of the mine on the southwestern margin of the Otago Schist goldfield; (b) Topographic setting of the mine in the Waikaia River valley, with placer gold transport directions; (c) Geometry of the late Pleistocene paleochannel in which the mine is located; (d) Typical gold particle size distributions in the basal gravels of the paleochannel, based on exploration data for the whole paleochannel.
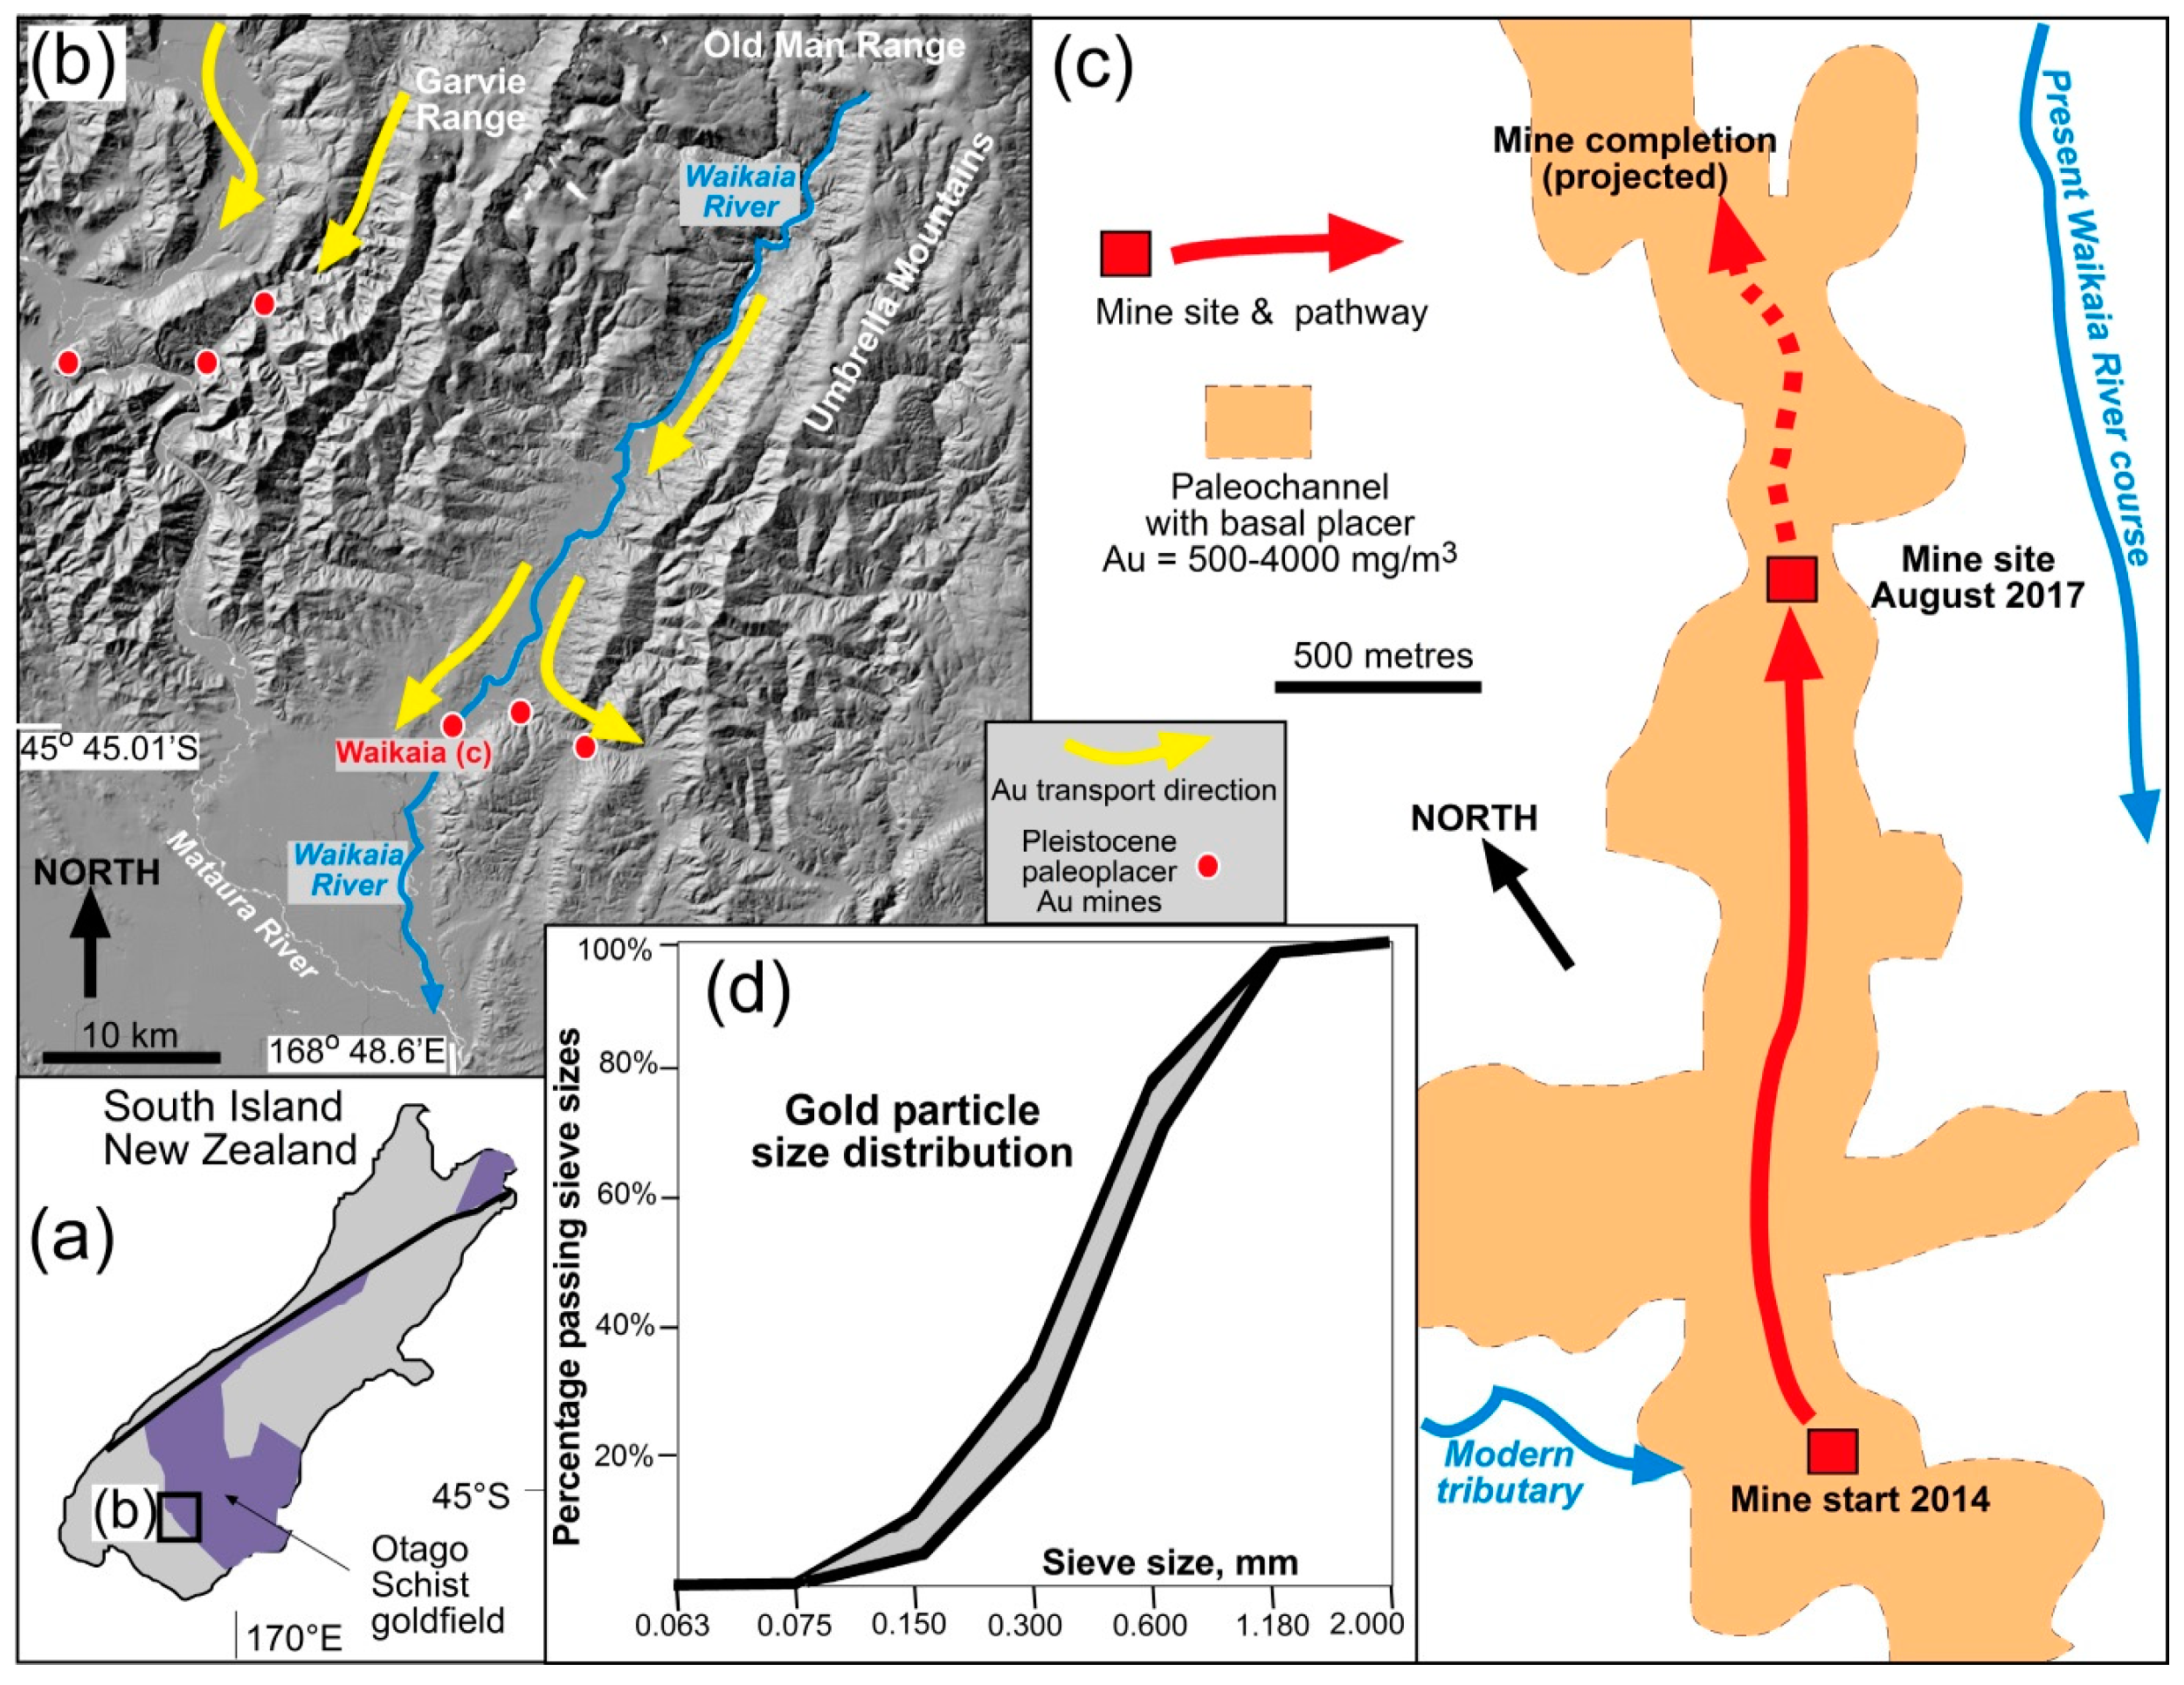
Figure 2.
Mining processes and products at the Waikaia placer gold mine. (a) Active mine excavation and processing site; (b) Gold concentrate, dominated by flakes ~0.5–1 mm across; (c) Doré bar produced from the gold concentrate.
Figure 2.
Mining processes and products at the Waikaia placer gold mine. (a) Active mine excavation and processing site; (b) Gold concentrate, dominated by flakes ~0.5–1 mm across; (c) Doré bar produced from the gold concentrate.
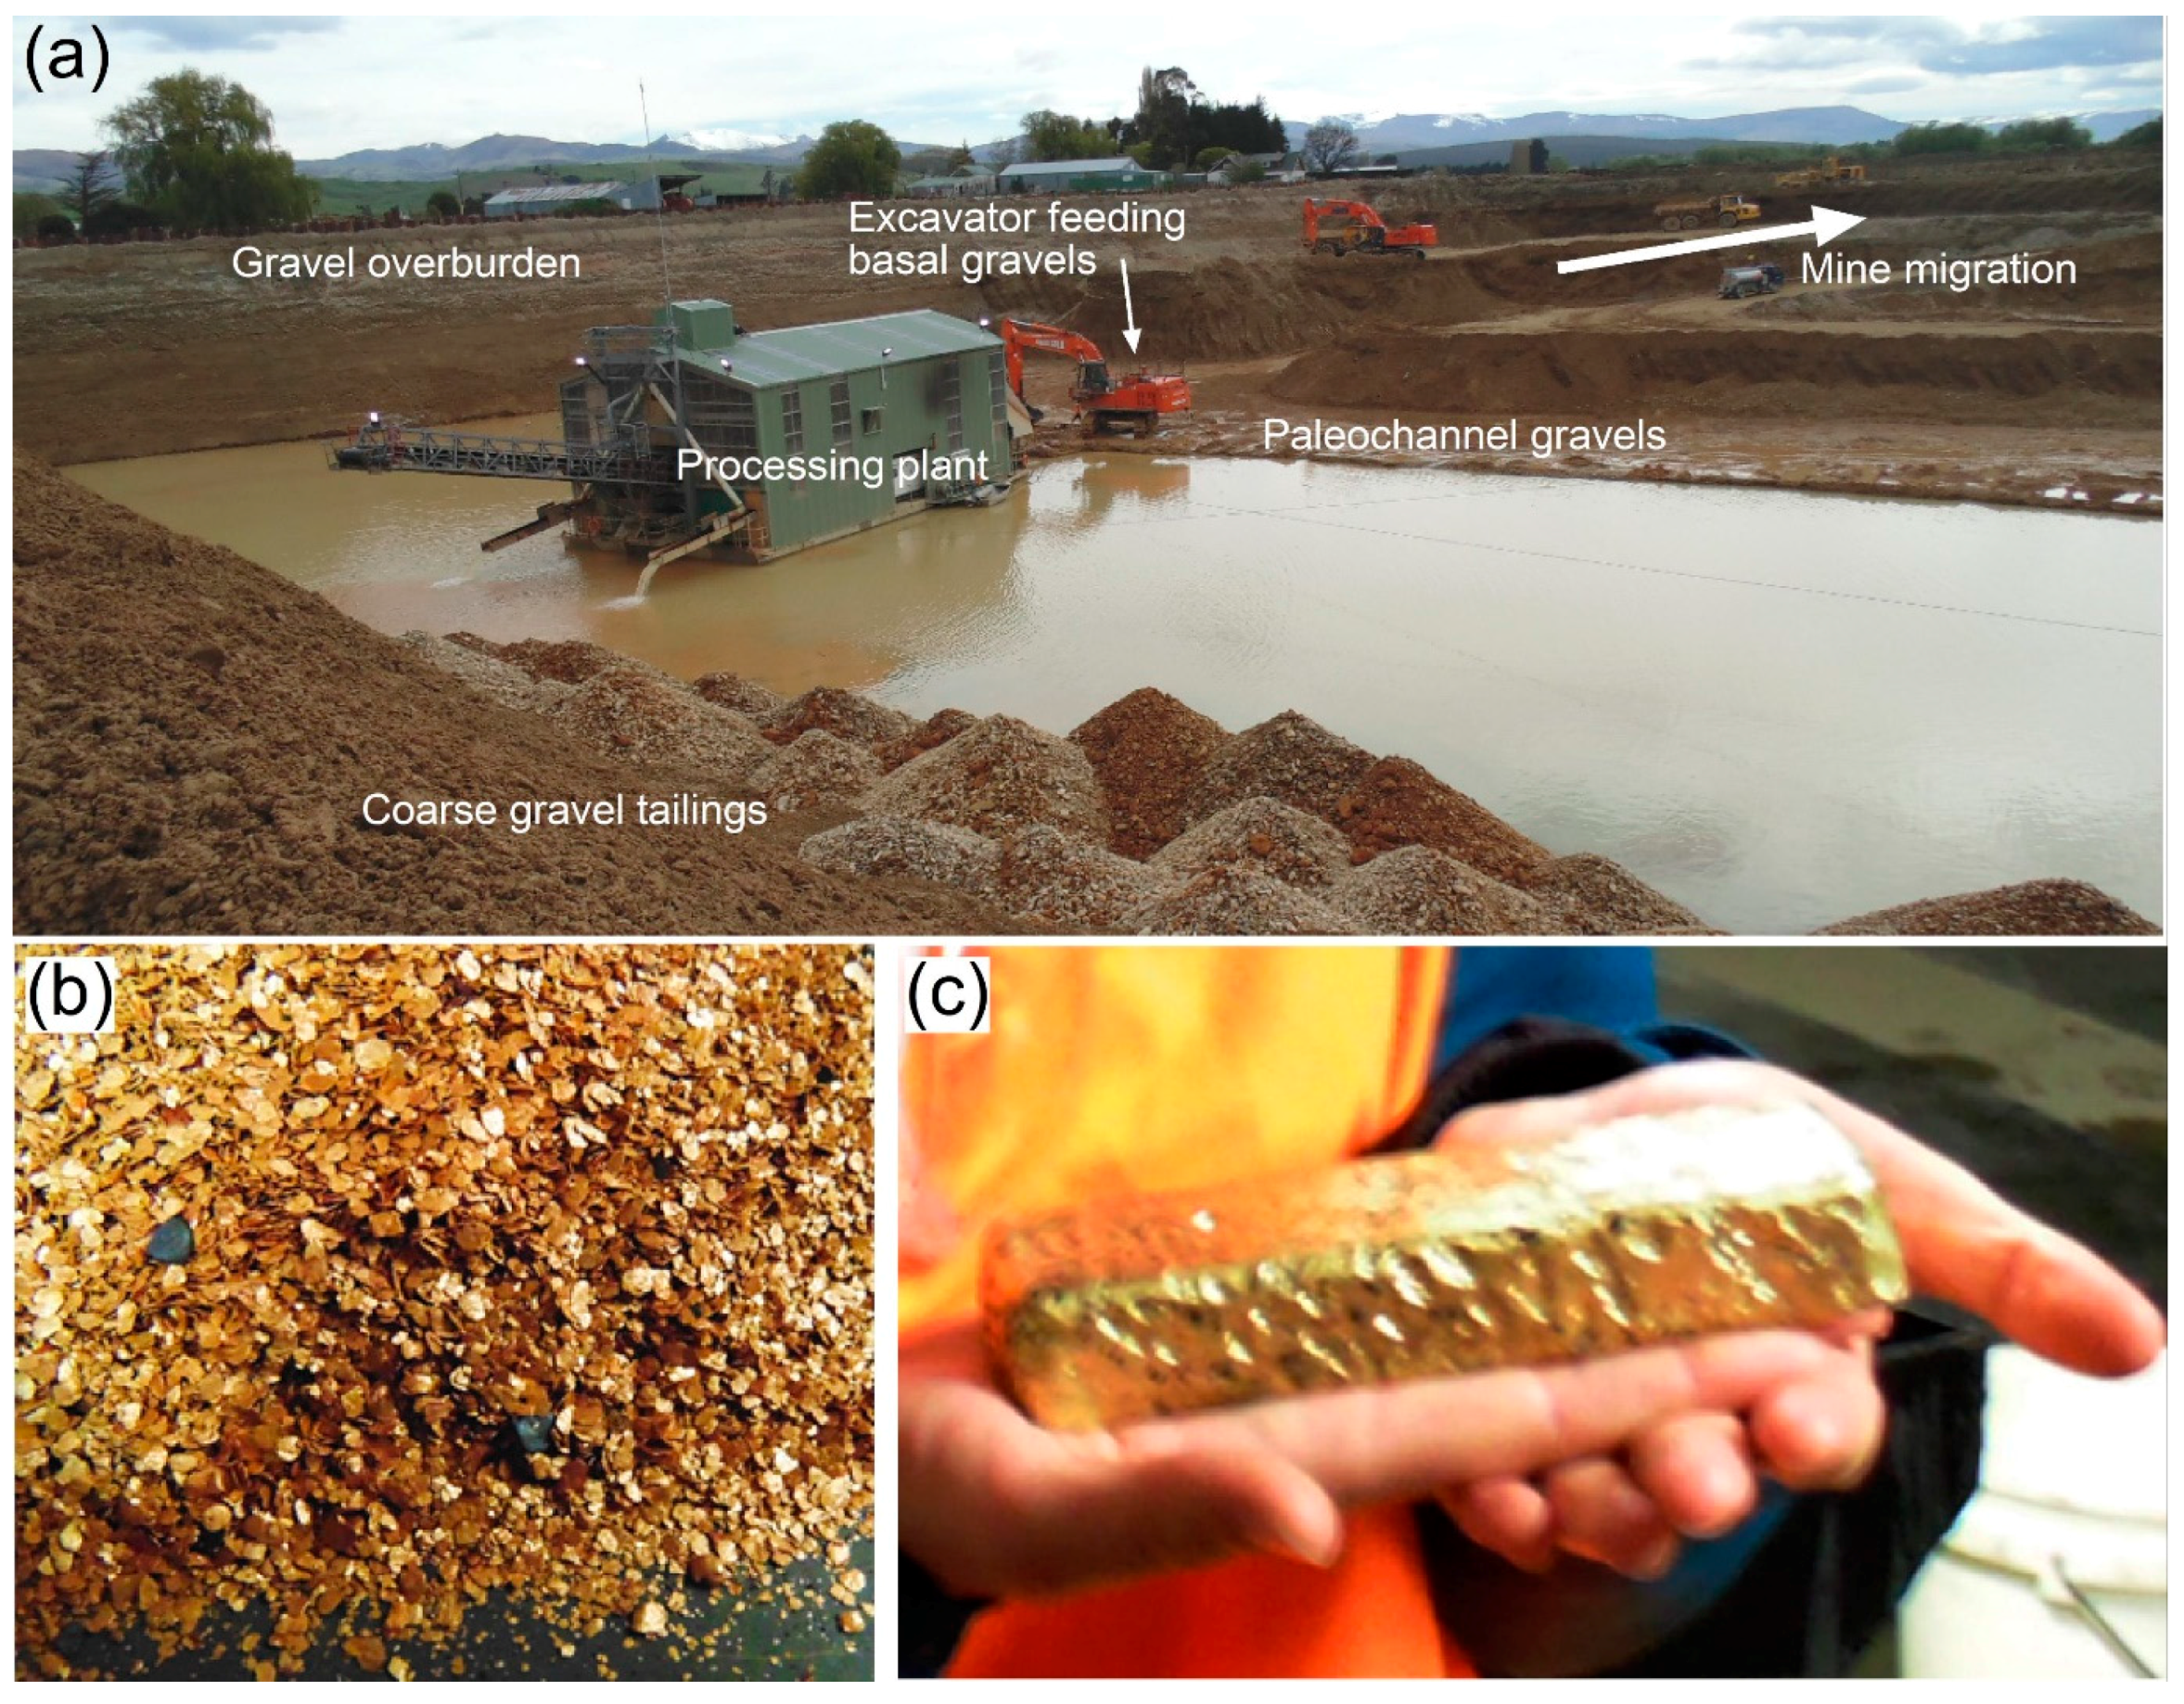
Figure 3.
Compositions of doré bars from bulk gold production at Waikaia mine over time. (a) Variation in Au fineness over time; (b) Silver content of doré bars. Blue dots are actual data; red lines are running averages of three bar compositions.
Figure 3.
Compositions of doré bars from bulk gold production at Waikaia mine over time. (a) Variation in Au fineness over time; (b) Silver content of doré bars. Blue dots are actual data; red lines are running averages of three bar compositions.
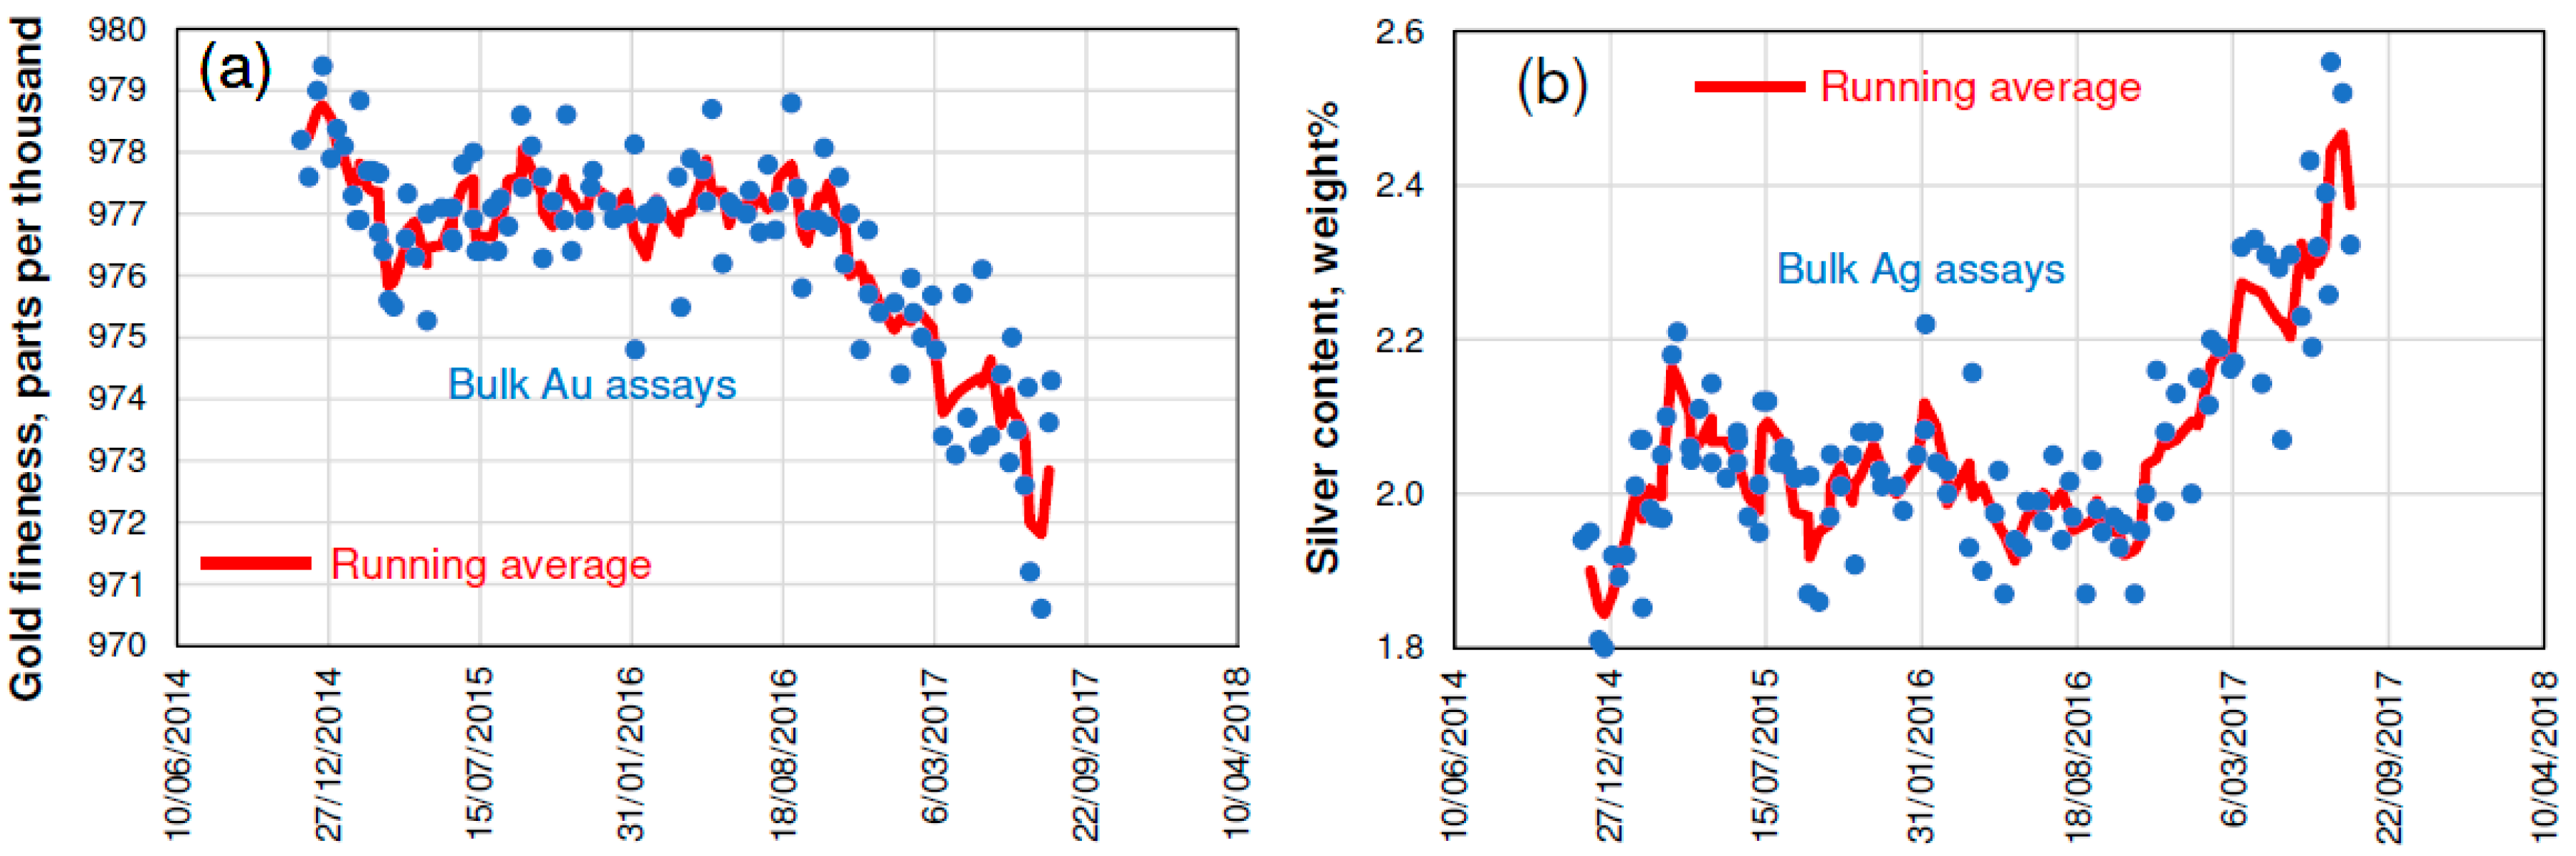
Figure 4.
Incident light view of a polished section, showing the typical appearance of gold particles from the Waikaia placer mine. Sections have been etched with aqua regia to show core and rim textures. (a) General view of sample taken in August 2017 (upstream); compared to (b) sample taken in October 2014 (downstream); (c) Close view of internal texture of a particle from August 2017 sample; (d,e) Close views of particles from October 2014 sample.
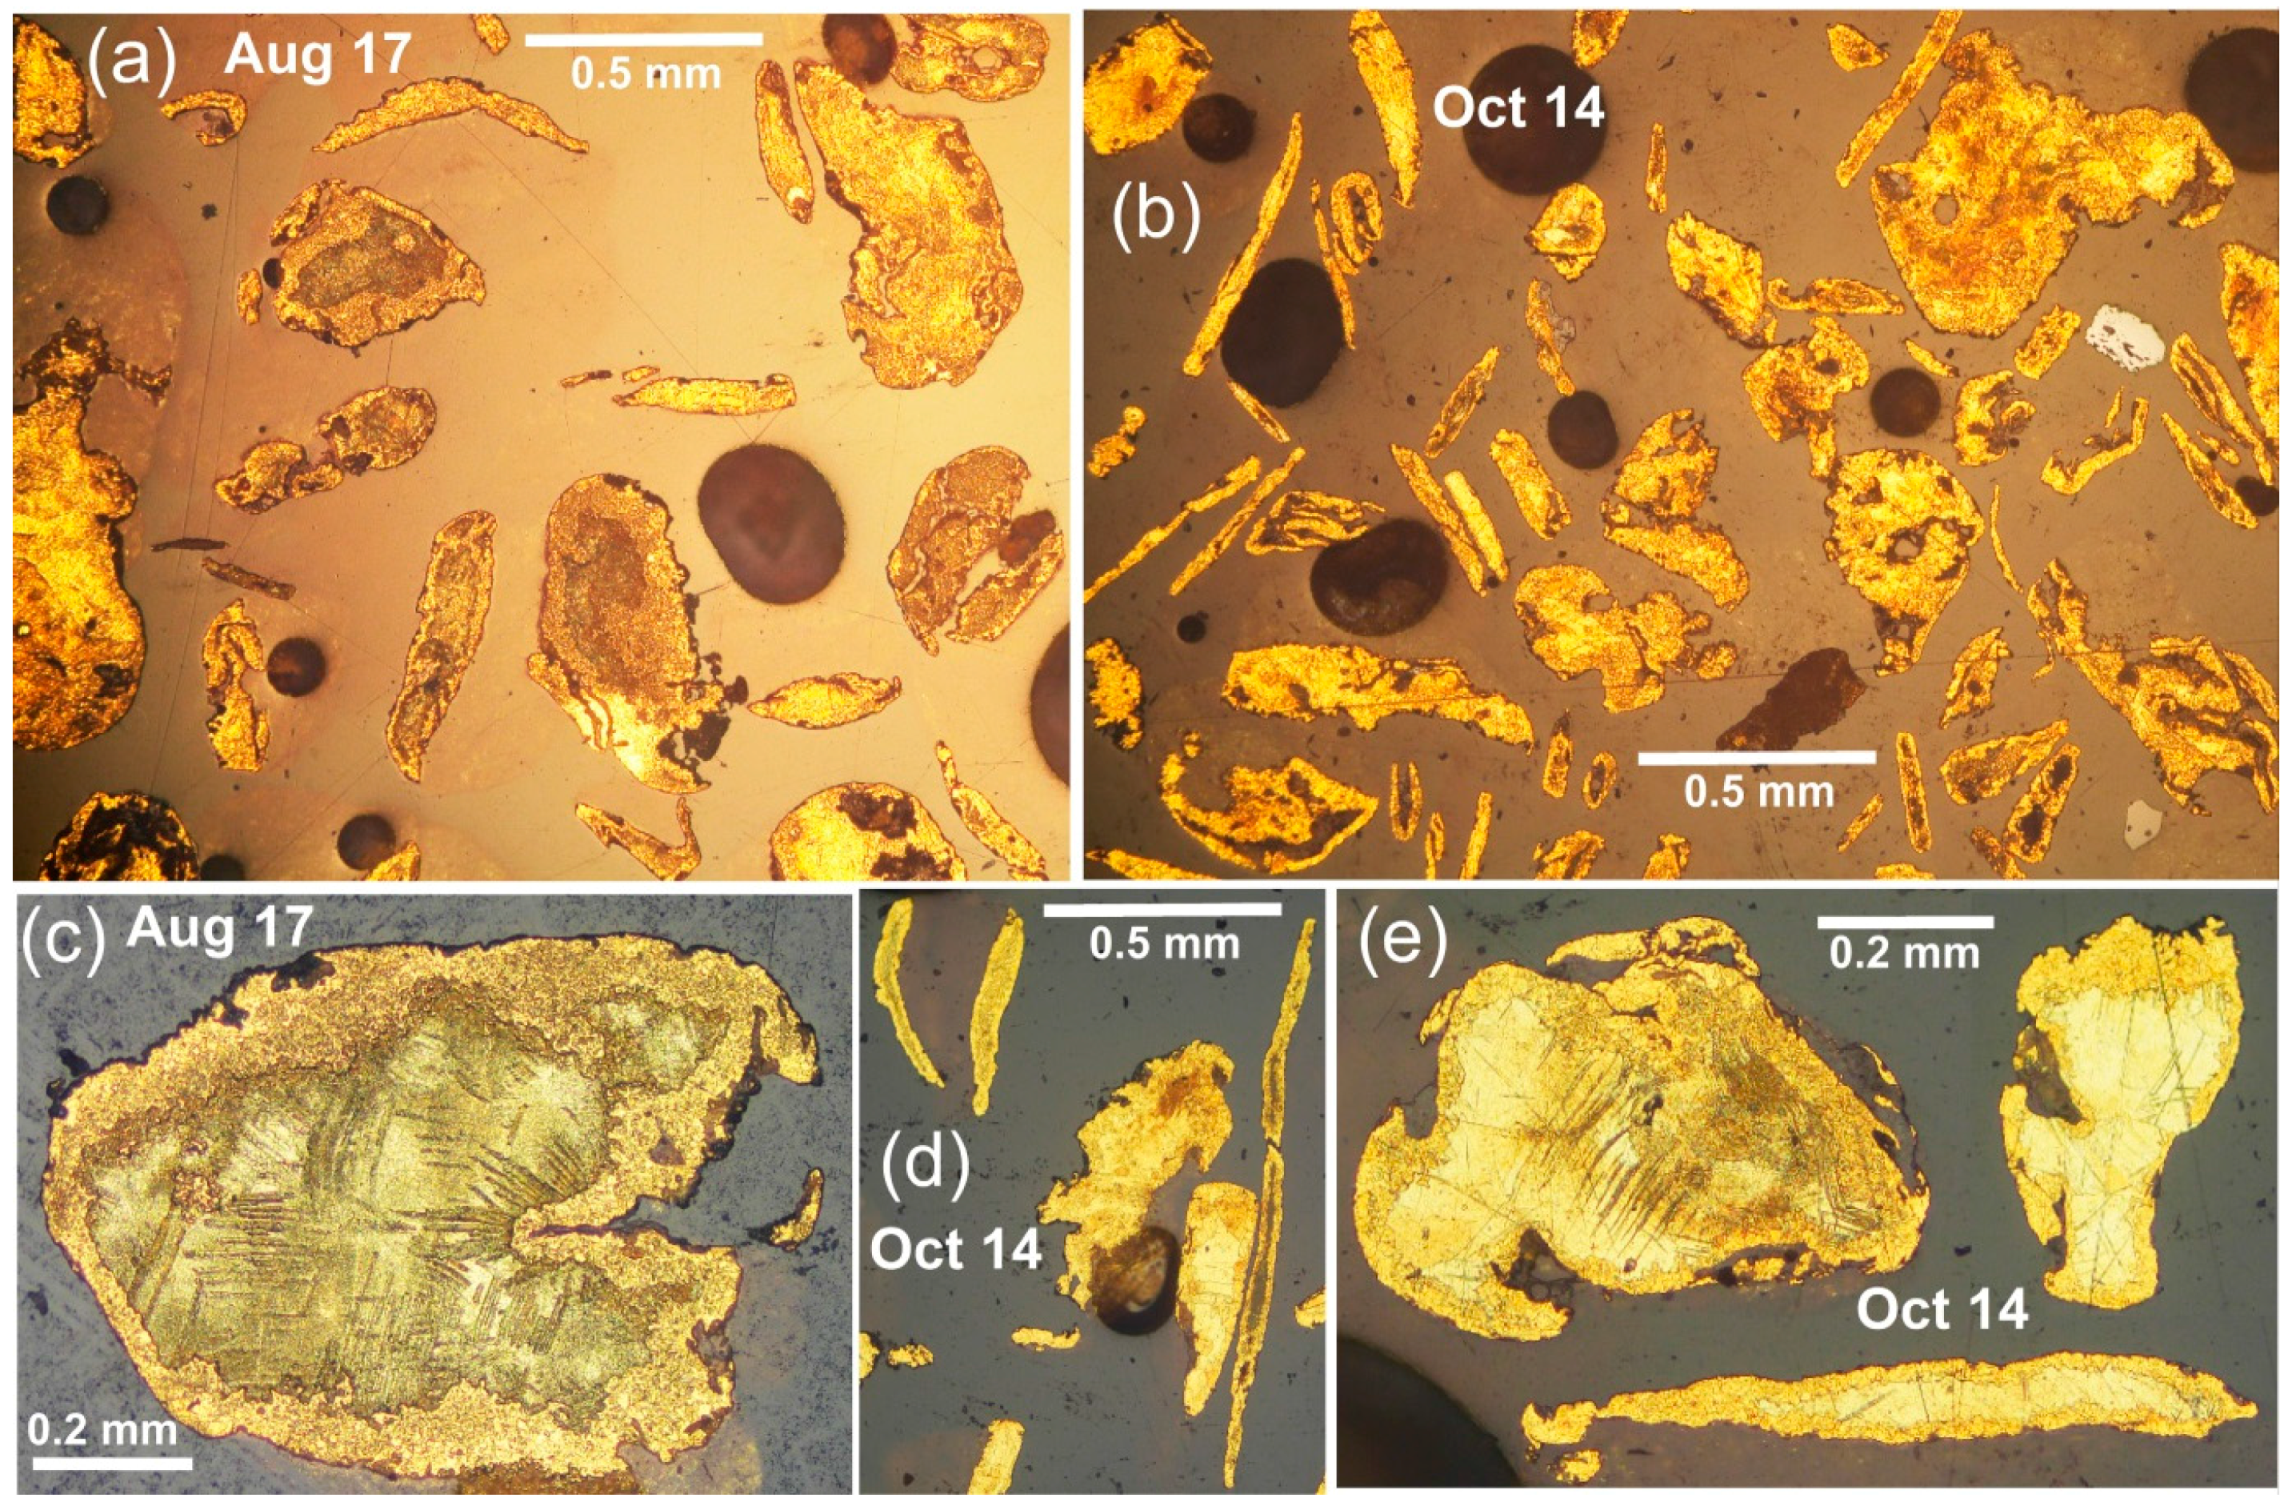
Figure 5.
SEM images and EDS analytical data for gold particles from the August 2017 sample at the Waikaia placer mine. (a) Backscatter electron image showing the textural contrast between the core and rim of a moderately flattened particle; (b) Overlaid Au and Ag EDS maps, showing the contrasting Ag contents of adjacent particles; (c) Ag transect across a folded gold particle (indicated in (b), with recorded spot data (red circles; 3 s counts) and lines linking a running average; (d) Backscatter electron image and Ag map, with point Ag analyses, of a flattened and folded particle.
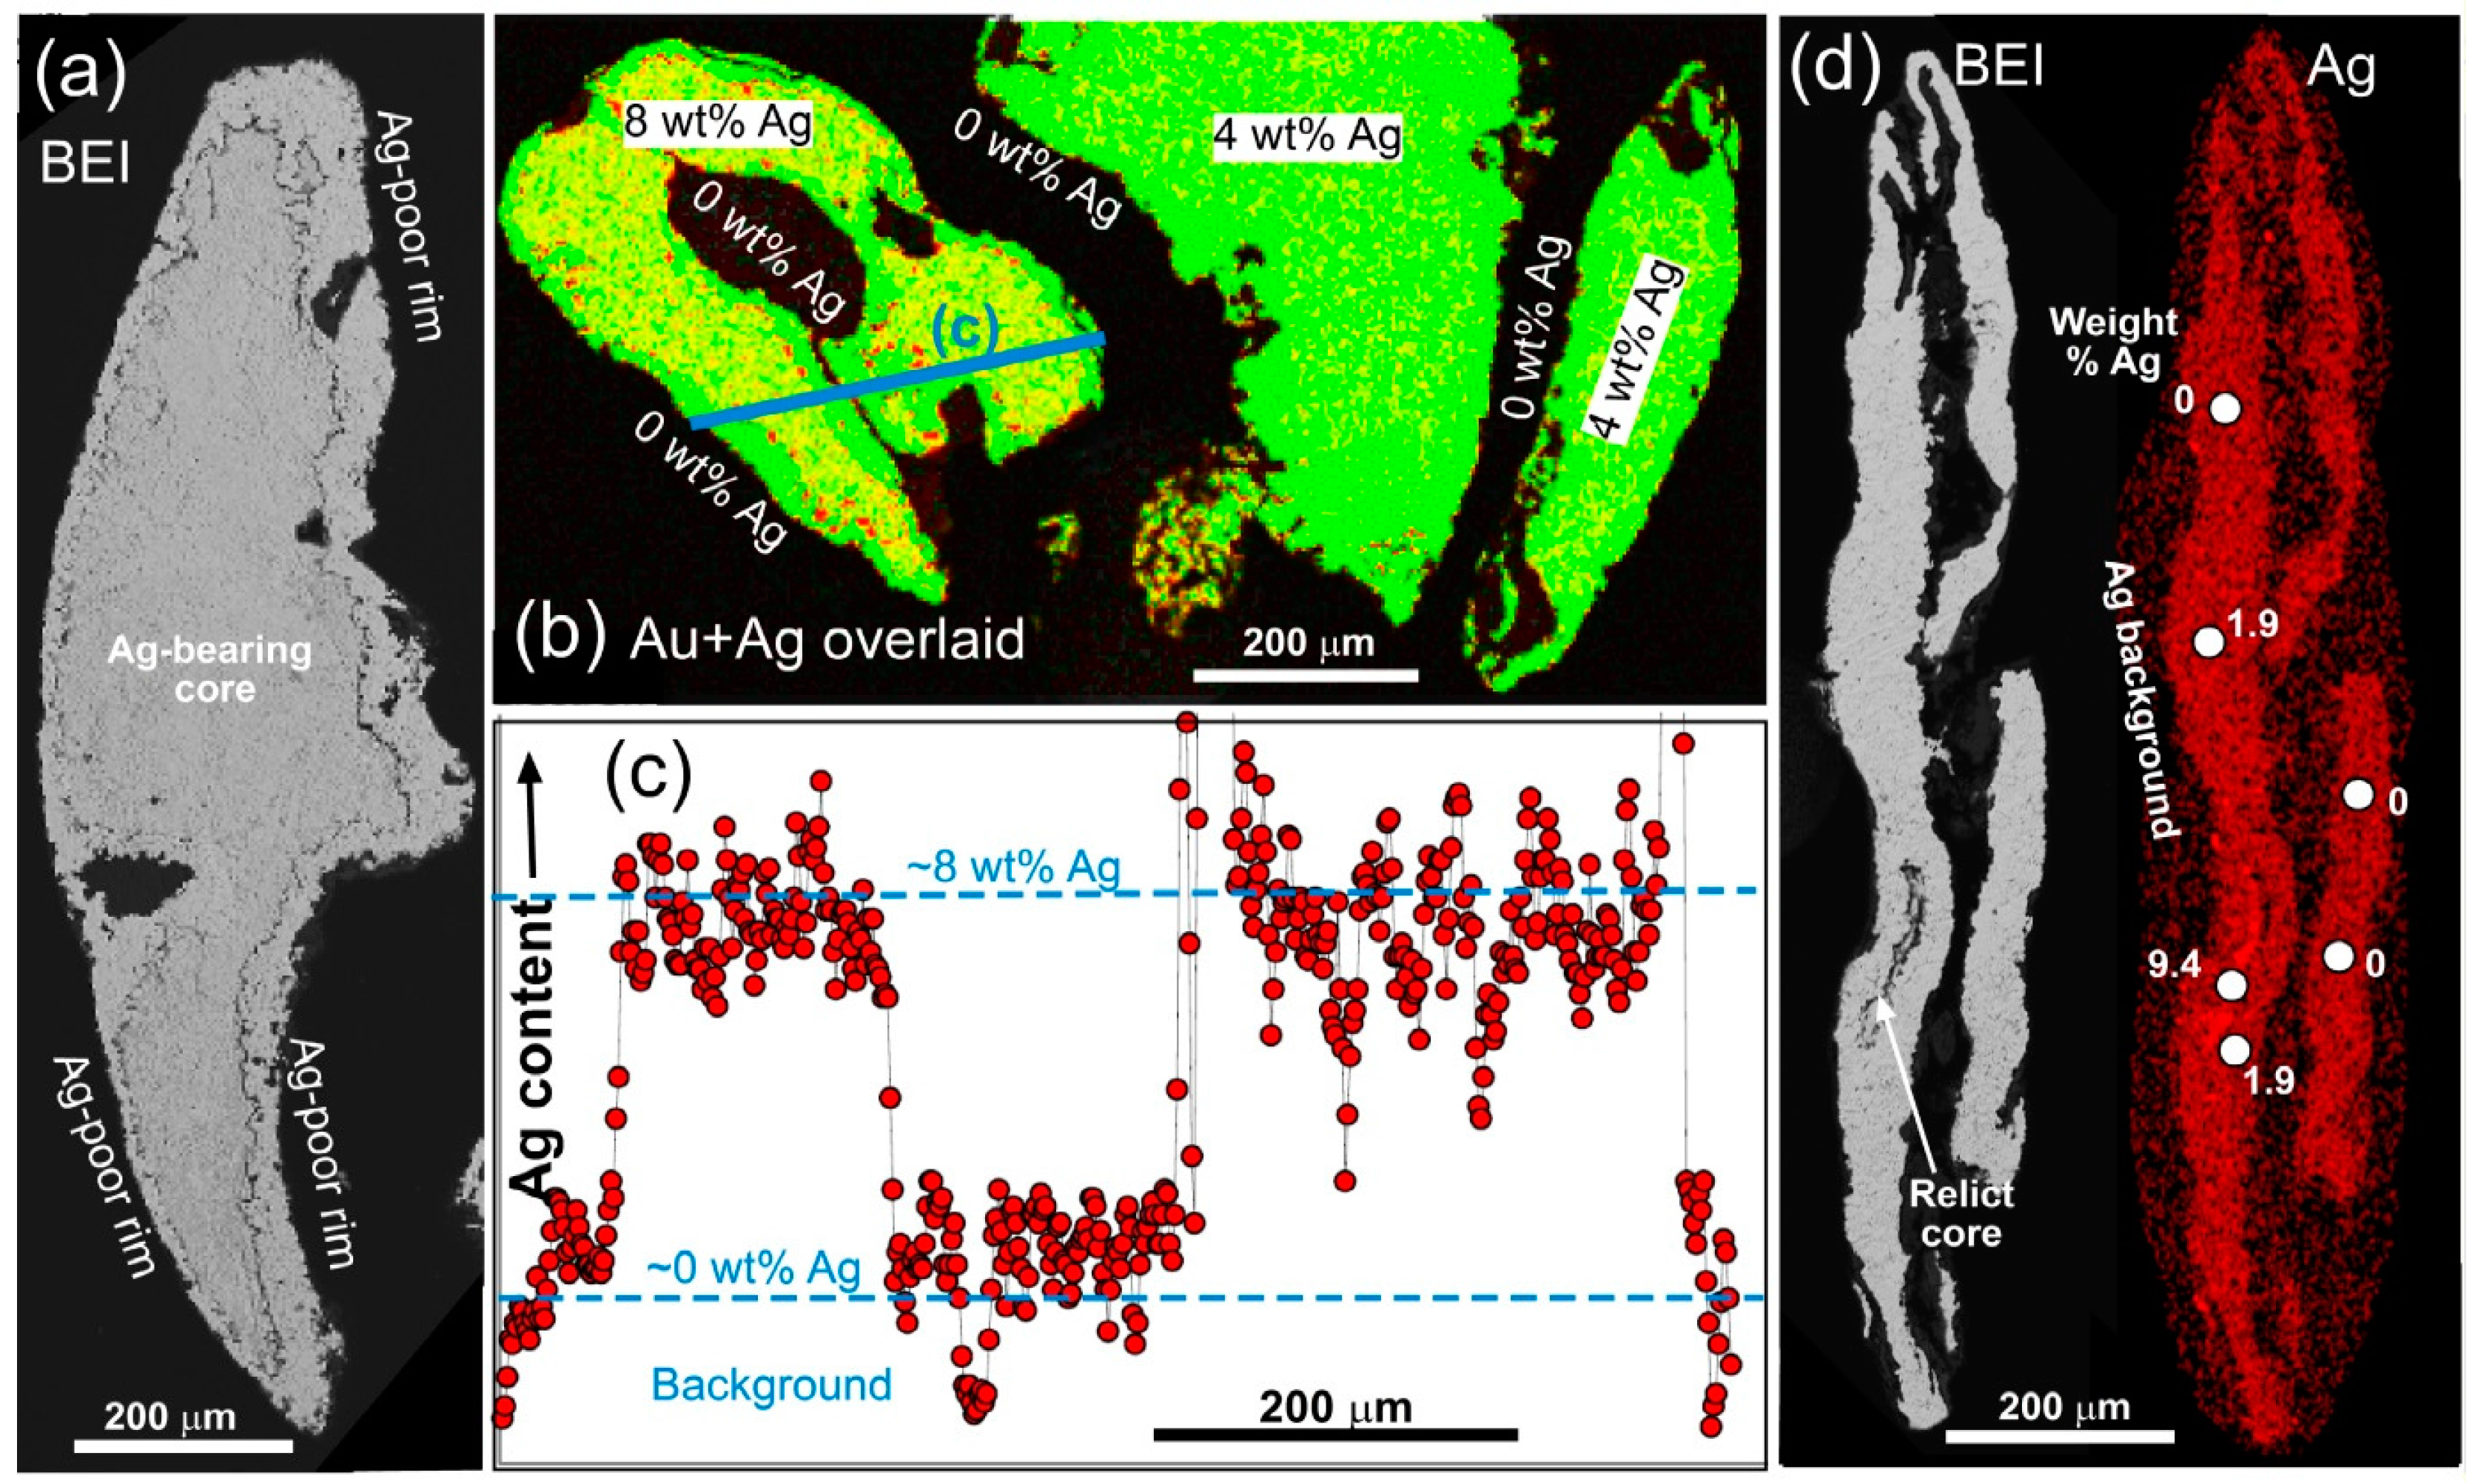
Figure 6.
Detailed view of a moderately flattened gold particle from the August 2017 sample from the Waikaia placer mine. (a) Incident light view of whole particle, with an adjacent smaller and more flattened particle; (b–e) Backscatter electron image and Au, Ag maps of the portion of the particle indicated in (a). Point Ag analyses are shown in (d). Small bright red Ag-rich patches in (d,e) are artefacts of the acid etching process.

Figure 7.
Electron backscatter diffraction maps of Waikaia gold particles, showing the internal grain structures. (a) Margin of a particle with large deformed Ag-bearing core grains (right) and smaller Ag-poor recrystallised rim grains (left), with boundary indicated with white dotted line; (b) Backscatter electron image; and (c) EBSD map, of a section across a flake without a core, consisting of small undeformed Ag-poor gold.
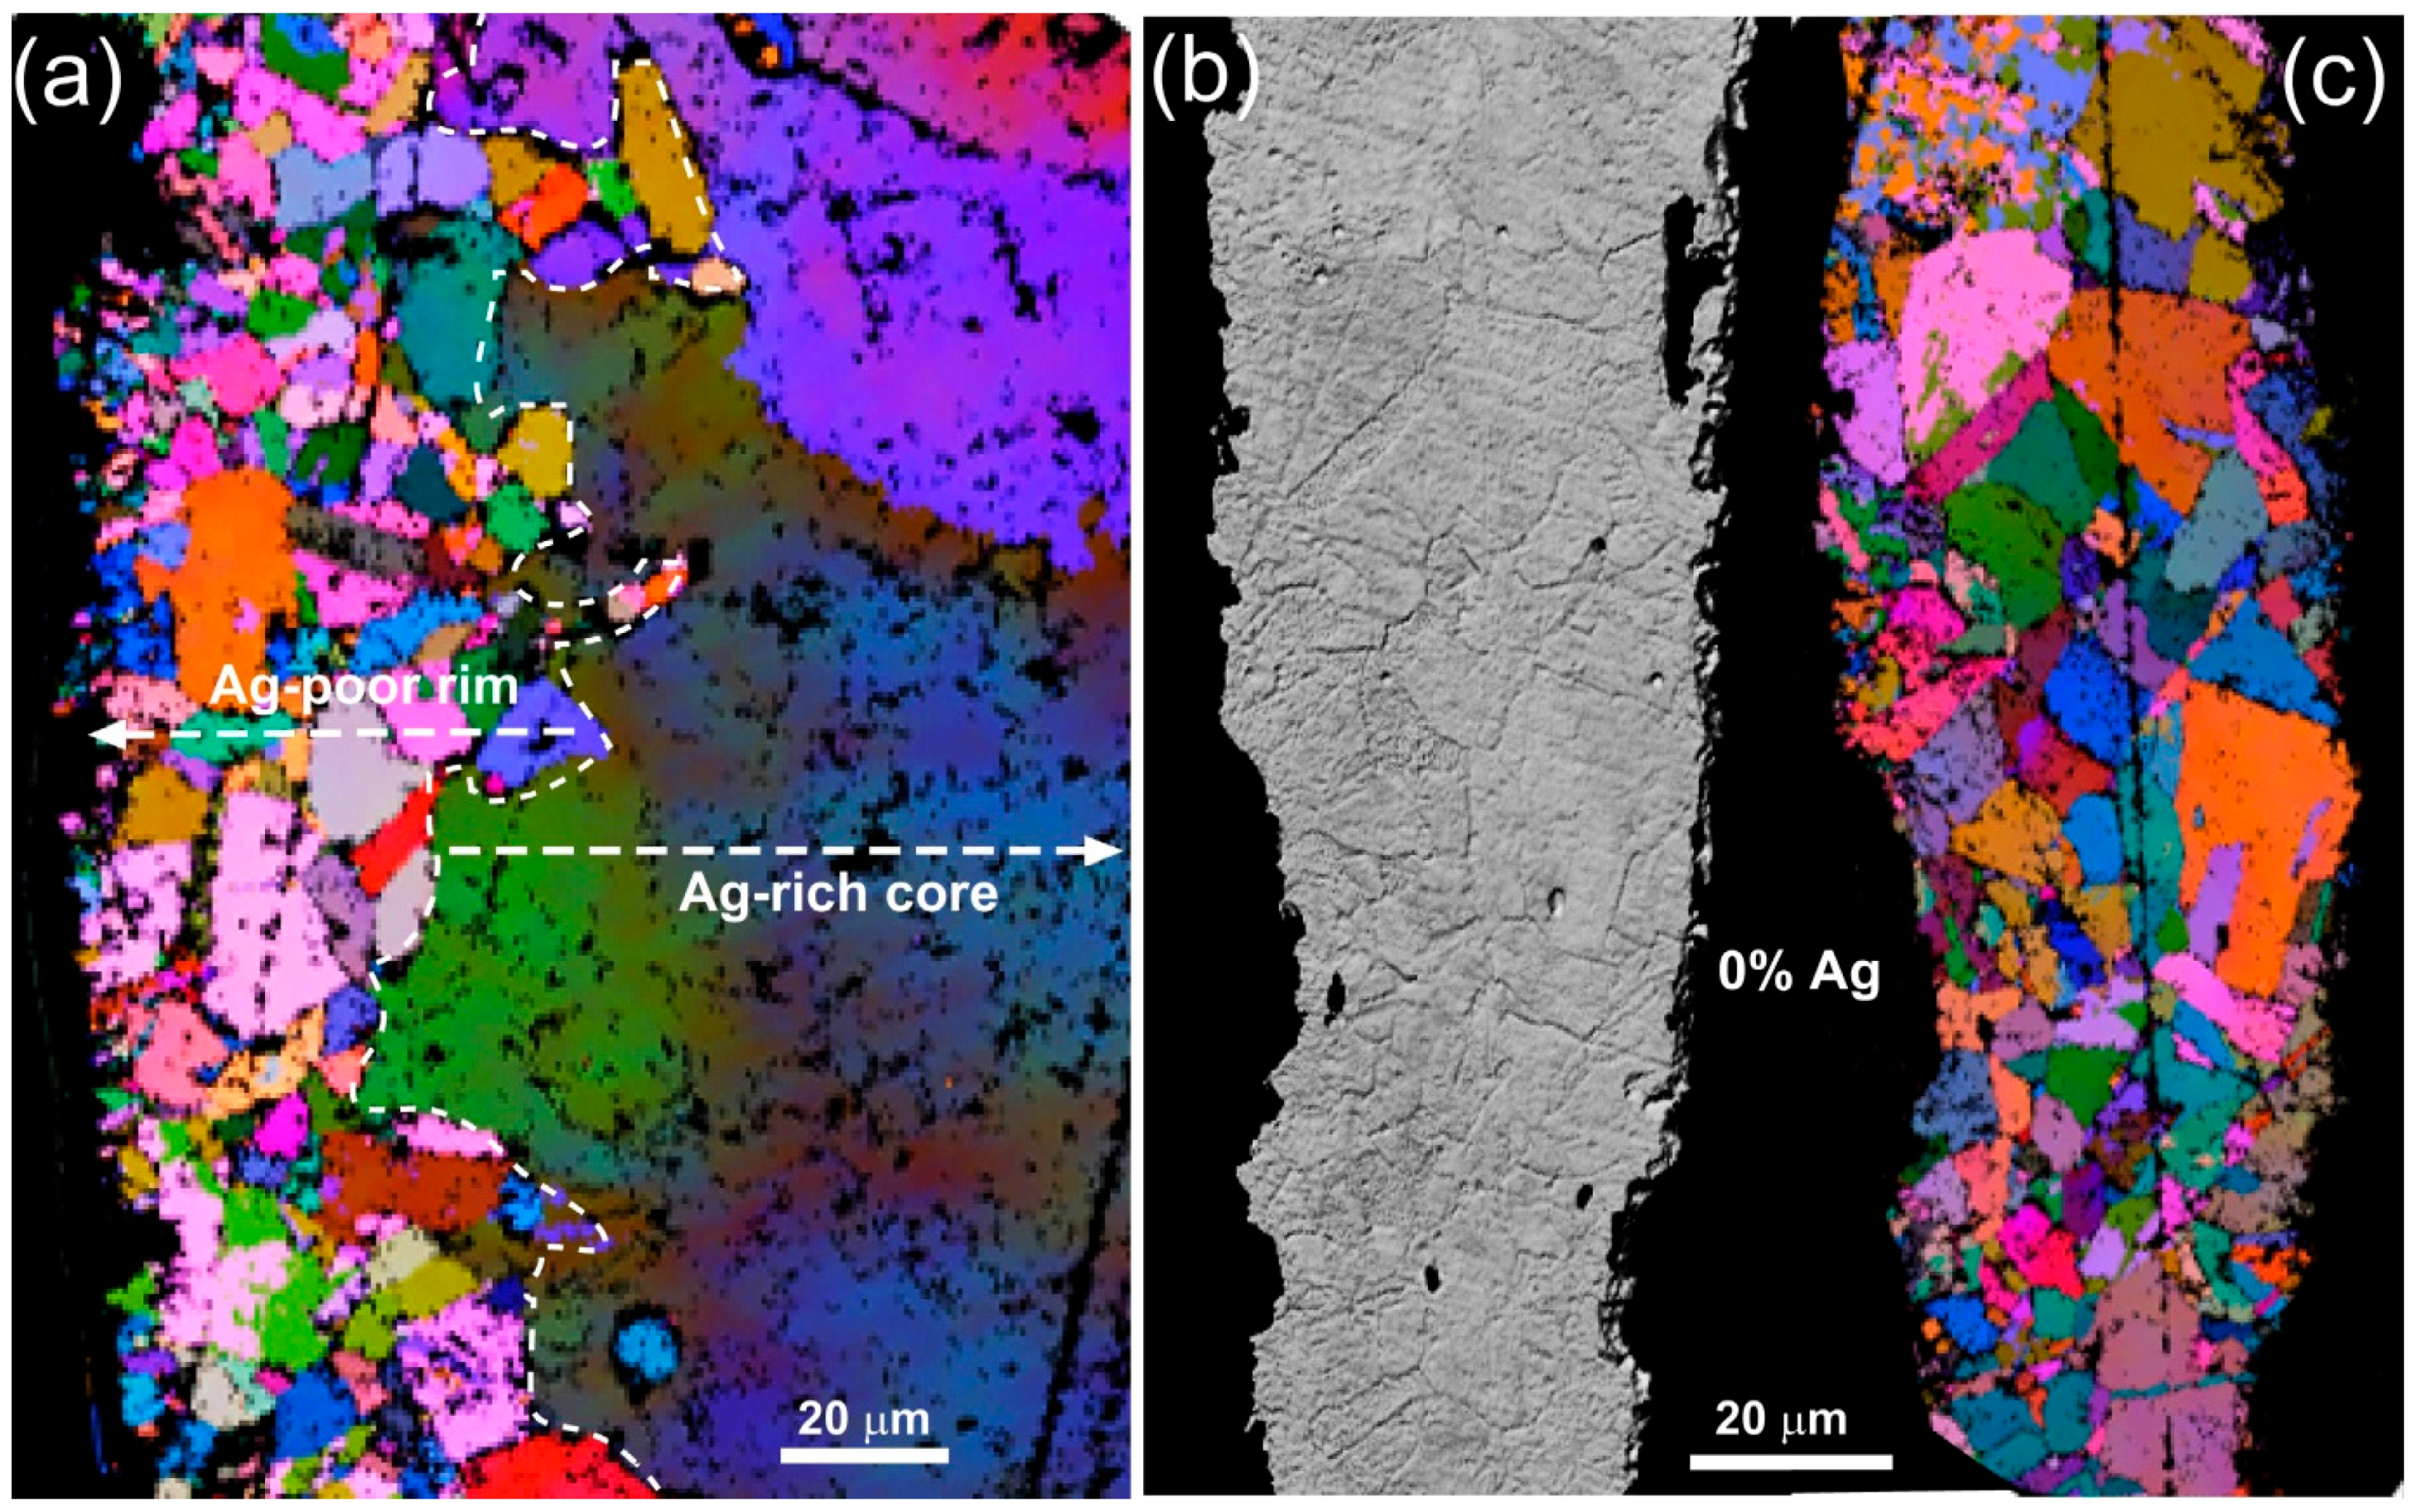
Figure 8.
Backscatter electron images of micron and submicron scale overgrowth gold on Waikaia gold particles and exterior clay-filled cavities in those particles. The electron beam penetrates into the clay to image nanoparticulate gold intergrown with the clay. (a) Irregular gold overgrowths form thin plates on the surface of the detrital particle; (b) Lacy overgrowth gold is intergrown with clay in a cavity; (c) Nanoparticulate triangular and dodecahedral gold crystals are intergrown with clay in a cavity; (d) A large triangular gold crystal has overgrown a variably plated gold particle surface.

Figure 9.
Modelled bulk fineness of placer gold mine products (doré bars) that result from particles with varying proportions of Ag-poor rims, with a range of average core Au fineness relevant to the Waikaia placer mine (dashed box).
Figure 9.
Modelled bulk fineness of placer gold mine products (doré bars) that result from particles with varying proportions of Ag-poor rims, with a range of average core Au fineness relevant to the Waikaia placer mine (dashed box).
© 2017 by the authors. Licensee MDPI, Basel, Switzerland. This article is an open access article distributed under the terms and conditions of the Creative Commons Attribution (CC BY) license (http://creativecommons.org/licenses/by/4.0/).
Share and Cite
MDPI and ACS Style
Craw, D.; McLachlan, C.; Negrini, M.; Becker, N. Quantification and Prediction of Bulk Gold Fineness at Placer Gold Mines: A New Zealand Example. Minerals 2017, 7, 226. https://doi.org/10.3390/min7110226
AMA Style
Craw D, McLachlan C, Negrini M, Becker N. Quantification and Prediction of Bulk Gold Fineness at Placer Gold Mines: A New Zealand Example. Minerals. 2017; 7(11):226. https://doi.org/10.3390/min7110226
Chicago/Turabian StyleCraw, Dave, Christine McLachlan, Marianne Negrini, and Noel Becker. 2017. "Quantification and Prediction of Bulk Gold Fineness at Placer Gold Mines: A New Zealand Example" Minerals 7, no. 11: 226. https://doi.org/10.3390/min7110226
Note that from the first issue of 2016, this journal uses article numbers instead of page numbers. See further details here.