Effect of Flowing Water on Sr Sorption Changes of Hydrous Sodium Titanate

1
Department of Fukushima Technology Development, Japan Atomic Energy Agency, 4-33 Muramatsu, Tokai-mura, Ibaraki 319-1194, Japan
2
Graduate School of Engineering, Hokkaido University N13W8, Kita-ku, Sapporo, Hokkaido 060-8628, Japan
3
Division of Sustainable Resource Engineering, Faculty of Engineering, Hokkaido University, N13W8, Kita-ku, Sapporo, Hokkaido 060-8628, Japan
*
Author to whom correspondence should be addressed.
Minerals 2017, 7(12), 247; https://doi.org/10.3390/min7120247
Submission received: 10 November 2017
/
Revised: 4 December 2017
/
Accepted: 11 December 2017
/
Published: 14 December 2017
(This article belongs to the Special Issue Environmental Mineralogy)
Abstract
:Radioactive contaminated water has been generated at the Fukushima Daiichi Nuclear Power station (F1NPS). Hydrous sodium titanate (SrTreat®) is able to remove radioactive Strontium (Sr) from this water. Knowing the amount of radioactive nuclides in the used as-received SrTreat® is important for effective disposal and deposition of the F1NPS waste. This study investigated changes in the ability of SrTreat® to sorb Sr, and to understand the causes of changes in the sorbing. An investigation of the Sr sorption ability of SrTreat® is important for calculating the initial radioactive inventory of used SrTreat®. This study carries out Sr sorption studies with acid-base titrations and X-ray photoelectron spectroscopy (XPS) to characterize the properties. After exposure to simulated treated water for 99 h, the surface structure of the SrTreat® was changed, and the percentage of sorbed Sr and the buffer capacity for protons decreased. When the amount of radioactive nuclides contained in the used SrTreat® is calculated from the sorption data of the as-received SrTreat®, the radioactive Sr content will be overestimated with a concomitant increase in the deposition and disposal costs of the used SrTreat®.
1. Introduction
The Fukushima Daiichi Nuclear Power Station (F1NPS) was damaged by the earthquake and subsequent tsunami that struck Japan on 11 March 2011, and cleanup has been conducted by the Tokyo Electric Power Company, Inc. (TEPCO, Tokyo, Japan). The radioactive contaminated water that accumulated inside the reactor, turbine, and other buildings is being processed, and the resulting freshwater is used as a coolant for the fuel in the damaged reactor. The composition of the radioactive contaminated water has varied since the accident [1]. At the early stage, this contaminated water mixed with seawater originating from the tsunami, and also with the coolant used for the damaged reactor fuel. When TEPCO began the cleanup operations, the main aim was to remove Cesium (Cs) from the water. Currently, the radioactive contaminated water is treated by a “Treatment Facility” which has a “Cs Adsorption Apparatus” and a “Decontamination Facility” for removing radioactive Cs, together with a “Desalination Facility”, and a “Multi-nuclide Removal Facility”. The Multi-nuclide Removal Facility consists of “Pre-treatment Facilities” and an “Adsorption Tower”. This facility removes most of the radioactive material from the contaminated water, but does not extract 3H. In the Adsorption Tower of the Multi-nuclide Removal Facility, Strontium (Sr) is removed by hydrous sodium titanate (SrTreat®) [2], which is supplied as amorphous titanium oxide granules with the chemical formula NaxTiyOz [3].
Radioactive liquid waste has been generated during operation of nuclear power stations and reprocessing of spent nuclear fuels, in the production of nuclear materials for military applications, in mining and milling of Uranium (U), as well as during industrial and institutional application of radioisotopes. Several treatment options for these wastes are selected based on their consideration of chemical and biological characteristics of each waste, the costs associated with the treatment and disposal of the secondary liquid waste, and safety and risk assessment of physical protection and safeguards at a radioactive liquid waste management facility [4,5]. Titanate has been used in processes such as in-tank precipitation at the Savannah River Site in the United States of America, and for packing to a column at the Japan Atomic Energy Research Institute in Japan [6,7].
Defining the characteristics of spent adsorbents is important for effective disposal and deposition of the F1NPS waste. In particular, the amount of radioactive nuclides sorbed by adsorbents must be calculated accurately. In previous studies [7,8,9], the Sr sorbed on SrTreat® has only been quantified in the treatment of radioactive liquid waste generated by conventional nuclear facilities. In addition, those studies conducted sorption experiments with nitrate aqueous solutions and limited concentrations of metals in solution. However, the experimental conditions used in those studies are not suitable for quantifying the content of radioactive Sr in SrTreat® used in the treatment of the radioactive contaminated water at F1NPS.
The composition of the radioactive contaminated water at F1NPS has varied as the coolant has changed from seawater to treated water. The process for treatment of radioactive contaminated water has changed over this period, and the adsorbents for the Adsorption Tower have been changed. As a result, the amount of sorbed elements on SrTreat® varies according to the effects of competing soluble elements in the radioactive contaminated water. In addition, the ability of sorbing elements of SrTreat® will change during use, and sorbed elements of SrTreat® will volatilize and elute during storage after use. Thus, it is difficult to calculate a radioactive inventory of used SrTreat® at processing from the reference data, because these matters cause uncertainties in the evaluation of the composition of the used SrTreat®. However, the IAEA reports that knowing the radioactive inventory of waste is necessary for the planning of decontamination activities. These activities include the sizing and design of processing facilities for waste storage and disposal [10]. Therefore, a method to characterize the radioactivity by analysis must be considered. However, the strong radioactivity of the used SrTreat® precludes sampling and accurate radioactivity analysis.
Although the operating conditions of the Multi-nuclide Removal Facility were not sufficiently considered in the planning stages, the long-term exposure of SrTreat® to the treated water can remove several elements from contaminated water at the upstream equipment. The pH of the treated water passing through the SrTreat® in the Adsorption Tower is adjusted to approximately 12 at a “Carbonate Coprecipitation Treatment Facility”, which is part of the Pre-treatment Facilities [11]. After use, the spent SrTreat® is discharged and temporarily stored in high-integrity containers in the Adsorption Tower at the Multi-nuclide Removal Facility until further disposal and deposition. During use, it is expected that the reactive groups and crystallization of SrTreat® change as a result of the exposure to treated water and radiation. During the storage period, the materials sorbed to SrTreat® will elute into residual water, and the SrTreat® will undergo radiolysis by the sorbing radioactive nuclides. In addition, the SrTreat® will crystallize due to the heat generated by exothermic reactions on 90Sr.
Here, we aim to determine the Sr sorption ability of SrTreat®, which is important in calculating an initial radioactive inventory of used SrTreat®. This makes the present study relevant when considering variations in the Sr sorption ability of SrTreat®, and aids understanding of the causes of variation. The study used Sr sorption studies, acid–base titration, and X-ray photoelectron spectroscopy (XPS) of the as-received SrTreat®. Materials included two kinds of titanates, as well as SrTreat® following exposure to the simulated treated water (the TEPCO term for water treated and discharged from the Treatment Facility).
2. Samples
2.1. SrTreat®
The SrTreat® is a commercial granular product made by Fortum, Finland. The granule size varies from 0.30 to 0.85 mm [3]. To avoid hydrolysis reactions (1), Fortum adds 0.1 mol/L NaOH aqueous solution in the final process of manufacturing [3].
NaxTiyOz + xH2O → HxTiyOz + xNa+ + xOH−
From batchwise sorption experiments with metal nitrate solutions, it was found that sorption with the as-received SrTreat® decreases in the order H+ > Ca2+ > Sr2+ >> Mg2+ > NH4+ > K+ > Li+ [12].
2.2. Sodium Titanate and Titanium Oxide
At the Multi-nuclide Removal Facility, the composition of SrTreat® was changed from NaxTiyOz to HxTiyOz by hydrolysis. To understand this change in more detail, customized sodium titanate and titanium oxide (Fuji Sangyo Co., Yokohama, Japan) were used. By comparing experimental and analytical Sr sorption behaviors on sodium titanate and titanium oxide, it becomes possible to understand how Na influences the adsorption affinity of Sr to SrTreat®.
Sodium titanate was synthesized by adding NaOH aqueous solution (0.8 mol/L) to dilute Ti{OCH(CH3)2}4 (tetraisopropyl orthotitanate) in C6H5CH3 (toluene) (2 mol-Ti/L) in equal volume. All reagents were purchased Wako Pure Chemical Industries, Ltd. (Osaka, Japan). After 4 h mixing, white precipitate was collected by filtration with filter paper No.5A (Advantec Co., Ltd., Tokyo, Japan). Then, white precipitate was washed with distilled water, dried at 105 °C, and crushed to 0.30–0.85 mm. Titanium oxide was synthesized by a similar procedure with synthesized sodium titanate. However, this process used diluted water in the place of NaOH aqueous solution.
2.3. Solid Phase of Titanates
The X-ray diffractometry (XRD) patterns of the three titanates were obtained to verify that the as-received SrTreat® was amorphous, and that the ordered titanates were not appreciably crystalized. The samples were well-ground in an agate mortar to a particle size below 10 µm, and then placed in a reflection-free sample holder. The crystallographic structure of the samples was identified in the 2θ = 2°–70° range by a Rigaku XRD instrument (RINT-2100, Rigaku Co., Ltd., Akishima-shi, Japan) with Cu-Kα radiation.
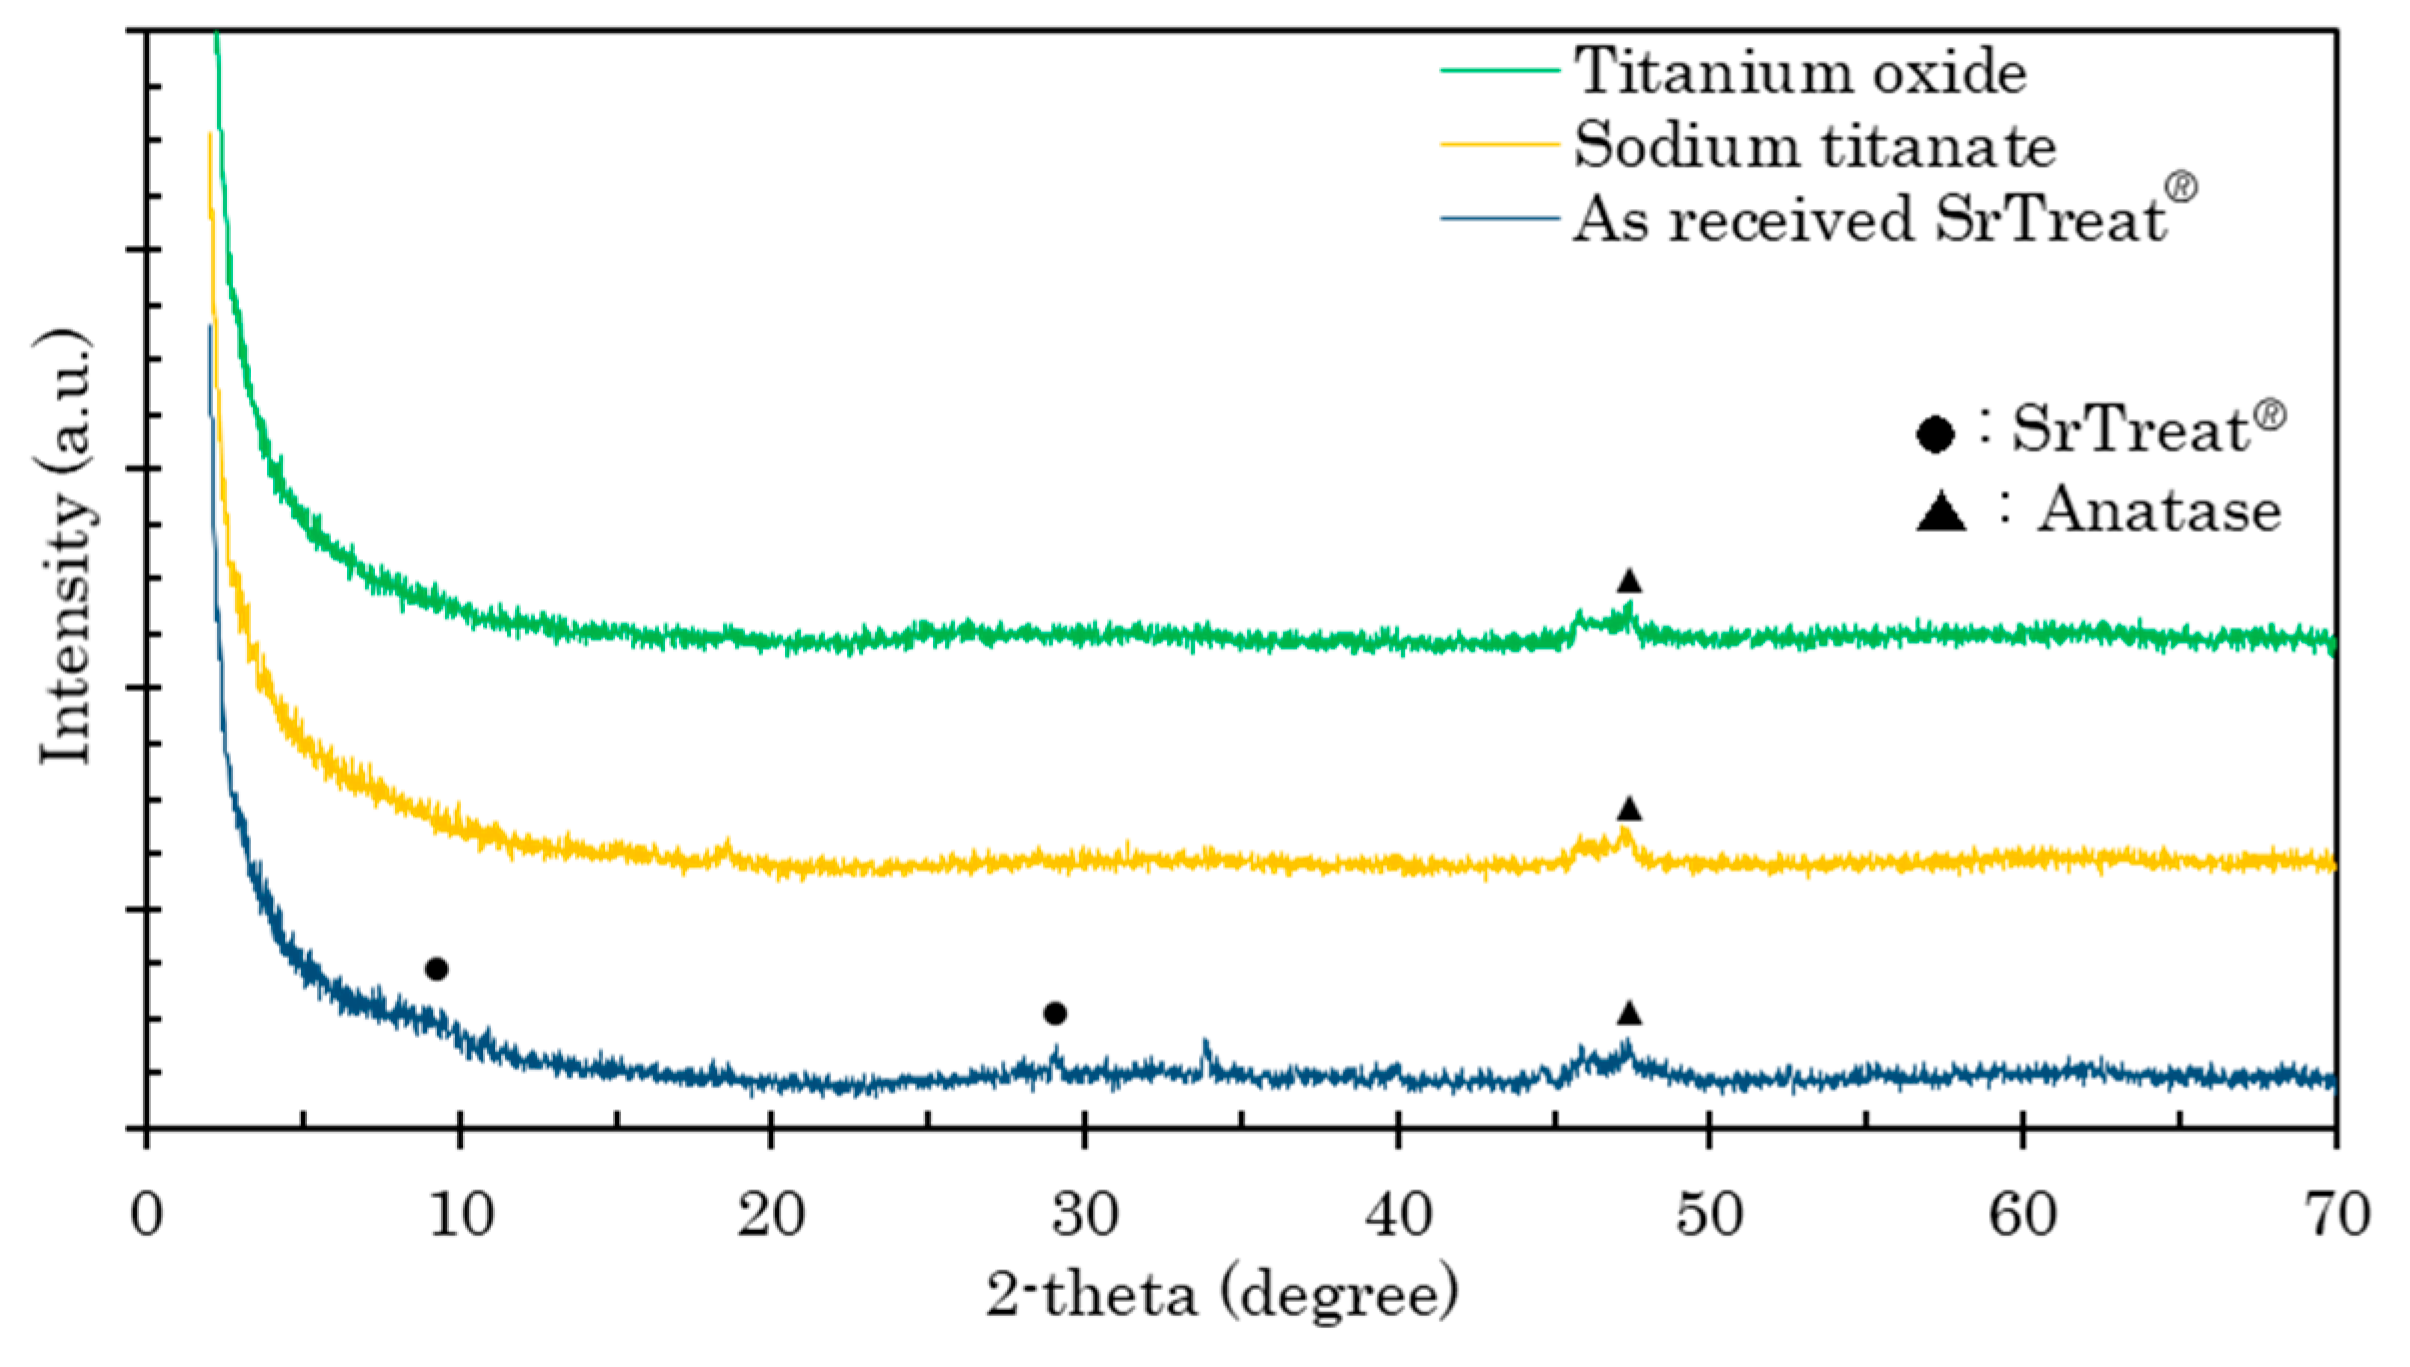
The XRD patterns of the samples are shown in Figure 1. The XRD pattern of the as-received SrTreat® featured a broad diffraction peak at 9°, and small peaks at 18°–19°, 29°, and 34°. The peaks at 9° and 29° agreed with those reported in the patent [3], but the other peaks are not reported there. The unidentified small peak at 19° appeared at this position in the XRD pattern of sodium titanate. The continuous diffraction peak at 45°–49° appeared in the XRD patterns of all samples. This peak would appear to be associated with the 48.02° peak on the anatase spectrum.
The absence of noticeable peaks in the spectra of all titanates in the present study confirmed the approximately amorphous state of the fine crystal structure, and sodium titanate was confirmed as similar to SrTreat® in crystallinity.
2.4. Chemical Compositions of Samples
The chemical compositions and impurity amounts in the titanates investigated in the present study were analyzed by energy dispersive X-ray (EDX) spectroscopy operated at 15 kV on a Swift ED 3000 OXFORD instrument (Abingdon, UK). For the EDX, a granule of sample was affixed on a specimen support (Nisshin EM Co., Ltd., Tokyo, Japan) by aluminum-based carbon tape (Nisshin EM Co., Ltd., Tokyo, Japan), and three granules of each of the samples were analyzed.
The ratios of the elements in the samples measured by EDX are listed in Table 1. Only Ti and Na were detected in the samples. Titanium oxide contained a small amount of Na, and the sample was considered to be pure titanium oxide. The chemical compositions of the titanates in this study were estimated to be NaxH(2−x)TiO3, assuming that TiO3 combines with one of the two of Na or H. Table 2 shows the estimated chemical compositions. This assumption is suggested by the ideal chemical composition of perovskite (CaTiO3).
3. Experimental
Solutions for all experiments were prepared by dissolving the components in ion-exchanged water. All reagents were special grade (Japanese Industrial Standards), and were purchased from Wako Pure Chemical Industries, Ltd., Osaka, Japan.
3.1. Changes to SrTreat® after the Simulated Treated Water Exposure
To understand the initial reaction of the SrTreat® in the Adsorption Tower at the Multi-nuclide Removal Facility, a solution was passed through a column filled with SrTreat®. The composition of the solution matched that of the treated water flowing to the Adsorption Tower during the initial period of the SrTreat® usage in the Multi-nuclide Removal Facility. When the Multi-nuclide Removal Facility commenced operation in March of 2013, the radioactive contaminated water was still mixed with the seawater washed ashore by the tsunami. This water also contained coolant from the damaged reactors. The equipment upstream of the Adsorption Tower did not remove Na+, K+, and Cl− ions from the radioactive contaminated water, and a large part of the content of the treated water flowing to the Adsorption Tower contained these ions. To match this, the simulated treated water was prepared by dissolving NaCl and KCl in ion-exchanged water, and the concentrations of Na+, K+, and Cl− in the simulated treated water were 0.16, 0.0034, and 0.15 mol/L respectively. These values are in accordance with typical seawater ratios [13]. The pH of the simulated treated water was adjusted to 12 using NaOH. This value replicates the pH of the Pre-treatment Facility water. Table 3 details the particulars of the simulated treated water flowing through the SrTreat® column.
Ion chromatography was used to analyze the Na+, K+, and Cl− concentrations in the simulated treated water, as well as and their fractions of the effluent through the column. Concentrations of Ti in the fractions of effluent through the column were analyzed by Inductively Coupled Plasma–Optical Emission Spectrometry (ICP–OES) SPS5000 (Seiko Instruments Inc., Chiba, Japan), and the pH was measured by an HM-30R meter (DKK-TOA Co., Tokyo, Japan) with a glass electrode.
3.2. Sorption Experiments
Batchwise sorption experiments were carried out with Sr solution in order to estimate the amount of Sr sorbed at various pHs with the as-received SrTreat®, sodium titanate, titanium oxide, and SrTreat® after the simulated treated water exposure.
The experimental conditions were determined by batchwise Sr sorption experiments for shaking for 5–360 min at room temperature for two basic titanates. The experiments were then conducted at various pH levels. Batchwise experiments were conducted on the as-received SrTreat® by shaking with 20 mL of 50 mmol/L SrCl2 solution and 0.89 g of titanate. Experiments on sodium titanate were conducted with 10 mL of 20 mmol/L and 0.10 g of titanate. The solid and liquid phases were separated by filtering through a polytetrafluoroethylene membrane with a pore size of 0.45 µm. Concentrations of Sr and Na in the liquid phases were measured by Atomic Absorption Spectroscopy (AAS) iCE3300 (Thermo Fisher Scientific Inc., Waltham, MA, USA).
The stock solutions contained 0.1–10 mmol/L SrCl2 and 0.1 mol/L NaCl. Fifty milliliters of a stock solution was added to 0.050 g of a sample weighed in a polypropylene bottle. After adding HCl or NaOH solution to maintain the pH, the bottle was shaken at 25 °C for 5 h. The solid and liquid phases were separated by filtering through a polytetrafluoroethylene membrane with a pore size of 0.45 µm. The pH and concentrations of Sr in the liquid phases were measured by a pH meter with a glass electrode, and by ICP–OES. When the pH of the liquid exceeded 9, the experiments were conducted in the absence of CO2, because the Sr2+ in the stock solution precipitates as SrCO3 above a pH of 10 [14]. Before adding the stock and pH-adjusted solutions to the bottle with a sample, both the stock and pH-adjusted solutions were purged with N2 gas for 30 min. The addition of the solutions and pH measurements were then conducted in a glove bag under an N2 atmosphere.
3.3. Acid–Base Titration
To evaluate the amount of cations and anions that reacted with the as-received SrTreat®, sodium titanate, titanium oxide, and SrTreat® after the simulated treated water exposure, an acid–base titration curve was created for each sample: a suspension with 0.075 g of a sample in 75 mL of 0.1 mol/L NaCl solution, and a solution of titrants HCl and NaOH. The suspension was placed in a glass vessel with a stirring bar supported over its base by a fish-clip® to avoid disturbing the structure of the granules, and purged with moist N2 gas to remove any CO2. Titrants were added to the suspension by a fixed-volume micropipette (Eppendorf Reference 2, Eppendorf AG, Hamburg, Germany). The pH of the suspension was measured by the pH meter using a glass electrode. The pH was assumed to be equilibrated when the pH varied by less than ±0.1 over a 30-min interval.
3.4. XPS Analysis
Analysis by X-ray photoelectron spectrometer (XPS) was conducted to understand details of the mechanism of Sr sorption with the titanate investigated in the present study. This was performed by analyzing the binding condition of the elements composing the surface of the samples. The analysis was carried out on a JPS-9200, (JEOL Ltd. Tokyo, Japan). The XPS spectra were recorded with Mg-Kα radiation (hv = 1253.6 eV), with the pressure of the analyzer chamber maintained at around 5 × 10⁻⁸ Pa, and the shift of the binding energy was corrected by the C1s peak of 285.0 eV as an internal standard.
4. Results and Discussion
4.1. SrTreat® Reaction by Exposure to the Simulated Treated Water
The Na+ and Cl− concentrations in the fractions of effluent through the column were not different from those in the simulated treated water, and the K+ concentration and pH in the fractions varied as shown in Figure 2. Along the left vertical axis of Figure 2, the K+ concentration of the fraction of effluent through the column (C, mol/L) is normalized with that in the simulated treated water (C0, mol/L). The horizontal axis is calculated as the volume of the sum of effluent from the column (mL) divided by the volume of the column filled with SrTreat® (cm3).
The C/C0 of K+ in the elute was not calculated at the start, because the concentrations of K+ in the fractions were below the determination limit. After the initial period, the C/C0 increased and saturated at 1.0. This implies that K+ was sorbed to saturation on the SrTreat®. Initially, the pH was lower in the fractions of effluent than in the simulated treated water, because H+ ions were released from SrTreat®. The concentration of Ti in the fractions of effluent was below 0.58 µmol/L, and the total Ti discharge from the column was calculated as 7.5 mg. This is negligible compared to the weight of SrTreat® filled in the column (34 g).
After the simulated treated water exposure, the ratios of Ti, Na, and K on the SrTreat® measured by EDX were 69, 27, and 1.6 mol %, respectively. The chemical composition of SrTreat® after the simulated treated water exposure was estimated as Na0.39K0.023H1.6TiO3, assuming the chemical composition of NaxKyH(2−x−y)TiO3. This is the likely chemical composition of the SrTreat® in the Adsorption Tower at the Multi-nuclide Removal Facility after 4 days of use.
4.2. Sr Sorption
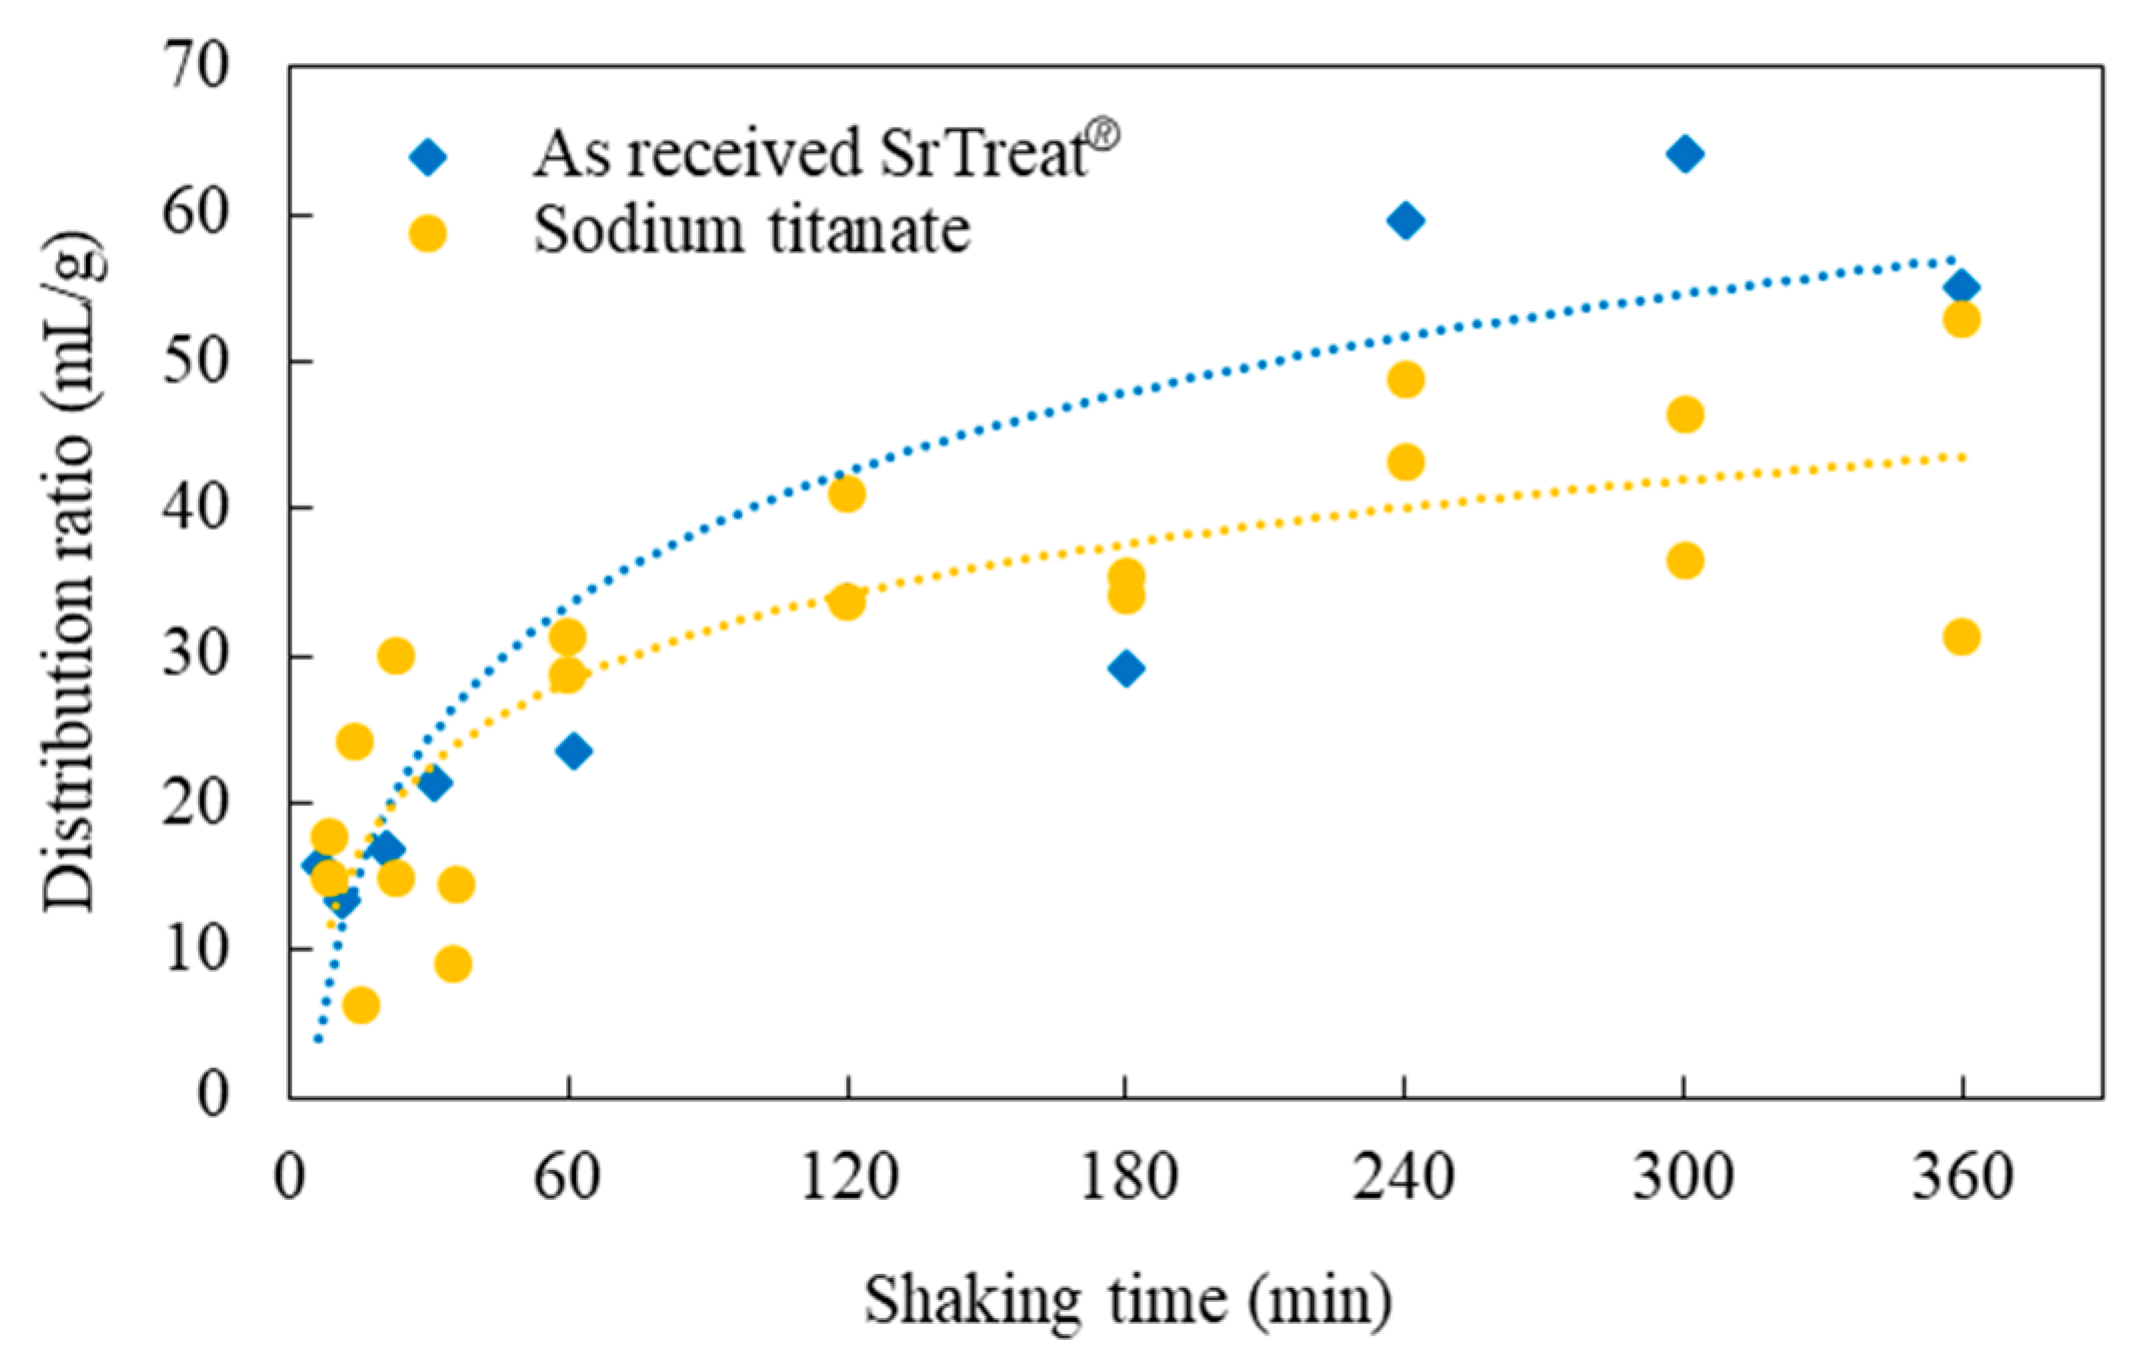
Figure 3 shows the time dependency of the distribution ratio on the as-received SrTreat® and sodium titanate. A distribution ratio (Kd) was calculated by Equation (2);
where Ctot and Caq are the concentrations of Sr in the stock solution (mmol/L) and the liquid phase of the mixture (mmol/L), V is the total volume (mL), and m is mass of titanate (g). Kd of two titanates increased depending on shaking time, and became constant at 240 min.
Kd (mL/g) = (Ctot − Caq)/Ctot × V/m
Figure 4 shows the percentage of sorbed Sr with the titanates calculated as:
Sorbed Sr (%) = (Ctot − Caq)/Ctot × 100
The as-received SrTreat® and sodium titanate were not sorbed on Sr in the 2–4 pH range. The percentage of sorbed Sr increased with increasing pH of the as-received SrTreat®. Sodium titanate sorbed Sr less than the as-received SrTreat® at each pH, and largely agreed with the percentage of sorbed Sr, except above pH 8 where it was considerably lower. The percentage of sorbed Sr on titanium oxide was lowest below pH 7, and exceeded that on sodium titanate at pH 12.
Figure 5 compares the percentage of sorbed Sr on the as-received SrTreat®, the SrTreat® after the simulated treated water exposure, sodium titanate, and titanium oxide. The amount of Sr sorbed on the SrTreat® decreased after the simulated treated water exposure, when the equilibrium Sr concentration was 0.01–5 Sr mmol/L. The EDX results suggest that after the simulated treated water exposure, some of the Na at the SrTreat® surface was exchanged for H and K, and this exchange may have decreased the amount of Sr sorbed on SrTreat®. The percentage of sorbed Sr was higher on titanium oxide than on sodium titanate at all equilibrium Sr concentrations. For the order of sorption ability of ions on the as-received SrTreat® [12], the few H+ ions available at pH 12 may be a cause of the sorption of the other cation onto titanate under highly alkaline conditions. Titanium oxide captures these cations into its structure more easily than at a lower pH. Titanium oxide sorbed Sr when the equilibrium pH of the mixture was 12, whereas sodium titanate sorbed Sr after releasing Na. As Sr sorption on titanium oxide is a single-step process, the percentage of sorbed Sr at pH 12 was higher on titanium oxide than on sodium titanate.
The amount of Sr in the SrTreat® (C′) was calculated by Equation (4).
The amount of Sr in the SrTreat® (mmol/g) = (Ctot − Caq) × (V/1000)/m
Amount of Sr in the SrTreat® before and after the simulated water exposure is shown in Figure 6. The isotherm was expressed by the following equation;
where qe is the amount of Sr in the titanate, KF and 1/nF are Freundlich’s constants of sorption capacity and sorption intensity.
qe (mmol/g) = KF Caq 1/nF
The data of batchwise Sr sorption experiments on SrTreat followed the Freundlich isotherm, and KF decreased after the simulated treated water exposure. Batchwise Sr sorption experiments for sodium titanate were given the same pretreatment as for SrTreat®. Experiments were then conducted, and the decrease of sorbed Sr arose on Sodium titanate after the simulated treated water exposure. SrTreat® is supplied to the Multi-nuclide Removal Facility for treatment of the radioactive contaminated water at F1NPS. Thus only the Sr sorption data about SrTreat® was discussed in this paper.
4.3. Acid–Base Titration
The measured and theoretical titration curves are shown in Figure 7. The buffer capacity for H+ was larger in the as-received SrTreat® than in the SrTreat® after the simulated treated water exposure. This demonstrated that the amount of reaction with cations on SrTreat® decreases after the simulated treated water exposure. The buffer capacity for H+ was significantly higher in sodium titanate than in titanium oxide. The results confirmed that the Na on the titanate group increased the buffer capacity for H+. The buffer capacity for OH− was small in all samples, and overall the titanates in the present study reacted little with anions.
In suspensions of the as-received SrTreat®, the SrTreat® after the simulated treated water exposure, and sodium titanate, the initial pH was approximately 10. Hydrogen ions react with anatase PK5585 (Bayer AG, Leverkusen, Germany) as shown in Equations (6)–(8). Ludwig and Schindler, who described these reactions, also confirm the dominance of the postulated surface species in 0.1 mol/L KNO3 aqueous solution, (TiOH)(TiOH2)+ at pH below 4.5 in solution, (TiOH)2 at pH 4.5–8.0, (TiOH)(TiO)− at pH 8.0–11.0, and at pH over 11.0 [15].
(TiOH)2 + H+ ⇄ (TiOH)(TiOH2)+
(TiOH)2 ⇄ (TiOH)(TiO)− + H+
From the EDX results, the as-received SrTreat® and sodium titanate differ from anatase only by the presence of Na or H. From the XRD results, the crystal structure of these two samples was suggested to be associated with anatase. Based on Ludwig and Schindler, the following reactions of the as-received SrTreat® and sodium titanate in the acid–base titration were:
where X denotes H and Na, Na is for the composition of titanate. From the suspension of the as-received SrTreat® and sodium titanate with an approximate pH of 10, the dominant surface species was initially (TiOX)(TiO)−. During the base titration, the dominant surface species shifted to as the reaction proceeded to the right-hand side of Equation (11). In the acid titration, increasing amounts of H+ were added to the (TiOX)(TiO)−, and the dominant surface species shifted from (TiOX)(TiOH) to (TiOX)(TiOH2)+ at pH below 4.5. The amount of reacting H+ with the as-received SrTreat® was larger than in sodium titanate considering the differences in the slope of the titration curves. This suggested a preferential reaction to the right side of Equation (9), and to the left side of Equation (10) on the as-received SrTreat® compared to sodium titanate.
(TiOX)2 + H+ ⇄ (TiOX)(TiOXH)+
(TiOX)2 ⇄ (TiOX)(TiO)− + X+
From the XRD and the EDX results, the titanium oxide in this study had a crystal structure and similar chemical composition compared with the anatase in Ludwig and Schindler. These suggest that the pH-dependence of the surface species and reactions would follow Equations (6)–(8). As the pH of the initial titanium oxide suspension was approximately 7, the dominant surface species may be considered to be (TiOH)2. During the base titration, the dominant surface species shifted to by way of (TiOH)(TiO)−. During the acid titration, it further shifted to (TiOH)(TiOH2)+ along Equation (6).
4.4. Relation between the Titanate Surface Structure and Sr Sorption Ability
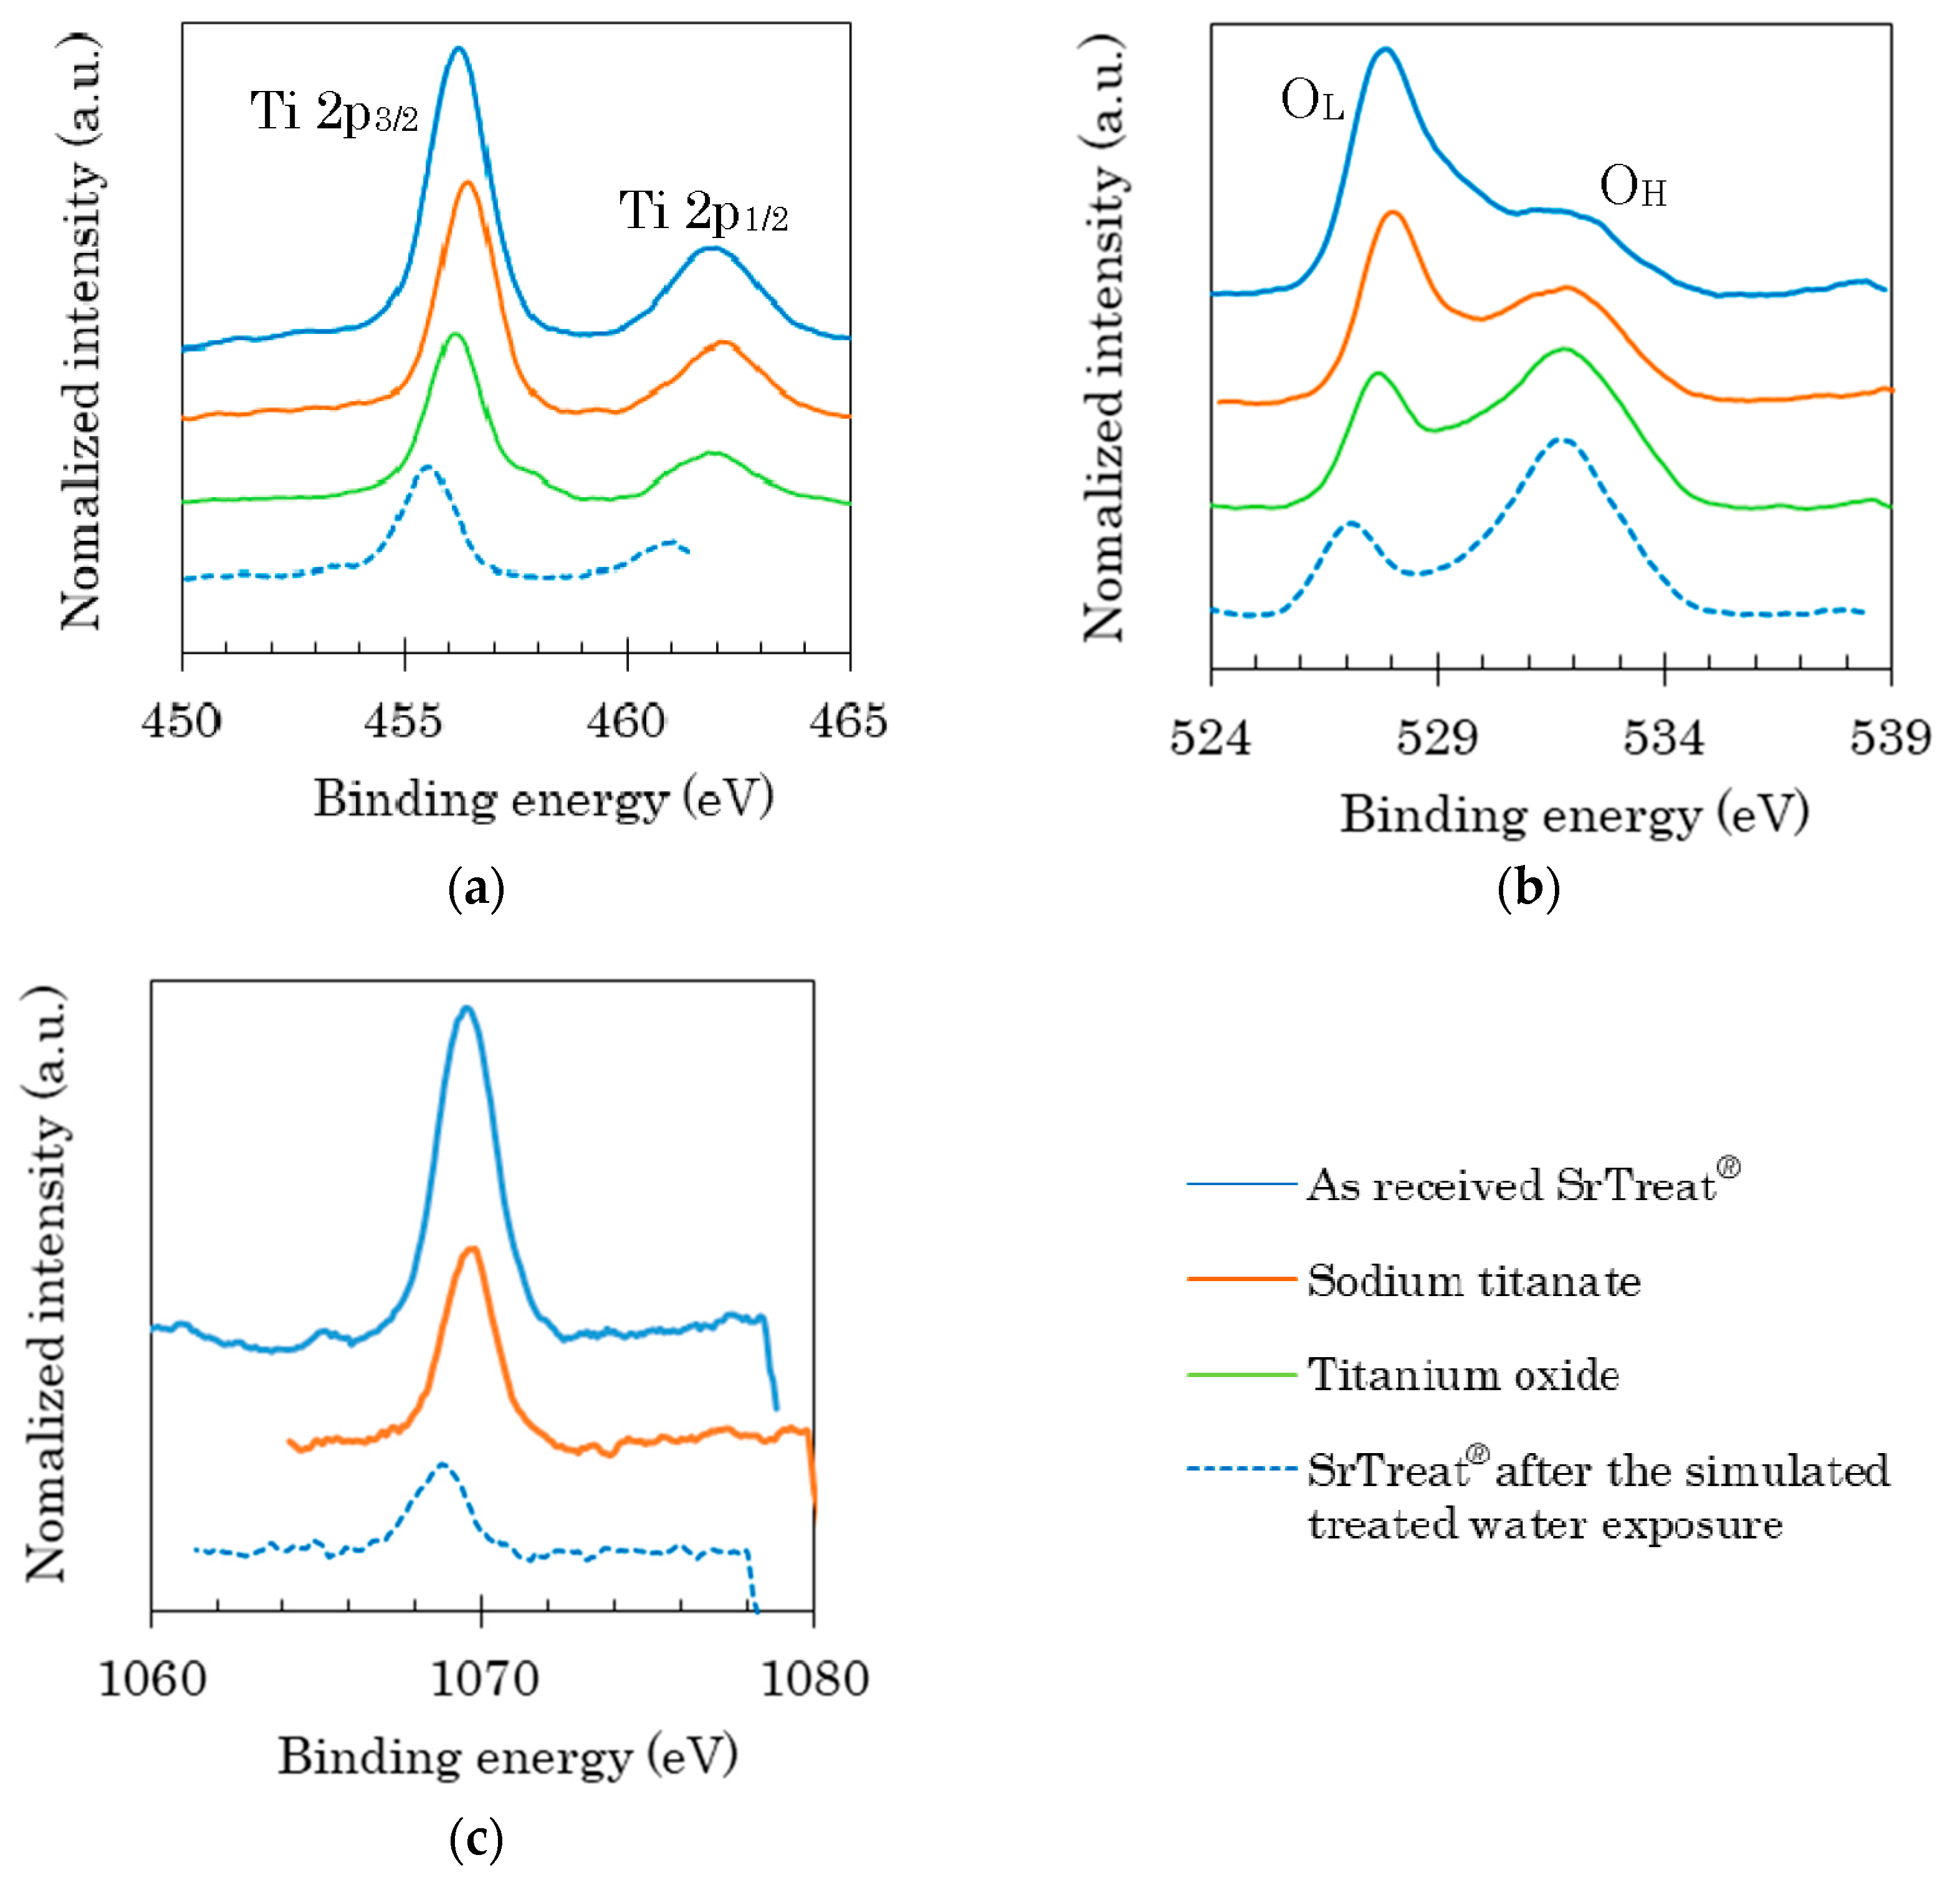
Despite their similar chemical compositions, the as-received SrTreat® and sodium titanate exhibited different Sr sorption abilities and different buffer capacities for H+, and these differences were observed in SrTreat® both before and after the simulated treated water exposure. To understand these differences, the different samples were analyzed by XPS. Figure 8 shows the XPS spectra of the four samples at bond energies corresponding to Ti2p, O1s, and Na1s in panels (a–c), respectively. The intensity ratios of the peaks are listed in Table 4. The peaks at 456 eV and 462 eV in Figure 8a can be attributed to Ti2p3/2 and Ti2p1/2 [16]. The peaks at 527.5 eV and 531.5 eV on Figure 8b apply to lattice oxygen and O–H bonds [17], and the peaks of lattice oxygen is termed OL, and that of the O–H bond OH. Here, the lattice oxygen refers to a bond between oxygen and a metal.
The peak positions for Ti2p differed by 0.2 eV in sodium titanate and titanium oxide, both Ti2p peaks shifting toward higher energies when the Ti content of the material is lower [18], indicating a decrease in Ti3+ and an increase in Ti4+ [16,19]. Replacement with Na in the titanium oxide was confirmed to increase the Ti4+ proportion. The OL/OH ratio was higher in sodium titanate than in titanium oxide, because the replacement of Na increased the peak intensity of OL.
The intensity ratio of Ti2p3/2/Ti2p1/2 was higher in the as-received SrTreat® than in sodium titanate, and the binding energies of both Ti peaks were lower in the as-received SrTreat® than in sodium titanate. Therefore, the energy levels of the 2p orbital of Ti4+ on the two kinds of sodium titanates were different, showing a slightly higher ratio of Ti3+ on the as-received SrTreat® than on sodium titanate. The ratio of OL/OH on the as-received SrTreat® was higher than in sodium titanate. In addition, the peak intensity of Na1s on SrTreat® was larger than in the sodium titanate, as shown in Figure 8c. A high availability of Na causes a high value of the ratio of OL/OH on the as-received SrTreat®, as the ratio of OL/OH of sodium titanate was higher than that of titanium oxide. There were some differences in the surface composition between the as-received SrTreat® and sodium titanate. These differences determine the Sr sorption abilities and the buffer capacity for H+ of the two kinds of titanate.
The positions of the Ti peaks shifted to lower energies, and the Ti2p3/2/Ti2p1/2 ratio also decreased on the SrTreat® after the simulated treated water exposure. Exposing the simulated treated water to the SrTreat® increased the Ti3+ ratio at the surface of SrTreat®, and changed the energy level of the 2p orbital in the Ti4+ state of the SrTreat®. After the simulated treated water exposure, the OL peak position in the SrTreat® spectrum shifted to a lower energy, and the OL/OH ratio and peak Na1s intensity decreased. The decreased OL/OH ratio after the simulated treated water exposure may be ascribed to a reduced number of Na ions in the titanate groups in SrTreat®. This result cannot be attributed to fewer Ti–O bonds (the basic bond of SrTreat®) because the Ti eluted from the SrTreat® column was not evaluated from the concentrations of Ti in the fractions of effluent through the column. The exposure to the simulated treated water clearly changed the chemical bond conditions at the surface of SrTreat®. These changes were likely related to the decreased percentage of sorbed Sr, and the buffer capacity for H+ on the SrTreat® after the simulated treated water exposure.
From the XPS analyses of the SrTreat® surfaces before and after the simulated treated water exposure, it may be assumed that the surface structure of SrTreat® in the Multi-nuclide Removal Facility changed from the situation at the start of its use. Furthermore, the Sr sorption experiments imply that the amount of Sr sorbed on the used SrTreat® was smaller than that estimated from the ability of Sr sorption of the as-received SrTreat®. In conclusion, when the Sr content in the used SrTreat® is calculated from the data of the as-received SrTreat®, the results will lead to an overestimation of the amount of radioactive Sr in the used SrTreat®. When the radiation and the radioactive inventory of the used SrTreat® rise above accuracy estimated values, the need for radiation shielding at the treatment facility will be excessive for the actual radioactivity on the used SrTreat®. In addition, the treatment and end-point for used SrTreat® will be inaccurate and exceed the radioactive inventory of the used SrTreat®. The excessively large values will demand an increase in the disposal and deposition costs of the used SrTreat®.
5. Conclusions
The TEPCO decontaminated radioactive contaminated water generated at Fukushima Daiichi Nuclear Power Station (F1NPS) generated after the major earthquakes and tsunami that struck the region in March of 2011 has been treated by use of SrTreat® to recover Sr at the Adsorption Tower of the Multi-nuclide Removal Facility. It is important to distinguish the changing chemical composition of SrTreat® during its use in order to evaluate the amount of radioactive nuclides sorbed in the used SrTreat®. To understand the changes in the Sr sorption ability of SrTreat® after the simulated treated water exposure, as well as the cause of this change, we carried out Sr sorption experiments and an XPS analysis. Additionally, we established the acid–base titration curves of the as-received SrTreat®, sodium titanate, titanium oxide, and SrTreat® after exposure to the simulated treated water that was injected to the Adsorption Tower filled with SrTreat®. After simulated treated water exposure for 99 h, the chemical composition of SrTreat® changed from Na0.64H1.5TiO3 to Na0.39K0.023H1.6TiO3. The chemical bond conditions at the surface of SrTreat® also changed. In addition, a decrease in the percentage of sorbed Sr on SrTreat® was observed. The buffer capacity for H+ of the SrTreat® also declined after the simulated treated water exposure. The surface structure of the SrTreat® in the Multi-nuclide Removal Facility changes from the start of its use, and the amount of Sr sorbed on the used SrTreat® is lower than that estimated from the percentage of sorbed Sr on the as-received SrTreat®. From these results, the amount of radioactive nuclides in the used SrTreat® can be calculated from the sorption data of the as-received SrTreat®. However, the nuclide content in the used SrTreat® will be overestimated, resulting in unnecessary and increased costs of disposal and deposition of the used SrTreat®.
Acknowledgments
This paper includes parts of the results obtained from the “Development of technology for processing and disposal of solid wastes”, study commissioned by the International Research Institute for Nuclear Decommissioning (IRID) and was carried out as per the supplementary budget for the fiscal year 2013, allocated for decommissioning and contaminated water treatment. This work was conducted at the Laboratory of XPS analysis, Hokkaido University, supported by the “Nanotechnology Platform” Program of the Ministry of Education, Culture, Sports, Science and Technology (MEXT), Japan. We wish to thank Fortum Corporation for donation of the SrTreat®. We received generous support in the analysis from students in the laboratory of environmental geology, Hokkaido University.
Author Contributions
Youko Takahatake performed the experiments and analysis, and wrote the paper. Atsuhiro Shibata proposed the idea of this research and took part in discussing the results. Kazunori Nomura gave many ideas for the column experiment and Sr sorption experiments and was the supervisor of this study. Tsutomu Sato provided recommendations for the investigation process and provided helpful suggestions.
Conflicts of Interest
The authors declare no conflict of interest.
References
- Shibata, A.; Koma, Y.; Ohi, T. Estimation of the inventory of the radioactive wastes in Fukushima Daiichi NPS with a radionuclide transport model in the contaminated water. J. Nucl. Sci. Technol. 2016, 53, 1933–1942. [Google Scholar] [CrossRef]
- Tusa, E. Efficiency of Fortum’s CsTreat® and SrTreat® in Cesium and Strontium Removal in Fukushima Daiichi NPP. In Proceedings of the European Nuclear Conference 2014, Marseille, France, 11–14 May 2014. [Google Scholar]
- Lehto, J.; Leinonen, H.; Harjula, R. Granular Titnate Ion Exchangers and Method for Preparation Thereof. International Patent WO 97/23290, 3 July 1997. [Google Scholar]
- Rahman, R.O.A.; Ibrahium, H.A.; Hung, Y.-T. Liquid Radioactive Wastes Treatment: A Review. Water 2011, 3, 551–565. [Google Scholar] [CrossRef]
- International Atomic Energy Agency. Combined Methods for Liquid Radioactive Waste Treatment; IAEA-TECDOC-1336; International Atomic Energy Agency: Vienna, Austria, 2003; p. 17. ISBN 92-0-100903-8. [Google Scholar]
- International Atomic Energy Agency. Application of Ion Exchange Processes for the Treatment of Radioactive Waste and Management of Spent Ion Exchangers; Technical Report Series, No. 408; International Atomic Energy Agency: Vienna, Austria, 2002; p. 18. ISBN 92-0-112002-8. [Google Scholar]
- Lehto, J.; Brodkin, L.; Harjula, R.; Tusa, E. Separation of Radioactive Strontium from Alkaline Nuclear Waste Solutions with the Highly Effective Ion Exchanger SrTreat. Nucl. Technol. 1999, 127, 81–87. [Google Scholar] [CrossRef]
- Tusa, E.; Harjula, R.; Yarnell, P. Fifteen Years of Operation with Inorganic Highly Selective Ion Exchange Materials. In Proceedings of the WM’07 Conference, Tucson, America, 25 February–1 March 2007. [Google Scholar]
- Yamagishi, I.; Yamaguchi, I.; Kubota, M. Removal of Radionuclides from Partitioning Waste Solutions by Adsorption and Catalytic Oxidation Methods; JAERI-Research 2000-038; Japan Atomic Energy Research Institute: Tokai-mura, Japan, 2000. [Google Scholar]
- International Atomic Energy Agency. Estimation of Global Inventories of Radioactive Waste and Other Radioactive Materials; IAEA-TECDOC-1591; International Atomic Energy Agency: Vienna, Austria, 2008; p. 1. ISBN 978-92-0-105608-5. [Google Scholar]
- Fukuda, Y.; Arai, Y.; Hinai, H.; Ichikawa, M.; Takahashi, R.; Hirayama, F.; Obata, M.; Akagi, M.; Fukumatsu, T.; Shibata, A.; et al. Characterization of carbonate slurry generated from Multiple Radio-nuclides removal system in Fukushima Daiichi Nuclear Power Station. In Proceedings of the ICAPP 2017, Fukui, Kyoto, Japan, 24–28 April 2017. [Google Scholar]
- Lehto, J.; Brodkin, L.; Harjula, R. SrTreat-A highly effective ion exchanger for the removal of radioactive strontium from nuclear waste solutions. In Proceedings of the Radioactive Waste Management and Environmental Remediation, Singapore, 12–16 October 1997; ASME: New York, NY, USA, 1997; pp. 245–248. [Google Scholar]
- Millero, F.J. Chemical Oceanography, 3rd ed.; CRC Press: Boca Raton, FL, USA, 2005; p. 62. ISBN 978-0849322808. [Google Scholar]
- Carroll, S.A.; Roberts, S.K.; Criscenti, L.J.; O’Day, P.A. Surface complexation model for strontium sorption to amorphous silica and goethite. Geochem. Trans. 2008, 9, 2. [Google Scholar] [CrossRef] [PubMed]
- Ludwig, C.; Schindler, P.W. Surface Complexation on TiO2: I. Adsorption of H+ and Cu2+ Ions onto TiO2 (Anatase). J. Colloid Interface Sci. 1995, 169, 284–290. [Google Scholar] [CrossRef]
- Kumar, D.; Chen, M.S.; Goodman, D.W. Characterization of ultra-thin TiO2 films grown on Mo(112). Thin Solid Films 2006, 515, 1475–1479. [Google Scholar] [CrossRef]
- Zhao, Y.; Li, C.; Liu, X.; Gu, F.; Du, H.L.; Shi, L. Zn-doped TiO2 nanoparticles with high photocatalytic activity synthesized by hydrogen-oxygen diffusion flame. Appl. Catal. B Environ. 2008, 79, 208–215. [Google Scholar] [CrossRef]
- Suzana, M.; Francisco, P.; Mastelaro, V.R.; Nascente, P.A.P.; Florentino, A.O. Activity and Characterization by XPS, HR-TEM, Raman Spectroscopy, and BET Surface Area of CuO/CeO2-TiO2 Catalysts. J. Phys. Chem. B 2001, 105, 10515–10522. [Google Scholar] [CrossRef]
- Chen, M.S.; Wallace, W.T.; Kumar, D.; Yan, Z.; Gath, K.K.; Cai, Y.; Kuroda, Y.; Goodman, D.W. Synthesis of well-ordered ultra-thin titanium oxide films on Mo(112). Surf. Sci. 2005, 581, 115–121. [Google Scholar] [CrossRef]
Figure 1.
X-ray diffractometry (XRD) patterns of the samples used in the present study.

Figure 2.
Changes in K+ concentration and pH in the effluent fractions after passage through the SrTreat® column.
Figure 2.
Changes in K+ concentration and pH in the effluent fractions after passage through the SrTreat® column.
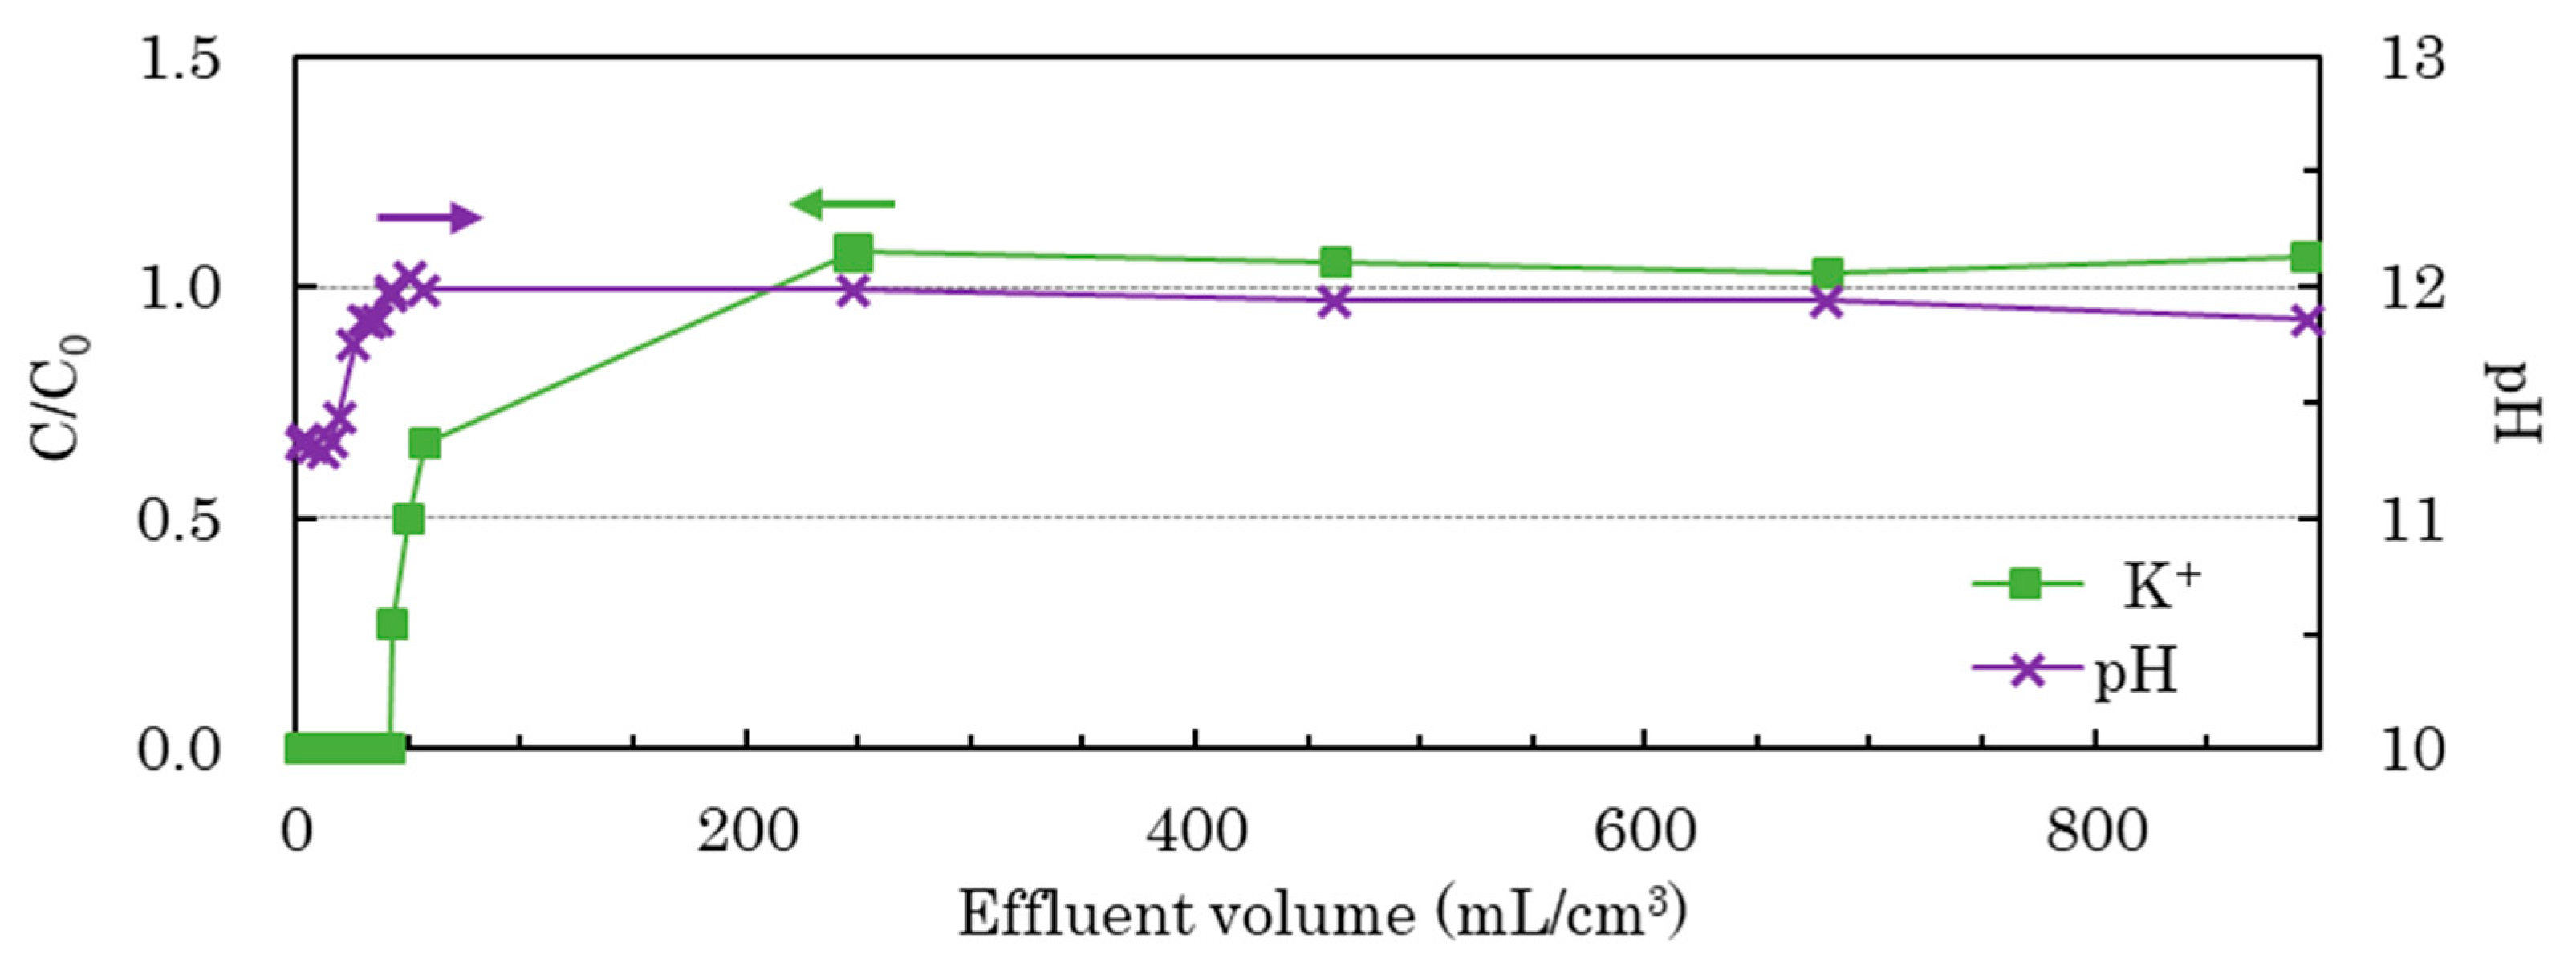
Figure 3.
Time dependency of the distribution ratio on basic two titanates.

Figure 4.
Plot of Strontium (Sr) sorption onto titanates in this study versus pH.
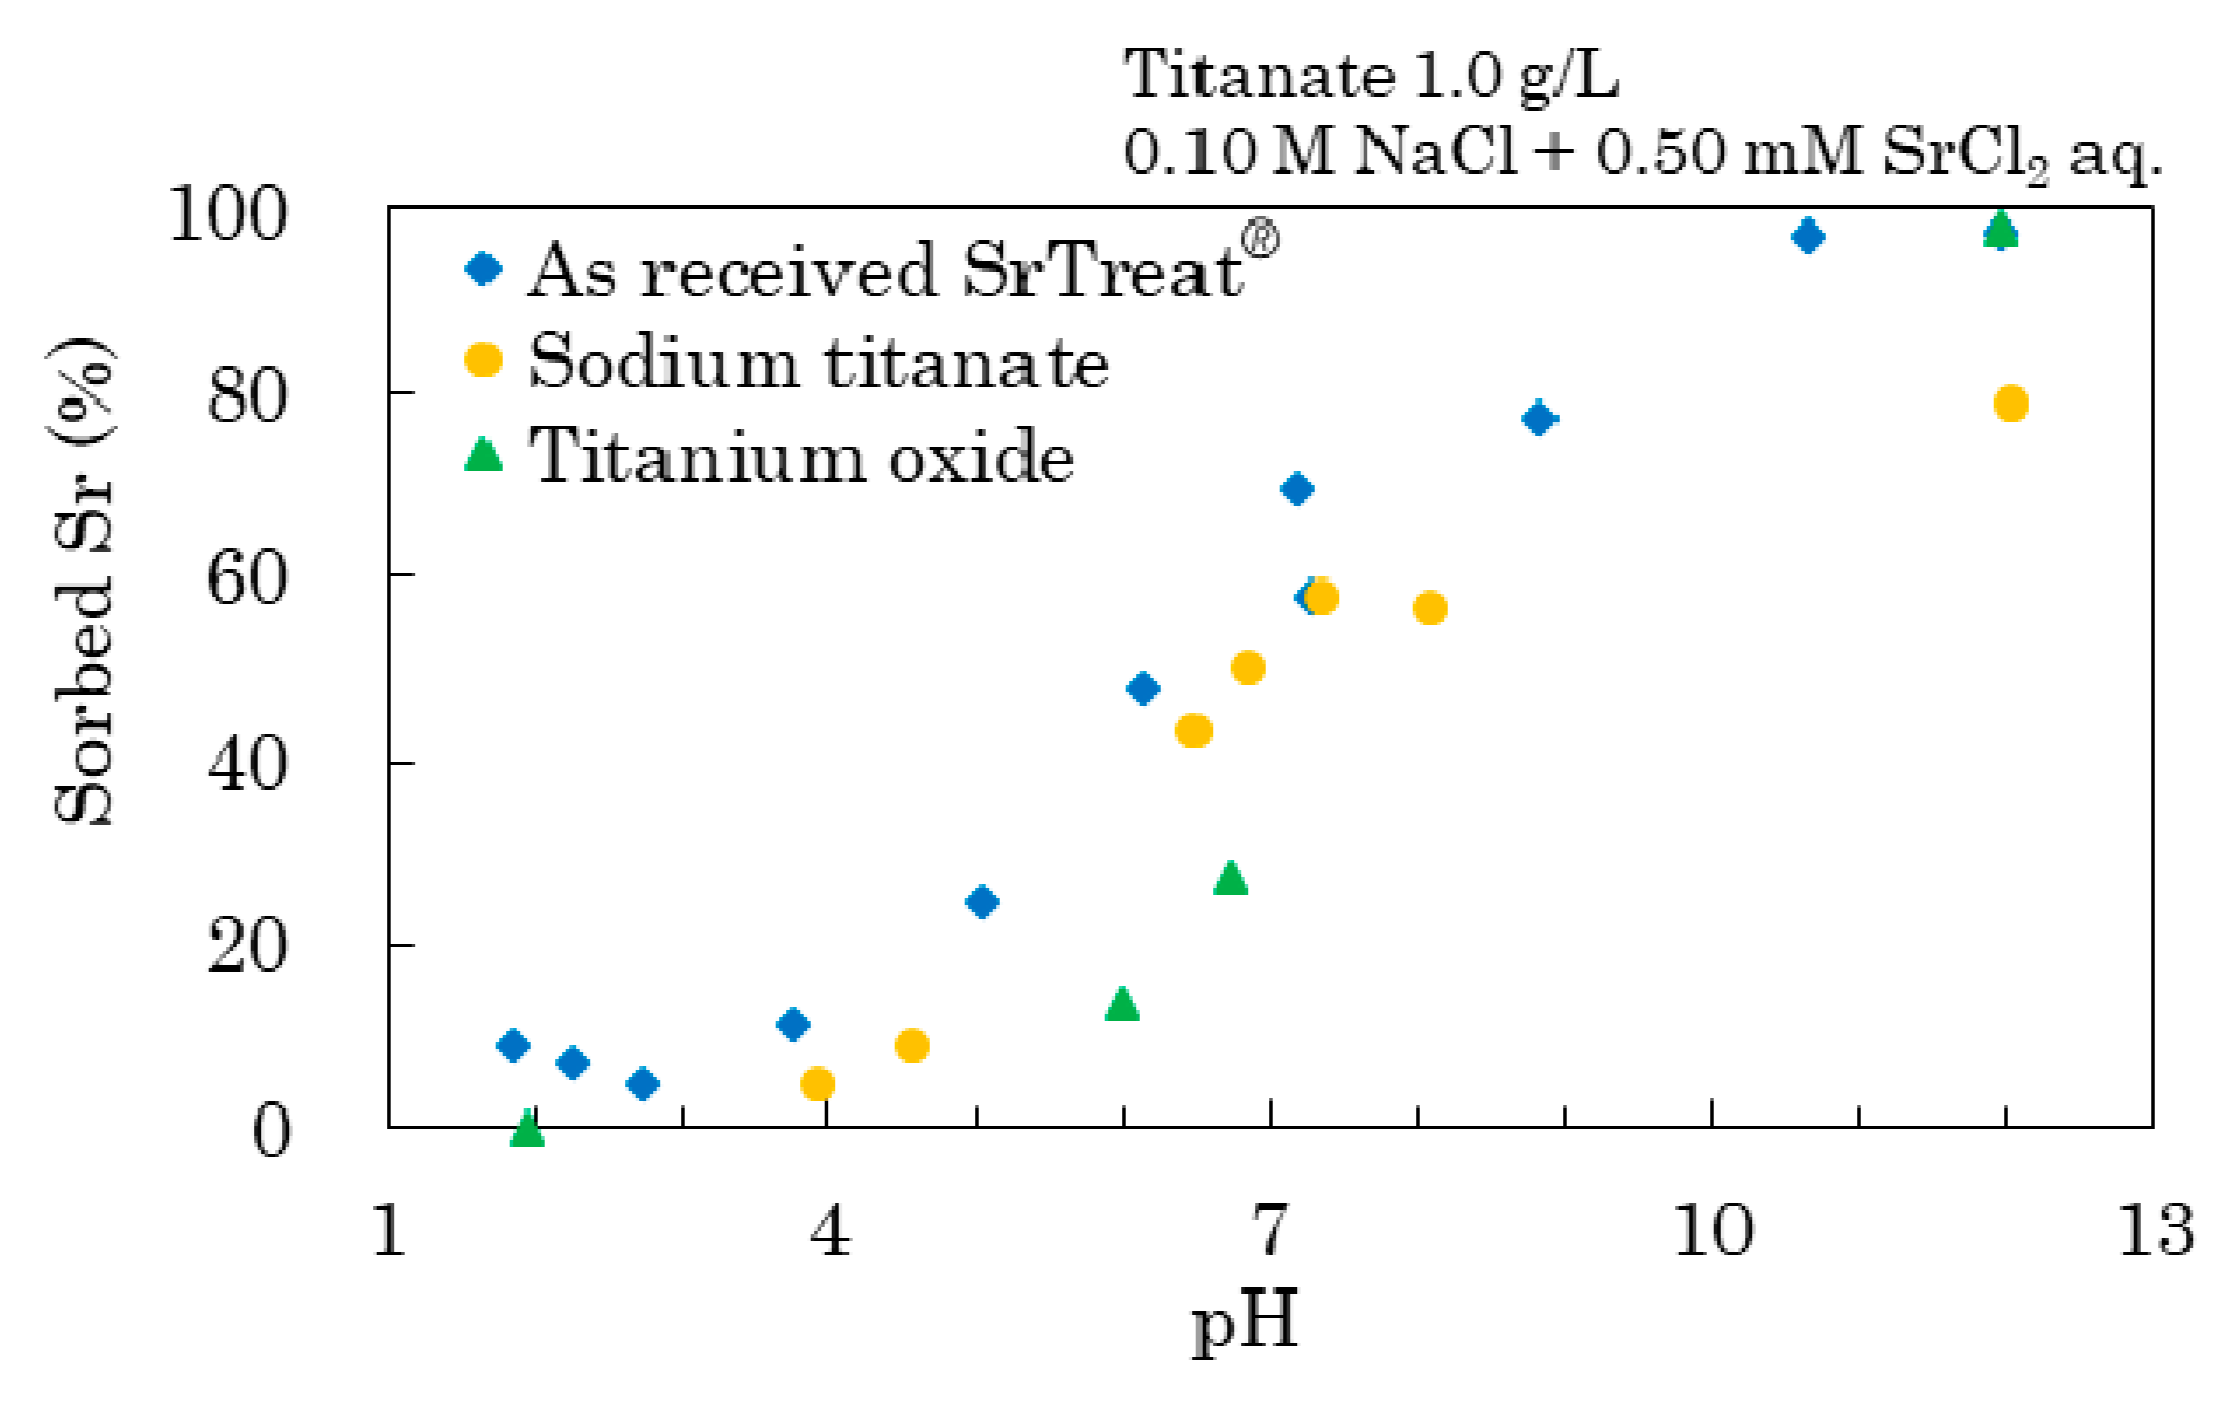
Figure 5.
The percentage of sorbed Sr on titanates in this study versus equilibrium Sr concentration at pH = 12.
Figure 5.
The percentage of sorbed Sr on titanates in this study versus equilibrium Sr concentration at pH = 12.
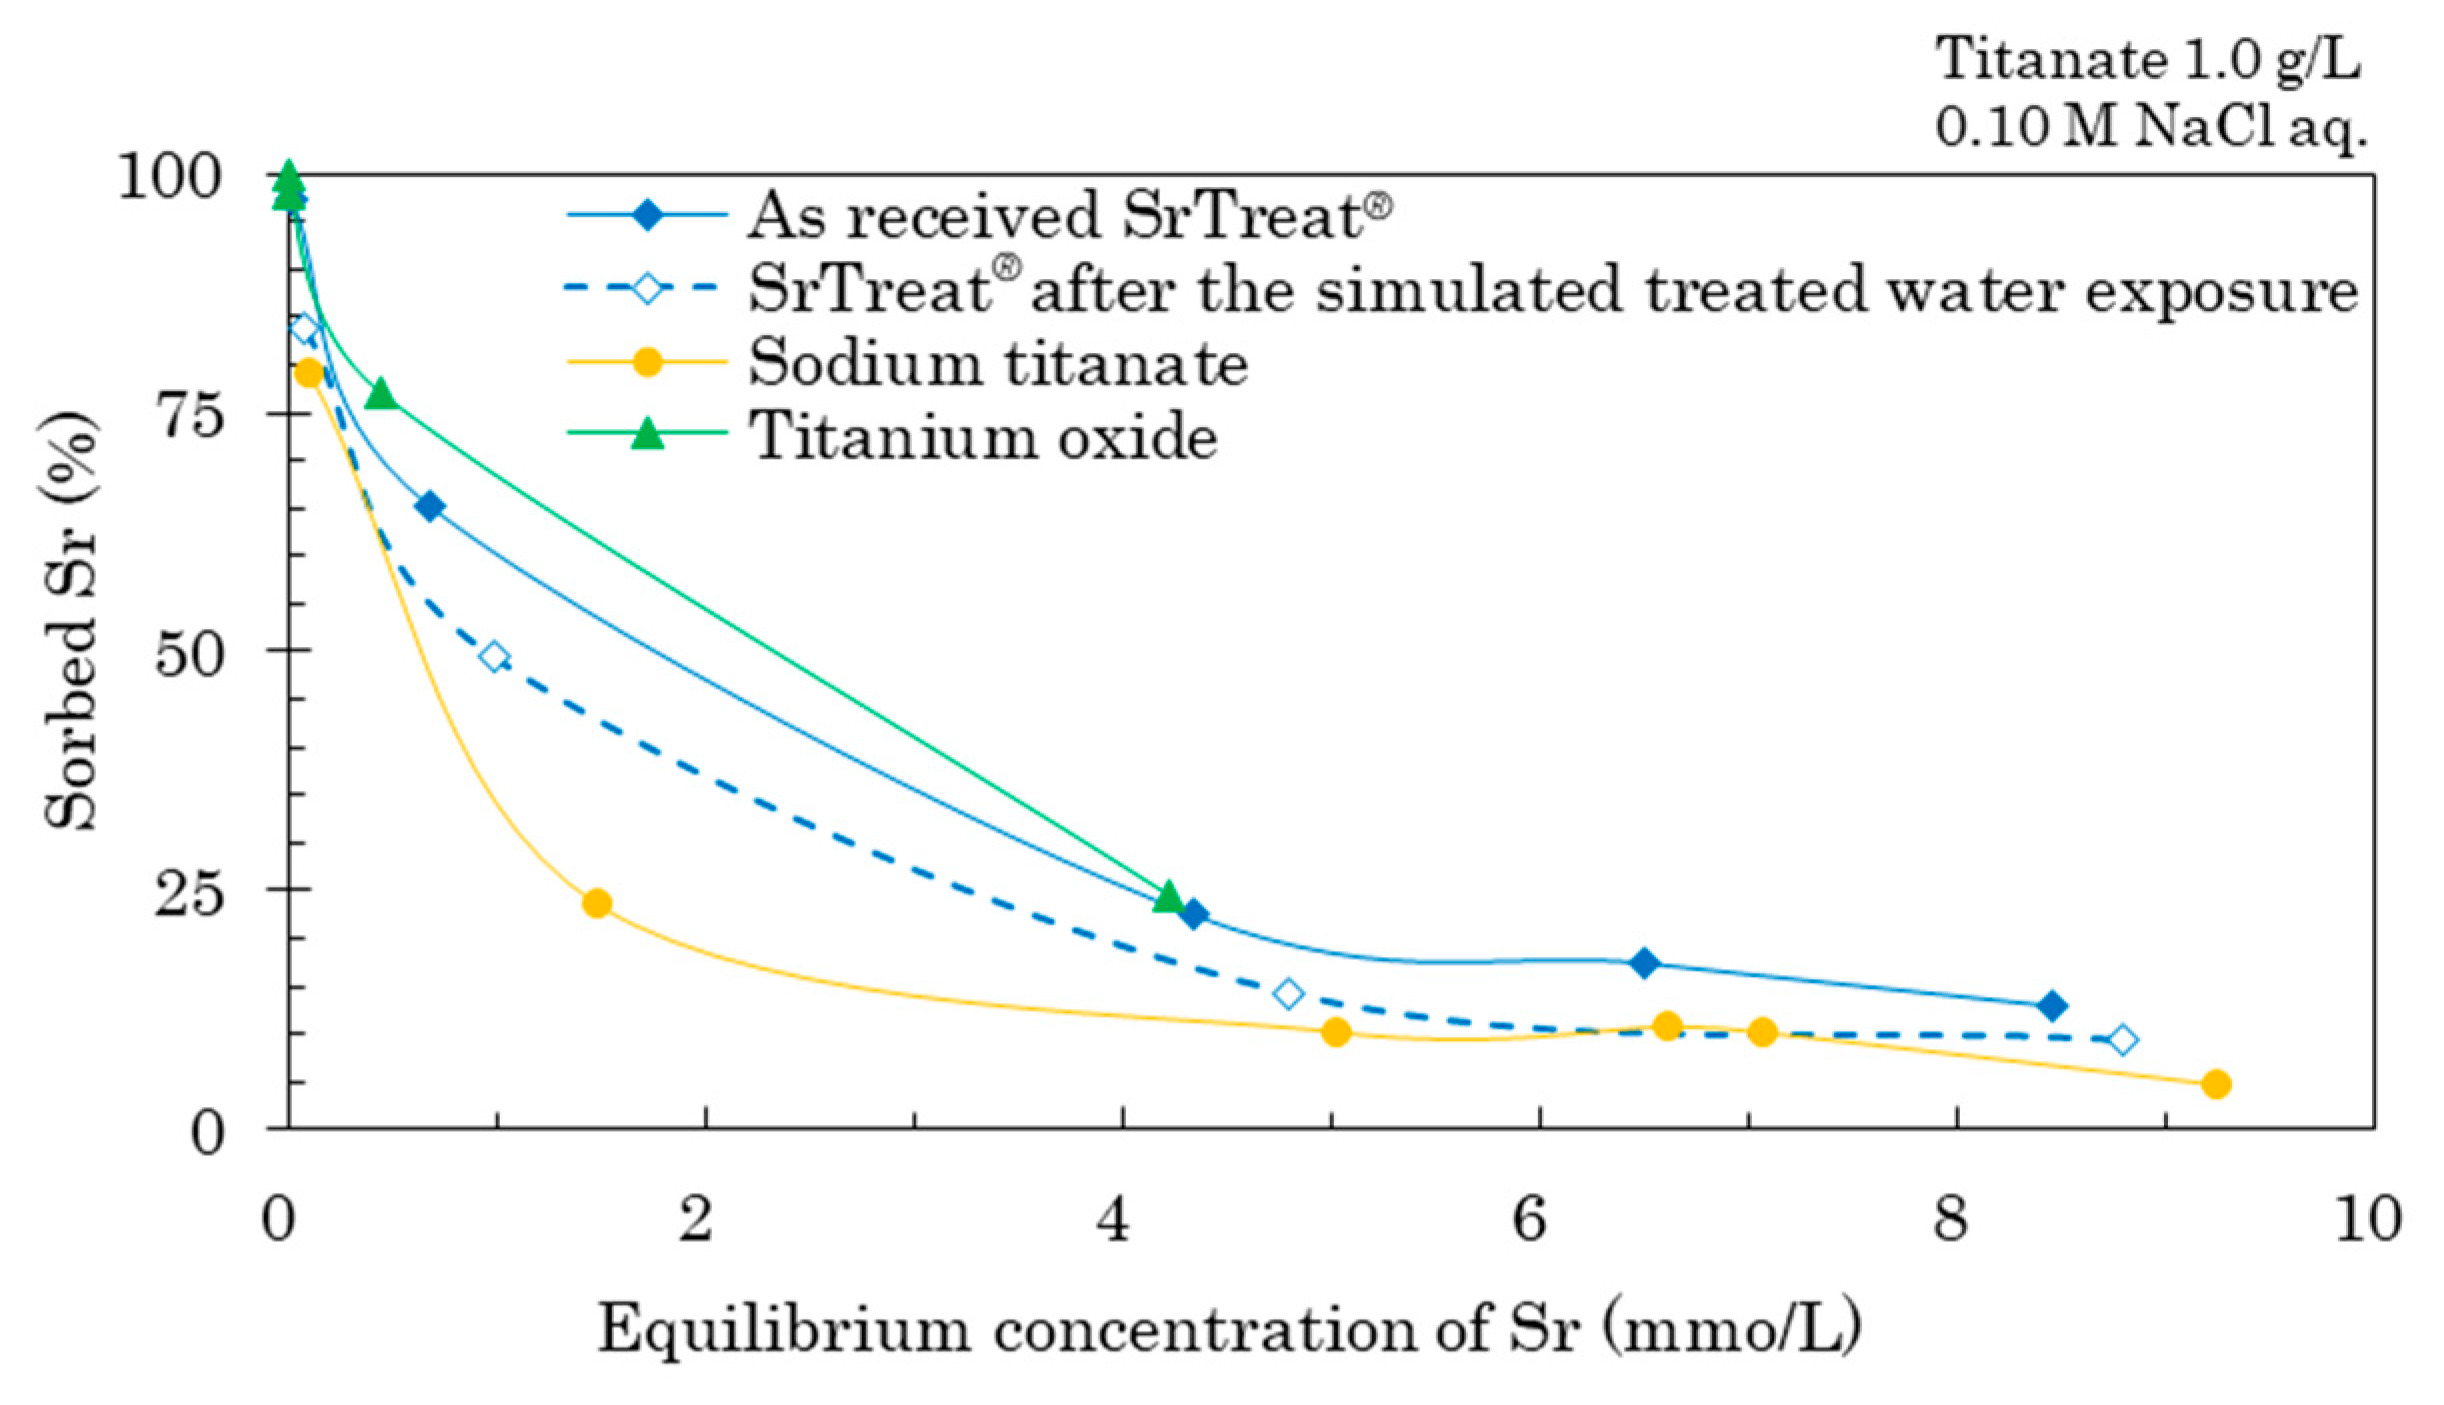
Figure 6.
Amount of Sr in the SrTreat® before and after the simulated treated water exposure at pH = 12 and a fit according to Freundlich exponential law.
Figure 6.
Amount of Sr in the SrTreat® before and after the simulated treated water exposure at pH = 12 and a fit according to Freundlich exponential law.
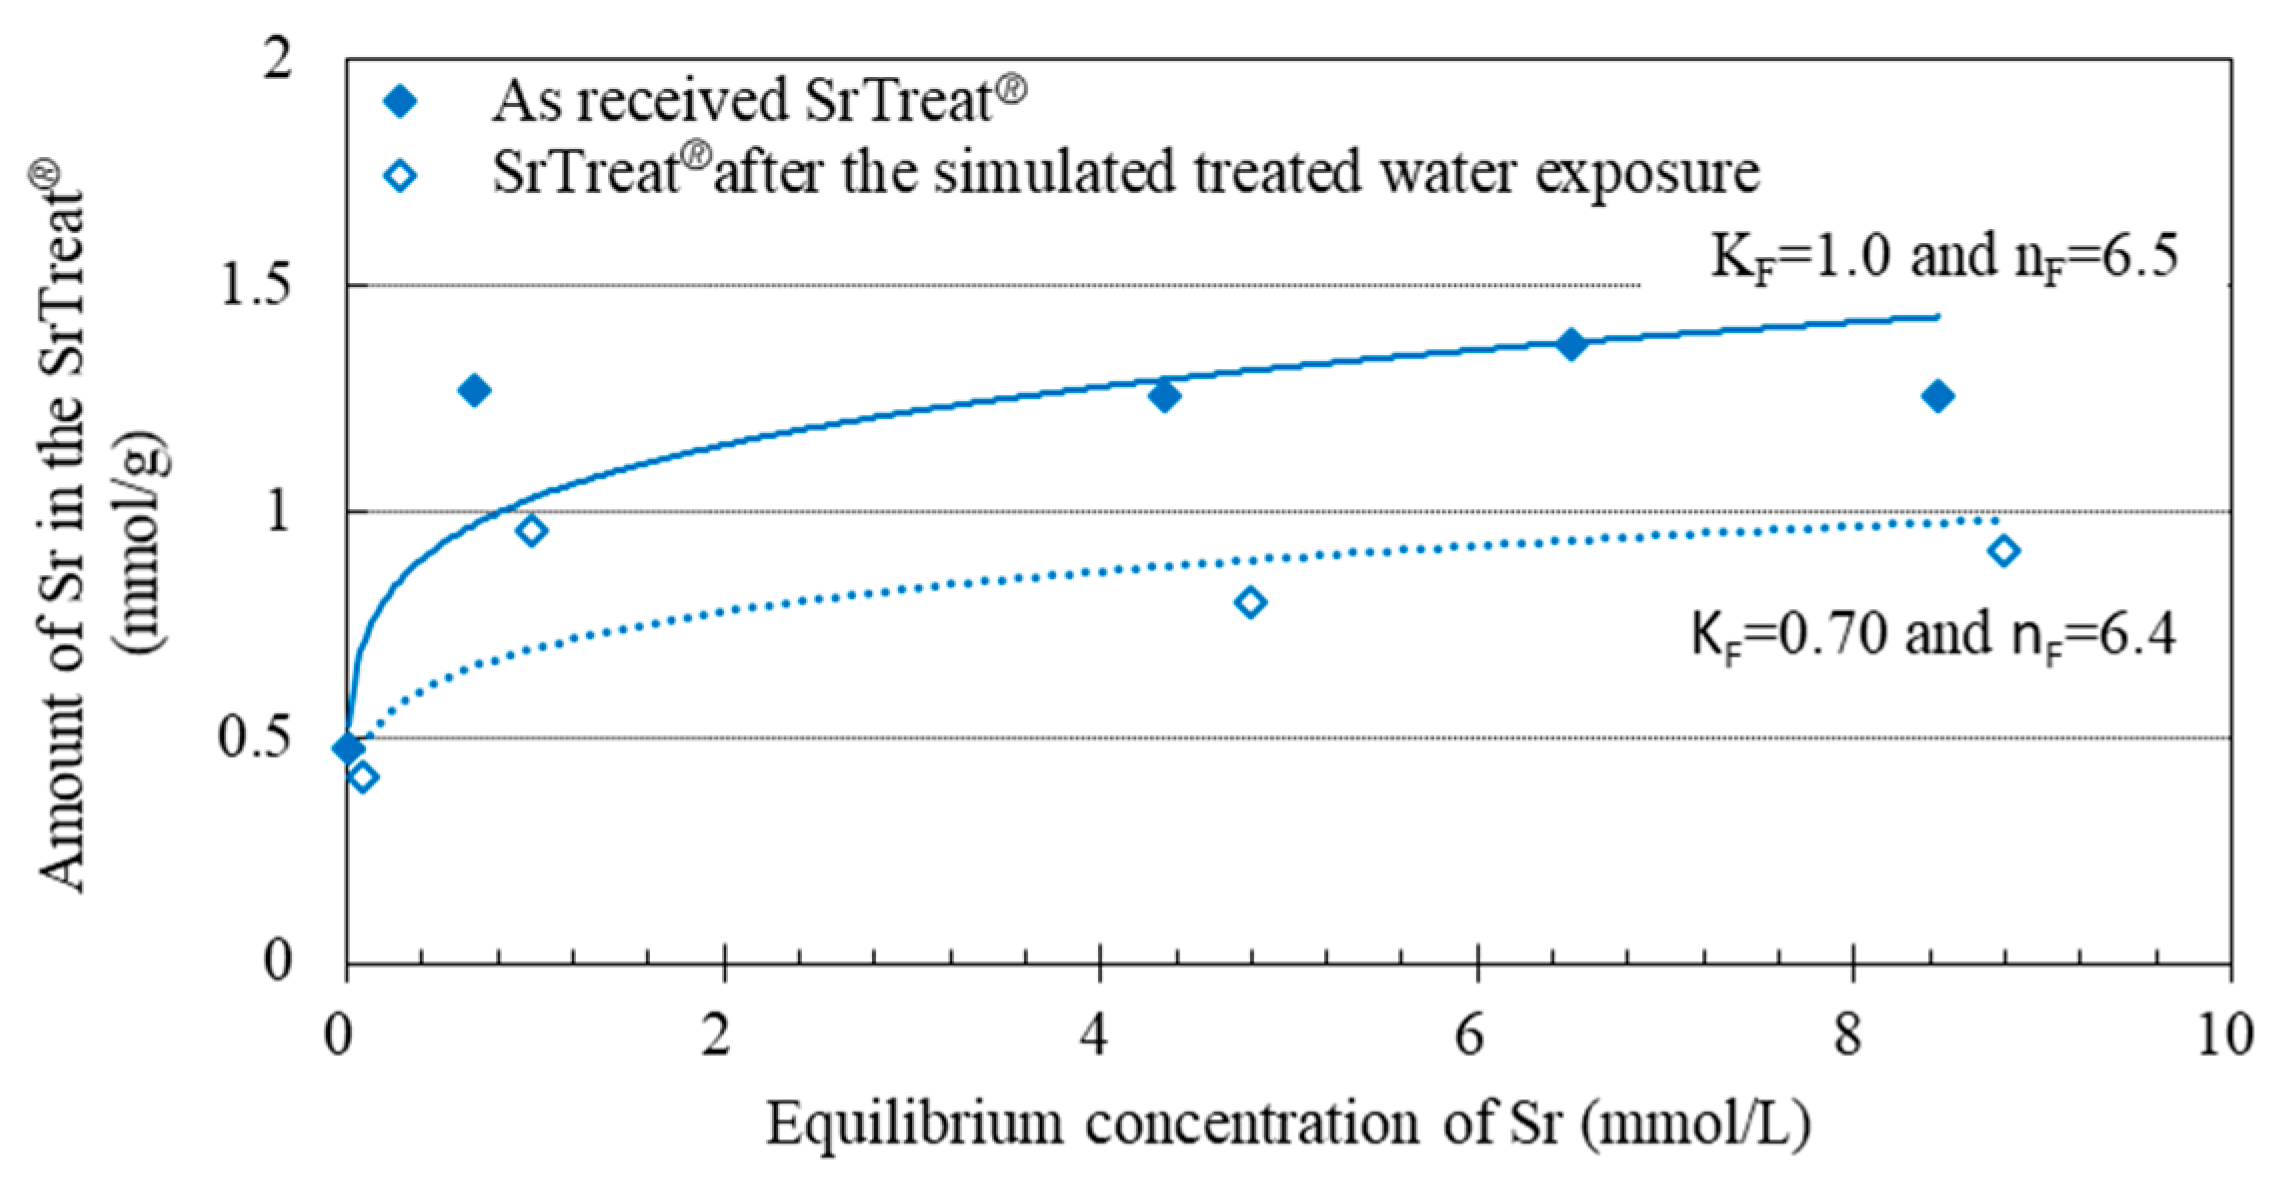
Figure 7.
Titration curves of the titanates in the present study in 0.10 mol/L NaCl solution.
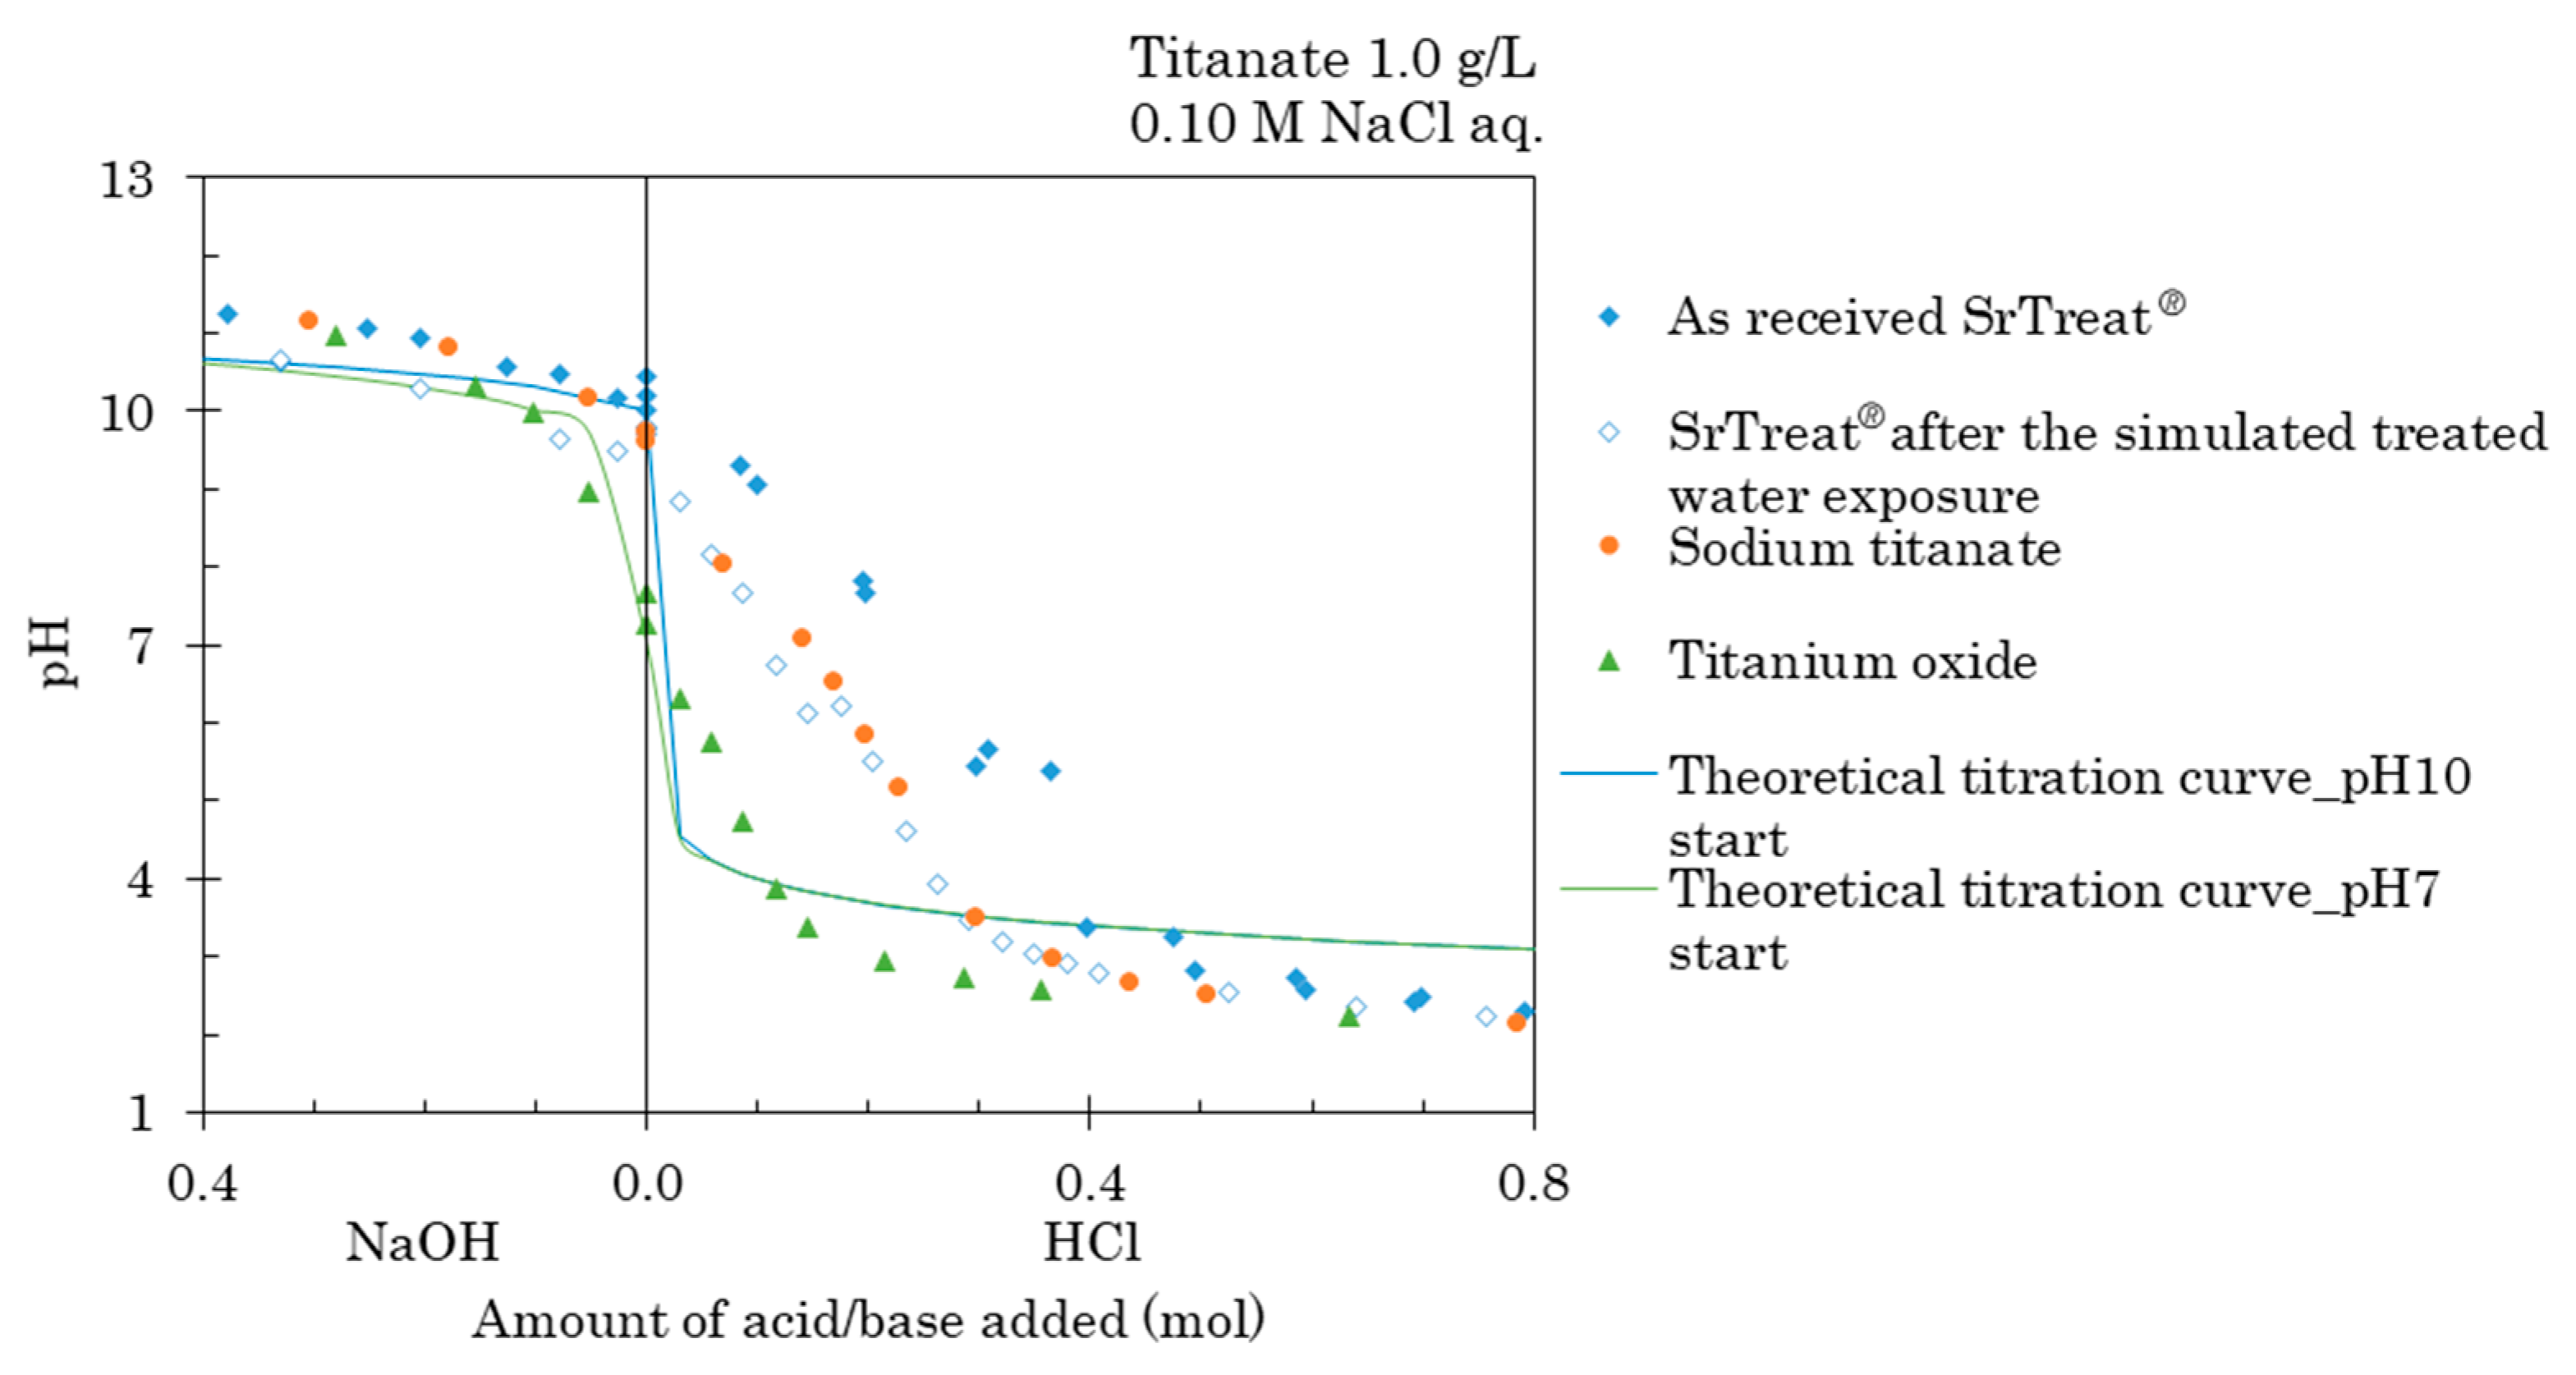
Figure 8.
XPS spectra of the titanates investigated in the present study for bond energies corresponding to (a) Ti2p; (b) O1s; and (c) Na1s.
Figure 8.
XPS spectra of the titanates investigated in the present study for bond energies corresponding to (a) Ti2p; (b) O1s; and (c) Na1s.

Table 1.
Results of energy dispersive X-ray (EDX) analysis on the titanates in the present study (mol %) 1.
Table 1.
Results of energy dispersive X-ray (EDX) analysis on the titanates in the present study (mol %) 1.
| Titanate | Ti | Na | Total |
|---|---|---|---|
| As-received SrTreat® | 66 | 34 | 100 |
| Sodium titanate | 70 | 30 | 100 |
| Titanium oxide | 96 | 3.7 | 100 |
1 Average of three analyses.
Table 2.
Chemical compositions of the titanates in the present study estimated from the EDX results.
Table 2.
Chemical compositions of the titanates in the present study estimated from the EDX results.
| Titanate | Chemical Composition |
|---|---|
| As-received SrTreat® | Na0.64H1.5TiO3 |
| Sodium titanate | Na0.43H1.6TiO3 |
| Titanium oxide | Na0.039H2.0TiO3 |
Table 3.
Conditions of the simulated treated water passage through the SrTreat® column.
| Conditions | ||
|---|---|---|
| Column | Diameter (mm) | 15 |
| Volume (cm3) | 38 | |
| Weight (g) 1 | 34 | |
| Water flow | Average flow rate (mL/min) | 5.8 |
| Average space velocity (h−1) | 9.1 | |
| Time (h) | 99 | |
| Water volume (L) 2 | 34 | |
1 Converted from the apparent density of the as-received SrTreat® (estimated as 0.89 g/cm3, the average of three measurements with the dosimeter calibrated to weight); 2 The total volume of effluent of the simulated treated water from the SrTreat® column.
Table 4.
Peak intensity ratios of the titanates of the present study, determined by the XPS analysis; (a) Ti2p and (b) O1s.
Table 4.
Peak intensity ratios of the titanates of the present study, determined by the XPS analysis; (a) Ti2p and (b) O1s.
| (a) | |||
| Titanate | Peak Position | Ratio of the Peaks | |
| Ti2p3/2 | Ti2p1/2 | Ti2p3/2/Ti2p1/2 | |
| As-received SrTreat® | 456.2 | 461.4 | 3.6 |
| Sodium titanate | 456.4 | 462.1 | 3.1 |
| Titanium oxide | 456.2 | 461.9 | 3.6 |
| SrTreat® after the simulated treated water exposure | 455.6 | 461.1 | 3.2 |
| (b) | |||
| Titanate | Peak Position | Ratio of the Peaks | |
| OL | OH | OL/OH | |
| As-received SrTreat® | 527.8 | 531.2 | 2.9 |
| Sodium titanate | 528.0 | 531.8 | 1.7 |
| Titanium oxide | 527.7 | 531.8 | 0.85 |
| SrTreat® after the simulated treated water exposure | 527.2 | 531.8 | 0.52 |
© 2017 by the authors. Licensee MDPI, Basel, Switzerland. This article is an open access article distributed under the terms and conditions of the Creative Commons Attribution (CC BY) license (http://creativecommons.org/licenses/by/4.0/).
Share and Cite
MDPI and ACS Style
Takahatake, Y.; Shibata, A.; Nomura, K.; Sato, T. Effect of Flowing Water on Sr Sorption Changes of Hydrous Sodium Titanate. Minerals 2017, 7, 247. https://doi.org/10.3390/min7120247
AMA Style
Takahatake Y, Shibata A, Nomura K, Sato T. Effect of Flowing Water on Sr Sorption Changes of Hydrous Sodium Titanate. Minerals. 2017; 7(12):247. https://doi.org/10.3390/min7120247
Chicago/Turabian StyleTakahatake, Youko, Atsuhiro Shibata, Kazunori Nomura, and Tsutomu Sato. 2017. "Effect of Flowing Water on Sr Sorption Changes of Hydrous Sodium Titanate" Minerals 7, no. 12: 247. https://doi.org/10.3390/min7120247
Note that from the first issue of 2016, this journal uses article numbers instead of page numbers. See further details here.