
Strength Characteristics and Failure Mechanism of Cemented Super-Fine Unclassified Tailings Backfill


1
School of Resources and Civil Engineering, Northeastern University, Shenyang 110819, China
2
Faculty of Education, Northeast Normal University, Changchun 130024, China
*
Author to whom correspondence should be addressed.
Minerals 2017, 7(4), 58; https://doi.org/10.3390/min7040058
Submission received: 7 March 2017
/
Revised: 5 April 2017
/
Accepted: 10 April 2017
/
Published: 12 April 2017
Abstract
:This experimental study investigates the strength characteristics of cemented super-fine unclassified tailings backfill (CSUTB) and its failure mechanism. Physical and chemical properties of tailings from the Zhongguan Iron Mine (ZGIM) were tested. A series of uniaxial compressive strength (UCS) tests was conducted to determine the relationships between UCS of CSUTB and three factors of cement-tailings ratio (CTR), solid content and curing time. Gray relational analysis (GRA) method was then used to study the sensitivity of UCS to these three factors. Results indicate that ZGIM unclassified tailings is a kind of alkaline super-fine tailings with high activity and quality. UCS of CSUTB increases exponentially with the increase of CTR and solid content, and increases linearly with curing time. The curing time is the most important factor for the UCS of CSUTB, followed by CTR and solid content. The stress-strain curves obtained from UCS tests show the failure process of CSUTB, including four stages of initial deformation, linear elastic, yield deformation and complete failure. It is the result of damage evolution.
1. Introduction
Underground mine backfill technology, one of the most important mining methods in the world [1], has developed rapidly since 1960s [2,3,4,5] due to the fact that it can control ground collapse, reduce ore dilution, reduce risk of barricade failure and enable mine operations to lessen the quantity of wastes [6,7,8,9]. Currently, cemented past backfill (CPB), which is made of mill tailings generated by the mineral processing plant, a binding agent such as ordinary Portland cement (OPC), water and other additives, is the most frequently used filling material due to its economic, environmental and technical benefits [10,11,12,13,14,15]. The CPB usually acts as artificial pillar and plays a key role in supporting surrounding rocks. The CPB should remain stable during the extraction of adjacent stopes, in order to provide safety for miners. The mechanical strength of CPB at a given time is thus the key quality control parameter. The uniaxial compressive strength (UCS) of CPB is often used to evaluate its strength properties, since the UCS test is inexpensive and can be incorporated into routine quality control programs at the mine [16].
Many experimental studies have been performed in order to investigate the factors that influence the UCS of CPB. Yi et al. [17] conducted uniaxial compressive tests on fiber-reinforced CPB and observed the increase in UCS and ductility of CPB with more fibers. Zhen et al. [18] studied coupled effect of limestone powder (LP) and water-reducing admixture (WRA) on the CPB properties, and reported that incorporation of LP and WRA increased the UCS of CPB. Maple-wood filler, Nano-silica, fly-ash, granulated blast-furnace slag (GBFS) and silica fume were added into CPB as partial binding agent to improve its mechanical performance [19,20,21,22,23]. Ercikdi et al. [24] reported the influence of different WRAs on rheology and short and long term performance of CPB. Li and Fall [25] observed that sulphate has negative effect on strength, intensity and rate of self-desiccation of the CPB in early curing time. The UCS value of CPB increases almost linearly with the increasing of binder amount [26]. Considering that the CPB structure is simultaneously subjected to thermal (T), mechanical (M), chemical (C) and hydraulic (H) loads from the entire curing ages, many researches [27,28,29,30,31] are focused on the THMC behaviour of CPB. Yilmaz et al. [32,33] observed that longer curing time and lower water-to-cement (w/c) ratio result in lower total porosity and higher UCS. The UCS and ultrasonic pulse velocity of CPB increase with increasing binder dosage and reduce with the w/c ratio regardless of sample size and tailings type [34]. Huang et al. [35] examined the effect of cement content, curing time and strain rate on the dynamic strength of CPB. Kesima et al. [12,36] measured the short and long term UCS of CPB, considering the effects of cement ratio and type, and the curing time. Yin et al. [37] investigated the effect of solid components on the rheological and mechanical properties of CPB and observed that a large bind proportion increases UCS significantly but weaken the consistency of paste. Experiments conducted by Fall et al. [38], Ercikdi et al. [23], showed that solid content of cemented tailings slurry, cement-tailings ratio (CTR), and curing time were the main factors controlling the UCS of CPB. However, all of these studies performed on the strength properties of CPB show no quantitative relationship between UCS and the three factors, especially for those who are made of super-fine unclassified tailings.
The originality of this paper is to characterize the strength of cemented super-fine unclassified tailings backfill (CSUTB) using the GRA method. The major objective of this paper is to highlight the relationship between UCS of CSUTB and solid content, CTR and curing time. Physical and chemical properties of unclassified mine tailings from ZGIM located in North China were initially tested. Uniaxial compressive experiments on CSTUB with different solid content, CTRs and curing time were conducted to reveal the relationship between UCS and the three factors. The sensitivity of UCS to different influencing factors was analyzed by the GRA method. The failure mechanism of CSUTB was studied at the end of this paper.
2. Materials and Methods
2.1. Tailings, Binder and Mixing Water
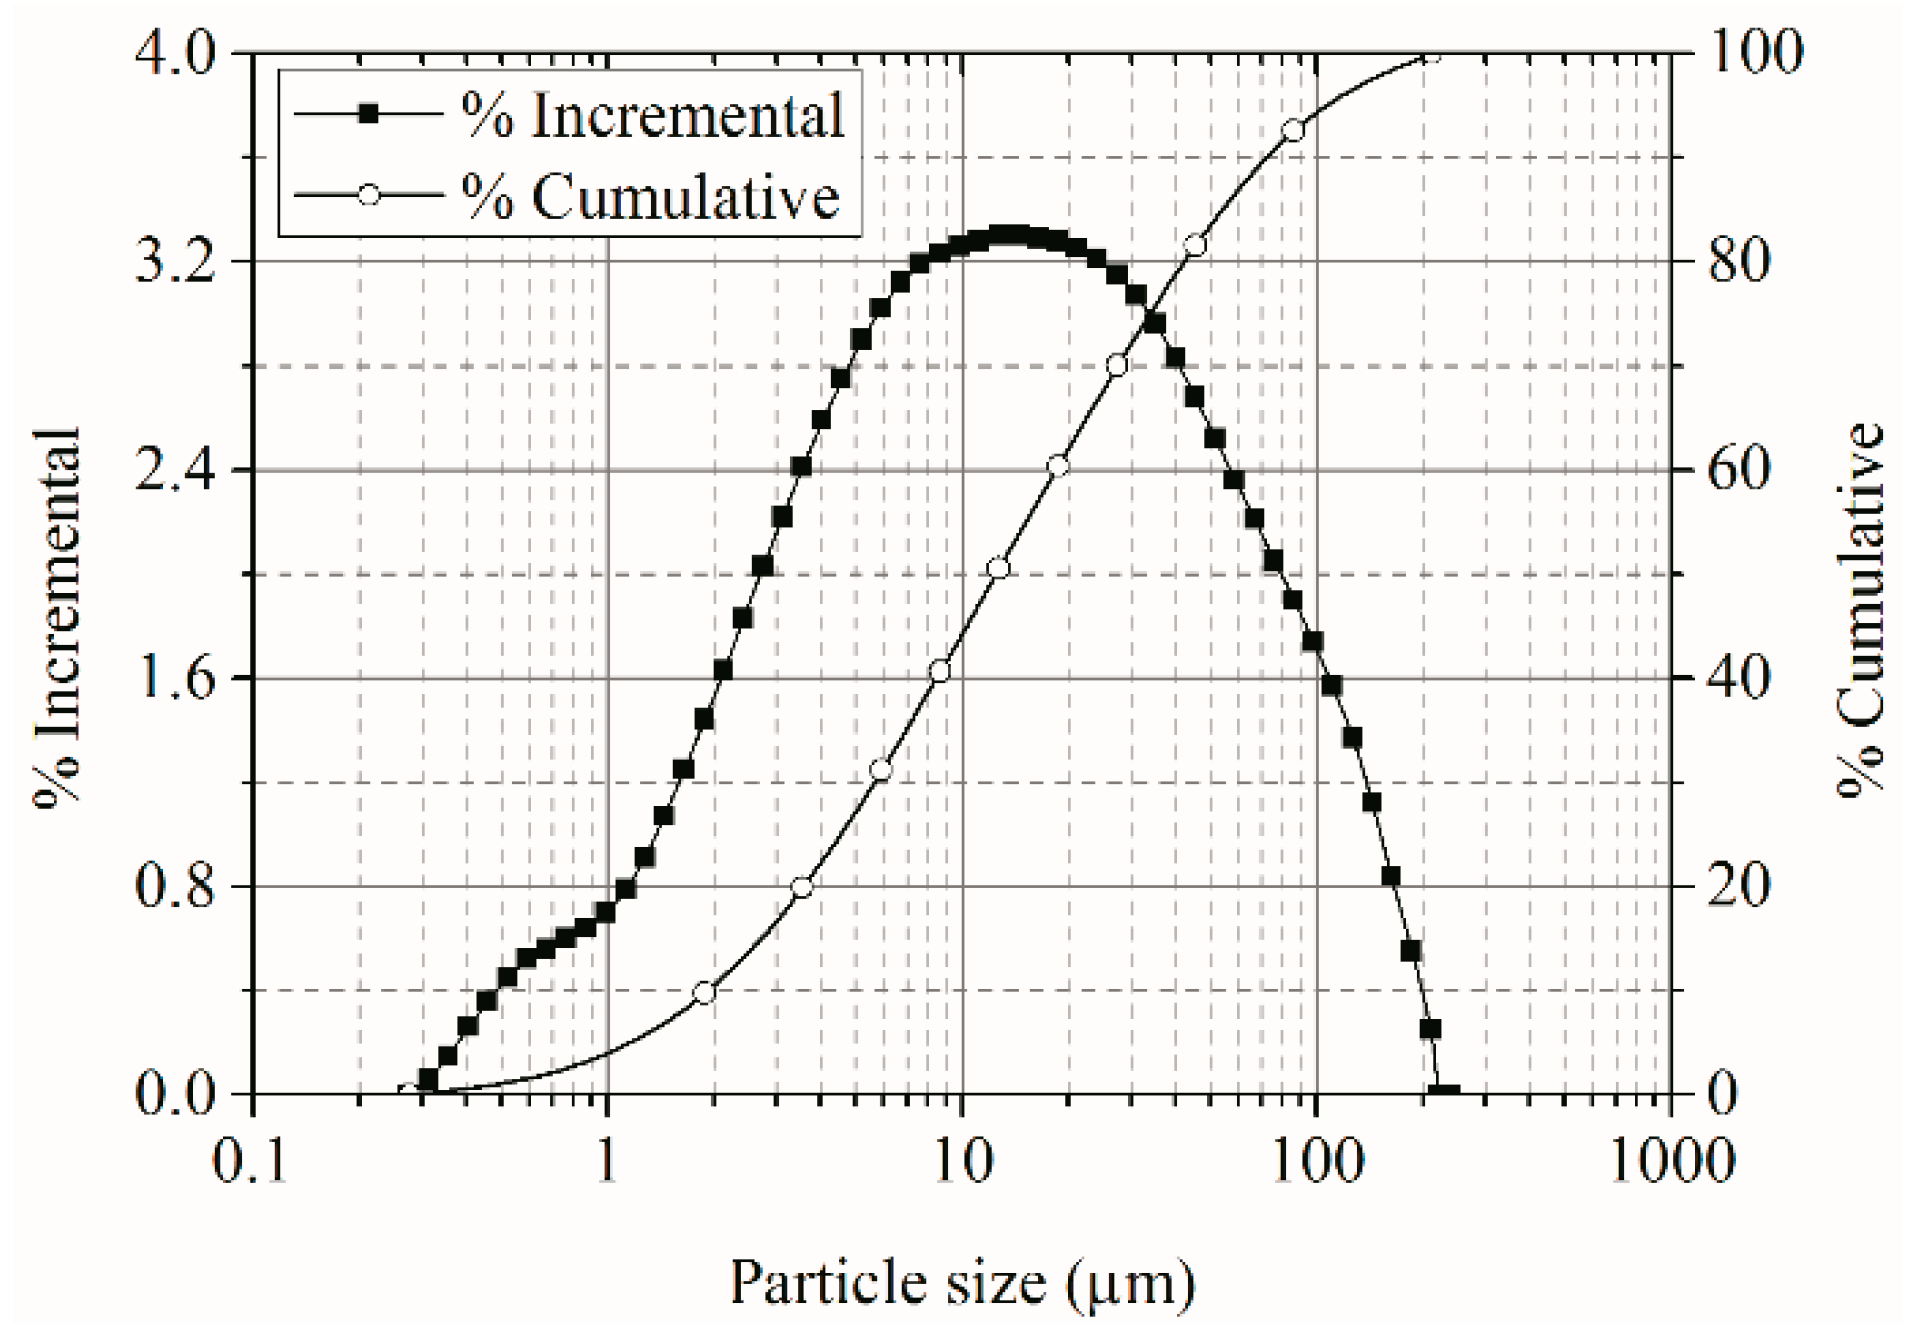
The unclassified tailings used in this study were sampled from the ore processing plant of the Zhongguan Iron Mine (ZGIM, Hesteel Group Co., Ltd., Handan, China, an underground iron mine) located in North China. The particle size distribution and mineralogy of the tailings were determined by Mastersizer2000 laser particle size analyzer (Malvern, Shanghai, China) and X-ray Fluorescence (XRF, Skyray, Suzhou, China) Spectrometer respectively. Parameters of the particle size are shown in Figure 1 and Table 1. The unclassified tailings can be considered as super-fine tailings since its median diameter (d50) and d90 are only 14.2 and 82.9 μm [39]. The non-uniform coefficient of the tailings is 8.6, showing its good gradation, which could improve backfill slurry density degree and CPB’s early strength [40]. Table 2 shows the main chemical composition in unclassified tailings including CaO, SiO2, Fe2O3 and MgO. Also, according to the calculation formula of minerals chemical compositions index [41], the basicity coefficient, quality factors and activity coefficient of unclassified tailings are 2.31, 2.78 and 2.12, respectively. The ZGIM tailings belong to alkaline tailings with high quality and activity.
2.2. Specimen Preparation
The CSUTB ingredients including unclassified super-fine tailings, OPC and water were weighted by high-precision electronic scale with an accuracy of 0.01 g. Mixtures with 16 formulations were mixed in laboratory blenders for 5 min to ensure it homogenous (Table 3). The mixtures were then casted in plastic cylinders molds with a diameter of 5 cm and a height of 10 cm (height-to-diameter ratio of 2). A total of 192 triplicate specimens were prepared. The specimens were cured in a humidity chamber at 20 °C and 95% relative humidity for different curing times (3, 7, 14 and 28 days).
2.3. Uniaxial Compression Tests
The UCS at a given time is the most important parameter to evaluate mechanical performance of CPB [43]. After reaching predetermined curing time, the CSUTB specimens were tested for UCS by using a computer-controlled mechanical press (MTS (China), Shanghai, China) according to the ASTM D2166/D2166M-16 [44]. The press has a loading capacity of 50 KN, and samples were loaded under a constant vertical displacement rate of 1 mm/min. Triplicate tests were conducted to determine the UCS of CSUTB, and only the mean value was considered. The individual strengths of three specimens, molded with the same characteristics, should not deviate by more than 15% from the mean strength.
3. Results and Discussion
3.1. Strength Characteristics of CSUTB
The UCS values of the CSUTB with different formulations are given in Table 4. The CTR, solid content and curing time are three major factors influencing backfill strength. In order to study the quantitative relationships between the backfill strength and the three factors, one selected factor was treated as variable while the other two factors were fixed as constants to avoid interference of multi-factor changes [45].
3.1.1. Effect of CTR
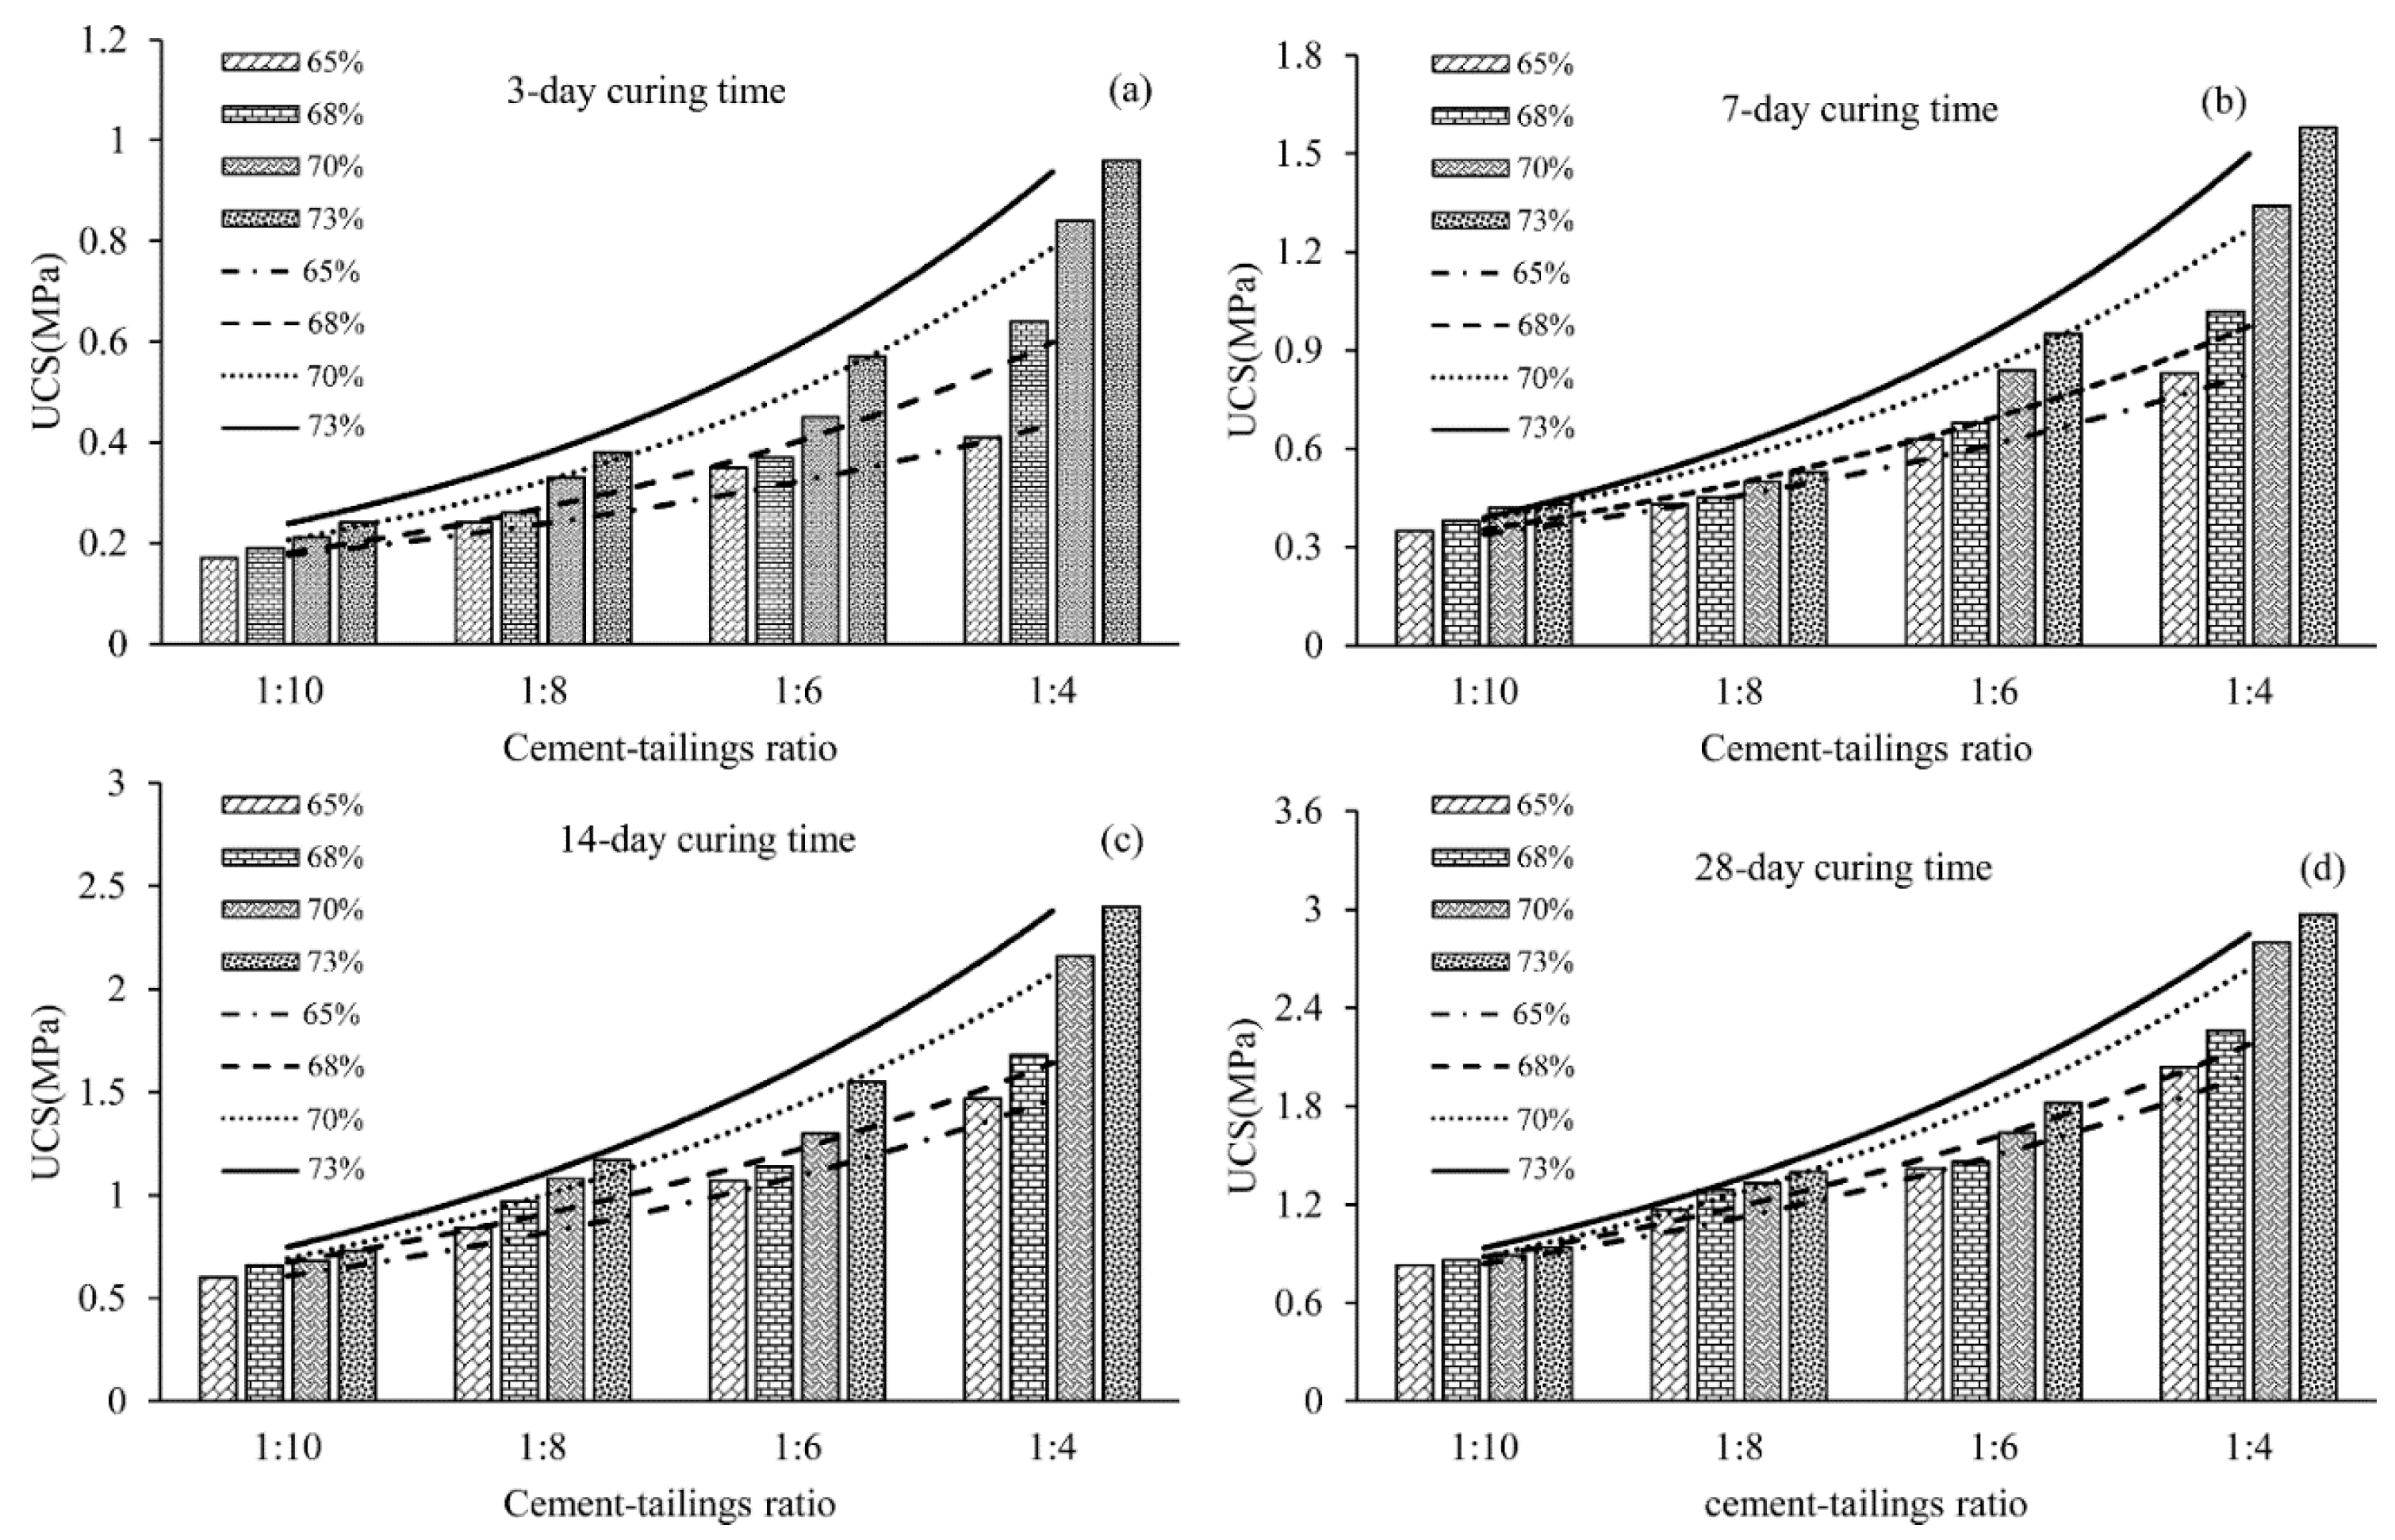
Solid content was fixed to study the variation law of the backfill strength in different CTRs with curing times of 3, 7, 14, and 28 days, respectively. Exponential fitting and linear fitting of the variation of UCS were conducted and the relevant correlation coefficient (R2) was calculated. Histograms and exponential fitting curves of the backfill strength of different CTRs and curing time are shown in Figure 2. The fitting results are shown in Table 5.
The exponential R2 between CTR and backfill strength with different curing time in Table 5 is greater than 0.95 and higher than linear R2 value. An obviously exponential relationship exists between backfill cement-tailings ratio and the strength, shown in Figure 2. When the solid content remains constant, the backfill strength increases exponentially with a higher cement-tailings ratio. The curve becomes steeper with higher solid content, implying a higher backfill strength. When the cement-tailings ratio is low, the backfill strength shows uniform variation and the exponential fitting curves distribute evenly. However, the backfill strength shows discreteness when the cement-tailings ratio increases gradually. The cement-tailings ratio shows an exponential relationship with the backfill strength, and the relevant expression can be defined in Equation (1).
where Y is backfill strength, X is cement-tailings ratio, and e is Euler number. A and R are fitting parameters depending on the influence of solid content and curing time.
Y = AeRX
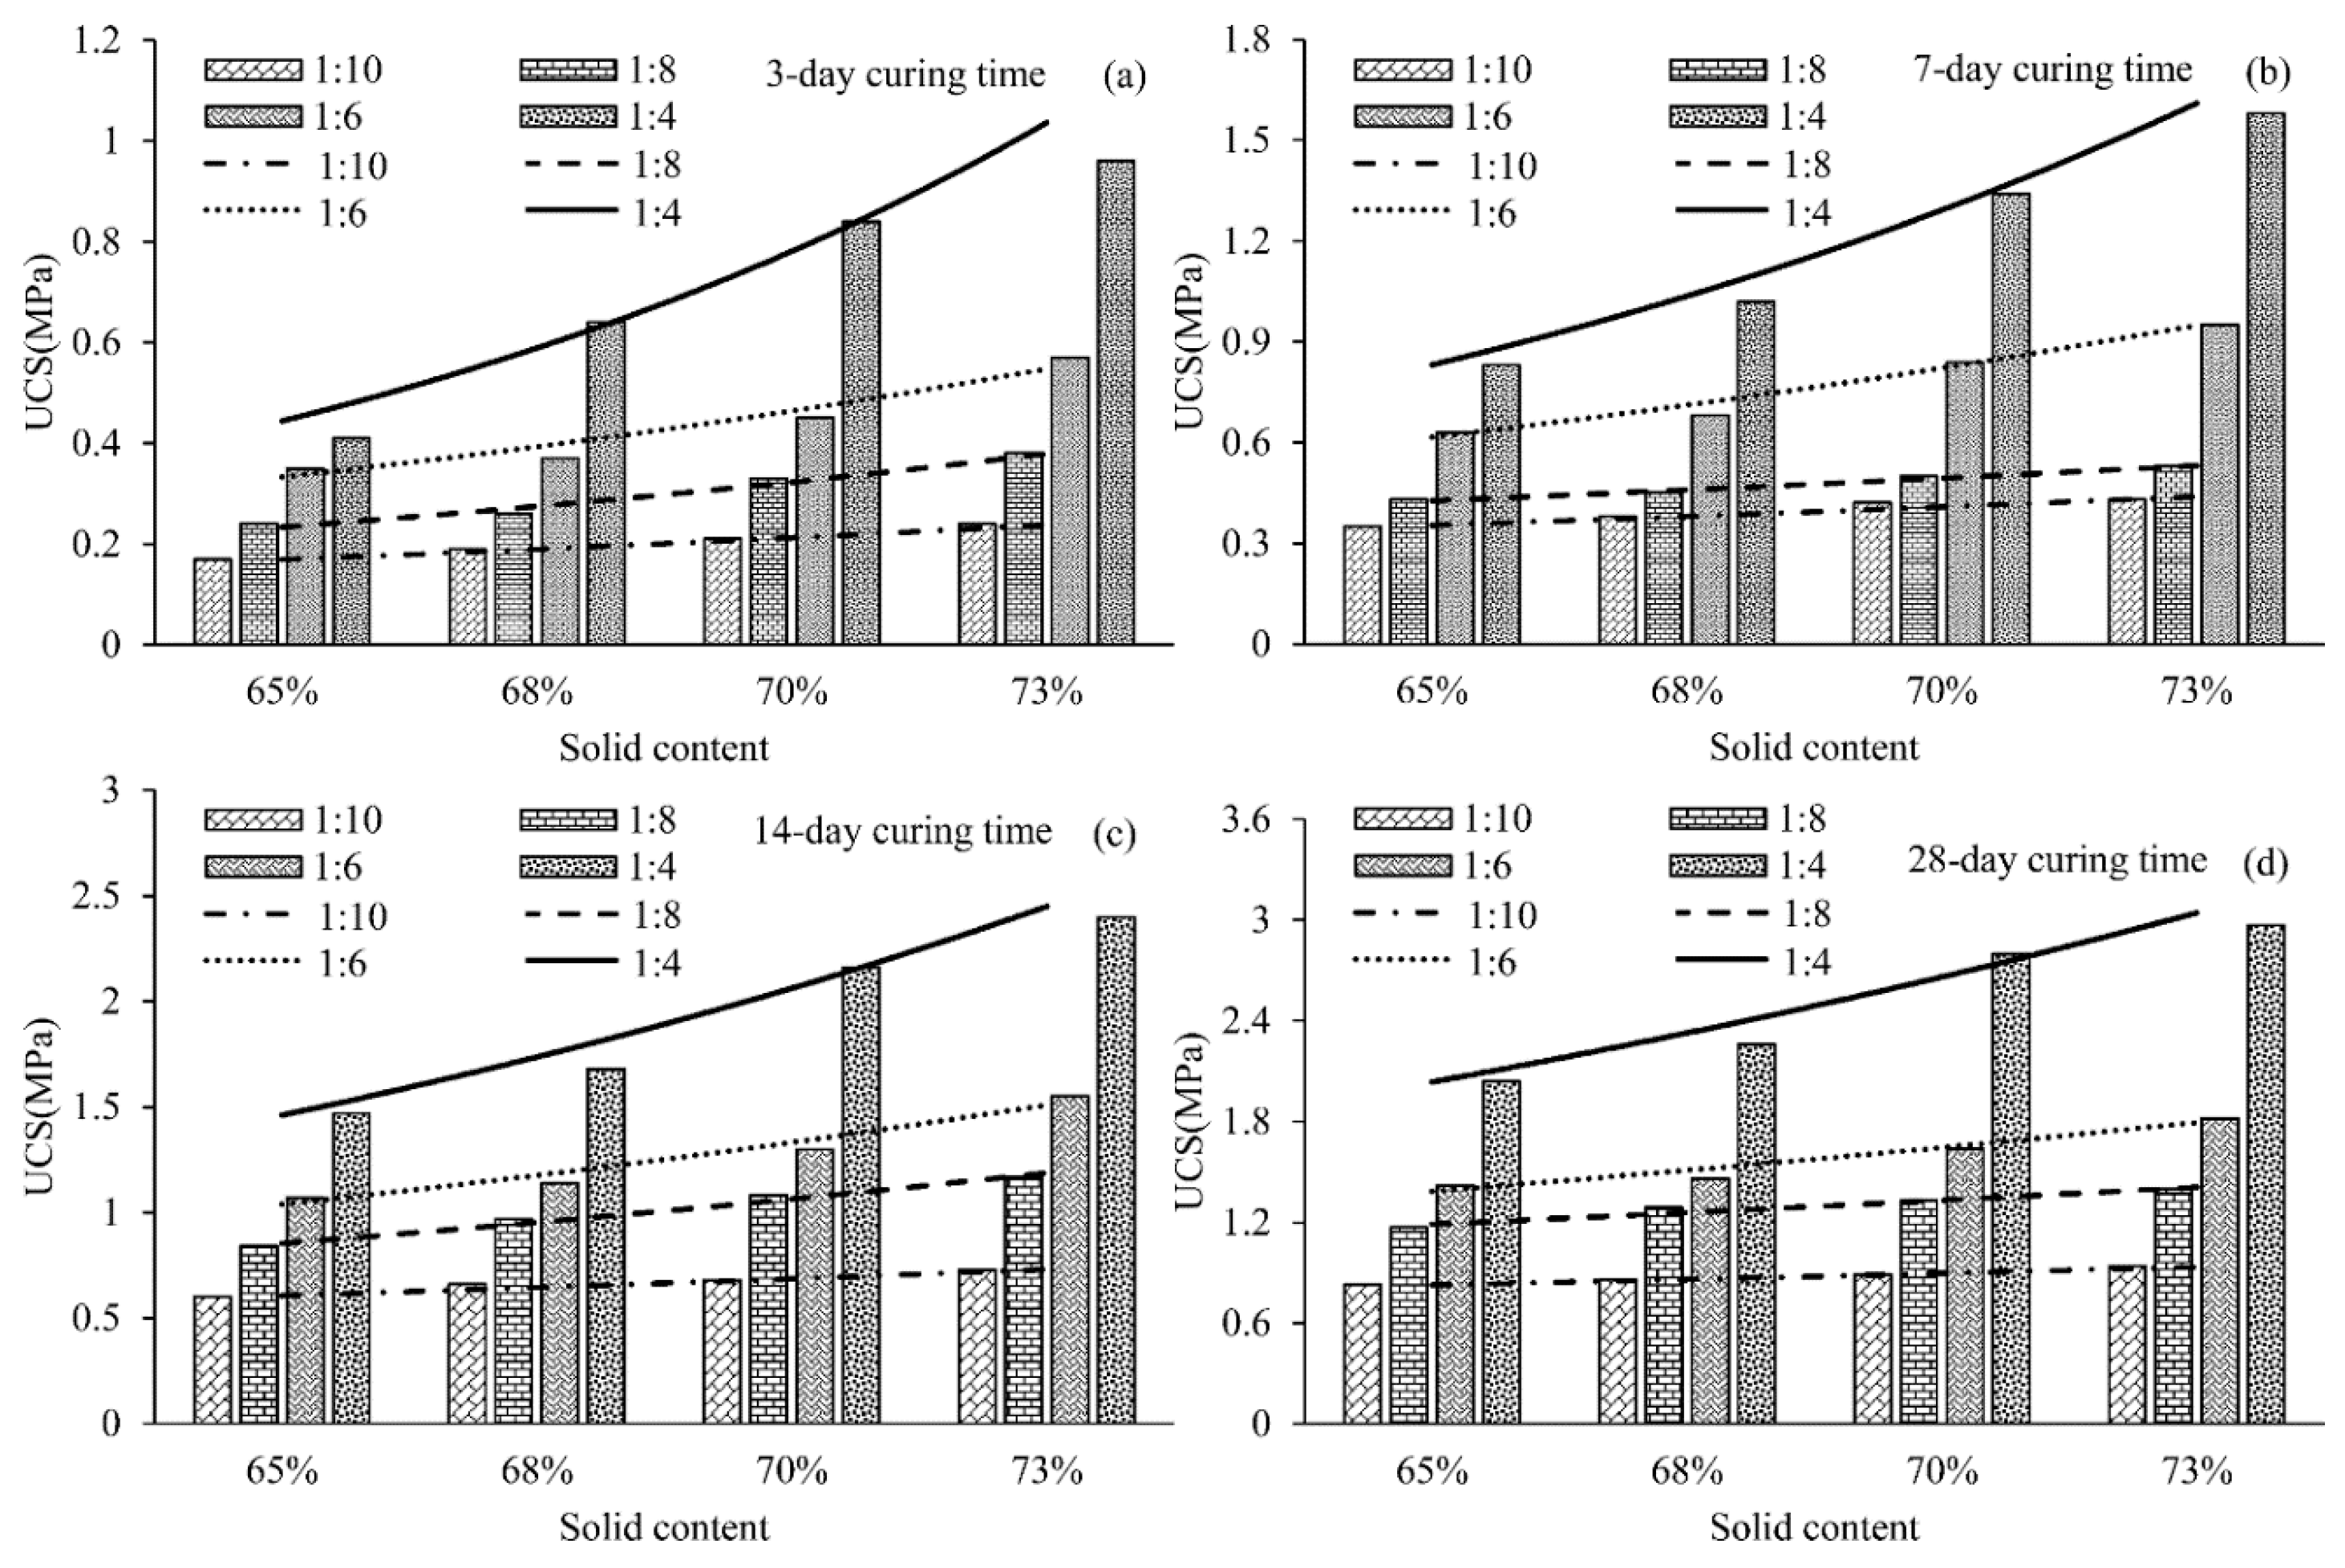
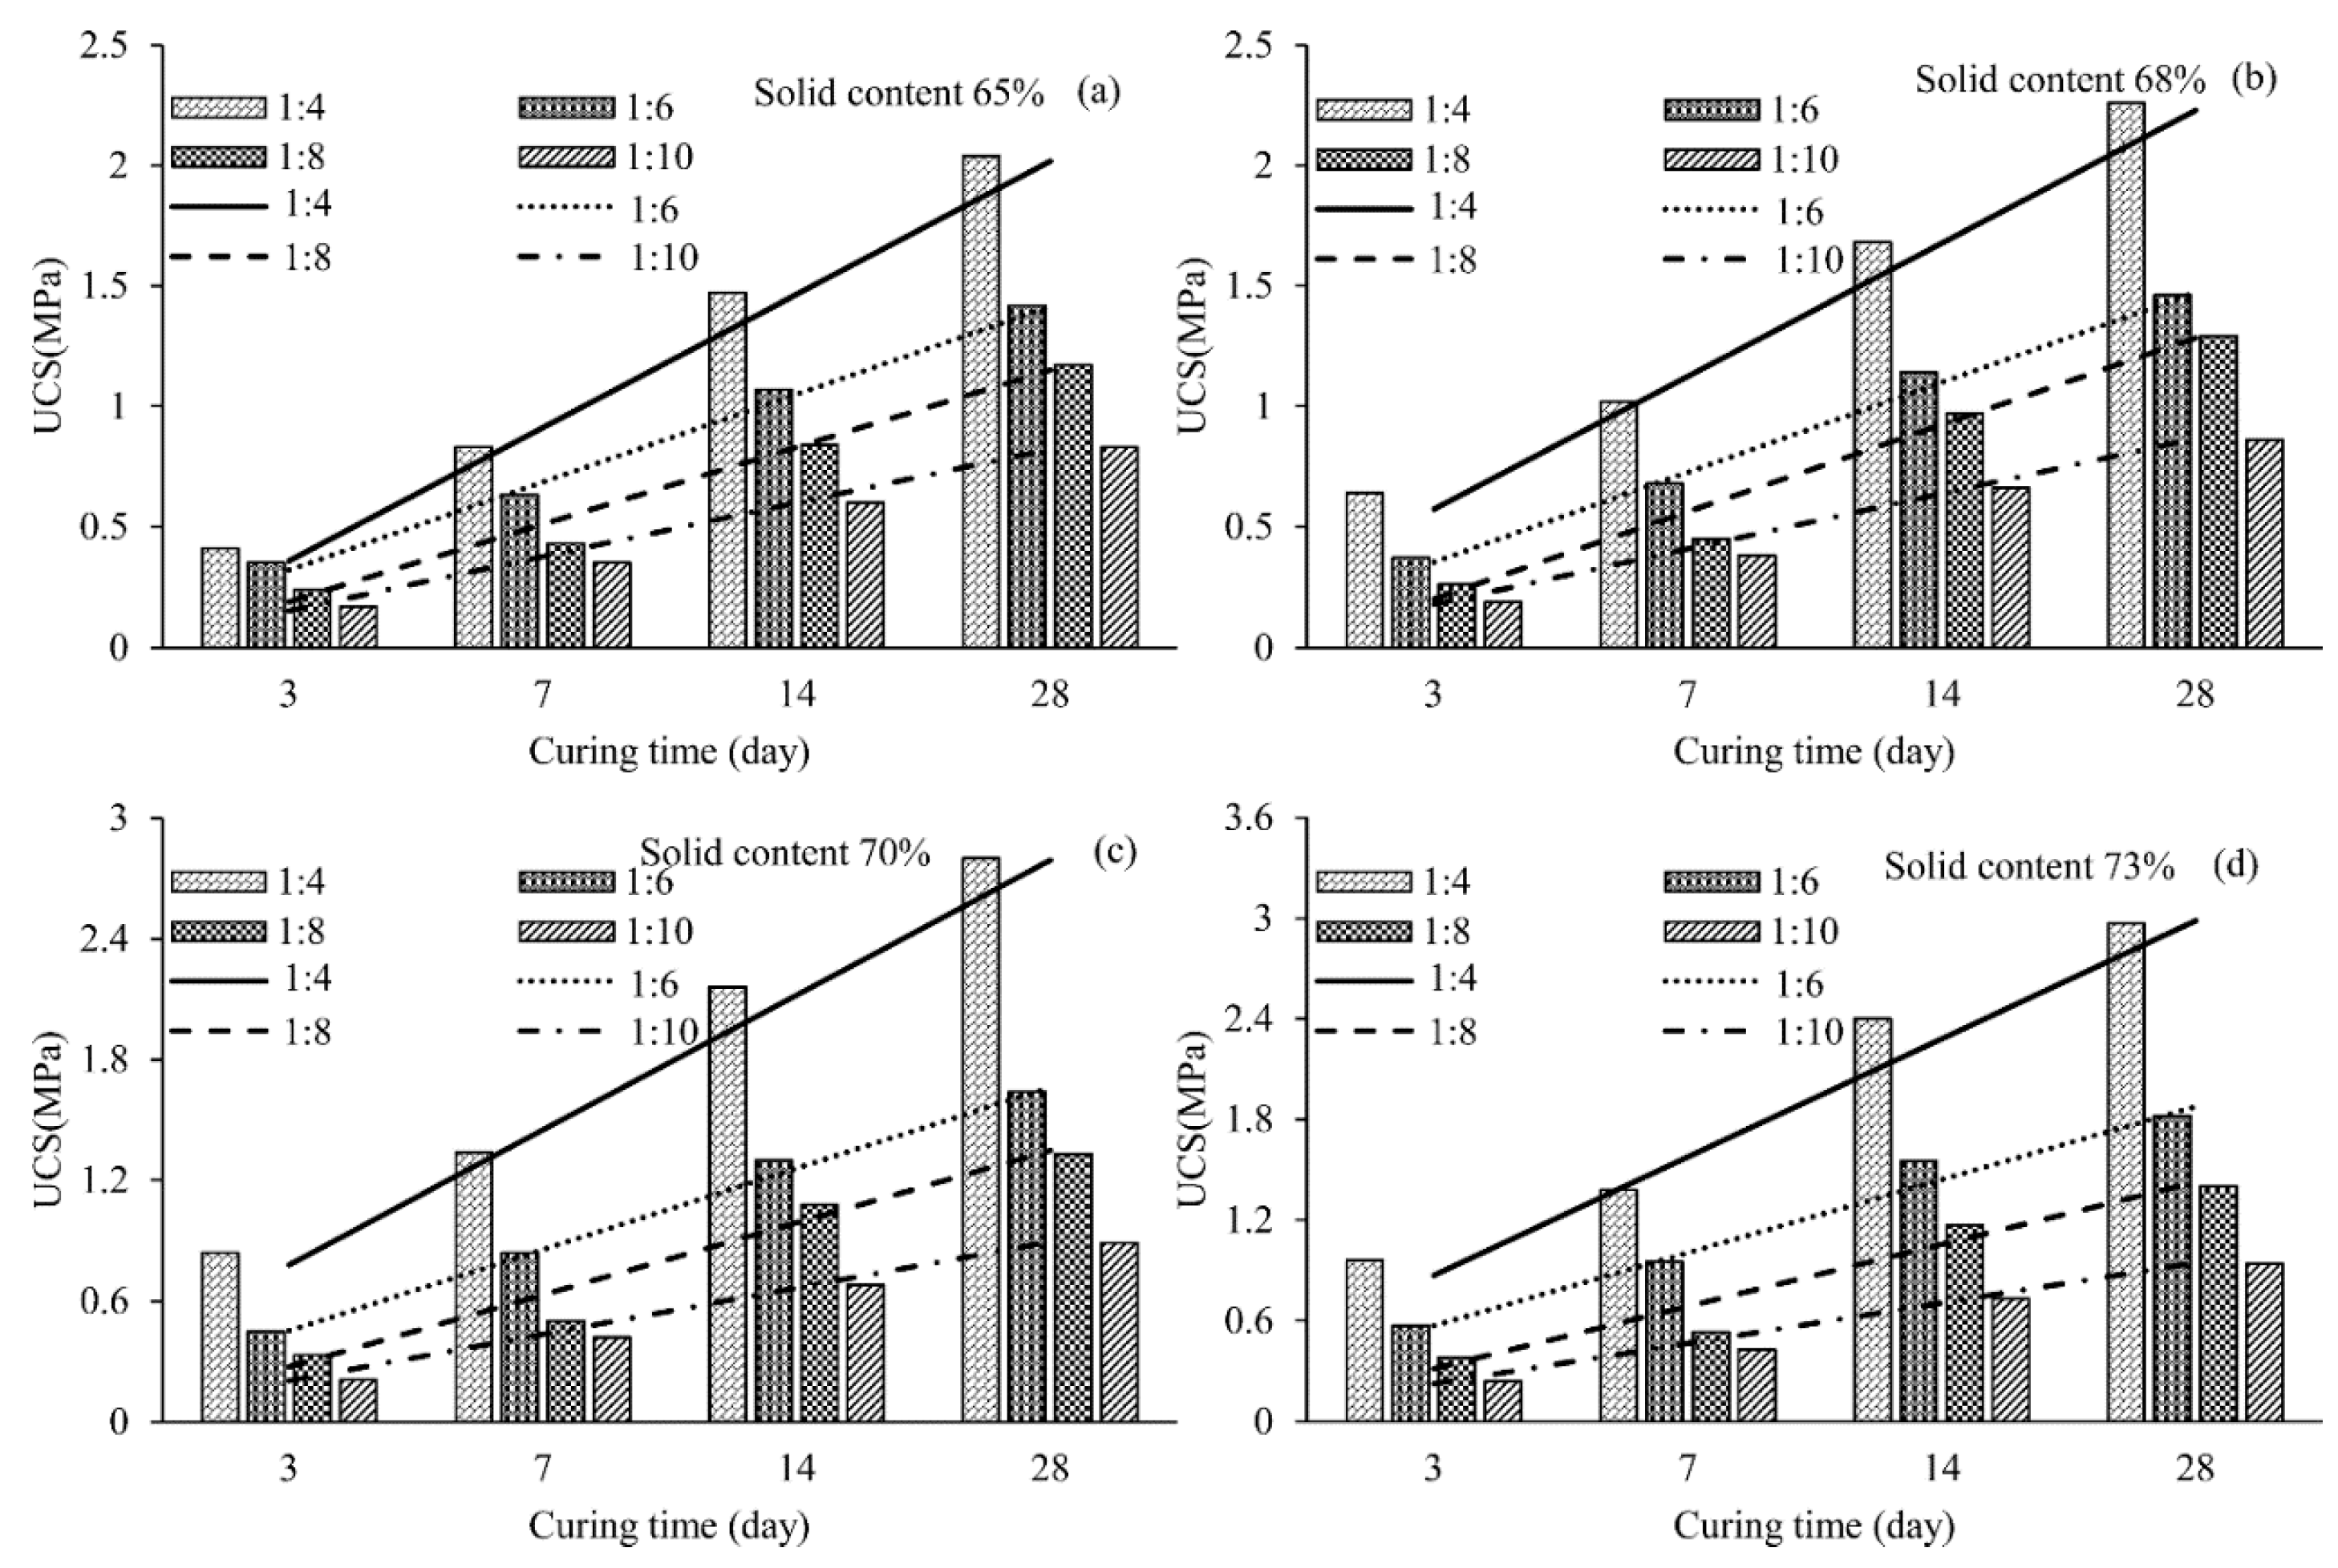
3.1.2. Effect of Solid Content
In order to quantify the relationship between backfill strength and solid content, the cement-tailings ratio was considered as constant. The variation of strength with curing time was studied and fitted as the linear and exponential forms, as showed in Table 6.
Table 6 indicates that the 7, 14 and 28-day strengths of CSUTB show a good agreement with linear and exponential fitting, and the average R2 values are 0.956 and 0.9575 respectively. The exponential fitting appears to fit more in the influence law of solid content on backfill strength. When backfills were cured for 3 days with cement-tailings ratio of 1:4, the linear and exponential R2 values of the strength and solid content are only 0.8883 and 0.8776 respectively. These two fitting forms show no quantitative relationship between backfill strength and mass fraction.
The histograms of CSUTB strength versus solid content with different curing time and CTRs and exponential fitting curves are showed in Figure 3, together with the relevant exponential fitting curves. The influence of solid content on the backfill strength shows a good agreement with the exponential function. When the CTR is constant, a higher concentration means greater influence on the backfill strength. The slope of the exponential fitting curves change drastically with the increase of the CTR, meaning a higher backfill strength. The exponential curves of backfill strength with different solid content at 3, 14 and 28-day of curing time distribute evenly from down to up, while there exists an obvious discrete phenomenon at 7-day curing time. The exponential curves of the 1:4 and 1:6 of CTR in 7-day are far higher than these of the 1:8 and 1:10 of CTR.
Above knowable, there is a relationship approximate to exponential function between solid content and backfill strength, we can obtain
where Y is backfill strength, Z is solid content, and e is Euler number. B and F are fitting parameters related to the influence of CTR and curing time.
Y = BeFZ
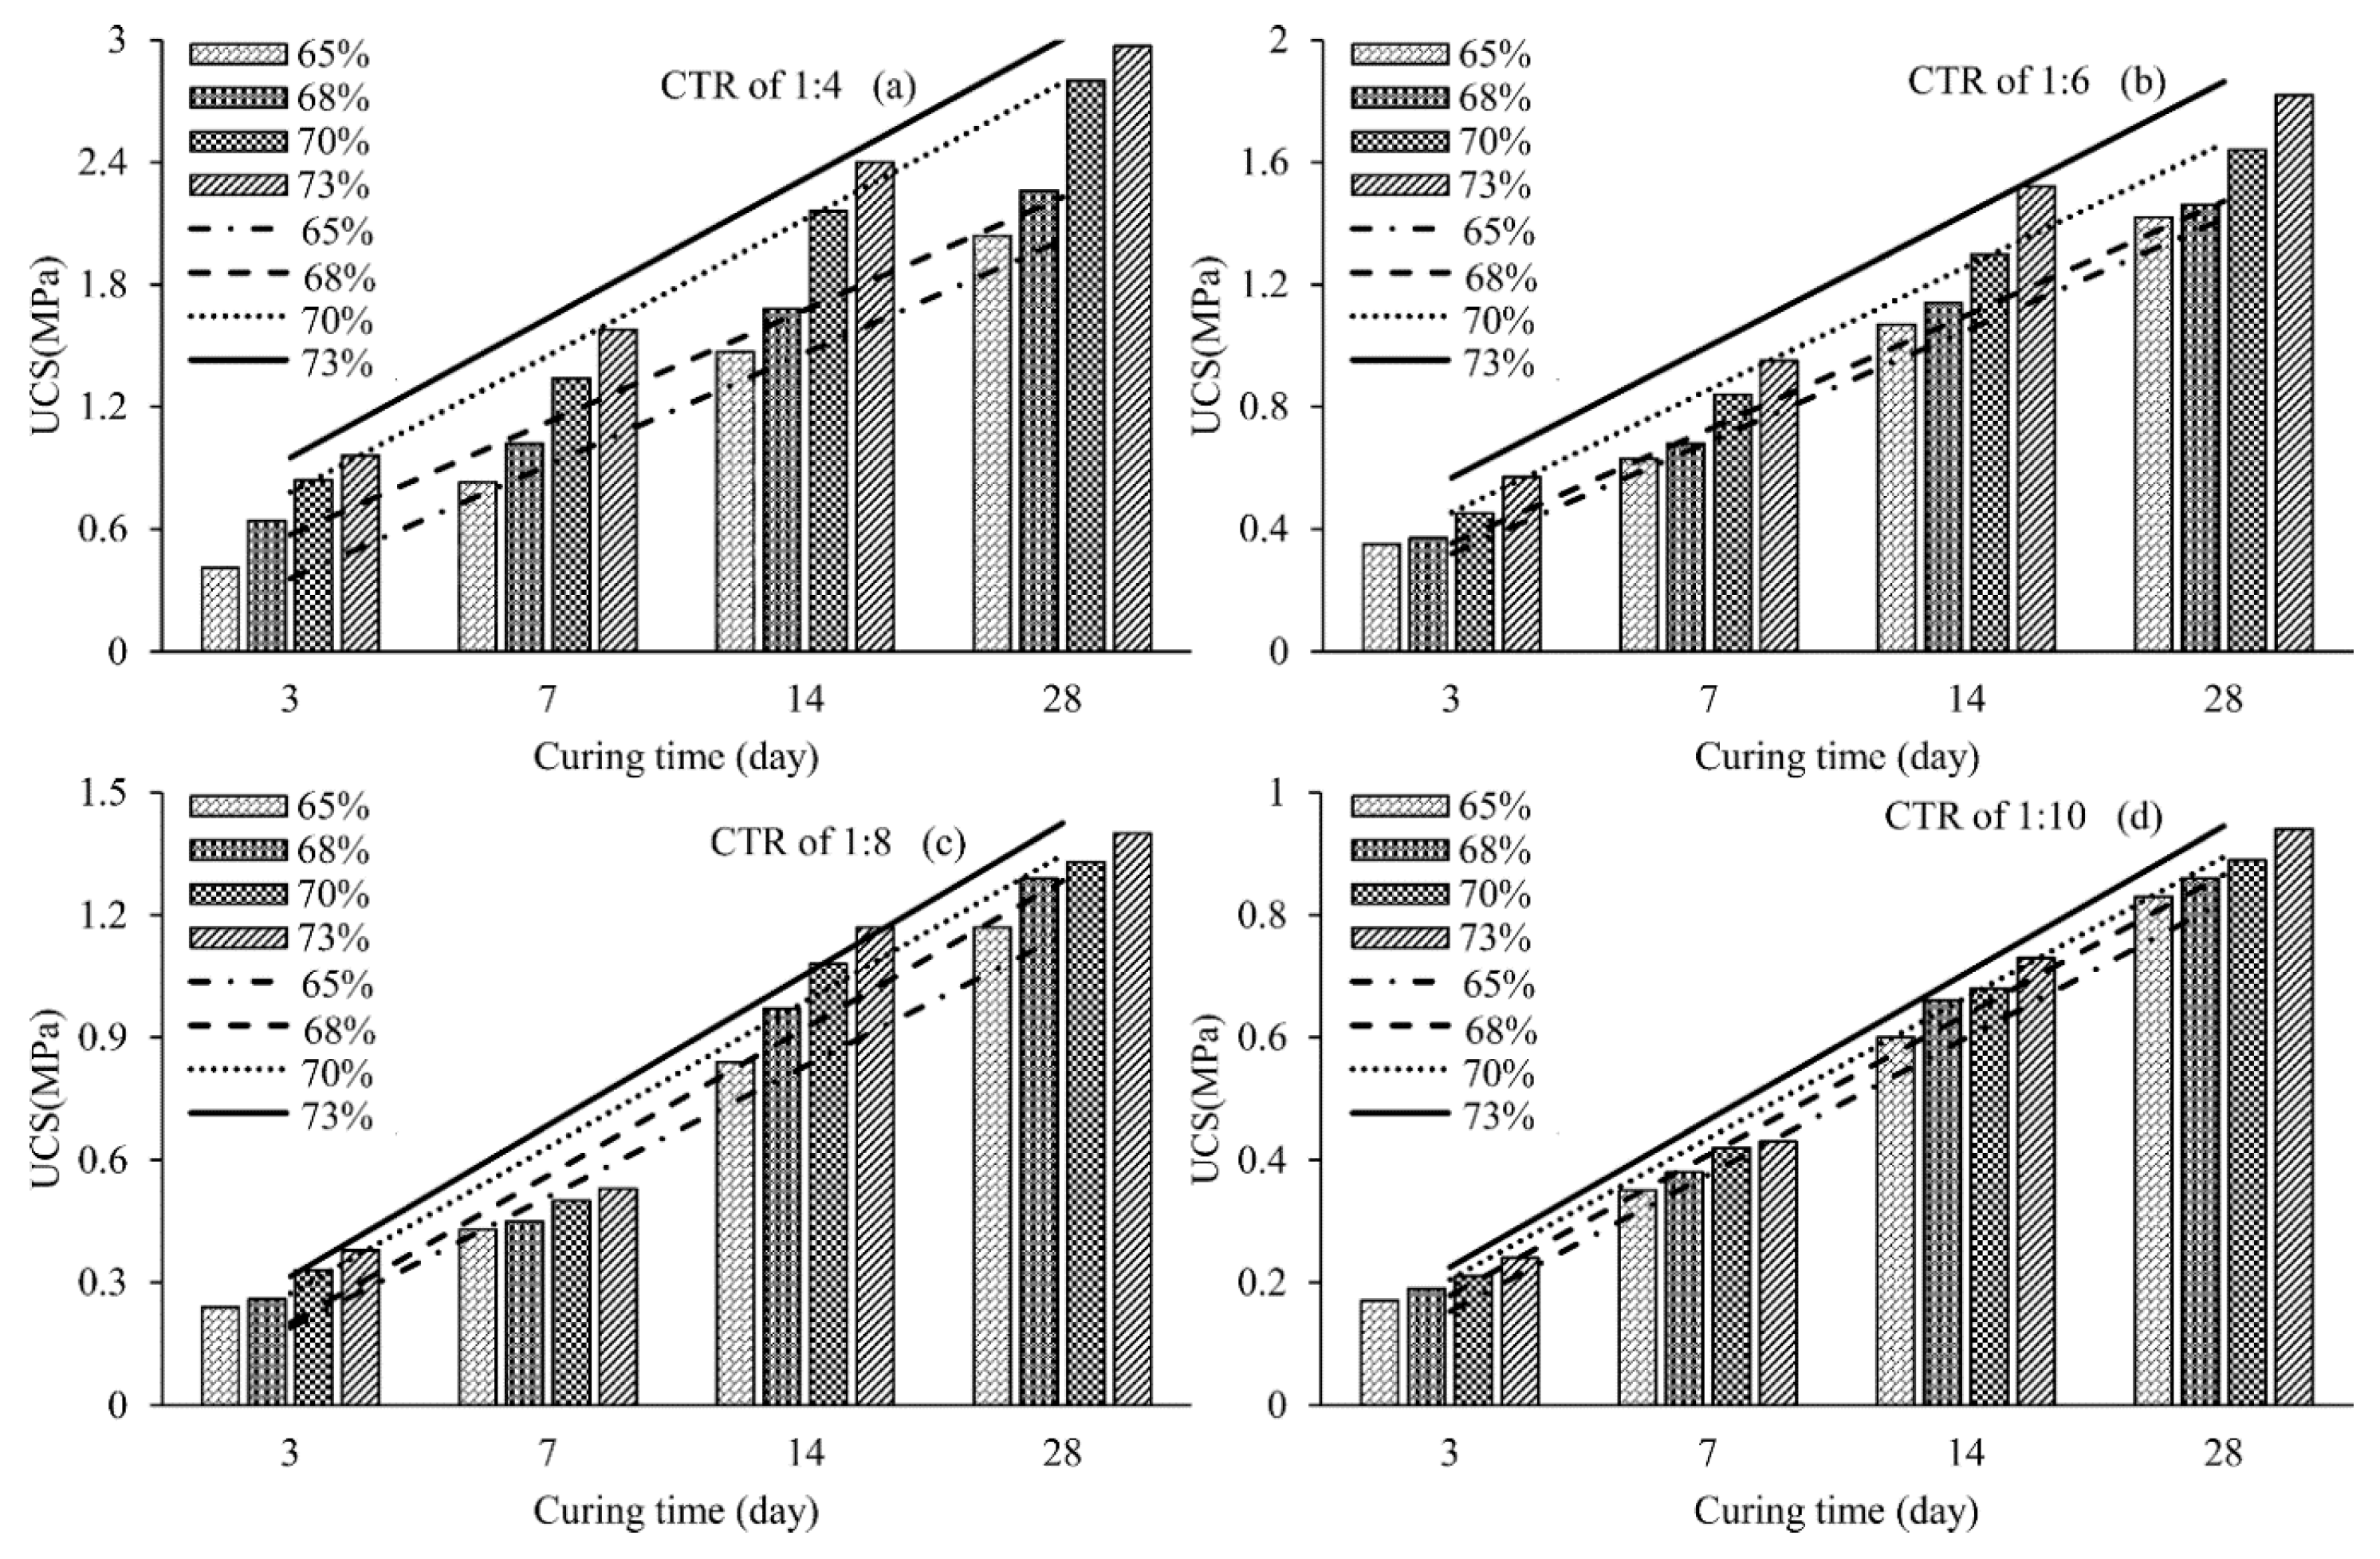
3.1.3. Effect of Curing Time
Solid content and CTR were considered as constants to study the variation of the backfill strength with curing time. Linear and exponential fitting of the variations were constructed, and the relevant values of R2 are listed in Table 7 and Table 8 respectively.
The relationship between the curing time and backfill strength shows linear characteristics, and the corresponding average of the value of R2 is greater than 0.92. The backfill with solid content of 65% shows the highest linear R2 value of 0.9460, whereas the relevant exponential R2 is only 0.8337. The exponential fitting is inappropriate to describe the quantitative relationship between the curing time and backfill strength.
The variation of backfill strength with the curing time in four levels of solid content (65%, 68%, 70% and 73%), and corresponding linear fitting curves, are plotted in Figure 4. The effect of the curing time on the backfill strength is in good agreement with linear function. The backfills strength is approximately linear with longer curing time when the CTR remains unchanged.
A good linear relationship between the curing time and backfill strength with different CTRs is shown in Table 8. The average value of the linear fitting R2 is greater than 0.92, whilst the corresponding exponential fitting R2 is only 0.8258. The backfill of 1:4 of CTR shows the highest linear R2 value of 0.9403, meaning a linear relationship between the curing time and backfill strength. Figure 5 shows the linear fitting curves and strength histogram of CSUTB with different curing time, CTRs and solid content. The backfill strength increases linearly with the curing time. A higher backfill strength is clearly observed when the solid content becomes greater. Moreover, the linear curves of strength development of CSUTB samples with different curing time at 1:8 and 1:10 of CTR distribute evenly from down to up, but the distribution of the linear curves at 1:4 and 1:6 of CTR are discrete.
To summarize, the relationship between curing time and backfill strength is fitted to linear function, and it is expressed as
where Y is backfill strength and d is curing time. B and C are fitting parameters depending on the influence of solid content and CTR.
Y = B + Cd
3.2. Sensitivity of Strength to Influencing Factors
According to the previous results, backfill strength is controlled by the cement-tailings ratio, solid content and curing time. The degree of influence of these three factors is different, meaning the degree of sensitivity is not the same. The GRA method is used to study the factors that influence backfill strength. The relationship of each factor is analyzed, and the significance of each factor is revealed [46]. The uniaxial compressive strength of the CSUTB is treated as the main factor, and the CTR, solid content and curing time as sub-factors. The grey correlation model was then established. Based on the design principle of three-factor and four-level orthogonal test, 16 groups of the uniaxial compression tests under staggered influence of the three factors were selected for the GRA analysis.
In order to ensure the quality of the GRA model, dimensionless treatment for observed values of the influencing factors is necessary. Many dimensionless methods exist, such as initialization, mean value and normalization. The initialization was selected to process data, as shown in Equation (4).
where is behavior sequence of i, and is the behavior sequence after initialization processing.
Absolute difference sequence () is expressed as
where k = (1, 2, 3, … n) is the number of levels, i = (1, 2, 3, … m) is the number of factors series, and M and m are the maximum and minimum in , respectively.
The correlation coefficient () between each sub-factor and mother factor can be written as
where is resolution coefficient extending from 0 to 1, = 0.5.
Therefore, the correlation degree () is given by:
The UCS of the selected groups is taken as reference list, where the i value of 1, 2 and 3 represents sub-factors of the cement-tailings ratio, curing time and solid content. Using the UCS values in Equations (4)–(7), the calculated correlation degrees of each influencing factor are shown in Table 9.
Table 9 shows that the cement-tailings ratio, curing time and solid content have different effects on UCS of CSUTB with the correlational degrees of 0.712, 0.728 and 0.689 respectively. All the correlation degrees are greater than 0.5, meaning significant influences on the UCS [47]. According to the correlation degrees, UCS is most sensitive to the curing time, least sensitive to solid content, and the cement-tailings ratio takes second place. This is mainly because the effect of the curing time on the increase in the amount of Calcium–Silicate–Hydrate (C–S–H) gel, ettringite and calcium hydroxide is more significant, and a higher level of these hydration products leads to a higher mechanical strength of CPB [45]. In addition, the total porosity and median pore diameter in CPB reduced with curing time due to the hydration products filling, which could also result in a higher strength [18].
3.3. Failure Process and Mechanism of CSUTB
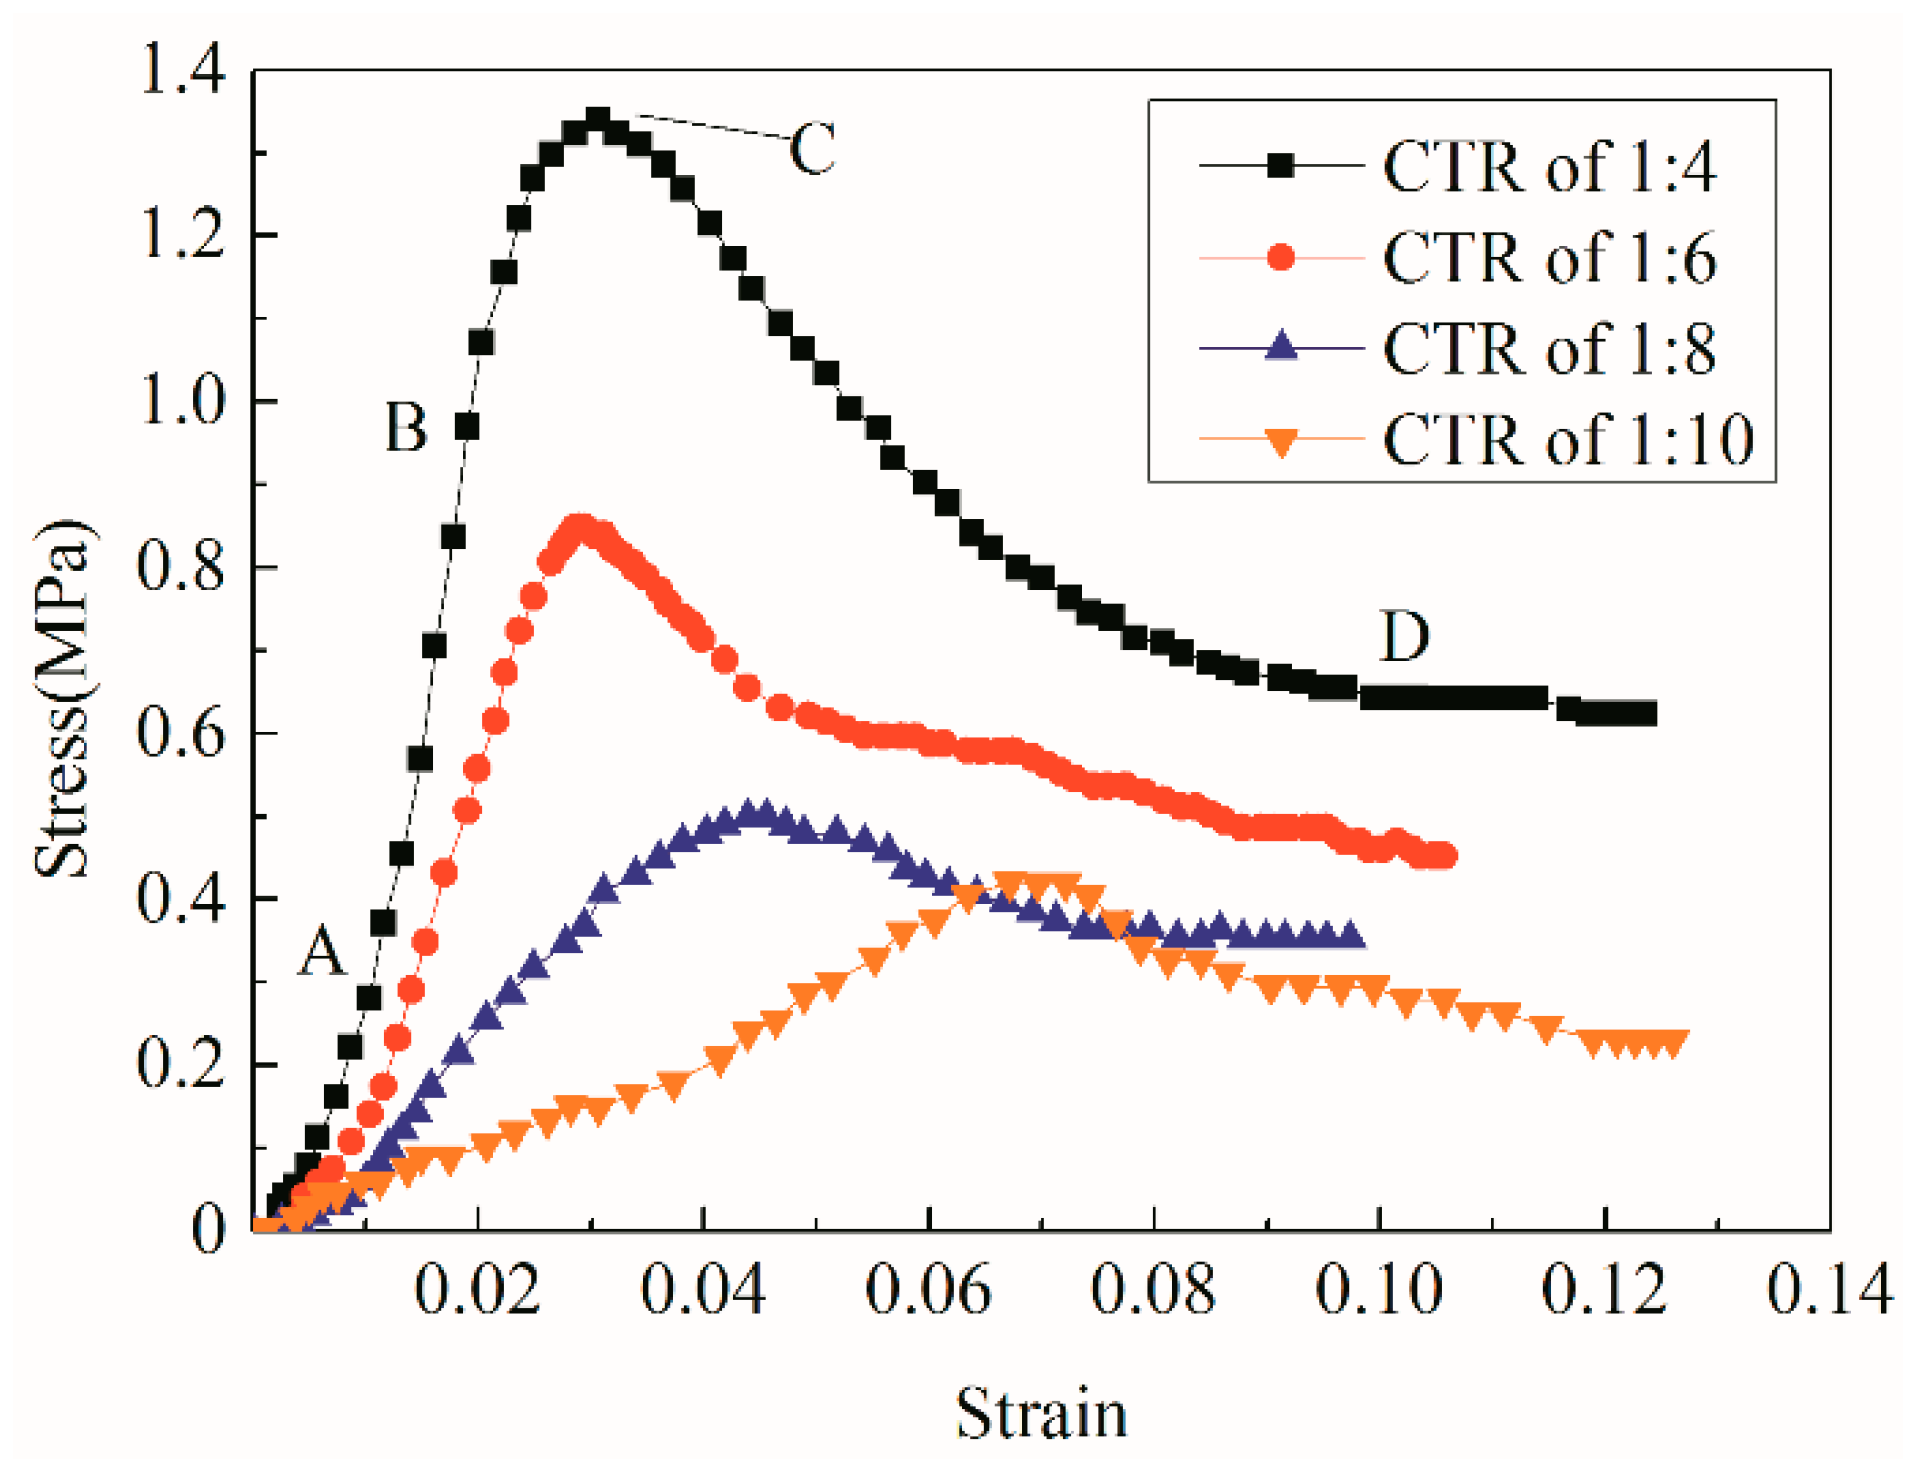
The CPB is composed of cement, tailings, water and other additives, so its strength is a function of the strength of cement, aggregate and the interaction of components. In order to study the failure process and mechanism of CSUTB, the strain-stress curves for 7-day cured and 70% solid content CSUTB with CTRs of 1:4, 1:6, 1:8 and 1:10, were analyzed as shown in Figure 6. The failure process of CSUTB is similar to brittle rocks. Each curve can be divided into four stages, including initial deformation (OA), linear elastic (AB), yield deformation (BC) and complete failure (CD).
The curve shows an upward curvature in the initial deformation stage, as the CPB belongs to artificial materials with many micro cracks and pores. In AB section, the curve is an approximate straight line since the internal pores in CPB are fully closed. The exact value of elastic modulus and Poisson ratio of CSUTB can be quantified in this stage. The elastic modulus of CSUTB increases with higher cement-tailings ratios. The curve shows nonlinear deformation in the yield deformation stage, where the slope of the curve drops to zero gradually. Micro cracks generate, develop and accumulate in the backfill material. The CSUTB then reaches failure stage, where the slope of stress-strain curve in this stage turns negative, and the stress of the CPB decreases with higher strain. The bearing capacity and stiffness of the CSUTB decline with higher level of loading, and the fracture plane gradually forms in CSUTB. After point D, no obvious change in the stress is observed and the CPB moves on to the plastic flow stage, where the stress is no longer reduced with the growth of strain.
To summarize, from the deformation laws of the CSUTB with different cemented-tailings ratios, the deformation is inversely related to the CTR prior to peak strength. The CSUTB with higher CTR shows higher peak strength and reaches the peak with lower axial strain. In the post-peak stage, the backfill with lower CTR shows lower deformation level and the failure occurs more suddenly. The deformation of the specimen shows significant brittle characteristics, and the strain softening phenomenon is observed after the peak strength.
4. Conclusions
The quantitative relationships between UCS of CSUTB and CTR, curing time and solid content were investigated in this study. A series of uniaxial compressive tests was carried out to study the mechanical properties and failure process of backfill. The GRA method was used to study the sensitivity of UCS to CTR, curing time and solid content. The results from this research are summarized below:
- (1)
- ZGIM tailings is a super-fine and alkaline tailings with high quality and activity. The non-uniform coefficient of the tailings is 8.6, meaning a good gradation.
- (2)
- The effects of the CTR, solid content and curing time on the UCS of CSUTB are investigated. When the other two factors are fixed, the UCS of CSUTB increases exponentially with the increase of CTR and solid content, while increases linearly with curing time. The sensitivity of UCS to curing time is strongest, with a correlation degree of 0.728, and the sensitivity is weakest to solid content, with a correlation degree of 0.689.
- (3)
- The failure process of CSUTB is divided into four stages including initial deformation, linear elastic deformation, yield deformation and complete failure. The damage of the CSUTB is attributed to the accumulation of micro cracks and concentration of partial stresses, and the evolution of damage leads to complete failure of CSUTB.
- (4)
- Future studies are required to investigate the strength characteristics of CSUTB under complex mechanical conditions, explore the hydration mechanism of CSUTB and compare it to normal CPB, and test the long term performance of CSUTB.
Acknowledgments
The authors acknowledge financial support from the National Science and Technology Support Program of China (No. 2011BAB07B02, 2012BAJ17B01, and 2012BAJ17B02). Yabing Zhang, Chenhui Wei and Haiqiang Jiang from Northeastern University are also gratefully acknowledged for proofing the manuscript.
Author Contributions
Xiaogang Sun designed the experiments; Jun Xing performed the experiments; Songbo Li collected and archived the experiment results; Jingping Qiu and Lei Yang analyzed the experimental data and initiated the writing of the paper.
Conflicts of Interest
The authors declare no conflict of interest.
References
- Zhang, T.J.; Ma, M.; Wang, H.S.; Xu, H.G. A nonlinear rheological model of backfill material for retaining roadways and the analysis of its stability. Min. Sci. Technol. China 2011, 21, 543–546. [Google Scholar] [CrossRef]
- Li, L.; Aubertin, M. A modified solution to assess the required strength of exposed backfill in mine stopes. Can. Geotech. J. 2012, 49, 994–1002. [Google Scholar] [CrossRef]
- Cai, S.J.; Huang, G.; Wu, D.; Zhang, Y.D. Experimental and Modeling Study on the Rheological Properties of Tailings Backfill. J. Northeast. Univ. Nat. Sci. 2015, 36, 882–886. [Google Scholar]
- Li, L.; Aubertin, M. An improved method to assess the required strength of cemented backfill in underground stopes with an open face. Int. J. Min. Sci. Technol. 2014, 24, 549–558. [Google Scholar] [CrossRef]
- Belem, T.; Benzaazoua, M. Design and Application of Underground Mine Paste Backfill Technology. Geotech. Geol. Eng. 2008, 26, 147–174. [Google Scholar] [CrossRef]
- Dong, L.; Gao, Q.; Nan, S.Q.; Du, J. Performance and hydration mechanism of new super fine cemented whole-tailings backfilling materials. J. Cent. South Univ. Sci. Technol. 2013, 44, 1571–1577. [Google Scholar]
- Li, J.; Zhang, J.X.; Huang, Y.L.; Zhang, Q.; Xu, J.M. An investigation of surface deformation after fully mechanized, solid back fill mining. Int. J. Min. Sci. Technol. 2012, 22, 453–457. [Google Scholar] [CrossRef]
- Doherty, J.P. A numerical study into factors affecting stress and pore pressure in free draining mine stopes. Comput. Geotech. 2015, 63, 331–341. [Google Scholar] [CrossRef]
- Yilmaz, E.; Belem, T.; Benzaazoua, M. Specimen size effect on strength behavior of cemented paste backfills subjected to different placement conditions. Eng. Geol. 2015, 185, 52–62. [Google Scholar] [CrossRef]
- Fall, M.; Benzaazoua, M.; Ouellet, S. Experimental characterization of the influence of tailings fineness and density on the quality of cemented paste backfill. Miner. Eng. 2005, 18, 41–44. [Google Scholar] [CrossRef]
- Fall, M.; Pokharel, M. Coupled effects of sulphate and temperature on the strength development of cemented tailings backfills: Portland cemen-paste backfill. Cem. Concr. Compos. 2010, 32, 819–828. [Google Scholar] [CrossRef]
- Kesimal, A.; Yilmaz, E.; Ercikdi, B.; Alp, I.; Deveci, H. Effect of properties of tailings and binder on the short- and long-term strength and stability of cemented paste backfill. Mater. Lett. 2005, 59, 3703–3709. [Google Scholar] [CrossRef]
- Ercikdi, B.; Külekci, G.; Yilmaz, T. Utilization of granulated marble and waste bricks as mineral admixture in cemented paste backfill of sulphide-rich tailings. Constr. Build. Mater. 2015, 93, 573–583. [Google Scholar] [CrossRef]
- Yilmaz, E.; Benzaazoua, M.; Belem, T.; Bussière, B. Effect of curing under pressure on compressive strength development of cemented paste backfill. Miner. Eng. 2009, 22, 772–785. [Google Scholar] [CrossRef]
- Yilmaz, E.; Belem, T.; Benzaazoua, M. Effects of curing and stress conditions on hydromechanical, geotechnical and geochemical properties of cemented paste backfill. Eng. Geol. 2014, 168, 23–37. [Google Scholar] [CrossRef]
- Fall, M.; Samb, S.S. Effect of high temperature on strength and microstructural properties of cemented paste backfill. Fire Saf. J. 2009, 44, 642–651. [Google Scholar] [CrossRef]
- Yi, X.W.; Ma, G.W.; Fourie, A. Compressive behaviour of fibre-reinforced cemented paste backfill. Geotext. Geomembr. 2015, 43, 207–215. [Google Scholar] [CrossRef]
- Zheng, J.R.; Zhu, Y.L.; Zhao, Z.B. Utilization of limestone powder and water-reducing admixture in cemented paste backfill of coarse copper mine tailings. Constr. Build. Mater. 2016, 124, 31–36. [Google Scholar] [CrossRef]
- Koohestani, B.; Koubaa, A.; Belem, T.; Bussière, B.; Bouzahzah, H. Experimental investigation of mechanical and microstructural properties of cemented paste backfill containing maple-wood filler. Constr. Build. Mater. 2016, 121, 222–228. [Google Scholar] [CrossRef]
- Koohestani, B.; Belem, T.; Koubaa, A.; Bussière, B. Experimental investigation into the compressive strength development of cemented paste backfill containing Nano-silica. Cem. Concr. Compos. 2016, 72, 180–189. [Google Scholar] [CrossRef]
- Fall, M.; Belem, S.; Samb, T.; Benzaazoua, M. Experimental characterization of the stress–strain behaviour of cemented paste backfill in compression. J. Mater. Sci. 2007, 42, 3914–3922. [Google Scholar] [CrossRef]
- Benzaazoua, M.; Fall, M.; Belem, T. A contribution to understanding the hardening process of cemented pastefill. Miner. Eng. 2004, 17, 141–152. [Google Scholar] [CrossRef]
- Ercikdi, B.; Kesimal, A.; Cihangir, F.; Deveci, H.; Alp, İ. Cemented paste backfill of sulphide-rich tailings: Importance of binder type and dosage. Cem. Concr. Compos. 2009, 31, 268–274. [Google Scholar] [CrossRef]
- Ercikdi, B.; Clhangir, F.; Kesimal, A.; Deveci, H.; Alp, I. Utilization of water-reducing admixtures in cemented paste backfill of sulphide-rich mill tailings. J. Hazard. Mater. 2010, 179, 940–946. [Google Scholar] [CrossRef] [PubMed]
- Li, W.C.; Fall, M. Sulphate effect on the early age strength and self-desiccation of cemented paste backfill. Constr. Build. Mater. 2016, 106, 296–304. [Google Scholar] [CrossRef]
- Hou, P.K.; Kawashima, S.H.; Wang, K.J.; Corr, D.J.; Qian, J.S.; Shah, S.P. Effects of colloidal nanosilica on rheological and mechanical properties of fly ash–cement mortar. Cem. Concr. Compos. 2013, 35, 12–22. [Google Scholar] [CrossRef]
- Fall, M.; Ghirian, A. Coupled thermo–hydro-mechanical–chemical evolution of cemented paste backfill and implications for backfill design-experimental results. In Proceedings of the 11th International Symposium on Mining with Backfill (Mine Fill 2014), Perth, Australia, 20–22 May 2014; Australian Centre for Geomechanics: Crawley, Australia, 2014. [Google Scholar]
- Abdul-Hussain, N.; Fall, M. Thermo–hydro-mechanical behaviour of sodium silicate-cemented paste tailings in column experiments. Tunn. Undergr. Space Technol. 2012, 29, 85–93. [Google Scholar] [CrossRef]
- Cui, L.; Fall, M. A coupled thermo–hydro-mechanical–chemical model for underground cemented tailings backfill. Tunn. Undergr. Space Technol. 2015, 50, 396–414. [Google Scholar] [CrossRef]
- Ghirian, A.; Fall, M. Coupled thermo-hydro-mechanical–chemical behaviour of cemented paste backfill in column experiments. Part I: Physical, hydraulic and thermal processes and characteristics. Eng. Geol. 2013, 164, 195–207. [Google Scholar] [CrossRef]
- Wu, D.; Sun, G.H.; Liu, Y.C. Modeling the thermo-hydro-chemical behavior of cemented coal gangue-fly ash backfill. Constr. Build. Mater. 2016, 111, 522–528. [Google Scholar] [CrossRef]
- Yilmaz, E.; Belem, T.; Bussière, B.; Benzaazoua, M. Relationships between microstructural properties and compressive strength of consolidated and unconsolidated cemented paste backfills. Cem. Concr. Compos. 2011, 33, 702–715. [Google Scholar] [CrossRef]
- Yilmaz, E.; Belem, T.; Bussière, B.; Mbonimpa, M.; Benzaazoua, M. Curing time effect on consolidation behaviour of cemented paste backfill containing different cement types and contents. Constr. Build. Mater. 2015, 75, 99–111. [Google Scholar] [CrossRef]
- Ercikdi, B.; Yılmaz, T.; Külekci, G. Strength and ultrasonic properties of cemented paste backfill. Ultrasonics 2014, 54, 195–204. [Google Scholar] [CrossRef] [PubMed]
- Huang, S.; Xia, K.W.; Qiao, L. Dynamic tests of cemented paste backfill: Effects of strain rate, curing time, and cement content on compressive strength. J. Mater. Sci. 2011, 46, 5165–5170. [Google Scholar] [CrossRef]
- Kesimal, A.; Yilmaz, E.; Ercikdi, B. Evaluation of paste backfill mixtures consisting of sulphide-rich mill tailings and varying cement contentse. Cem. Concr. Res. 2004, 34, 1817–1822. [Google Scholar] [CrossRef]
- Yin, S.H.; Wu, A.X.; Hu, K.J.; Wang, Y.; Zhang, Y.K. The effect of solid components on the rheological and mechanical properties of cemented paste backfill. Miner. Eng. 2012, 35, 61–66. [Google Scholar] [CrossRef]
- Fall, M.; Benzaazoua, M.; Saa, E.G. Mix proportioning of underground cemented tailings backfill. Tunn. Undergr. Space Technol. 2008, 23, 80–90. [Google Scholar] [CrossRef]
- Li, S.; Wang, X.M.; Zhang, Q.L.; Wang, S. Time-Varying Characteristic of Paste-like Super-Fine Unclassified Tailings in Long Self-Flowing Transportation. J. Northeast. Univ. Nat. Sci. 2016, 37, 1045–1050. [Google Scholar]
- Zhang, Q.L.; Li, X.P.; Yang, W. Optimization of filling slurry ratio in a mine based on back-propagation neural network. J. Cent. South Univ. Sci. Technol. 2013, 44, 2867–2874. [Google Scholar]
- Xu, W.B.; Du, J.H.; Song, W.D.; Chen, H.Y. Experiment on the mechanism of consolidating backfill body of extra-fine grain unclassified tailings and cementitious materials. Rock Soil Mech. 2013, 34, 2295–2302. [Google Scholar]
- Common Portland Cement; Chinese Standard: GB 175-2007; Standardization Administration of China: Beijing, China, 2007.
- Yılmaz, T.; Ercikdi, B.; Karaman, K.; Külekçi, G. Assessment of strength properties of cemented paste backfill by ultrasonic pulse velocity test. Ultrasonics 2014, 54, 1386–1394. [Google Scholar] [CrossRef] [PubMed]
- Standard Test Method for Unconfined Compressive Strength of Cohesive Soil; ASTM D2166/D2166M-16; ASTM International: West Conshohocken, PA, USA, 2016.
- Fu, J.X.; Du, C.F.; Song, W.D. Strength sensitivity and failure mechanism of full tailings cemented backfills. J. Univ. Sci. Technol. Beijing 2014, 36, 1149–1157. [Google Scholar]
- Cao, S.G.; Xu, A.M.; Liu, Y.B.; Zhang, L.Q. Comprehensive assessment of security in coal mines based on grey relevance analysis. J. Min. Saf. Eng. 2007, 24, 141–145. [Google Scholar]
- Huang, D.L.; Lin, B. Sensitivity analysis on the influence factor of the mechanical properties of the artificial frozen soil. Mech. Eng. 2012, 34, 63–65. (In Chinese) [Google Scholar]
Figure 1.
Particle size distribution of the Zhongguan Iron Mine (ZGIM) unclassified tailings.

Figure 2.
Relationship between CTR and backfill strength when the curing time varies from 3 to 28 days: (a) 3-day; (b) 7-day; (c) 14-day; (d) 28-day.
Figure 2.
Relationship between CTR and backfill strength when the curing time varies from 3 to 28 days: (a) 3-day; (b) 7-day; (c) 14-day; (d) 28-day.

Figure 3.
Relationship between solid content and backfill strength when the curing time varies from 3 to 28 days: (a) 3-day; (b) 7-day; (c) 14-day; (d) 28-day.
Figure 3.
Relationship between solid content and backfill strength when the curing time varies from 3 to 28 days: (a) 3-day; (b) 7-day; (c) 14-day; (d) 28-day.

Figure 4.
Relationship between curing time and backfill strength when the solid content varies from 65% to 73%: (a) 65%; (b) 68%; (c) 70%; (d) 73%.
Figure 4.
Relationship between curing time and backfill strength when the solid content varies from 65% to 73%: (a) 65%; (b) 68%; (c) 70%; (d) 73%.

Figure 5.
Relationship between curing time and backfill strength when the cement-tailings ratio varies from 1:4 to 1:10: (a) 1:4; (b) 1:6; (c) 1:8; (d) 1:10.
Figure 5.
Relationship between curing time and backfill strength when the cement-tailings ratio varies from 1:4 to 1:10: (a) 1:4; (b) 1:6; (c) 1:8; (d) 1:10.

Figure 6.
Stress-strain curves for CSUTB with different cement-tailings ratios.

Table 1.
Particle size characteristics of unclassified tailings.
| Characteristic Diameter | d10 | d50 | d60 | d90 | d100 |
|---|---|---|---|---|---|
| Size (μm) | 2.17 | 14.2 | 18.7 | 82.9 | 211 |
Table 2.
Chemical compositions of unclassified tailings and ordinary Portland cement (OPC) (%).
| Composition | CaO | SiO2 | Fe2O3 | MgO | Al2O3 | SO3 | K2O | Na2O | TiO2 |
|---|---|---|---|---|---|---|---|---|---|
| Tailings | 44.41 | 20.91 | 16.39 | 11.30 | 3.22 | 2.23 | 0.52 | 0.39 | 0.10 |
| OPC | 60.51 | 22.86 | 3.35 | 1.57 | 5.45 | 3.01 | 0.56 | 0.25 | 0.11 |
Table 3.
Mix formulations of cemented super-fine unclassified tailings backfill (CSUTB) mixture. CTR—cement-tailings ratio.
Table 3.
Mix formulations of cemented super-fine unclassified tailings backfill (CSUTB) mixture. CTR—cement-tailings ratio.
| CTR | Solid Content | Curing Time (Day) |
|---|---|---|
| 1:4 | 65% | 3 |
| 1:6 | 68% | 7 |
| 1:8 | 70% | 14 |
| 1:10 | 73% | 28 |
Table 4.
Uniaxial compressive strength (UCS) of CSUTB (MPa).
| CTR | Curing Time (Day) | Solid Content | |||
|---|---|---|---|---|---|
| 65% | 68% | 70% | 73% | ||
| 1:4 | 3 | 0.41 | 0.64 | 0.84 | 0.96 |
| 7 | 0.83 | 1.02 | 1.34 | 1.58 | |
| 14 | 1.47 | 1.68 | 2.16 | 2.40 | |
| 28 | 2.04 | 2.26 | 2.80 | 2.97 | |
| 1:6 | 3 | 0.35 | 0.37 | 0.45 | 0.57 |
| 7 | 0.63 | 0.68 | 0.84 | 0.95 | |
| 14 | 1.07 | 1.14 | 1.30 | 1.55 | |
| 28 | 1.42 | 1.46 | 1.64 | 1.82 | |
| 1:8 | 3 | 0.24 | 0.26 | 0.33 | 0.38 |
| 7 | 0.43 | 0.45 | 0.50 | 0.53 | |
| 14 | 0.84 | 0.97 | 1.08 | 1.17 | |
| 28 | 1.17 | 1.29 | 1.33 | 1.40 | |
| 1:10 | 3 | 0.17 | 0.19 | 0.21 | 0.24 |
| 7 | 0.35 | 0.38 | 0.42 | 0.43 | |
| 14 | 0.60 | 0.66 | 0.68 | 0.73 | |
| 28 | 0.83 | 0.86 | 0.89 | 0.94 | |
Table 5.
Fitting correlation coefficient between CTR and strength.
| Curing Time (Day) | Fitting Type | Solid Content | ||||
|---|---|---|---|---|---|---|
| 65% | 68% | 70% | 73% | Average | ||
| 3 | linear | 0.9760 | 0.8712 | 0.7986 | 0.9216 | 0.8919 |
| exponential | 0.9533 | 0.9991 | 0.9836 | 0.9968 | 0.9832 | |
| 7 | linear | 0.9554 | 0.8834 | 0.8765 | 0.9143 | 0.9074 |
| exponential | 0.9816 | 0.9884 | 0.9845 | 0.9564 | 0.9778 | |
| 14 | linear | 0.9695 | 0.9282 | 0.8905 | 0.9448 | 0.9333 |
| exponential | 0.9909 | 0.9309 | 0.9401 | 0.9581 | 0.9550 | |
| 28 | linear | 0.9414 | 0.8974 | 0.8670 | 0.9051 | 0.9027 |
| exponential | 0.9694 | 0.9510 | 0.9606 | 0.9790 | 0.9650 | |
Table 6.
Fitting correlation coefficient between solid content and strength.
| Curing Time (Day) | Fitting Type | CTR | ||||
|---|---|---|---|---|---|---|
| 1:4 | 1:6 | 1:8 | 1:10 | Average | ||
| 3 | linear | 0.8883 | 0.9118 | 0.9324 | 0.9797 | 0.9281 |
| exponential | 0.8776 | 0.9348 | 0.9375 | 0.9837 | 0.9334 | |
| 7 | linear | 0.9739 | 0.9374 | 0.9347 | 0.9651 | 0.9528 |
| exponential | 0.9751 | 0.9410 | 0.9356 | 0.9593 | 0.9528 | |
| 14 | linear | 0.9481 | 0.9320 | 0.9888 | 0.9974 | 0.9666 |
| exponential | 0.9484 | 0.9492 | 0.9807 | 0.9964 | 0.9687 | |
| 28 | linear | 0.9232 | 0.9187 | 0.9695 | 0.9832 | 0.9487 |
| exponential | 0.9235 | 0.9242 | 0.9701 | 0.9860 | 0.9510 | |
Table 7.
Fitting correlation coefficient between curing time and strength.
| Solid Content | Fitting Type | CTR | ||||
|---|---|---|---|---|---|---|
| 1:4 | 1:6 | 1:8 | 1:10 | Average | ||
| 65% | linear | 0.9484 | 0.9382 | 0.9515 | 0.9457 | 0.9460 |
| exponential | 0.8269 | 0.8351 | 0.8507 | 0.8219 | 0.8337 | |
| 68% | linear | 0.9559 | 0.9204 | 0.9060 | 0.9233 | 0.9264 |
| exponential | 0.8702 | 0.8169 | 0.8207 | 0.8005 | 0.8271 | |
| 70% | linear | 0.9480 | 0.9078 | 0.8946 | 0.9267 | 0.9175 |
| exponential | 0.8818 | 0.7956 | 0.8288 | 0.8080 | 0.8286 | |
| 73% | linear | 0.9646 | 0.8723 | 0.8761 | 0.9190 | 0.9080 |
| exponential | 0.8983 | 0.7899 | 0.8245 | 0.8149 | 0.8319 | |
Table 8.
Correlation coefficient of curing age and strength fitting.
| CTR | Fitting Type | Solid Content | ||||
|---|---|---|---|---|---|---|
| 65% | 68% | 70% | 73% | Average | ||
| 1:4 | linear | 0.9484 | 0.9539 | 0.9480 | 0.9109 | 0.9403 |
| exponential | 0.8269 | 0.8702 | 0.8818 | 0.8189 | 0.8495 | |
| 1:6 | linear | 0.9382 | 0.9204 | 0.9078 | 0.8723 | 0.9097 |
| exponential | 0.8351 | 0.8169 | 0.7956 | 0.7899 | 0.8094 | |
| 1:8 | linear | 0.9512 | 0.9060 | 0.8946 | 0.8761 | 0.9077 |
| exponential | 0.8507 | 0.8207 | 0.8288 | 0.8245 | 0.8311 | |
| 1:10 | linear | 0.9457 | 0.9233 | 0.9267 | 0.9190 | 0.9287 |
| exponential | 0.8219 | 0.8005 | 0.8080 | 0.8149 | 0.8133 | |
Table 9.
Calculation results of correlation degree.
| Group | γ01 (k) | γ02 (k) | γ03 (k) |
|---|---|---|---|
| 1 | 1.000 | 1.000 | 1.000 |
| 2 | 0.677 | 0.974 | 0.680 |
| 3 | 0.422 | 0.959 | 0.422 |
| 4 | 0.333 | 0.949 | 0.333 |
| 5 | 0.739 | 0.898 | 0.755 |
| 6 | 0.988 | 0.859 | 0.851 |
| 7 | 0.578 | 0.821 | 0.535 |
| 8 | 0.555 | 0.805 | 0.511 |
| 9 | 0.723 | 0.778 | 0.718 |
| 10 | 0.715 | 0.736 | 0.947 |
| 11 | 0.985 | 0.636 | 0.745 |
| 12 | 0.731 | 0.583 | 0.593 |
| 13 | 0.620 | 0.545 | 0.651 |
| 14 | 0.679 | 0.407 | 0.683 |
| 15 | 0.778 | 0.371 | 0.844 |
| 16 | 0.868 | 0.333 | 0.749 |
| correlational degree | 0.712 | 0.728 | 0.689 |
© 2017 by the authors. Licensee MDPI, Basel, Switzerland. This article is an open access article distributed under the terms and conditions of the Creative Commons Attribution (CC BY) license (http://creativecommons.org/licenses/by/4.0/).
Share and Cite
MDPI and ACS Style
Qiu, J.; Yang, L.; Sun, X.; Xing, J.; Li, S. Strength Characteristics and Failure Mechanism of Cemented Super-Fine Unclassified Tailings Backfill. Minerals 2017, 7, 58. https://doi.org/10.3390/min7040058
AMA Style
Qiu J, Yang L, Sun X, Xing J, Li S. Strength Characteristics and Failure Mechanism of Cemented Super-Fine Unclassified Tailings Backfill. Minerals. 2017; 7(4):58. https://doi.org/10.3390/min7040058
Chicago/Turabian StyleQiu, Jingping, Lei Yang, Xiaogang Sun, Jun Xing, and Songbo Li. 2017. "Strength Characteristics and Failure Mechanism of Cemented Super-Fine Unclassified Tailings Backfill" Minerals 7, no. 4: 58. https://doi.org/10.3390/min7040058
Note that from the first issue of 2016, this journal uses article numbers instead of page numbers. See further details here.