
A Time Varying Ventilation and Dust Control Strategy Based on the Temporospatial Characteristics of Dust Dispersion


1
Institute of Remote Sensing and Geographic Information System, Peking University, Beijing 100871, China
2
Department of Mechanics and Engineering Science, College of engineering, Peking University, Beijing 100871, China
*
Author to whom correspondence should be addressed.
Minerals 2017, 7(4), 59; https://doi.org/10.3390/min7040059
Submission received: 20 November 2016
/
Revised: 5 April 2017
/
Accepted: 7 April 2017
/
Published: 14 April 2017
Abstract
:Generally, an effective ventilation system is essential to reduce coal dust disaster. However, with the implementation of carbon tax and increase of energy and operating costs, it is urgent to design a cost-effective ventilation and dust control system. In this paper, a real driving face in an excavation laneway of coal mine in China was taken as the physical model, and the temporospatial characteristics of airflow and dust dispersion is investigated for the first time to design an original conception of time-varying ventilation and dust control strategy. Specifically, computational fluid dynamic (CFD) approaches are utilized to investigate the dynamic regularity of airflow behavior and dust dispersion, and parametric studies are conducted to select the appropriate ventilation pattern, which is validated to be potential in energy saving as well as dust removal efficiency. In addition, based on the selection of key time point according to the regularity of dust concentration changed over time, the most effective type of speed function is brought out for this novel ventilation system, which reduces energy usage up to 15.11% in a ventilation period. Furthermore, the accuracy of simulation result is verified by field measurements, which demonstrates that adjusting the ventilation velocity at the appropriate time point (case 7) can effectively control the dust concentration, which performs as well as the steady flow. The research results suggest that the further understanding of temporospatial characteristics of dust dispersion is helpful for ventilation design, and significant energy savings and dust removal requirements are verified to be possible in the proposed scheme.
1. Introduction
The appropriate control of coal dust inside a laneway remains a longstanding challenge in underground coal mine systems, which is one of the most important guarantees of the safe production in mining operation environment. Specifically, with respect to the comprehensive mechanized driving face in an excavation laneway of coal mine, it is difficult to exclude coal dust from the driving face due to the characteristics such as the high level of mechanization and long ventilation distance [1]. In accordance to the statistics by Xi, more than 2.65 million miners are exposed to coal dust in China, with 6000 cases die of coal dust among 25,000 new pneumoconiosis cases every year [2]. The dust concentration near the driving face can be up to 6000 mg/m3 without any of the measures of dust control, which seriously endangers safe production and is harmful to mine operators in the working environment. For example, the precision and longevity of equipment can be influenced by high dust concentration, and the working place with low visibility can effect normal operation over time [3]. Furthermore, there are numerous fatalities caused by coal dust explosions, whose requirements can be helpfully described on a fundamental level by the explosion pentagon [4]. It occurs when coal dust is suspended in air and ignited by oxidant gases. In terms of the impact on people, physical assets and business production, the consequences are often similar to those arising from a gas explosion [5,6]. Thus, it is urgent to design a proper dust control system to ensure a safe and productive underground working environment [7].
To date, various physical and chemical dust control methods have been used in dust prediction and prevention, such as water spray, coal seam water infusion, foam and ventilation [8,9,10]. However, as for these methods, there are advantages and disadvantages, for instance, a good water spray system has remarkable dust removal efficiency because it can decrease the dust concentration in the air by 60% [11]. However, the additional water treatment and coal drying process are required during this process, which add extra complexity and cost for the water spray system. Otherwise, the evaporated water mixed with many impurities may block the nozzle spray; the high environmental humidity caused by the excessive water evaporation is not the ideal working condition; and wet coal quality may lead to difficulties in coal transportation. As for the coal seam water infusion and foam spray, the extra requirement for complex apparatus and the large amount of water also increases complexity for the system, similar to water spray. However, the ventilation strategy typically requires massive fresh air to control dust, which has the potential to minimize complexity of the system and reduce energy requirement.
Therefore, this paper focused on the ventilation approaches and investigated how to reasonably design the ventilation and dust control system. In the early stage of the mine ventilation system development, numerical simulation experiments have already played an important role, which allows innovation at very low cost and have been conducted by many researchers to investigate the airflow behavior and dust dispersion regularity. Numerous achievements have been obtained over the past few decades. Computational fluid dynamics (CFD) modeling were firstly conducted by Heerden and Sullivan [12] to investigate airflow behavior, methane emission and dust dispersion in underground mine. While the model was first validated against measurement data till 1997 by Uchino and Inoue [13]. Niu et al. revealed that mining face inside the laneway is the most dangerous area due to high dust concentration around [14]. In addition, Torano et al. found that high dust concentration could be effectively reduced by increasing ventilation air velocity [15], and some other factors such as windpipe diameter and setback distance could also influence dust dispersion. Wang et al. indicated that the effectiveness of air curtain in protecting miners from dust exposure [16]. Canoo developed multiphase Eularian model to predict dust behavior in more complex geometries [17]. While Parra et al. simulated airflow behavior and validated against experimental counterpart by investigating two different ventilation scenarios, i.e., blowing and exhausting [18]. Torano et al. compared various turbulence models, evaluated methane distribution, and later added dust to their model and validated the dust behavior in underground tunnels with experimental data [19]. El-Nagdy utilized fan and system characteristic curves to evaluate the stability of multiple fans [20]. Recently, Sasmito et al. investigated various auxiliary ventilation equipment to improve ventilation, primarily focused on brattice ventilation with no additional power source needed to drive fans. They showed that this method can provide better dust management in room and pillar mining. Whereas one of the major weaknesses is that the movement and flexibility of miners and mining fleets would be limited by brattice installation. Therefore, they proposed by far the most effective method called a hybrid brattice system, which is a combination of a physical brattice together with air curtains [21,22,23,24,25]. However, additional equipment lead to the complexity and severe energy consumption to the system; meanwhile, a study indicated that the most underground mines generally supply excess fresh air to remove coal dust according to local codes, up to 60% of the total operating cost is attributable to mine ventilation cost [26,27]. In addition, these present methods still remains very limited because they ignored the dynamic regularity of the airflow and dust dispersion during ventilation design process, which renders the principle and technology of dust control system a key scientific issue. For this purpose, this study aims to design the ventilation system from the perspective of time with the goal of reducing energy cost to the minimum whilst maintaining the dust concentration in the driving face at a low level.
Based on the above issues, this paper investigated temporospatial characteristics of airflow and dust dispersion for the first time, and a novel time-varying ventilation and dust control system is proposed. Firstly, different mesh discretization is tested and compared with each other in terms of time consuming and computational efficiency, and four different turbulence models are evaluated and compared with Tianchen coal mine data. Secondly, computational fluid dynamic (CFD) approaches are utilized to study the temporospatial characteristics of airflow behavior and dust dispersion inside a laneway, and the time-varying ventilation and dust control system is validated to be potential in energy saving. Various factors are investigated by parametric studies and the appropriate type of speed function is brought out. Finally, the key time point is defined for the time varying ventilation according to the dust concentration curve changed over time, which provides excellent performance in dust control efficiency and energy saving. Furthermore, the numerical simulation results are verified by field measurements in Tianchen coal mine. It is noted that the intermittent flow can be implemented based on frequency conversion technology for local fan in ventilation system, which can be done by adding frequency converter for the local fan in the circuit without affecting local ventilation fans and other equipment [28]. The simpler design of this novel ventilation makes it suitable for practical application in underground mine.
2. Model Development
2.1. Geometric Model and Research Background
This study takes a real excavation laneway (3-7109 laneway) in Tianchen coal mine as the physical prototype, which is located in Shandong province, China. The layout of the excavation laneway and devices inside is shown in Figure 1. The excavation laneway is the main part of the roadway, which has a heading face, an outlet with the rectangular cross-section, and consists of a forcing duct and a roadheader inside. Based on this laneway prototype, a cuboid laneway model is established to select and validate the turbulence model, and investigate the temporal-spatial characteristics of airflow and dust dispersion, as shown in Figure 2. The rectangle roadway section is 4.2 m wide and 3.6 m high, and the length is 36 m. The forcing duct is close to the laneway wall. The diameter of the forcing duct is 0.8 m, the distance from its outlet to the heading face before driving is 12 m, and to the laneway floor is 2.1 m.
According to the safe and operating regulations in Tianchen coal mine, the coal seam structure is simple, it has primary structure coal, and the comprehensive mechanized driving method is adopted in the construction of the laneway. Coal dust from all seams in Tianchen mine poses an explosion hazard; the explosive index of the coal dust is around 39.15%. During the process of laneway excavation, the airflow quantity in the excavation laneway is calculated based on the requirement of the mine gas or carbon dioxide emission quantity, the actual wind suction of local fan, the number of miners in the laneway and the maximum and minimum wind speed. The safety operation regulations of Tianchen coal mine indicate that the required airflow in 3-7109 laneway is 7.82 m3/s, and the dust flow rate around the driving face is about 0.0042 kg/s. Therefore, the velocity of pressing air from forcing duct is 15.6 m/s in order to provide a safe working environment for miners, and three representative longitudinal sections (Sections A–C) are chosen to study the temporospatial distribution of airflow behavior and dust distributions in the numerical simulation shown in Figure 2. Section B is in the middle of the laneway. Section A is set through the forcing duct, and the Section C is far away from the forcing duct. Sections A and C are, respectively, 0.4 m away from the two walls of the laneway, which are the regions miners typically walk, and they usually work at the position with the distance of 10 m away from the driving face. The maximum number of miners allowed in the excavation laneway 3-7109 is 9.
2.2. Mathematical Models
The essential regularity of dust dispersion, dust movement and their interaction with the air flow is a key issue for dust removal and prevention. During the procedure of coal mining in an excavation laneway, the driving face is the main source of coal dust. A large amount of coal dust generate from the driving face and disperse with the pressing air from the outlet of the forcing duct; finally, part of the dust is removed through the outlet of the laneway, while the rest stays in the laneway space. During the delivering process, dust movement, dust diffusion and dust distribution in the airflow exhibit a gas solid two-phase flow; Here we have three model assumptions: (a) the airflow and other gases belong to the primary phase, which are the continuous medium gas; (b) coal dust particles are assumed to be spherical; (c) heat and mass transfer are ignored during the process of air flow.
In this section, we focus on the temporospatial characteristics of airflow and dust dispersion. The conservative equations of mass, momentum and energy for two-phase flow is deduced for gas solid two-phase flow. Then, four different turbulence models are simulated and compared with each other based on the measured data, then we choose K-epsilon model to simulate the air flow field. Finally, the Discrete Phase Model (DPM) is applied based on the time varying ventilation and dust control system, which belongs to the Euler Lagrange model.
2.2.1. Governing Equations
During the process of dust dispersion with ventilation airflow, the conservation equations of turbulent mass, momentum, energy and species transport need to be considered in mathematical model for the continuous medium gas, which can be expressed as:
where is the fluid density, is the fluid velocity, is the pressure, is the viscous stress tensor, is the gravity acceleration, is the specific heat of the fluid, is the effective fluid thermal conductivity, is the temperature, is the mass fraction of species i (O2, CH4 and N2), is the effective diffusivity of species i, is turbulent viscosity and is the turbulent Schmidt number and is the turbulent Prandtl number.
2.2.2. Turbulence Model
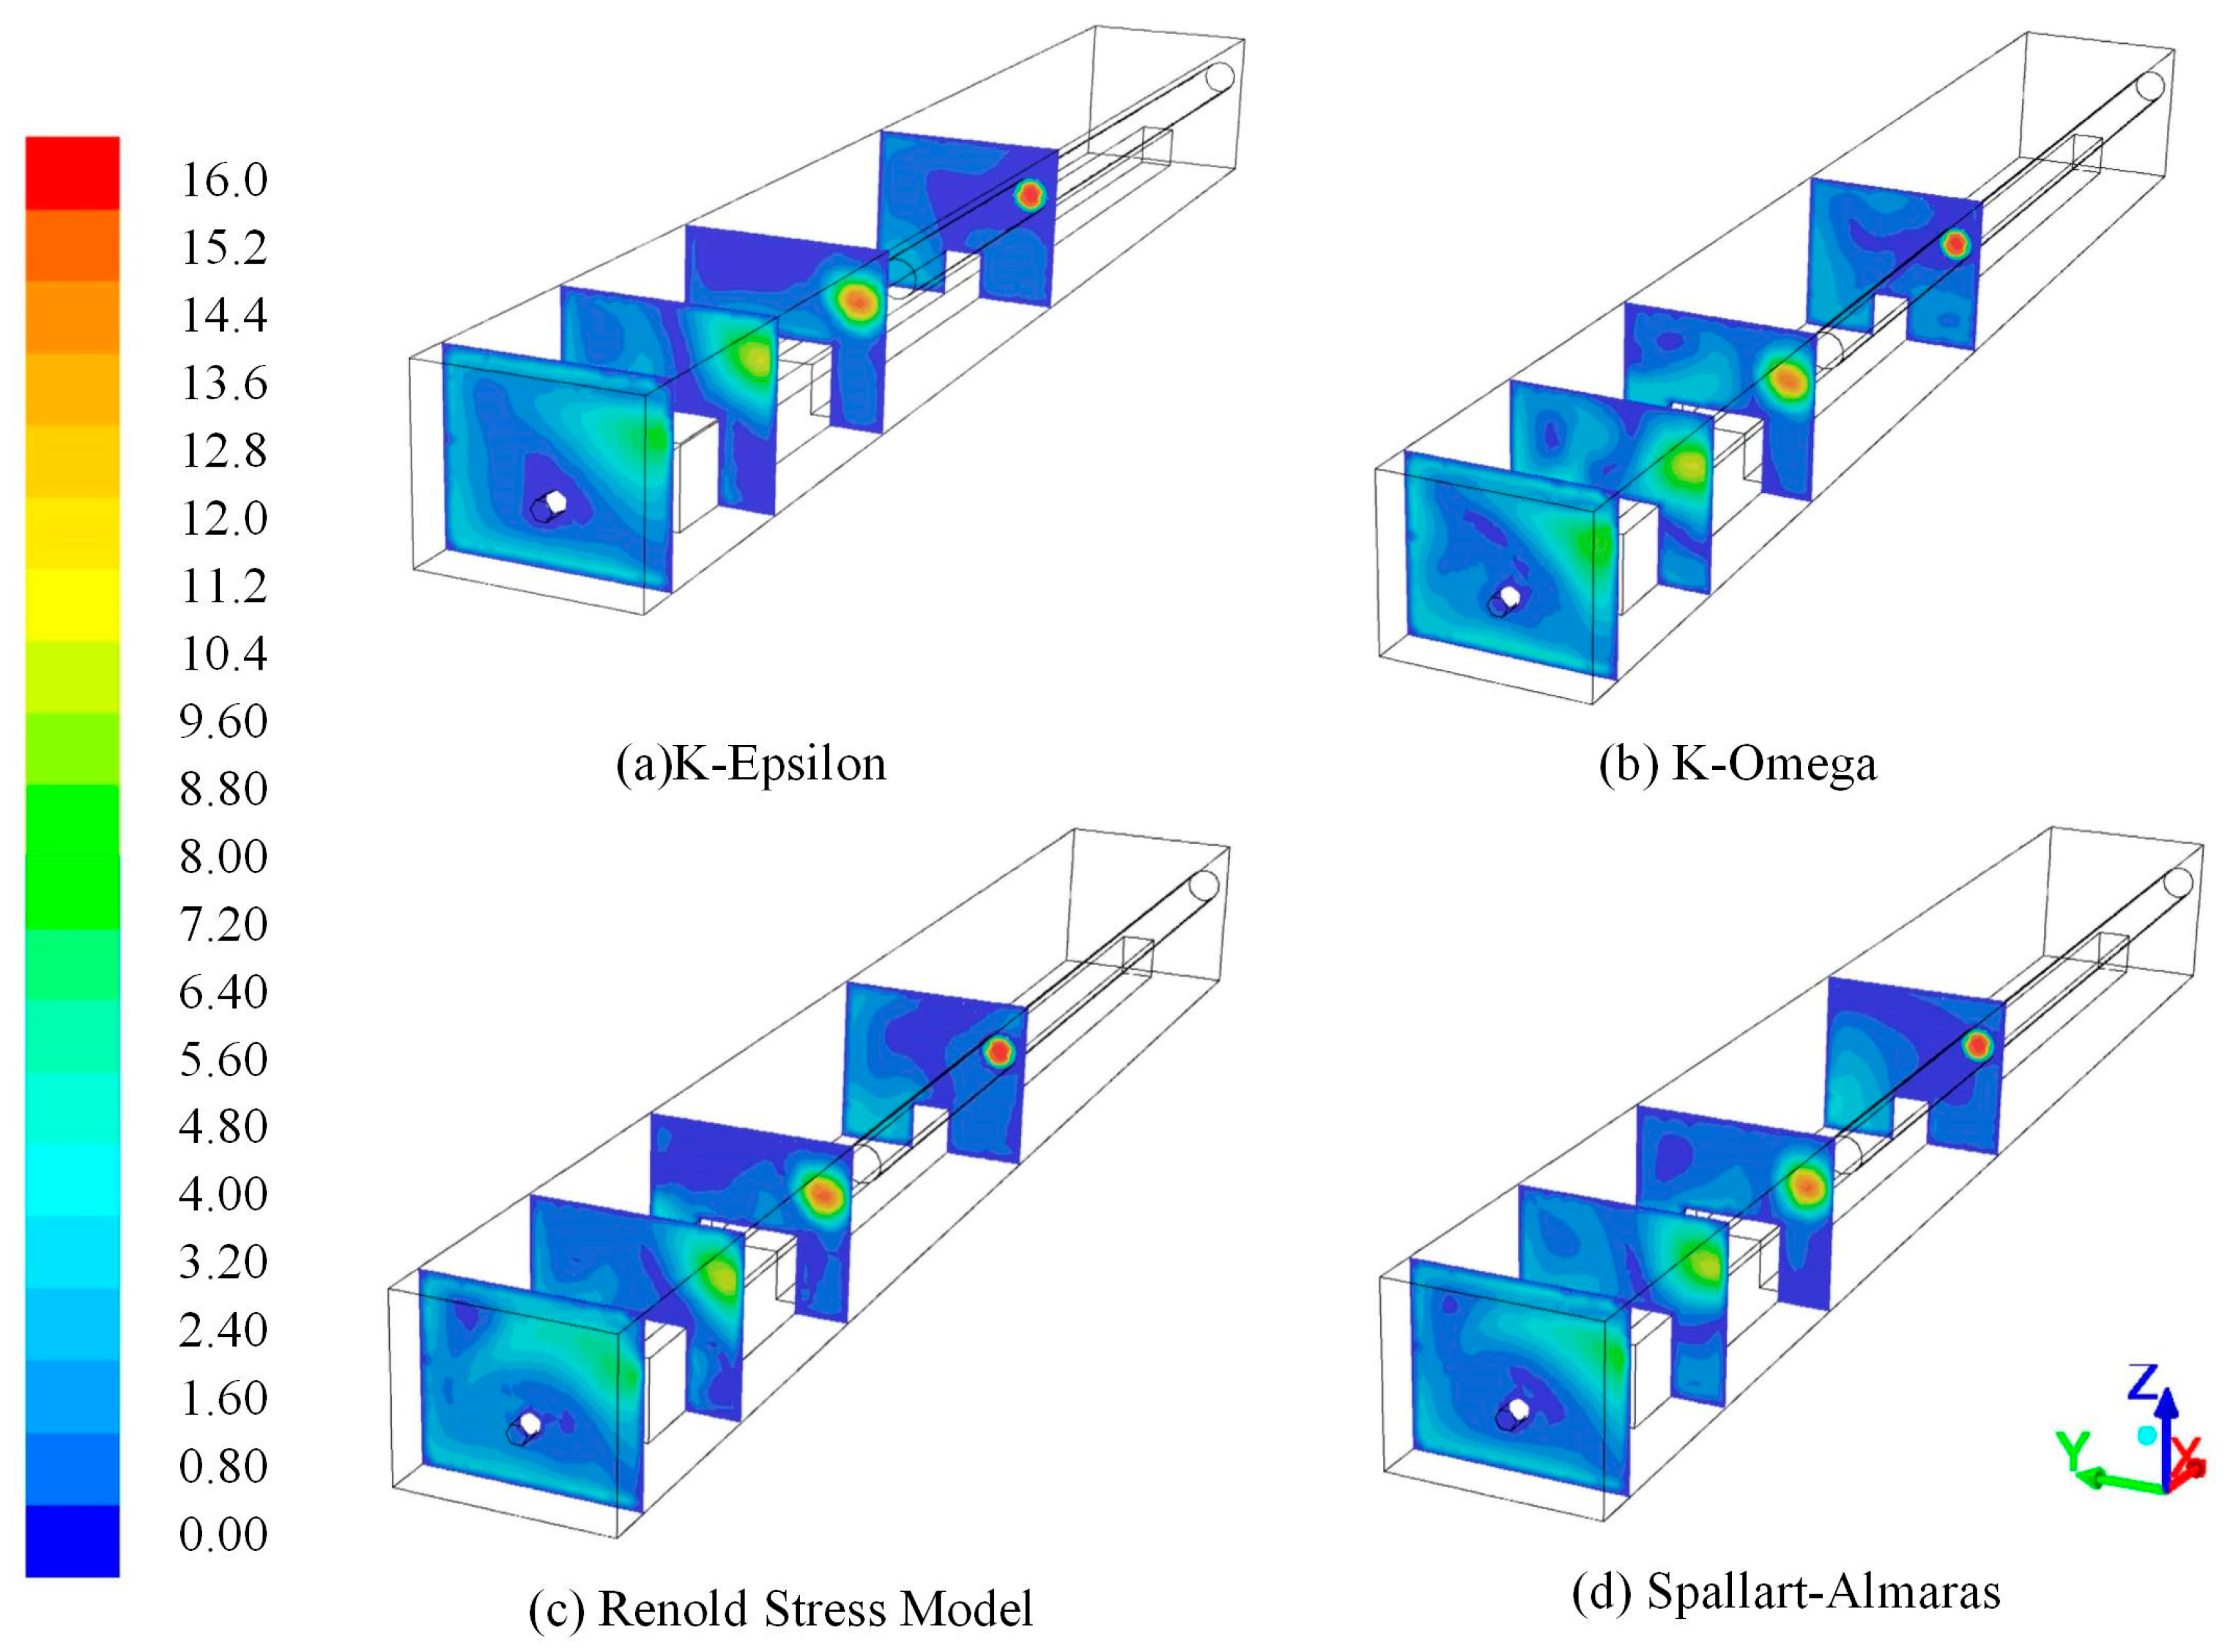
Turbulence model is the foundation of two phase flow simulation because it can directly affect the results precision for dynamic characteristics of dust dispersion. Here, we investigated and compared flow behaviour with four turbulence models, i.e., K-epsilon, K-omega, RSM (Reynolds Stress Model) and Spalart-Allmaras based on the actual measured data in excavation laneway 3-7109 (see Figure 3 for the comparison). Table 1 shows the average error for four turbulence models in four points with distance of 2, 5, 10, 20 m from the driving face, where K-epsilon model was chosen as it obtained reasonably good prediction with R2 equals to 0.946. In addition, the current research aims to study the overall airflow behaviour inside the laneway for system design guidance rather than the detail of the flow in specific location. Two-equation model is considered in the K-epsilon model, which is given for turbulent kinetic energy [29,30].
where , and its rate of dissipation is
where , in these equations, represents the generation of turbulence kinetic energy due to the mean velocity gradients. is the generation of turbulence kinetic energy due to buoyancy. represents the contribution of the fluctuating dilatation in compressible turbulence to the overall dissipation rate. , and are constants. and are the turbulent Prandtl numbers for k and respectively. The turbulent viscosity is computed by combining k and as follows:
where is constant.
2.2.3. Discrete Phase Model
In this section, the temporospatial characteristics of dust dispersion and distribution as well as inter-particle collision are investigated utilizing the three-dimensional DPM, which is valid for solid fraction lower than 10%, while Euler Euler model can simulate relatively high volume fraction of the dispersed phase without the consideration of discrete details, like particle particle collisions. In this study, we have calculated that the maximum volume fraction for dust particles at the cross section of the laneway is much lower than 10%, so DPM was adopted as it can track a large number of particles through the flow field in detail. This model is based on the Euler Lagrange method, which treats air and dust as the coupling of continuous two phase flow, and tracks dust movement inside the laneway over time by solving a differential equation in the Lagrangian reference time [31,32,33]. Specifically, the air is defined as the primary phase and dust particles are defined as the second phase. The force balance equation in x direction under Cartesian coordinate system is:
where , , and is the density and velocity of air flow and dust particles, respectively, is the drag force for unit mass of dust particles, where , is the dynamic viscosity of the air flow, is the diameter of the dust particles, is the relative Reynolds number, which is defined as , drag coefficient is , , are constants for circular particles. Here, the momentum exchange for coupling between airflow and dust particle is given by:
where is the mass flow rate of the dust particles and is the time step.
This model assumes that the dust is coming out from the driving face at constant flow rate, and no bigger particles are created during particle collision for first approximation. For comparison purposes later, the average dust concentration along the tunnel faces is defined as:
where is the dust concentration; and is the driving face area. The distance from driving face is measured from the face/wall where the driving/excavation takes place.
2.2.4. Boundary Conditions
The boundary conditions are described as follows:
- (i)
- Walls: all simulations use the standard wall function;
- (ii)
- Inlet: the velocity inlet is prescribed as the boundary condition at the inlet of forcing duct, and various ventilation patterns with time varying air velocity are conducted;
- (iii)
- Driving face: coal dust is released evenly from driving face at total flow rate of 0.0042 kg/s;
- (iv)
- Outlet: the outlet of the laneway is set to outflow and the temperature is set to 300 K (average temperature in Tianchen coal mine).
3. Numerical Methodology
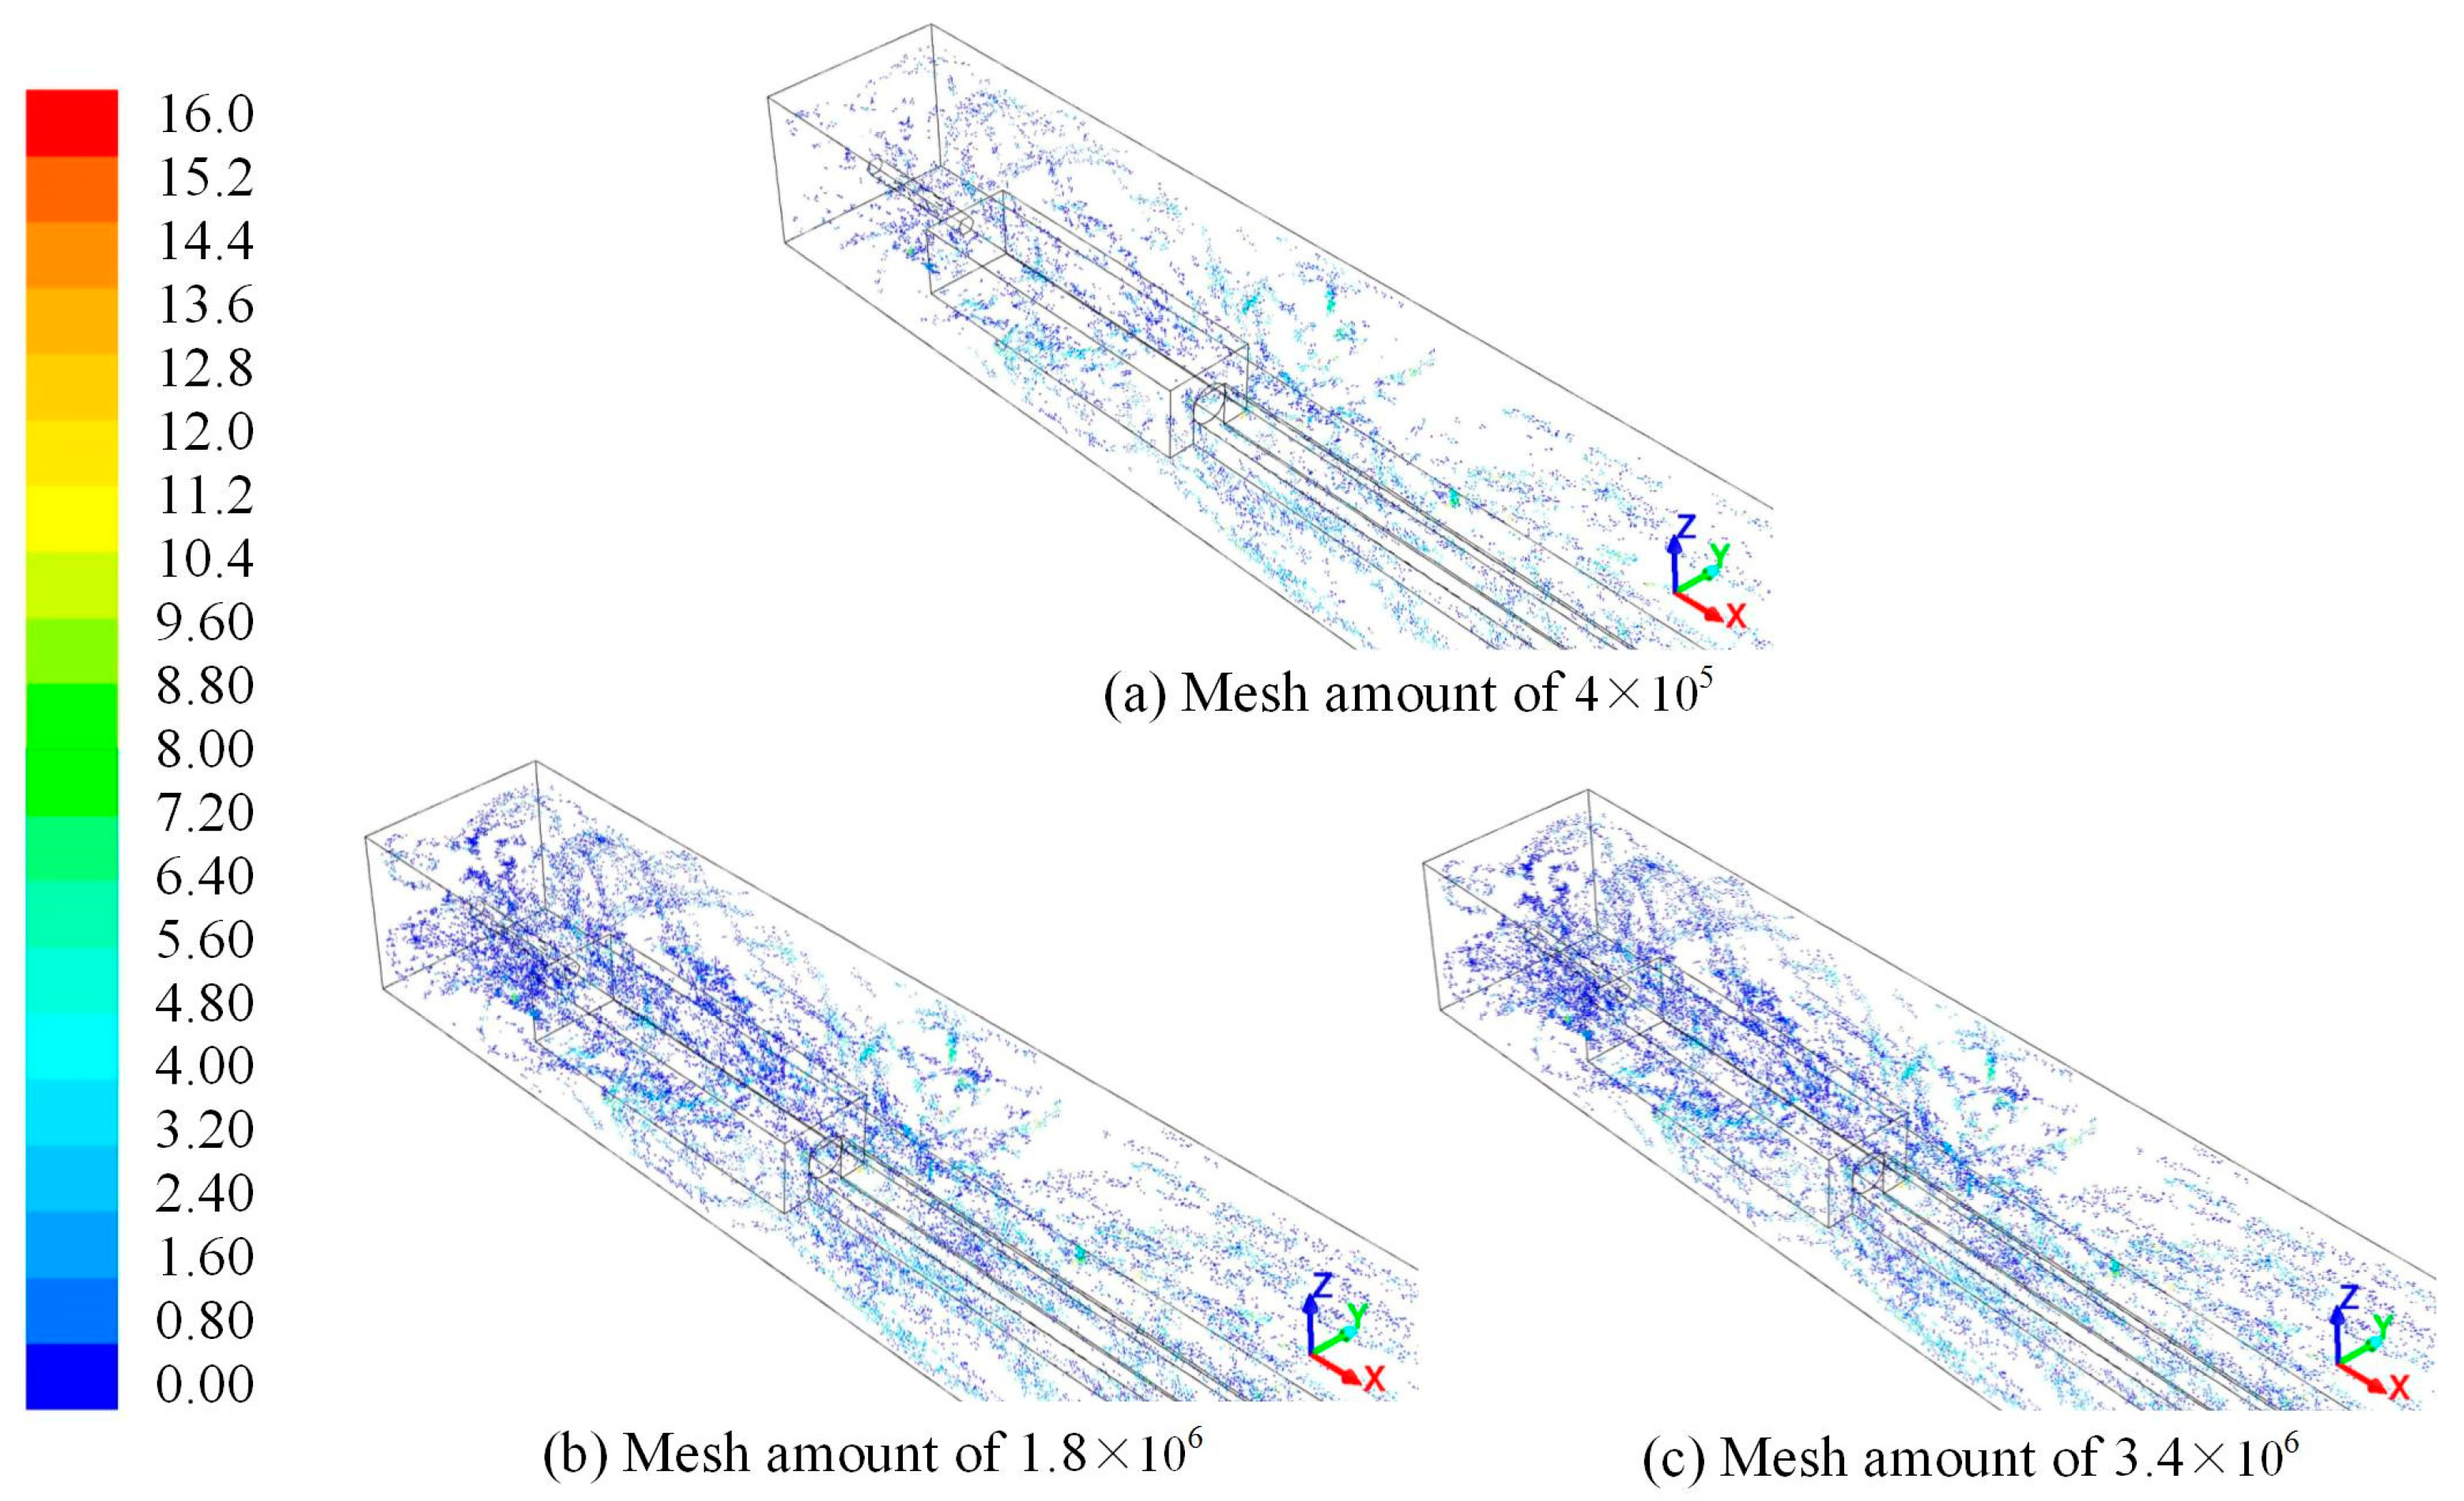
The three-dimensional model for the excavation laneway was established using the pre-processor Gambit 2.3.16 (FLUENT Inc., New York, NY, USA), and the computational domains were meshed and labelled. In order to ensure a mesh independent solution, different amount of mesh 4 × 10⁵, 1.8 × 10⁶ and 3.4 × 10⁶ were tested and compared in terms of velocity field of airflow and velocity vectors for coal dust particles (see Figure 4 and Figure 5 for detailed comparisons). The results showed that the simulation accuracy under mesh amount of 1.8 × 10⁶ significantly improved compared with 4 × 10⁵, gives about 17.2% deviation, while the mesh amount of 1.8 × 10⁶ gives only 4.6% deviation compared to the number of 3.4 × 10⁶. Besides, the mesh amount of 3.4 × 10⁶ is time consuming (see Table 2 for details). Therefore, the mesh amount of about 1.8 million elements was adequate for the numerical simulation purposes: the intervals for laneway and windpipes are presented in Table 2. The meshed computational domains generated is shown in Figure 6.
The established model was numerically simulated based on the Euler Lagrange model by utilising Computational Fluid Dynamics platform (Fluent). All terms of the governing equations and constitutive relations were solved with the semi-implicit pressure-linked equation (SIMPLE) algorithm, second-order upwind scheme. The turbulence model and boundary conditions were solved using finite volume solver. DPM was implemented to investigate the temporospatial characteristics of coal dust, and the detailed parameters are presented in Table 3. A steady airflow field is achieved before conducting the transient DPM. The calculation steps for steady simulation and transient simulation are shown in Table 3. Steady simulation required around 5 h, while transient DPM simulation required around 15–20 h on workstations with six core processors and 8–10 GB RAM.
4. Results and Discussion
4.1. Time Varying Ventilation Strategy and Parametric Studies
In this section, the temporospatial characteristics of air flow and dust distribution with time varying velocities are investigated. Various configurations of innovative time varying ventilation systems are introduced and discussed.
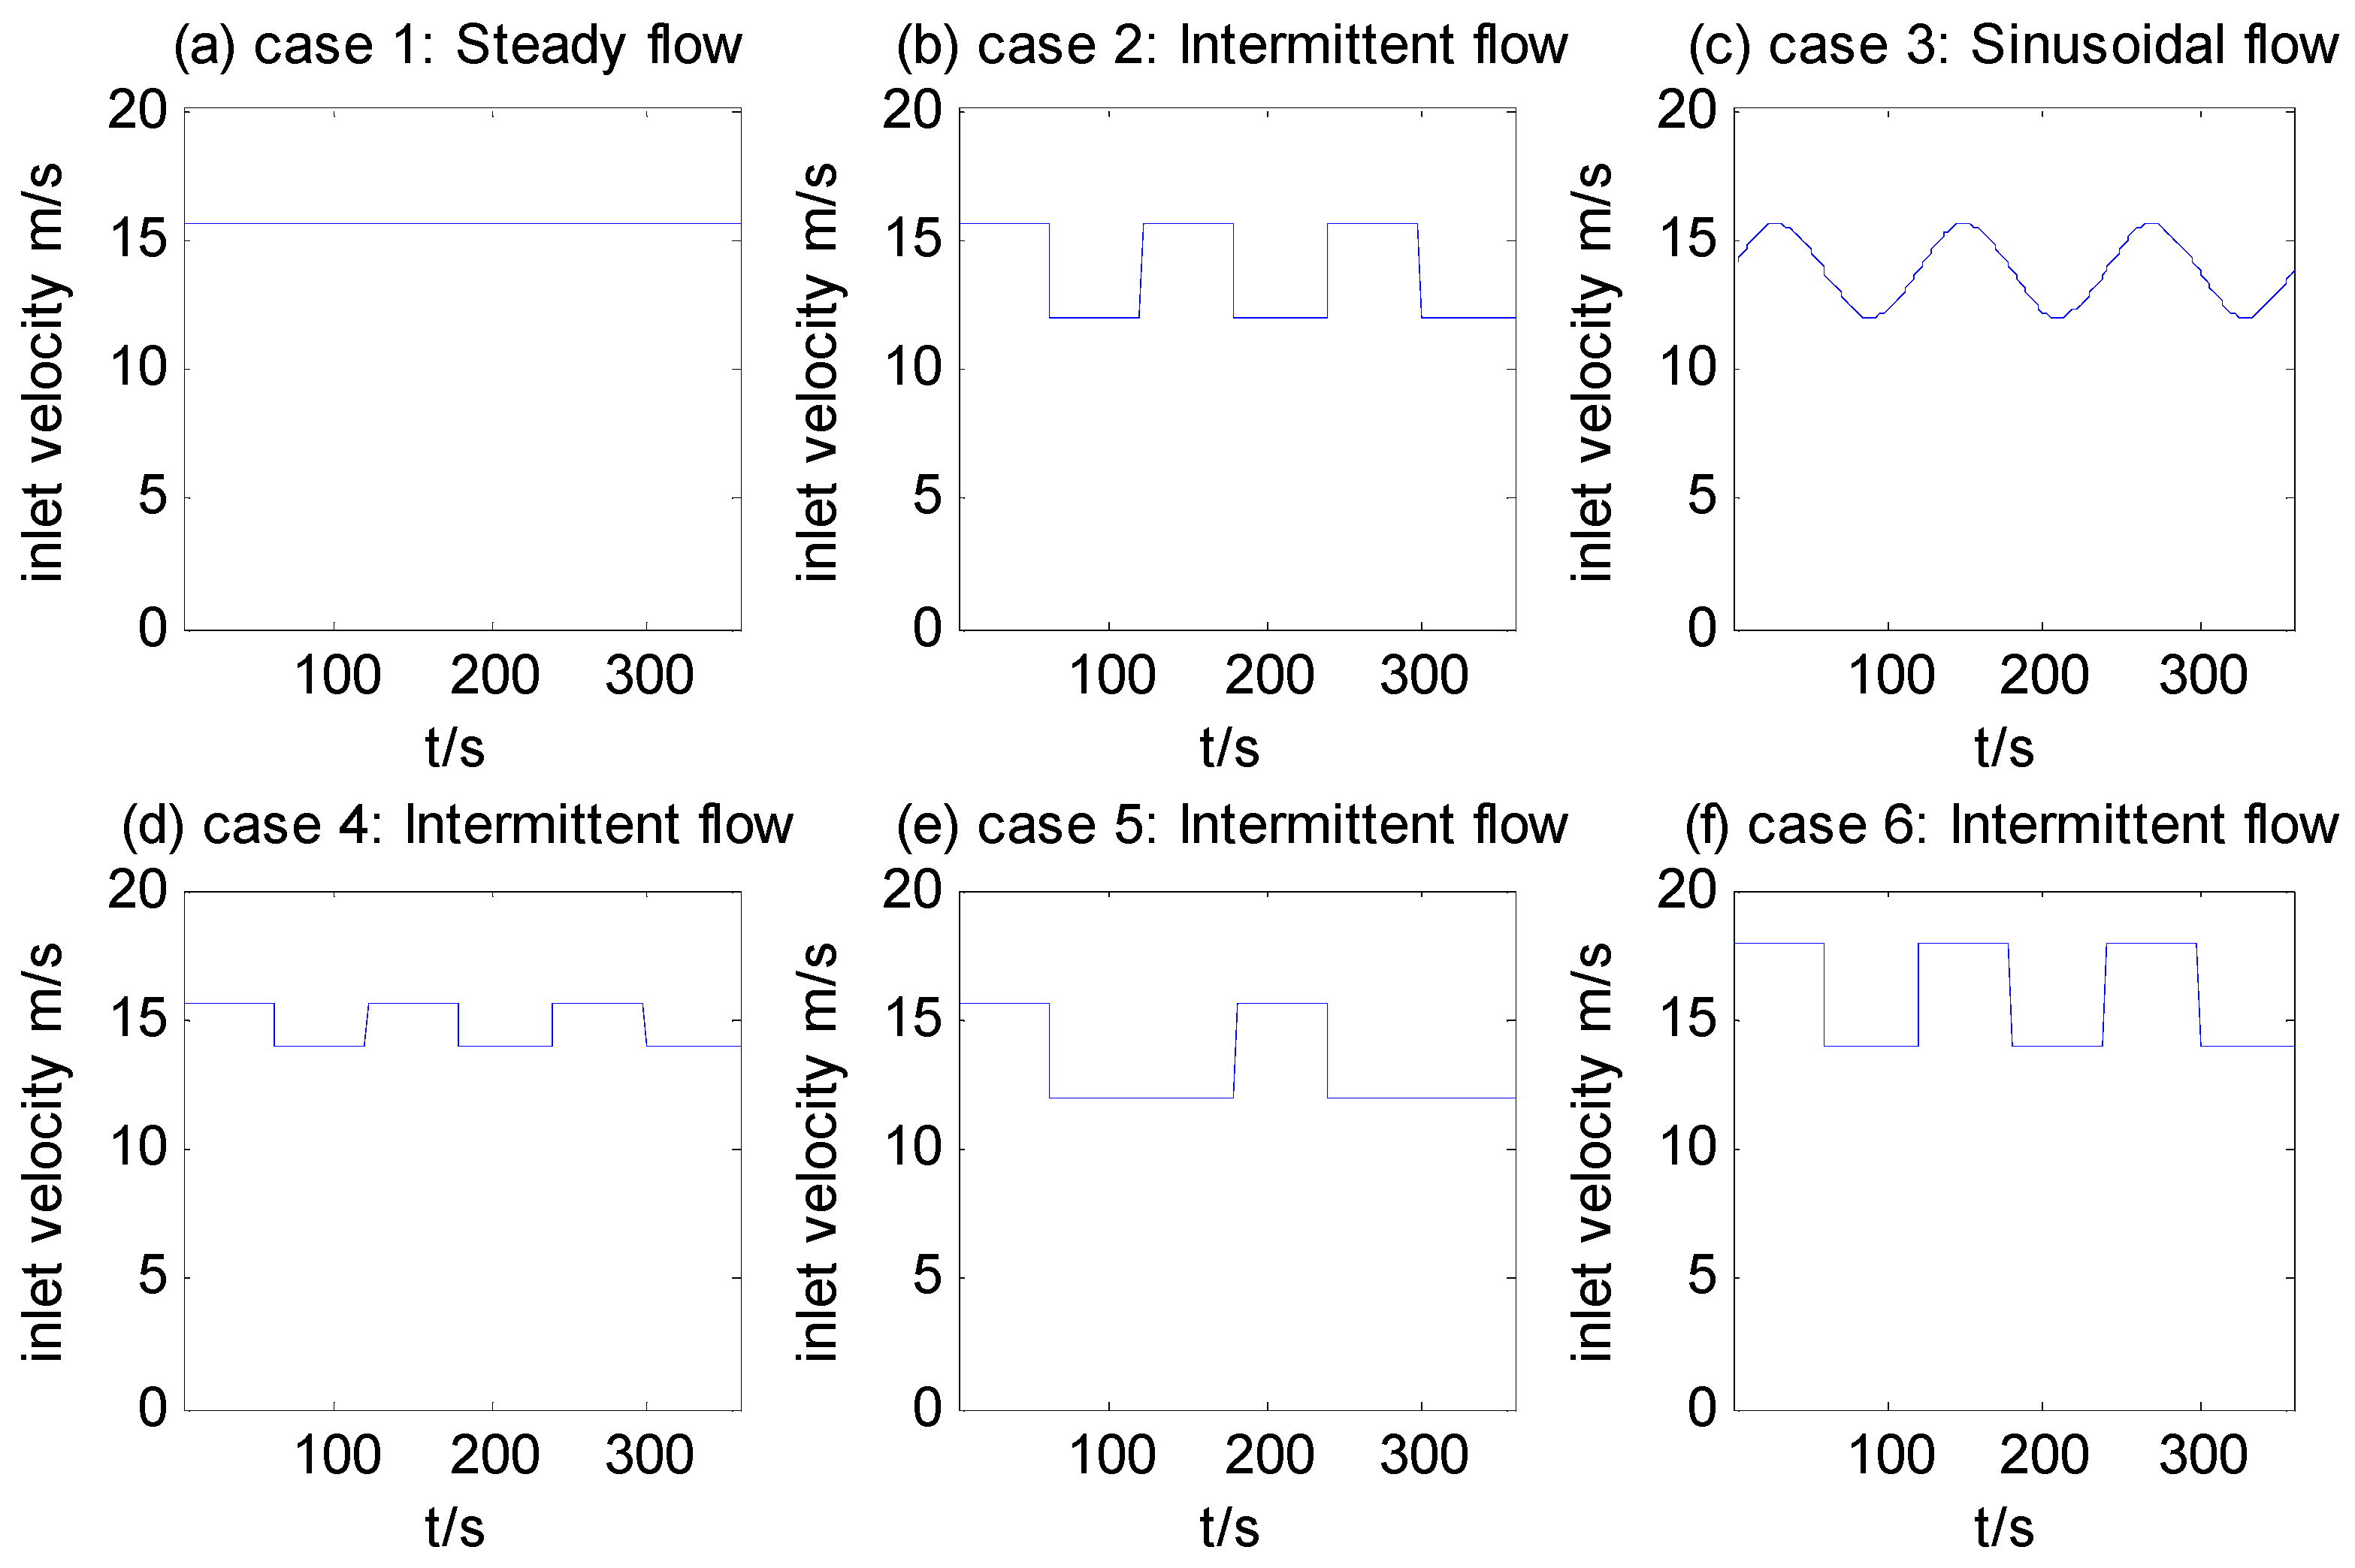
In order to provide coal miners with sufficient fresh air and ensure dust concentration in a safe level, most underground mines typically utilize large main fans to ventilate airflow to other branches, which generally provides excessive amount of fresh air to various locations in underground working environment. The operation regulations of Tianchen coal mine indicate that the required airflow in 3-7109 laneway is 7.82 m3/s, so the velocity of airflow in forcing duct is 15.6 m/s. It requires massive electrical energy to power the fan when this approach is adopted. Here, based on parametric studies, we proposed five possible time varying ventilation designs to save energy whilst ensure a safe environment, and their performance in terms of the possible energy saving and dust control efficiency are tested and compared with the steady flow ventilation system. Specifically, each ventilation system has different dynamic patterns of inlet velocity, which are illustrated in Figure 7: (case 1, Figure 7a) steady flow with 15.6 m/s velocity; (case 2, Figure 7b) 60 s high velocity (15.6 m/s) and 60 s low velocity (12 m/s); (case 3, Figure 7c) defined as sinusoidal flow, for which the velocity changing curve is defined as the sine law with period of 120 s, its peak value and valley value is 15.6 m/s and 12 m/s, respectively; (case 4, Figure 7d) 60 s high velocity (15.6 m/s) and 60 s low velocity (14 m/s); (case 5, Figure 7e) 60 s high velocity (15.6 m/s) and 120 s low velocity (12 m/s), and (case 6, Figure 7f) 60 s high velocity (18 m/s) and 60 s low velocity (14 m/s).
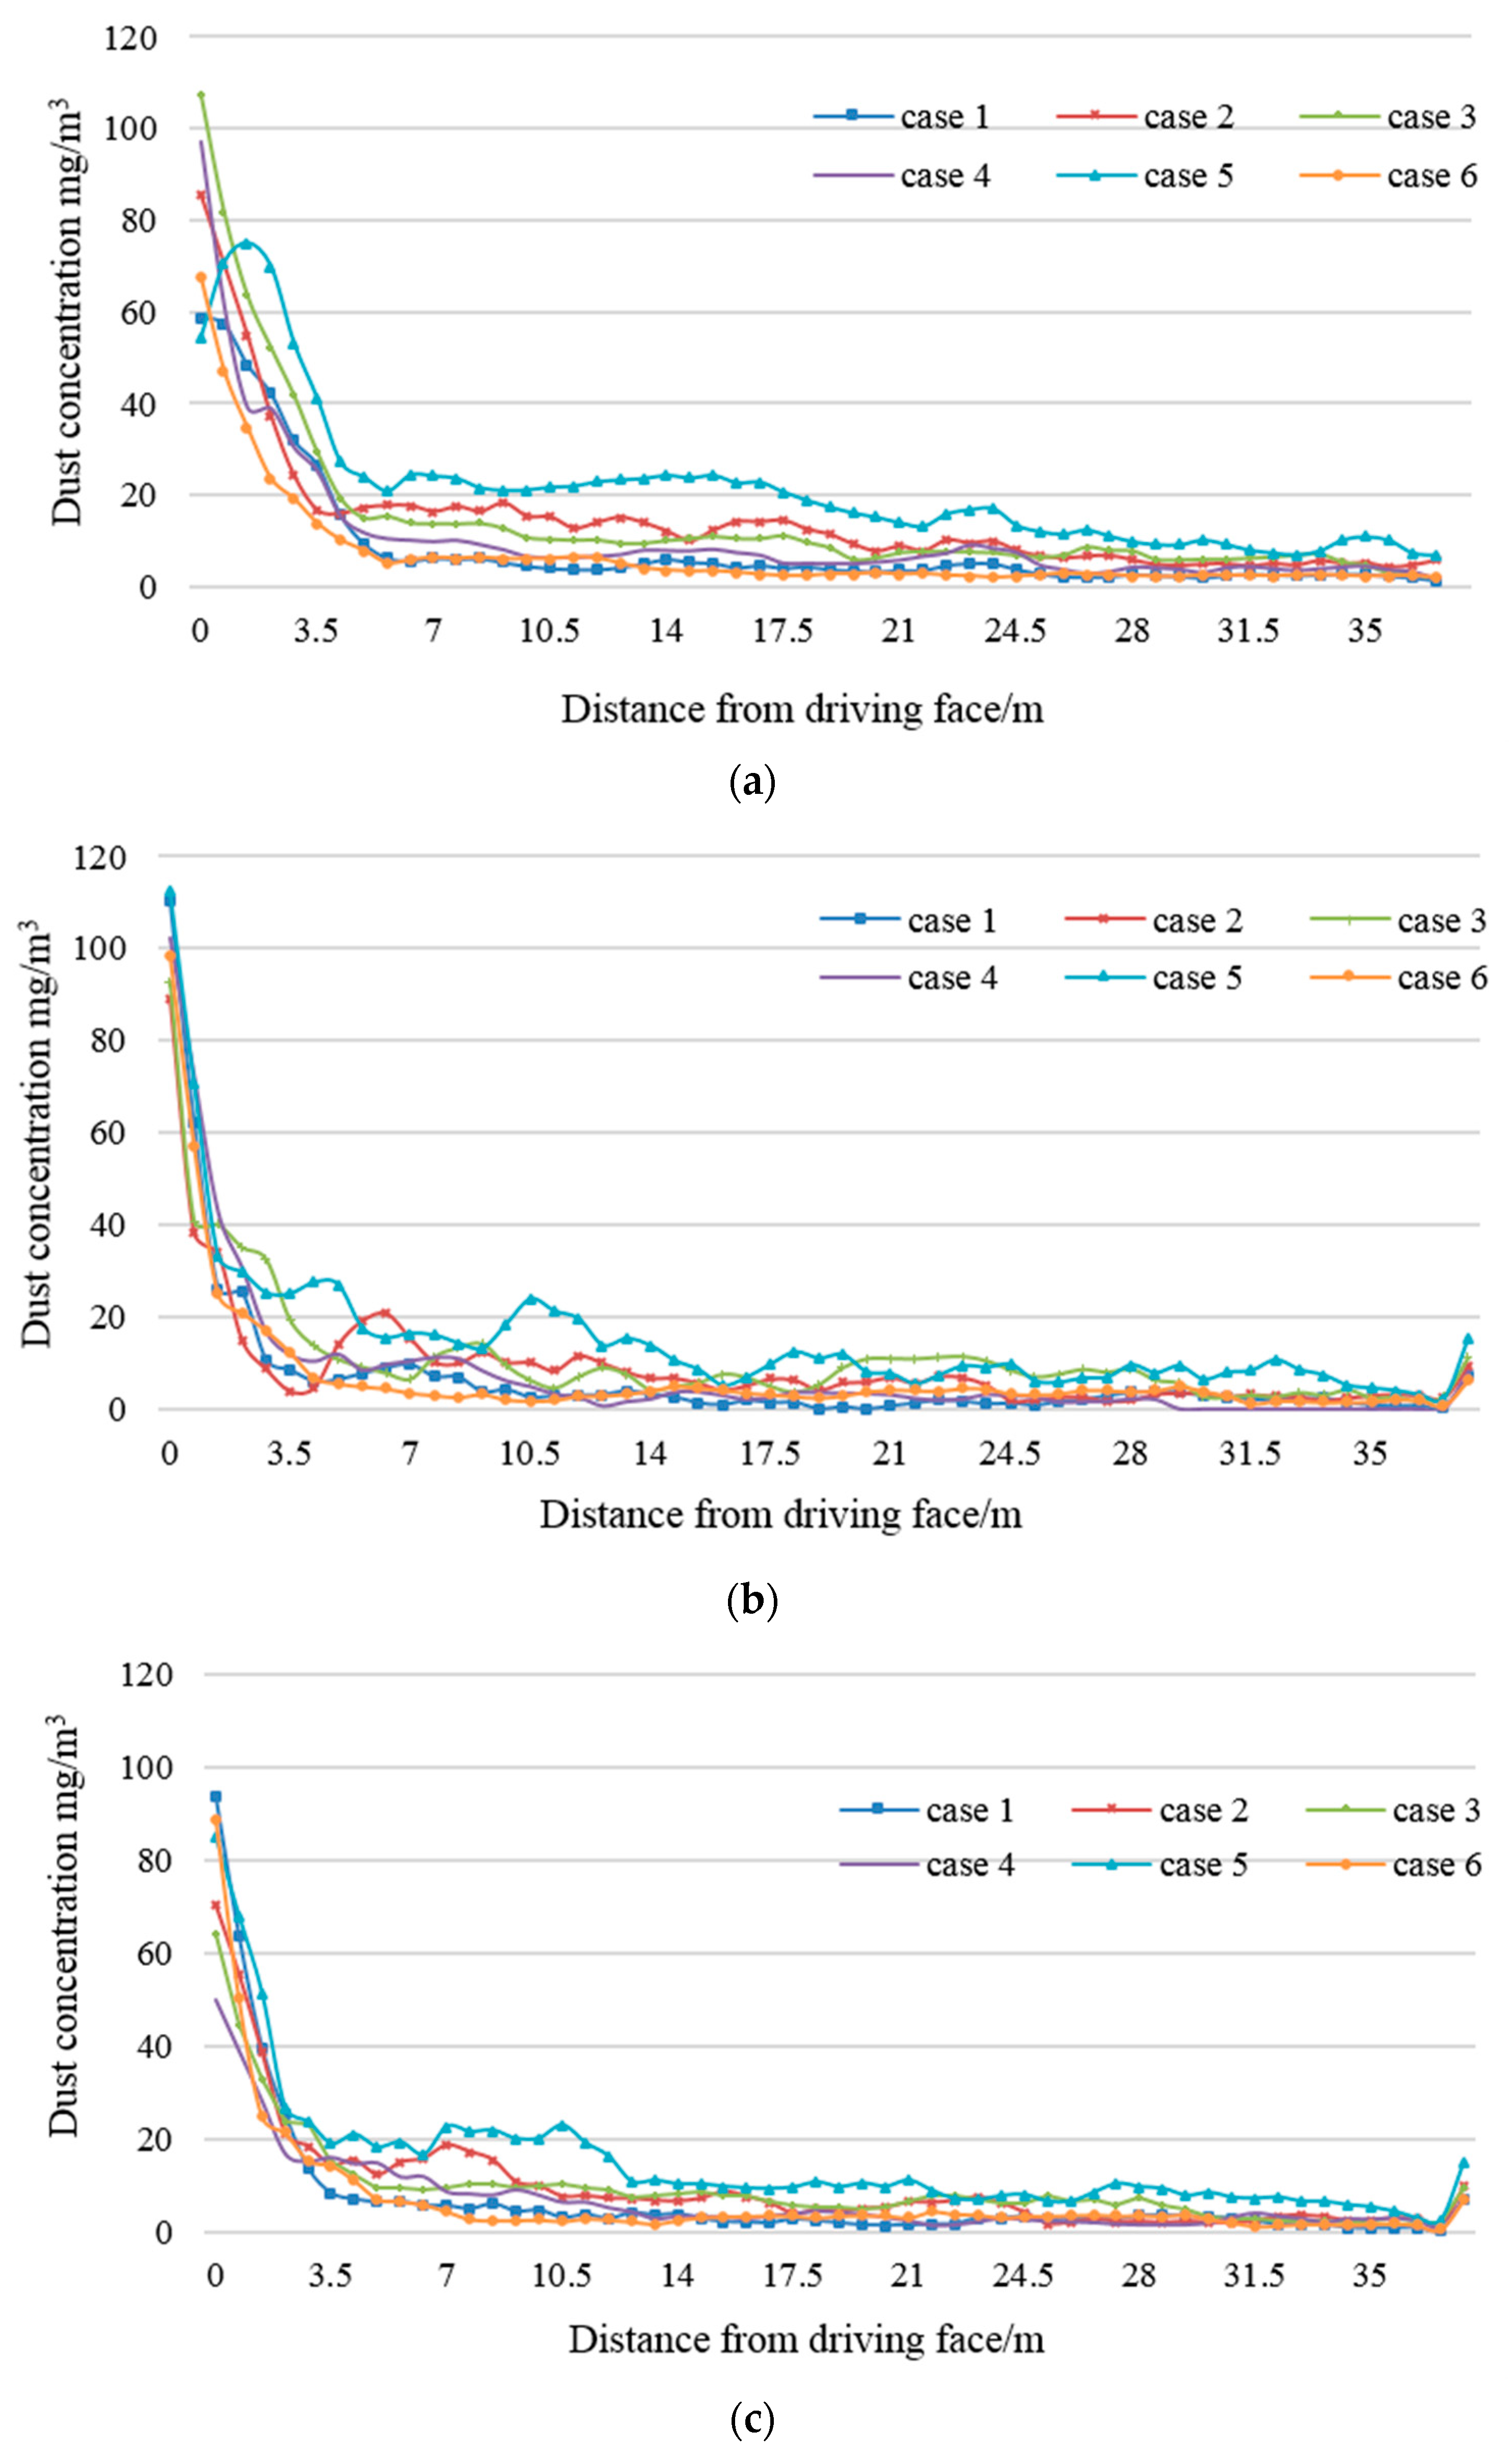
Six ventilation patterns were simulated based on the computational fluid dynamic platforms. At first, we look into coal dust distribution characteristics along the mining laneway in different time points. Considered that miners typically breathe at the average height of 1.5 m, which is defined as the breathing zone. So a line in this height in section A was selected to detect dust concentration among the six ventilation patterns. The variation trend of dust concentration along the laneway was presented in Figure 8 at time points 60, 120 and 180 s. There are several apparent features: with the increasing laneway length, dust concentration under six different ventilation patterns were pushed into the area near the driving face, mirrored by high concentration on first few meters from the mining face and the slightly decreasing trend of dust concentration. Coal dust concentration is maintained at a low level on average. It can also be found that at 60 s, coal dust is relatively high and distributed fully inside the laneway; and maintain steadily around the safe level at 120 s; and keep under the safe level at 180 s.
Considered that miners usually work at the position with the distance of farther than 7 m away from the driving face. It is clear that at 180 s, the dust concentration in case 1, case 4 and case 6 is lower than the limit value of 5 mg/m3 when it is father than 7 m away from driving face. Accordingly, the computed average dust concentration at 120 s along the selected line for case 1~6 are 7.00, 9.17, 11.12, 8.06, 15.17, and 6.20 mg/m3, and dust concentration for case 2~6 increased up to 31.08%, 58.84%, 15.10%, 92.51% and −11.42% compared with base case, respectively. The same figure at 180 s for case 1~6 are 7.29, 9.84, 9.64, 7.98, 13.98, and 6.97 mg/m3, and dust concentration for case 2~6 increased up to 35.11%, 32.26%, 9.4%, 91.7% and −4.5% compared with base case respectively. Overall, it can be concluded that case 6 performs best among other patterns in handling dust emission by mitigating it away from the driving face.
It is found that the ventilation system with time varying velocity cannot apparently improve dust removal efficiency compared with steady flow, however, it offers potential in terms of energy savings and guarantees that the average dust concentration can still be decreased to a low level, which confirms that continuous high-speed ventilation typically used in underground mine really leads to the waste of energy consumption. As presented in Table 4, the significant amount of energy saving and other parameters on average are calculated based on Bernoulli equation within 360 s, which are presented here.
where is the pressure difference, is the standard atmospheric pressure and is the pressure at the cross section of the laneway. is the volumetric flow rate in the blast, and is the cross-sectional area of the blast. is the fan power needed in this model. and are variables at two different intervals (t1 and t2) in a velocity changing period, where represents different variables , , and , and is the mean value of the variables.
The energy saving for case 2~5 is 27.20%, 27.20%, 13.80% and 36.26% respectively, while case 6 performs worse in energy saving as it constitutes to negative saving (more power is required), which is neglected in the following study. Besides, Figure 8 shows that the dust concentration for case 5 is higher than other cases, which performs worse in dust control efficiency due to its long period of low ventilation velocity, so this case is also neglected in the following study. Hence, considered the dust removal efficiency of those three cases, it can be concluded that case 4 offers a balanced performance for it reduced energy usage up to 13.8% whilst keeping coal dust concentration at low level (the average dust concentration is slightly increased by 15.10% and 9.4% along the monitored line at 120 and 180 s). The results indicate that it is really necessary to apply time varying ventilation and dust control system in practical application. Besides, the further understanding of dynamic regularity of dust movement and its distribution inside the laneway is also essential for the design of ventilation patterns.
4.2. The Temporospatial Characteristics of Airflow and Dust Distribution
The velocity field of air flow is one of the main factors which is expected to directly influence dust dispersion and mitigation. In this section, we take ventilation pattern with intermittent flow (case 2) as an example to investigate the dynamic characteristics of the airflow and dust distribution.
As presented in Figure 9, the airflow velocity profiles at the height of 0.25, 1.6 and 2.5 m were investigated, the pressing air is discharged from the forcing duct at high velocity, and there exists an obvious jet flow, which goes along the laneway and flows to the driving face. When the air arrives at the heading face, it is obstructed by the face, hence the impact jet flow forms. After that, the air changes its flow direction and the air velocity gradually decreases along the outtake airflow roadway. Figure 10 and Figure 11 present the predicted velocity profiles and dust distribution at breathing zone for four time points with the fixed dust generation rate of 0.0042 kg/s. As we explored the overall temporospatial characteristics of velocity behaviour and dust distribution inside the laneway: with the action of the pressing air, a great amount of dust particles are dispersed and driven to the outtake side of airflow roadway (Figure 11a), it is obvious that the volume fraction of dust particles is far bigger near the heading face on the outtake side than the other parts. While after 80 s, dust particles are diluted along the whole laneway and distributed uniformly with low concentration.
Overall, the results indicate that the dynamic patterns of ventilation perform well in energy saving but not ideal in dust control and management. Therefore, an improved time varying design should be developed and more parametric research need to be studied in order to enhance dust removal efficiency.
4.3. The Most Efficient Ventilation Pattern
In the previous parametric studies, we have studied the potential energy saving for the time varying ventilation patterns. However, in order to investigate the changing regularity of dust concentration, a number of simulations are conducted to optimize the parameters. An important finding is that the velocity value and duration of periodic changes in ventilation velocity plays an important role in dust removal efficiency. Considered the positions where miners typically work, two points (10 m away from the driving face) at Sections A and C with the breathing height of 1.5 m are monitored, where the dust concentration is compared for different time varying ventilation patterns. The results suggest that high speed of velocity in an intermittency duration (case 4) yields relatively low dust concentration as compared to other intermittent scenarios (cases 2 and 3). This is attributed to the dust accumulation during low velocity ventilation, which alleviates higher dust concentration. When looking to the duration of periodic changes in ventilation velocity, we found that changing this factor can lead to very different dust concentration. Then it comes to a question of whether we can we find a key time point at which the dust concentration almost cannot be affected by the velocity that is changed slightly in an intermittent period? The answer is right. Considered the fact that in this study, after 110 s, the dust concentration in base case 1 (steady flow) decreases very slowly and maintains at a stable level. This phenomenon illustrates the dust removal efficiency with continuously high speed velocity is not significant anymore, so the ventilation velocity can be decreased slightly to save energy consumption. Therefore, we set velocity as 12 m/s after 110 s and observed the corresponding concentration tendency. As presented in Figure 12, the dust concentration in case 7 is slightly increased after 110 s, this is attributed to the dust accumulation during low velocity. Therefore, the velocity needs to be increased, the simulation result demonstrates that 160 s is the key time point and increasing velocity at this time point will control dust concentration at a low level. Thus, this case is defined as case 7: 110 s high velocity (15.6 m/s) and 50 s low velocity (12 m/s), as presented in Figure 13. The result in Figure 12 shows the dust concentration changes with different velocity and duration period, which demonstrates that case 7 can perform as well as the steady flow, and 110 and 160 s are defined as the key time points.
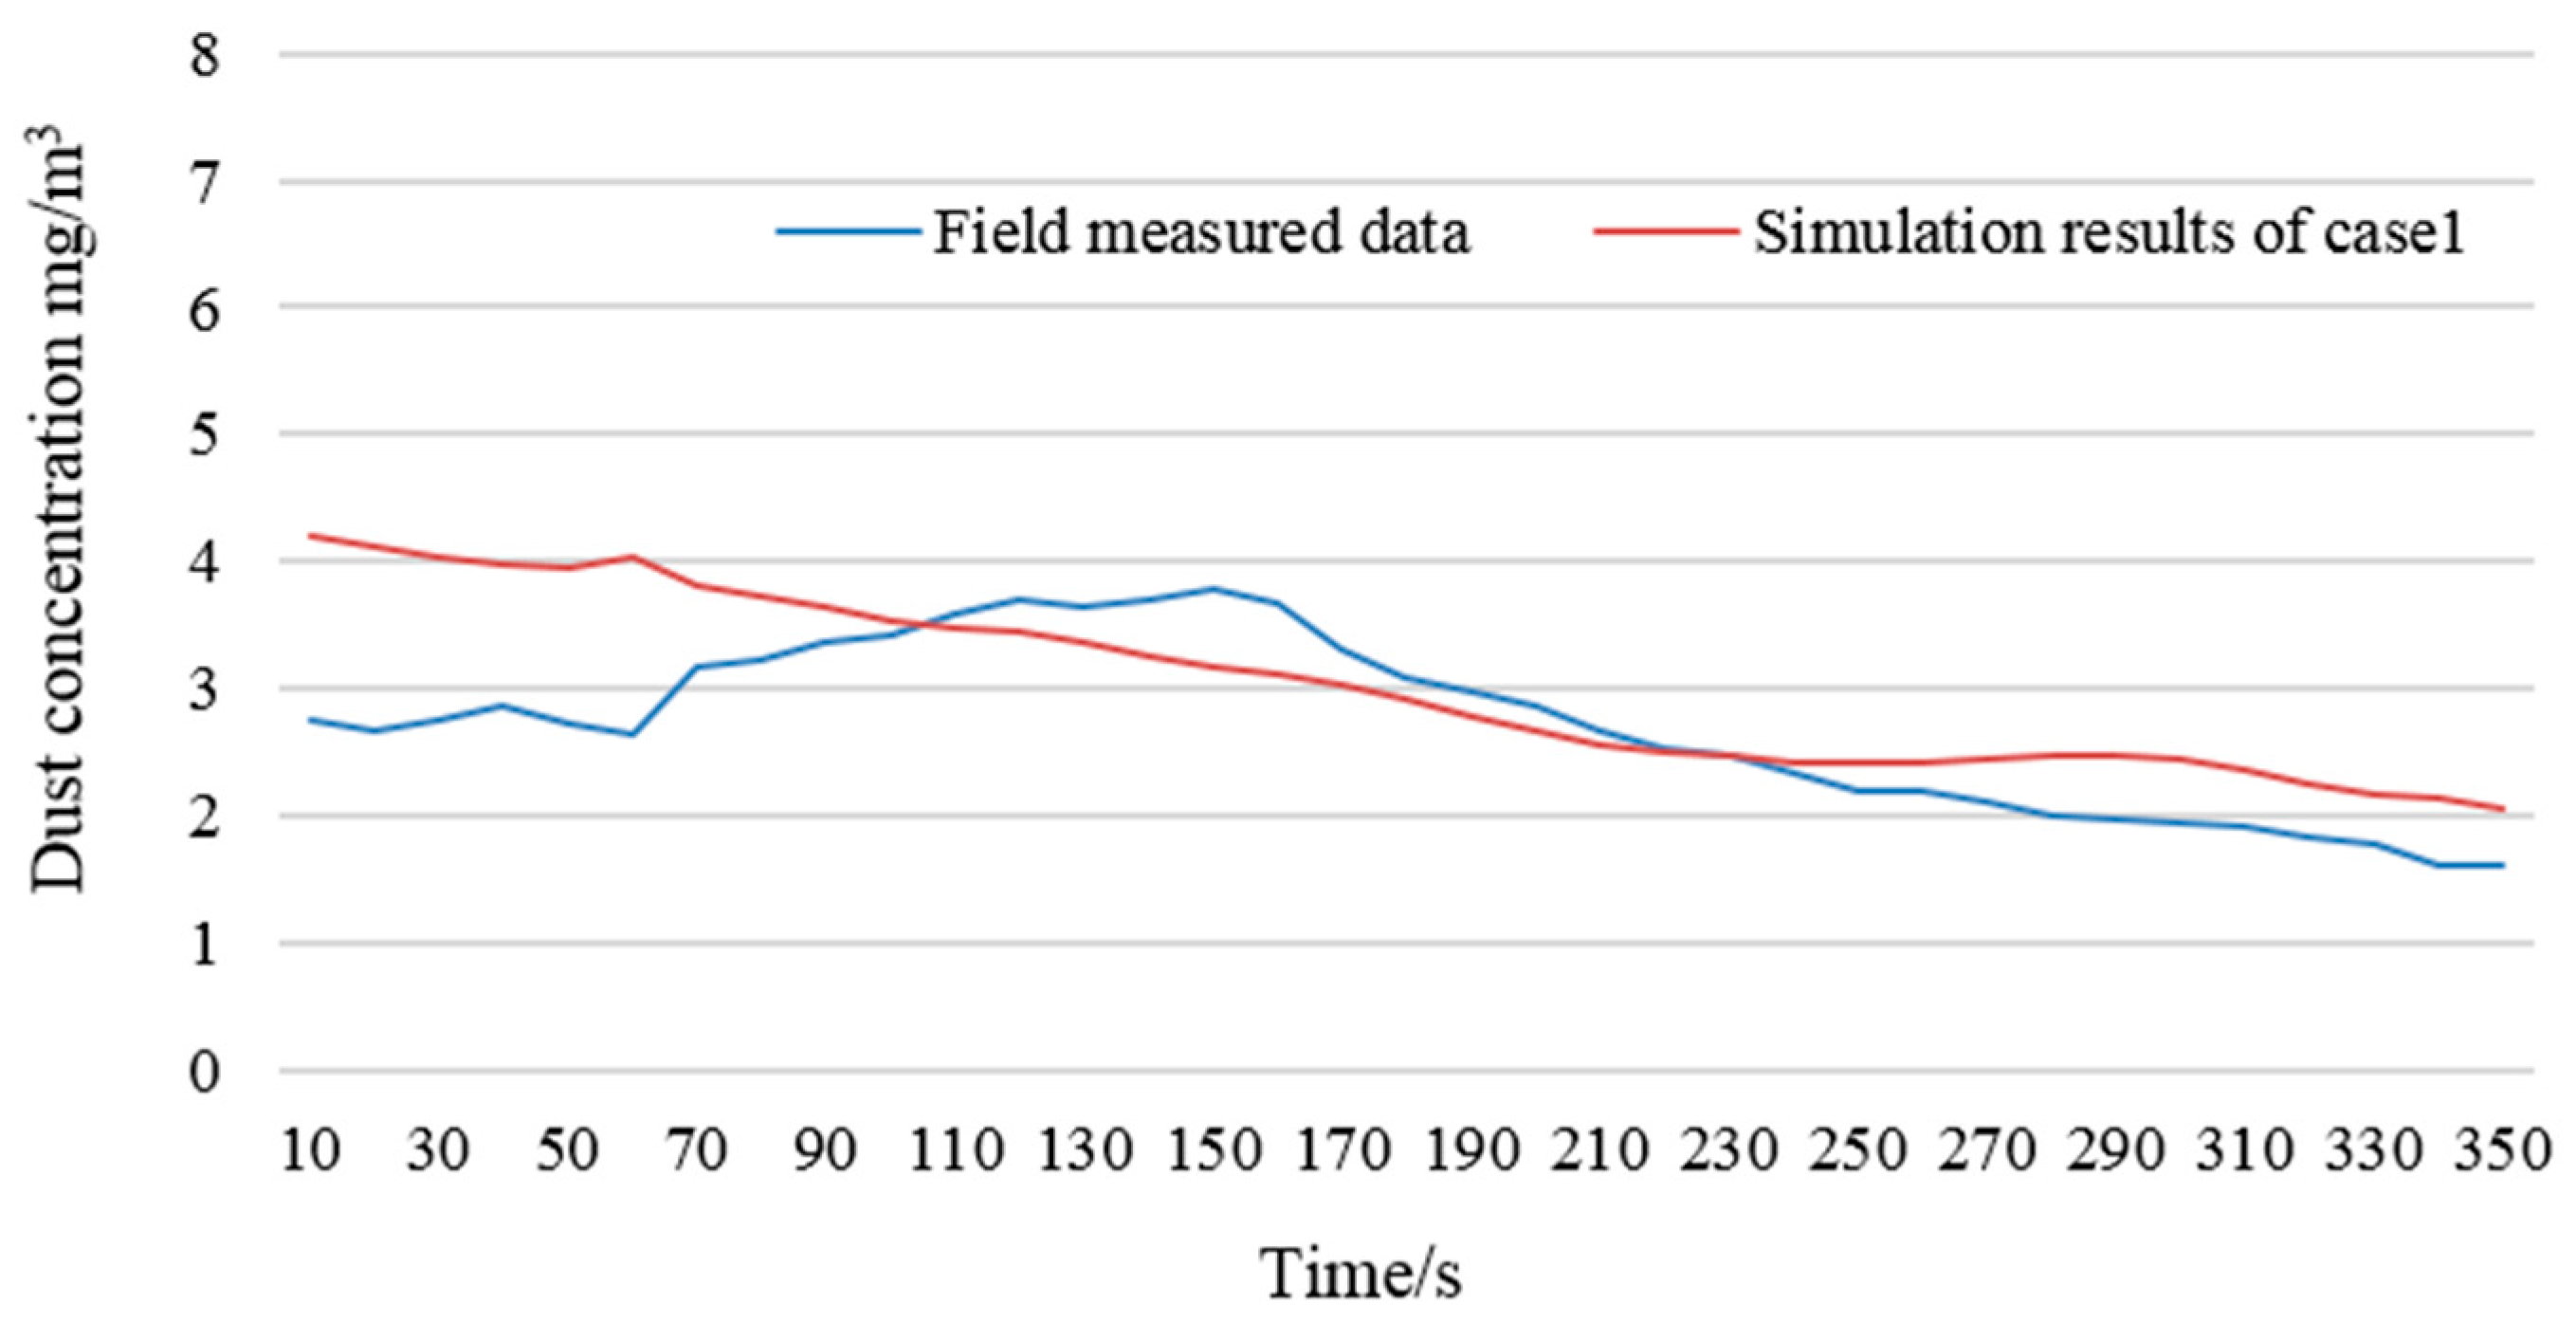
The base model of case 1 must be validated before accepting the results for field guidance. In this experiment, the dust monitor of type GCG1000 was paced at the height of the breathing zone (1.5 m above floor) and at 20 m away from the driving face inside the 3-7109 laneway in Tianchen coal mine. The measured data was used for model validation. The safety and operation regulations of Tianchen coal mine indicates that free silica dioxide content is lower than 5%, so the maximum allowable total dust concentration is 5 mg/m3, as can be seen in Table 5. Specifications of the dust monitor with type GCG1000 is shown in Table 6. Figure 14 illustrates the comparison among simulation results in case 1 and field measured data. It can be seen that good agreement between the two sets of data has obtained. They all exhibit a declining tendency and indicate that dust concentration is diluted and expelled out of the laneway. The measured result demonstrated that the dust concentration in this point is lower than the limit values, indicating that the dust quality has remained the standard.
Similarly, the potential energy savings for case 7 is shown in Table 7, and it reduces energy consumption up to 15.11%. The results indicate that case 7 offers the best performance, as it saves energy consumption whilst keeping coal dust concentration at a low level, which shows a potential for practical application.
5. Conclusions
In this study, based on the computational fluid dynamics (CFD) approach, a novel time varying ventilation and dust control system is proposed and evaluated inside a laneway of coal mine, which is demonstrated to be an effective method to reduce energy cost whilst guaranteeing the dust concentration at a low level. In addition, the temporospatial characteristics of airflow behavior and dust dispersion provide the useful guidance to define the most effective ventilation pattern.
The parametric studies are conducted to investigate various factors influencing the performance of the novel intermittent ventilation system. Case 4 is selected as it offers balanced performance with energy reduction and dust removal efficiency. However, the proposed ventilation patterns are pre-determined. On account of this, the dynamic regularity of dust concentration is applied to scientifically design the interval of intermittency. Accordingly, the key time point is defined for case 7. That is to say, changing velocity at the appropriate time point offers nearly the same performance with steady ventilation pattern case 1 in dust removal efficiency and remarkable energy reduction of 15.11%.
In conclusion, this study provides a possibility to design the ventilation system from a perspective of time; however, since the physical model remains quite simple, maybe more parametric studies with brattice installation and air curtain as well as dynamic regularity of dust dispersion are required to investigate in the future. Furthermore, it is noted that the intermittent flow can be done alternately by operating control valves while turning off other ones, which would be easy to be implemented for local codes if the novel idea is conducted widely because it will not affect main ventilation fans.
Acknowledgments
The authors would like to thank the anonymous reviewers who contributed to the quality of this letter by providing helpful suggestions. This work is financially supported by Mega-projects of Science Research for the 13th Five-year Plan: (Grant No. 2016YFC0801807), (Grant No. 2016YFC0801805) and (Grant No. 2016YFC0803108).
Author Contributions
During this study, Xiaohu Wu conceived and designed the research, Hui Liu performed the numerical simulation and wrote the paper, Shanjun Mao and Mei Li contributed materials and Jun Yue contributed analysis tools.
Conflicts of Interest
The authors declare no conflict of interest.
References
- Wang, H.; Jiang, Z.A.; Du, C.F.; He, Z.L.; Hu, G.Y. Field study and numerical research on dust concentration distribution in the excavation tunnel. Chin. J. Liaoning Technol. Univ. 2011, 30, 345–348. (In Chinese) [Google Scholar]
- Xi, Z.L.; Jiang, M.M.; Yang, J.J.; Tu, X. Experimental study on advantages of foam-sol in coal dust control. Process Saf. Environ. Prot. 2014, 92, 637–644. [Google Scholar] [CrossRef]
- Wang, P.F.; Feng, T.; Ronghua, L. Numerical simulation of dust distribution at a fully mechanized face under the isolation effect of air curtain. Min. Sci. Technol. 2011, 21, 65–69. [Google Scholar] [CrossRef]
- Amyotte, P.R. Some myths and realities about dust explosions. Process Saf. Environ. Prot. 2014, 92, 292–299. [Google Scholar] [CrossRef]
- Amyotte, P.R.; Eckhoff, R.K. Dust explosion causation, prevention and mitigation: An overview. J. Chem. Health Saf. 2010, 17, 15–28. [Google Scholar] [CrossRef]
- Benedetto, A.D.; Russo, P.; Amyotte, P. Modelling the effect of particle size on dust explosions. Chem. Eng. Sci. 2010, 65, 772–779. [Google Scholar] [CrossRef]
- Palazzi, E.; Currò, F.; Fabiano, B. Accidental continuous releases from coal processing in semiconfined environment. Energies 2013, 6, 5003–5022. [Google Scholar] [CrossRef]
- Cecala, A.B.; O’brien, A.D.; Schall, J.; Colinet, J.F.; Fox, W.R.; Franta, R.J.; Schultz, M.J. Dust Control Handbook for Industrial Minerals Mining and Processing; National Institute for Occupational Safety and Health, Office of Mine Safety and Health Research: Pittsburgh, PA, USA, 2012; pp. 143–179.
- Gunson, A.J.; Klein, B.; Veiga, M.; Dunbar, S. Reducing mine water requirements. J. Clean. Prod. 2012, 21, 71–82. [Google Scholar] [CrossRef]
- Cote, C.M.; Moran, C.J.; Hedemann, C.J.; Koch, C. System modeling for effective mine water management. Environ. Model. Softw. 2010, 25, 1664–1671. [Google Scholar] [CrossRef]
- Colinet, J.F.; Rider, J.P.; Listak, J.M.; Organiscak, J.A.; Wolfe, A.L. Best Practice for Dust Control in Coal Mining; National Institute for Occupational Safety and Health, Office of Mine Safety and Health Research: Pittsburgh, PA, USA, 2010; pp. 56–107.
- Heerden, J.; Sullivan, P. The application of CFD for evaluation of dust suppression and auxiliary ventilation systems used with continuous miners. In Proceedings of the 6th US Mine Ventilation Symposium, Salt Lake City, UT, USA, 21–23 June 1993; SME: Littleton, CO, USA, 1993; pp. 293–297. [Google Scholar]
- Uchino, K.; Inoue, M. Auxiliary ventilation at a heading of a face by a fan. In Proceedings of the 6th US Mine Ventilation Symposium, Salt Lake City, UT, USA, 21–23 June 1993; SME: Littleton, CO, USA, 1993; pp. 493–496. [Google Scholar]
- Niu, W.; Jiang, Z.G.; Tian, D.M. Numerical simulation of the factors influencing dust in drilling tunnels: It’s application. Min. Sci. Technol. 2011, 21, 11–15. [Google Scholar] [CrossRef]
- Torano, J.; Torno, S.; Mendez, M.; Gent, M. Auxiliary ventilation in mining roadways driven with road headers: Validated CFD modeling of dust behavior. Tunn. Undergr. Space Technol. 2011, 26, 201–210. [Google Scholar] [CrossRef]
- Wang, H.; Jiang, Z.A.; Huang, L.T.; Liao, X.X.; Wand, J.R. Experimental research on pressing air-absorption air volume ratio in FPNA ventilation for excavation roadways. Chin. J. Liaoning Technol. Univ. 2011, 30, 168–171. (In Chinese) [Google Scholar]
- Canoo, B. STAR-CD Digs Miners out of Trouble; Elsevier Science B.V.: Amsterdam, The Netherlands, 2004; pp. 27–28. [Google Scholar]
- Parra, M.T.; Villafruela, J.M.; Castro, F.; Mendez, C. Numerical and experimental analysis of different ventilation systems in deep mines. Build. Environ. 2006, 41, 87–93. [Google Scholar] [CrossRef]
- Torano, J.; Torno, S.; Menendez, M.; Gent, M.; Velasco, J. Models of methane behaviour in auxiliary ventilation of underground coal mining. Int. J. Coal Geol. 2009, 80, 35–43. [Google Scholar] [CrossRef]
- El-Nagdy, K.A. Stability of multiple fans in mine ventilation networks. Int. J. Min. Sci. Technol. 2013, 23, 569–571. [Google Scholar] [CrossRef]
- Sasmito, A.P.; Birgersson, E.; Ly, H.; Mujumdar, A.S. Some approaches to improve ventilation system in underground coal mines environment—A computational fluid dynamic study. Tunn. Undergr. Space Technol. 2013, 34, 82–95. [Google Scholar] [CrossRef]
- Kurnia, J.C.; Sasmito, A.P.; Mujumdar, A.S. Dust dispersion and management in underground mining faces. Int. J. Min. Sci. Technol. 2014, 24, 39–44. [Google Scholar] [CrossRef]
- Kurnia, J.C.; Sasmito, A.P.; Mujumdar, A.S. CFD simulation of methane dispersion and innovative methane management in underground mining faces. Appl. Math. Model. 2014, 38, 3467–3484. [Google Scholar] [CrossRef]
- Kurnia, J.C.; Sasmito, A.P.; Mujumdar, A.S. Prediction and innovative control strategies for oxygen and hazardous gases from diesel emission in underground mines. Sci. Total Environ. 2014, 481, 317–334. [Google Scholar] [CrossRef] [PubMed]
- Kurnia, J.C.; Sasmito, A.P.; Mujumdar, A.S. Simulation of a novel intermittent ventilation system for underground mines. Tunn. Undergr. Space Technol. 2014, 42, 206–215. [Google Scholar] [CrossRef]
- Kurnia, J.C.; Sasmito, A.P.; Hassani, F.P. Introion and evaluation of a novel hybrid brattice for improved dust control in underground mining faces: A computational study. Int. J. Min. Sci. Technol. 2015, 24, 537–543. [Google Scholar] [CrossRef]
- Reddy, A.C. Development of a Coal Reserve GIS Model and Estimation of the Recoverability and Extraction Costs. Master’s Thesis, West Virginia University, Morgantown, WV, USA, 2009. [Google Scholar]
- Wu, J. Research on mine ventilator frequency conversion energy saving technology ventilator. Opencast Min. Technol. 2010, 68–72. [Google Scholar] [CrossRef]
- Wilcox, D.C. Turbulence Modeling for CFD; DCW Industries Inc.: La Cañada Flintridge, CA, USA, 1993. [Google Scholar]
- Li, Y.C.; Liu, J. Numerical simulation of dust control using air curtain based on gas-solid two-phase flow. Chin. J. Liaoning Technol. Univ. 2012, 31, 765–769. (In Chinese) [Google Scholar]
- Wang, Y.; Luo, G. Numerical study on dust movement and dust distribution for hybrid ventilation system in a laneway of coal mine. J. Loss Prev. Process Ind. 2015, 36, 146–157. [Google Scholar] [CrossRef]
- Hu, S.; Wang, Z. Temporal and Spatial Distribution of Respirable Dust after Blasting of Coal Roadway Driving Faces: A Case Study. Minerals 2015, 5, 679–692. [Google Scholar] [CrossRef]
- Hu, S.; Feng, G.; Ren, X.; Xu, G. Numerical study of gas-solid two-phase flow in a coal roadway after blasting. Adv. Powder Technol. 2016, 27, 1607–1617. [Google Scholar] [CrossRef]
Figure 1.
Layout of the excavation laneway and devices.
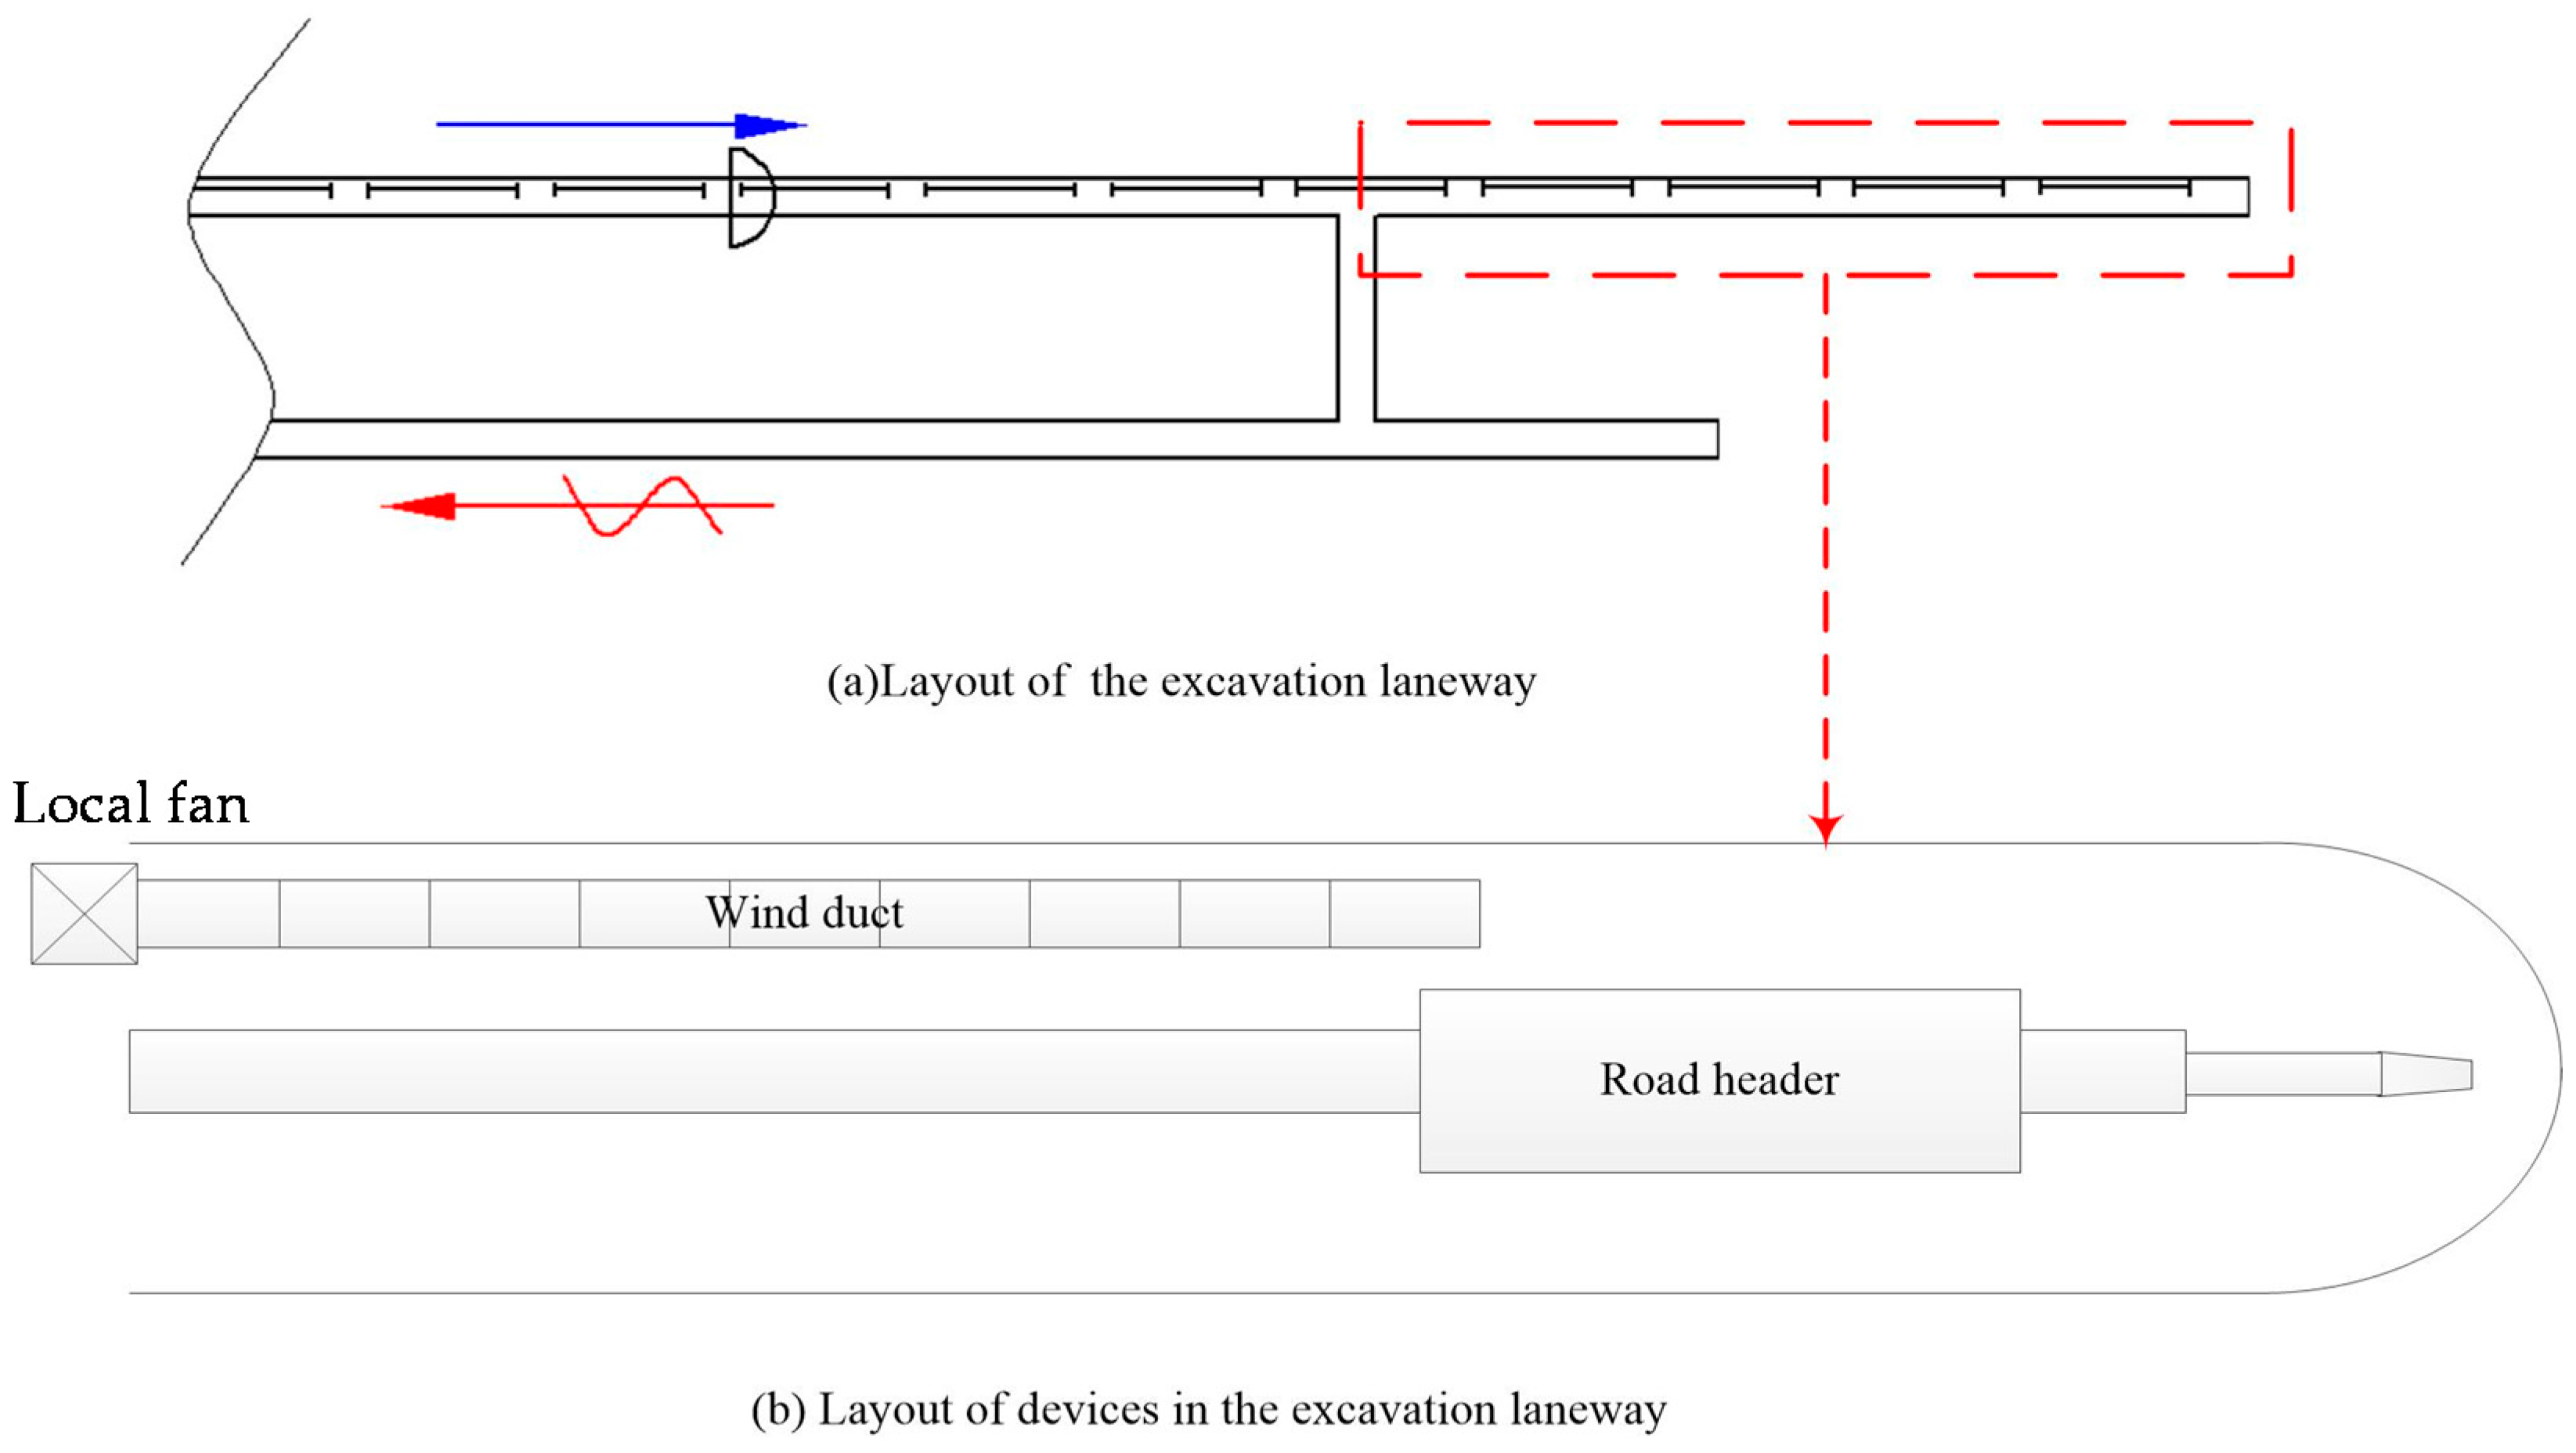
Figure 2.
Schematic views of the laneway model.
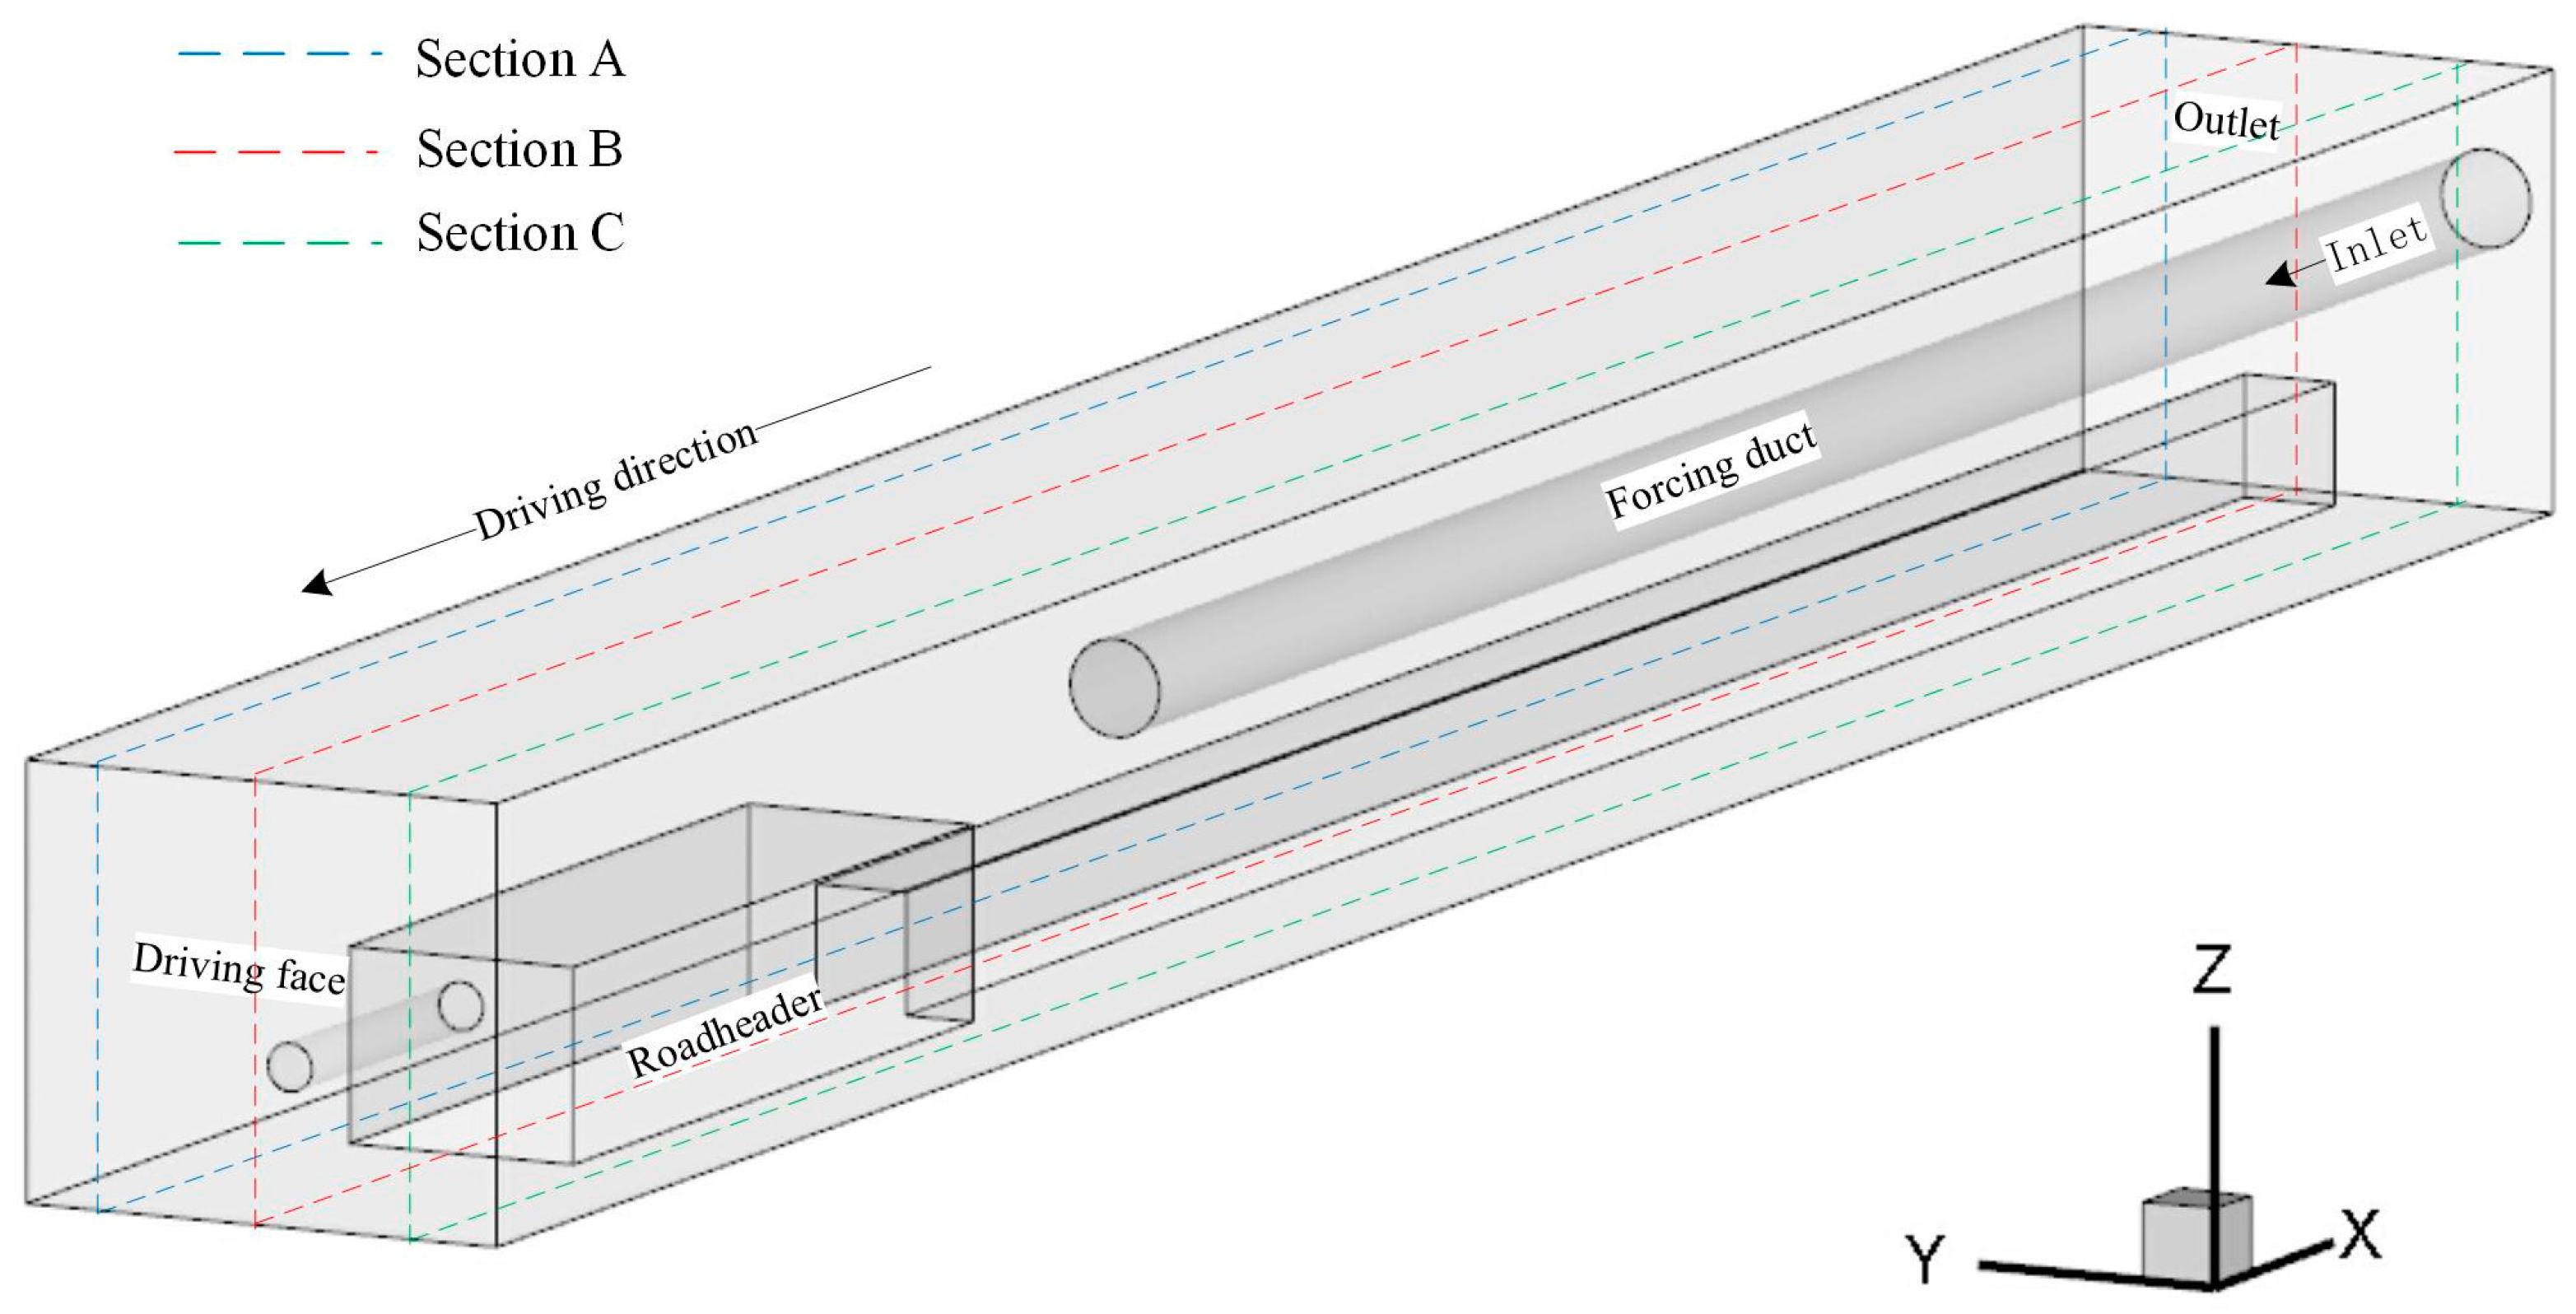
Figure 3.
Velocity distribution (m/s) for various turbulence models at distance of 2, 5, 10, 20 m from the driving face.
Figure 3.
Velocity distribution (m/s) for various turbulence models at distance of 2, 5, 10, 20 m from the driving face.

Figure 4.
Velocity field (m/s) of airflow under different mesh generation.
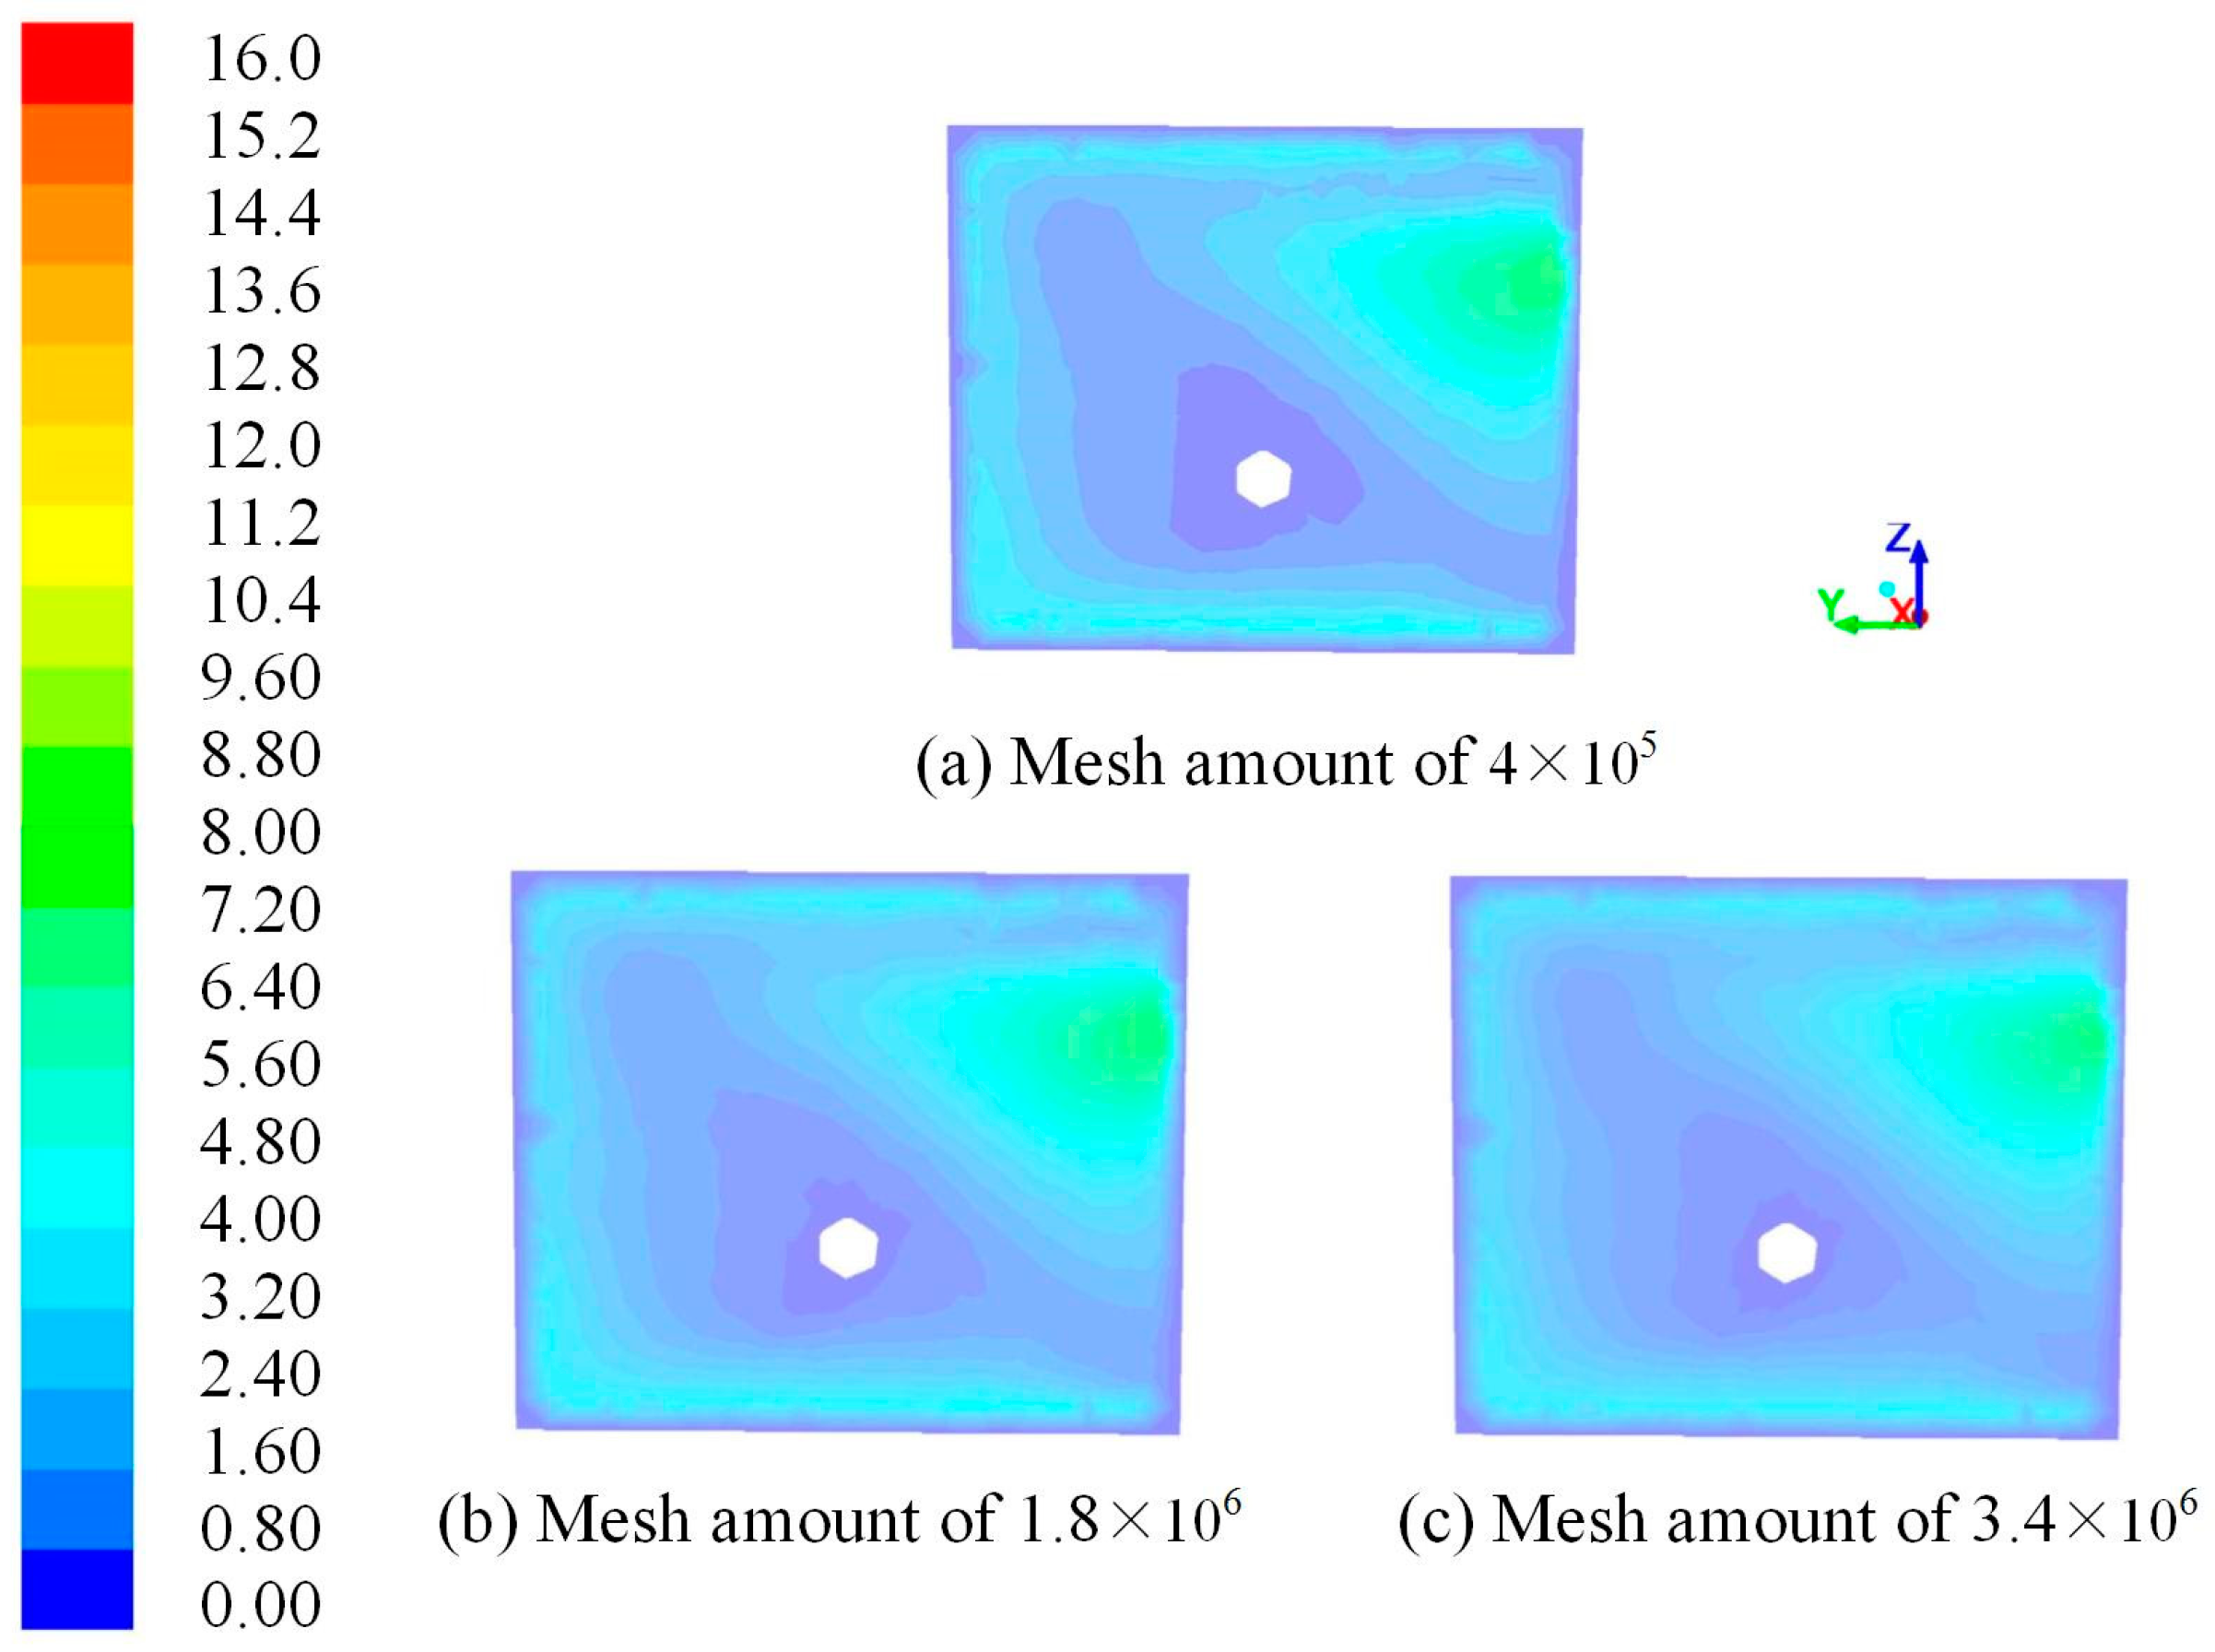
Figure 5.
Velocity vectors (m/s) of dust particles under different mesh generation.

Figure 6.
Mesh generation.
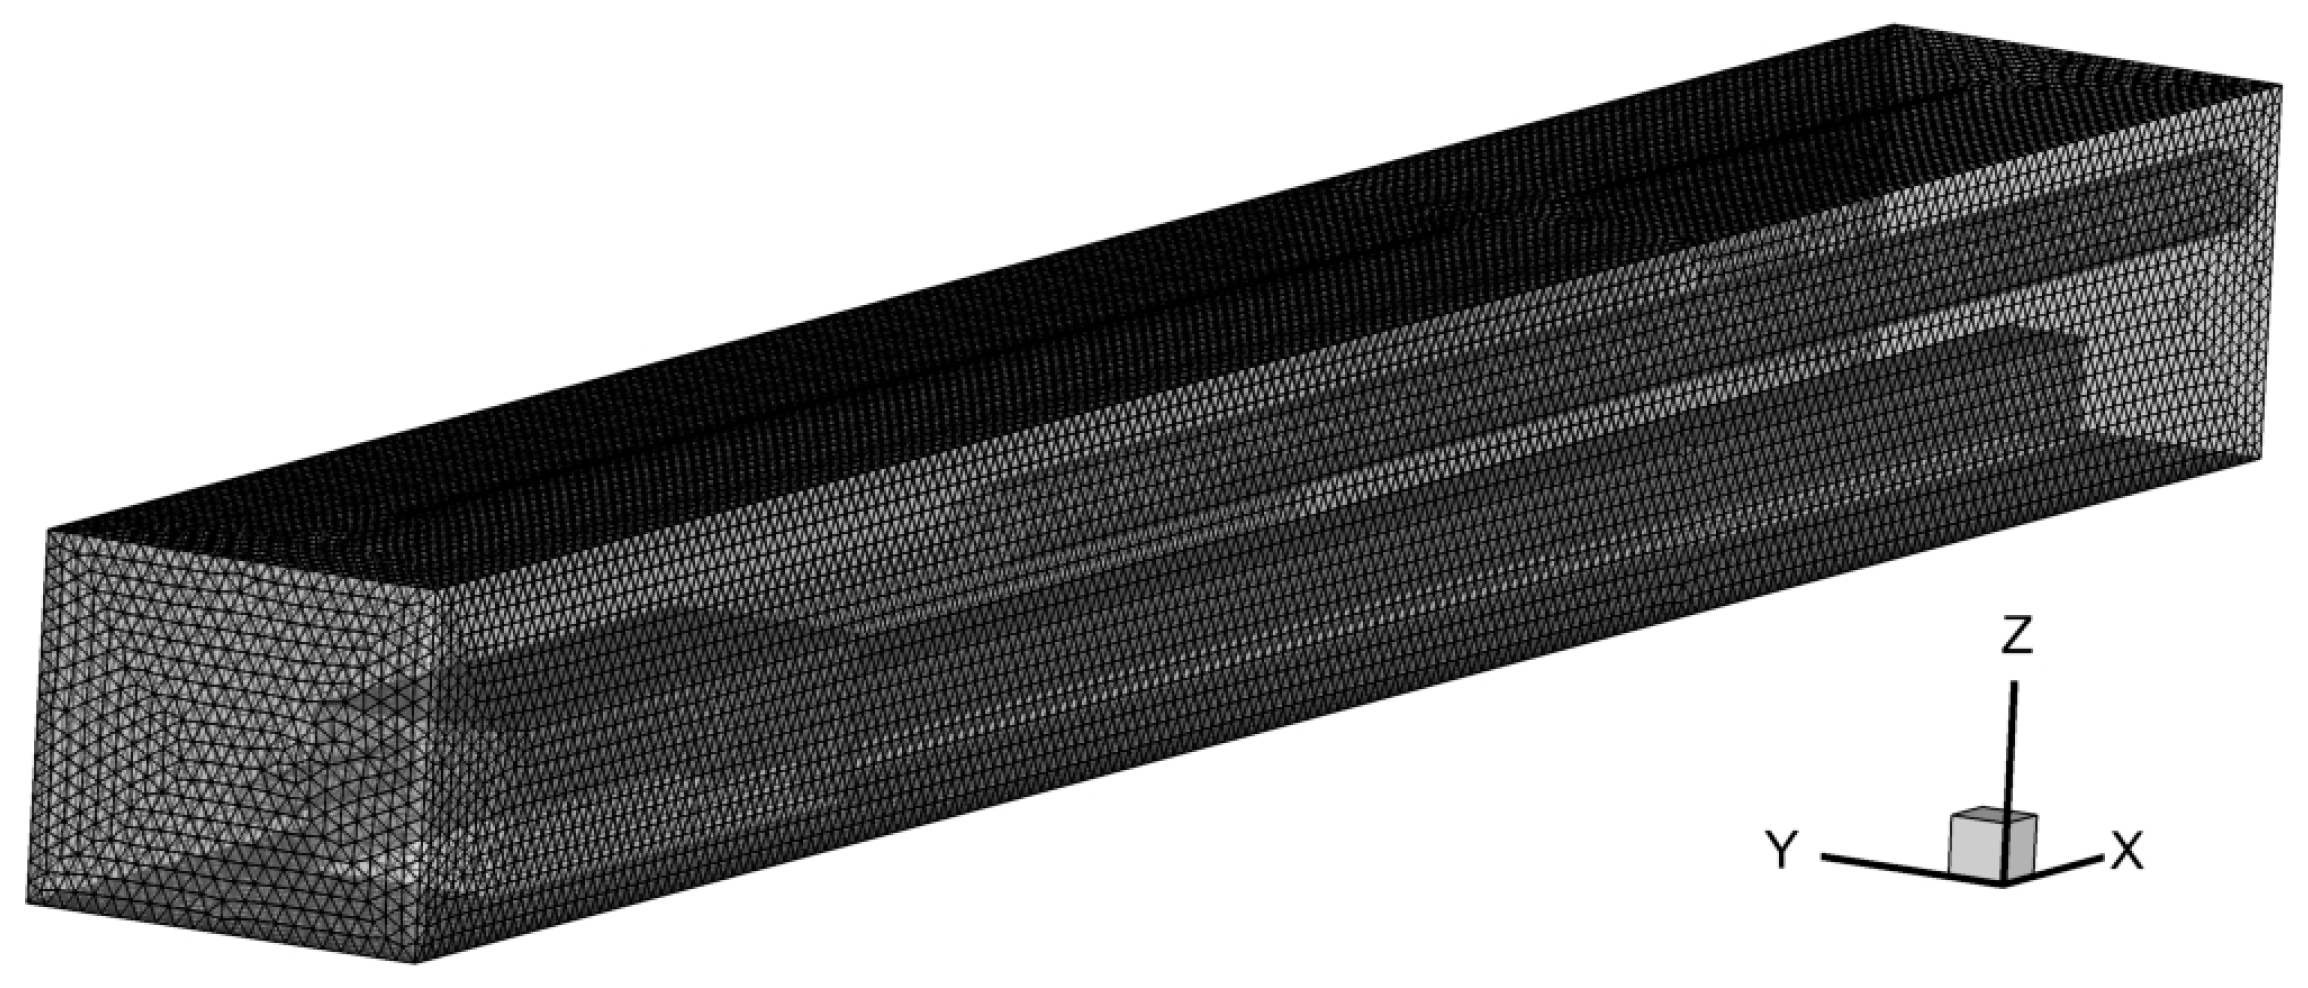
Figure 7.
Four different velocity patterns for ventilation and dust control system.

Figure 8.
Average dust concentration along section A at breathing height of 1.5 m. (a) t = 60 s; (b) t = 120 s; (c) t = 180 s.
Figure 8.
Average dust concentration along section A at breathing height of 1.5 m. (a) t = 60 s; (b) t = 120 s; (c) t = 180 s.

Figure 9.
Airflow velocity (m/s) profiles at different height (0.25, 1.6 and 2.5 m above the laneway floor).
Figure 9.
Airflow velocity (m/s) profiles at different height (0.25, 1.6 and 2.5 m above the laneway floor).
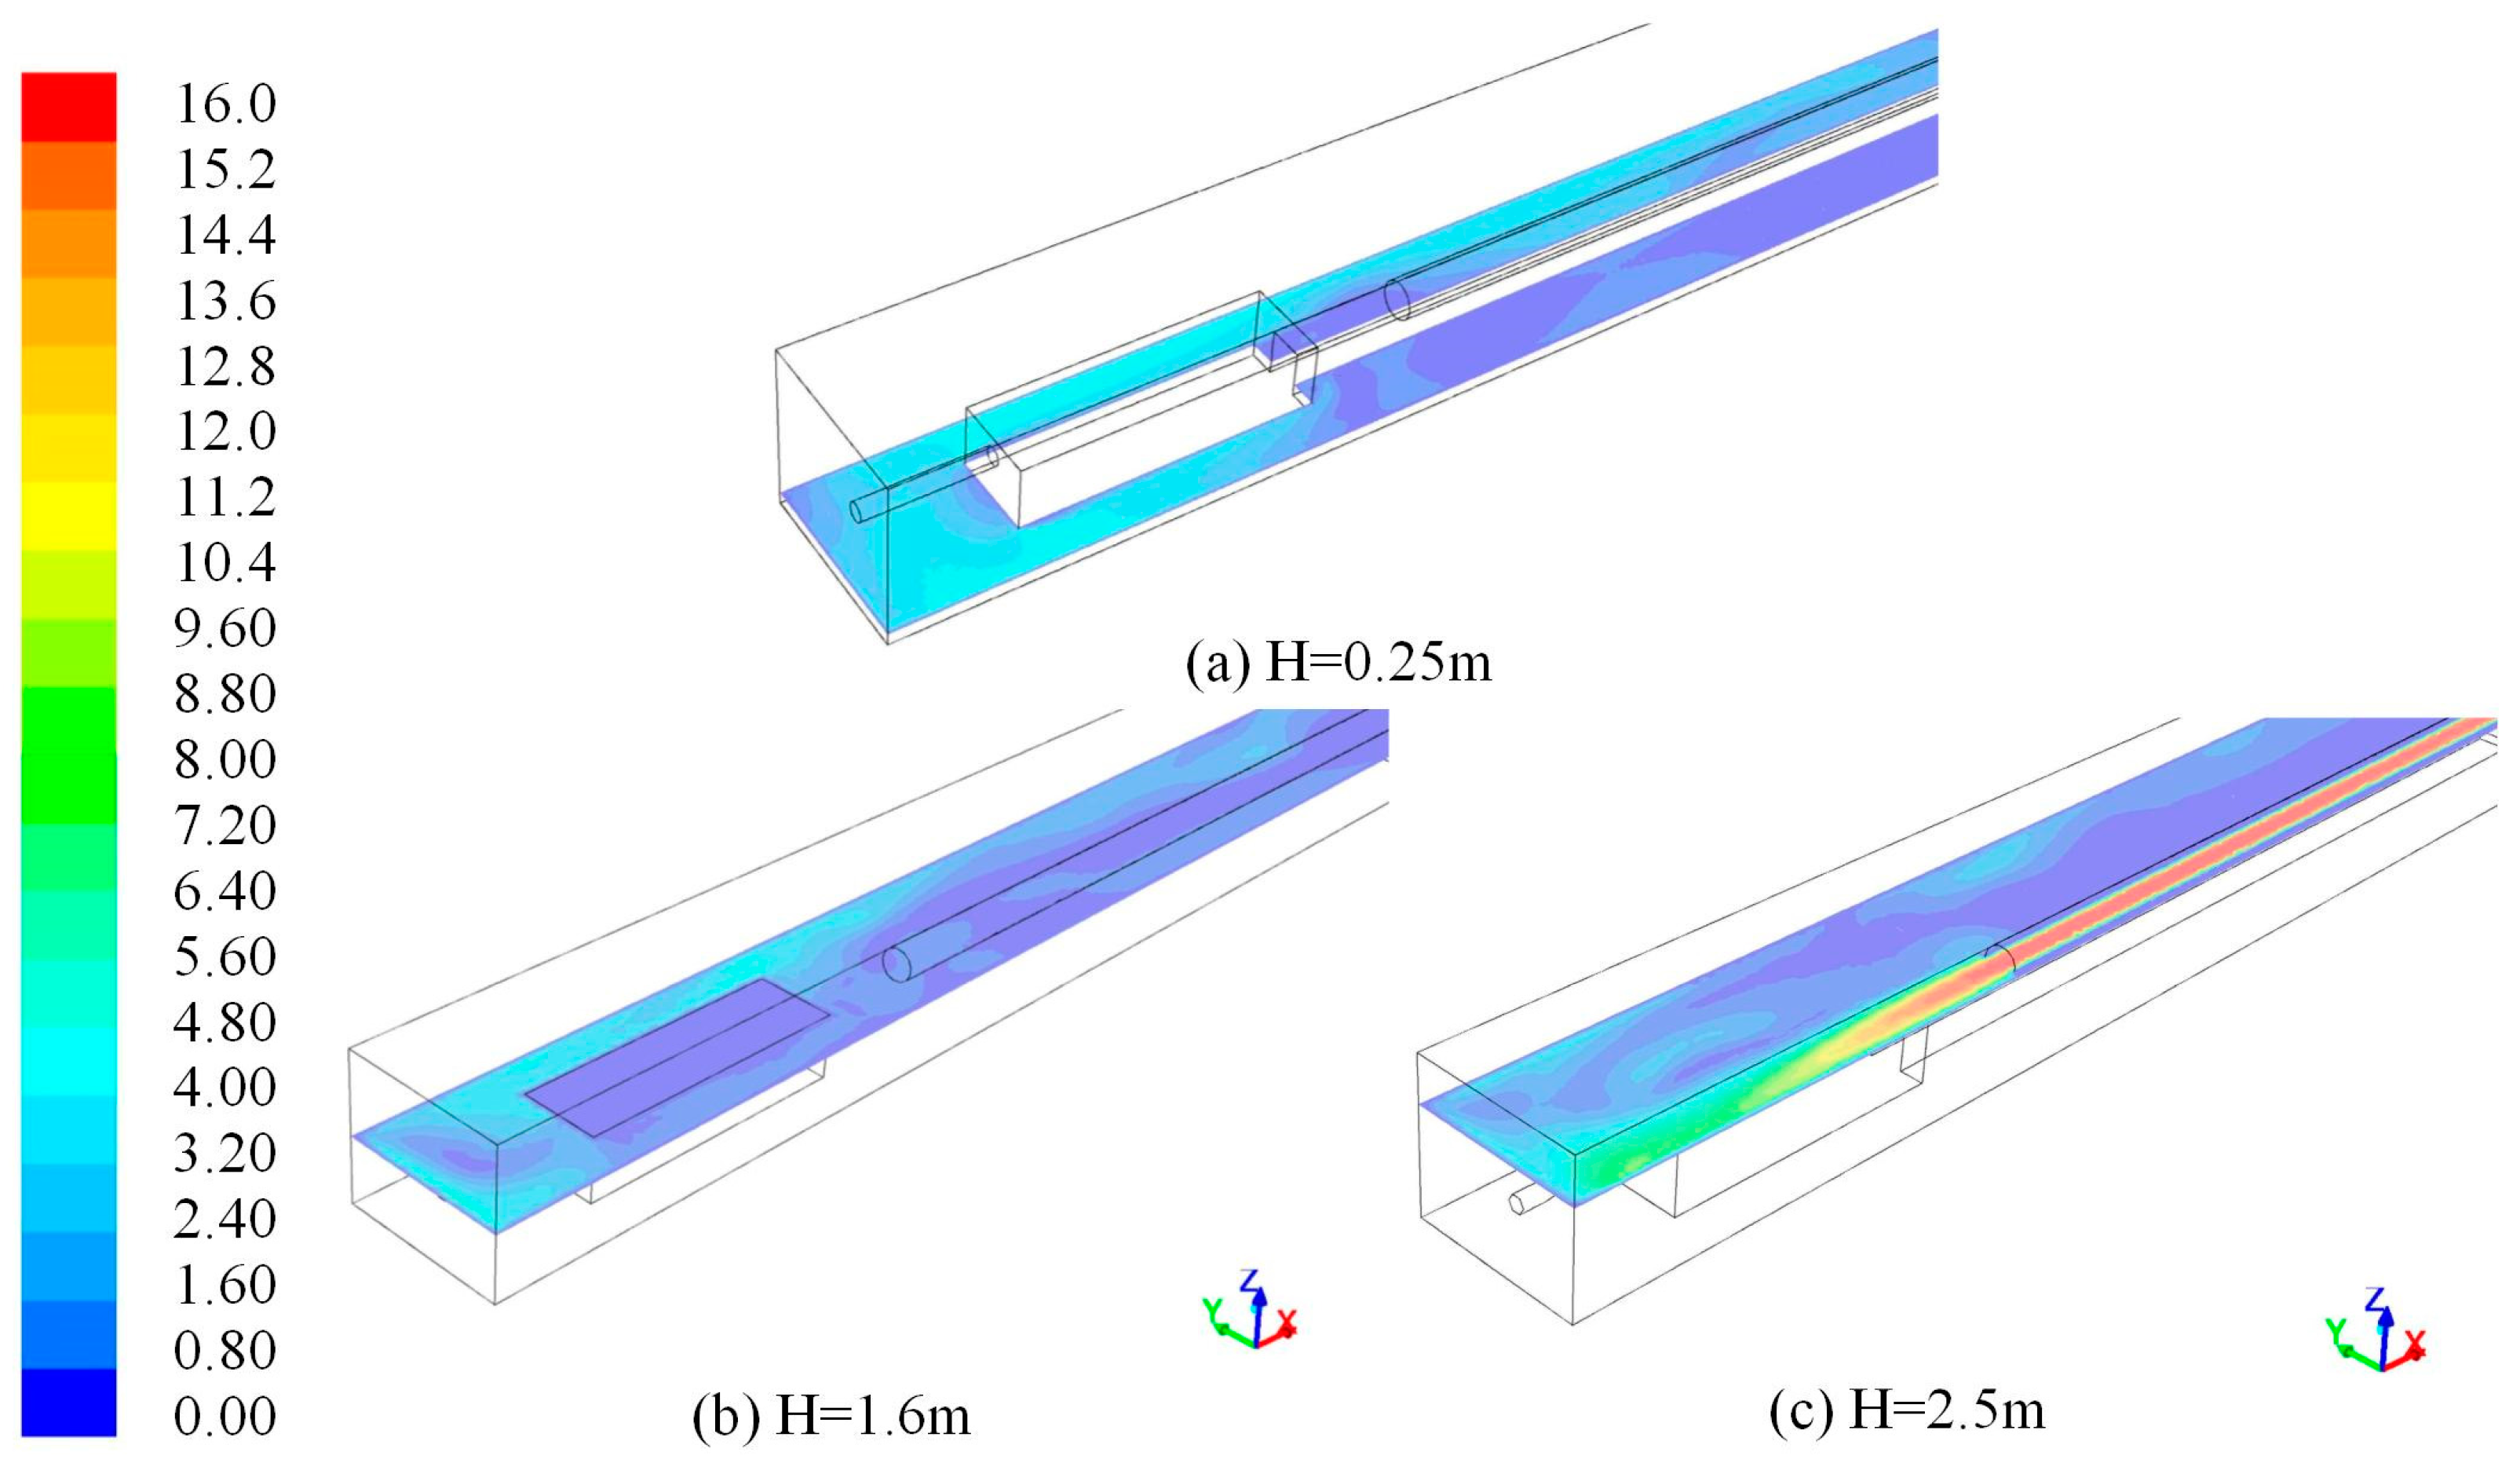
Figure 10.
Airflow velocity (m/s) profiles at height of 1.5 m above the laneway floor.
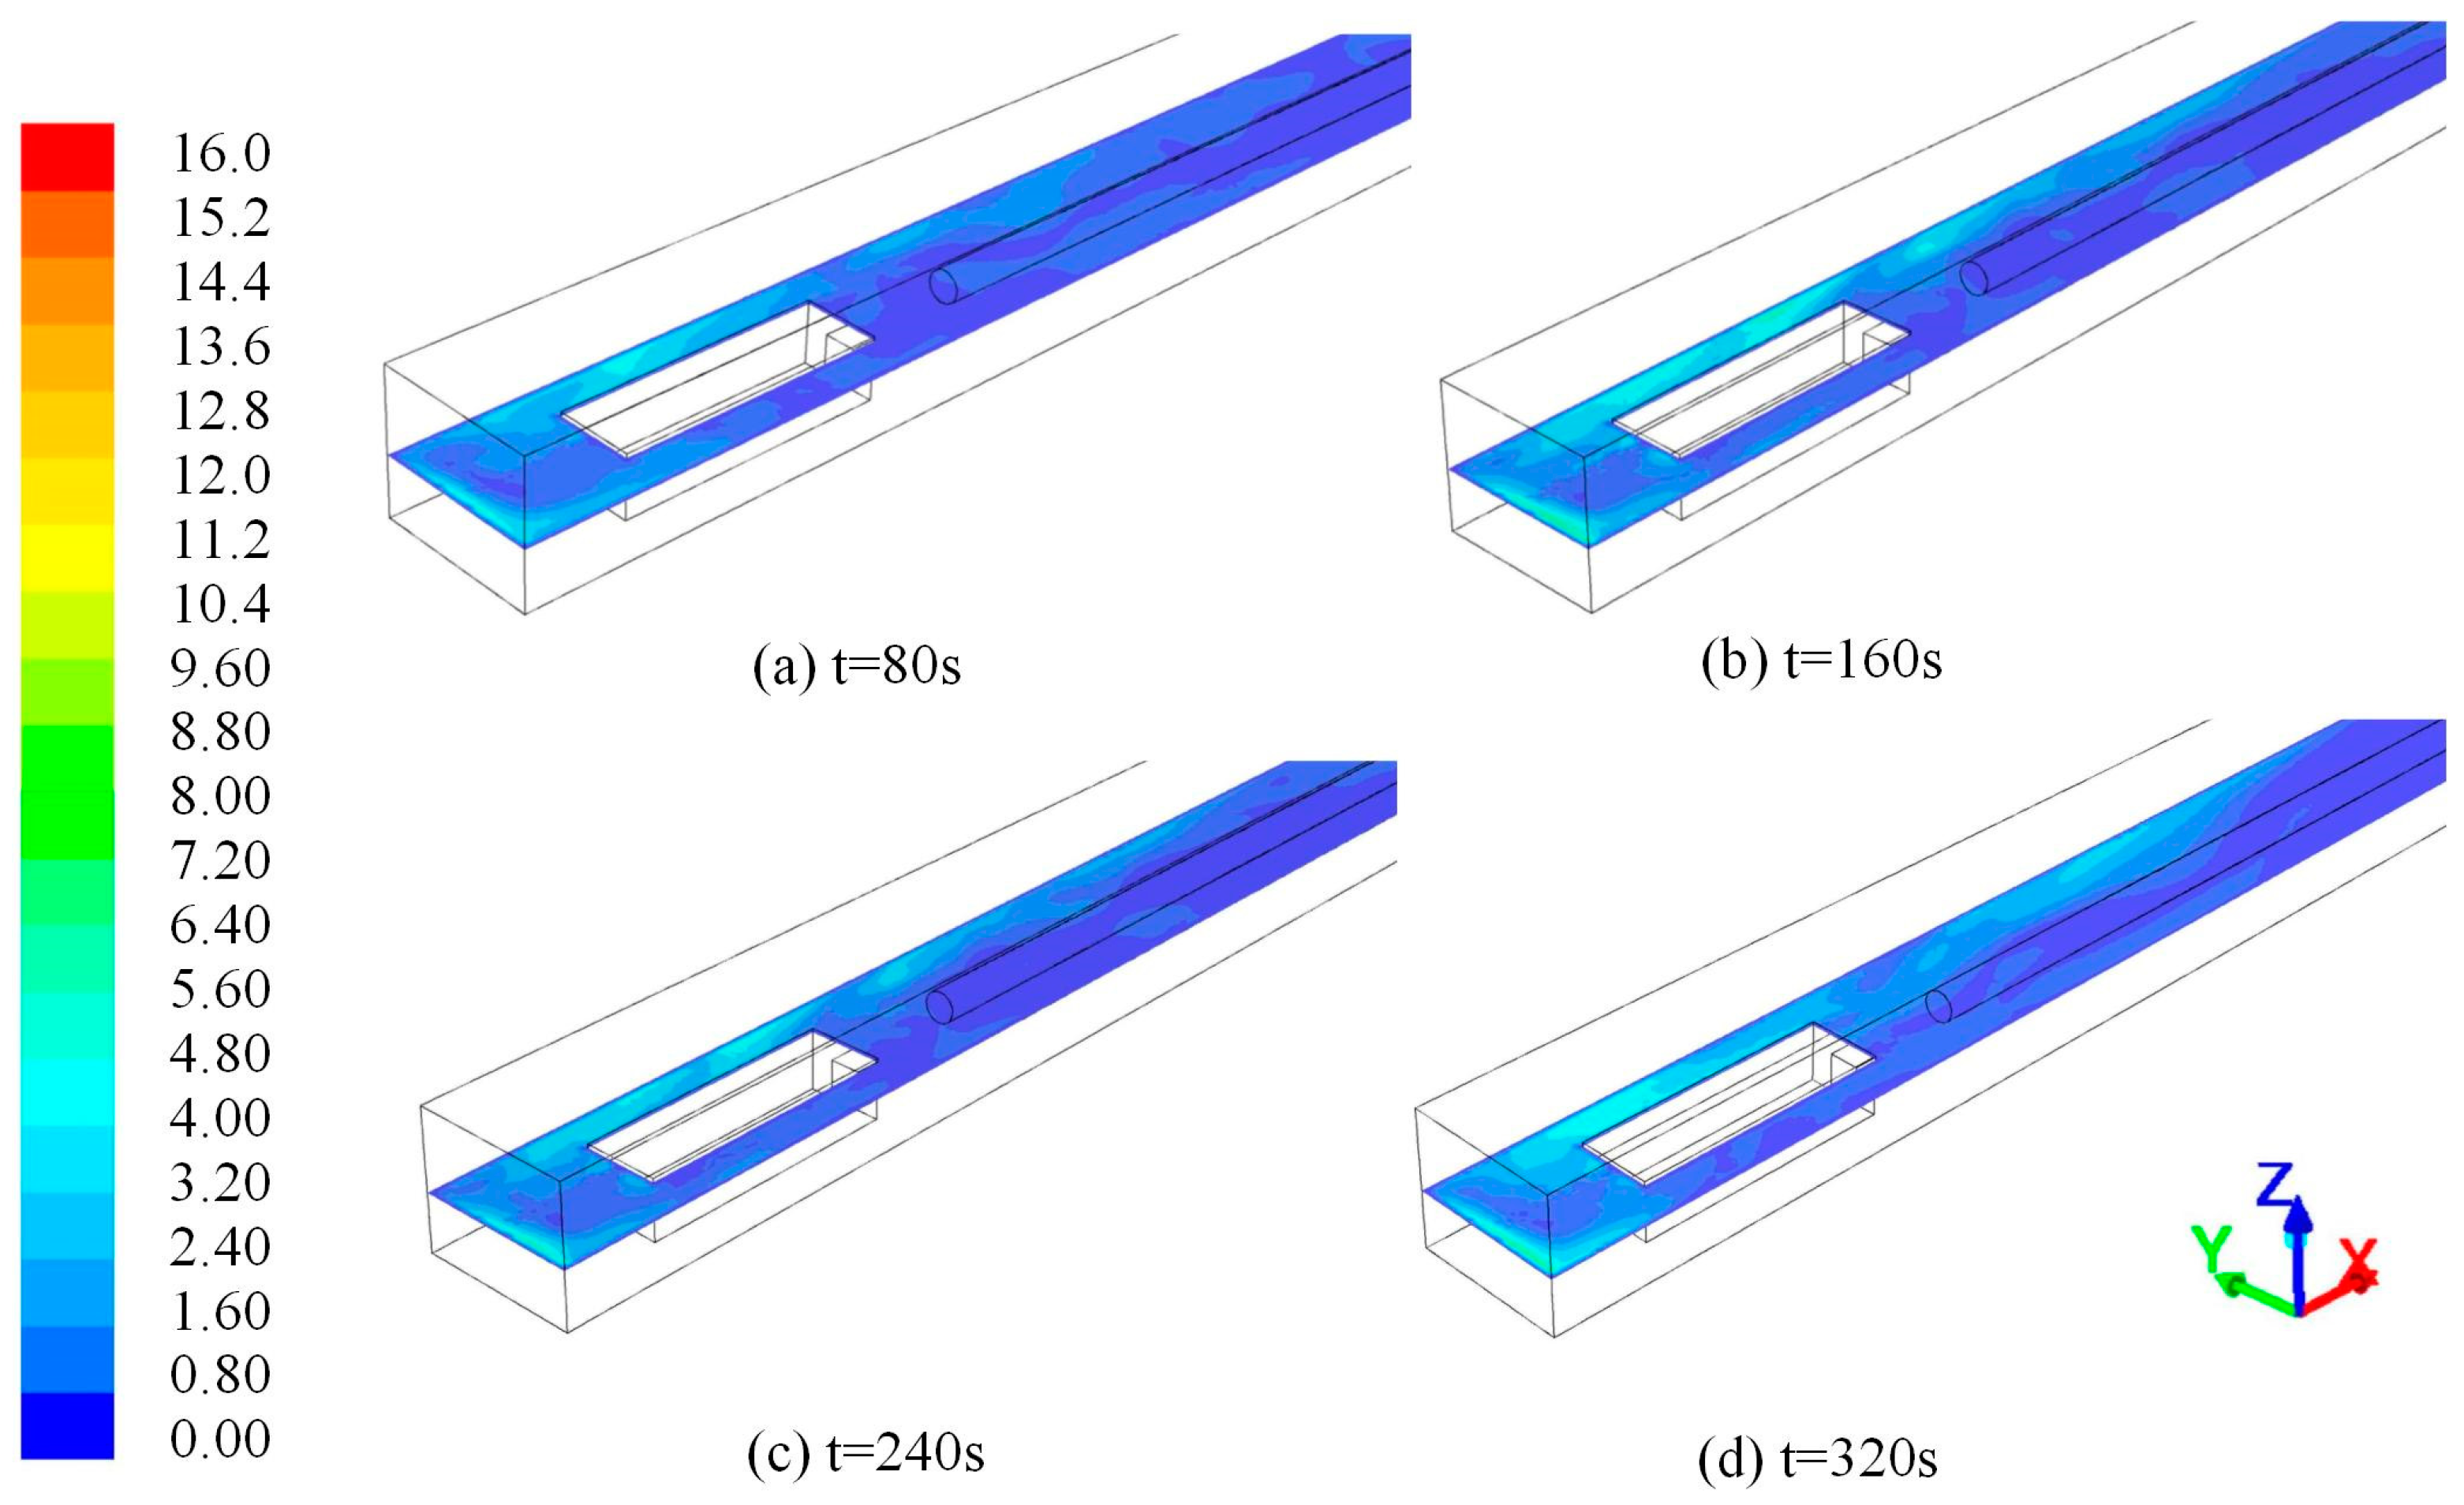
Figure 11.
Dust distribution (g/m3) at height of 1.5 m above the laneway floor.
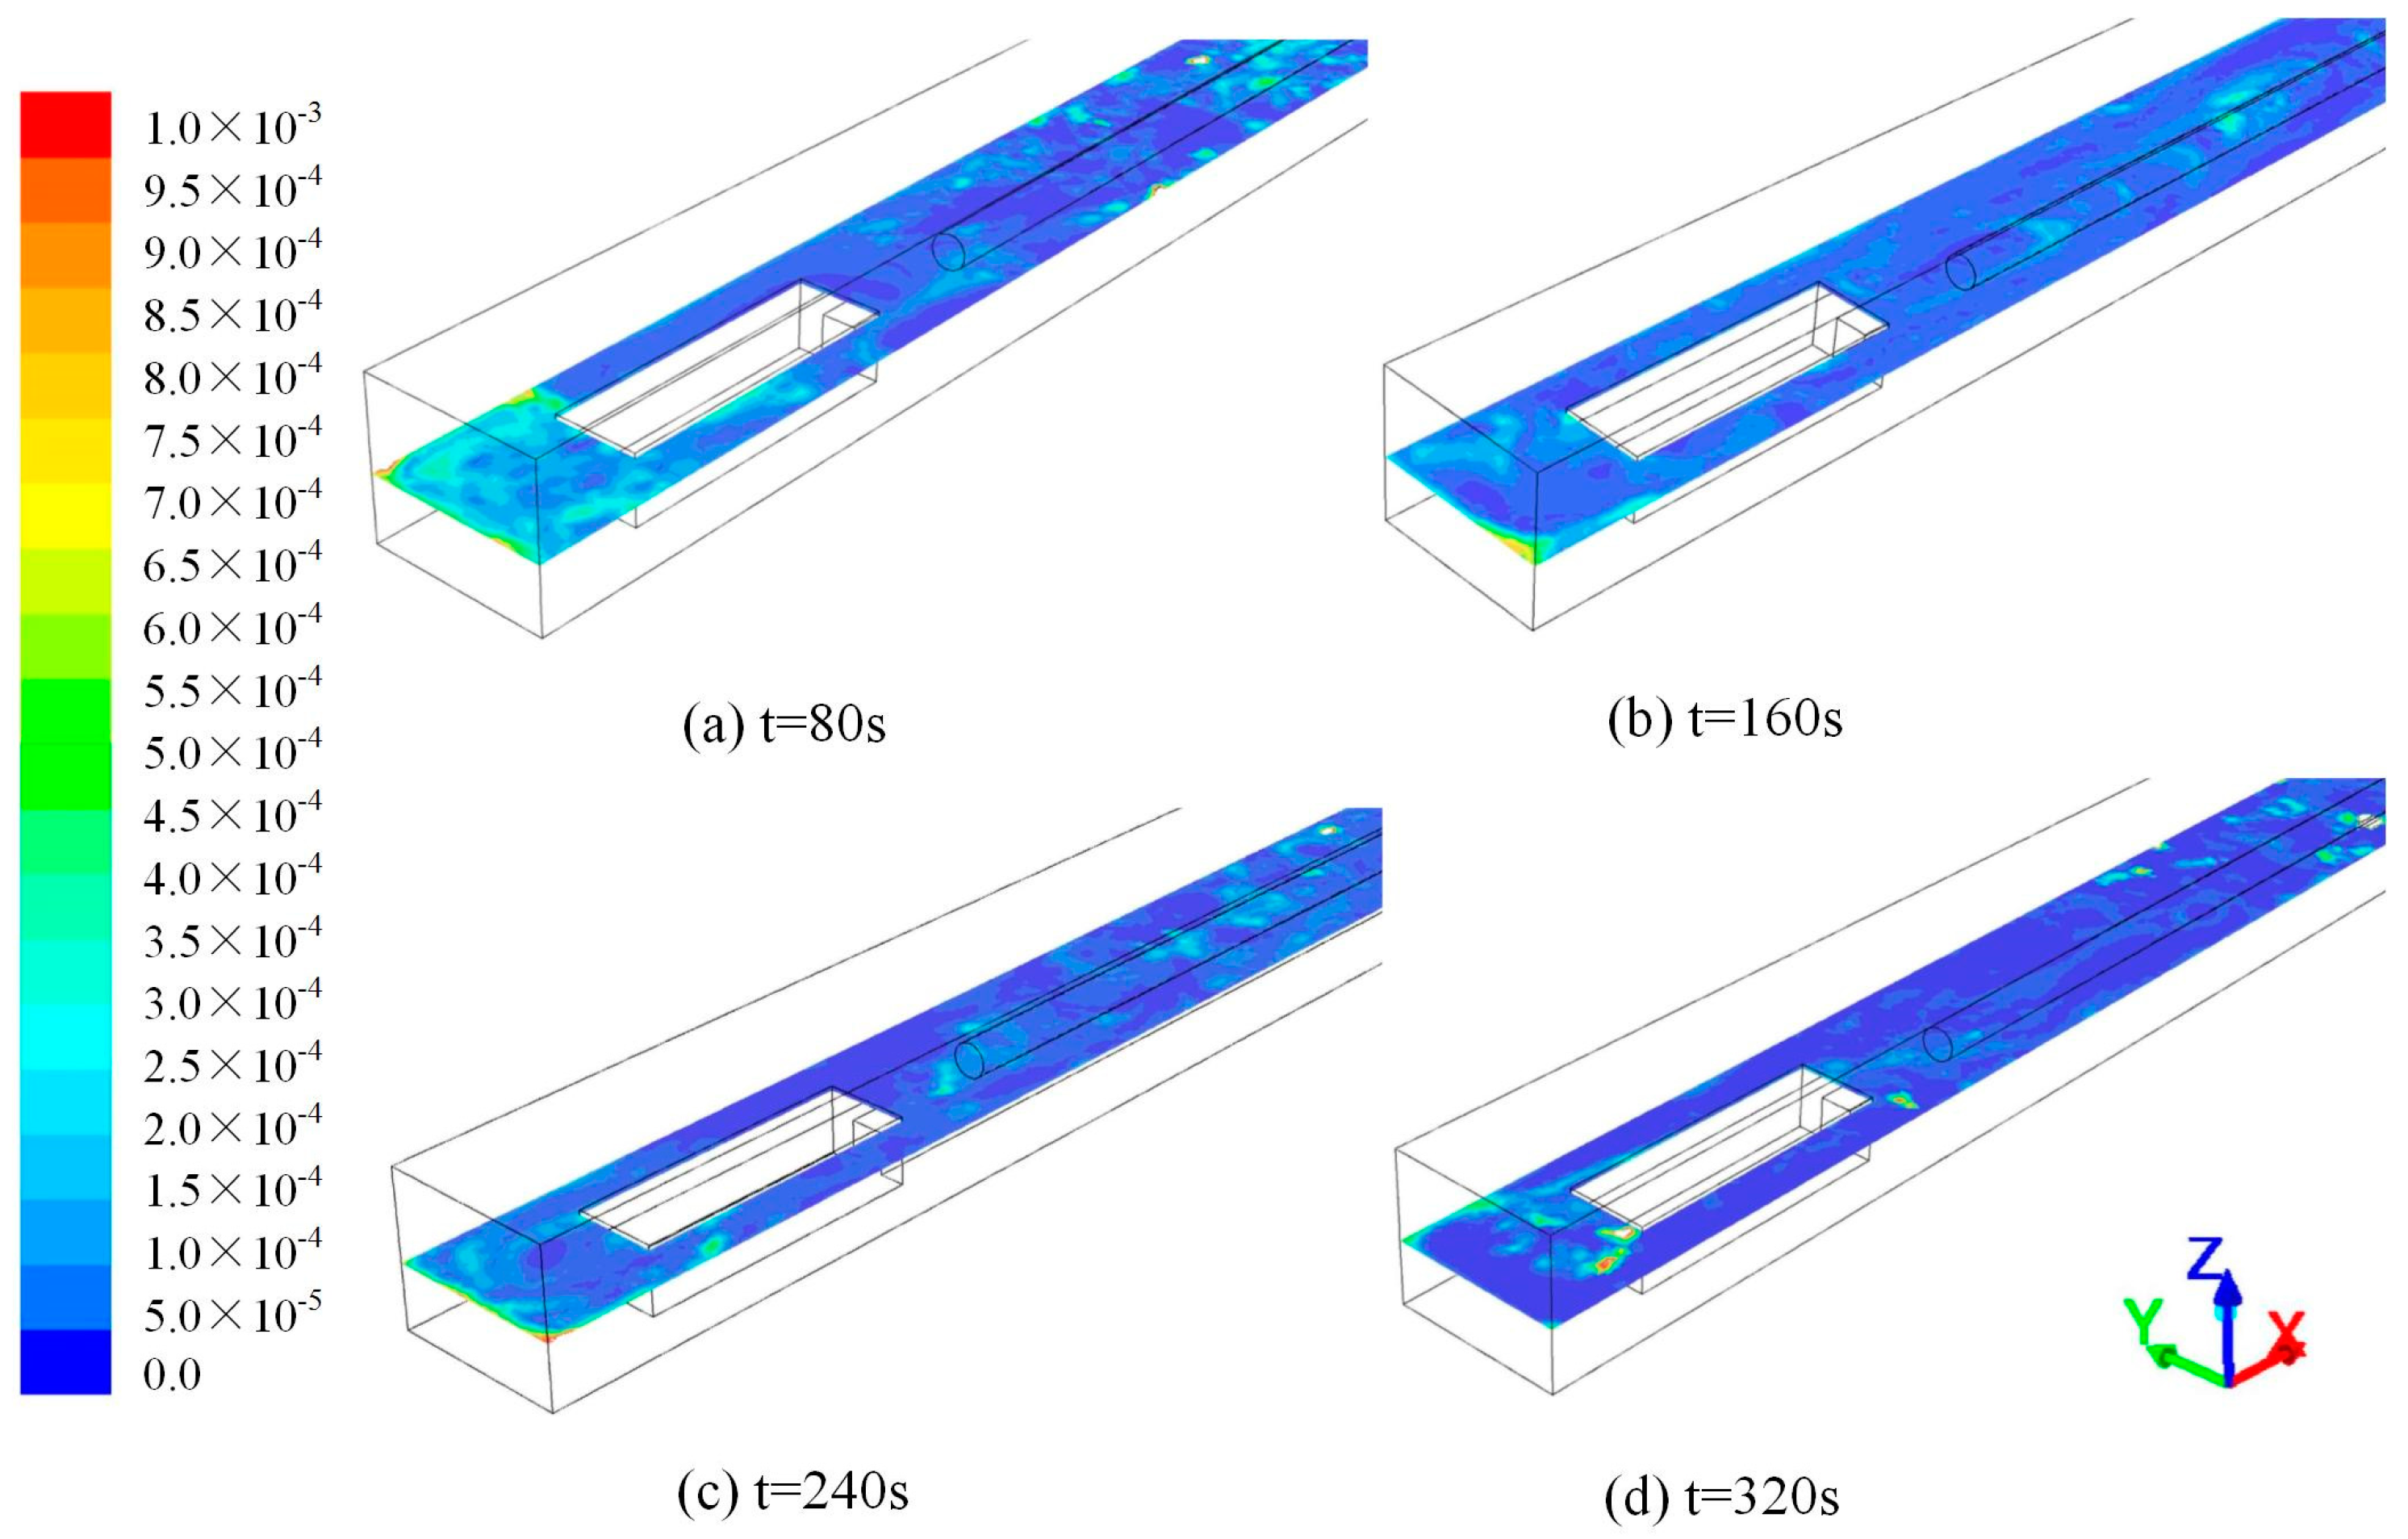
Figure 12.
Dust concentration changed over time at two monitored points. (a) Point in Section A; (b) point in Section C.
Figure 12.
Dust concentration changed over time at two monitored points. (a) Point in Section A; (b) point in Section C.
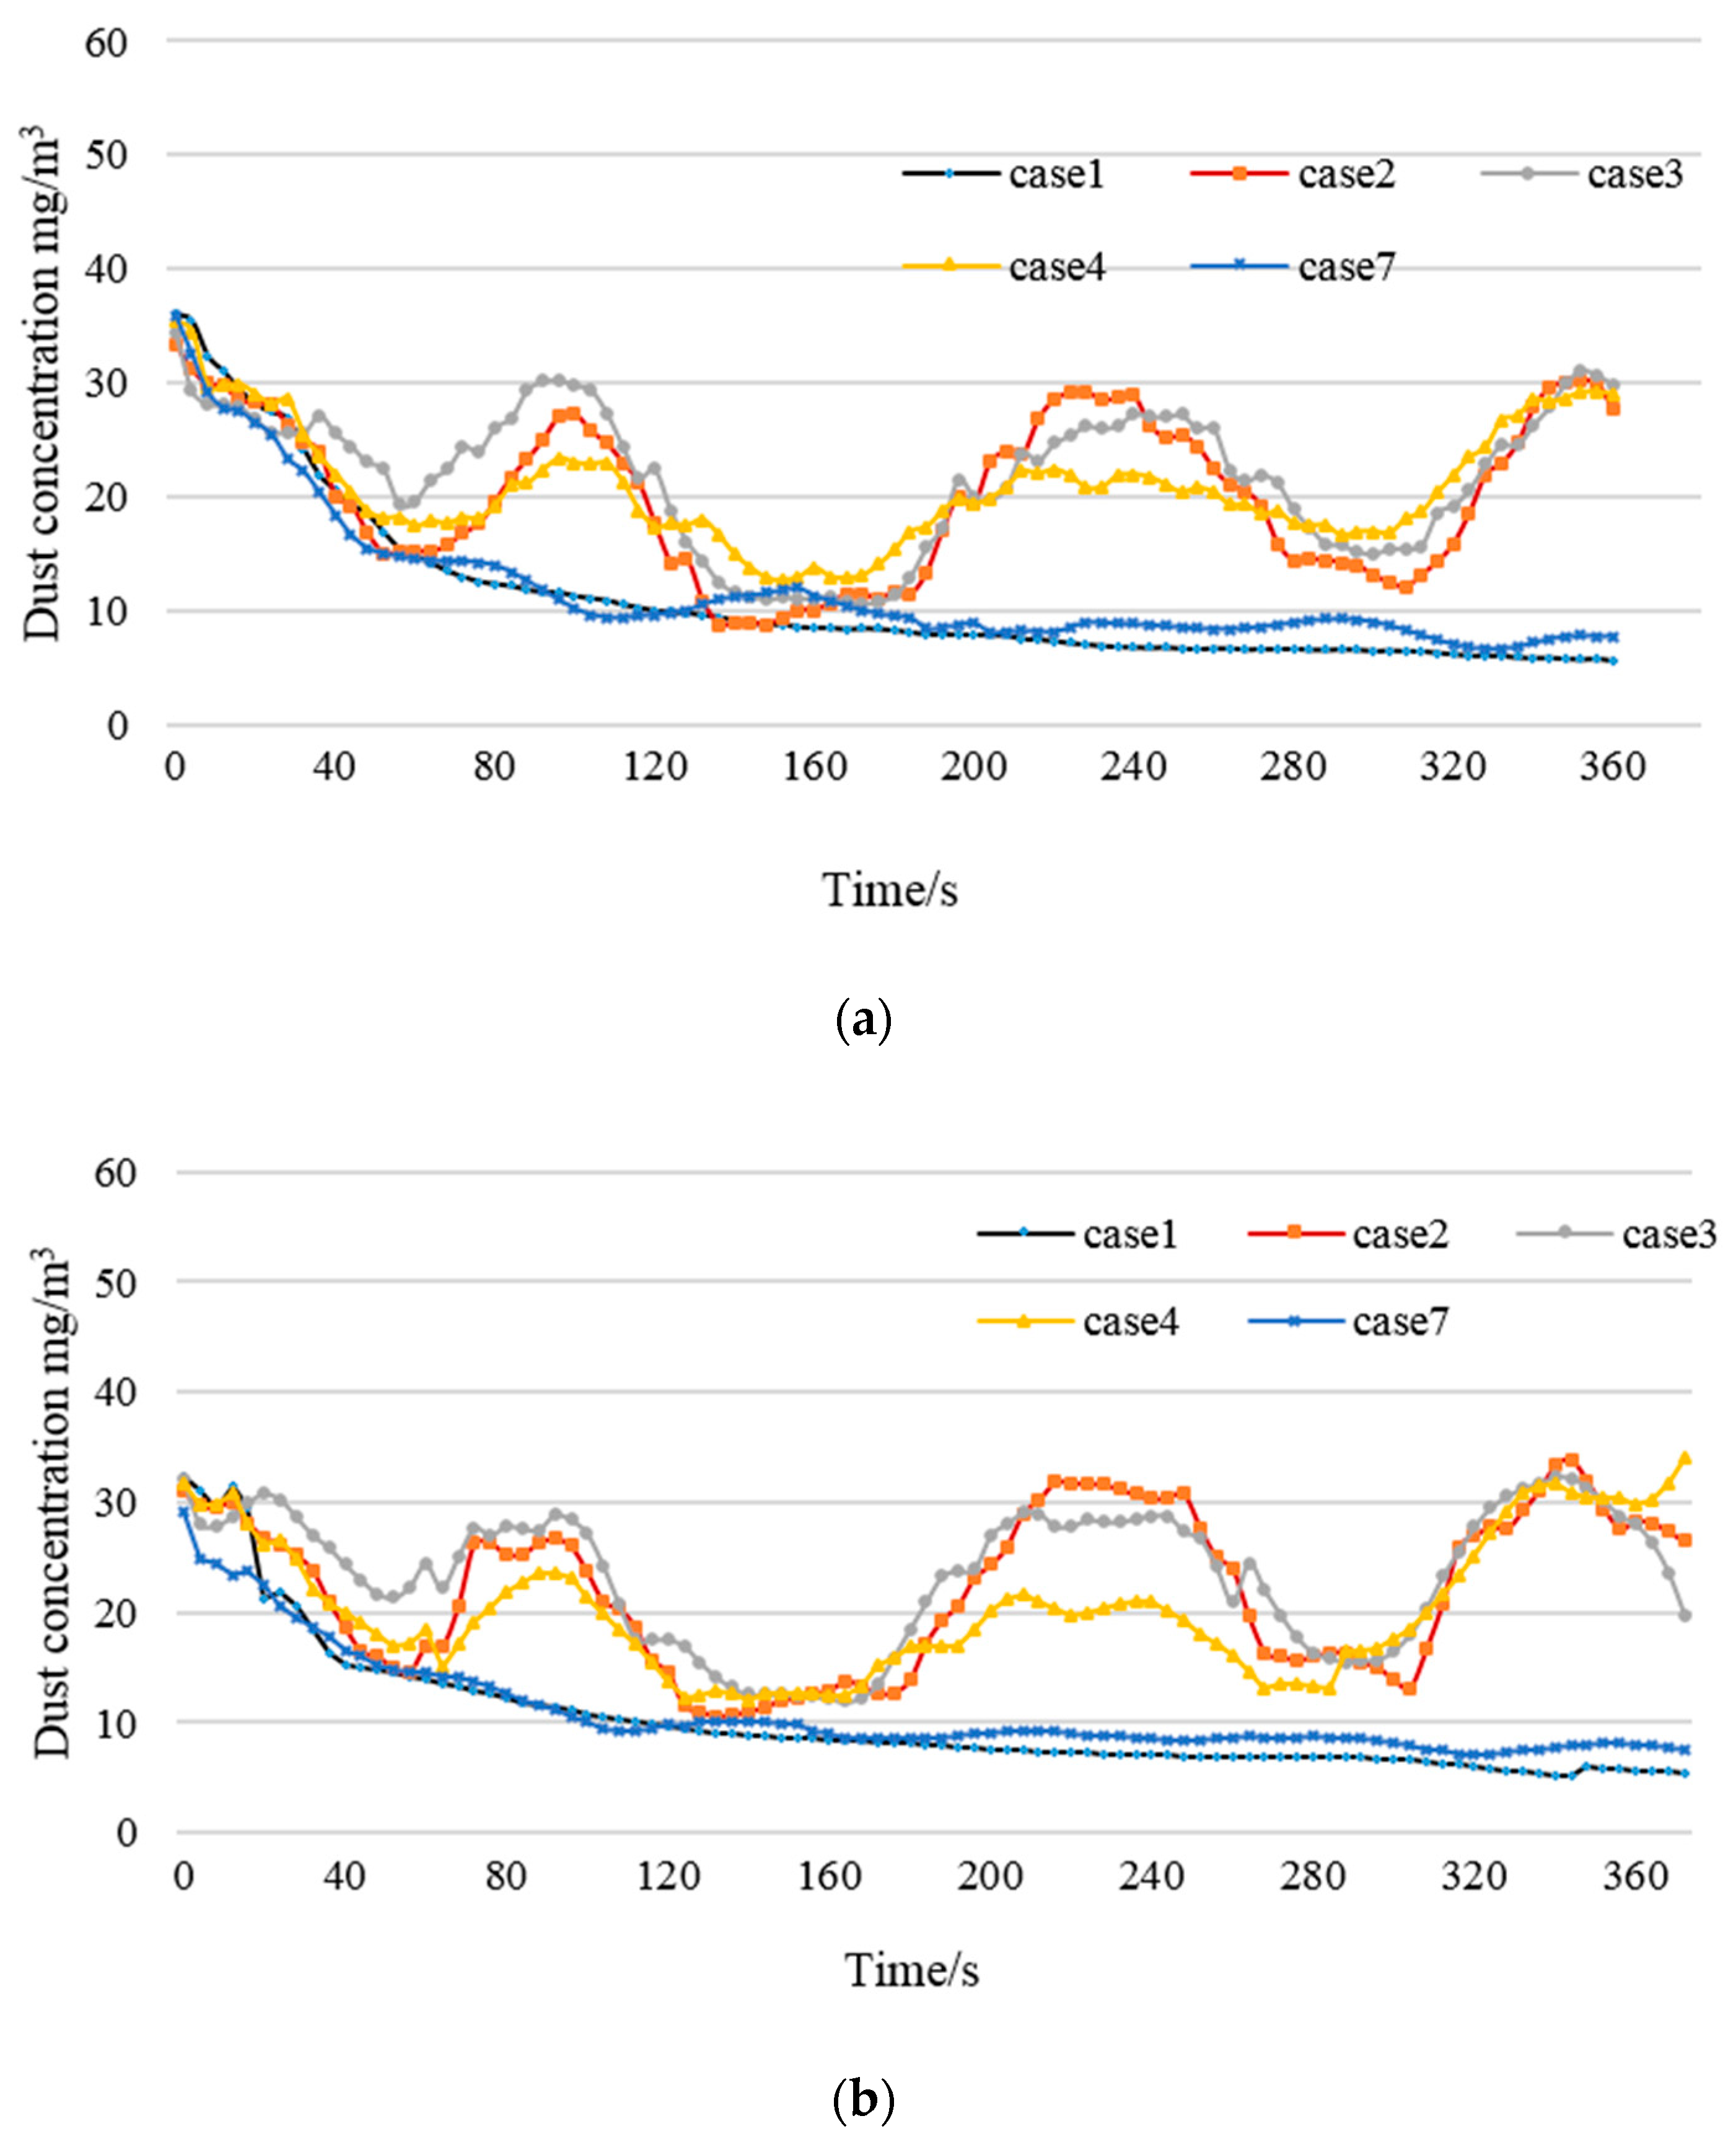
Figure 13.
Optimized velocity pattern for ventilation and dust control system.
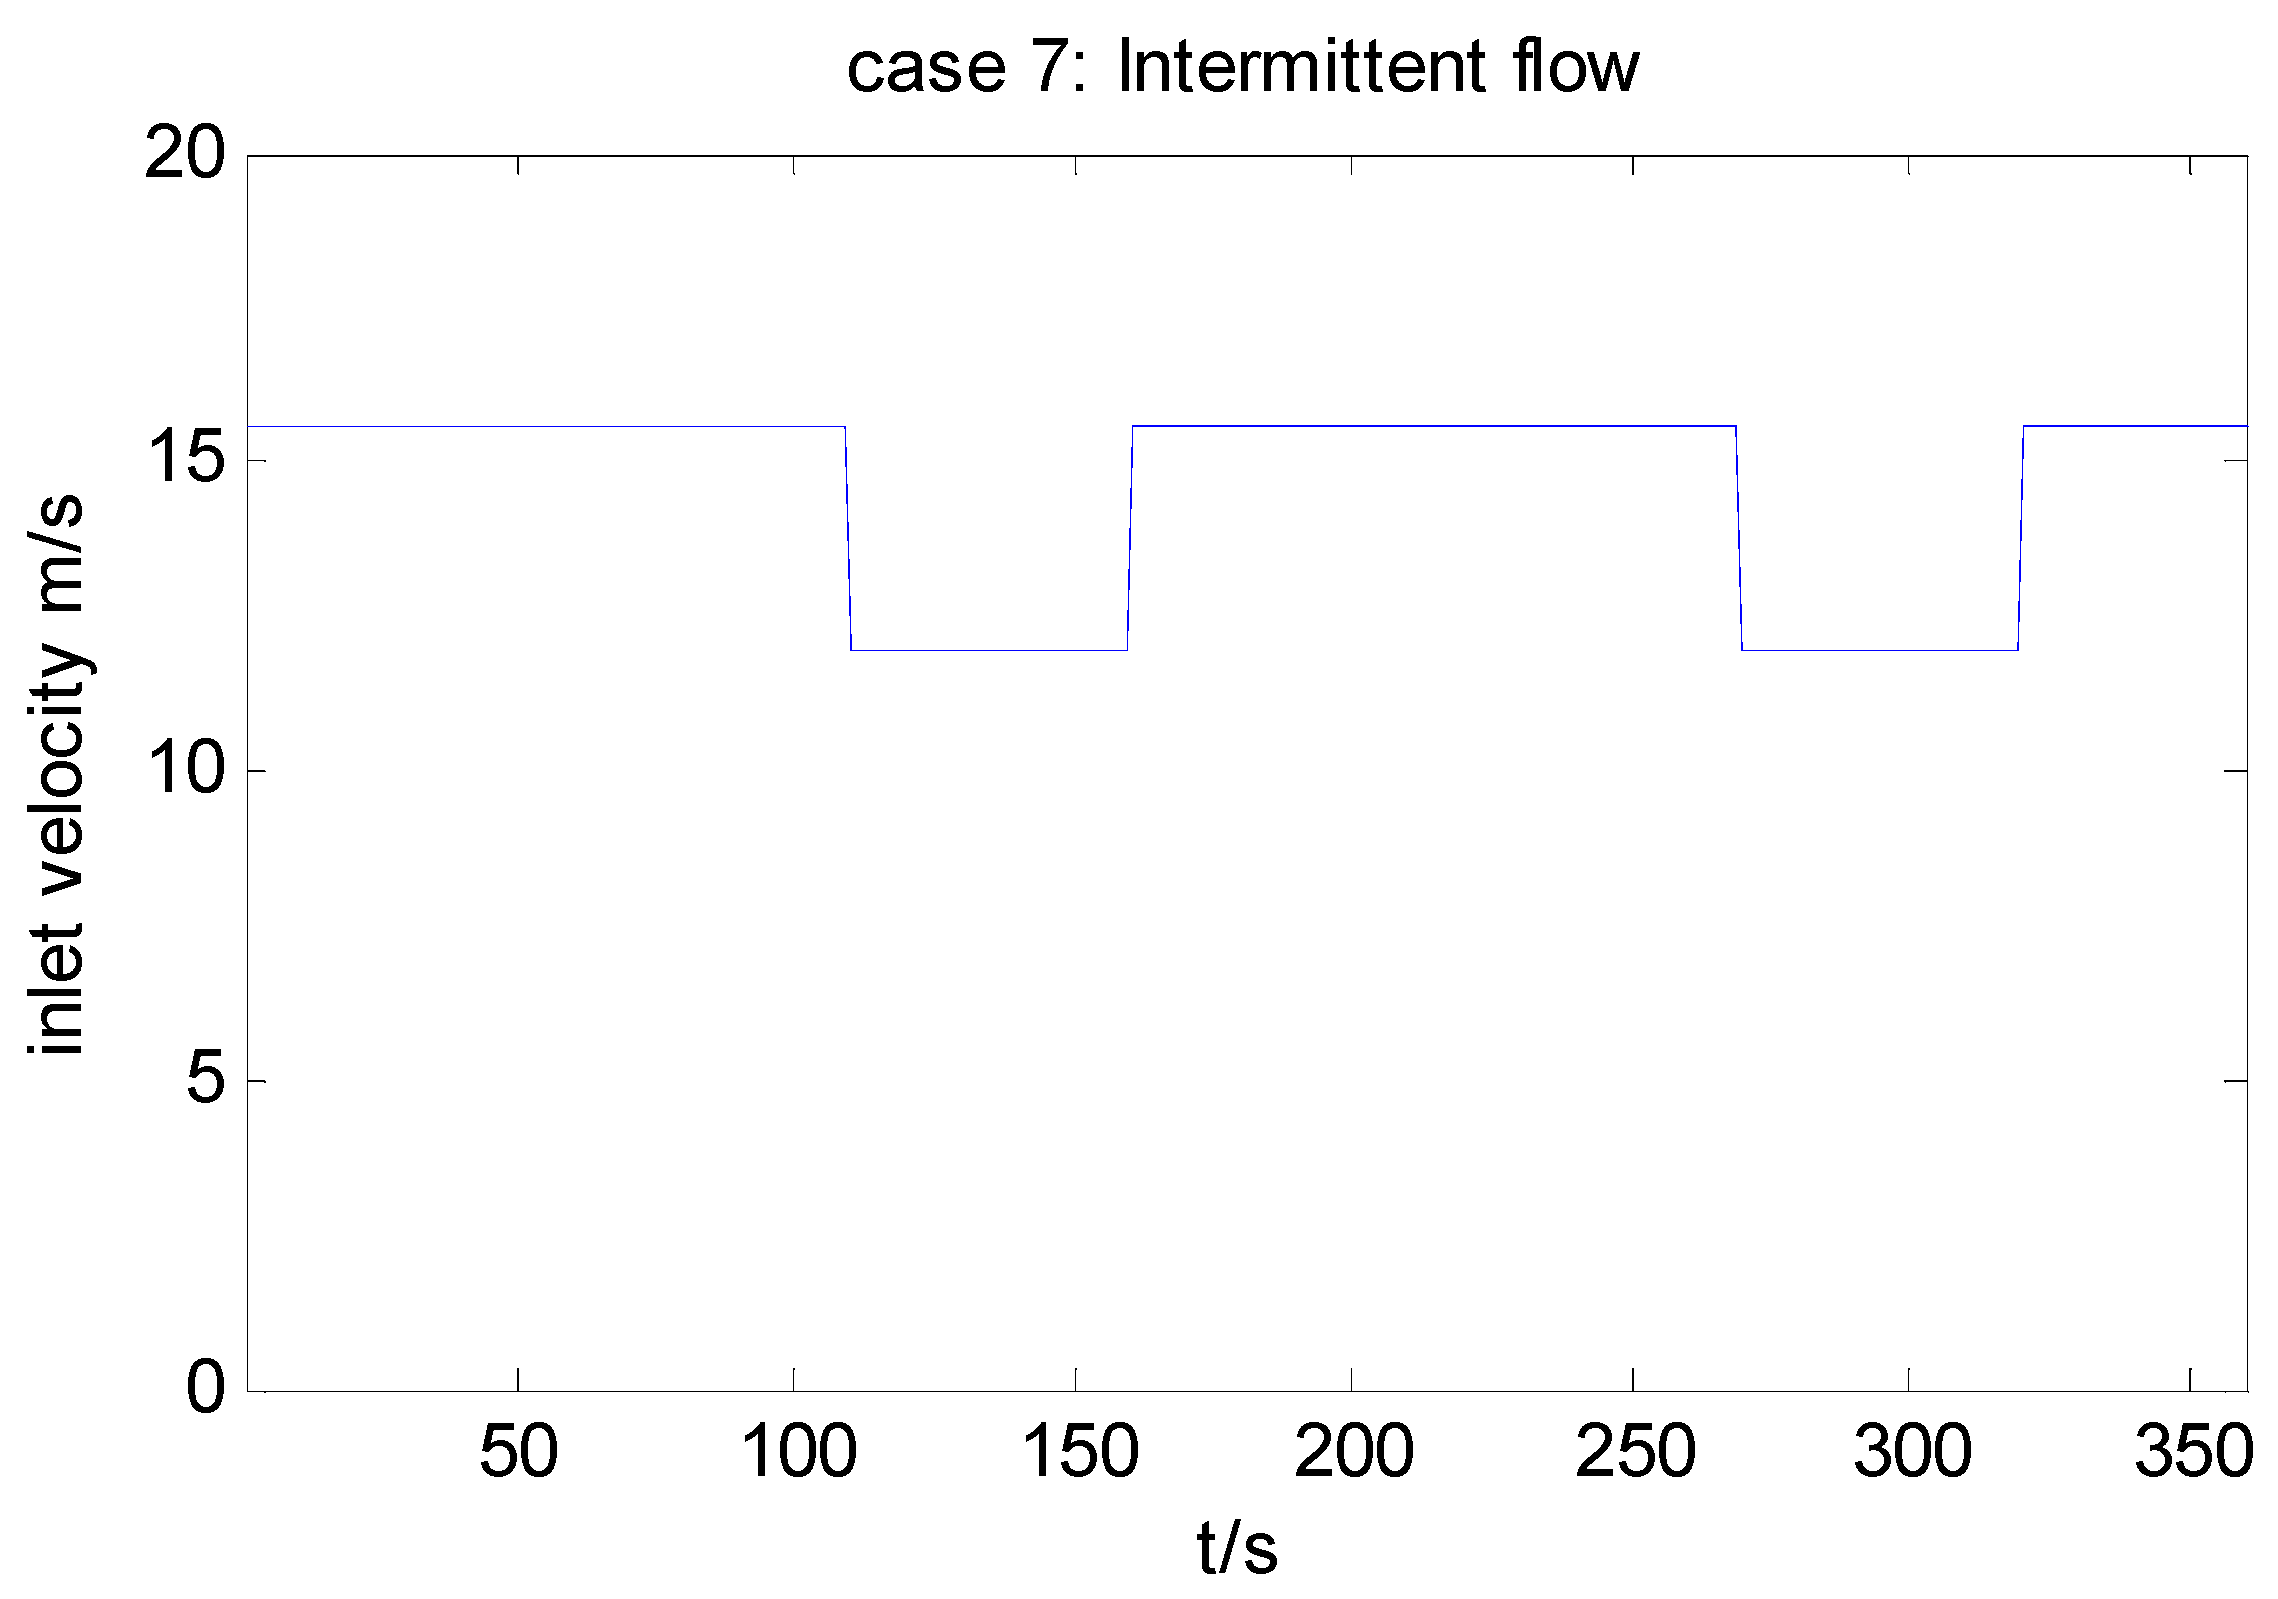
Figure 14.
Comparison of simulation results and field measured data.


Table 1.
Average error for four turbulence models with measured data.
| Measurement Point | K-Epsilon (Error, %) | K-Omega (Error, %) | Spalart-Allmaras (Error, %) | RSM (Error, %) |
|---|---|---|---|---|
| 1 | 48.5 | 76.8 | 54.5 | 53.6 |
| 2 | 40.2 | 56.8 | 43.5 | 42.3 |
| 3 | 35.7 | 52.7 | 51.2 | 35.8 |
| 4 | 56.8 | 48.3 | 52.3 | 68.2 |
| R2 | 0.946 | 0.921 | 0.904 | 0.857 |
Table 2.
Details for mesh generation of computational domains.
| Mesh Amount | Interval of Laneway (m) | Interval of Windpipes (m) | Elapsed Time (s) |
|---|---|---|---|
| 4.0 × 10⁵ | 0.2 | 0.1 | 56 |
| 1.8 × 10⁶ | 0.15 | 0.05 | 79 |
| 3.4 × 10⁶ | 0.1 | 0.05 | 162 |
Table 3.
Parameters for discrete phase model (DPM) models.
| Parameters | Setting |
|---|---|
| Diameter distribution | Rosin-rammler |
| Diameter range (m) | 2 × 10⁻⁶ to 1 × 10⁻⁴ |
| Initial velocity of coal dust (m/s) | 1 |
| Air density (kg/m3) | 1.225 |
| Dust density (kg/m3) | 1200 |
| Turbulent viscosity (m2/s) | 1.7894 × 10⁻⁵ |
| Turbulent kinetic energy | 1.3 |
| The relative intensity of turbulence | 5.1 |
| Flow rate of the coal dust (kg/s) | 0.0042 |
| Convergence criteria | 10 × 10−6 |
| Initialization method | Hybrid Initialization |
| Injection type | surface |
| Calculation steps for steady simulation | 3000 |
| Number of time steps for transient simulation | 3600 |
| Time step size (s) | 0.1 |
| Max iterations/time step | 20 |
Table 4.
Energy savings for various ventilation patterns in 2 min.
| Cases | Average Pressure Difference (Pa) | Average Volumetric Flow Rate (m3/s) | Average Fan Power (Watt) | Energy Saving (%) |
|---|---|---|---|---|
| Case 1 | 149.1 | 7.82 | 1165.96 | 0 |
| Case 2 | 193.2 | 6.93 | 848.85 | 27.20 |
| Case 3 | 193.2 | 6.93 | 848.85 | 27.20 |
| Case 4 | 134.6 | 7.43 | 1005.13 | 13.80 |
| Case 5 | 108.5 | 6.63 | 743.15 | 36.26 |
| Case 6 | 159.28 | 8.04 | 1319.15 | −13.14 |
Table 5.
Dust concentration standards in Tianchen coal mine.
| Free Silica Dioxide Content of Dust (%) | Maximum Allowable Total Dust Concentration (mg/m3) |
|---|---|
| <5 | 5 |
| 5~10 | 2.5 |
| 10~30 | 1.0 |
| 30~50 | 0.5 |
| >50 | 0.2 |
Table 6.
Specifications of the dust monitor (type GCG1000).
| Specifications | Range |
|---|---|
| Measurement range | 0–1000 mg/m3 |
| Relative error | 18 L/min ± 2.5% |
| Working voltage | 12–24 VDC 1 |
| Working current | ≤250 mA |
| Operating temperature | 0–40 °C |
| Relative humidity | ≤98% |
1 VDC: Voltage Direct Current.
Table 7.
Energy saving for case 7 in 2 min.
| Average Pressure Difference (Pa) | Average Volumetric Flow Rate (m3/s) | Average Fan Power (Watt) | Energy Saving (%) |
|---|---|---|---|
| 132.18 | 7.32 | 989.79 | 15.11 |
© 2017 by the authors. Licensee MDPI, Basel, Switzerland. This article is an open access article distributed under the terms and conditions of the Creative Commons Attribution (CC BY) license (http://creativecommons.org/licenses/by/4.0/).
Share and Cite
MDPI and ACS Style
Liu, H.; Wu, X.; Mao, S.; Li, M.; Yue, J. A Time Varying Ventilation and Dust Control Strategy Based on the Temporospatial Characteristics of Dust Dispersion. Minerals 2017, 7, 59. https://doi.org/10.3390/min7040059
AMA Style
Liu H, Wu X, Mao S, Li M, Yue J. A Time Varying Ventilation and Dust Control Strategy Based on the Temporospatial Characteristics of Dust Dispersion. Minerals. 2017; 7(4):59. https://doi.org/10.3390/min7040059
Chicago/Turabian StyleLiu, Hui, Xiaohu Wu, Shanjun Mao, Mei Li, and Jun Yue. 2017. "A Time Varying Ventilation and Dust Control Strategy Based on the Temporospatial Characteristics of Dust Dispersion" Minerals 7, no. 4: 59. https://doi.org/10.3390/min7040059
Note that from the first issue of 2016, this journal uses article numbers instead of page numbers. See further details here.