Re-Equilibration Processes in Fluid Inclusion Assemblages

Resource Mineralogy, Department of Applied Geological Sciences and Geophysics, Montanuniversity Leoben, 8700 Leoben, Austria
Minerals 2017, 7(7), 117; https://doi.org/10.3390/min7070117
Submission received: 16 June 2017
/
Revised: 4 July 2017
/
Accepted: 5 July 2017
/
Published: 7 July 2017
(This article belongs to the Special Issue Fluid Inclusions: Study Methods, Applications and Case Histories)
Abstract
:Post-entrapment modifications reduce the reliability of fluid inclusions to determine trapping conditions in rock. Processes that may modify fluid inclusion properties are experimentally identified in this study using synthetic fluid inclusions in quartz with a well-defined composition and density. Modifications are characterized with microthermometry (homogenization and dissolution temperatures) and Raman-spectroscopy in binary fluid systems H2O-D2O and H2O-NaCl. Three distinct processes were identified in this study: (1) diffusion of H2O and D2O; (2) crystal-recovery, expulsion of H2O and accumulation of quartz in inclusions (preferential H2O loss); (3) irreversible total volume increase at the α-β quartz transition. Diffusion is caused by H2O fugacity gradients and can be modelled according to classical diffusion models. The variability of re-equilibrated properties in fluid inclusion assemblages depends on time, temperature, diffusion distance and the size of fluid inclusions. Negative pressure gradients (internal under-pressure) induce the crystal-recovery process, in which H2O is preferentially extracted from inclusions that simultaneously shrink by the inward growth of quartz. This process reduces the H2O concentration and increases the fluid density by total volume loss. Temperature and time are also controlling factors of this process, which is able to transport H2O against fugacity gradients.
1. Introduction
Equilibrium thermodynamics is an important tool within geosciences. For example, the stability of minerals is a fundamental concept in metamorphic processes, and it defines the metamorphic grade of the rock [1]. The mobility of matter is a factor that has a major impact on establishing equilibrium conditions. Stable isotopes’ distribution is described by equilibrium thermodynamics [2], whereas the tendency of isotopes to distribute equally in a system by diffusion seriously affects the age determinations with radiogenic isotopes within rock and single grains [3]. The “closure temperature” of specific minerals defines the limit of the efficient diffusion of radiogenic isotopes, and it constrains metamorphic cooling history estimations.
The concept of “closure temperature” can also be applied to fluid inclusion research. A hypothesis of major importance in fluid inclusion research is that fluid inclusions do not change in total volume and mass contents after their formation [4]. This hypothesis can be experimentally verified or falsified by studying re-equilibration possibilities for specific external conditions [5,6]. The main challenge is the identification and quantification of the modifications of fluid inclusion properties at specific temperatures, pressures and chemistries of external systems, such as pore fluid surrounding grains that contain fluid inclusions. The efficiency of modification processes may be defined by temperature limits, i.e., the concept of “closure temperature”, which may be identified for a variety of host minerals. The knowledge of re-equilibration processes may classify specific rock as reliable material (e.g., sedimentary rock), for which the trapping conditions of fluid inclusions can be directly obtained from its fluid properties, and unreliable material (e.g., metamorphic rock), in which the fluid properties were modified after entrapment. It must be noted that metamorphic and igneous rock may also be classified as “reliable”, because the interplay of the original fluid properties and changes in the geological environment may not always result in re-equilibration processes.
The isolated character of fluid inclusions highly depends on the properties of the host crystal. Gradients in the fluid component concentration (fugacities) between fluid inclusions and pore fluid surrounding the host crystal may be driving forces for diffusion according to classical diffusion theories [7]. The diffusion from and to fluid inclusions is only possible if the host crystal is able to “dissolve” fluid components in the crystal lattice or at interstitial lattice positions (e.g., [8] and the references therein). Crystallographic modifications of the host crystal can also have a major effect on the properties of fluid inclusions. Phase changes of the host mineral, such as the α-β quartz transition, may affect the properties of fluid inclusions [9]. Deformation processes under metamorphic conditions, such as recrystallization and grain boundary migration, may completely anneal the grains and result in the loss of the majority of the fluid inclusions.
The present study summarizes, scrutinizes and re-examines re-equilibration experiments with synthetic fluid inclusions in natural quartz performed at the Montanuniversity Leoben (Austria) between 2010 and 2015 [10,11,12]. The results of these studies illustrate a variety of processes that may modify fluid inclusion properties. The experiments were designed to take place at constant temperatures and nearly constant pressures, i.e., the internal pressure within fluid inclusions was intended to be equal to the external pressure of the host crystal. Modifications of fluid properties in inclusions were expected to be caused only by diffusion processes and the phase transition of the host mineral, in absence of pressure-gradients and deformation, which may have triggered additional re-equilibration processes.
2. Hydrothermal Laboratory
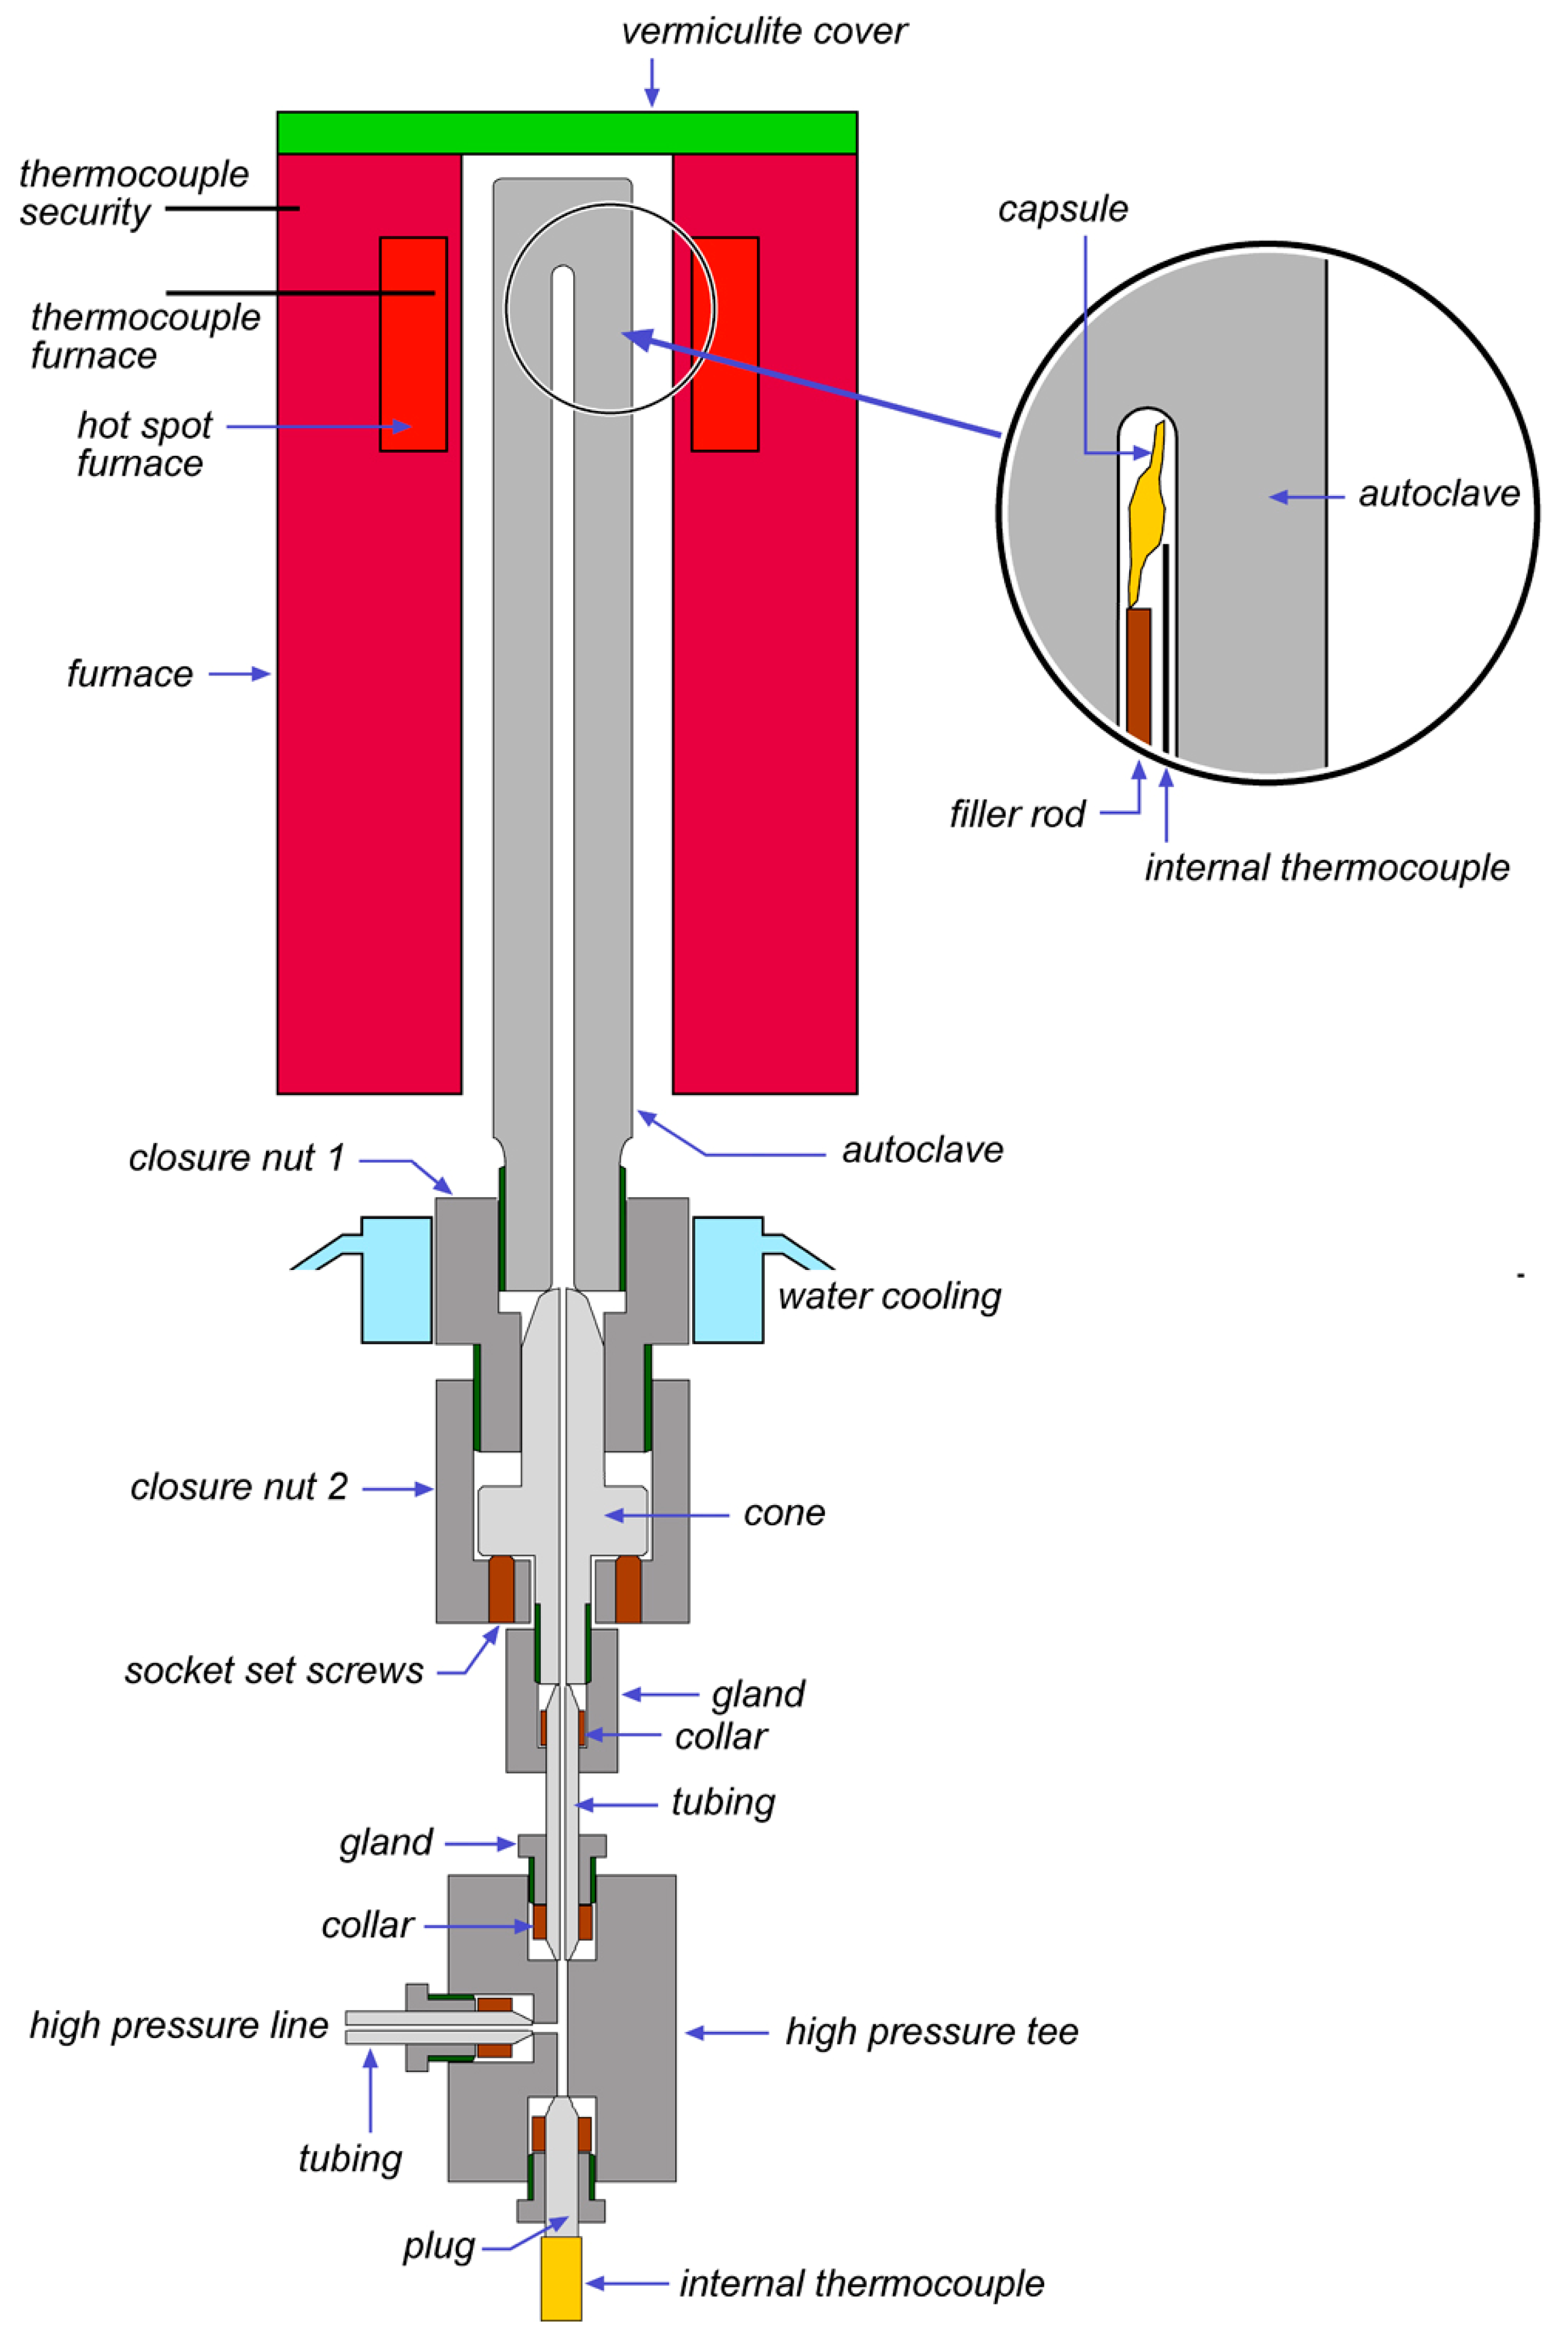
The conditions of experiments to synthesize fluid inclusions must be controlled as precisely as possible in order to detect simple cause-effect pairs. For example, fluid inclusions with a specific density form in micro-cracks by crystal healing processes at high temperature and pressure, and the density of the entrapped fluid is exactly determined by the experimental conditions. The robust design of the experimental setup at the hydrothermal laboratory of the Montanuniversity Leoben, Austria (Figure 1) allows highly precise experimental runs at high temperature and pressure, with a maximum of 1 GPa confining pressure and 700 °C. The device is constructed with 10 Nimonic IOS/René 41 autoclaves (Ni–Cr alloy) in a vertical position, with a cold-seal system [12,13]. Argon is used as the pressure medium, which is compressed by a high-pressure pump system (Sitec). Pressure transducers register pressure with a variation of 2 MPa during the experiments. The transducers are calibrated up to 700 MPa with a Heise dial gauge with an accuracy of 0.015% of reading. The sample (host crystal) that is used to synthesize fluid inclusions is enclosed in a Au-capsule together with a fluid phase. The pressure inside the Au-capsule is assumed to be equal to the argon pressure in the pressure line.
External furnaces induced the appropriate temperature conditions. The temperature was measured by an internal thermocouple (NiCr–Ni, Type “K”) directly attached to the Au-capsule that allowed direct monitoring and recording of the sample temperature with an uncertainty of 0.1 °C. The temperature during the experimental run was stabilized within 2 °C. The internal thermocouple allows the possibility to load and unload experiments along isochoric temperature-pressure paths, i.e., conditions with a constant fluid density. It must be noted that isochoric temperature-pressure paths cannot be obtained with an external thermocouple that is attached to the outside of the autoclave.
Experimental confining argon-pressure and temperature were continuously logged by a computerized system. Each experiment in the work of Doppler et al. [10], Doppler and Bakker [11] and Bakker and Doppler [12], both the synthesis and the complementary re-equilibration, was intended to be performed exclusively under identical conditions without any gradients in temperature and initial pressure or deviatoric stress. A gradient in concentration (i.e., fugacity) of specific fluid components between fluid inclusions and a pore fluid surrounding the host grain was intended to be the main driving force for modifications of the fluid properties in apparently isolated inclusions. Pressure gradients were avoided during loading and unloading of the experiments due to the isochoric T-p path.
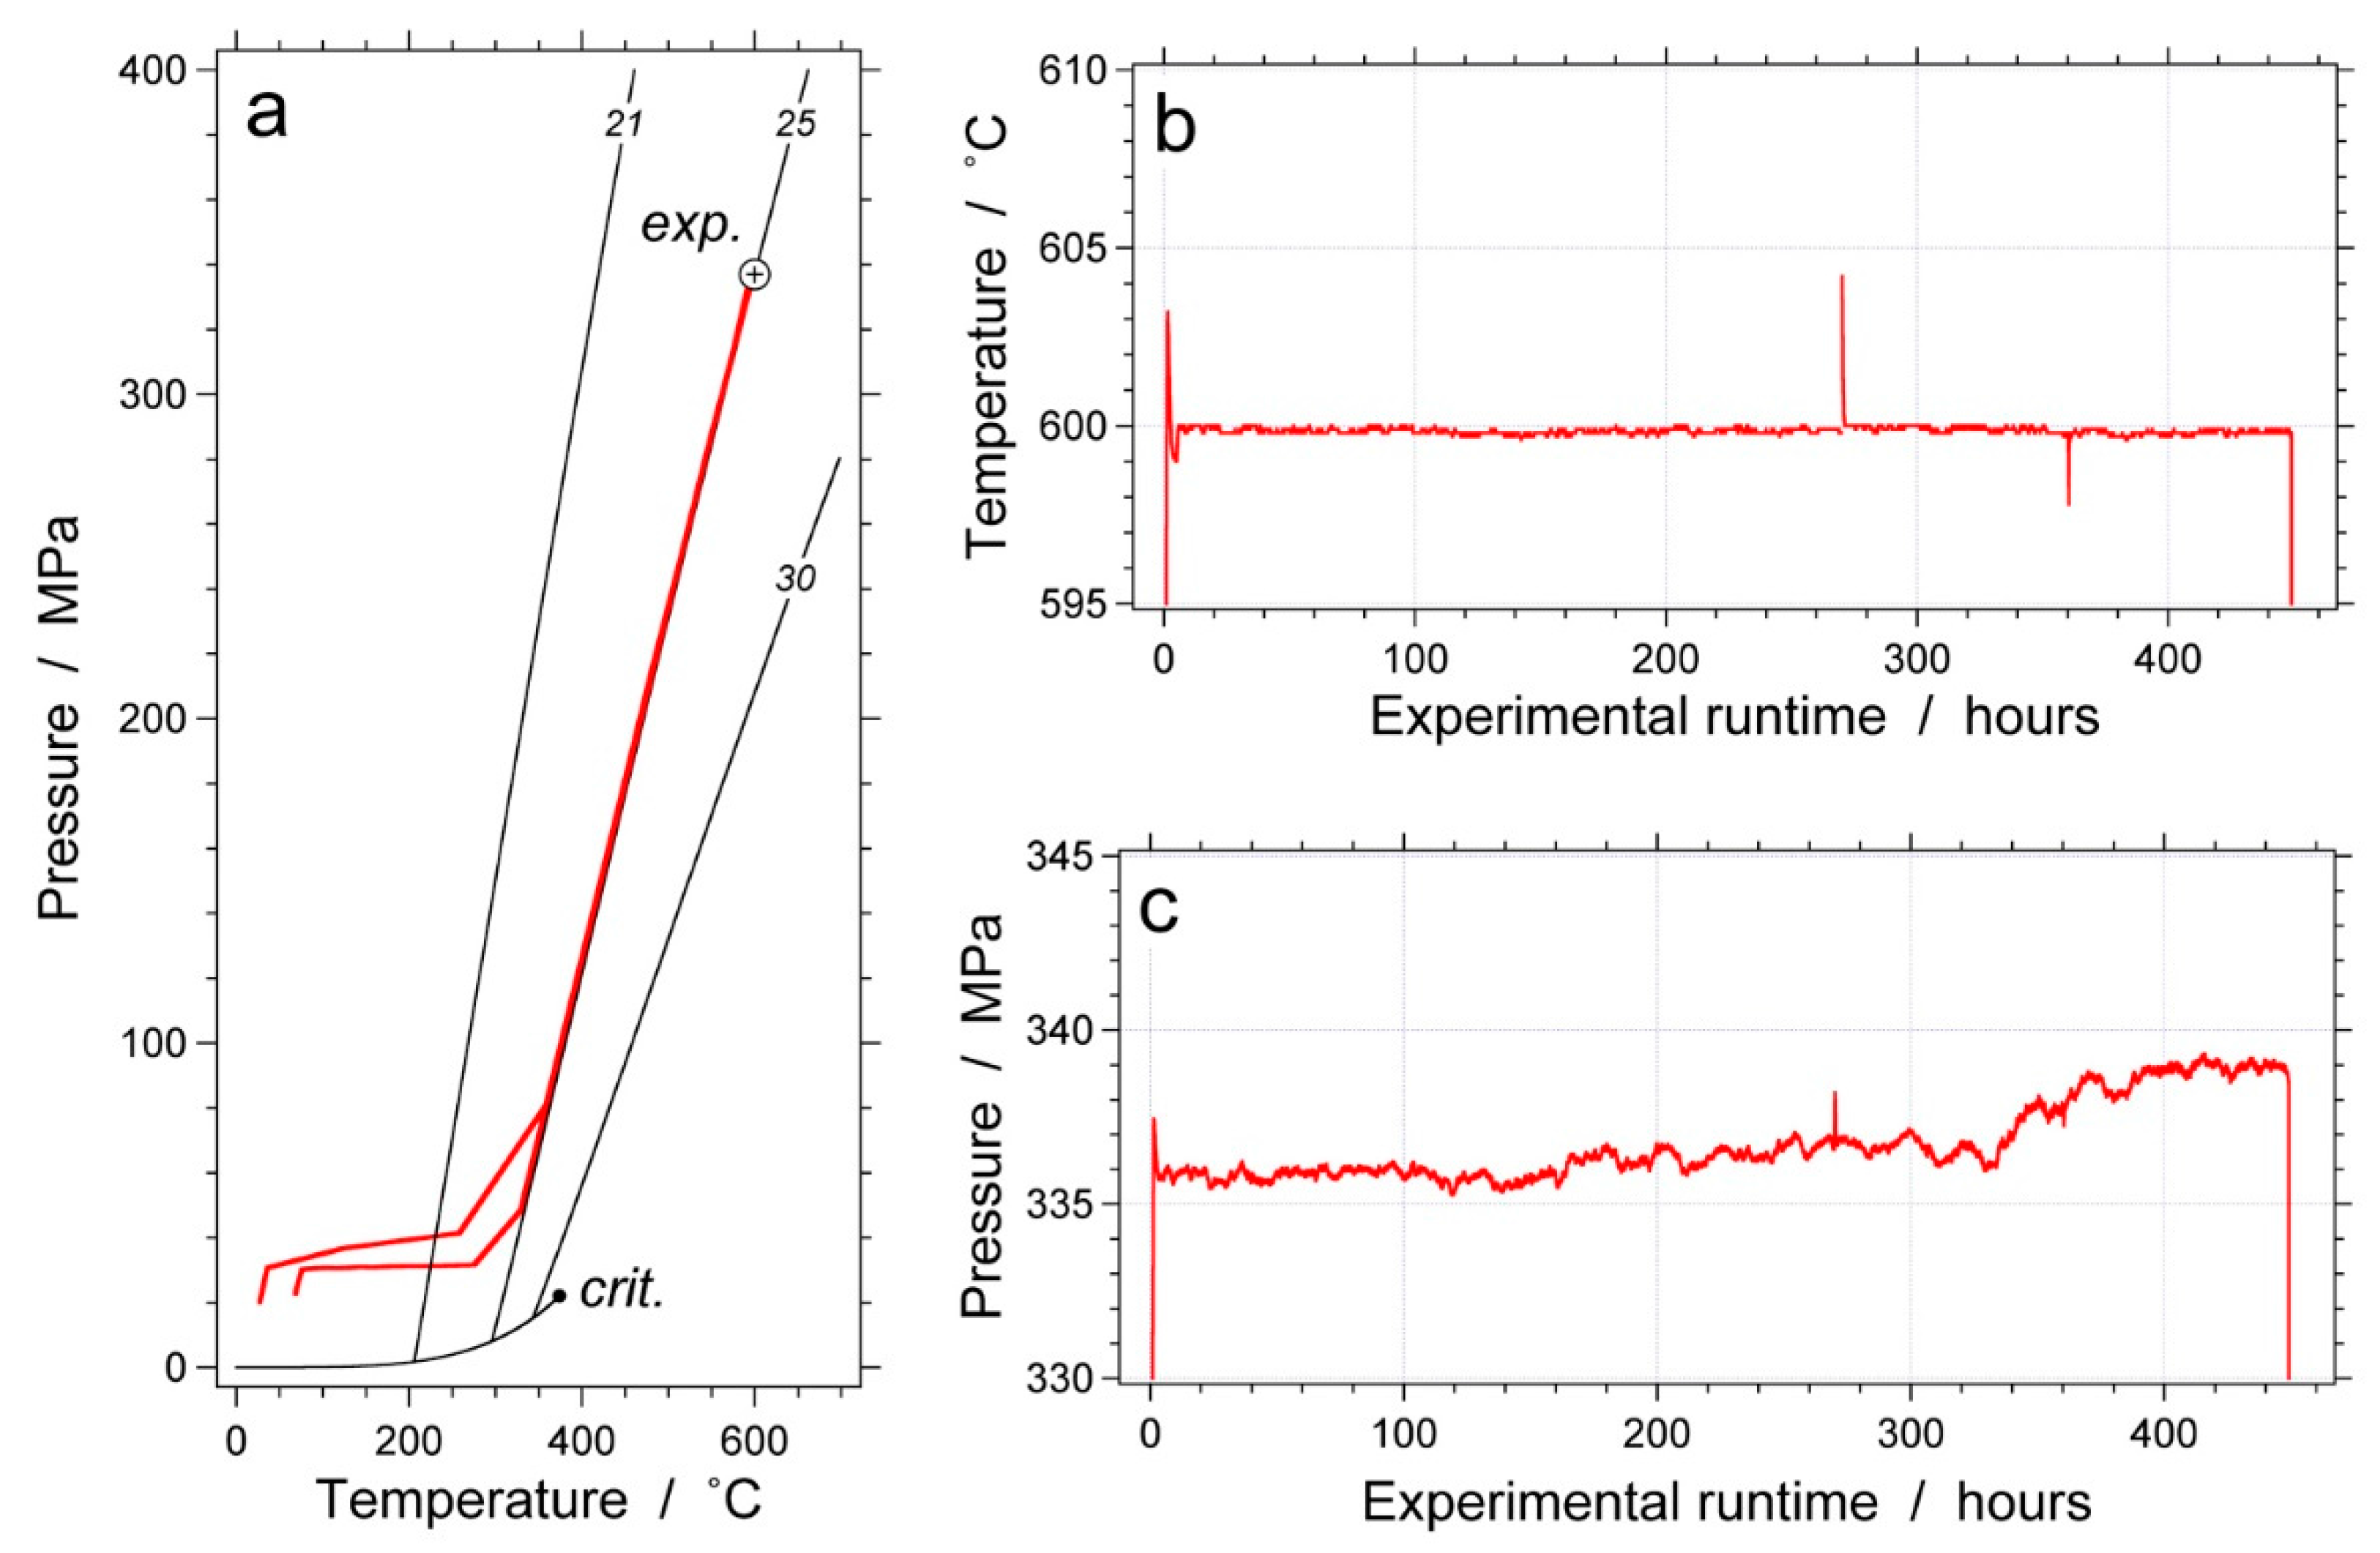
An example of the log-file of an experimental run is illustrated in Figure 2. At relatively low temperatures, the pressure was constant at approximately 30–35 MPa (Figure 2a). The temperature-pressure control along the isochore of 25 cm3/mol (pure H2O) started at about 300 °C. The experimental conditions at 600 °C and 337 MPa were reached along this isochore, and the experiment ended after 450 h (Figure 2b,c). The temperature varied between 599.7 and 600.0 °C and the pressure between 335.5 and 339 MPa during the experiment. These minor variations in temperature and in pressure illustrate that experimental conditions, from the start of loading to the end of unloading, are well controlled by the experimental setup in our laboratory.
The equality of the argon pressure in the pressure line and the hydrothermal confining fluid pressure within Au-capsules is obtained from the flexibility of these capsules at high temperatures and pressures, which allows a total volume adjustment according to the loaded amount of fluid. Each capsule will have a maximum amount of fluid that can be loaded according to its size, and this maximum amount is defined by the experimental temperature and pressure. For example, an Au-capsule with a maximum total volume 0.2 cm3 according to its length and inner diameter contains a quartz core with a total volume of 0.05 cm3; therefore, 0.15 cm3 can be occupied by a fluid phase. The experimental conditions define a molar volume of this fluid at 25 cm3/mol. Consequently, we can load maximally 6 mmole of fluid in this capsule. If less fluid is loaded, the Au-capsule reduces its total volume by contraction under experimental conditions.
3. Fluid Inclusion Synthesis
Semi-precious natural Brazilian quartz (inclusion-free) is used as the host mineral to synthesize fluid inclusions according to the method of crack-healing [14,15]. Rods of quartz with an approximate length of 10 mm and a diameter of 2.75 mm are drilled parallel to the c-axis of the quartz crystal. The quartz rods are partially cracked by a thermal shock after heating to 400 °C. A cracked quartz rod and a specific fluid are loaded in a Au-capsule (3 mm in diameter) that is arc-welded on both sides. The fluid composition, average experimental pressure and temperature and duration are shown in Table 1. An experimental runtime of approximately 19 days (varying between 454.3 and 462.4 h) is selected to synthesize sufficient fluid inclusions for the analytical procedures. Detailed descriptions of the synthesis experiments are given by Doppler et al. [10], Doppler and Bakker [11] and Bakker and Doppler [12].
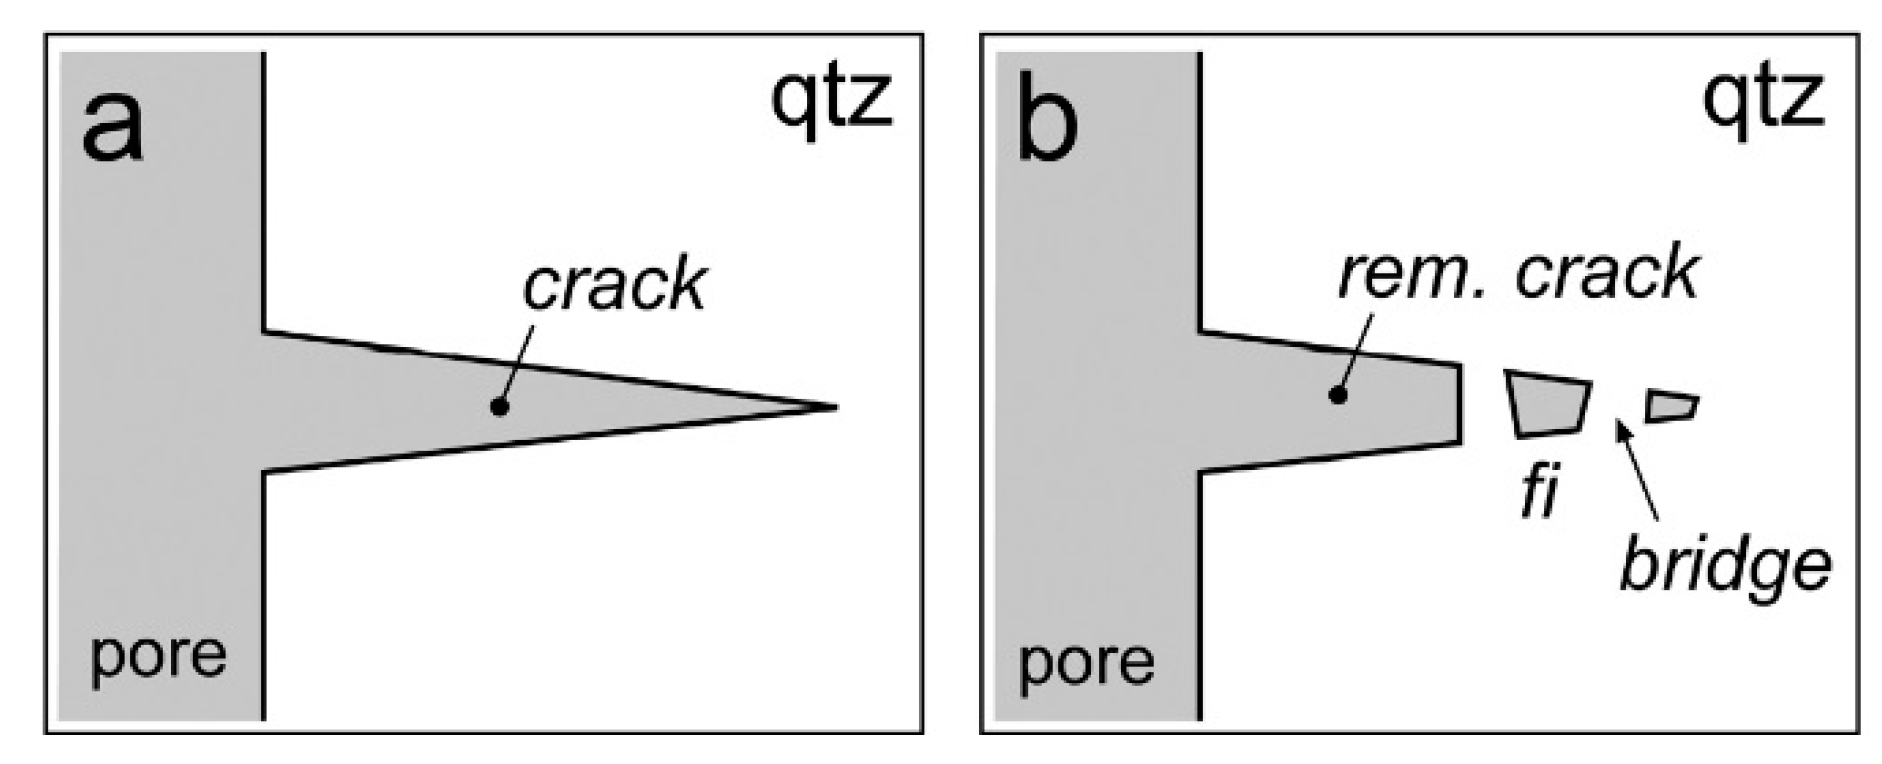
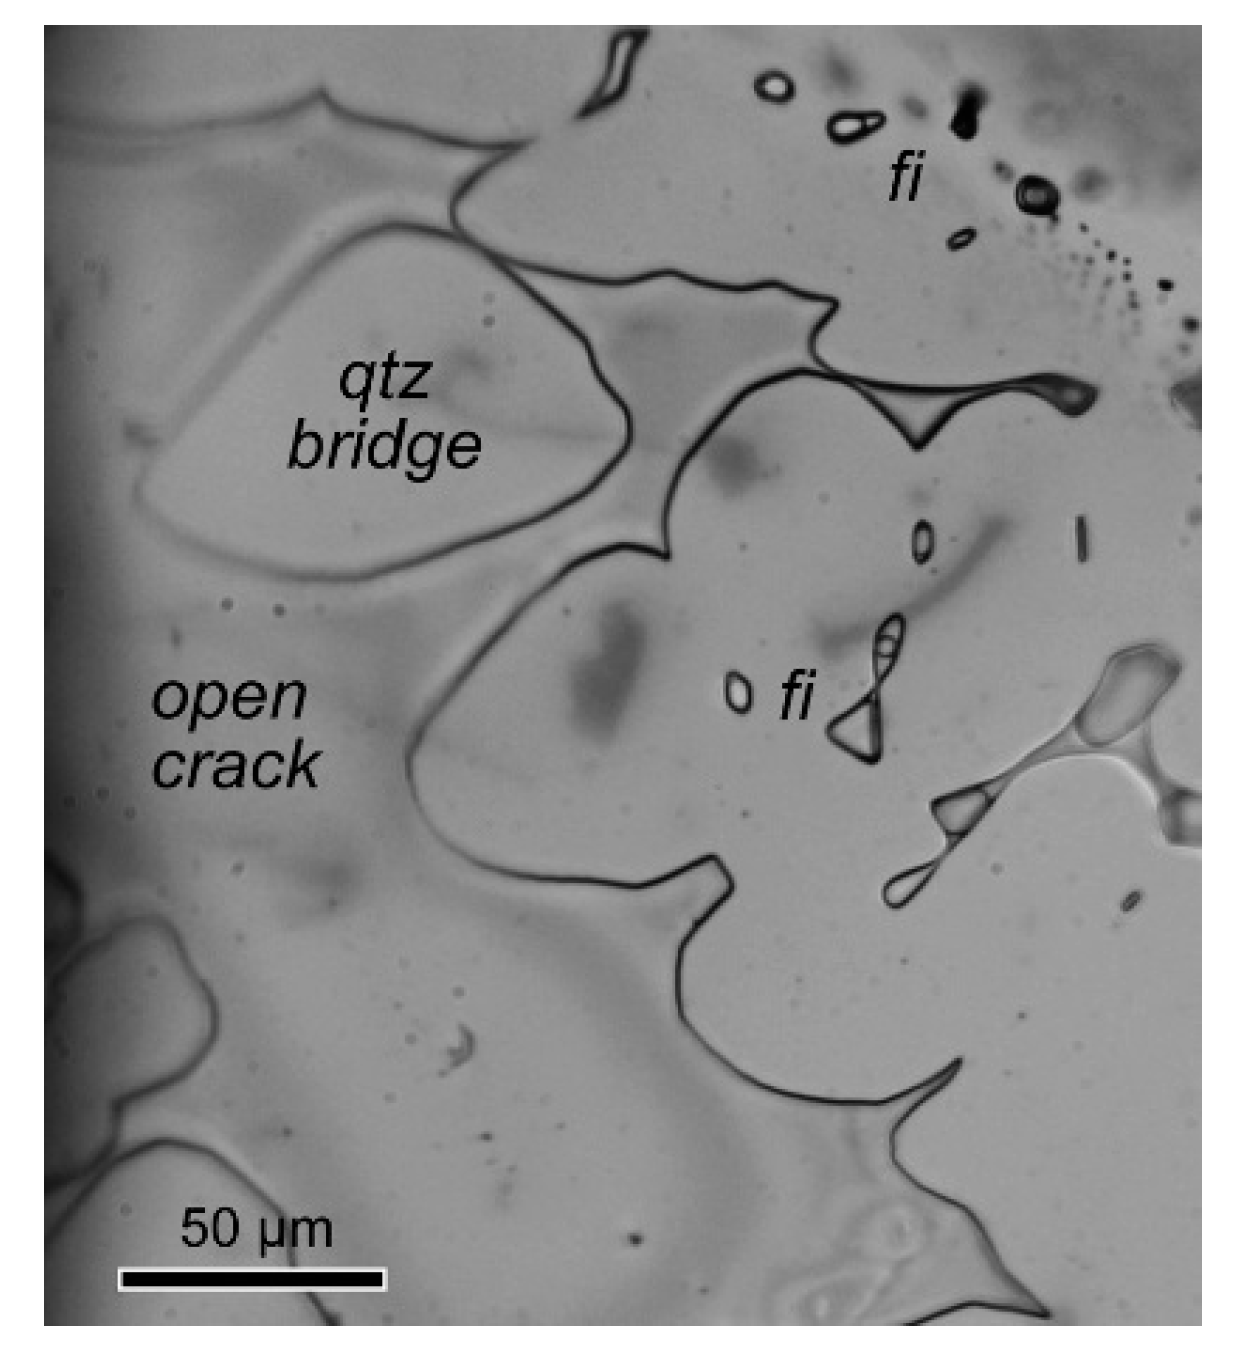
Crack healing of quartz is an efficient process to reduce surface energy at the experimental temperatures by diffusional transport of dissolved SiO2 in the fluid phase [15,16]. Sharply-defined crack tips become blunted, healed curvilinear quartz bridges, and river patterns surrounded by open fluid-filled cracks form, as well as fluid-filled tubes (fluid inclusions) surrounded by regions of fully-healed quartz appear (Figure 3 and Figure 4). The initial surface roughness of the cracks defines the geometries of the fluid inclusions.
Homogeneous fluid inclusion assemblages were formed in each healed crack during our experiments at high temperature and pressure, each inclusion with a fluid density corresponding to the experimental conditions. Detailed experimental data are available as supplementary materials from Doppler et al. [10], Doppler and Bakker [11] and Bakker and Doppler [12].
The theoretical molar volumes of fluid inclusions from these experiments are calculated with the equations of state from Haar et al. [17] for pure H2O and Driesner [18] for H2O-NaCl mixtures in the experimental conditions (Table 2). Fugacities in H2O-NaCl solutions are calculated with the equation of Anderko and Pitzer [19]. The homogenization temperatures corresponding to these molar volumes have to be corrected according to the volumetric properties of the host crystal [20] (Table 2). The contraction or expansion of quartz along a fluid isochore causes the modification of the inclusion fluid density, resulting in slightly lower homogenization temperatures (up to −5.5 °C).
The measured homogenization temperatures of the fluid inclusion assemblages reflect these theoretical values in experiment GMR-004, but are significantly higher in the other experiments (Table 2). The largest deviations are observed in the experiments performed at lower temperatures (GMR-006, GMR-007). Higher homogenization temperatures correspond to higher molar volume values (or lower densities), which can be obtained if the fluid pressure inside the Au-capsule is lower than the argon pressure in the pressure line. A lower fluid pressure in Au-capsules is caused by incomplete adjustment of its total volume at higher temperatures. Irregular contractions of the capsule walls and a relatively low degree of fluid filling of the capsules may result in lower internal fluid pressures.
The spread in measured homogenization temperatures in fluid inclusion assemblages (the range is given in Table 2) is larger than the expected variation as calculated from the minor variation in the experimental conditions (corrected values Th in Table 2). Although the experimental setup was optimized to obtain a single type of fluid inclusion, irregularities in crack-healing processes during the experiment, loading and unloading must have resulted in a minor variation in fluid densities that exceeds the calculated variation from the ranges of experimental temperatures and pressures (Table 1).
4. Re-Equilibration in the D2O Environment
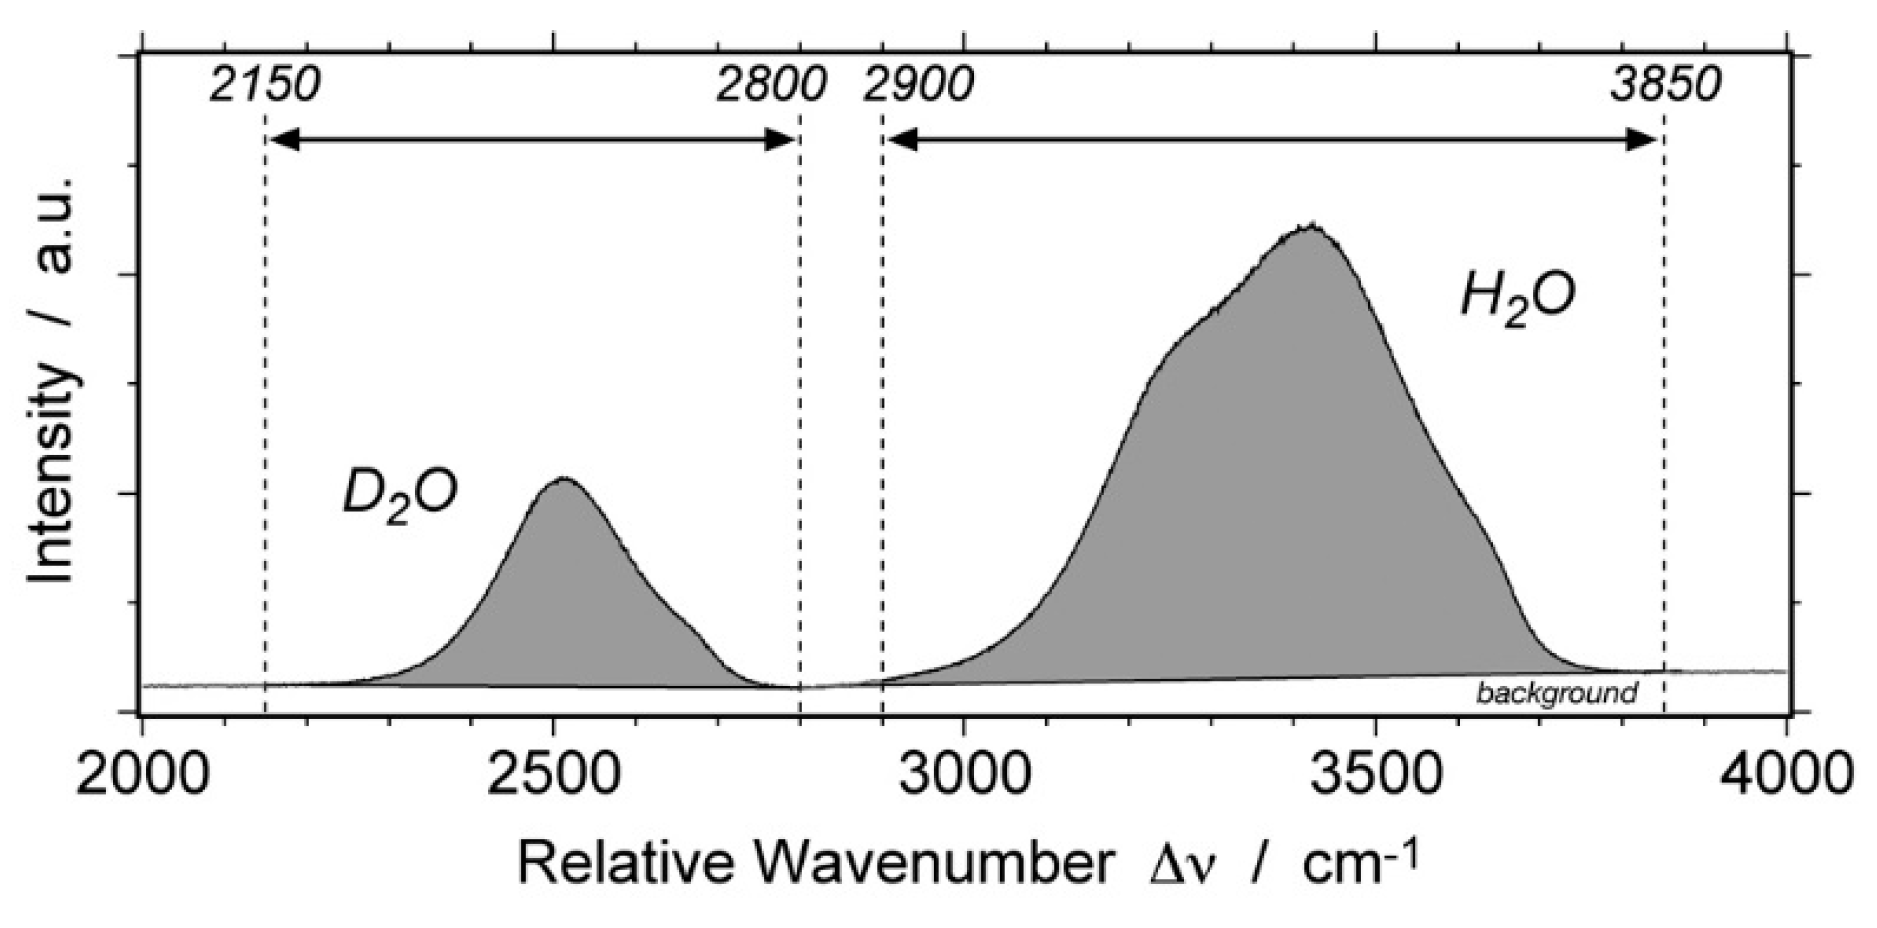
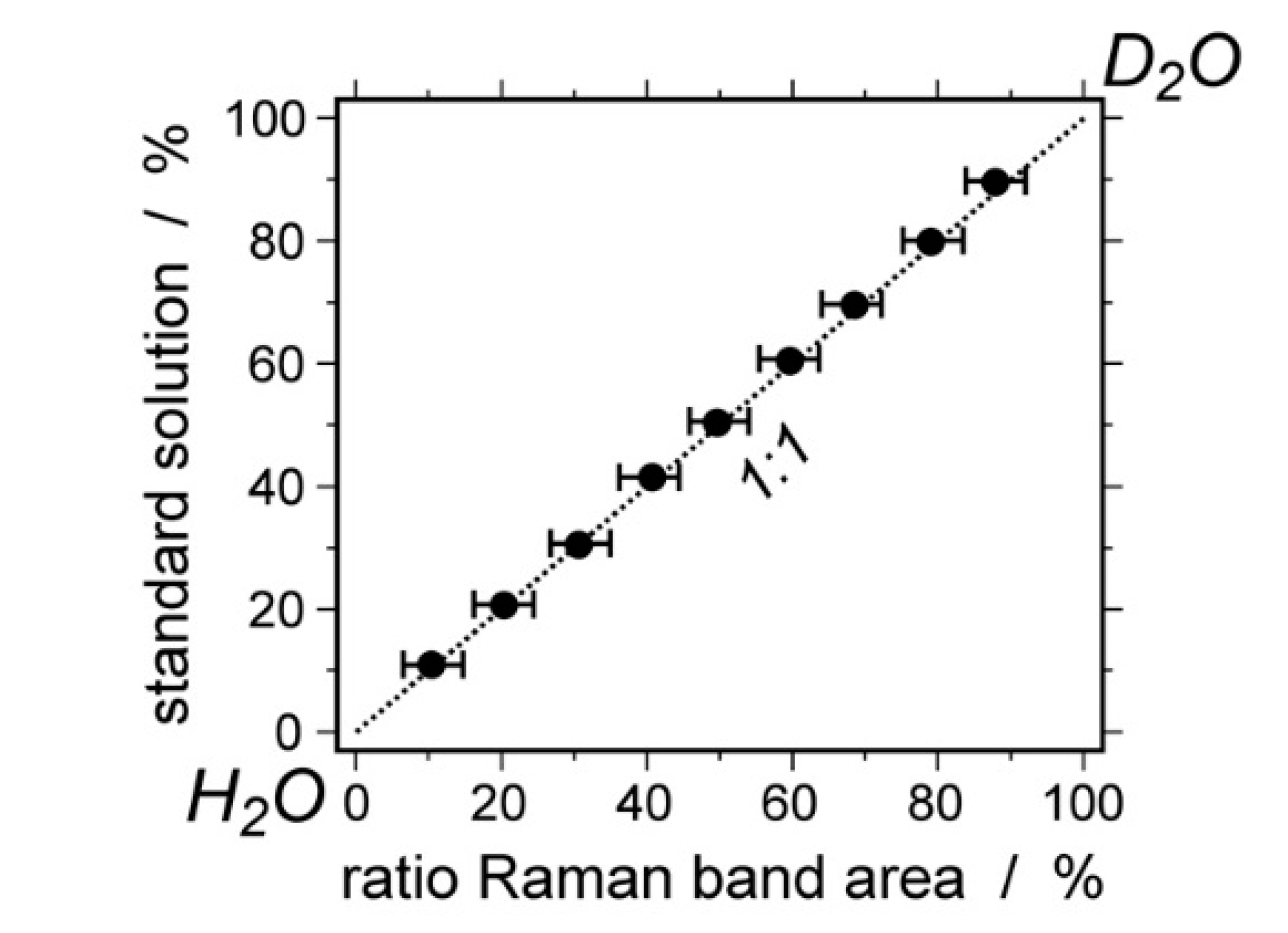
The re-equilibration experiments [10,11,12] were intended to be performed at the same temperature and pressure conditions with a different external fluid: either pure H2O or pure D2O. The fluid p-T-V properties of D2O are calculated with the equation of state from Hill et al. [21]. D2O is selected for this external fluid because it has similar properties as H2O and can be used as a tracer, which is easily detected in fluid inclusions by Raman-spectroscopy [22] and microthermometry. Raman spectra of both H2O and D2O are broad bands within a range of wavenumbers that do not interfere (Figure 5), 2900–3800 and 2100–2800 cm−1, respectively [23]. A simple formula based on Placzek’s polarizability theory [24,25] can then be applied to derive a quantitative analysis in molar fractions of H2O and D2O in fluid inclusions. This formula was confirmed with standard solutions of known variable H2O/D2O ratios by Baumgartner et al. [22] and results in a simple relationship between molar fractions (Xrel) and Raman-area fractions, Figure 6 and Equation (1):
where a is the Raman band area (intensity × relative wavenumber). Under ambient conditions, mixtures of H2O and D2O are ideal, and both species have similar properties; therefore, the Raman cross-sections of H2O and D2O do not need to be considered in this purely empirical relationship. The relative D2O content of the re-equilibrated synthetic fluid inclusion can be directly calculated with Equation (1).
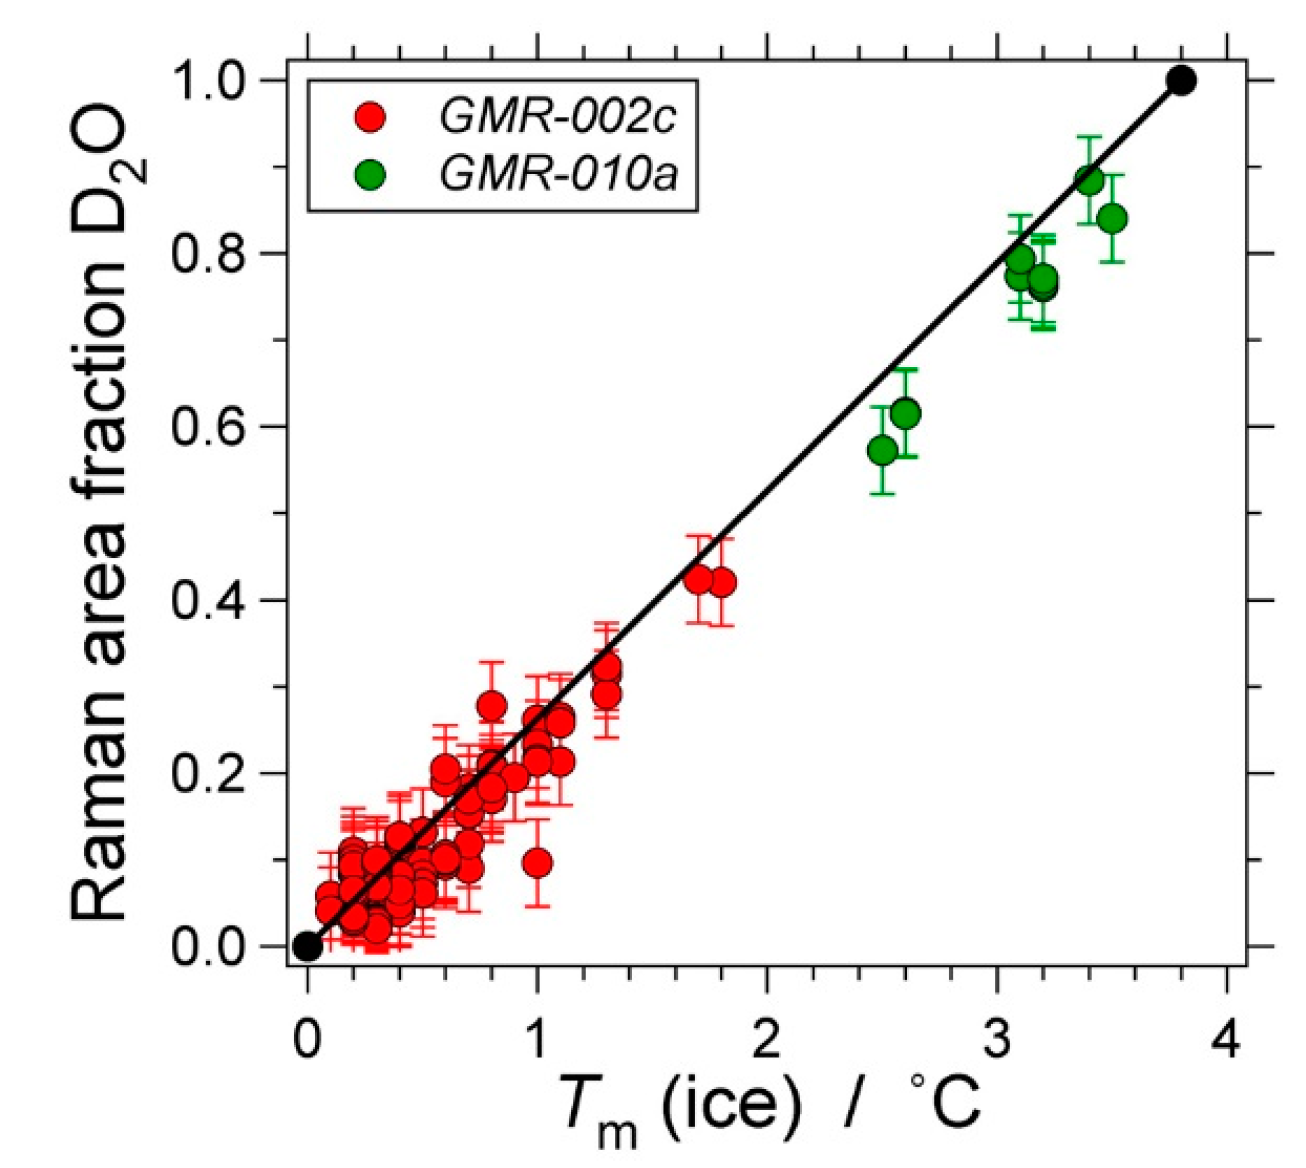
Comparison of this D2O composition with corresponding melting temperatures Tm (SV→LV) of D2O/H2O mixtures in fluid inclusions also reveals an ideal mixing behavior (Figure 7). The melting temperature of pure H2O is 0.0 °C, whereas pure D2O is +3.8 °C. According to the ideal mixing properties, intermediate Tm values can be used to determine relative amounts of H2O and D2O, Equation (2):
where Tm is the melting temperature in °C of a D2O-H2O mixture in a specific fluid inclusion (fi), and ΔTmpure is 3.8 °C, i.e., the difference in melting temperature between pure H2O and pure D2O.
5. Fluid Inclusion Re-Equilibration Experiments
After the initial synthesis, fluid inclusion assemblages in selected quartz disks were characterized by microscopy, microthermometry and Raman spectroscopy. These disks were cut out of the quartz cores that were used in the synthesis experiments. A large number of fluid inclusions (up to 100) has been analyzed in each disk in order to obtain a representative amount of data [10,11,12]. The disks were loaded in new Au-capsules with pure D2O and pure H2O, supported on top and below by a quartz-rod to prevent crushing of the disks by Au-capsule contraction in the experimental conditions. The conditions of each re-equilibration experiment are given in Table 3.
The experimental setup resulted in a variety of gradients between fluid inclusions and the external fluid: D2O-fugacity, H2O-fugacity and pressure gradients (Table 4). Although we tried to avoid pressure gradients by selecting similar re-equilibration conditions, the variation in observed molar volumes of individual fluid inclusions resulted locally in minor pressure gradients. Both fugacity and pressure gradients are considered the key factors in post-entrapment fluid inclusion modification.
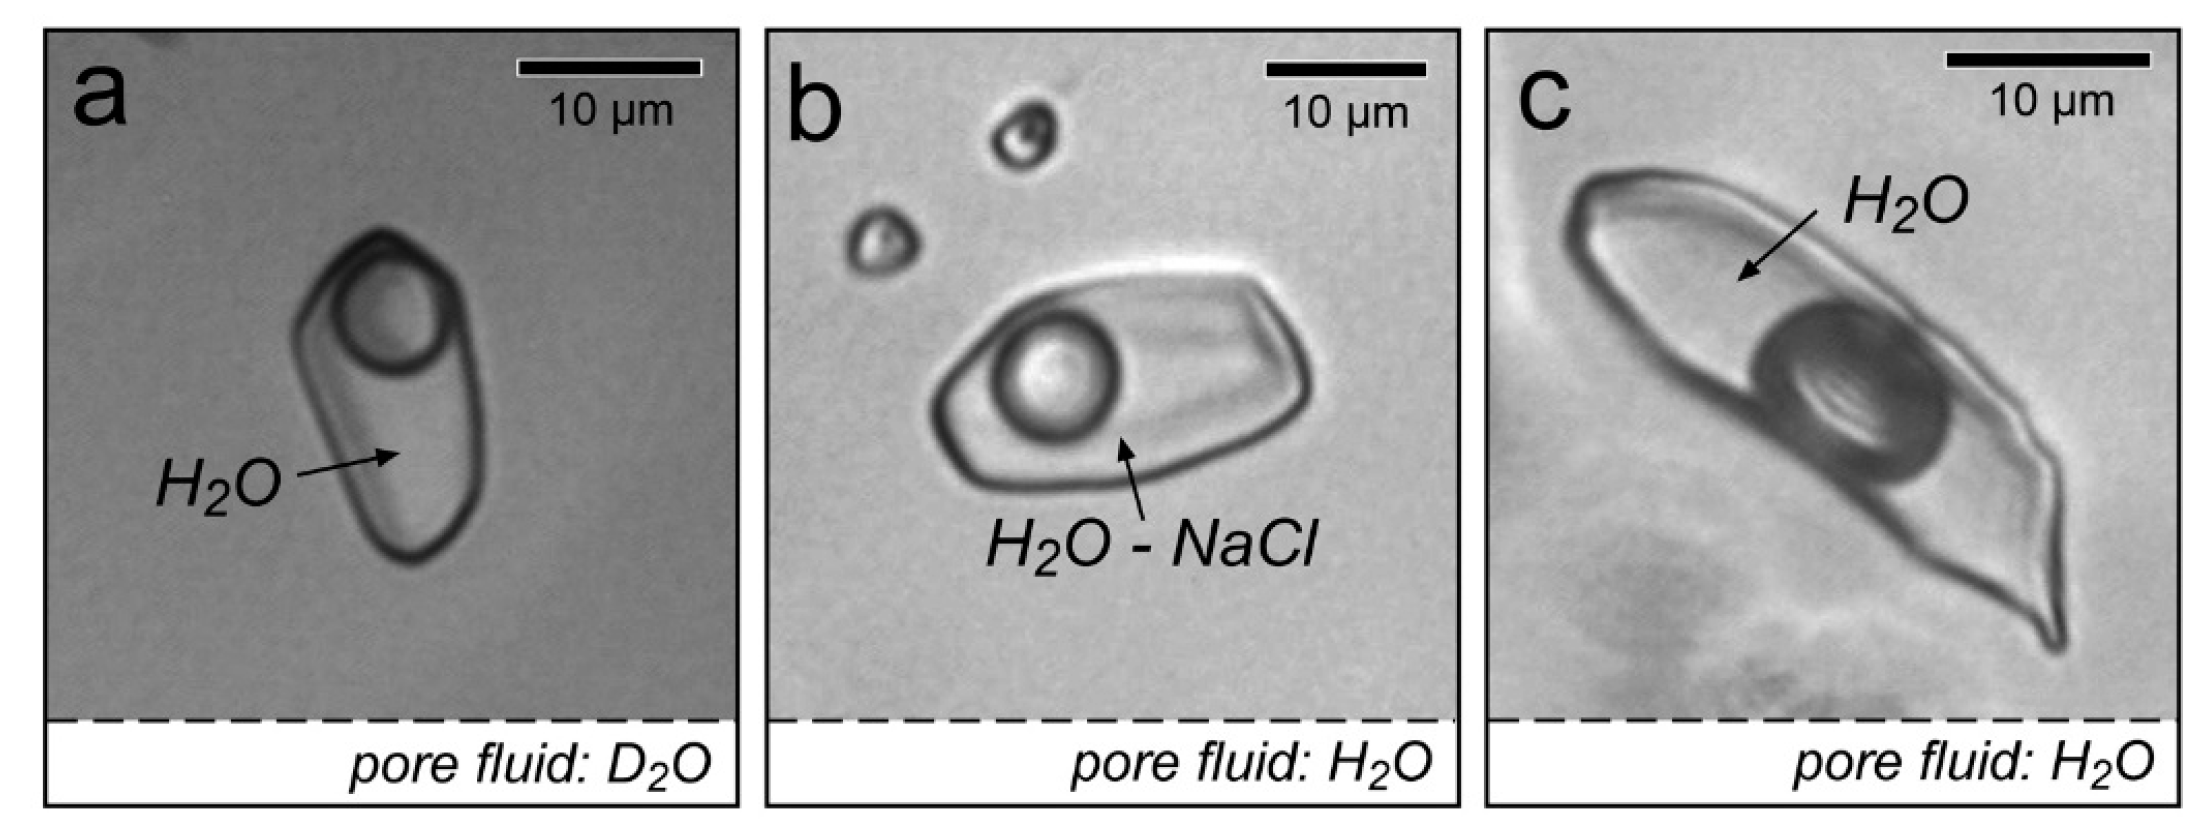
Three types of re-equilibration experimental setups (Figure 8) were described by Doppler et al. [10], Doppler and Bakker [11] and Bakker and Doppler [12]: (1) modifications of H2O-rich fluid inclusions in a D2O environment (Figure 8a); (2) modifications of H2O-NaCl-rich fluid inclusions in a pure H2O environment (Figure 8b). In addition, a series of “blank” re-equilibration experiments was performed (Figure 8c), i.e., H2O-rich fluid inclusions were re-equilibrated in a pure H2O environment. Most of the experiments were performed within the α-quartz stability field (see Table 1 and Table 3), whereas GMR-010 and GMR-013 were performed within the β-quartz stability field. Modifications of fluid inclusions are evident and recorded by changes in homogenization temperatures, melting (or dissolution) temperatures, inclusion shape, inclusion size and Raman spectra. Gases such as H2 and CH2 were not detected in fluid inclusions after re-equilibration experiments. The use of binary fluid mixtures, i.e., H2O-D2O and H2O-NaCl, allows an accurate characterization of processes such as diffusion and total volume changes.
5.1. “Blank” Re-Equilibration Experiments
A series of “blank” re-equilibration experiments was performed to illustrate that the experiment method itself does not cause modifications of the properties of fluid inclusions. These experiments were performed in similar temperature and pressure conditions with the same fluid as in the original synthesis experiments (GMR-004g, GMR-009b and GMR-010b in Table 3).
Two “blank” re-equilibration experiments were performed in the α-quartz stability field at 600.6 °C-336.3 MPa (GMR-004g) and 624.8 °C-279.1 MPa (GMR-009b). Re-equilibrated inclusions from GMR-004g homogenize at similar temperatures as after the original synthesis (Figure 3 in Bakker and Doppler [12]), which confirms the reliability of the experimental method. The experiment GMR-009b reveals insignificant lower homogenization temperatures after the “blank” re-equilibration experiment (Figure 6 in Doppler and Bakker [11]). This minor modification is caused by an unintended internal under-pressure of −11.2 MPa (Table 4). This relatively low pressure in inclusions (270 MPa) is caused by a minor pressure difference between argon gas in the pressure line and the fluid pressure in the Au-capsule (see Section 3) during the synthesis. A minor modification to higher fluid densities (i.e., to lower Th) is expected if the inclusions are adapted to the external fluid properties in the re-equilibration experiment.
The “blank” re-equilibration experiment in the β-quartz stability field at 674.9 °C and 322.6 MPa (GMR-010b) reveals a significant change in homogenization temperatures (Figure 6 in Doppler and Bakker [11]). The original fluid inclusions reveal homogenization temperatures that exceed the expected values by about 5 °C (Table 2), due to the previously-mentioned pressure differences between argon gas and fluid in the capsule (see Section 3). Consequently, during the re-equilibration experiments, the inclusions have an internal under-pressure of about −9.6 MPa (Table 4). Similar to the “blank” experiment in the α-quartz field, modification of the fluid inclusion density would result in lower homogenization temperatures, i.e., towards higher densities. However, the observed modifications are significantly higher homogenization temperatures corresponding to lower densities (Figure 6 in Doppler and Bakker [11]). An additional process must have been activated in the β-quartz field experiment, which was absent in the α-quartz field experiment, which is able to modify fluid inclusions even in “blank” experiments. It is most likely that the α-β-quartz phase transition is causing this minor modification in fluid inclusion density, corresponding to a total volume increase of about 1% by the induction of micro-cracks or diffusion of H2O during the transition.
5.2. Synthesis in H2O and Re-Equilibration in D2O
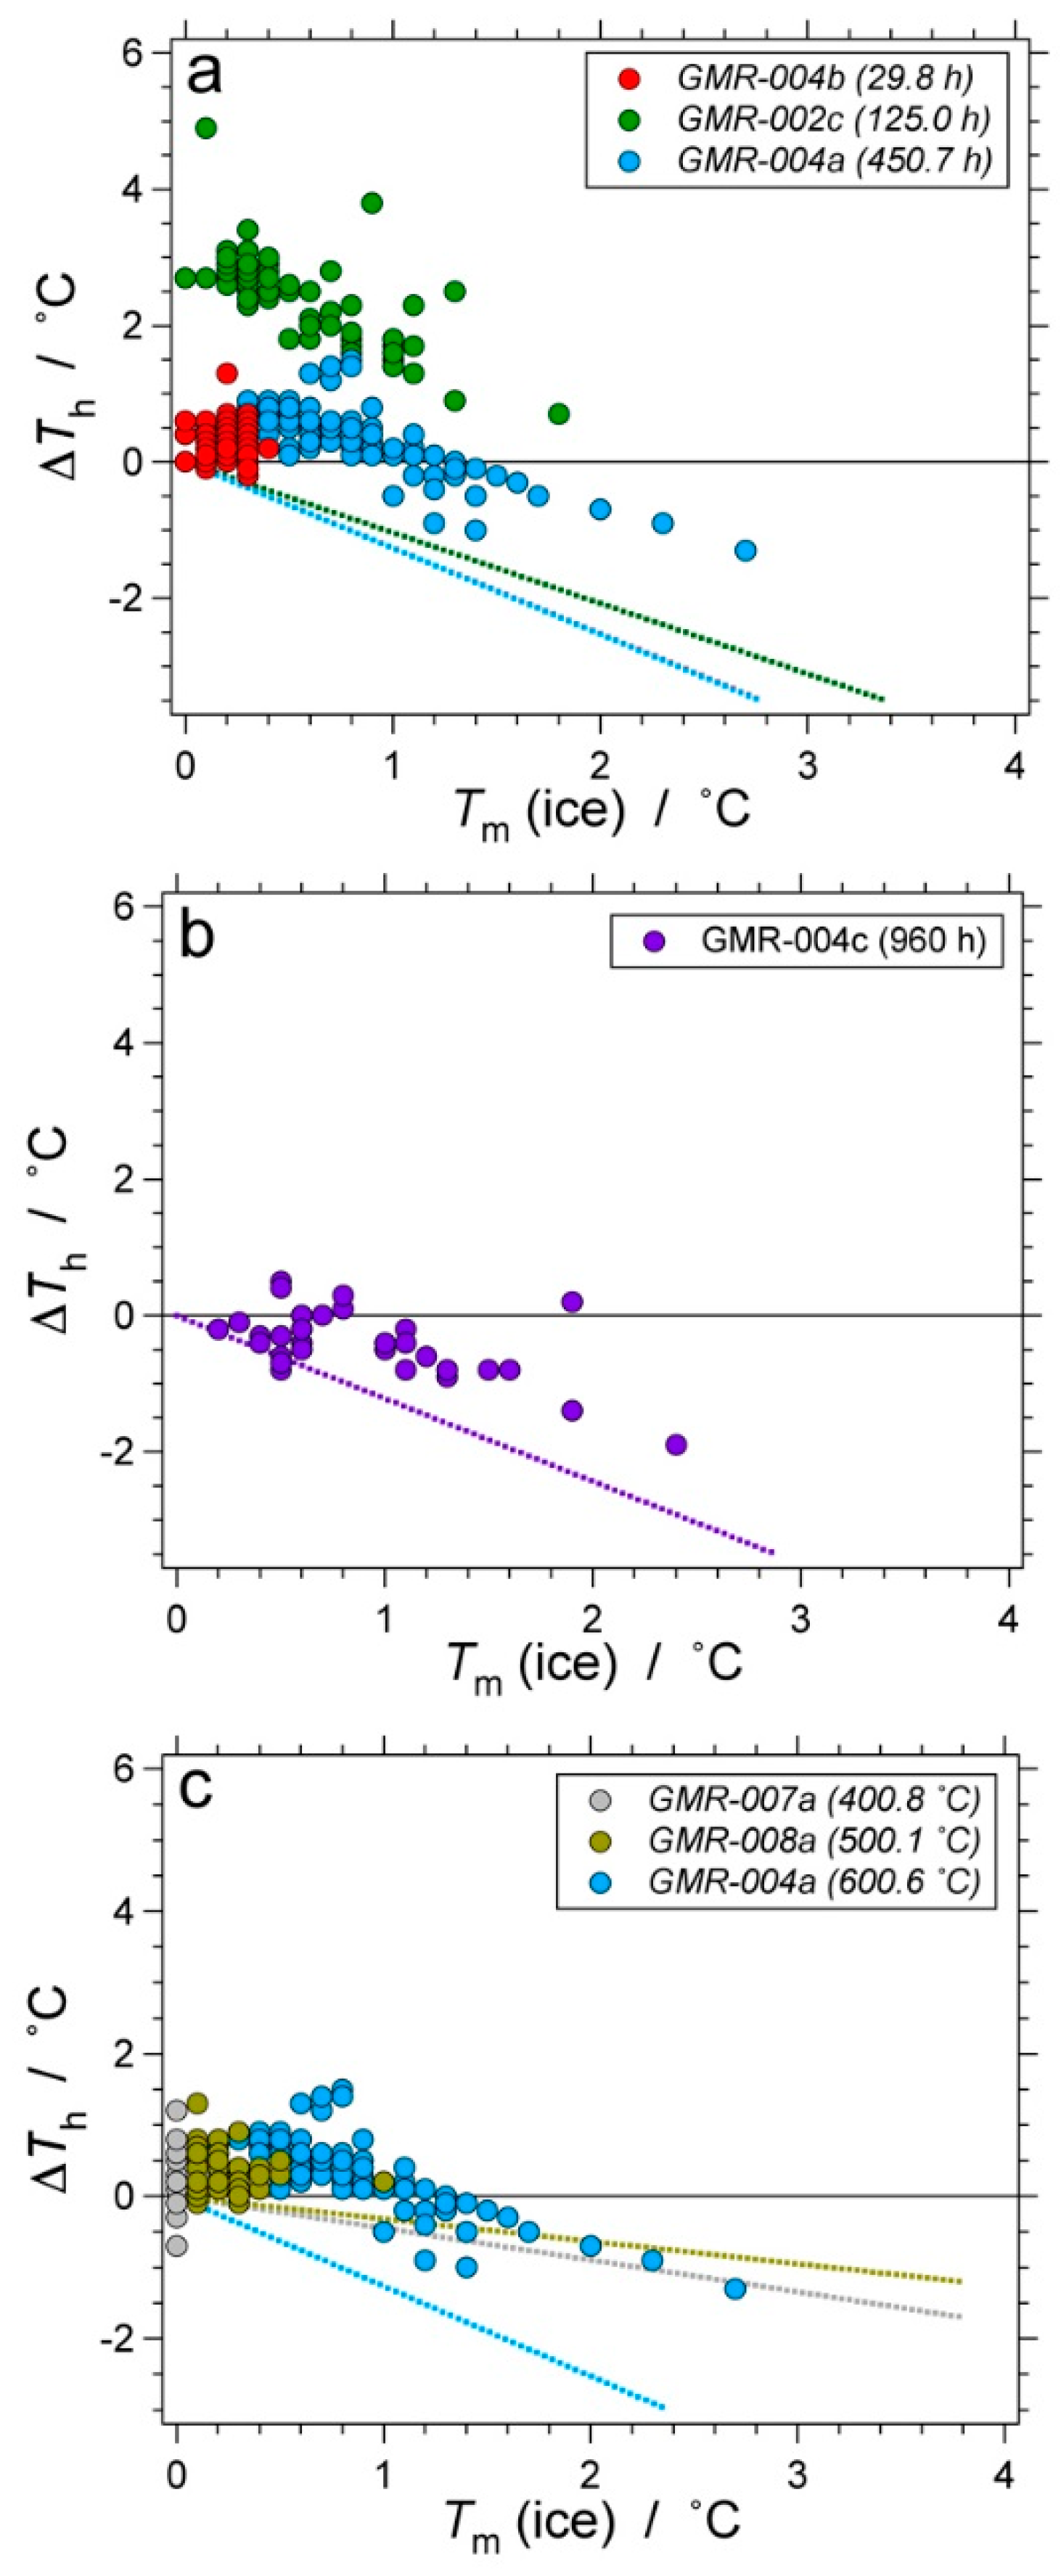
A series of re-equilibration experiments was performed with GMR-004 and GMR-002 at about 600 °C and 336 MPa in a pure D2O environment (Table 3). The induced gradients include only H2O-fugacities and D2O-fugacities, whereas the pressure difference between fluid inclusions and the Au-capsule can be neglected (Table 4). The expected diffusion of H2O out of inclusions and D2O into inclusions was tested with a variety of run-times (29.8, 125, 450.7 and 960 h, Figure 9a,b) and temperatures (~300, 400, 500 and 600 °C, Figure 9c). Complete re-equilibration at 600 °C, i.e., when the internal H2O is completely replaced by D2O, must result in a decrease of Th (down to 288 °C) (Table 5) and an increase of Tm (up to +3.8 °C). Incomplete re-equilibration would result in intermediate values, according to the ideal mixing behavior of H2O and D2O. The completeness of diffusion is, however, dependent on the parameters in a classical diffusion model [7,8], such as duration, temperature, fluid inclusion size and distance to surface. A fluid inclusion assemblage will be modified according to these parameters and may therefore contain a large variety of Th and Tm values (Figure 9), corresponding to a large variety in D2O content in one single experiment. Up to 10 mole% D2O (Tm = 0.4 °C, Figure 9a) is detected in fluid inclusions after the 29.8-h re-equilibration experiment, with similar Th (slightly increased values) as in the original synthesis experiment. The 125.0-h re-equilibration experiment resulted in both significantly higher Th and Tm values (Figure 9a), up to 298.1 °C and +2.7 °C, respectively. These temperatures do not correspond to the expected ideal mixing behavior of H2O and D2O (dashed lines in Figure 9) and were caused by the difference in the diffusion constant of H2O and D2O. For this specific run-time, relatively “slow” diffusion of D2O into the inclusion compared to “fast” H2O diffusion out of the inclusion results in a temporary density loss [10]. For longer run-times (450.7 h, Figure 9a; and 960 h, Figure 9b), modifications of Th and Tm (D2O concentration) approach the ideal mixing line between pure H2O and pure D2O inclusions.
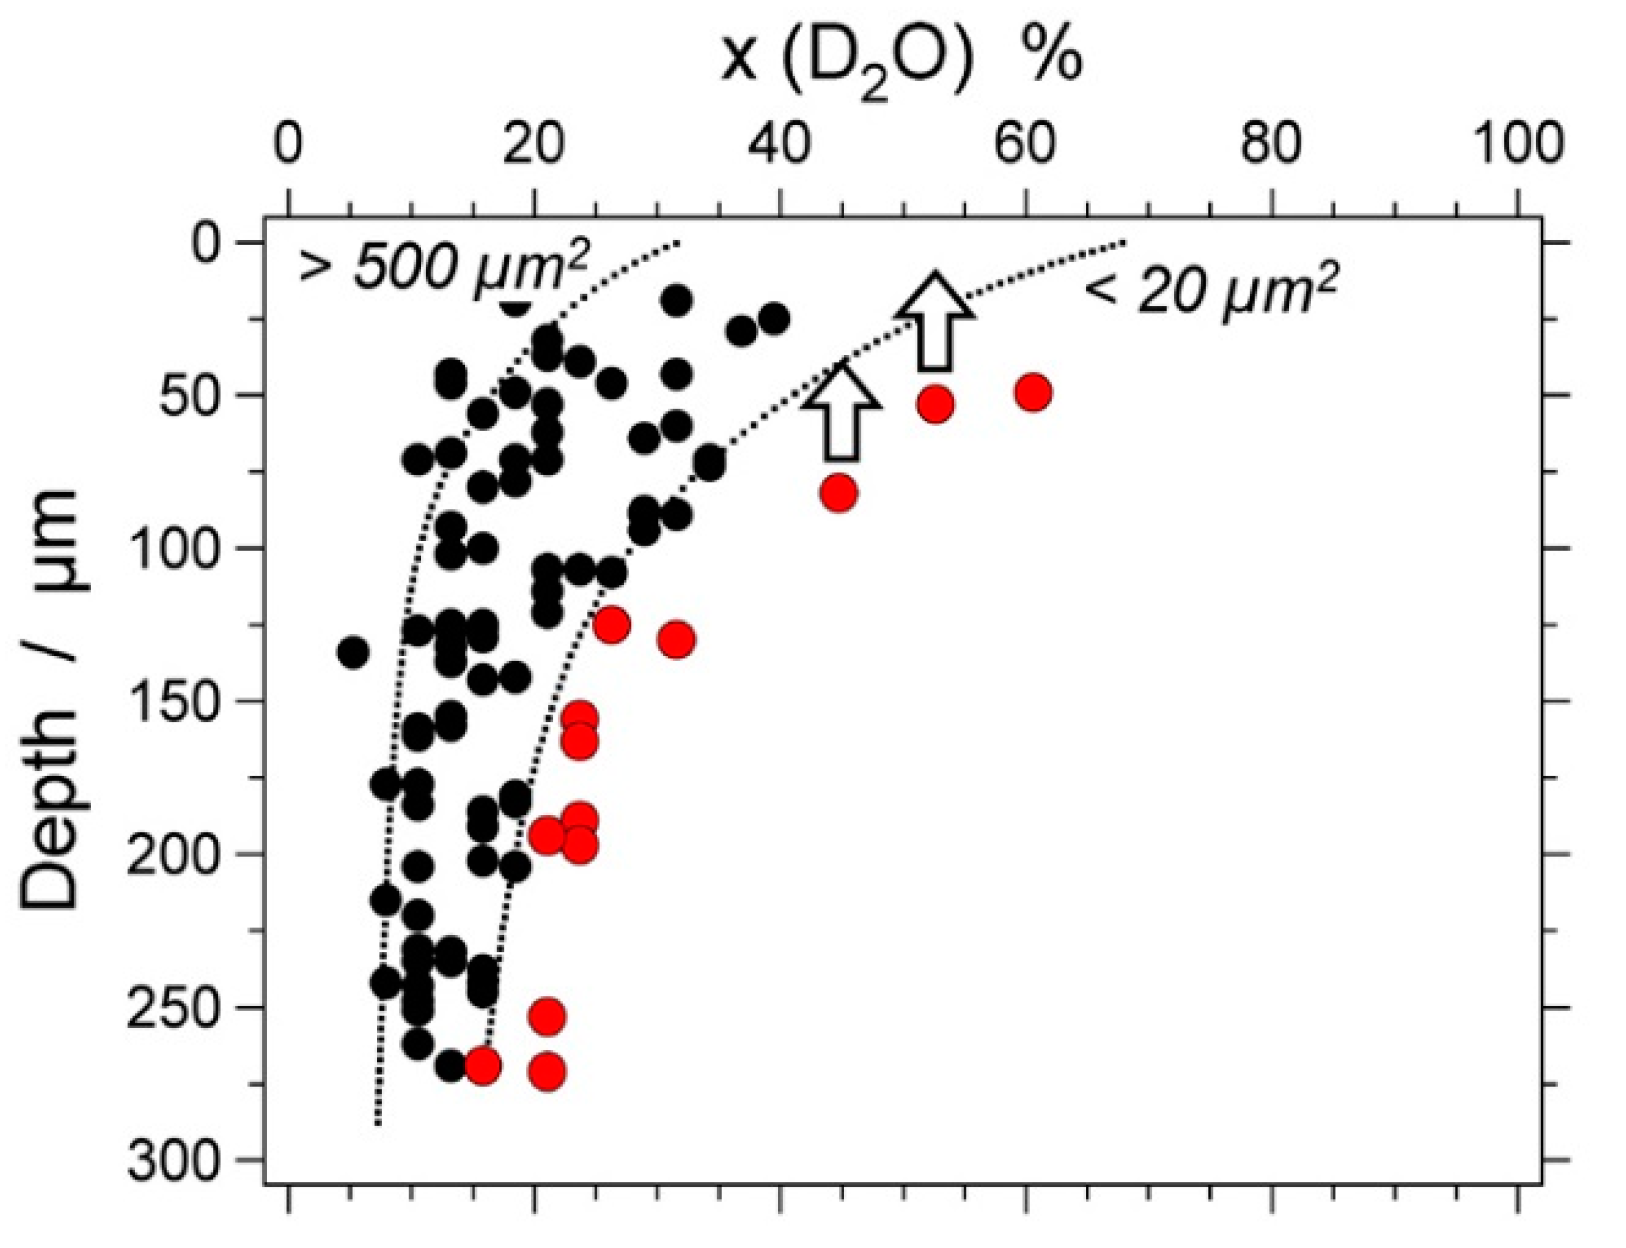
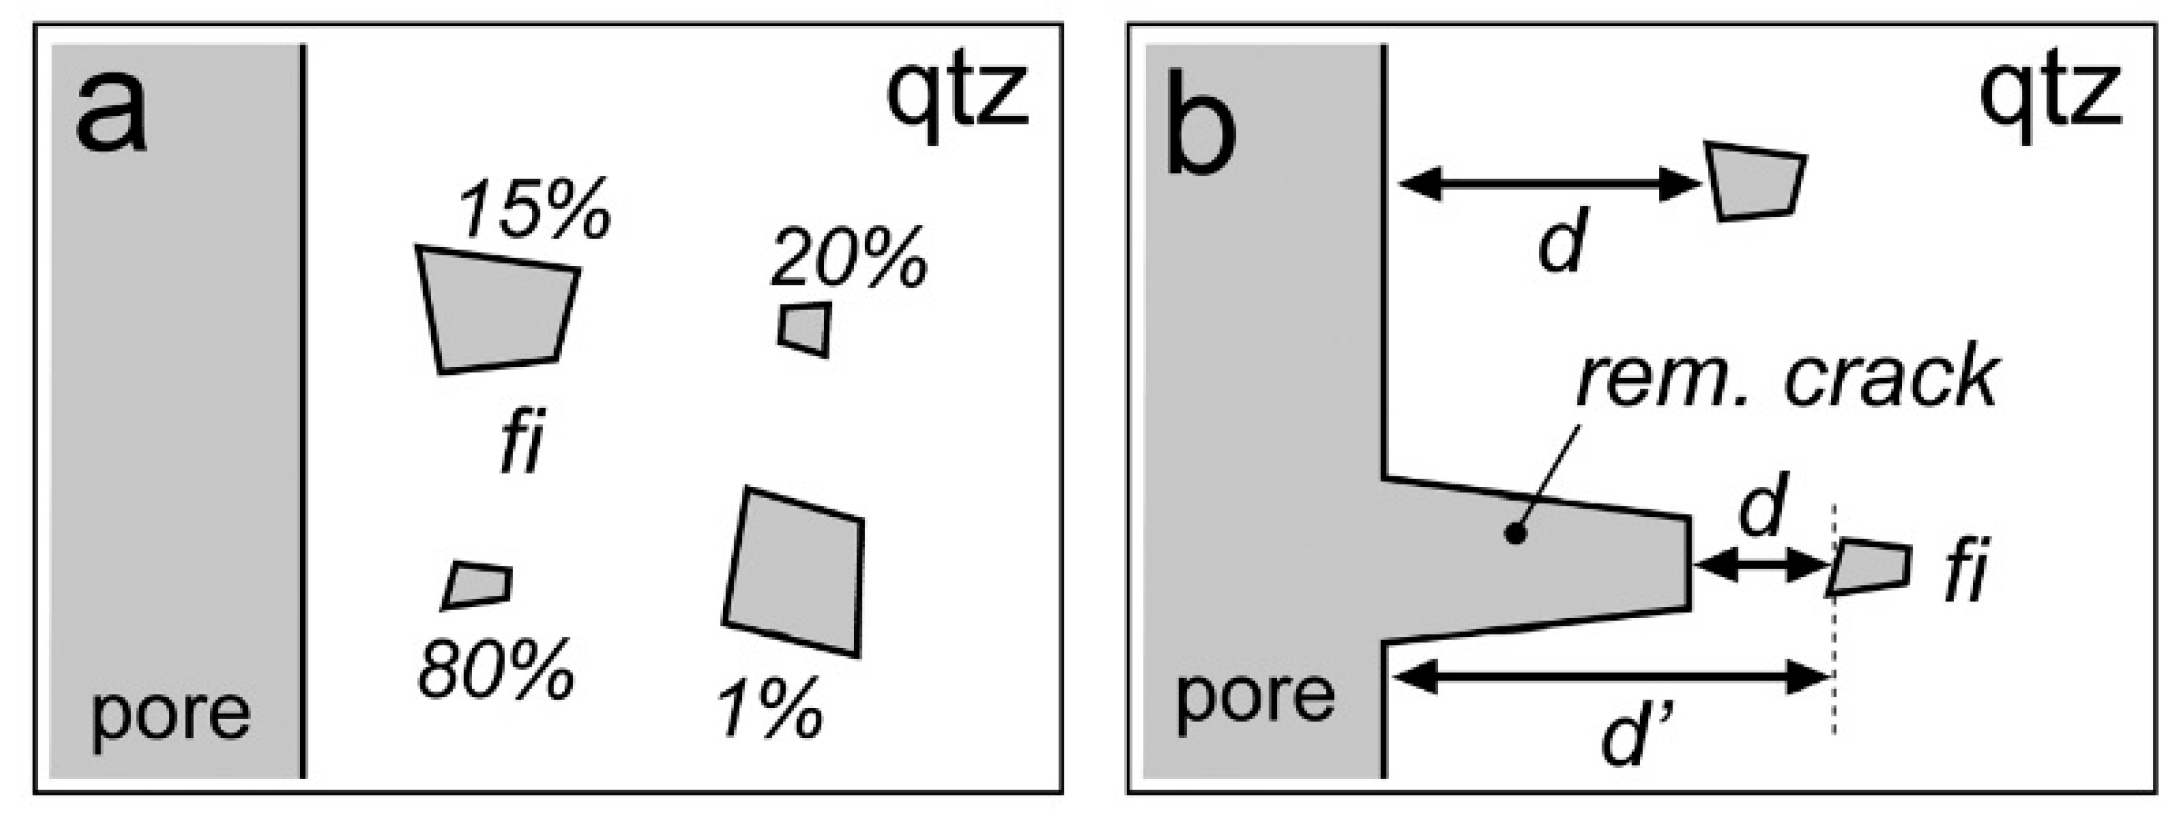
The application of a classical diffusion theory [8] predicts a variation in fluid inclusion modifications according to depth (distance inclusion-quartz surface) (Figure 10) and fluid inclusion size (Figure 11). Figure 10 illustrates that deep inclusions reveal less modifications than shallow inclusions, but these modifications are not uniform at specific depths. The variation in fluid inclusion size is causing this spread at specific depths (Figure 11). For example, large inclusions that are located close to the surface are less modified than small inclusions at similar depths (Figure 12a). At deeper levels, the large inclusions may show only minor modifications, whereas smaller inclusions are considerably modified. The distance between the quartz surface and fluid inclusions may be overestimated if the remaining open crack space, in which the fluid inclusions were formed, is neglected (Figure 12b). These types of fluid inclusions are marked with red symbols in Figure 10 and Figure 11 and contain more D2O than expected from their distance to the surface. For example, the inclusions that contain 26–32 mole% D2O in Figure 11c (red symbols) correspond to a distance of 46–56 µm (Figure 11b) to the remaining open crack, whereas they were classified to a larger distance quartz surface-inclusion (125–135 µm).
The factor temperature in diffusion coefficients from classical diffusion theories was also investigated by Doppler et al. [10]. The experiment at 400.6 °C-336.7 MPa did not reveal any D2O in re-equilibrated fluid inclusions after 460 h of experimentation (Figure 9c). Up to 26 mole% D2O was detected in small inclusions close to the surface in the experiment at 499.7 °C-337.3 MPa (Figure 9c). The efficiency of diffusion is, therefore, limited to temperatures between 400 and 500 °C in our experimental setup, which may correspond to the previously mentioned “closure temperature” at about 336 MPa (see also Figure 7 in Doppler et al. [10]). D2O was not detected in synthetic fluid inclusions after similar re-equilibration experiments at lower temperatures (GMR-006a).
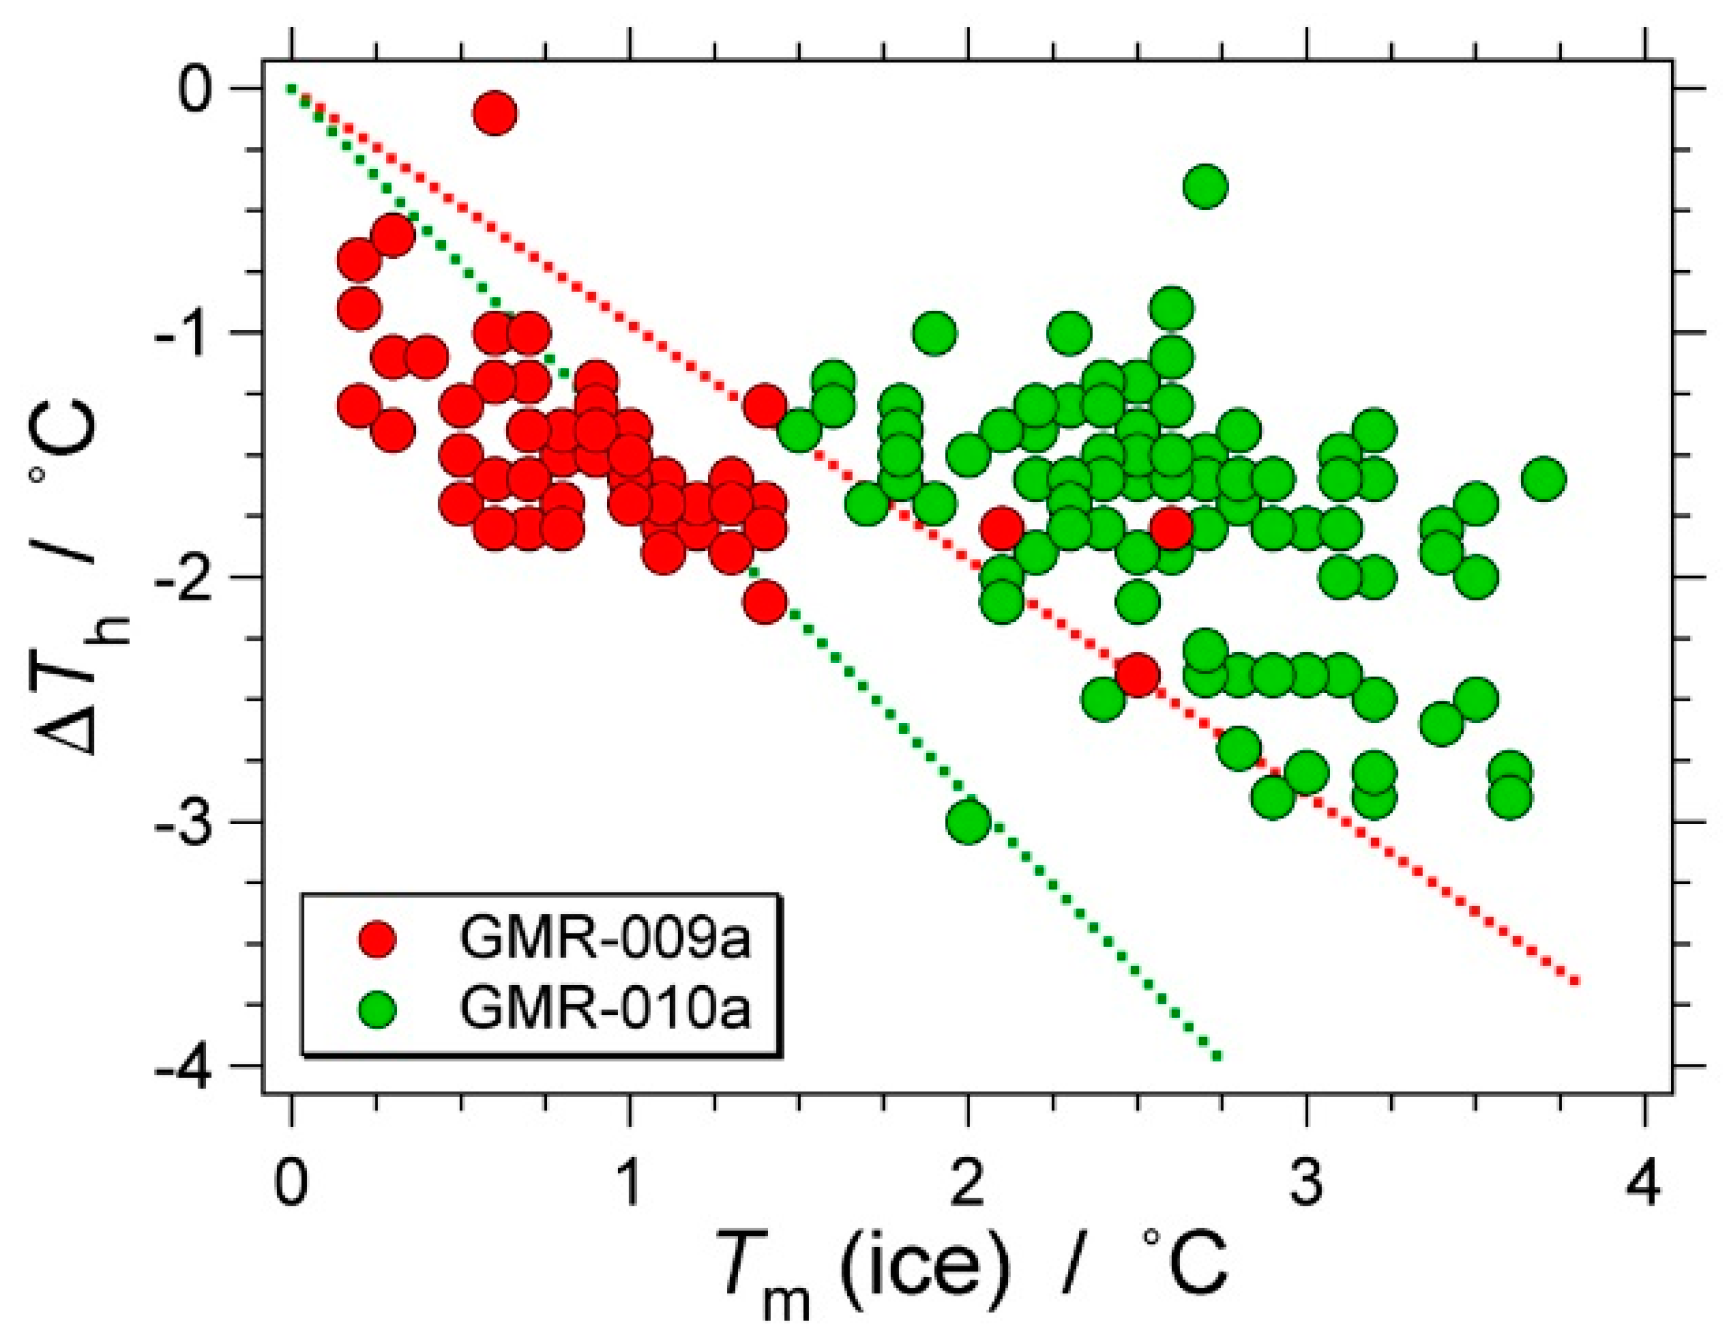
One specific H2O molar volume (27.5 cm3/mol) in fluid inclusion assemblages was selected to re-equilibrate in both the α-quartz and the β-quartz stability field (Figure 13). The re-equilibration was performed in a D2O environment (GMR-009a, GMR-010a, GMR-013a in Table 3). Detailed results of these experiments are given in Doppler and Bakker [10]. The expected modifications of fluid inclusion properties correspond to modifications observed in the previously-described experiments at about 600 °C and 336 MPa in the α-quartz stability field. Complete replacement of H2O by D2O (diffusion) in fluid inclusions would result in lower Th: 316.9 °C (ΔTh = −3.7) for GMR-009a and 312.0 °C (ΔTh = −5.5) for GMR-010a, with ice melting temperatures of +3.8 °C. Incomplete re-equilibration results in mixtures of H2O-D2O with Th and Tm values according to ideal mixing behavior (dashed lines in Figure 14).
The modifications of fluid inclusions in experiment GMR-010a (β-quartz) are more pronounced than in GMR-009a (α-quartz), due to the differences in the experimental temperatures. Most inclusions in GMR010a reveal a nearly complete replacement of H2O by D2O, whereas GMR-009a has only D2O contents up to 68 mole%. Similar to the “blank” experiment with GMR-009, Th values are insignificantly lower (red symbols in Figure 14) than the expected values (red dashed line in Figure 14), due to lower fluid pressures inside the Au-capsule than the argon pressure in the pressure line (see Section 3). Although the modifications of fluid inclusions in GMR-010a result in lower Th values (green symbols in Figure 14), they are significantly higher than the expected values (green dashed line in Figure 14). Again, a similar result was observed in the “blank” experiment, corresponding to the interpreted increase of inclusion total volume due to the α-β-quartz phase transition. Enhanced permanent modifications in total inclusion volume at this phase transition were also identified by Schmidt et al. [9] with extremely short experimental run times (less than 400 s).
The size of fluid inclusions defines the variation in the amount of the modification for both experiments (Figure 15). Relatively large inclusions (≈600 µm2) contain maximally 15 mole% D2O, whereas relative small inclusions (≈60 µm2) in GMR-0009a contain up to 70 mole% D2O. The large variation for a specific size is defined by the distance between inclusion and quartz surface. A similar effect is observed in GMR-010a, where small inclusions contain up to 100 mole% D2O and large inclusions only up to 45 mole% D2O.
5.3. Synthesis in H2O-NaCl and Re-Equilibration in H2O
The original synthesis of H2O-NaCl-rich fluid inclusions [12] resulted in a relative unexpected broad span of densities (Table 2, GMR-005, GMR-011 and GMR-014). Consequently, the re-equilibration conditions in a pure H2O environment and a constant pressure of about 337 MPa resulted in a variety of minor pressure gradients between inclusions and the Au-capsule, in addition to H2O-fugacity gradients (Table 4). The average pressure gradients are negative, corresponding to internal under-pressures.
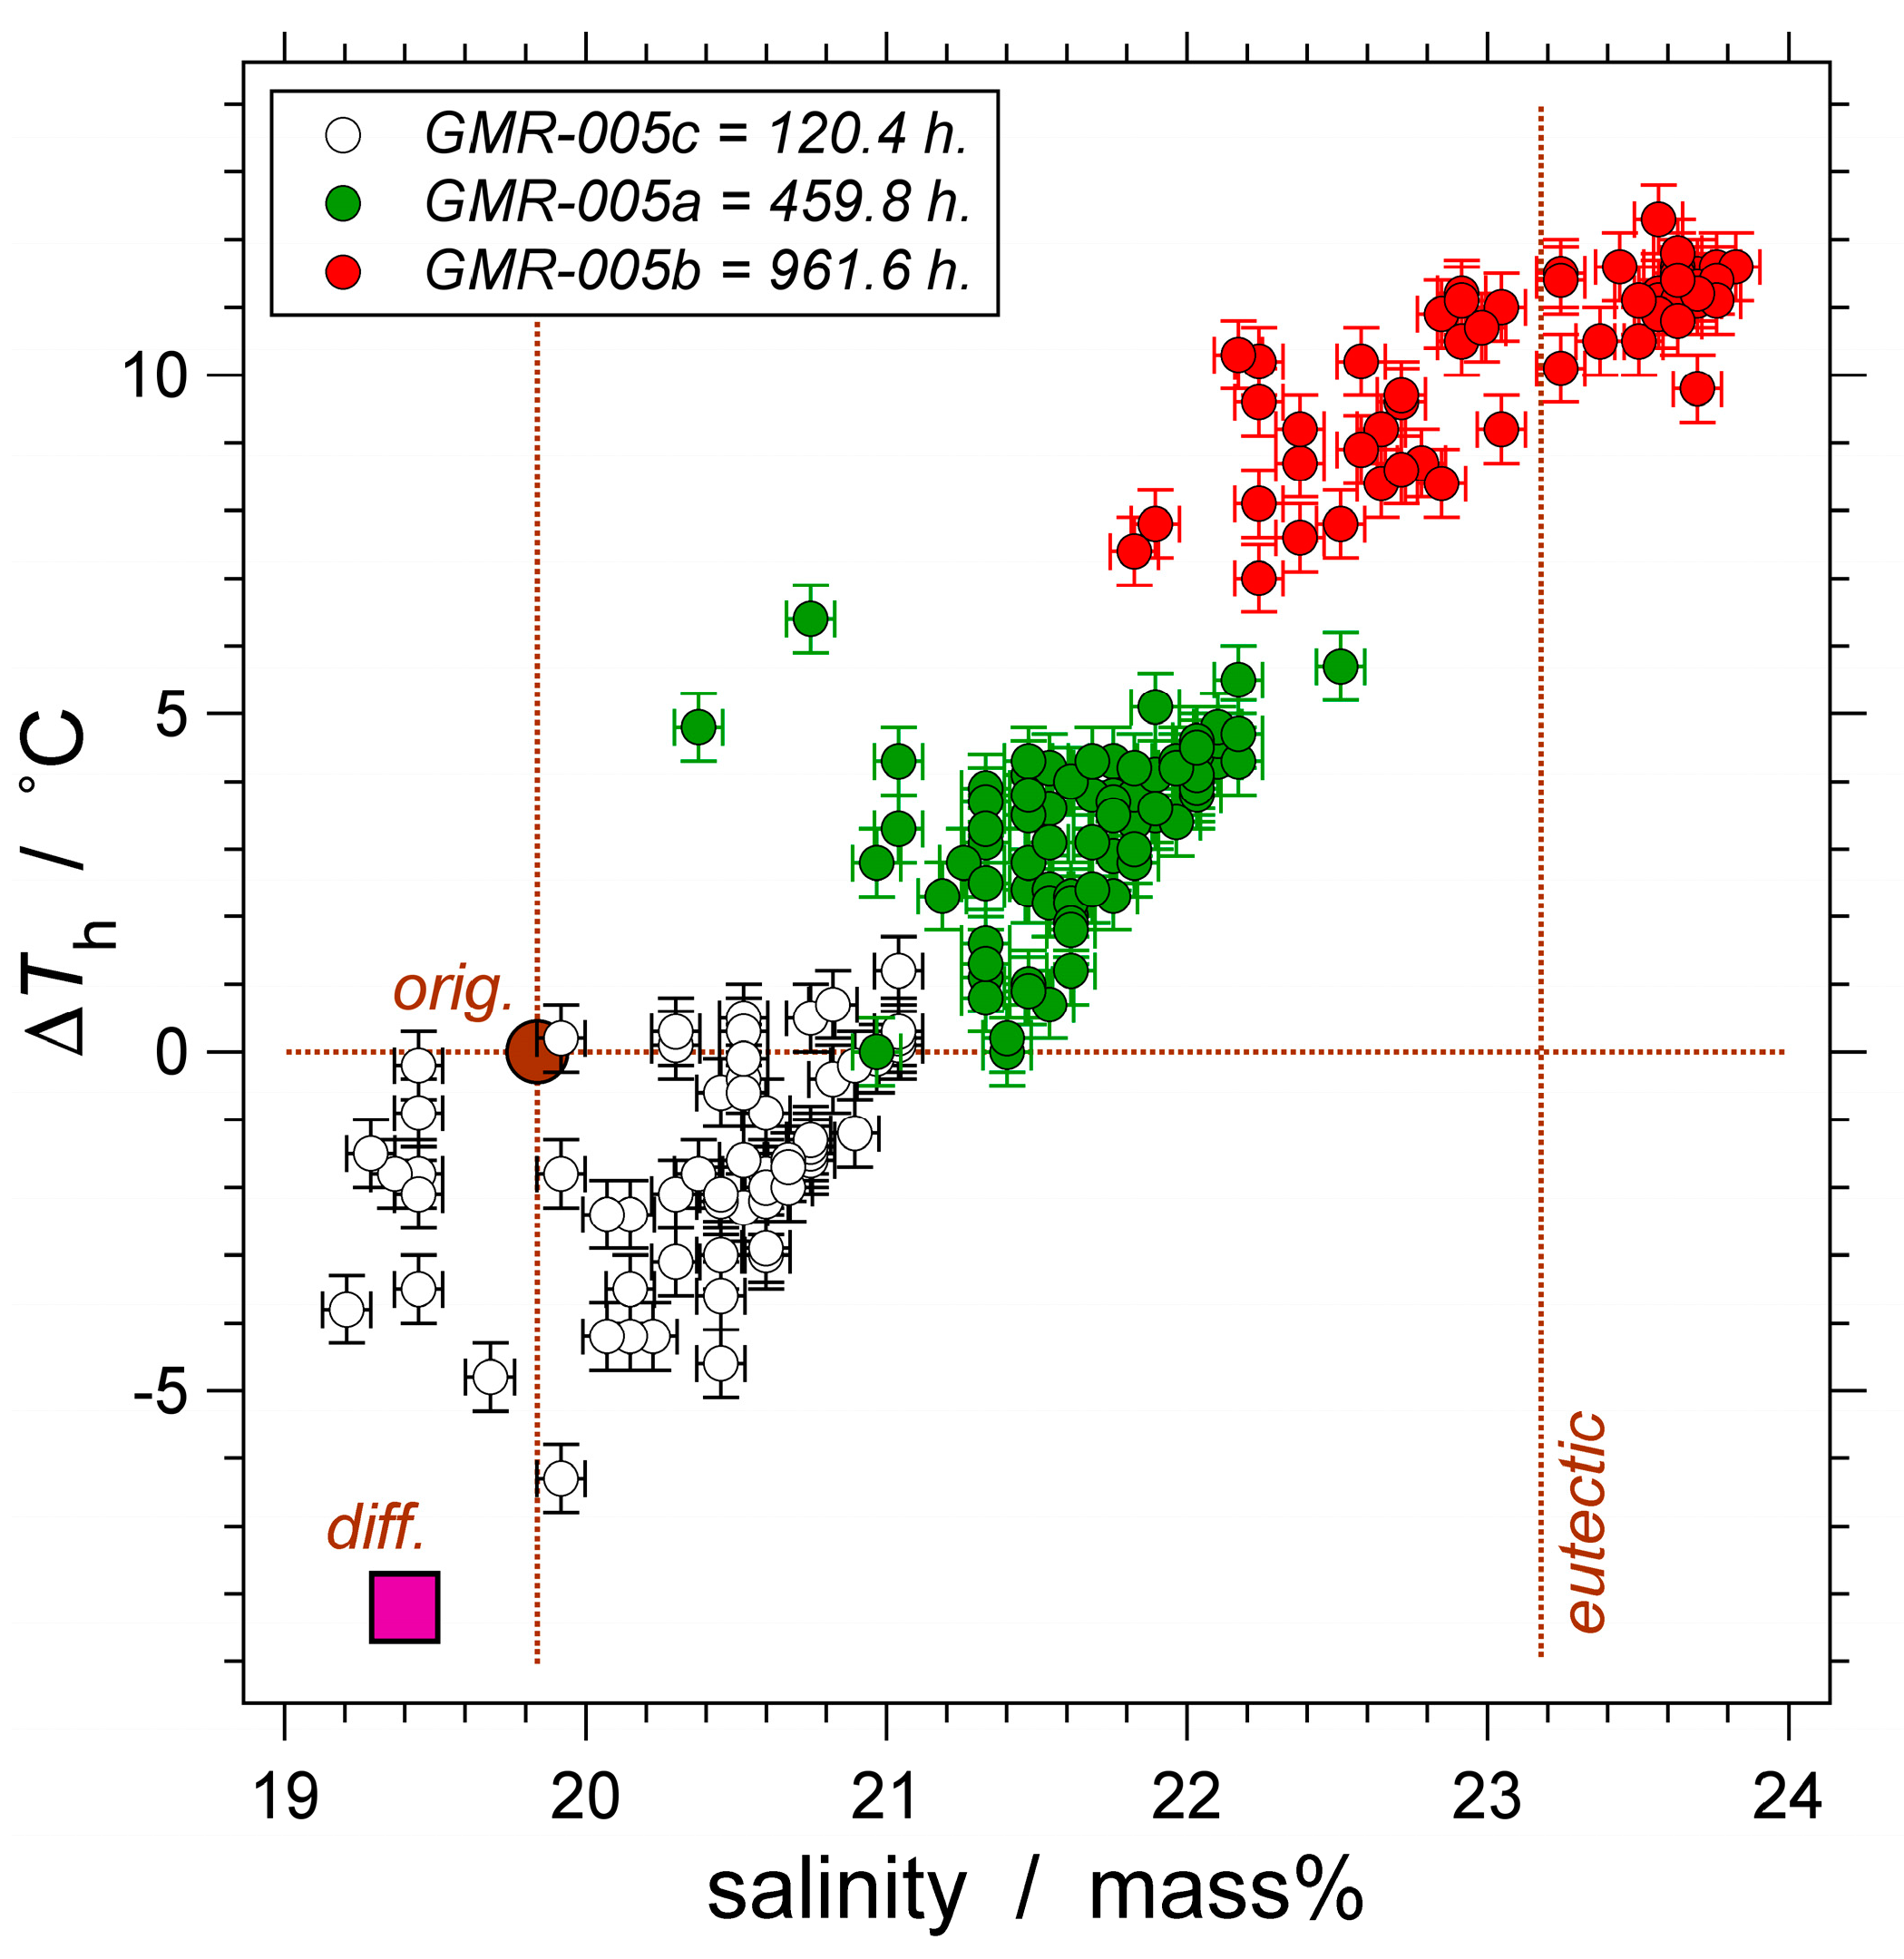
The application of a classical diffusion model [8] for GMR-005 would finally result in a minor dilution of the aqueous solution in fluid inclusions, from 19.8 down to 19.4 mass% NaCl, a minor decrease in molar volume (−1.23%) and an increase in internal pressure (from 336 to 359.5 MPa) in the experimental conditions. These minor modifications correspond to higher Tm values (−16.0 °C) and lower Th values (321.5 °C), which is in contrast to our observations (Figure 16). Only a few of the re-equilibrated fluid inclusions from the short run-time experiment (GMR-005c, open symbols in Figure 16) reveal modifications according to a classical diffusion model. However, most inclusions reveal preferential loss of H2O, resulting in higher salinities, corresponding to lower Tm values and higher Th values. The longer run-time experiments (GMR-005a, green symbols in Figure 16; and GMR-005b, red symbols in Figure 16) illustrate fluid inclusion modifications of Th and Tm that are completely in contrast to the diffusion model, but reveal a linear trend away from the expected values.
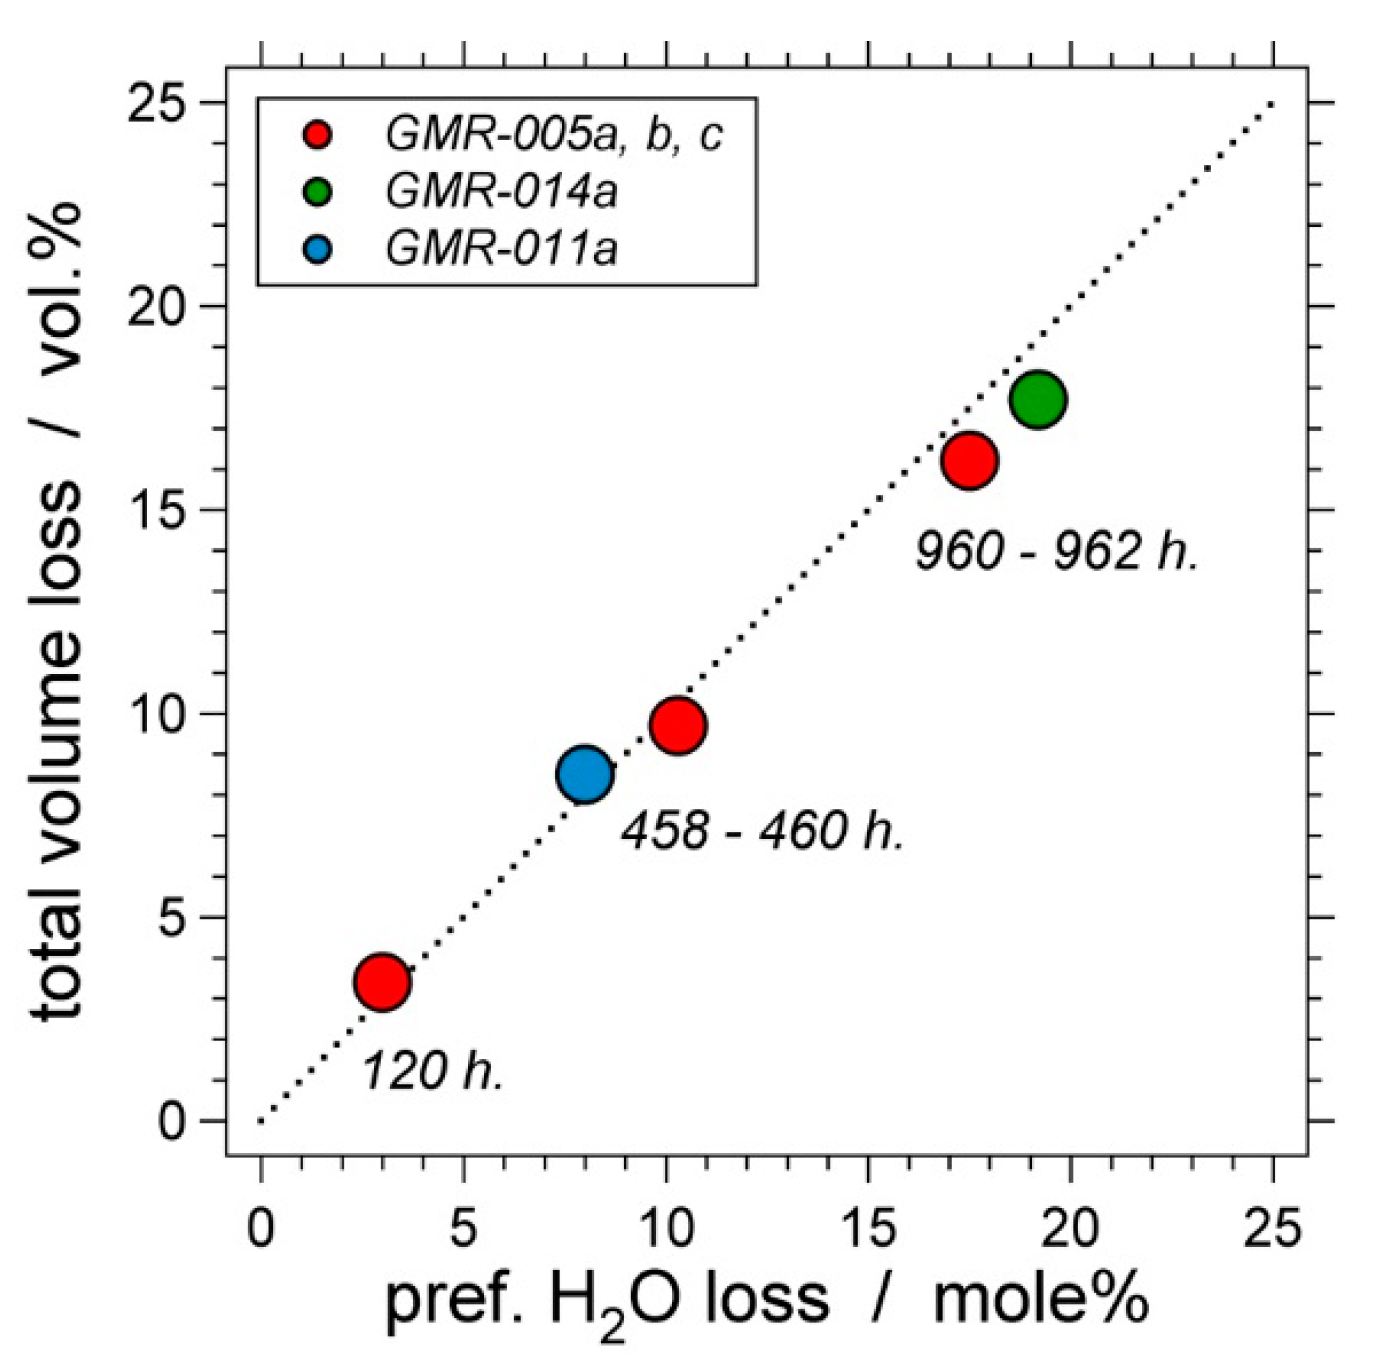
The combination of homogenization temperatures and dissolution temperatures of fluids in the binary H2O-NaCl system can be used to calculate modifications in composition, molar volume and total volume of fluid inclusions [12]. The relative amount of H2O loss can be calculated from modifications of Tm, assuming that H2O is the only mobile component. The loss of certain amounts of a component must lead to an increase of molar volume in fluid inclusions with a constant total volume. Small amounts of H2O loss would already result in intensive modifications of Th (see Table 6 in Bakker and Doppler [12]). The observed Th values do not correspond to these calculated modifications and are much lower than expected (i.e., lower molar volumes). Consequently, these lower molar volumes can only be obtained by the reduction of the total volume of fluid inclusions. The experimental data from GMR-005a, GMR-005b, GMR-005c, GMR-011a and GMR-0014a have been used to calculate the amount of preferential H2O loss and the amount of total volume loss, according to these considerations (Figure 17). The fluid inclusions from the relative short run-time experiment GMR-005c (120.4 h) revealed an average preferential H2O loss of 3.0% and a total volume decrease of 3.4 vol %. The intermediate run-time experiment GMR-005a (458.9 h) revealed an average 10.3% preferential H2O loss and 9.7 vol % total volume decrease and the long run-time experiment GMR-005b (961.9 h), a 17.5% preferential H2O loss and a 16.2 vol % total volume decrease. The re-equilibration experiments GMR-011a and GMR-014a were consistent with these results. In summary, the replacement of one mole H2O from the fluid inclusion with approximately one mole quartz from the host crystal resulted in the observed modifications of Th and Th. The molar volume of quartz and H2O were nearly equal in these experiments conditions, which resulted in a one-to-one mole alteration. This process is not triggered by fugacity coefficients, but is most likely caused by the internal under-pressure in fluid inclusions. This quartz-fluid exchange is a time- and temperature-dependent process, similar to their significance in diffusion processes, but this is a much stronger process to modify fluid inclusion properties than simple diffusion according to fugacity gradients.
6. Preferential H2O Loss
A logical cause for preferential H2O loss would be a corresponding fugacity gradient that only affects the H2O content in fluid inclusions. The presently-described experiments demonstrate that preferential H2O loss is not purely a diffusional process that can be modelled according to the classical diffusion theory. The experiments illustrate that H2O can also diffuse against specific H2O fugacity gradients, and this process can be characterized as a crystal-recovery process, in which the included fluid is expelled from the crystal through migration of fluid pockets away from the inclusion. The results of this crystal-recovery process have been described in only a few studies on re-equilibration of fluid inclusions, both natural and synthetic [5,26,27,28,29], whereas other work revealed only textural evidence of the occurrence of this process [6]. A direct consequence of this process would be the formation of a halo of relatively small H2O-rich inclusions around the original larger fluid inclusion and the recrystallization and inward growth of inclusion walls into a highly irregular pattern. This halo can also be developed at the nm scale, forming small bubbles on dislocation lines around a re-equilibrated fluid inclusion [26] and, therefore, not visible with an optical microscope. Our experiments do not reveal these halos because the applied pressure gradients were extremely small, but nevertheless, both preferential loss of H2O and total volume loss are proven with the microthermometric data. In long run-time experiments, the original fluid inclusions will contract to a small gas- and salt-rich relict inclusion, whereas its aqueous fluid will be redistributed in the quartz crystal in numerous small inclusions, or it will be lost to pore space around the crystals.
Preferential H2O loss is a generally-accepted process that modifies fluid inclusion composition and density. This process takes place under hydrostatic conditions [26] and under deviatoric stress conditions [28]. Diffusion is assumed to be the mechanism of H2O transport through the quartz crystal according to specific fugacity gradients. However, the boundary conditions, i.e., the parameters that control diffusion, are not always well defined in re-equilibration experiments and are often only theoretically deduced [28]. The experimental work in the present study reveals a different type of H2O transport through the quartz crystal, which is not triggered by fugacity gradients, but by hydrostatic pressure gradients. This process must be active in experiments with a deviatoric stress because it includes similar hydrostatic pressure conditions. Consequently, the crystal-recovery process may also play an important role in the modifications of fluid inclusion in deviatoric stress experiments, in which preferential loss of H2O and molar volume decrease are observed.
7. Natural Fluid Inclusions
The identification and quantification of processes that may modify fluid inclusions is the first step to judge the reliability of the information obtained from natural fluid inclusions. Many experiments have revealed that fluid inclusions may adapt to external fluid conditions within the relatively short experimental run-time and that internal pressures are adjusted to hydrostatic pressures and maximum principle stress. The experiments have also revealed the limitations of modification processes, which are defined by temperature, pressure and fugacity gradients.
How can we judge that a natural fluid inclusion assemblage was modified? Textural analyses of fluid inclusion assemblages provide the main argument for the identification of re-equilibration processes. In addition, the variability of fluid inclusion compositions and densities within an assemblage is an important aspect. This variability can only adapt specific values according to well-defined modification processes. For example, an original homogeneous assemblage of a H2O-CO2-NaCl-rich inclusion trapped at high temperature and pressure can be modified to specific compositions and densities according to the diffusion of H2O. This variability can be calculated according to inclusion size and diffusion distance at specific temperatures.
The knowledge of mechanisms that may modify fluid inclusion properties is still incomplete. The present study provides conceptual models for a very limited set of fluid compositions, temperatures and hydrothermal confining pressures.
8. Conclusions
Processes involved in post-entrapment modifications of synthetic fluid inclusions that were published by Doppler et al. [10], Doppler and Bakker [11] and Bakker and Doppler [12] are re-examined and scrutinized in the present work. The experiments were intended to include only fugacity gradients at constant temperatures (≈600 °C) and pressures (≈336 MPa), but an additional pressure gradient was established in some experiments. Binary fluid systems were selected, i.e., H2O-D2O and H2O-NaCl, to document modifications in microthermometric properties (Th and Tm) and corresponding modifications in density, composition and total volume of fluid inclusions accurately. Three types of processes were identified:
1. Diffusion of H2O and D2O was observed in experiments that contained only a fugacity gradient. The variety of fluid compositions (ratio H2O/D2O) of individual inclusions could be predicted according to classical diffusion models [8], in which time, temperature, diffusion distance and fluid inclusion size play a major role. This diffusion process is not efficient below 500 °C or in short experimental run-times.
2. Negative pressure gradients (internal under-pressure) induce a crystal-recovery process, in which preferential loss of H2O occurs in addition to quartz growth into the inclusions (decrease in total volume), resulting in a lower H2O concentration and a higher fluid density. This process was the dominant modification process in re-equilibration experiments with a H2O-NaCl fluid system, which were performed with a relatively small H2O fugacity gradient (≈−18 MPa) and pressure gradients of −9–−16 MPa (under-pressure). These experiments included also H2O diffusion according to the first process (fugacity gradients) to a minor extent, which was only noticeable in short run-time experiments. The crystal-recovery process is able to transport H2O against fugacity gradients, away from the inclusions.
3. The α-β quartz transition induced an irreversible total volume increase of about 1% of fluid inclusions.
Acknowledgments
The Austrian Science Fund (FWF) is greatly acknowledged for the financial support (Project No. P 22446-N21). I would like to thank Gerald Doppler and Miriam Baumgartner for the energy and engagement that they have put in this project. The experimental data presented in this manuscript were originally reported in the PhD thesis of Gerald Doppler. We would like to thank Kurt Krenn and Olga Vasyukova for reviewing this manuscript.
Conflicts of Interest
The author declares no conflict of interest.
References
- Spear, F.S. Metamorphic Phase Equilibria and Pressure-Temperature-Time Paths; Monograph Series; Mineralogical Society of America: Washington, DC, USA, 1995; p. 799. [Google Scholar]
- Faure, G. Principles of Isotope Geology; John Wiley & Sons: New York, NY, USA, 1986; p. 589. [Google Scholar]
- Geyh, M.A. Handbuch. der Physicalischen und Chemischen Altersbestimmung; Wissenschaftliche Buchgesellschaft: Darmstadt, Germany, 2005; p. 211. [Google Scholar]
- Roedder, E. Fluid Inclusions, Reviews in Mineralogy; Mineralogical Society of America: Chelsea, MA, USA, 1984; Volume 12, p. 644. [Google Scholar]
- Bakker, R.J.; Jansen, J.B.H. Preferential water leakage from fluid inclusions by means of mobile dislocations. Nature 1990, 345, 58–60. [Google Scholar] [CrossRef]
- Sterner, S.M.; Bodnar, R.J. Synthetic fluid inclusions-VII. Re-equilibration of fluid inclusions in quartz during laboratory-simulated metamorphic burial and uplift. J. Metam. Geol. 1989, 7, 243–260. [Google Scholar] [CrossRef]
- Crank, J. The Mathematics of Diffusion; Oxford Science Publications: Oxford, UK, 1975; p. 414. [Google Scholar]
- Bakker, R.J. Re-equilibration of fluid inclusions: Bulk diffusion. Lithos 2009, 112, 277–288. [Google Scholar] [CrossRef]
- Schmidt, C.; Bruhn, D.; Wirth, R. Experimental evidence of transformation plasticity in silicates: Minimum of creep strength in quartz. Earth Plant. Sci. Lett. 2003, 205, 273–280. [Google Scholar] [CrossRef]
- Doppler, G.; Bakker, R.J.; Baumgartner, M. Fluid inclusion modification by H2O and D2O diffusion: The influence of inclusion depth, size, and shape in re-equilibration experiments. Contrib. Mineral. Petrol. 2013, 165, 1259–1274. [Google Scholar] [CrossRef]
- Doppler, G.; Bakker, R.J. The influence of the α-β phase transition of quartz on fluid inclusions during re-equilibration experiments. Lithos 2014, 198, 14–23. [Google Scholar] [CrossRef]
- Bakker, R.J.; Doppler, G. Salinity and density modifications of synthetic H2O and H2O-NaCl fluid inclusions in re-equilibration experiments at constant temperature and confining pressure. Chem. Geol. 2016, 424, 43–85. [Google Scholar] [CrossRef]
- Kerrick, D.M. Cold-seal systems. In Hydrothermal Experimental Techniques; Ulmer, G.C., Barnes, H.L., Eds.; Wiley: New York, NY, USA, 1987; pp. 293–323. [Google Scholar]
- Shelton, K.L.; Orville, P.M. Formation of synthetic fluid inclusions in natural quartz. Am. Mineral. 1980, 65, 1233–1236. [Google Scholar]
- Smith, D.L.; Evans, B. Diffusional crack healing in quartz. J. Geoph. Res. 1984, 89, 4125–4135. [Google Scholar] [CrossRef]
- Brantley, S.L.; Evans, B.; Hickman, S.H.; Crerar, D.A. Healing of microcracks in quartz: Implications for fluid flow. Geology 1990, 18, 136–139. [Google Scholar] [CrossRef]
- Haar, L.; Gallagher, J.S.; Kell, G.S. NBS/NRC Steam Tables; Hemisphere Publishing Corporation: Washington, DC, USA, 1984. [Google Scholar]
- Driesner, T. The system H2O-NaCl. Part II: Correlation for molar volume, enthalpy, and isobaric heat capacity from 0 to 1000 °C, 1 to 5000 bar, and 0 to 1 XNaCl. Geochim. Cosmochim. Acta 2007, 71, 4902–4919. [Google Scholar] [CrossRef]
- Anderko, A.; Pitzer, K.S. Phase equilibria and volumetric properties of the system KCl-H2O and NaCl-KCl-H2O above 573 K: Equation of state representation. Geochim. Cosmochim. Acta 1993, 57, 4885–4897. [Google Scholar] [CrossRef]
- Hosieni, K.R.; Howald, R.A.; Scanlon, M.W. Thermodynamics of the lambda transition and the equation of state of quartz. Am. Mineral. 1985, 70, 782–793. [Google Scholar]
- Hill, P.G.; MacMillan, C.R.D.; Lee, V. A fundamental equation of state for heavy water. J. Phys. Chem. Ref. Data 1982, 11, 1–14. [Google Scholar] [CrossRef]
- Baumgartner, M.; Doppler, G.; Bakker, R.J. Preliminary results of experimental re-equilibration studies of natural H2O–CO2–NaCl bearing fluid inclusions in quartz. ECROFI-XXI. In Berichte der Geologischen Bundesanstalt; Geological Survey of Austria: Vienna, Austria, 2011; Volume 87, pp. 44–45. [Google Scholar]
- Rull, F. Structural investigation of water and aqueous solutions by Raman spectroscopy. Pure Appl. Chem. 2002, 74, 1859–1870. [Google Scholar] [CrossRef]
- Schrotter, H.W.; Klockner, H.W. Raman scattering cross-sections in gases and liquids. In Raman Spectroscopy of Gases and Liquids; Weber, A., Ed.; Springer-Verlag: Berlin, Germany, 1979; pp. 123–166. [Google Scholar]
- Dubessy, J.; Poty, B.; Ramboz, C. Advances in C–O–H–N–S fluid geochemistry based on micro-Raman spectrometric analysis of fluid inclusions. Eur. J. Mineral. 1989, 1, 517–534. [Google Scholar] [CrossRef]
- Bakker, R.J.; Jansen, J.B.H. A mechanism for preferential H2O leakage from fluid inclusions in quartz, based on TEM observations. Contrib. Mineral. Petrol. 1994, 116, 7–20. [Google Scholar] [CrossRef]
- Audétat, A.; Günther, D. Mobility and H2O loss from fluid inclusions in natural quartz crystals. Contrib. Mineral. Petrol. 1999, 137, 1–14. [Google Scholar]
- Diamond, L.W.; Tarantola, A.; Stünitz, H. Modification of fluid inclusions in quartz by deviatoric stress II: Experimentally induced changes in inclusion volume and composition. Contrib. Mineral. Petrol. 2010, 160, 845–864. [Google Scholar] [CrossRef]
- Baumgartner, M.; Bakker, R.J.; Doppler, G. Re-equilibration of natural H2O-CO2-salt-rich fluid inclusions in quartz—Part 1: Experiments in pure water at constant pressures and differential pressures at 600 °C. Contrib. Mineral. Petrol. 2014, 168, 1017. [Google Scholar] [CrossRef]
Figure 1.
Schematic of the experimental setup, illustrating the position of the Au-capsule within the autoclave, the external furnace system and the attachment of the autoclave to the high-pressure line with an extra entry for the internal thermocouple. See the text for further details.
Figure 1.
Schematic of the experimental setup, illustrating the position of the Au-capsule within the autoclave, the external furnace system and the attachment of the autoclave to the high-pressure line with an extra entry for the internal thermocouple. See the text for further details.

Figure 2.
Example of a log-file of a fluid inclusion synthesis experiment. The red line illustrates the recorded temperature, pressure and run time: (a) temperature-pressure diagram with the isochores 21, 25 and 30 cm3/mol of pure H2O and the liquid-vapor curve with the critical point (crit.); (b) experimental runtime-temperature diagram; (c) experimental runtime-pressure diagram illustrating a minor increase in pressure.

Figure 3.
Schematic of the crack-healing process in quartz (qtz) with the formation of quartz bridges within the crack and the formation of fluid inclusions (fi); shaded areas are filled with fluid: (a) open crack; (b) partly-healed crack (rem is the remaining open part of the crack).
Figure 3.
Schematic of the crack-healing process in quartz (qtz) with the formation of quartz bridges within the crack and the formation of fluid inclusions (fi); shaded areas are filled with fluid: (a) open crack; (b) partly-healed crack (rem is the remaining open part of the crack).

Figure 4.
Photomicrograph of a partially-healed crack within quartz (top view), with the intergrowth of rounded quartz bridges and the formation of fluid-filled tubes (fi).
Figure 4.
Photomicrograph of a partially-healed crack within quartz (top view), with the intergrowth of rounded quartz bridges and the formation of fluid-filled tubes (fi).

Figure 5.
Example of a Raman spectrum of a D2O-H2O mixture from a single fluid inclusion.

Figure 6.
Comparison between standard solutions of H2O-D2O mixtures with known composition and area fractions in Raman spectra. Equation (1) is represented by the diagonal dashed line (1:1).
Figure 6.
Comparison between standard solutions of H2O-D2O mixtures with known composition and area fractions in Raman spectra. Equation (1) is represented by the diagonal dashed line (1:1).

Figure 7.
Comparison of the melting temperature of ice (H2O-D2O mixtures) in re-equilibrated fluid inclusion assemblages from the experiments GMR-002c and GMR-010a and area fractions in the corresponding Raman spectra. The diagonal solid line represents the ideal mixing of H2O and D2O.
Figure 7.
Comparison of the melting temperature of ice (H2O-D2O mixtures) in re-equilibrated fluid inclusion assemblages from the experiments GMR-002c and GMR-010a and area fractions in the corresponding Raman spectra. The diagonal solid line represents the ideal mixing of H2O and D2O.

Figure 8.
Photomicrographs of synthetic fluid inclusions in three different settings of re-equilibration: (a) H2O fluid inclusions with a pure D2O pore fluid (GMR-004a); (b) H2O-NaCl fluid inclusions with a pure H2O pore fluid (GMR-005a); (c) H2O fluid inclusions with a pure H2O pore fluid (GMR-004g).

Figure 9.
Modification of Th (ΔTh) versus Tm of individual fluid inclusions after the re-equilibration experiments with: (a) a variety of run-times at about 600 °C and 336 MPa (GMR-004b, GMR-002c, GMR-004a); (b) GMR-004c; and (c) a variety of temperatures with about a 458-h run-time (GMR-007a, GMR-008a, GMR004a). The dashed lines represent the ideal mixing behavior of H2O and D2O.

Figure 10.
D2O concentration profile of synthetic fluid inclusions in quartz after the re-equilibration experiment GMR-004a. The dashed curves illustrate the concentration profiles for specific constant sizes of fluid inclusions (area of <20 µm2 and >500 µm2 in the microscope view). The red symbols represent shifted values (open arrows) due to an overestimated distance between the inclusion and quartz-surface (see also Figure 12b).

Figure 11.
D2O composition versus fluid inclusion size (in µm2), as observed from two-dimensional projections in microscope images after re-equilibration experiment with GMR-004a, at specific depths: (a) 19–29 µm; (b) 46–56 µm; and (c) 125–135 µm. The dashed lines are concentrations according to classical diffusion models [8]. The red symbols are defined in Figure 10.
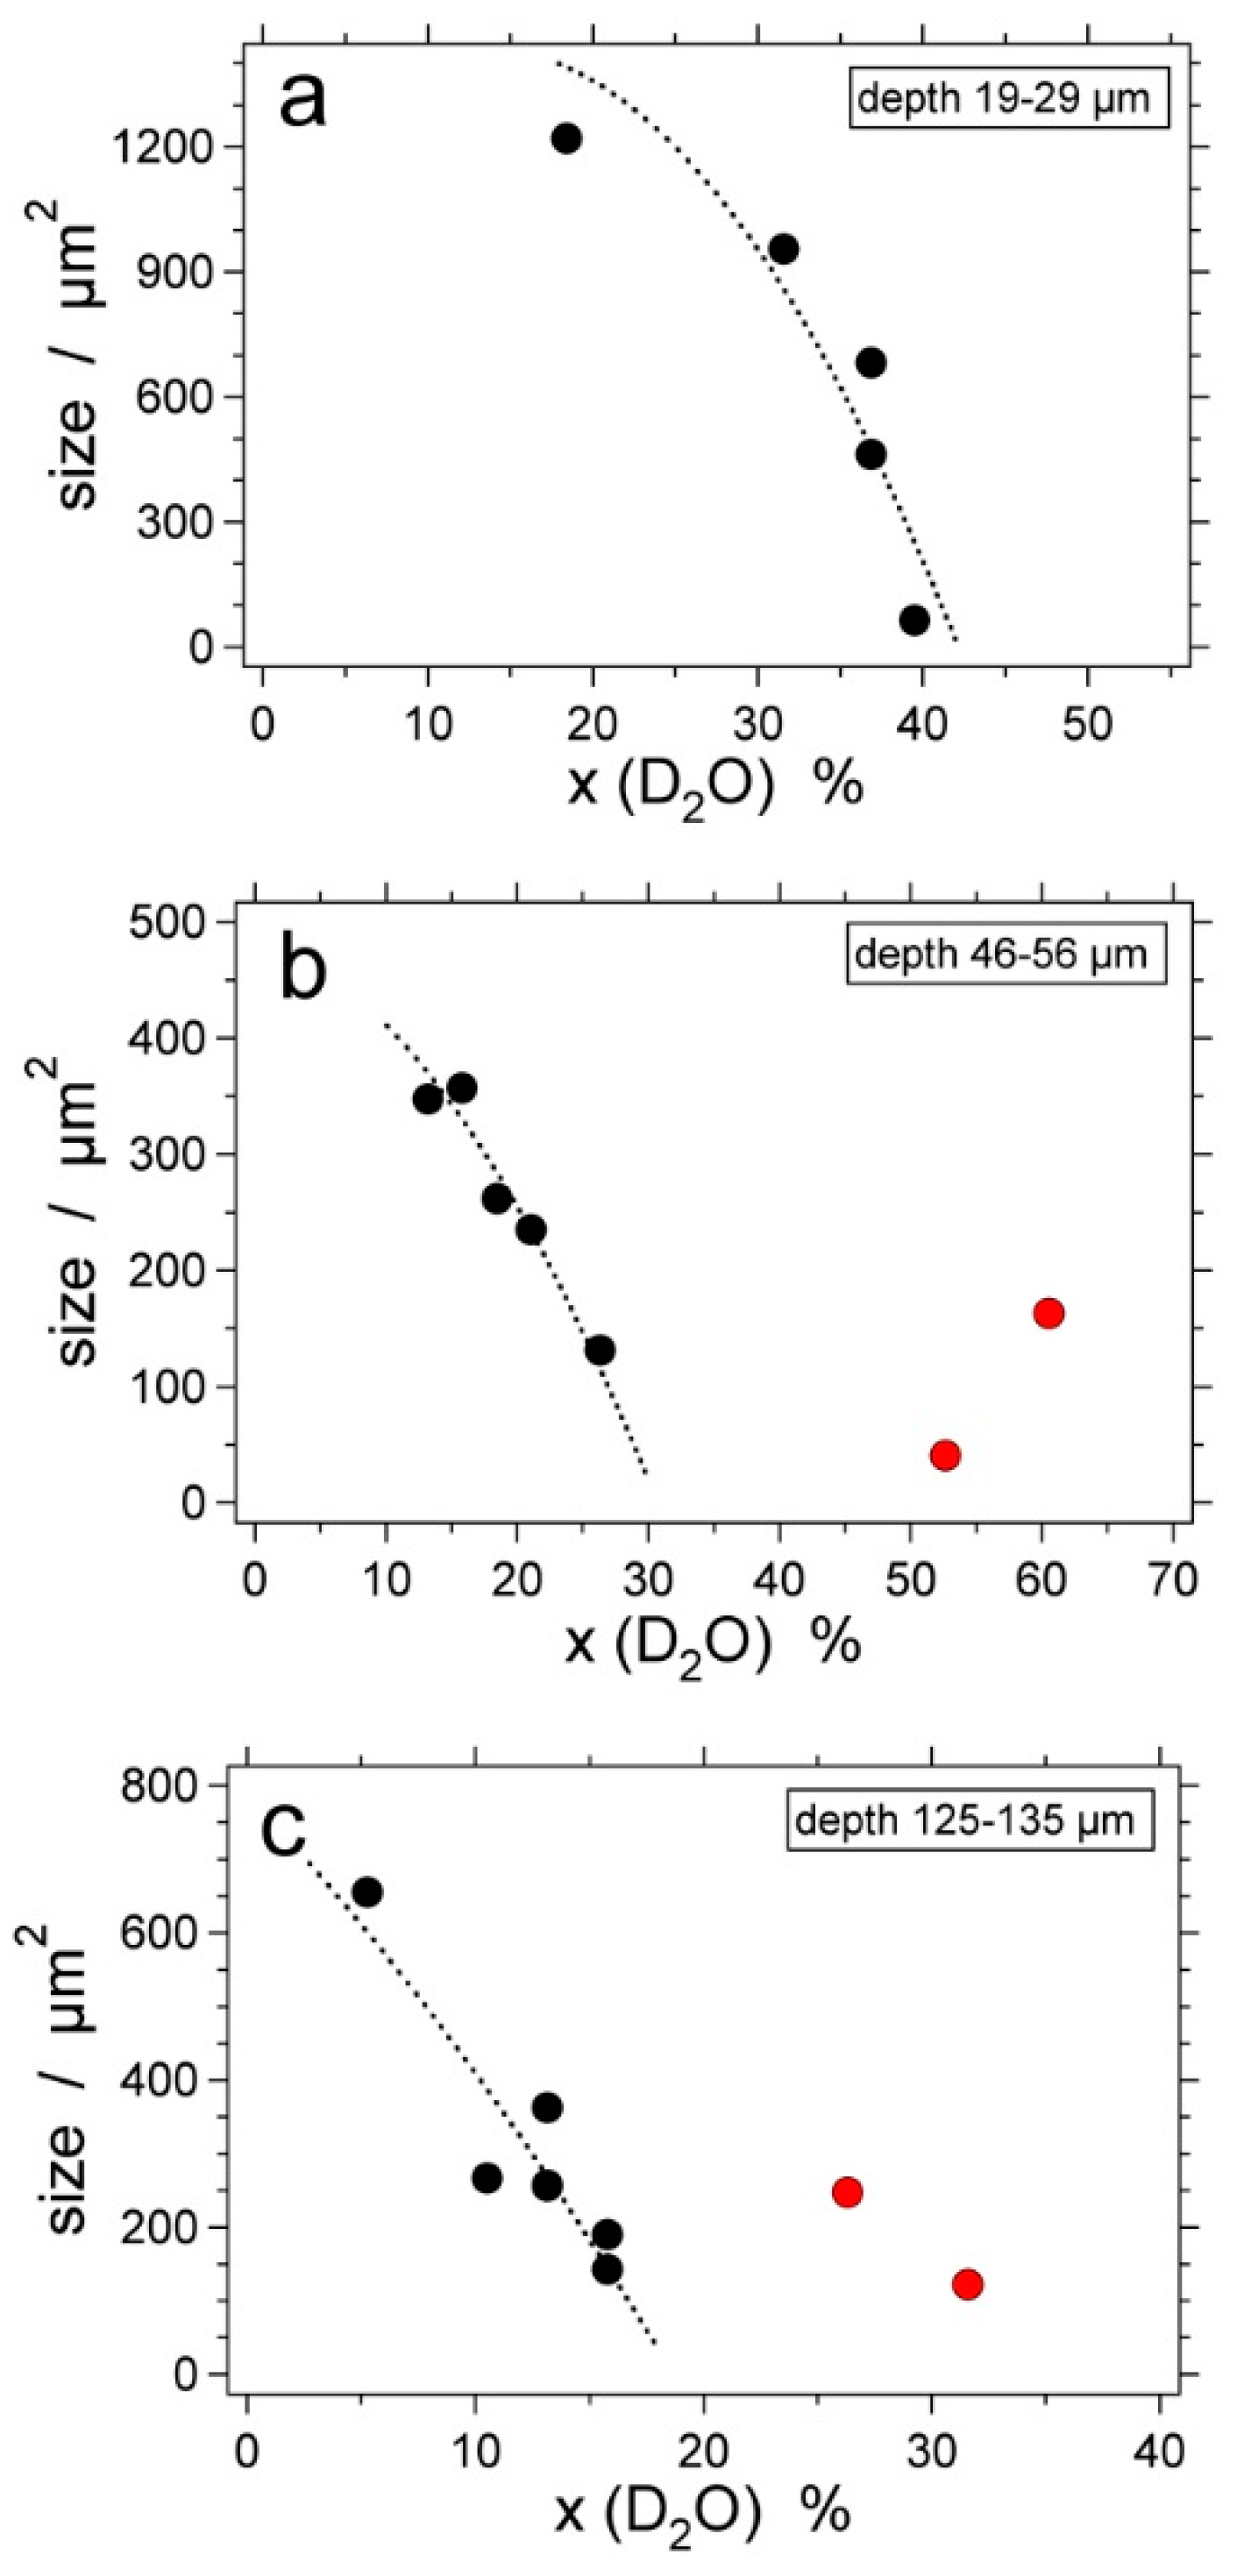
Figure 12.
(a) Schematic drawing of D2O concentrations in synthetic fluid inclusion as a function of size and depth according to classical diffusion models; numbers are mole% D2O; (b) overestimation of the distance of the quartz surface to fluid inclusions (fi), if the remaining open crack is neglected (cf. distance d with d’).

Figure 13.
Temperature-pressure diagram with the experimental conditions of GMR-009 in the α-quartz stability field and GMR-010 in the β-quartz stability field. The red line is the isochore of 27.5 cm3/mol.
Figure 13.
Temperature-pressure diagram with the experimental conditions of GMR-009 in the α-quartz stability field and GMR-010 in the β-quartz stability field. The red line is the isochore of 27.5 cm3/mol.
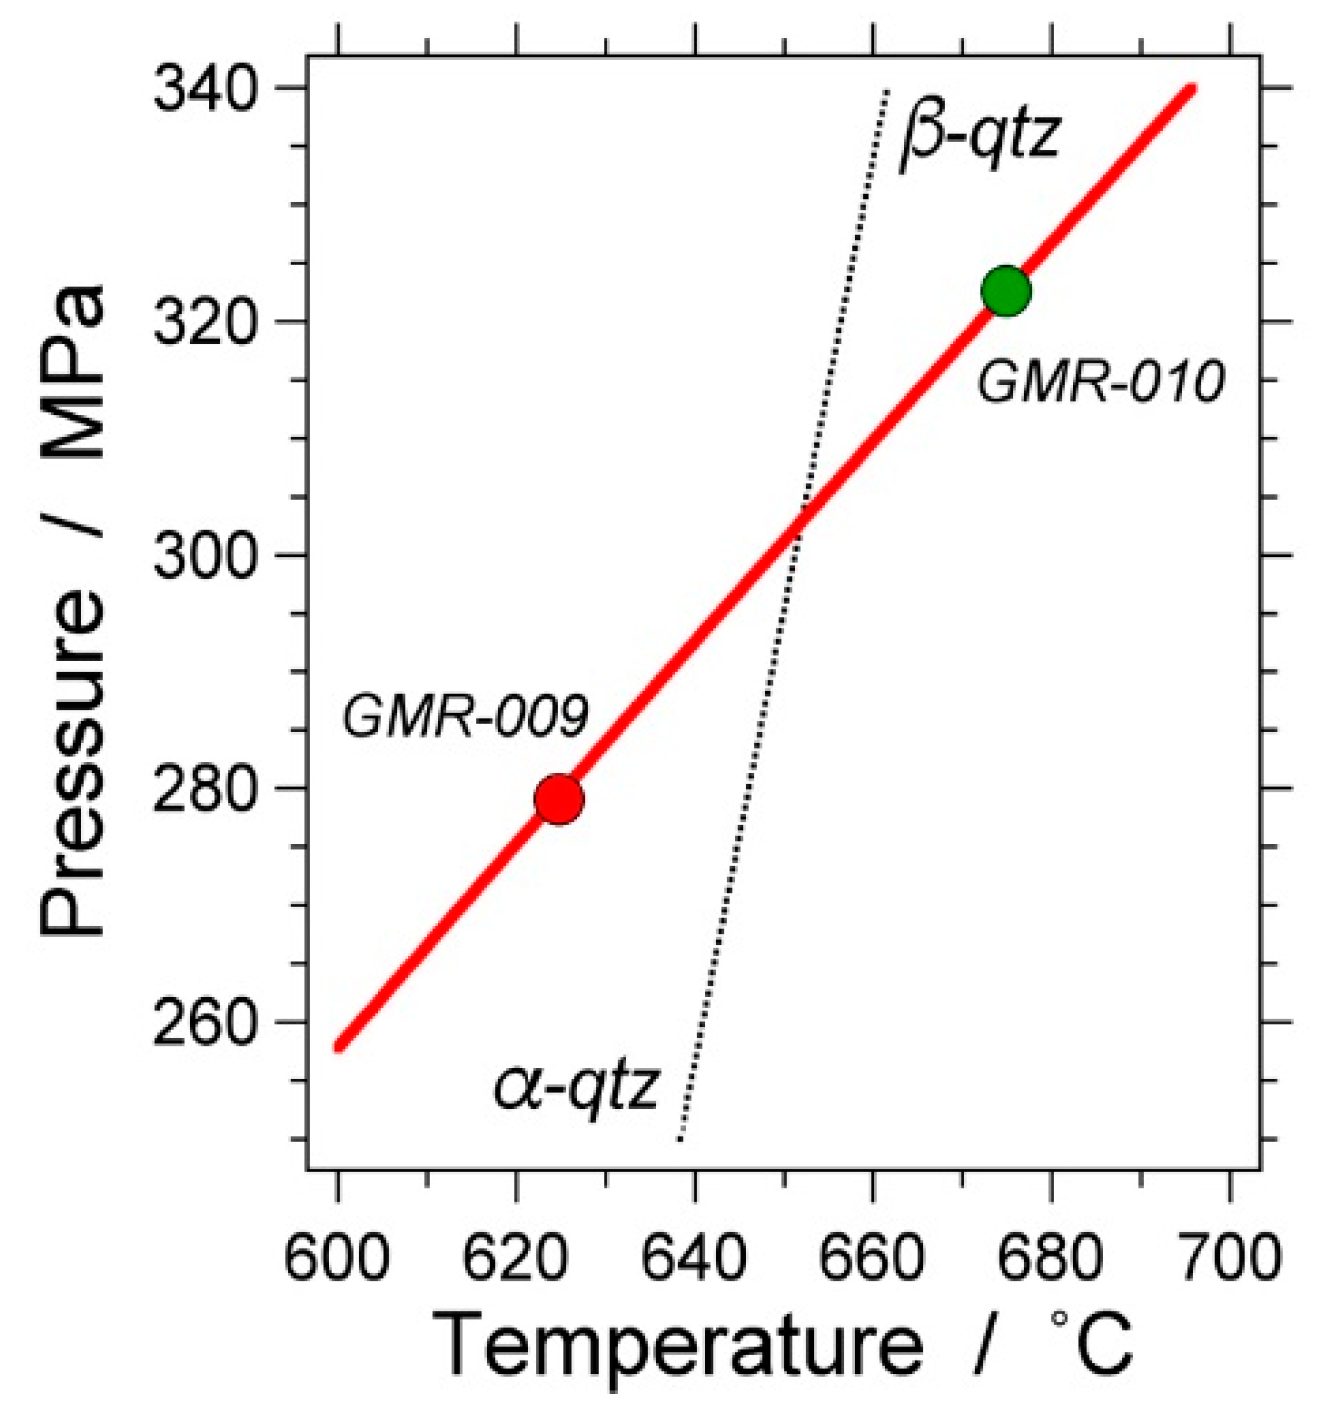
Figure 14.
Modification of Th (ΔTh) versus Tm of individual fluid inclusions after the re-equilibration experiments GMR-009a (red symbols) and GMR-010a (green symbols). The dashed lines represent the ideal mixing behavior of H2O and D2O for both experiments.
Figure 14.
Modification of Th (ΔTh) versus Tm of individual fluid inclusions after the re-equilibration experiments GMR-009a (red symbols) and GMR-010a (green symbols). The dashed lines represent the ideal mixing behavior of H2O and D2O for both experiments.

Figure 15.
D2O composition versus fluid inclusion size (in µm2), as observed from two-dimensional projections in microscope images after re-equilibration experiment GMR-009a (red symbols) and GMR-010a (green symbols).
Figure 15.
D2O composition versus fluid inclusion size (in µm2), as observed from two-dimensional projections in microscope images after re-equilibration experiment GMR-009a (red symbols) and GMR-010a (green symbols).
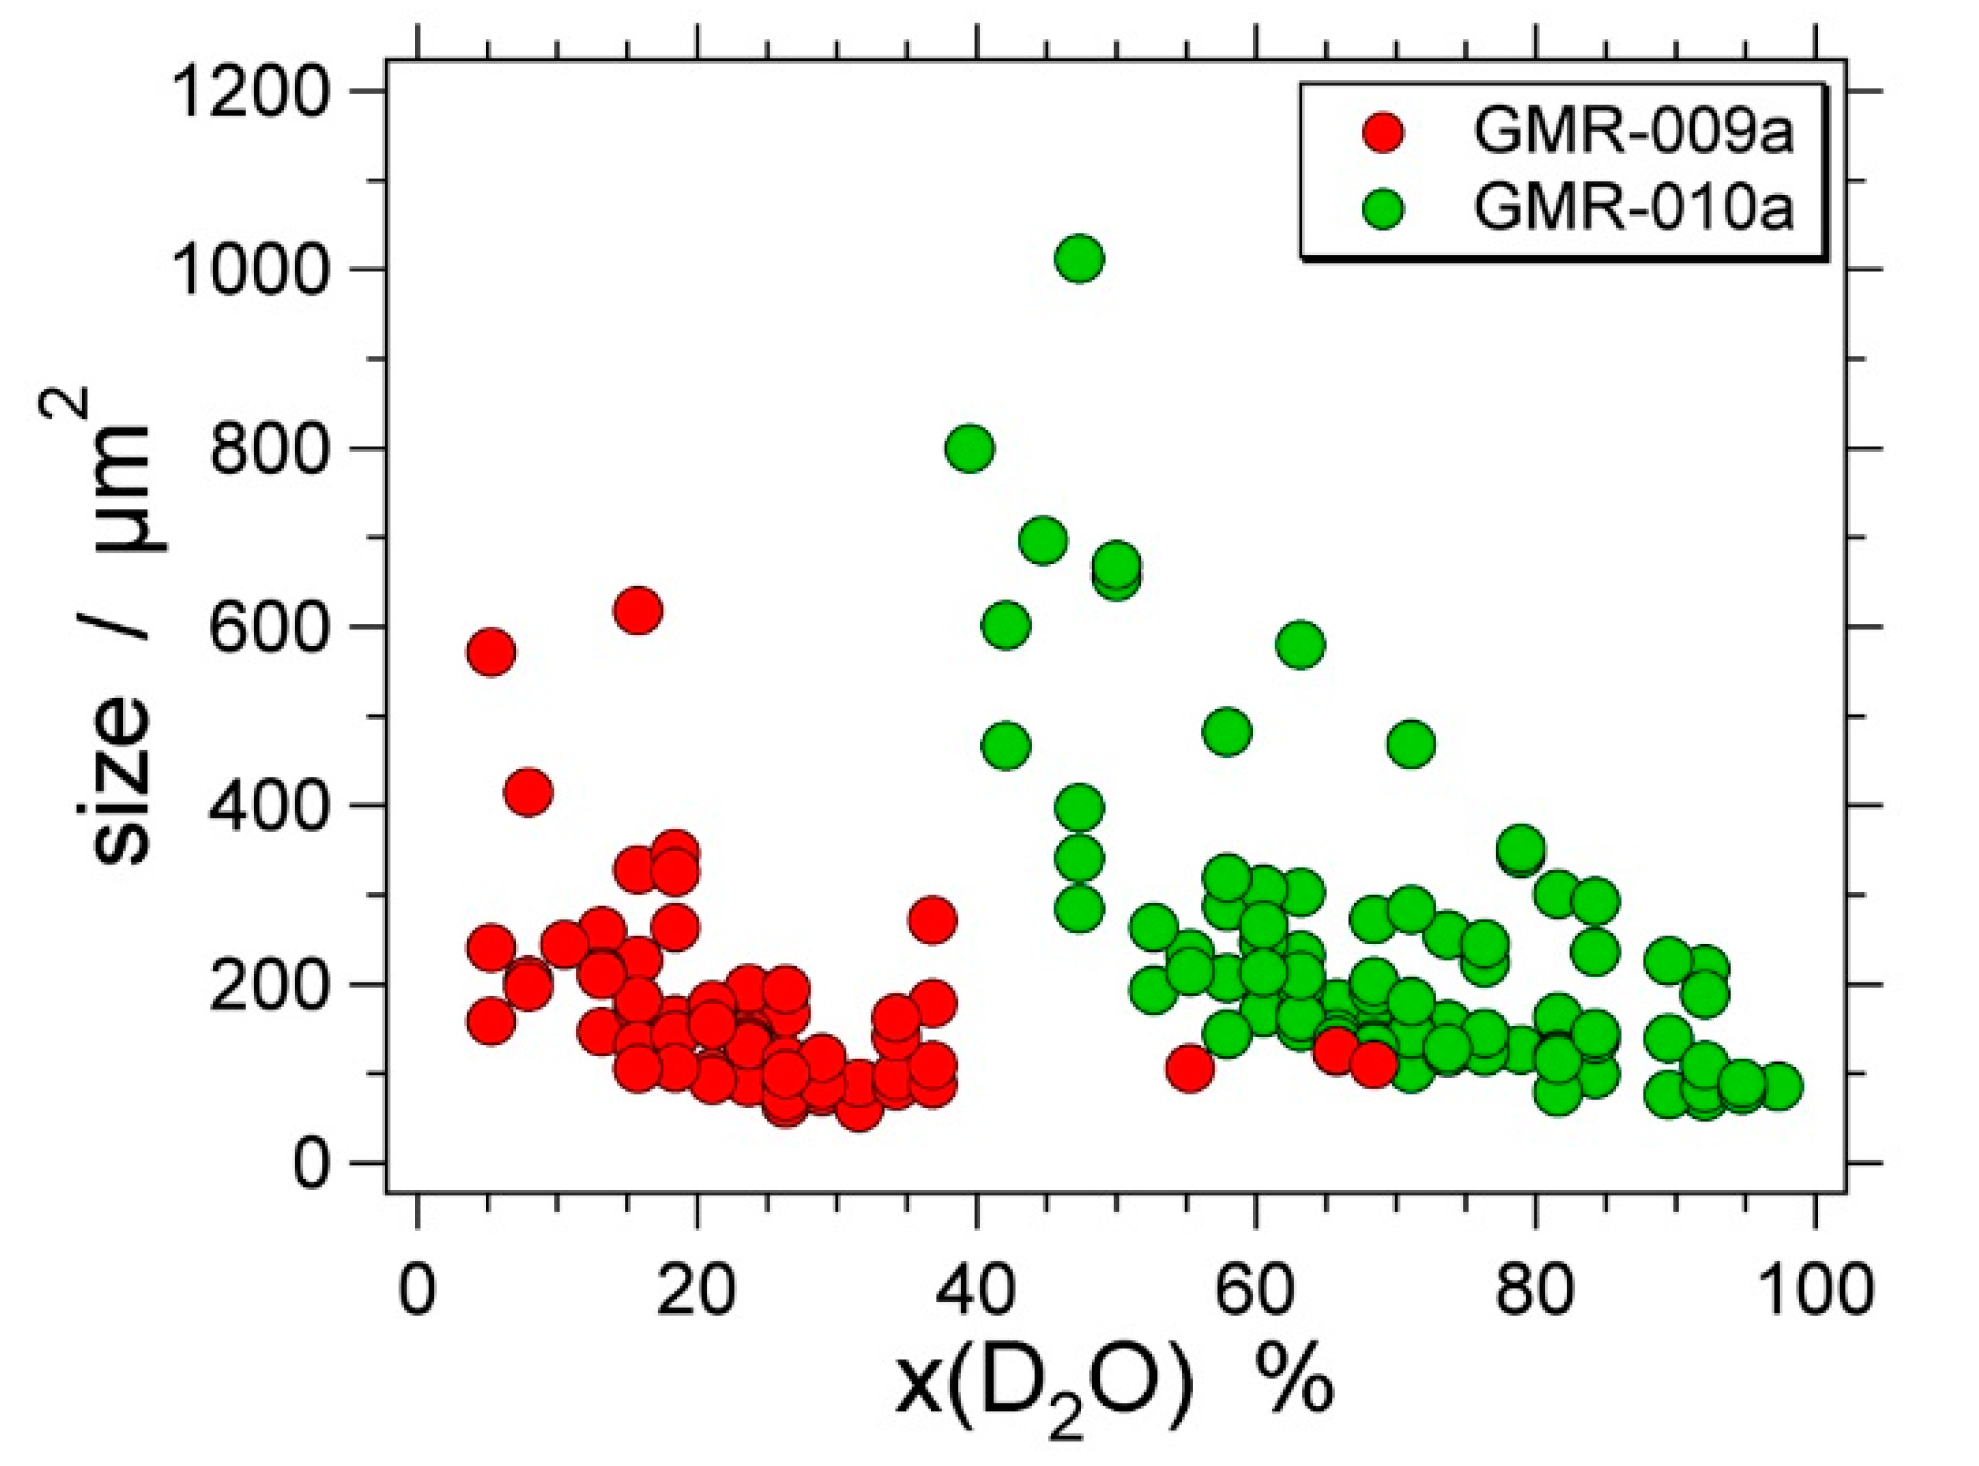
Figure 16.
Modification of Th (ΔTh) versus salinity (mass% NaCl) of individual fluid inclusions after the re-equilibration experiments GMR-005c (open symbols), GMR-005a (green symbols) and GMR-005b (red symbols). The eutectic composition is illustrated with a vertical dashed line. The original synthetic fluid inclusions are located at 19.8 mass% NaCl and ΔTh = 0 (orig.). The expected modification according to diffusion is illustrated with the purple square (diff.).

Figure 17.
Preferential H2O loss (in the amount of substance fraction, also known as mole%) versus total volume loss of the fluid inclusion (in vol %) (after Bakker and Doppler [12]). The run-times of the experiments are illustrated with numbers (in hours), and the diagonal dashed line indicates an equal percentage of total volume loss and preferential H2O loss.


Table 1.
Conditions of the fluid inclusion synthesis experiments.
| Experiment | Loaded Fluid | Pressure (MPa) | Temperature (°C) | Duration (Hours) | |||
|---|---|---|---|---|---|---|---|
| H2O 1 | NaCl 1 | Average 2 | Range 3 | Average 2 | Range 3 | ||
| GMR-002 | 100 | - | 338.5 (1.3) | 335.7–341.3 | 600.2 (0.10) | 600.0–600.4 | 460.4 |
| GMR-004 | 100 | - | 336.3 (0.46) | 334.4–337.6 | 600.6 (0.41) | 598.4–603.3 | 457.4 |
| GMR-005 | 80.2 | 19.8 | 336.9 (0.55) | 335.3–338.5 | 600.7 (0.31) | 598.8–601.1 | 458.6 |
| GMR-006 | 100 | - | 337.6 (0.77) | 335.9–338.9 | 300.1 (0.52) | 299.7–300.6 | 457.3 |
| GMR-007 | 100 | - | 337.7 (0.45) | 336.7–338.6 | 400.8 (0.60) | 400.1–401.2 | 457.2 |
| GMR-008 | 100 | - | 334.9 (0.79) | 333.0–337.0 | 500.1 (0.34) | 499.7–500.3 | 459.2 |
| GMR-009 | 100 | - | 279.1 (0.48) | 278.3–280.0 | 624.8 (0.33) | 623.9–625.2 | 458.1 |
| GMR-010 | 100 | - | 322.6 (0.30) | 321.7–323.3 | 674.9 (0.31) | 674.1–675.3 | 459.2 |
| GMR-011 | 90 | 10 | 337.4 (0.19) | 336.6–338.0 | 599.7 (0.13) | 598.2–600.3 | 462.4 |
| GMR-013 | 100 | - | 280.9 (0.17) | 280.4–281.3 | 675.0 (0.22) | 674.1–675.2 | 456.2 |
| GMR-014 | 83.7 | 16.3 | 337.4 (0.54) | 332.5–338.2 | 600.4 (0.35) | 597.2–601.1 | 454.3 |
1 Fluid loaded in the Au-capsule, in mass%; 2 standard deviation in brackets; 3 99.9% of the logged temperature and pressure fall within the range.
Table 2.
Summary of calculated molar volumes (Vm) and microthermometric data on fluid inclusions.
| Experiment | Experimental Vm (cm3/mol) 12 | Corrected Values 3 | Th Measured (°C) | ||||
|---|---|---|---|---|---|---|---|
| Th (°C) 2 | Vm (cm3/mol) 2 | Disk 4 | Mean | Std. Dev. 5 | Range | ||
| GMR-002 | 24.97 (0.03) | 291.9 (0.4) | 24.73 (0.03) | c | 293.2 | 1.1 | 291.4–297.8 |
| GMR-004 | 25.03 (0.02) | 292.8 (0.3) | 24.78 (0.02) | a | 293.1 | 0.8 | 288.5–295.6 |
| b | 292.7 | 0.9 | 290.5–295.8 | ||||
| c | 293.8 | 1.1 | 290.4–296.8 | ||||
| g | 292.8 | 1.4 | 286.5–295.2 | ||||
| GMR-005 | 23.73 (0.01) | 324.1 (0.3) | 23.54 (0.01) | a | 329.7 | 1.5 | 324.4–332.8 |
| b | 327.0 | 3.0 | 316.6–330.8 | ||||
| c | 328.3 | 2.5 | 321.5–332.1 | ||||
| GMR-006 | 19.06 (0.01) | 118.9 (0.7) | 19.08 (0.01) | a | 130.9 | 2.9 | 126.0–136.8 |
| GMR-007 | 20.66 (0.02) | 193.7 (0.7) | 20.66 (0.02) | a | 199.8 | 2.8 | 191.4–205.0 |
| GMR-008 | 22.67 (0.02) | 251.3 (0.5) | 22.60 (0.02) | a | 254.3 | 2.9 | 236.2–259.4 |
| GMR-009 | 27.50 (0.03) | 320.6 (0.3) | 27.05 (0.03) | a | 323.7 | 0.8 | 321.3–326.0 |
| b | 323.7 | 0.8 | 321.9–325.5 | ||||
| GMR-010 | 27.48 (0.02) | 317.5 (0.2) | 26.75 (0.02) | a | 322.9 | 0.9 | 320.9–326.8 |
| b | 322.0 | 0.8 | 319.4–324.6 | ||||
| GMR-011 | 24.17 (0.01) | 309.9 (0.2) | 23.96 (0.01) | a | 313.9 | 0.8 | 311.8–318.8 |
| GMR-013 | 29.15 (0.02) | 332.2 (0.2) | 28.38 (0.02) | a | 337.3 | 0.7 | 335.3–338.9 |
| GMR-014 | 23.86 (0.02) | 319.2 (0.5) | 23.66 (0.02) | a | 328.5 | 1.3 | 324.8–331.9 |
1 Calculated for trapping conditions; 2 standard deviations are given in brackets, calculated from experimental T-p conditions; 3 corrected homogenization temperature and molar volume according to the expansivity and compressibility of quartz [20] along the isochore; 4 individual quartz disk from the synthesis experiments that was prepared for re-equilibration experiments; 5 two-thirds of all measurements fall within the standard deviation.
Table 3.
Conditions of re-equilibration experiments.
| Synthesis | Re-Equilibration Experiments | ||||||
|---|---|---|---|---|---|---|---|
| Loaded Fluid | Pressure (MPa) | Temperature (°C) | Duration (h) | ||||
| Experiment | Disk | Average 1 | Range 2 | Average 1 | Range 2 | ||
| GMR-002 | c | D2O | 336.84 (0.20) | 336.22–337.49 | 599.87 (0.07) | 599.5–600.1 | 120.8 |
| GMR-004 | a | D2O | 336.74 (1.10) | 335.27–339.32 | 599.86 (0.23) | 597.8–610.3 | 450.4 |
| b | D2O | 337.30 (0.49) | 333.47–338.39 | 600.53 (0.32) | 599.2–600.9 | 29.8 | |
| c | D2O | 336.60 (0.83) | 334.35–337.80 | 600.28 (0.26) | 599.7–609.1 | 960.0 | |
| g | H2O | 338.25 (0.32) | 336.03–340.04 | 600.03 (0.32) | 598.7–611.0 | 458.6 | |
| GMR-005 | a | H2O | 336.1 (0.84) | 334.8–338.0 | 600.70 (0.08) | 598.9–600.8 | 458.9 |
| b | H2O | 337.5 (1.57) | 335.1–340.3 | 600.30 (0.30) | 599.8–613.9 | 961.6 | |
| c | H2O | 332.6 (0.30) | 331.5–333.2 | 600.70 (0.50) | 597.5–610.9 | 120.4 | |
| GMR-006 | a | D2O | 336.74 (0.37) | 334.08–343.61 | 300.11 (0.56) | 298.9–319.8 | 458.4 |
| GMR-007 | a | D2O | 337.17 (0.30) | 335.90–340.99 | 400.58 (0.36) | 399.8–416.4 | 457.2 |
| GMR-008 | a | D2O | 337.27 (0.17) | 336.60–340.23 | 499.67 (0.44) | 498.7–512.4 | 459.5 |
| GMR-009 | a | D2O | 278.42 (1.13) | 276.36–281.35 | 624.73 (0.23) | 623.1–636.3 | 457.8 |
| b | H2O | 281.17 (0.93) | 277.10–283.07 | 624.46 (1.72) | 617.0–636.0 | 458.3 | |
| GMR-010 | a | D2O | 321.15 (0.51) | 320.00–322.28 | 674.63 (0.34) | 673.9–675.2 | 458.3 |
| b | H2O | 319.66 (0.39) | 318.94–320.87 | 675.22 (0.39) | 670.5–683.3 | 453.7 | |
| GMR-011 | a | H2O | 337.89 (0.38) | 336.47–339.42 | 600.08 (0.21) | 597.2–608.2 | 458.1 |
| GMR-013 | a | D2O | 279.38 (0.31) | 278.55–280.36 | 674.60 (0.22) | 672.9–680.6 | 457.1 |
| GMR-014 | a | H2O | 338.69 (0.14) | 337.79–341.04 | 599.57 (0.31) | 598.9–609.9 | 959.7 |
1 Standard deviation in brackets; 2 99.9% of the logged temperature and pressure fall within the range.
Table 4.
Average conditions in fluid inclusions during re-equilibration experiments, calculated from measured homogenization temperatures after synthesis (Table 2).
Table 4.
Average conditions in fluid inclusions during re-equilibration experiments, calculated from measured homogenization temperatures after synthesis (Table 2).
| Experiment | Disk | Pressure (MPa) 1 | H2O Fugacity (MPa) 1 | Pressure Gradient (MPa) 2 | ||
|---|---|---|---|---|---|---|
| Average | Min. | Max. | ||||
| GMR-002 | c | 334.34 (329.68–337.46) | 174.18 (171.38–176.10) | −2.50 | −7.36 | +0.82 |
| GMR-004 | a | 334.62 (330.61–337.03) | 174.34 (171.82–175.98) | −2.12 | −7.23 | +1.39 |
| b | 336.35 (331.98–339.14) | 175.75 (172.94–177.62) | −0.95 | −5.81 | +2.33 | |
| c | 331.52 (328.27–336.39) | 172.71 (170.64–175.78) | −5.80 | −9.16 | +0.62 | |
| g | 335.60 (329.87–339.76) | 175.03 (171.42–177.72) | −2.65 | −8.70 | +1.83 | |
| GMR-005 | a | 320.29 (312.77–333.44) | 148.65 (144.86–155.46) * | −15.81 | −23.33 | −2.66 |
| b | 326.94 (317.60–356.74) | 151.86 (147.09–167.89) * | −10.56 | −19.90 | +19.24 | |
| b | 323.72 (314.46–343.69) | 150.40 (145.70–160.93) * | −8.88 | −18.19 | +11.09 | |
| GMR-006 | a | 310.83 (303.38–318.27) | 25.90 (24.97–26.85) | −25.91 | −33.37 | −18.10 |
| GMR-007 | a | 322.53 (315.25–329.85) | 65.11 (63.21–67.07) | −14.64 | −22.22 | −7.02 |
| GMR-008 | a | 326.49 (319.73–333.28) | 115.93 (113.40–118.51) | −10.78 | −17.71 | −3.82 |
| GMR-009 | a | 270.18 (267.78–272.58) | 148.97 (145.54–150.40) | −8.24) | −11.77 | −4.71 |
| b | 269.99 (266.53–273.46) | 148.75 (146.13–151.41) | −11.18 | −15.57 | −6.78 | |
| GMR-010 | a | 307.00 (304.16–309.85) | 193.47 (191.37–195.59) | −14.15 | −17.50 | −10.79 |
| b | 310.05 (307.45–312.65) | 195.85 (193.87–197.84) | −9.61 | −12.60 | −6.62 | |
| GMR-011 | a | 326.02 (313.97–331.23) | 158.09 (151.64–160.94) * | −11.87 | −23.92 | −6.63 |
| GMR-013 | a | 265.55 (263.32–267.80) | 166.16 (164.67–167.69) | −13.83 | −16.37 | −11.27 |
| GMR-014 | a | 312.00 (303.95–320.89) | 146.34 (142.31–150.90) * | −26.69 | −34.74 | −17.80 |
1 The spread according to the variation of measured homogenization temperatures in brackets; 2 gradient between the Au-capsule and inclusions; negative values correspond to internal under-pressures; * fugacities in H2O-NaCl mixtures calculated with Anderko and Pitzer [19].
Table 5.
Average D2O molar volume (Vm) in the experimental conditions and corrected values of homogenization temperatures and molar volumes in homogenization conditions according to the quartz expansivity and compressibility [20] along the isochores in re-equilibration experiments.
Table 5.
Average D2O molar volume (Vm) in the experimental conditions and corrected values of homogenization temperatures and molar volumes in homogenization conditions according to the quartz expansivity and compressibility [20] along the isochores in re-equilibration experiments.
| Experiment | Disk | Vm (cm3/mol) | Corrected Values | |
|---|---|---|---|---|
| Th (°C) | Vm (cm3/mol) | |||
| GMR-002 | c | 24.91 | 288.0 | 24.67 |
| GMR-004 | a | 24.92 | 288.0 | 24.67 |
| b | 24.92 | 288.0 | 24.67 | |
| b | 24.93 | 288.2 | 24.68 | |
| GMR-006 | a | 19.09 | 118.3 | 19.12 |
| GMR-007 | a | 20.77 | 195.4 | 20.76 |
| GMR-008 | a | 22.68 | 250.1 | 22.66 |
| GMR-009 | a | 27.45 | 316.9 | 27.00 |
| GMR-010 | a | 27.26 | 312.0 | 26.53 |
| GMR-013 | a | 29.04 | 328.1 | 28.26 |
© 2017 by the author. Licensee MDPI, Basel, Switzerland. This article is an open access article distributed under the terms and conditions of the Creative Commons Attribution (CC BY) license (http://creativecommons.org/licenses/by/4.0/).
Share and Cite
MDPI and ACS Style
Bakker, R.J. Re-Equilibration Processes in Fluid Inclusion Assemblages. Minerals 2017, 7, 117. https://doi.org/10.3390/min7070117
AMA Style
Bakker RJ. Re-Equilibration Processes in Fluid Inclusion Assemblages. Minerals. 2017; 7(7):117. https://doi.org/10.3390/min7070117
Chicago/Turabian StyleBakker, Ronald J. 2017. "Re-Equilibration Processes in Fluid Inclusion Assemblages" Minerals 7, no. 7: 117. https://doi.org/10.3390/min7070117
Note that from the first issue of 2016, this journal uses article numbers instead of page numbers. See further details here.