Concentration at the Minimum Bubble Velocity (CMV) for Various Types of Flotation Frothers


1
Faculty of Geoengineering, Mining and Geology, Wroclaw University of Science and Technology, Wybrzeze Wyspianskiego 27, 50-370 Wroclaw, Poland
2
Department of Geoscience and Petroleum, Norwegian University of Science and Technology, Sem Sælands veg 1, NO-7491 Trondheim, Norway
3
Jerzy Haber Institute of Catalysis and Surface Chemistry PAS, Niezapominajek 8, 30-239 Krakow, Poland
*
Author to whom correspondence should be addressed.
Minerals 2017, 7(7), 118; https://doi.org/10.3390/min7070118
Submission received: 28 June 2017
/
Revised: 8 July 2017
/
Accepted: 10 July 2017
/
Published: 12 July 2017
Abstract
:This paper presents the determination of a concentration at the minimum bubble velocity (CMV) for different types of frothers, such as straight and branched alkyl chain aliphatic alcohols, 1,ω-diols, poly(propylene glycol) and poly(ethylene glycol) alkyl ethers, n-alkyltrimethylammonium bromides, commercial frothers and others. The values of terminal rise bubble velocity were reviewed from the experimental data published in the literature for two different types of columns, i.e., a short PAS (used in Polish Academy of Sciences) of height (35 cm) and a long McGill of height (350 cm). The obtained empirical equation is universal and allows one to rapidly and accurately determine the CMV for all surfactants. The proposed empirical model can also be used to predict the terminal bubble velocity–frother concentration curve by knowing the maximum and minimum terminal velocities, as well as the values of CMV. Assessment and usefulness of frother characterization parameters (i.e., concentration at the minimum bubble velocity (CMV), dynamic frothability index (DFI) and critical coalescence concentration (CCC)) were shown in the flotation of coal.
1. Introduction
Flotation frothers are surface active substances commonly used in a froth flotation separation process as an important additive of the pulping process. They are mainly aimed to modify the liquid/gas interface properties to enhance many essential fundamental factors (e.g., degree of gas dispersion, coalescence inhibition, bubble rise velocities, induction time, froth formation and stability) influencing the separation efficiency. Currently, a vast number of types of frothers are used, and the impact on the above-mentioned factors depends mainly on their surface activity in the chosen concentration range. This influence has to be experimentally determined in terms of the most efficient range of concentrations, where desired liquid/gas interface properties, triggering useful frothers’ features and allowing their classification, can be achieved. The experimentally determined parameters, which are commonly used for these purposes, are for example, the concentration at the minimum bubble velocity (CMV) [1,2,3], the critical coalescence concentration (CCC) [4,5,6], the concentration at half of the maximum foam height (CMH) [7] or the dynamic frothability index (DFI) [8,9,10]. Since all these parameters depend mainly on the properties of the liquid/gas interface, the corresponding characteristic frother concentration values can vary strongly, depending on the frother’s family (type) and carbon chain length.
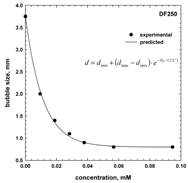
From the practical point of view, it would be very beneficial to determine a methodology, which can be used for the simple characterization and anticipation of frothers’ properties in terms of CMV, CCC, CMH and DFI variations, based on basic experimental results, which can be either found in a myriad of published papers or easily determined. In this paper, we show a methodology to obtain an empirical equation allowing the rapid and accurate determination of the value of the CMV for surface active substances commonly used as flotation frothers. In addition, it is shown that the proposed empirical approach can be used to predict the dependence of a rising bubble terminal velocity as a function of frother concentration only by knowing the border velocity values (maximum and minimum) and the CMV for a given system. This approach can also be extended for prediction of the bubble size–concentration curve, where the minimum and maximum bubble sizes, as well as the CCC value, are known.
2. Columns Used to Measure Bubble Velocity
In this work, the values of terminal rise bubble velocity were reviewed from the experimental data published in the literature. Two series of single bubble tests were considered: one at the Jerzy Haber Institute of Catalysis and Surface Chemistry, Polish Academy of Science in Krakow (Poland), shortly called PAS, using a short column (height 35 cm), and the other one at McGill University in Quebec (Canada), shortly called McGill, using a long column (350 cm). The experimental setups of both tests are presented in Figure 1.
The PAS setup was described in detail elsewhere [11]. The setup consisted of a basic level of (i) a square glass column (40 mm × 40 mm) with a height of 35 cm; (ii) a glass capillary with an inner diameter of 0.075 mm at the bottom of the column; (iii) a high-speed camera (1000–1024 frames per second); (iv) a high precision pump with a gas-tight syringe; (v) a light source; and (vi) a computer for data processing (Figure 1a). To determine profiles of the local velocity of the bubble detaching from the capillary, the bubble motion was monitored over the distance of ca. 300 mm. The bubble terminal velocity was calculated as an average for distances, where values of the local bubble velocity started to be constant. The distance of 300 mm was enough for the rising bubble to reach the terminal velocity [11,12].
The McGill experimental setup proposed by Finch and his co-workers was described in detail elsewhere [1,2,3] (Figure 1b). It comprised (i) a circular Plexiglas column with a 6.35 cm diameter and a height of 350 cm surrounded by a water jacket; (ii) a glass capillary with an inner diameter of 0.051 mm, (iii) a bubble generator (30 frames per second), (iv) a CCD camera and (v) a computer for data processing. The terminal bubble velocity was measured at the distance of 300 cm from the capillary.
Profiles of the local bubble velocity were determined for different types of chemical reagents, such as straight and branched alkyl chain aliphatic alcohols, 1,ω-diols, poly(propylene glycol) alkyl ethers (CnPm), poly(ethylene glycol) alkyl ethers (CnEm), n-alkyltrimethylammonium bromides, commercial frothers and others. The properties of chemical reagents used are shown in Table 1 in Section 4. All reagents were of the highest available purity and were used without further purification. Mili-Q water® was used in the tests, cleaning and preparation of surfactant solutions for the single bubble tests in the PAS column, while tap water was used in the McGill tests.
3. Terminal Bubble Velocity
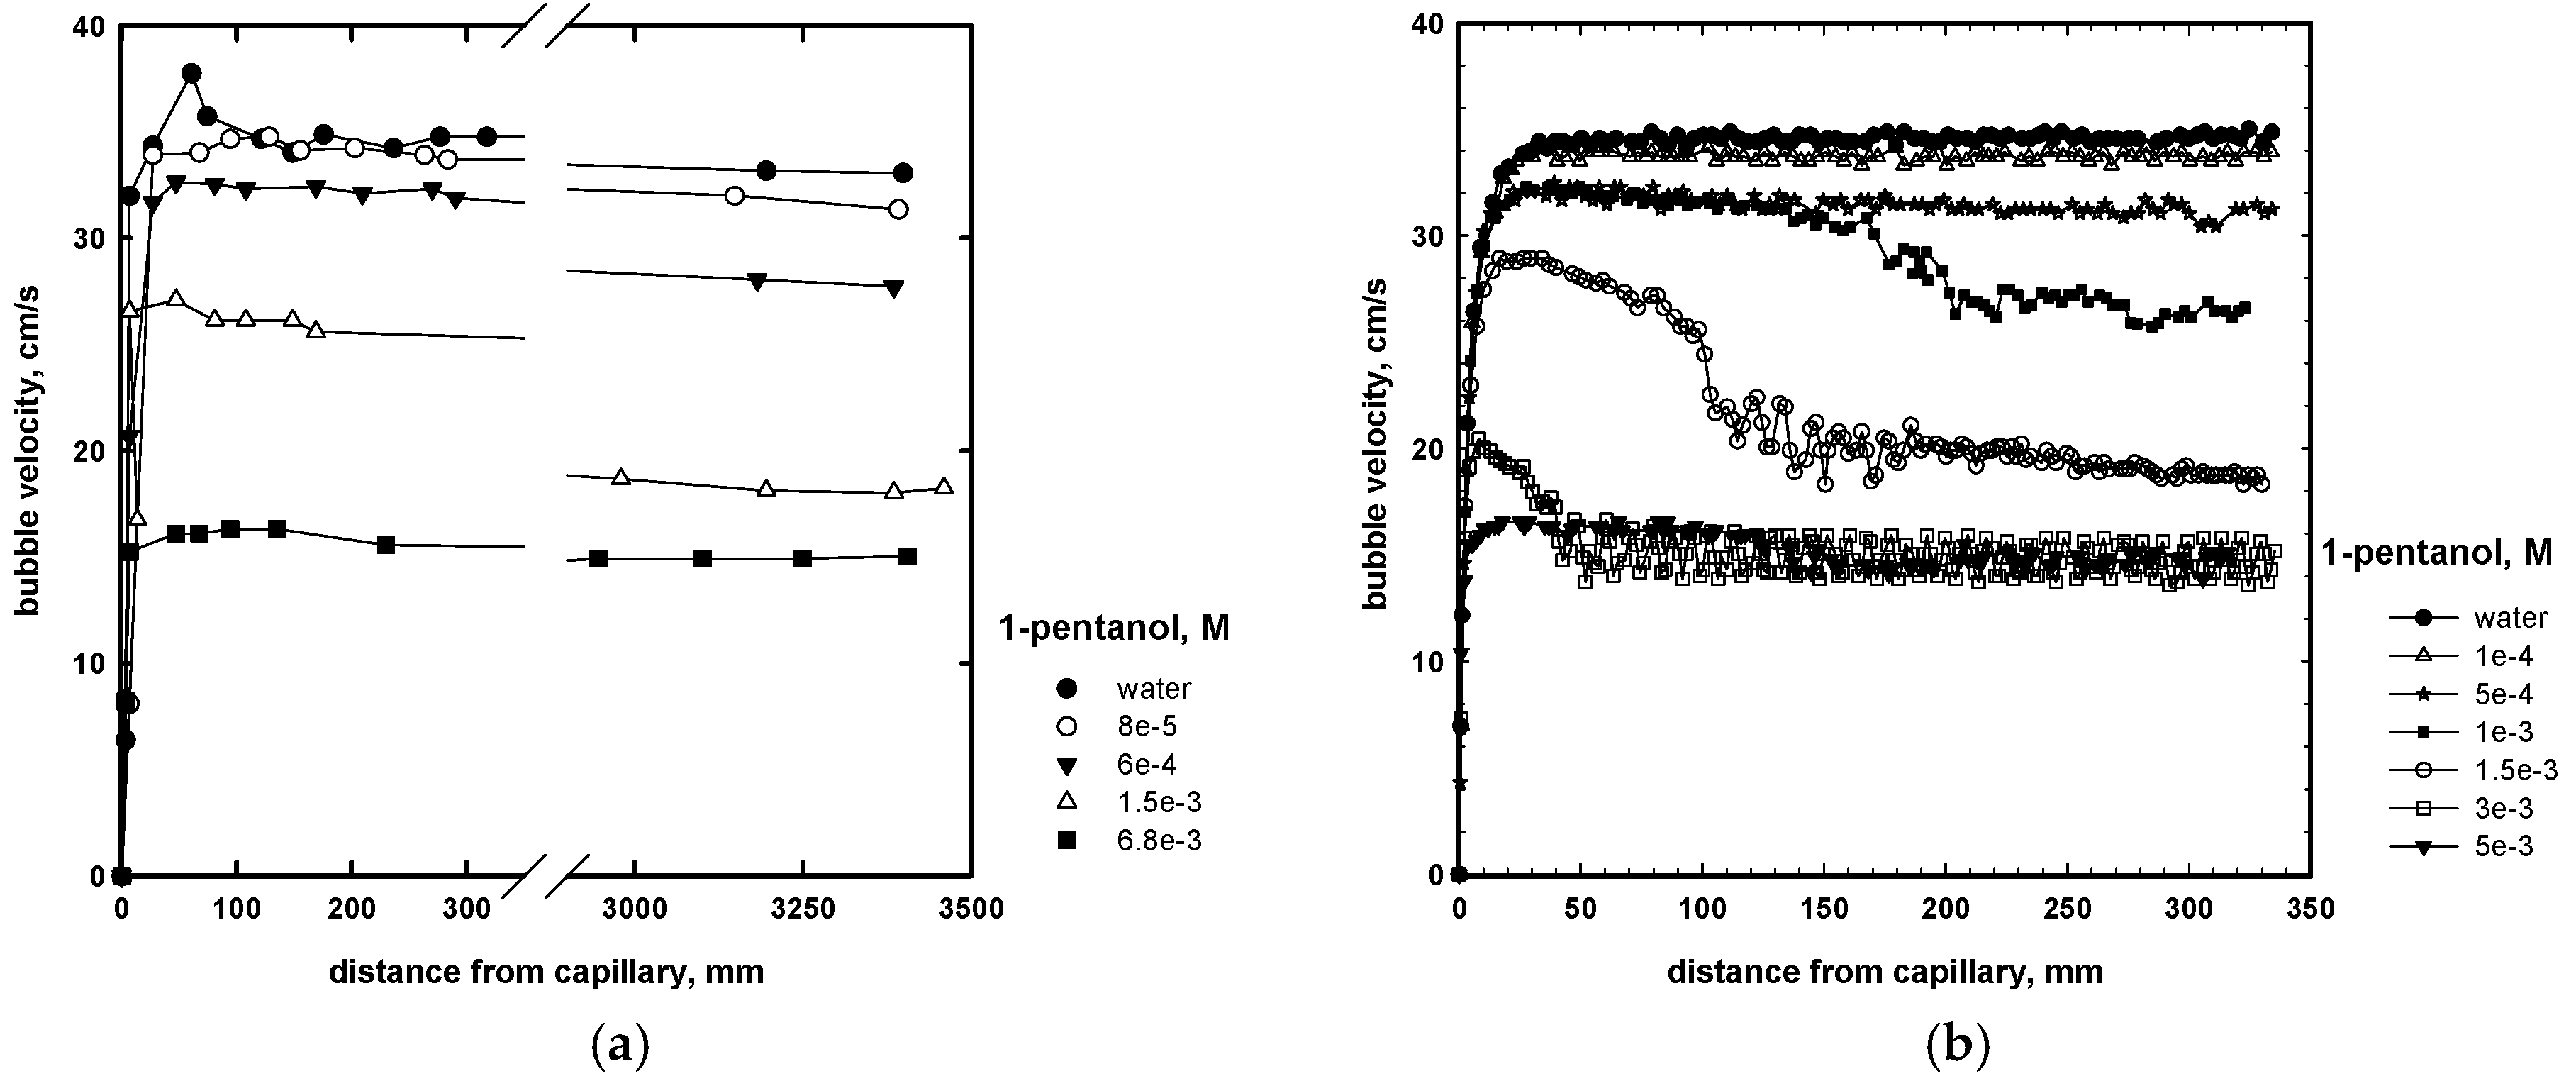
Profiles of local velocities of bubbles in water and the aqueous solutions of 1-pentanol, as an example, after detachment from capillaries in the McGill and PAS columns are presented in Figure 2a,b, respectively. It can be clearly seen that, irrespective of the column type and length, in pure water the bubble accelerates rapidly to a terminal (constant) velocity, which is equal to ca. 33 and ca. 35 cm/s in the McGill and PAS columns, respectively. The terminal velocity in the McGill column was determined at the distance of 300 cm, while in the PAS column was at 30 cm.
In the aqueous solutions of surfactants, the bubble velocity reaches the maximum, and then decreases until it assumes a constant value of the terminal velocity. The value of the terminal velocity of the bubble depends on the solution concentration. The impact of the surfactant concentration on the profiles of bubble velocities is described in detail elsewhere (e.g., [2,3,11,12,13,14,15,16,17,18,19,20,21,22]). In short, it depends on the mass transfer rate, molecular orientation and packing at the liquid/gas interface, surface activity and mobility, surface tension gradients, surface viscosity, as well as hydration effects. A detailed discussion of the mechanism is outside of the scope of this paper.
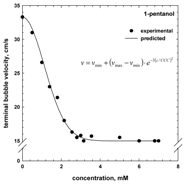
Figure 3a shows the terminal velocities as dependent on the concentration of 1-pentanol, as an example. Initially, the values of terminal velocities decrease rapidly with the surfactant concentration until the bubble reaches the minimum terminal velocity of ca. 15 cm/s, which then is not further affected by the frother concentration. Despite the difference in the distance and bubble size in the McGill (h = 300 cm) and PAS (h = 30 cm) columns, one can observe that dependences of the terminal bubble velocity on the surfactant concentration (Figure 3) have similar patterns. The profiles of local bubble velocities are slightly different due to, for example, bubble size and bubble formation time. By normalizing the terminal bubble velocities in the McGill and PAS columns using (v − vmin)/(vmax − vmin), where vmax and vmin are the maximum (in water, ca. 33 and 35 cm/s in McGill and PAS) and minimum (ca. 15 cm/s) terminal bubble velocities, respectively, it can be seen from Figure 3b, that all the experimental points fit one single curve, indicating that the profiles of bubble velocities in the presence of an aqueous solution of 1-pentanol are similar. The same results were observed for all types of the investigated flotation frothers.
4. Concentration at the Minimum Bubble Velocity (CMV)
Figure 4 shows the dependences of the normalized terminal bubble velocity on the concentration of different types of surfactants tested in the McGill and PAS columns. The concentration is presented on a logarithmic scale. It can be clearly seen that, irrespective of the type of column, the bubble velocity–concentration (v–c) trend is generic for all investigated frothers. As discussed elsewhere (e.g., [1,2,3]), the surfactants, and thus their foaming properties, can be characterized by the concentration at the minimum bubble velocity (CMV). The values of CMV can be either interpreted from the v–c plot or mathematically determined. The estimation of the CMV from the v–c plot (Figure 3) is done by taking the intersection of the linear trend imposed on the data with the minimum terminal bubble velocity (ca. 15 m/s) line by determining the 95% confidence interval of the line [1]. This graphical method is similar to that used in determining the critical micelle concentration (CMC) from a surface tension-concentration plot [23] and the critical coalescence concentration (CCC) from a bubble size-concentration plot [4,18]. A more practical approach is to use a formula, which allows one to rapidly and accurately determine the CMV of frothers. Based on the relationship between the terminal bubble velocity v and the frother concentration c (Figure 4), the values of the CMV can be determined by utilizing the empirical equation:
where vmin and vmax are the minimum and maximum terminal velocities, respectively.
By normalizing the terminal bubble velocity with (v − vmin)/(vmax − vmin) and the frother concentration c in relation to the CMV values for all investigated frothers, it can be clearly seen that all experimental data points converge to one single universal curve (Figure 4b). This self-similarity gives a unique trend line for all frothers by plotting the normalized terminal bubble velocity against the normalized concentration c/CMV. It indicates that the frothers act similarly but at different concentrations, expressed as CMV. The experimental and determined values of CMV are given in Table 1. Figure 5, Figure 6, Figure 7, Figure 8 and Figure 9 show the results for different frother families, that is straight and branched alkyl chain aliphatic alcohols, 1,ω-diols, poly(propylene glycol) alkyl ethers (CnPm), poly(ethylene glycol) alkyl ethers (CnPm), n-alkyltrimethylammonium bromides, commercial frothers and others.
A comparison of the experimental data and values predicted in this work for all investigated frothers is provided in Figure 10. As seen, the proposed empirical equation (Equation (1)) gives an excellent fit to the experimental data, with the determination coefficient R2 = 0.9985, and a standard error of estimate σest = 0.2592, and thus is generally acceptable for all surfactants.
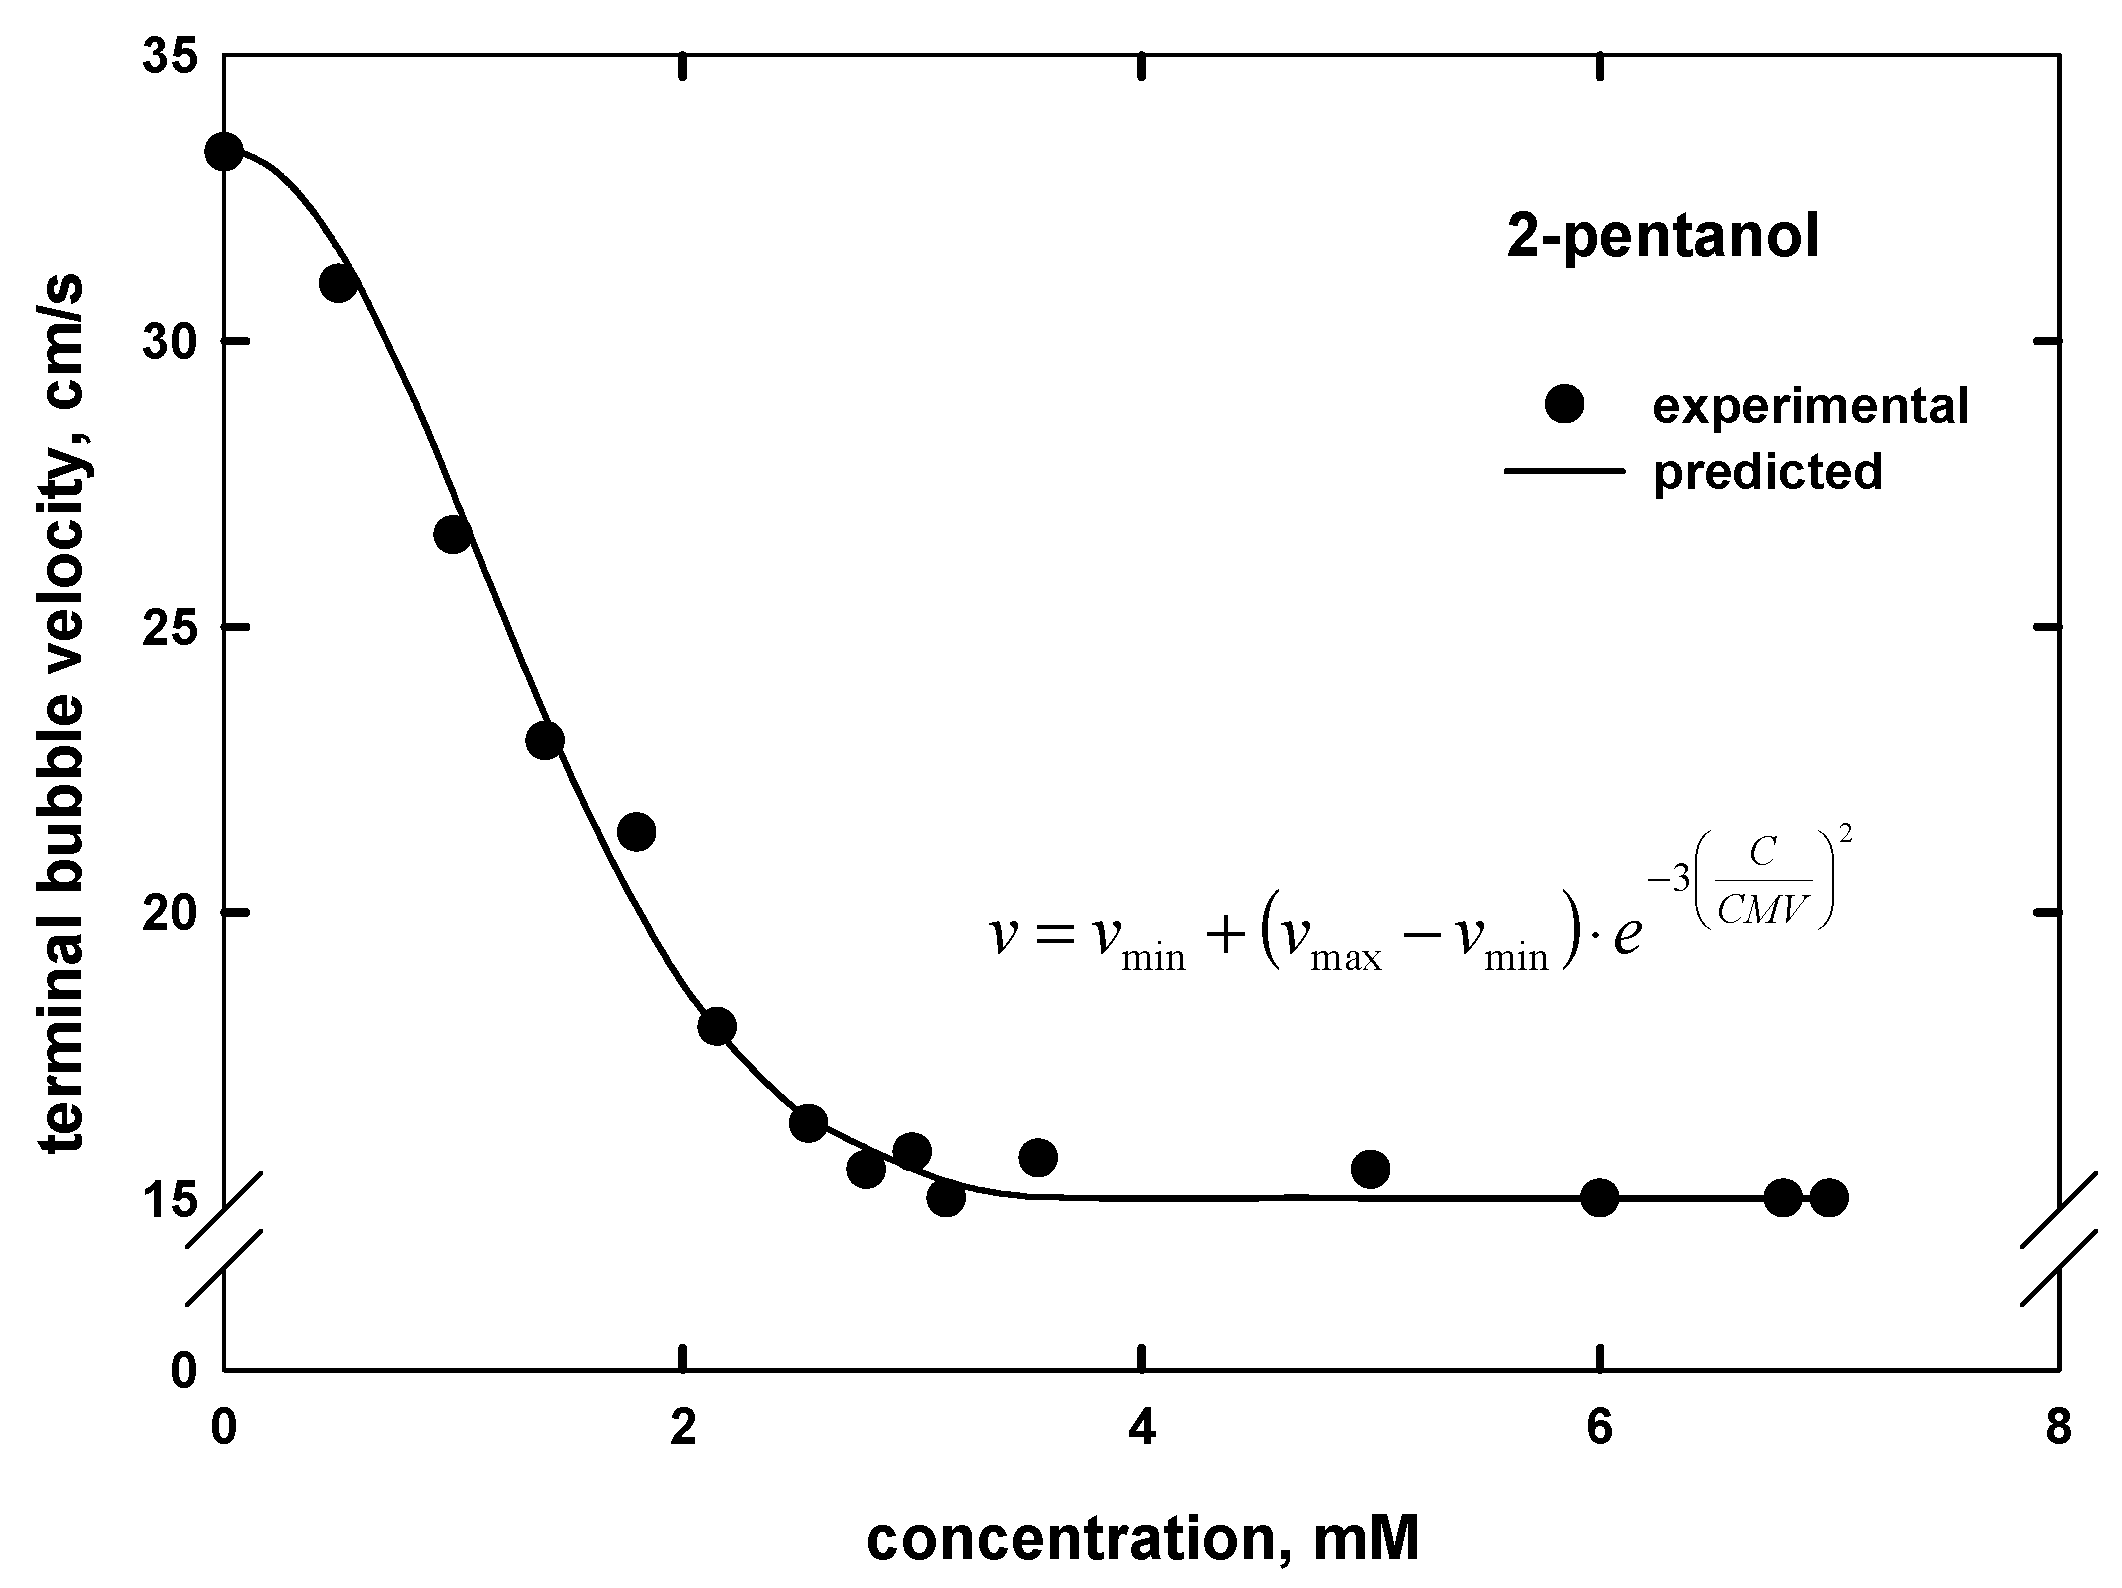
The proposed empirical model (Equation (1)) can be also used to predict the terminal bubble velocity–concentration curve by knowing the maximum (vmax, in water equal to ca. 33 and ca. 35 cm/s in the McGill and PAS columns, respectively) and minimum (vmin, equal to ca. 15) terminal velocities, as well as the values of CMV. An example is given for 2-pentanol (Figure 11). As seen from Figure 11, the line fits well to the experimental points.
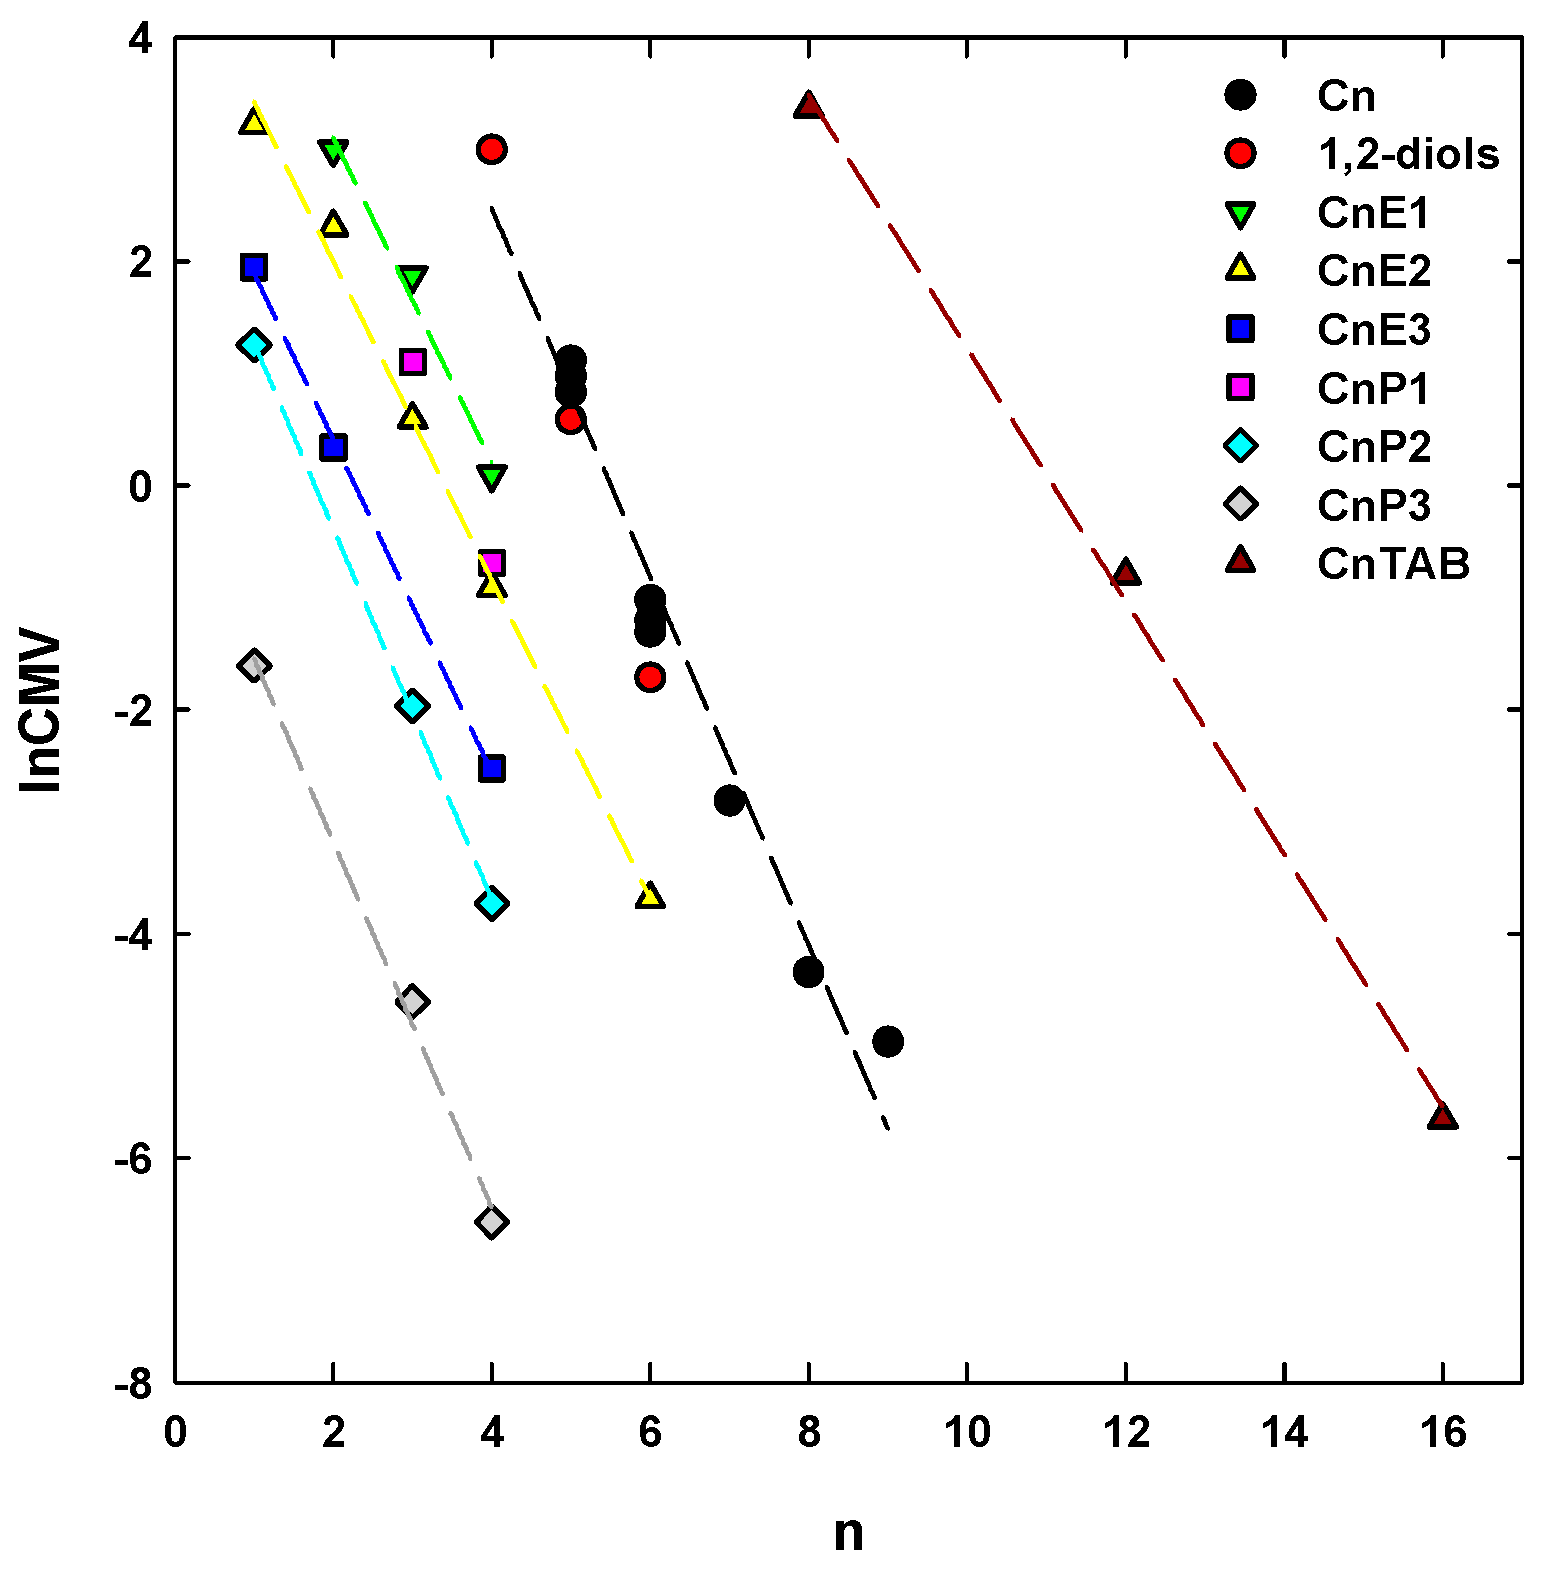
The physicochemical characteristics of surfactants, e.g., the critical micelle concentration (CMC), the critical coalescence concentration (CCC), the concentration at half of the maximum foam height (CMH) and the concentration at the minimum bubble velocity (CMV) strongly depend on the alkyl chain length [2,3,7,18,27]. The values of CMC, CCC, CMH and CMV decrease as the number of carbons in the alkyl chain of surfactant increases. In the case of the CMC, the trend is related to the energy transfer of surface active molecules of frothers from the bulk solution to the micelle, while in the case of the CMV, CCC and CMH, the trend is related to the transfer of surface active molecules of frothers from the bulk to the surface [3,7].
The trends in Figure 12 show a series of self-similarities, that is consistent patterns (similar slope) that can be approximated with a simple linear equation lnCMV = −αn + β, where n is the number of carbons in the alkyl chain, and α and β are the constants that depend on the frothers’ family, as given in Table 2. This empirical equation allows one to predict the values of the CMV from the number of carbons in the alkyl chain (Cn) for aliphatic alcohols, poly(ethylene glycol) alkyl ethers (for m = 1, 2 and 3), poly(propylene glycol) alkyl ethers (for m = 1, 2 and 3), n-alkyltrimethylammonium bromides (CnTAB) and 1,2-diols.
5. CMV in Relation to Other Frother Characterization Parameters
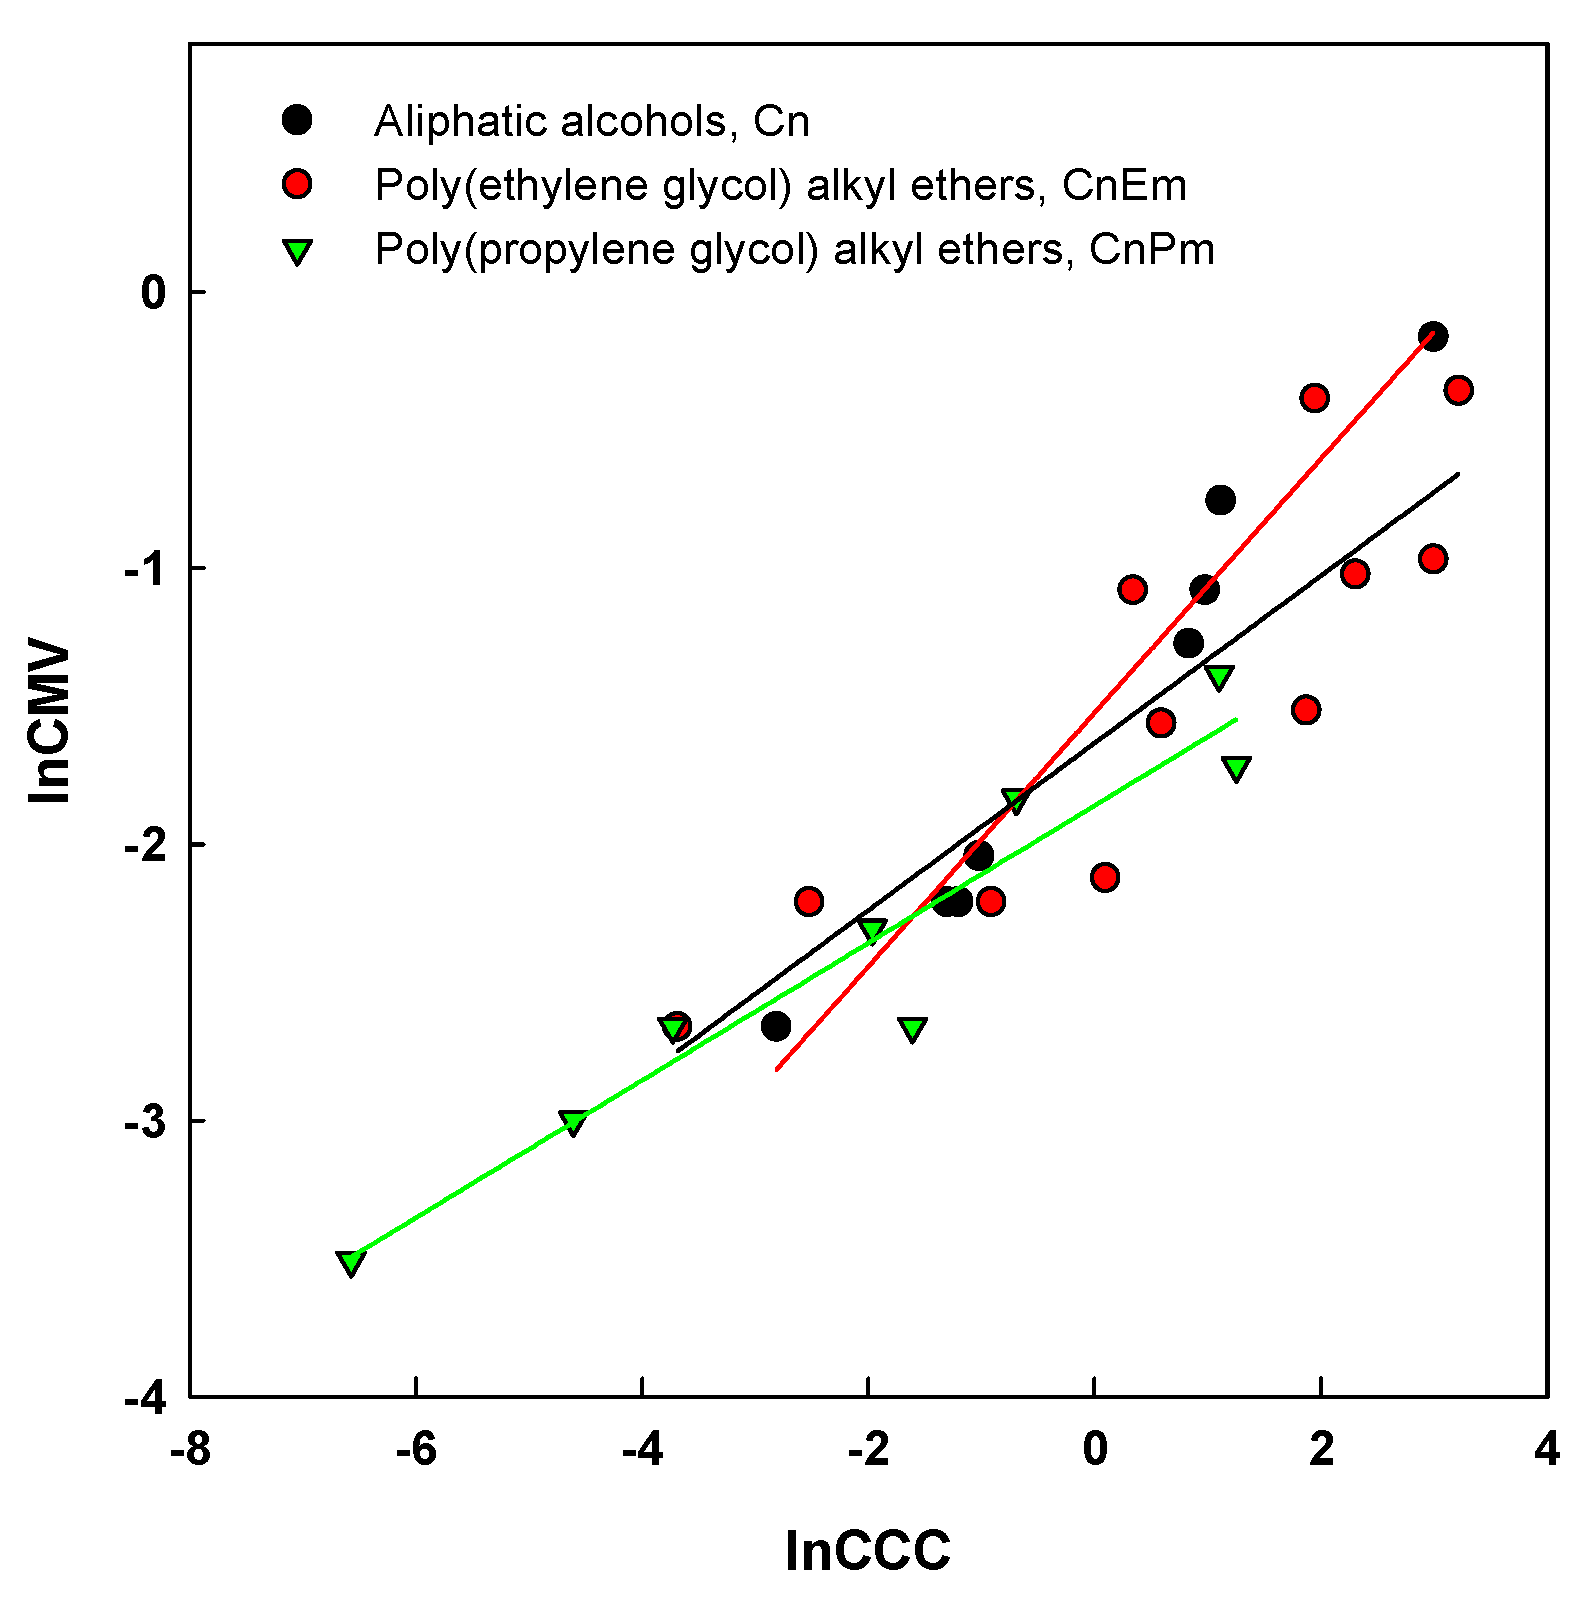
In order to check the relationship between CMV and other frother characterization parameters, the data from Table 1 were plotted in relation to critical coalescence concentration (CCC) (Figure 13) and dynamic frothability index (DFI) (Figure 14). Figure 13 shows that there is a correlation between CCC and CMV (both as ln) for aliphatic alcohols, poly(ethylene glycol) and poly(propylene glycol) alkyl ethers, which can be approximated to an equation lnCMV = αlnCCC − β, where α and β are the constants that depend on the frothers’ family, as given in Table 3. This relationship indicates that the impact of surfactant concentration and type is similar for both terminal velocity and the shape of bubbles.
As discussed before by Laskowski [29], the DFI-CCC diagram can be used to classify frothers into selective and powerful. Selective frothers recover useful fine particles, while powerful frothers float coarse particles. The powerful frothers have high values of DFI and low CCC, while selective ones have low values of DFI and high CCC. Since there is a correlation between CCC and CMV (Figure 13), by analogy the same attempt can be made to create the DFI–CMV diagram. Such an example is shown in Figure 14 for aliphatic alcohols for n from 4 to 8. It can be clearly seen that the foaming properties highly depend on the number of carbons in the alkyl chain (n). As seen from Figure 15a, the values of CMC decrease (as discussed before), while the DFI increases with the increase in the number of carbons in the alkyl chain. It means that the DFI is inversely proportional to CMV. When the same data are plotted in the form of 1/DFI and CMV versus (n), as shown in Figure 15b, it can be clearly seen that the trend is generic. This new diagram can be used to classify frothers into powerful and selective based on the number of carbons in the alkyl chain (n). The frother selectivity decreases with the increase in the alkyl chain. The most selective seems to be 1-butanol (n = 4), while the less selective, and thus the most powerful, is n-octanol (n = 8). The same classification can be made for any other flotation frothers utilizing their foaming properties.
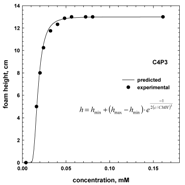
Table 4 shows that (i) the frother characterization parameters, e.g., CMV, CCC and CMH, can be easily determined by empirical equations proposed in this work for CCC and CMV as well as for CMH [7], and (ii) the equations can be successfully used to predict the terminal bubble velocity–concentration, bubble shape–concentration and foam height–concentration curves by knowing the maximum and minimum values of either bubble velocities and shapes or foam height, as well as the values of CMV, CCC and CMH.
6. Influence of Frother Characterization Parameters on Flotation
Many authors have investigated the influence of surfactant type and concentration on the flotation performance (e.g., [7,9,31,32,33,34,35,36,37,38,39,40,41]). An example involving coal flotation is shown in Figure 16. Malysa et al. [9] showed that plotting, for a given material and aliphatic alcohols family frothers (e.g., 1-butanol, 1-pentanol, 1-hexanol), the maximum recovery of coal versus a product of dynamic foamability index (DFI) and frother concentration c, provided all the curves converging into one single universal plot (Figure 16).
This generic trend indicates that flotation recoveries were the same under conditions of identical aliphatic alcohols family frothers expressed as DFI·c and the same hydrodynamic conditions. Comparable results can be obtained when the flotation results are plotted in the form of flotation recovery versus normalized frother concentration in relation to either CCC (c/CCC) or CMV (c/CMV) (Figure 16). A similar pattern was recently presented by Kowalczuk et al. [7] for the flotation of quartz in the presence of short chain alkyl amines, where the normalized frother concentration was presented in the form of c/CHM (concentration at half of the maximum foam height CMH). It proves that all frothers exhibit almost the same foaming behaviours but at different concentrations, expressed as either DFI, CCC, CMV, CMH or any other frother characterization parameter.
7. Conclusions
Based on an analysis of the literature and experimental data for surfactants used as flotation frothers, the following conclusions can be drawn.
- (a)
- The newly obtained empirical equation allows one to rapidly and accurately determine a concentration at the minimum bubble velocity (CMV), as a characterization parameter for different types of frothers, such as straight and branched alkyl chain aliphatic alcohols, 1,ω-diols, poly(propylene glycol) and poly(ethylene glycol) alkyl ethers, n-alkyltrimethylammonium bromides, commercial frothers and others. An excellent agreement was observed between the determined and experimental values.
- (b)
- The proposed empirical model can also be used to predict the terminal bubble velocity–frother concentration curve by knowing the maximum and minimum terminal velocities, as well as the values of the CMV. This approach is universal under similar experimental conditions and can be also extended for the prediction of bubble size when the minimum and maximum bubble sizes, as well as CCC value, are known.
- (c)
- There is a strong correlation between the CMV, the DFI and the number of carbons in the alkyl chain (n). This correlation allows one to determine these parameters, but also to classify frothers as selective and powerful.
- (d)
- The assessment and usefulness of frother characterization parameters, e.g., CMV, DFI and CCC, were shown in the flotation of coal.
Acknowledgments
The work was partially financed by the Polish Statutory Research Grant (No. 0401/0121/16).
Author Contributions
Przemyslaw B. Kowalczuk analyzed the data; Przemyslaw B. Kowalczuk, Jan Zawala and Jan Drzymala wrote the paper.
Conflicts of Interest
The authors declare no conflict of interest.
References
- Tan, Y.H.; Rafiei, A.A.; Elmahdy, A.; Finch, J.A. Bubble size, gas holdup and bubble velocity profile of some alcohols and commercial frothers. Int. J. Miner. Process. 2013, 119, 1–5. [Google Scholar] [CrossRef]
- Tan, Y.H.; Finch, J.A. Frother structure–property relationship: Effect of hydroxyl position in alcohols on bubble rise velocity. Miner. Eng. 2016, 92, 1–8. [Google Scholar] [CrossRef]
- Tan, Y.H.; Finch, J.A. Frother structure–property relationship: Effect of alkyl chain length in alcohols and polyglycols ethers on bubble rise velocity. Miner. Eng. 2016, 95, 14–20. [Google Scholar] [CrossRef]
- Cho, Y.S.; Laskowski, J.S. Effect of flotation frothers on bubble size and foam stability. Int. J. Miner. Process. 2002, 64, 69–80. [Google Scholar] [CrossRef]
- Zhang, W.; Nesset, J.E.; Rao, R.; Finch, J.A. Characterizing frothers through critical coalescence concentration (CCC) 95-hydrophile-lipophile balance (HLB) relationship. Minerals 2012, 2, 208–227. [Google Scholar] [CrossRef]
- Kowalczuk, P.B. Determination of critical coalescence concentration and bubble size for surfactants used as flotation frothers. Ind. Eng. Chem. Res. 2013, 52, 11752–11757. [Google Scholar] [CrossRef]
- Kowalczuk, P.B.; Siedlarz, M.; Szczerkowska, S.; Wojcik, M. Facile determination of foamability index of non-ionic and cationic frothers and its effect on flotation of quartz. Sep. Sci. Technol. 2017, 1–9. [Google Scholar] [CrossRef]
- Czarnecki, J.; Malysa, K.; Pomianowski, A. Dynamic frothability index. J. Colloid Interface Sci. 1982, 86, 570–572. [Google Scholar] [CrossRef]
- Malysa, E.; Malysa, K.; Czarnecki, J. A method of comparison of the frothing and collecting properties of frothers. Colloids Surf. 1987, 23, 29–39. [Google Scholar] [CrossRef]
- Khoshdast, H.; Mirshekari, S.; Zahab-Nazouri, A. A model for predicting dynamic frothability index for dual-frother blends. J. Min. Environ. 2015, 6, 119–124. [Google Scholar] [CrossRef]
- Malysa, K.; Krasowska, M.; Krzan, M. Influence of surface active substances on bubble motion and collision with various interfaces. Adv. Colloid Interface Sci. 2005, 114 115, 205–225. [Google Scholar] [CrossRef] [PubMed]
- Zawala, J.; Malysa, E.; Krzan, M.; Malysa, K. Monitoring of contamination of coal processing plants and environmental waters using bubble velocity measurements—Advantages and limitations. Physicochem. Probl. Miner. Process. 2014, 50, 143–157. [Google Scholar] [CrossRef]
- Frumkin, A.; Levich, V. On surfactants and interfacial motion. Zhur. Fiz. Khim. 1947, 21, 1183–1204. [Google Scholar]
- Fuerstenau, D.W.; Wayman, C.H. Effect of chemical reagents on the motion of single air bubbles in water. Trans. AIME 1958, 211, 694–699. [Google Scholar]
- Clift, R.; Grace, J.R.; Weber, M.E. Bubbles, Drops and Particles; Academic Press: Cambridge, MA, USA, 1978. [Google Scholar]
- Zhou, Z.A.; Egiebor, N.O.; Plitt, L.R. Frother effect on single bubble motion in a water column. Can. Metall. Q. 1992, 31, 11–16. [Google Scholar] [CrossRef]
- Sam, A.; Gomez, C.O.; Finch, J.A. Axial velocity profiles of single bubbles in water/frother solutions. Int. J. Miner. Process. 1996, 47, 177–196. [Google Scholar] [CrossRef]
- Zhang, W.; Sam, A.; Finch, J.A. Temperature effect on single bubble velocity profile in water and surfactant solution. Colloids Surf. A Physicochem. Eng. Aspects 2003, 223, 45–54. [Google Scholar] [CrossRef]
- Krzan, M.; Lunkenheimer, K.; Malysa, K. On the influence of the surfactant’s polar group on the local and terminal velocities of bubbles. Colloids Surf. A Physicochem. Eng. Aspects 2004, 250, 431–441. [Google Scholar] [CrossRef]
- Alves, S.S.; Orvalho, S.P.; Vasconcelos, J.M.T. Effect of bubble contamination on rise velocity and mass transfer. Chem. Eng. Sci. 2005, 60, 1–9. [Google Scholar] [CrossRef]
- Krzan, M.; Malysa, K. Influence of solution pH and electrolyte presence on bubble velocity in anionic surfactant solutions. Physicochem. Probl. Miner. Process. 2009, 43, 43–58. [Google Scholar]
- Javor, Z.; Schreithofer, N.; Heiskanen, K. The effect of bubble release techniques on their behavior at the initial stages of rise. Miner. Eng. 2012, 36, 254–261. [Google Scholar] [CrossRef]
- Varadaraj, R.; Bock, J.; Valint, P. Jr.; Zushma, S.; Thomas, R. Fundamental interfacial properties of alkyl-branched sulfate and ethoxy sulfate surfactants derived from Guerbet alcohols. 1. Surface and instantaneous interfacial tensions. J. Phys. Chem. 1991, 95, 1671–1676. [Google Scholar] [CrossRef]
- Krzan, M.; Zawala, J.; Malysa, K. Development of steady state adsorption distribution over interface of a bubble rising in solutions of n-alkanols (C5, C8) and n-alkyltrimethylammonium bromides (C8, C12, C16). Colloids Surf. A Physicochem. Eng. Aspects. 2007, 298, 42–51. [Google Scholar] [CrossRef]
- Krzan, M.; Malysa, K. Profiles of local velocities of bubbles in n-butanol, n-hexanol and n-nonanol solutions. Colloids Surf. A Physicochem. Eng. Aspects. 2004, 207, 279–291. [Google Scholar] [CrossRef]
- Kosior, D.; Zawala, J.; Krasowska, M.; Malysa, K. Influence of n-octanol and a-terpineol on thin film stability and bubble attachment to hydrophobic surface. Phys. Chem. Chem. Phys. 2013, 15, 2586–2595. [Google Scholar] [CrossRef] [PubMed]
- Klevens, H. Structure and aggregation in dilate solution of surface active agents. J. Am. Oil Chem. Soc. 1953, 30, 74–80. [Google Scholar] [CrossRef]
- Finch, J.A.; Zhang, W. Frother function-structure relationship: Dependence of CCC95 on HLB and the H-ratio. Miner. Eng. 2014, 61, 1–8. [Google Scholar] [CrossRef]
- Laskowski, J.S. Testing flotation frothers. Physicochem. Probl. Miner. Process. 2004, 38, 13–22. [Google Scholar]
- Sweet, C.; van Hoogstraten, J.; Harris, M.; Laskowski, J.S. The effect of frothers on bubble size and frothability of aqueous solutions. In Processing of Complex Ores: Proceedings of the Second UBC-McGill Bi-Annual International Symposium on Fundamentals of Mineral Processing and the Environment, Sudbury, Ontario, 17–19 August 1997; Finch, J.A., Rao, S.R., Holubec, I., Eds.; Canadian Institute of Mining, Metallurgy and Petroleum: Montreal, QC, Canada, 1997; pp. 235–245. [Google Scholar]
- Mukai, S.; Wakamatsu, T.; Takahashi, K. Mutual interaction between collectors and frothers in flotation. Mem. Fac. Eng. Kyoto Univ. 1972, 34, 279–288. [Google Scholar]
- Kurniawan, A.U.; Ozdemir, O.; Nguyen, A.V.; Ofori, P.; Firth, B. Flotation of coal particles in MgCl2, NaCl, and NaClO3 solutions in the absence and presence of Dowfroth 250. Int. J. Miner. Process. 2011, 98, 137–144. [Google Scholar] [CrossRef]
- Laskowski, J.S.; Castro, S.; Ramos, O. Effect of sea water main components on frothability in the flotation of Cu-Mo sulphide ore. Physicochem. Probl. Miner. Process. 2013, 50, 17–29. [Google Scholar] [CrossRef]
- Karlkvist, T.; Patra, A.; Rao, K.H.; Bordes, R.; Holmberg, K. Flotation selectivity of novel alkyl dicarboxylate reagents for apatite–calcite separation. J. Colloid Interface Sci. 2015, 445, 40–47. [Google Scholar] [CrossRef] [PubMed]
- Moimane, T.M.; Corin, K.C.; Wiese, J.G. Investigation of the interactive effects of the reagent suite in froth flotation of a Merensky ore. Miner. Eng. 2016, 96, 39–45. [Google Scholar] [CrossRef]
- Park, H.; Wang, J.; Wang, L. A comparative study of methyl cyclohexanemethanol and methyl isobutyl carbinol as frother for coal flotation. Int. J. Miner. Process. 2016, 155, 32–44. [Google Scholar] [CrossRef]
- Drzymala, J.; Ratajczak, T.; Kowalczuk, P.B. Kinetic separation curves based on process rate considerations. Physicochem. Probl. Miner. Process. 2017, 53, 983–995. [Google Scholar] [CrossRef]
- Kowalczuk, P.B.; Drzymala, J. Selectivity and power of frothers in copper ore flotation. Physicochem. Probl. Miner. Process. 2017, 53, 515–523. [Google Scholar] [CrossRef]
- Sousa, R.; Futuro, A.; Setas Pires, C.; Machado Leite, M. Froth flotation of Aljustrel sulphide complex ore. Physicochem. Probl. Miner. Process. 2017, 53, 758–769. [Google Scholar] [CrossRef]
- Sun, K.; Liu, T.; Zhang, Y.; Liu, X.; Wang, B.; Xu, C. Application and mechanism of anionic collector sodium dodecyl sulfate (SDS) in phosphate beneficiation. Minerals 2017, 7, 29. [Google Scholar] [CrossRef]
- Kowalczuk, P.B.; Mroczko, D.; Drzymala, J. Influence of frother type and dose on collectorless flotation of copper-bearing shale in a flotation column. Physicochem. Probl. Miner. Process. 2015, 51, 547–558. [Google Scholar] [CrossRef]
Figure 1.
PAS (a) and McGill (b) experimental setups used to measure local velocity of the bubble (after [2,11]).
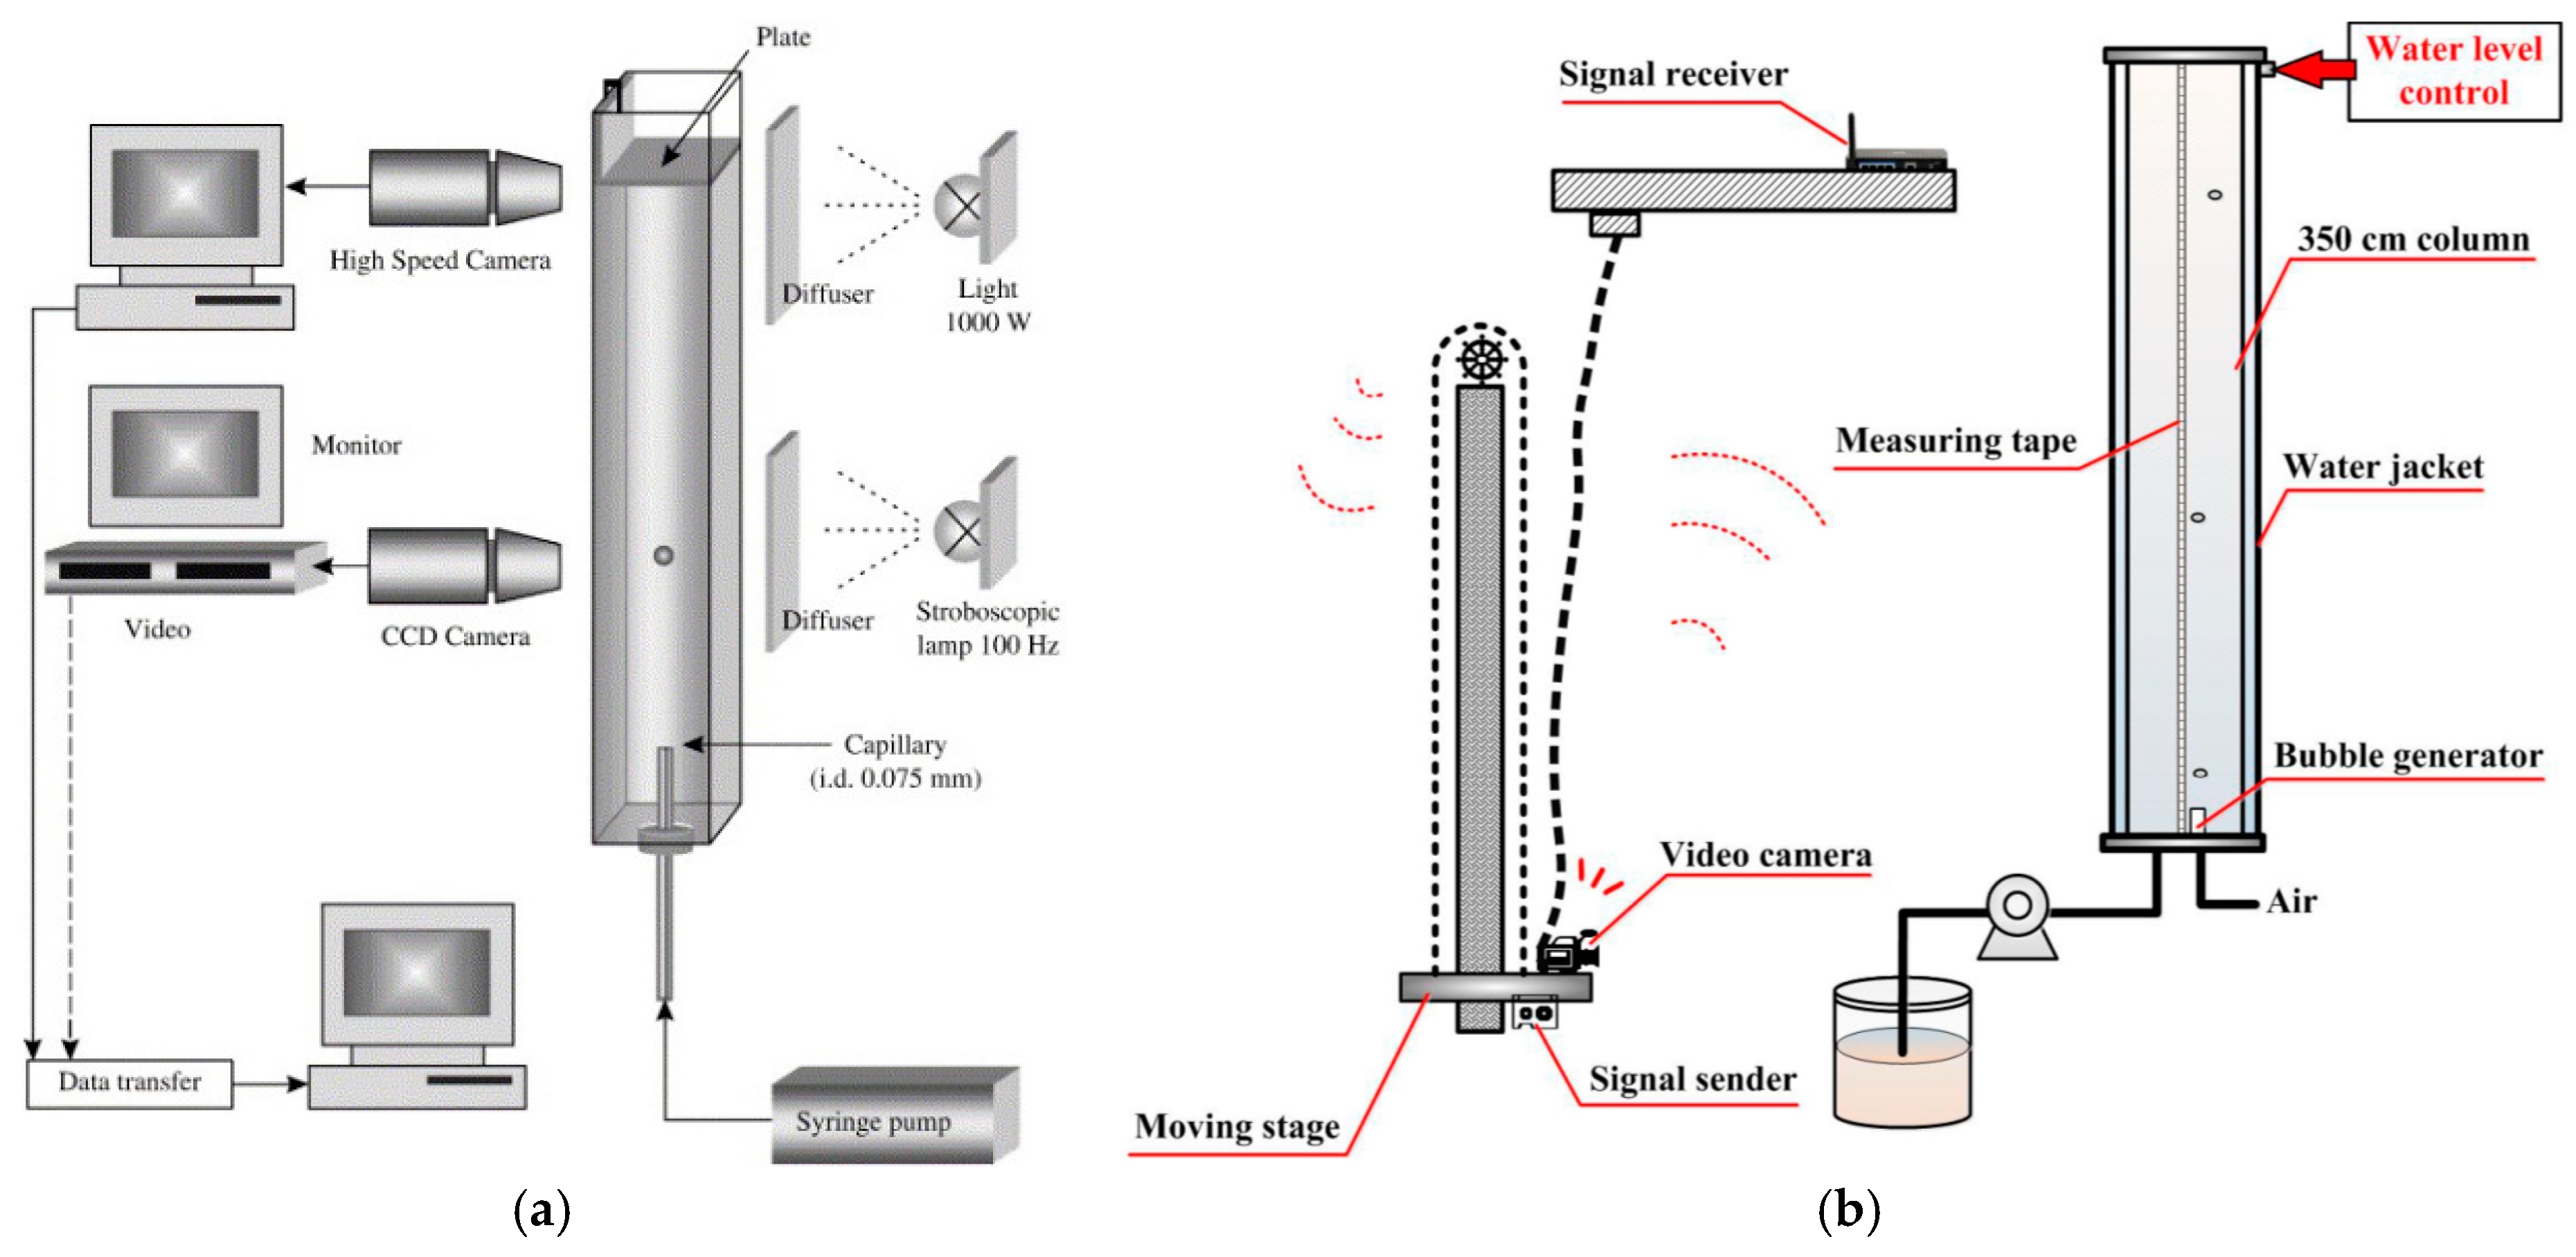
Figure 2.
Bubble velocity profiles in the presence of 1-pentanol in McGill (a) and PAS (b) columns.

Figure 3.
Influence of 1-pentanol concentration on (a) normal and (b) normalized (v − vmin)/(vmax − vmin) terminal bubble velocity measured in McGill (300 cm) and PAS (30 cm) columns.
Figure 3.
Influence of 1-pentanol concentration on (a) normal and (b) normalized (v − vmin)/(vmax − vmin) terminal bubble velocity measured in McGill (300 cm) and PAS (30 cm) columns.
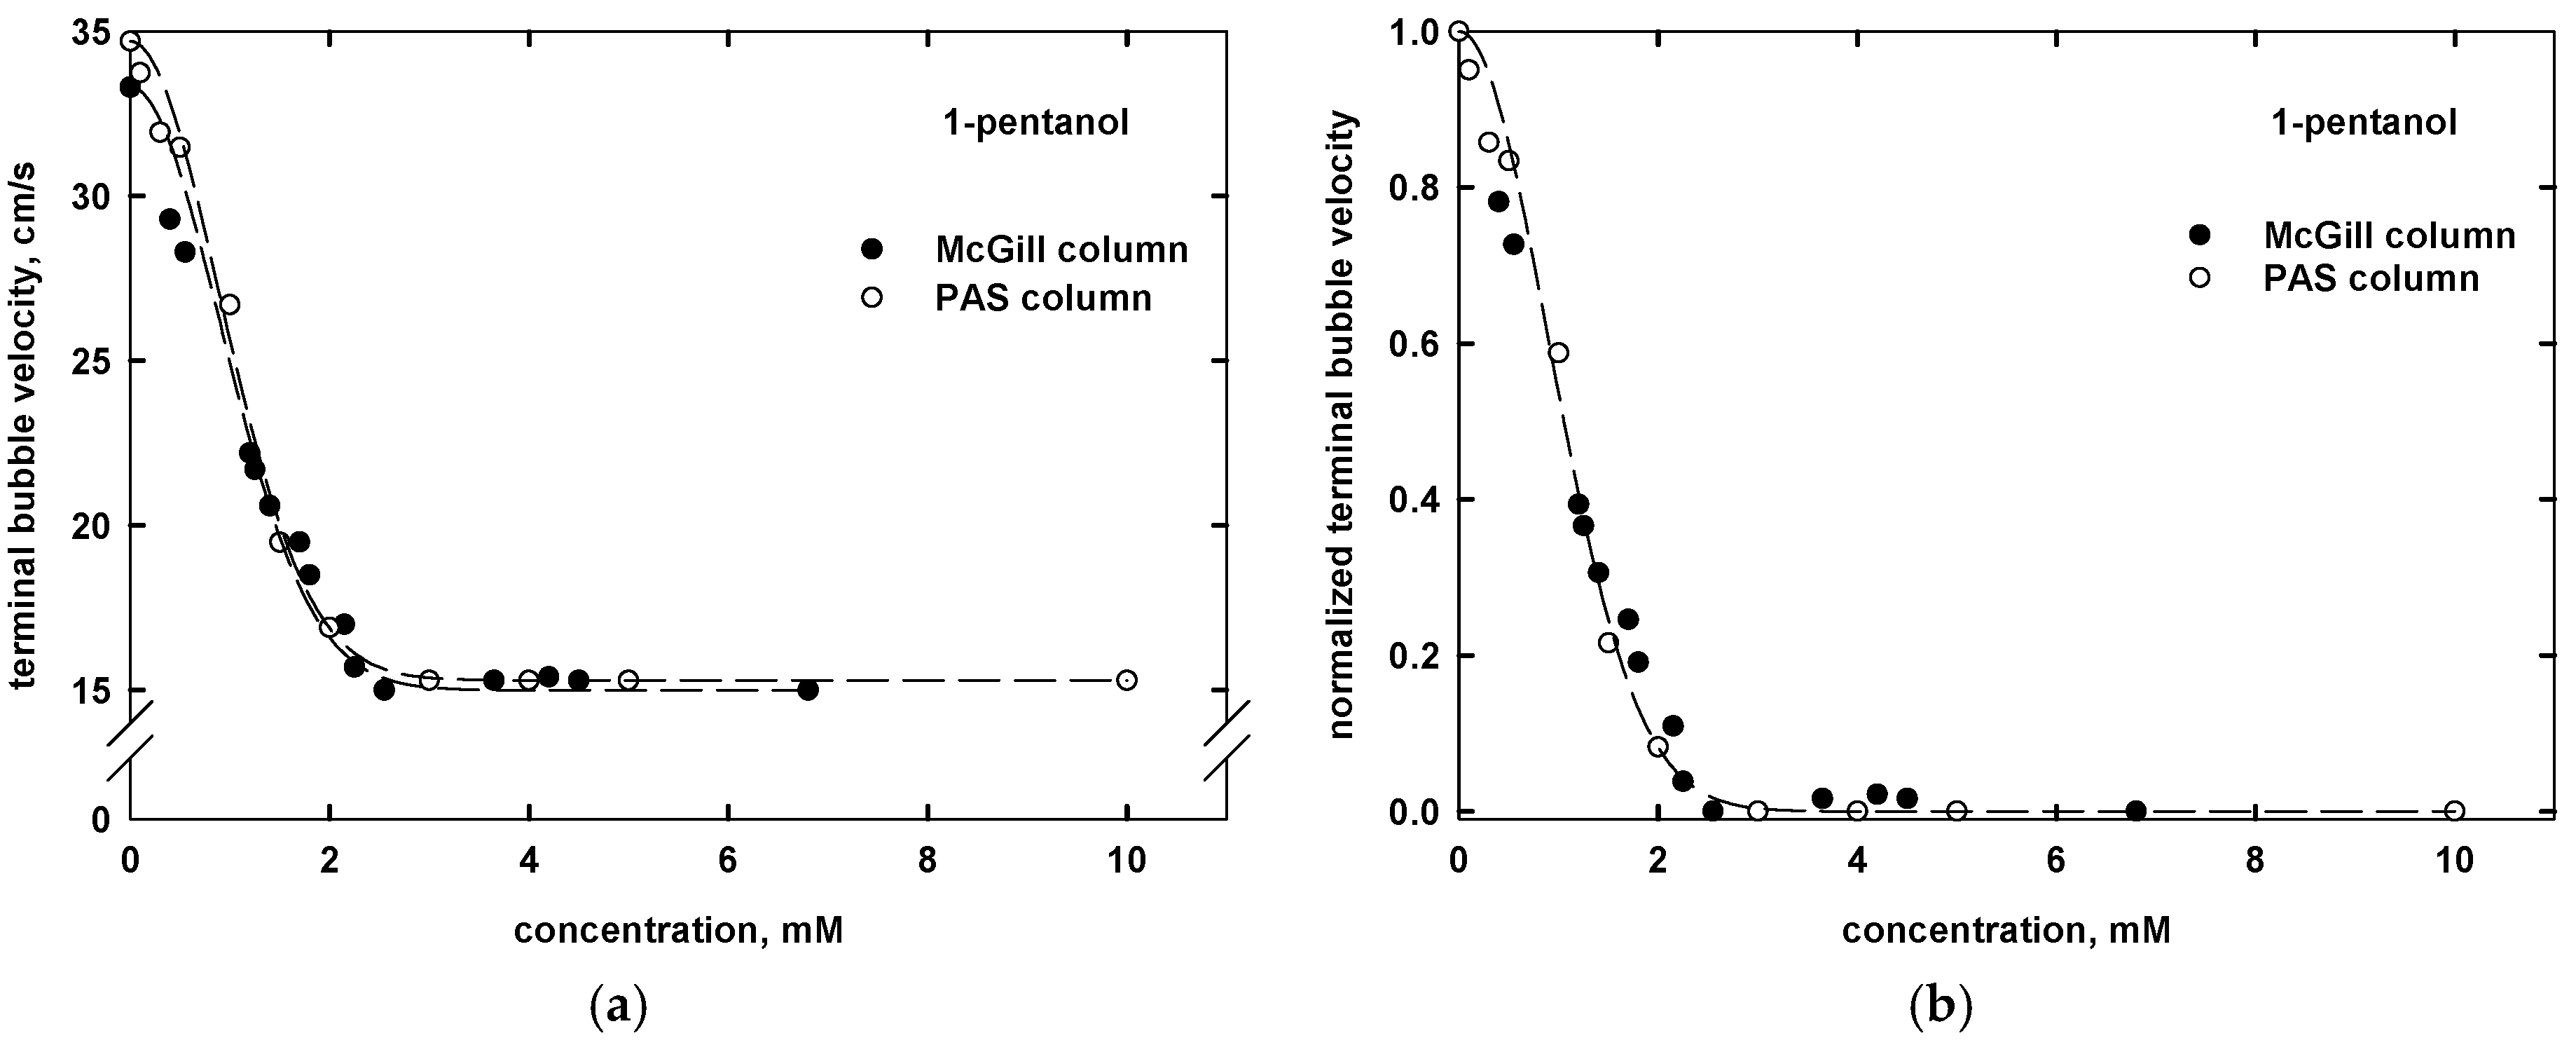
Figure 4.
Influence of surfactant concentration expressed in mM (a) and normalized surfactant concentration (c/CMV) (b) on the normalized terminal bubble velocity (v − vmin)/(vmax − vmin).
Figure 4.
Influence of surfactant concentration expressed in mM (a) and normalized surfactant concentration (c/CMV) (b) on the normalized terminal bubble velocity (v − vmin)/(vmax − vmin).

Figure 5.
Influence of straight alkyl chain aliphatic alcohols concentration expressed in mM (a) and normalized surfactant concentration (c/CMV) (b) on the normalized terminal bubble velocity.
Figure 5.
Influence of straight alkyl chain aliphatic alcohols concentration expressed in mM (a) and normalized surfactant concentration (c/CMV) (b) on the normalized terminal bubble velocity.
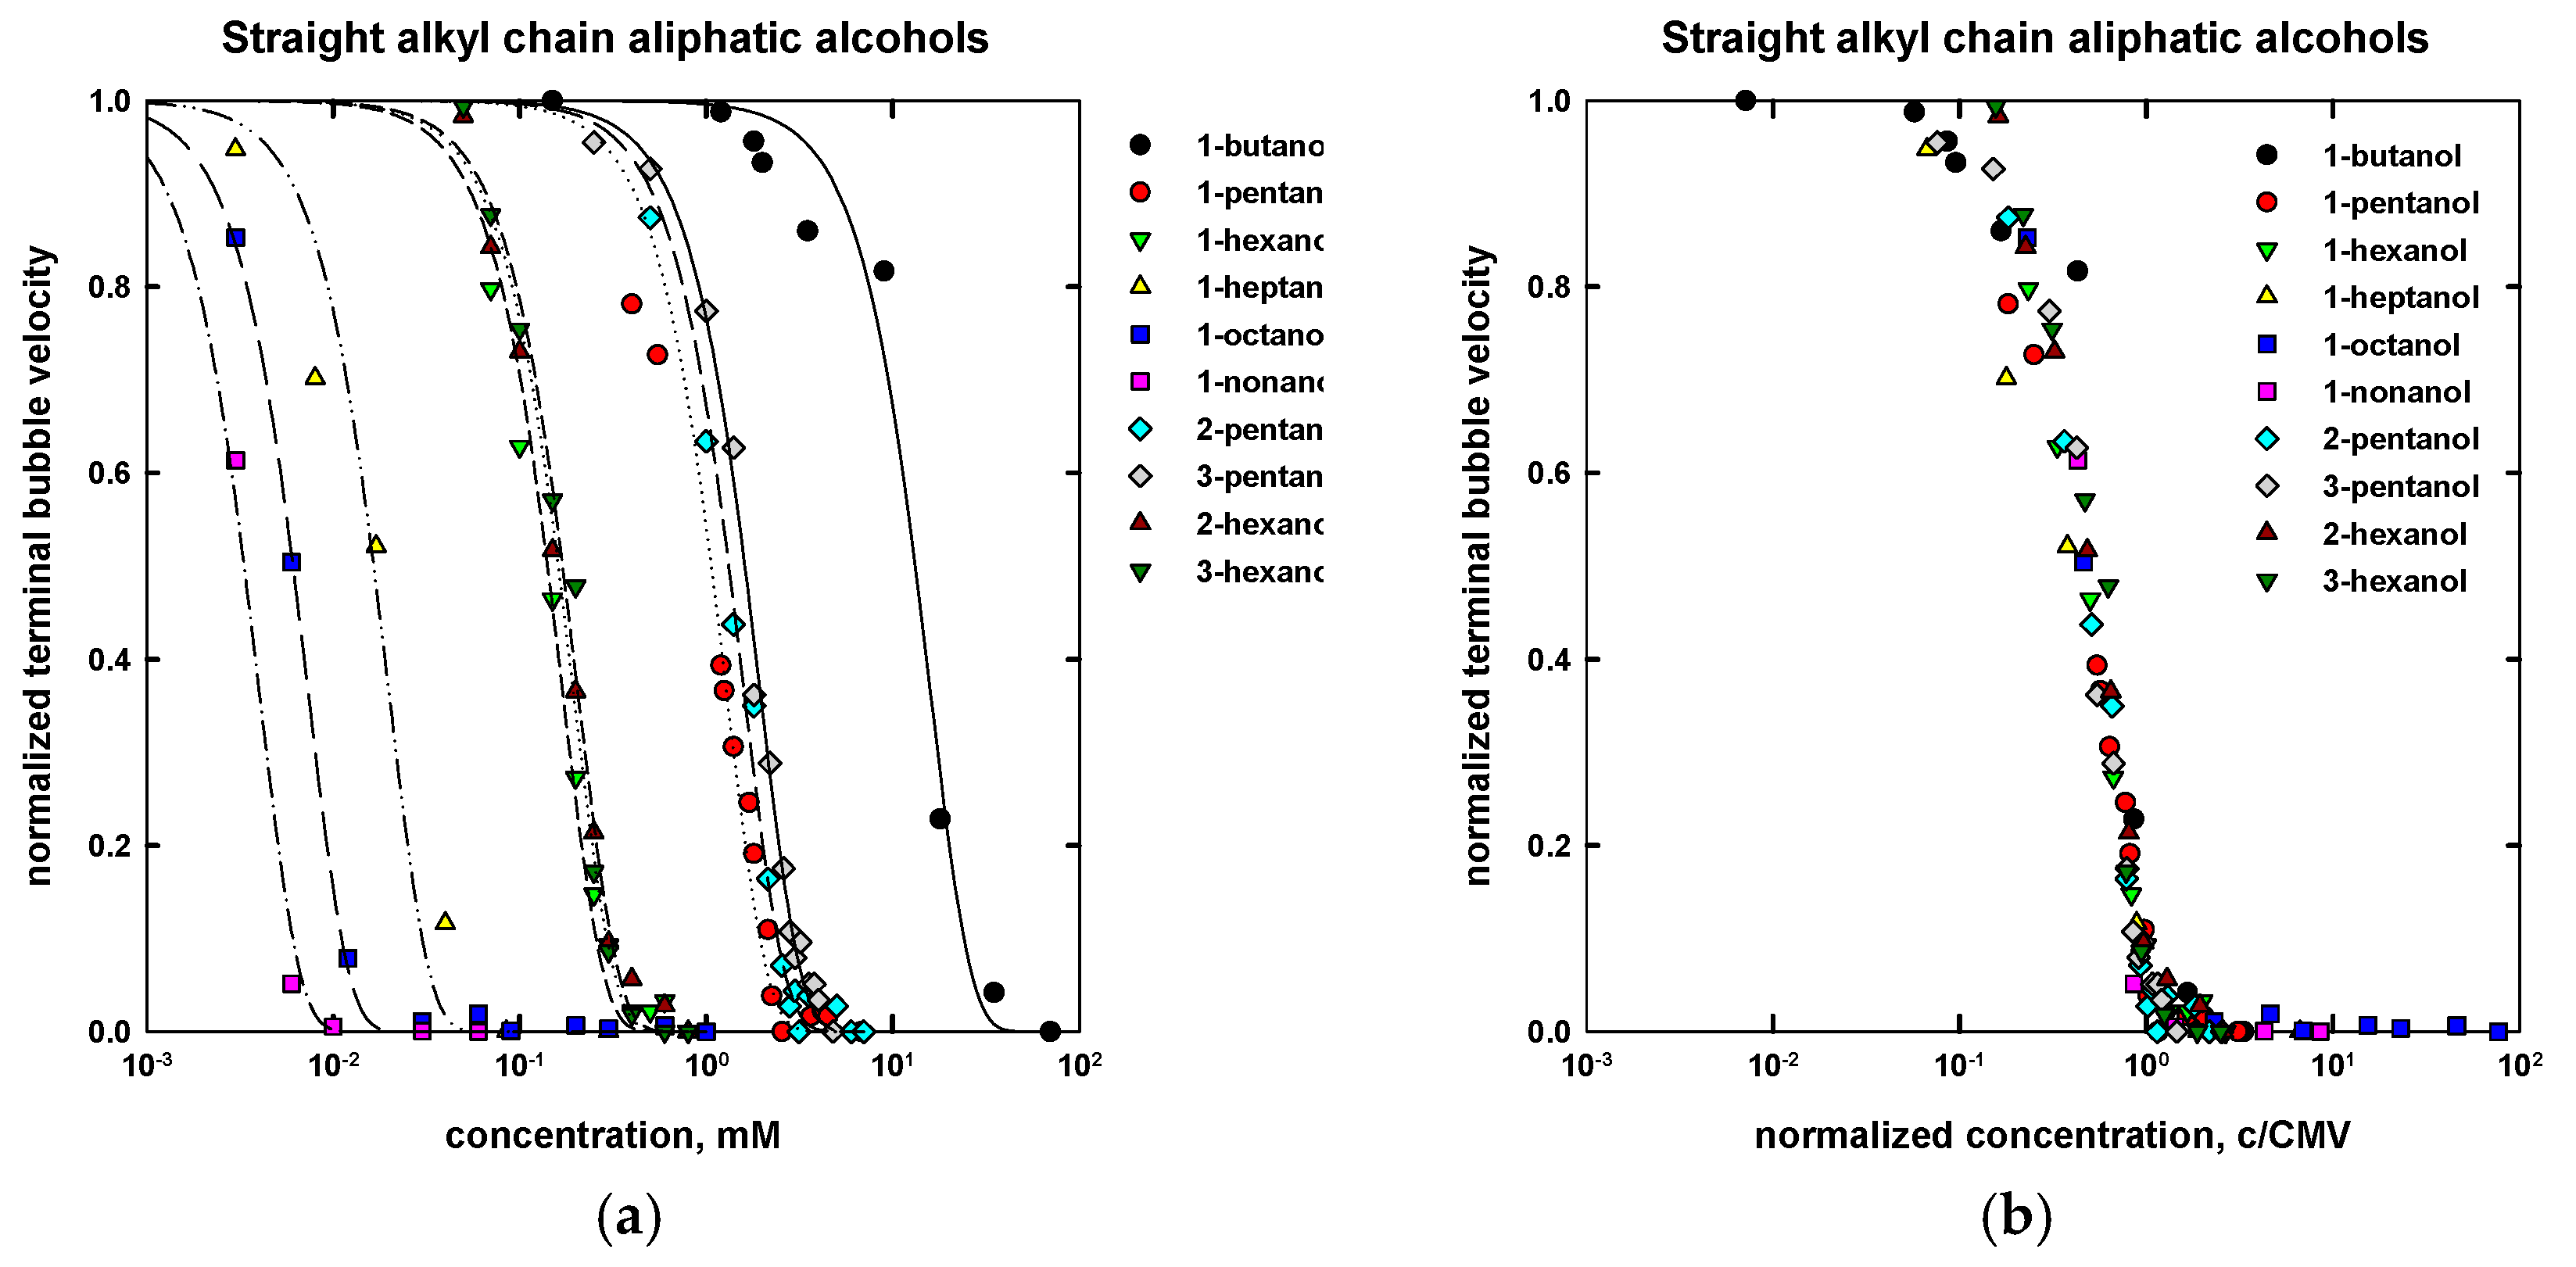
Figure 6.
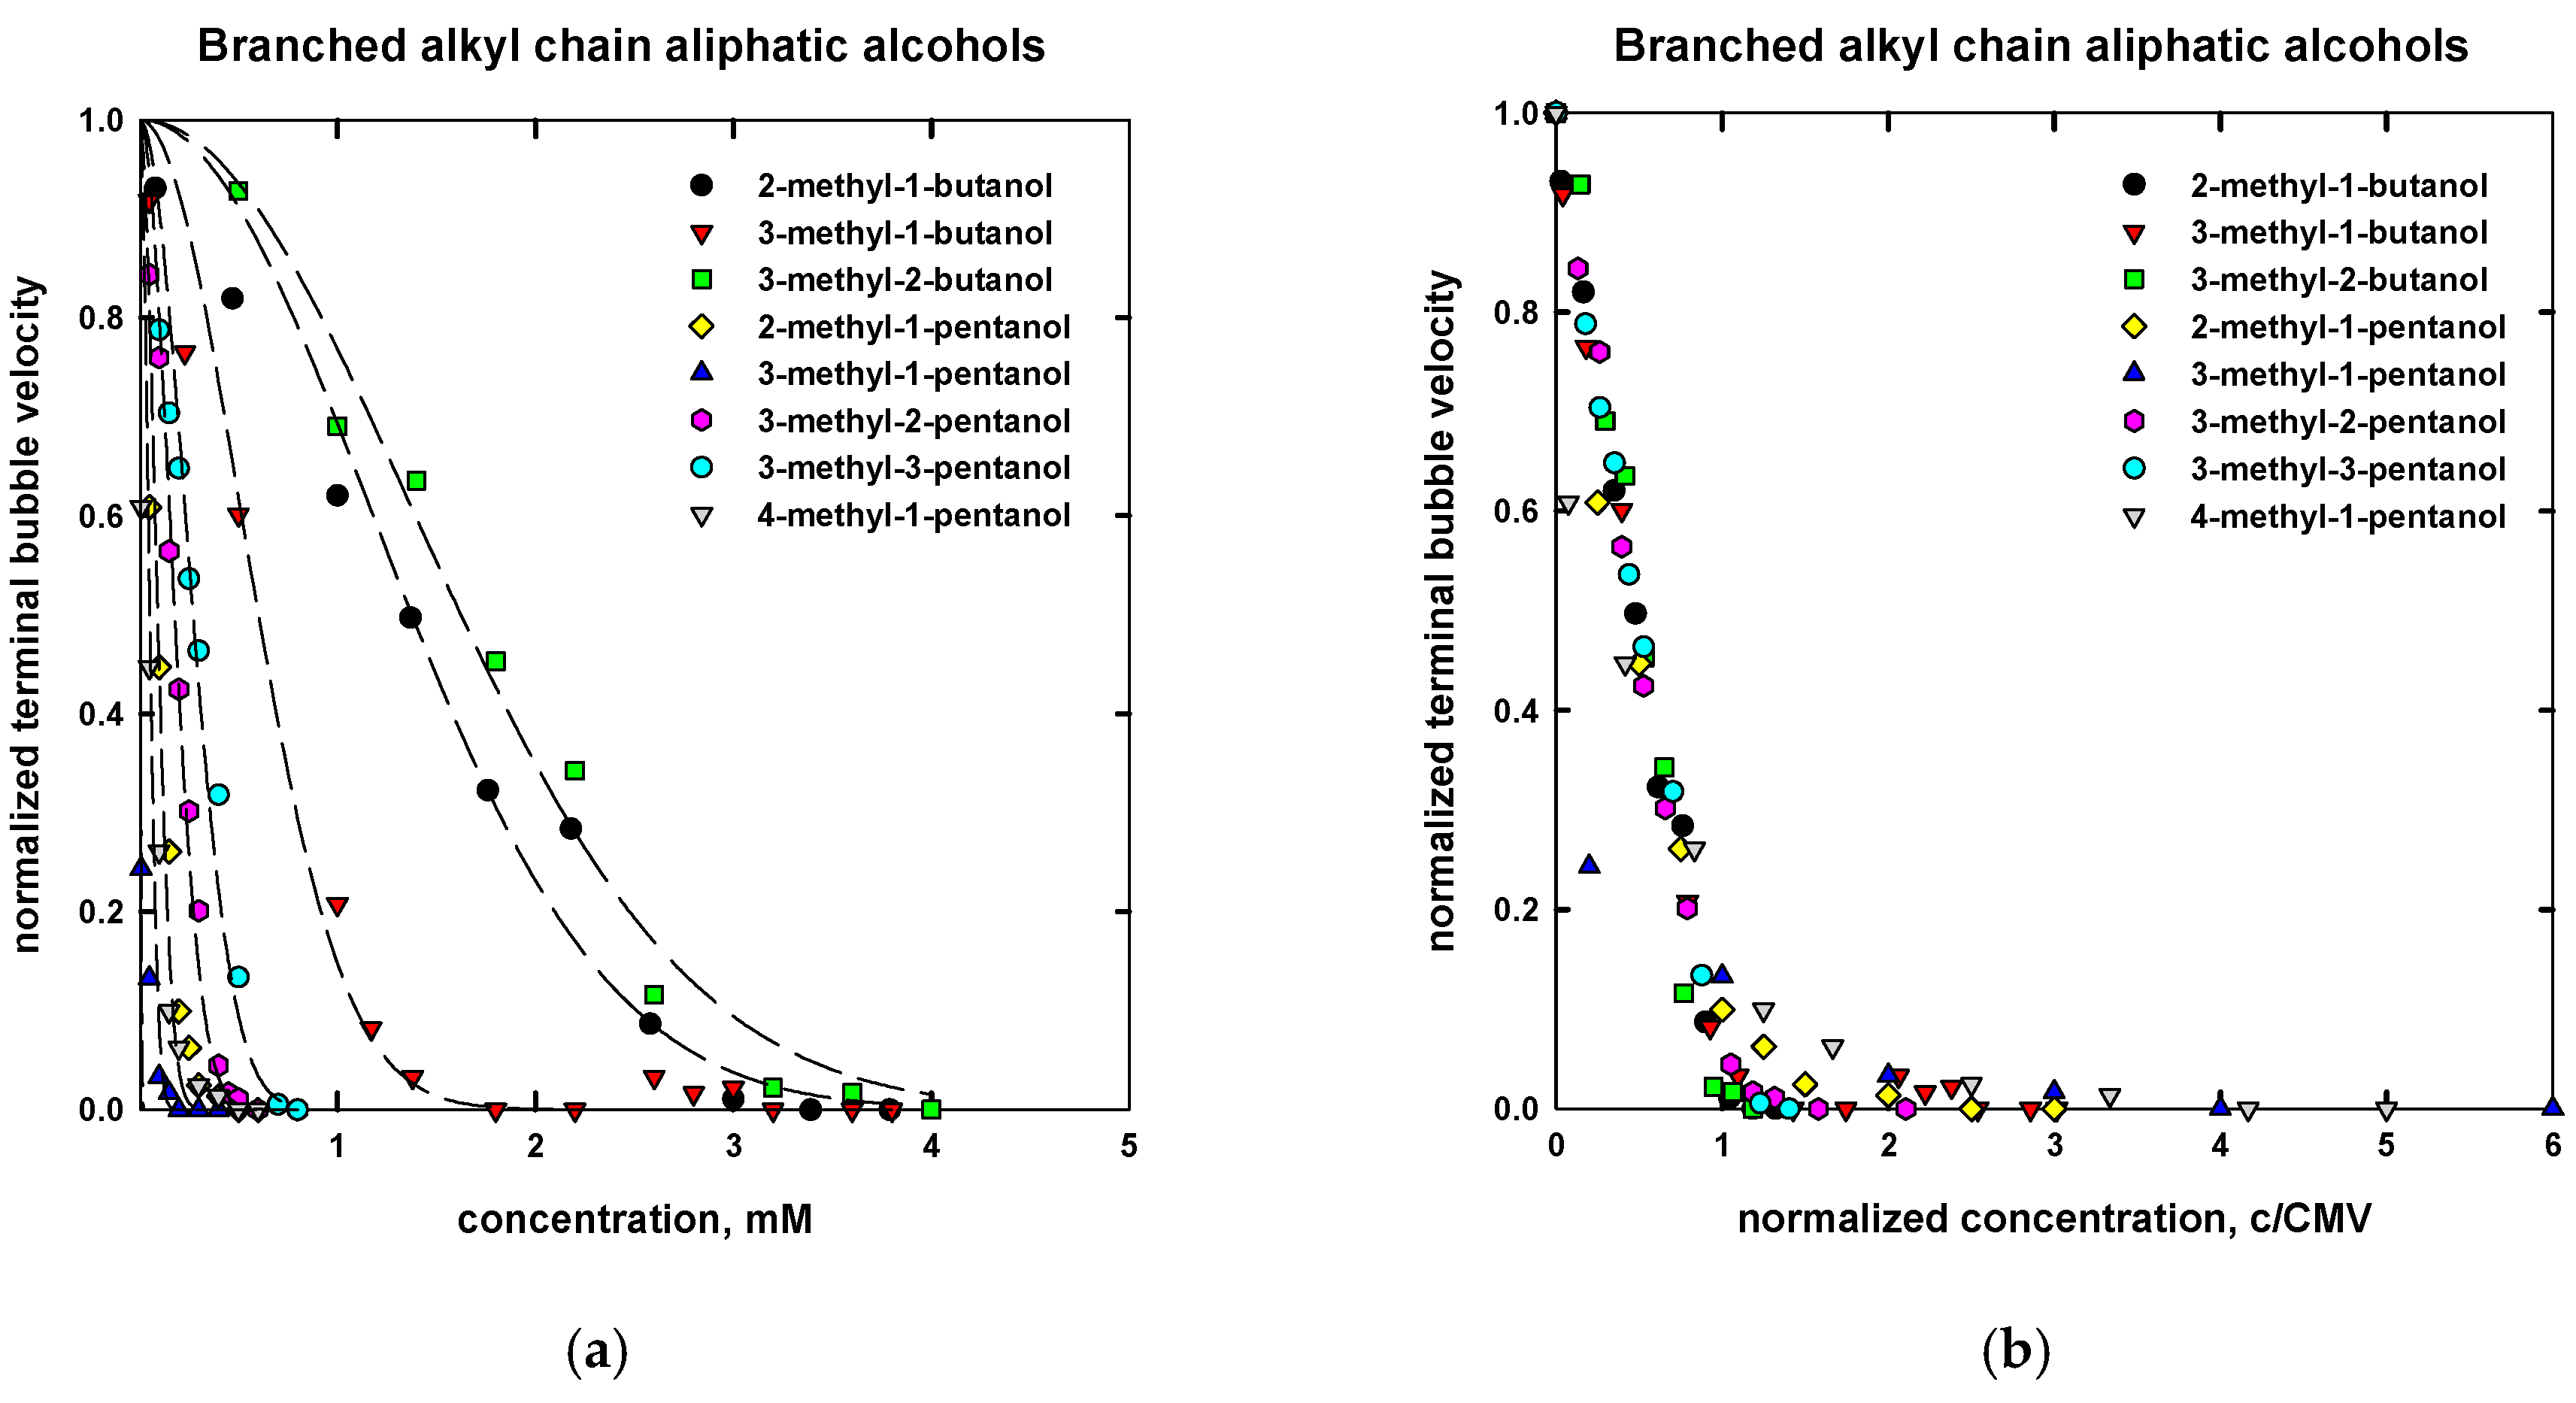
Influence of branched alkyl chain aliphatic alcohols concentration expressed in mM (a) and normalized surfactant concentration (c/CMV) (b) on the normalized terminal bubble velocity.
Figure 6.
Influence of branched alkyl chain aliphatic alcohols concentration expressed in mM (a) and normalized surfactant concentration (c/CMV) (b) on the normalized terminal bubble velocity.

Figure 7.
Influence of 1,ω-diols concentration expressed in mM (a) and normalized surfactant concentration (c/CMV) (b) on the normalized terminal bubble velocity.
Figure 7.
Influence of 1,ω-diols concentration expressed in mM (a) and normalized surfactant concentration (c/CMV) (b) on the normalized terminal bubble velocity.
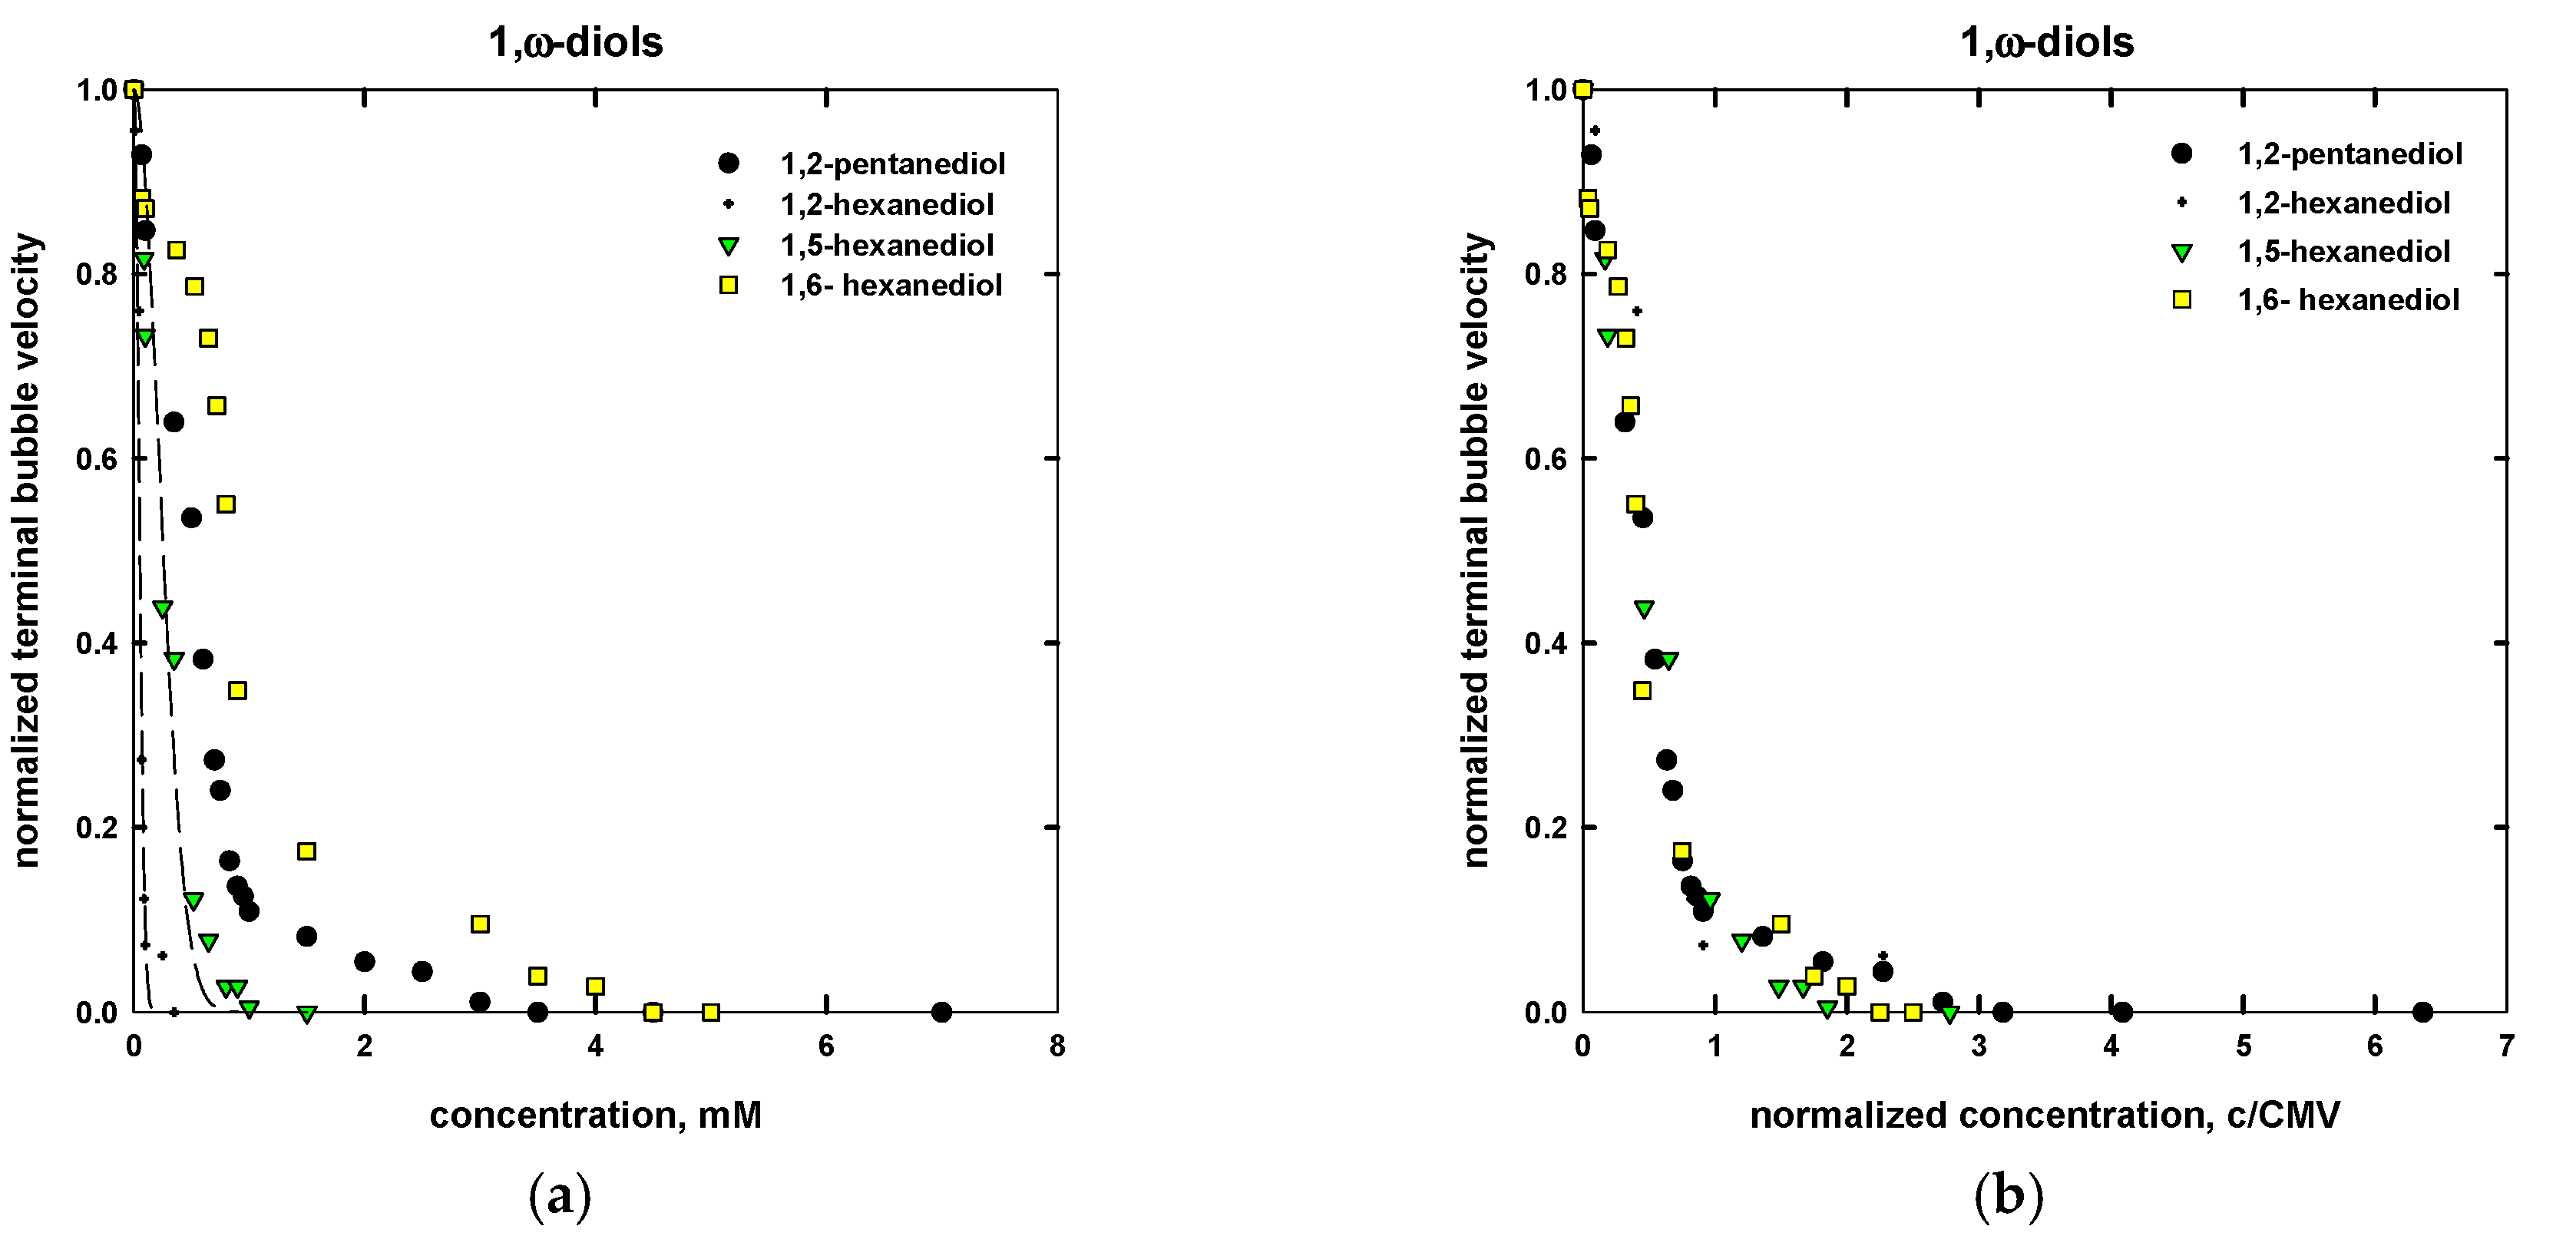
Figure 8.
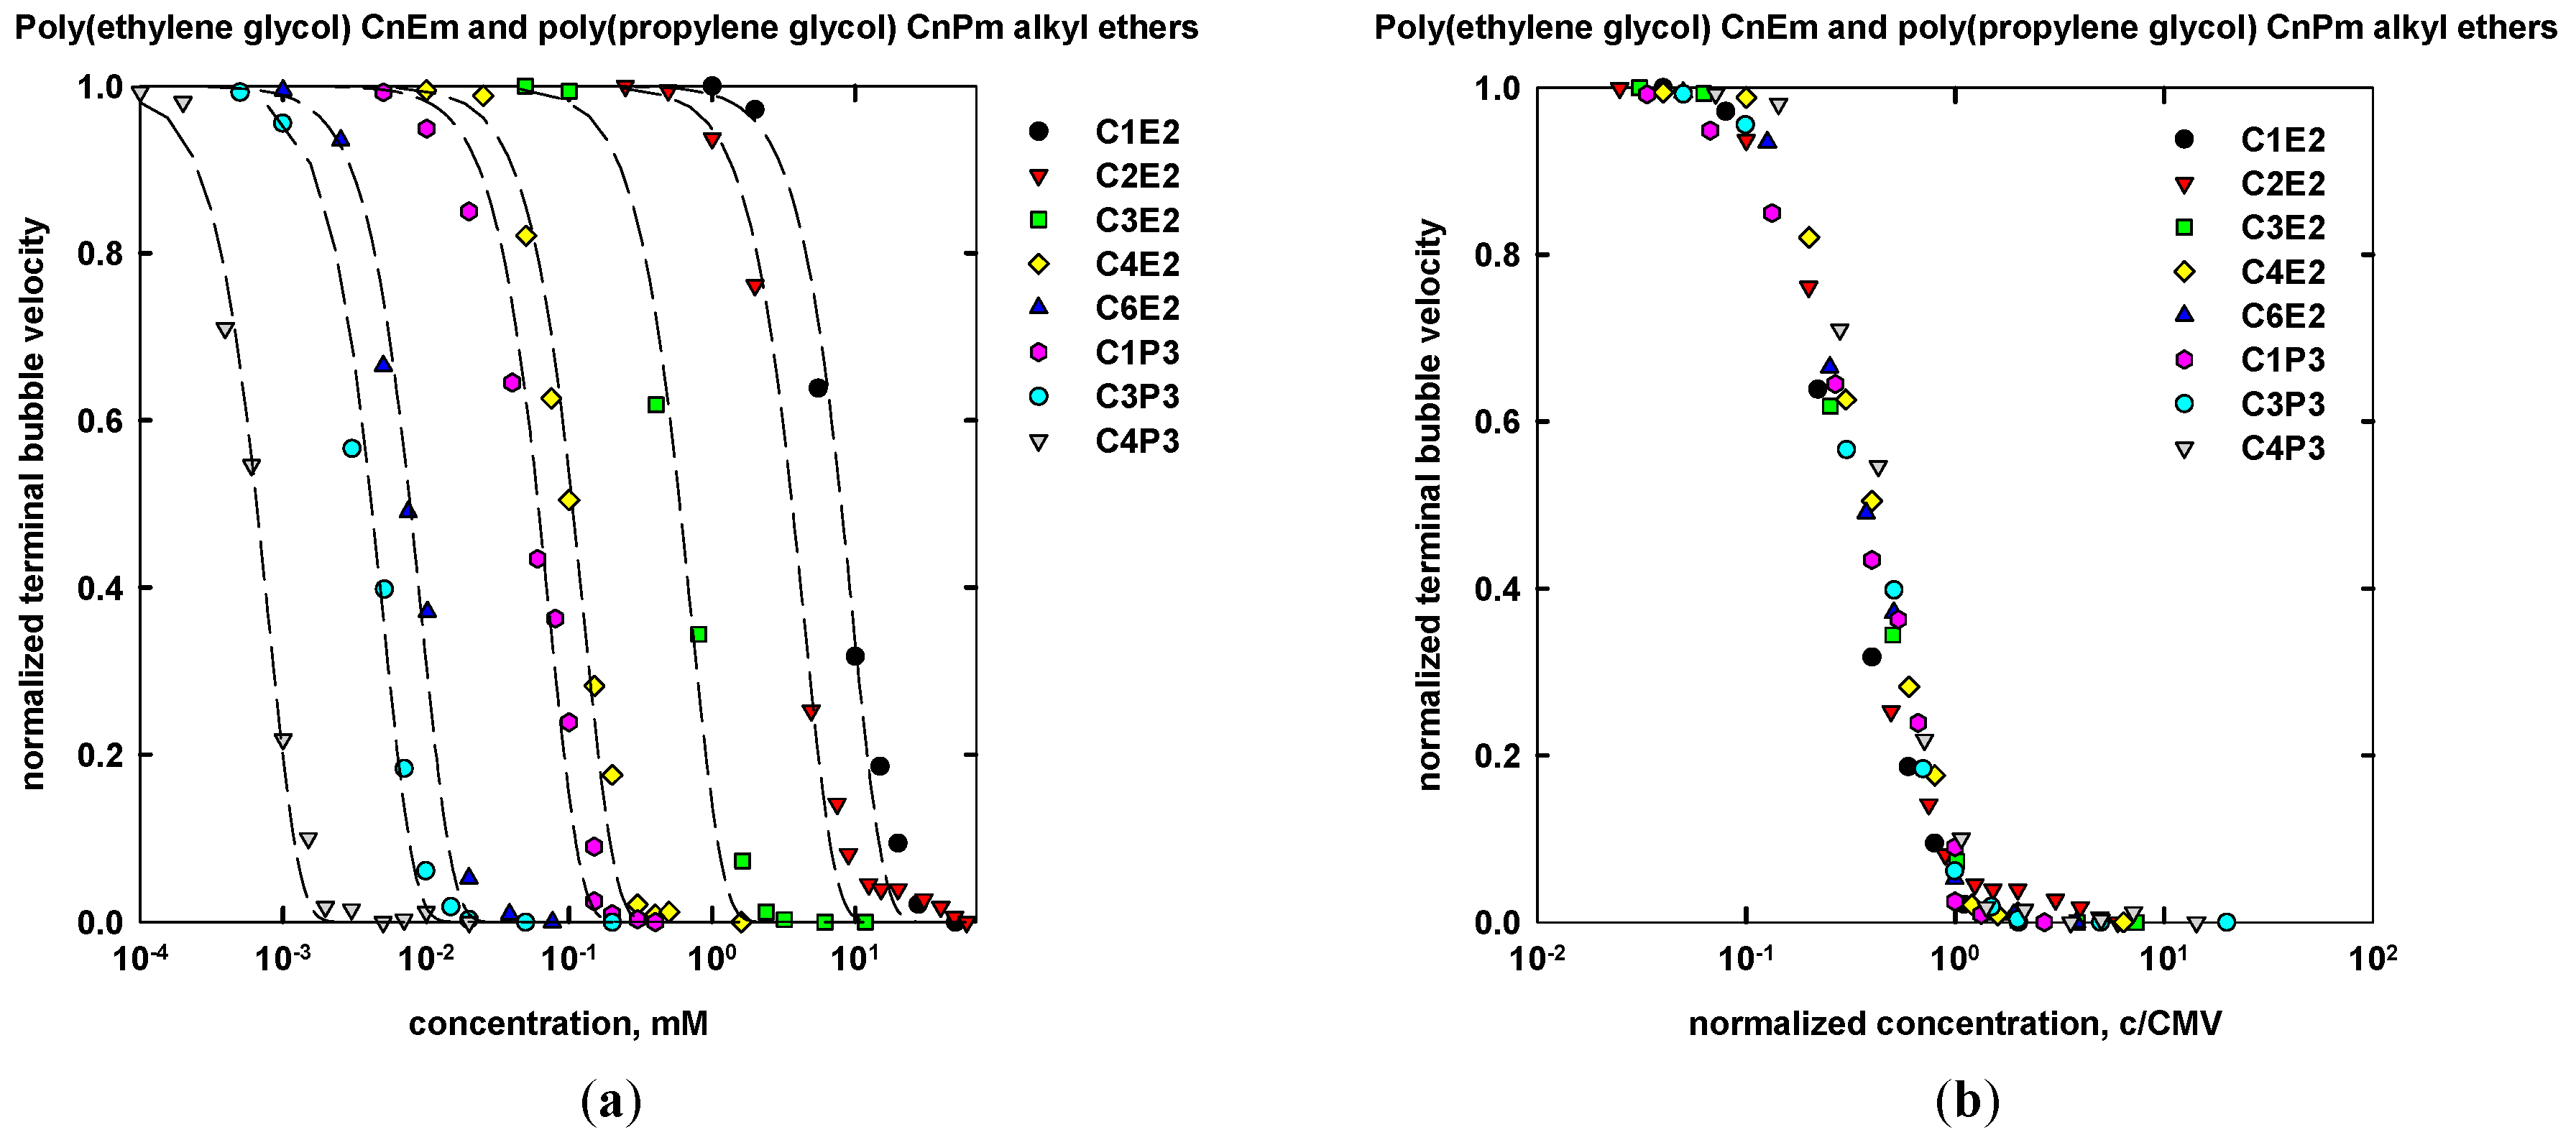
Influence of poly(ethylene glycol) and poly(propylene glycol) alkyl ethers concentration expressed in mM (a) and normalized surfactant concentration (c/CMV) (b) on the normalized terminal bubble velocity.
Figure 8.
Influence of poly(ethylene glycol) and poly(propylene glycol) alkyl ethers concentration expressed in mM (a) and normalized surfactant concentration (c/CMV) (b) on the normalized terminal bubble velocity.

Figure 9.
Influence of n-alkyltrimethylammonium bromides (CnTAB), commercial and other frothers concentration expressed in mM (a) and normalized surfactant concentration (c/CMV) (b) on the normalized terminal bubble velocity.
Figure 9.
Influence of n-alkyltrimethylammonium bromides (CnTAB), commercial and other frothers concentration expressed in mM (a) and normalized surfactant concentration (c/CMV) (b) on the normalized terminal bubble velocity.
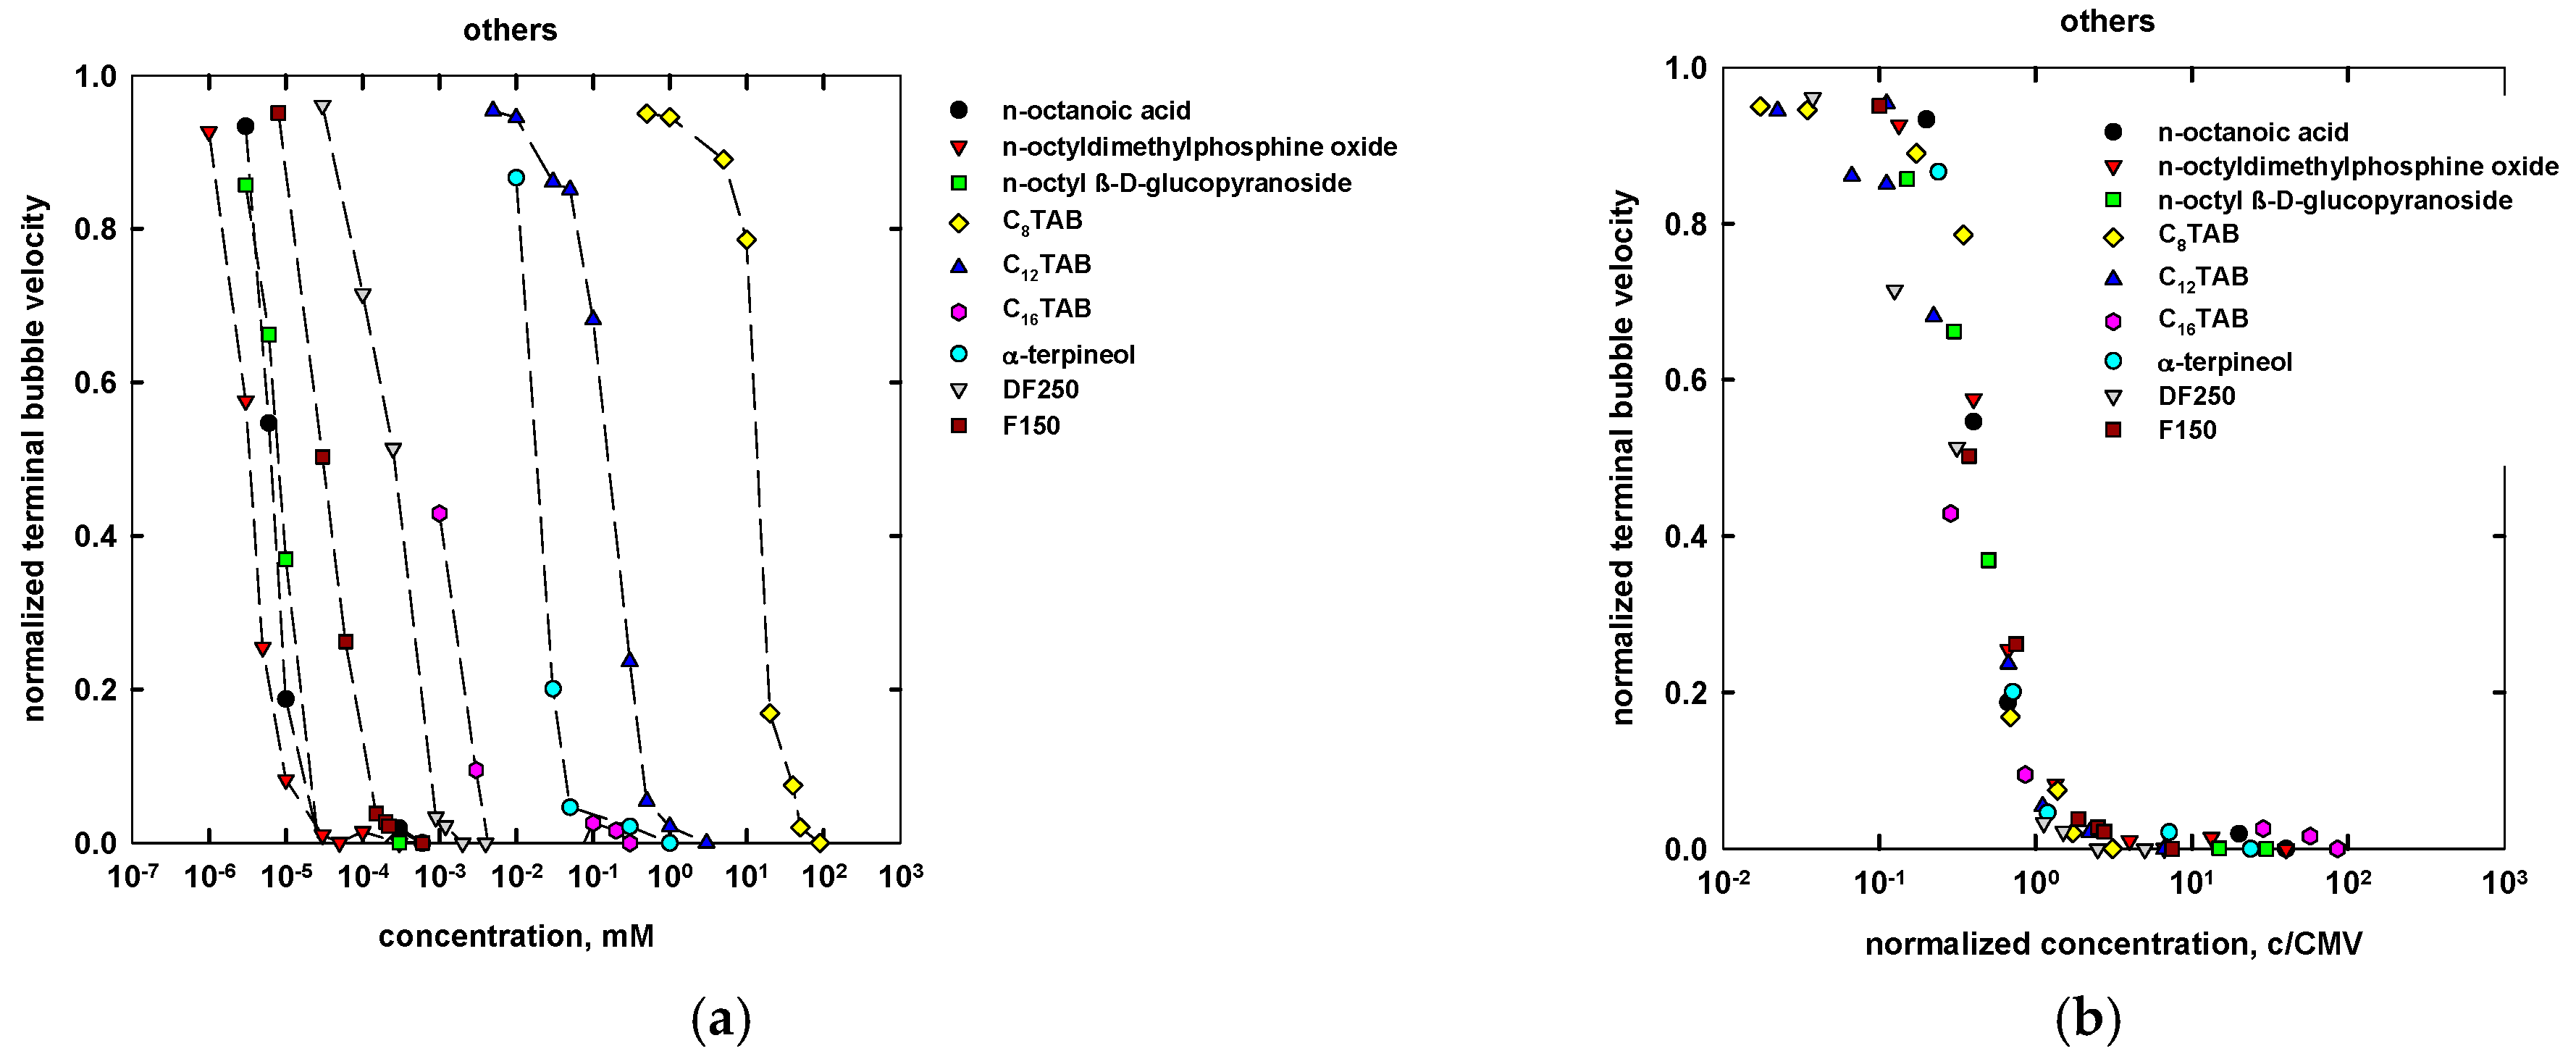
Figure 10.
Comparison of measured and predicted values of CMV for investigated frothers (determination coefficient R2 = 0.9985, standard error of estimate σest = 0.2592).
Figure 10.
Comparison of measured and predicted values of CMV for investigated frothers (determination coefficient R2 = 0.9985, standard error of estimate σest = 0.2592).
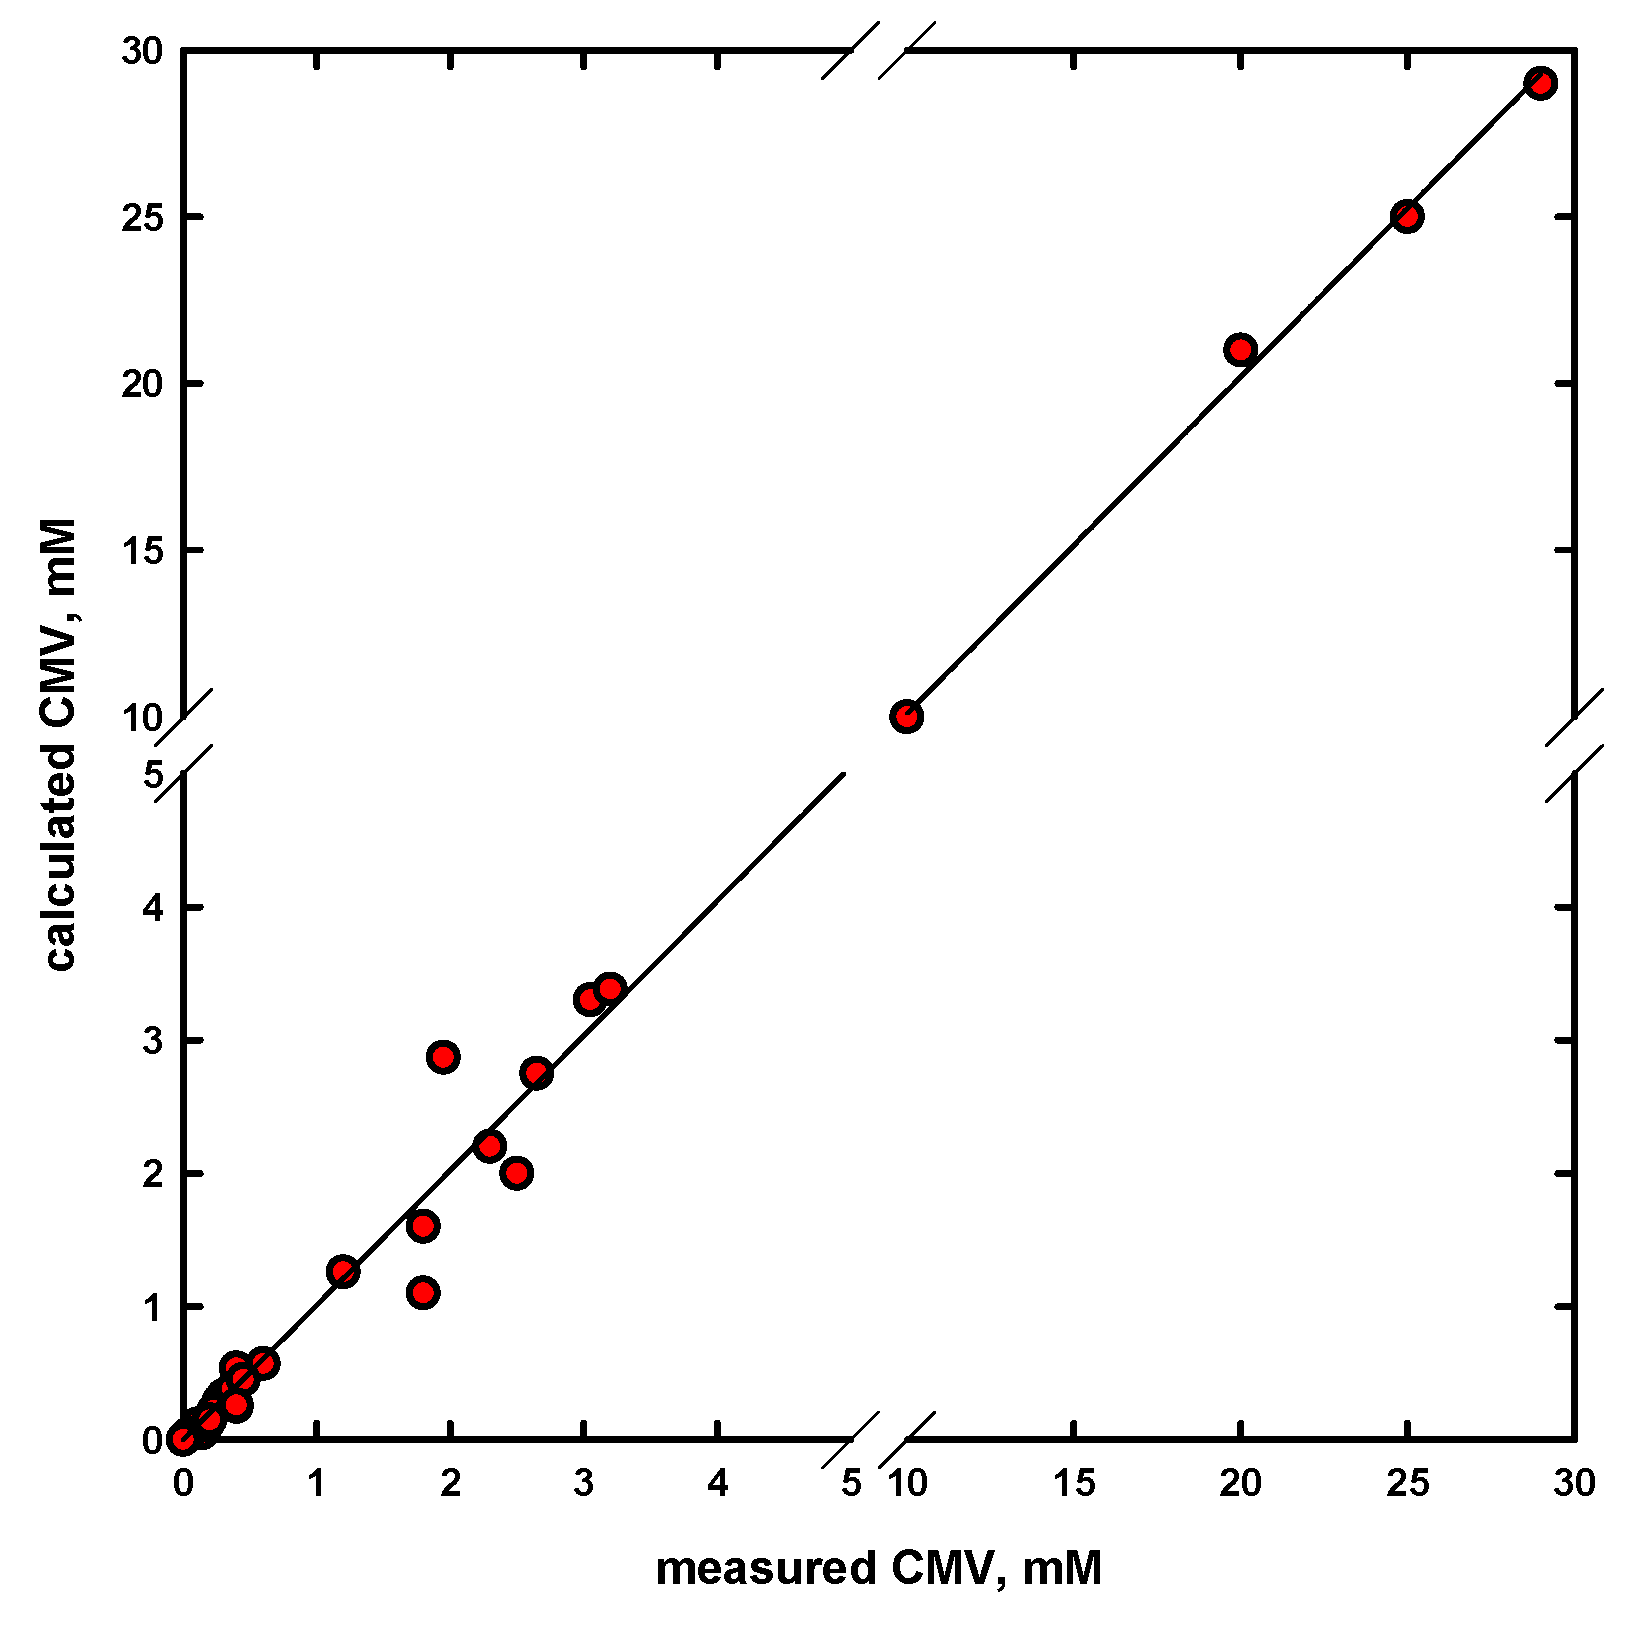
Figure 11.
Comparison of measured [2] and predicted (Equation (1)) values of terminal bubble velocity v vs. 2-pentanol concentration.
Figure 11.
Comparison of measured [2] and predicted (Equation (1)) values of terminal bubble velocity v vs. 2-pentanol concentration.

Figure 12.
The effect of the number of carbons in alkyl chain (n) on CMV. Solids represent experiments, while lines show linear fitting curves.
Figure 12.
The effect of the number of carbons in alkyl chain (n) on CMV. Solids represent experiments, while lines show linear fitting curves.

Figure 13.
Relationship between lnCMH and lnCCC95 for tested nonionic surfactants. Solids represent the experimental point (data: CMV Table 1, CCC [18,28]), while lines represent linear fitting curves.

Figure 14.
Relationship between dynamic frothability index (DFI) and CMV values for aliphatic alcohols (data: CMV Table 1, DFI [30]).
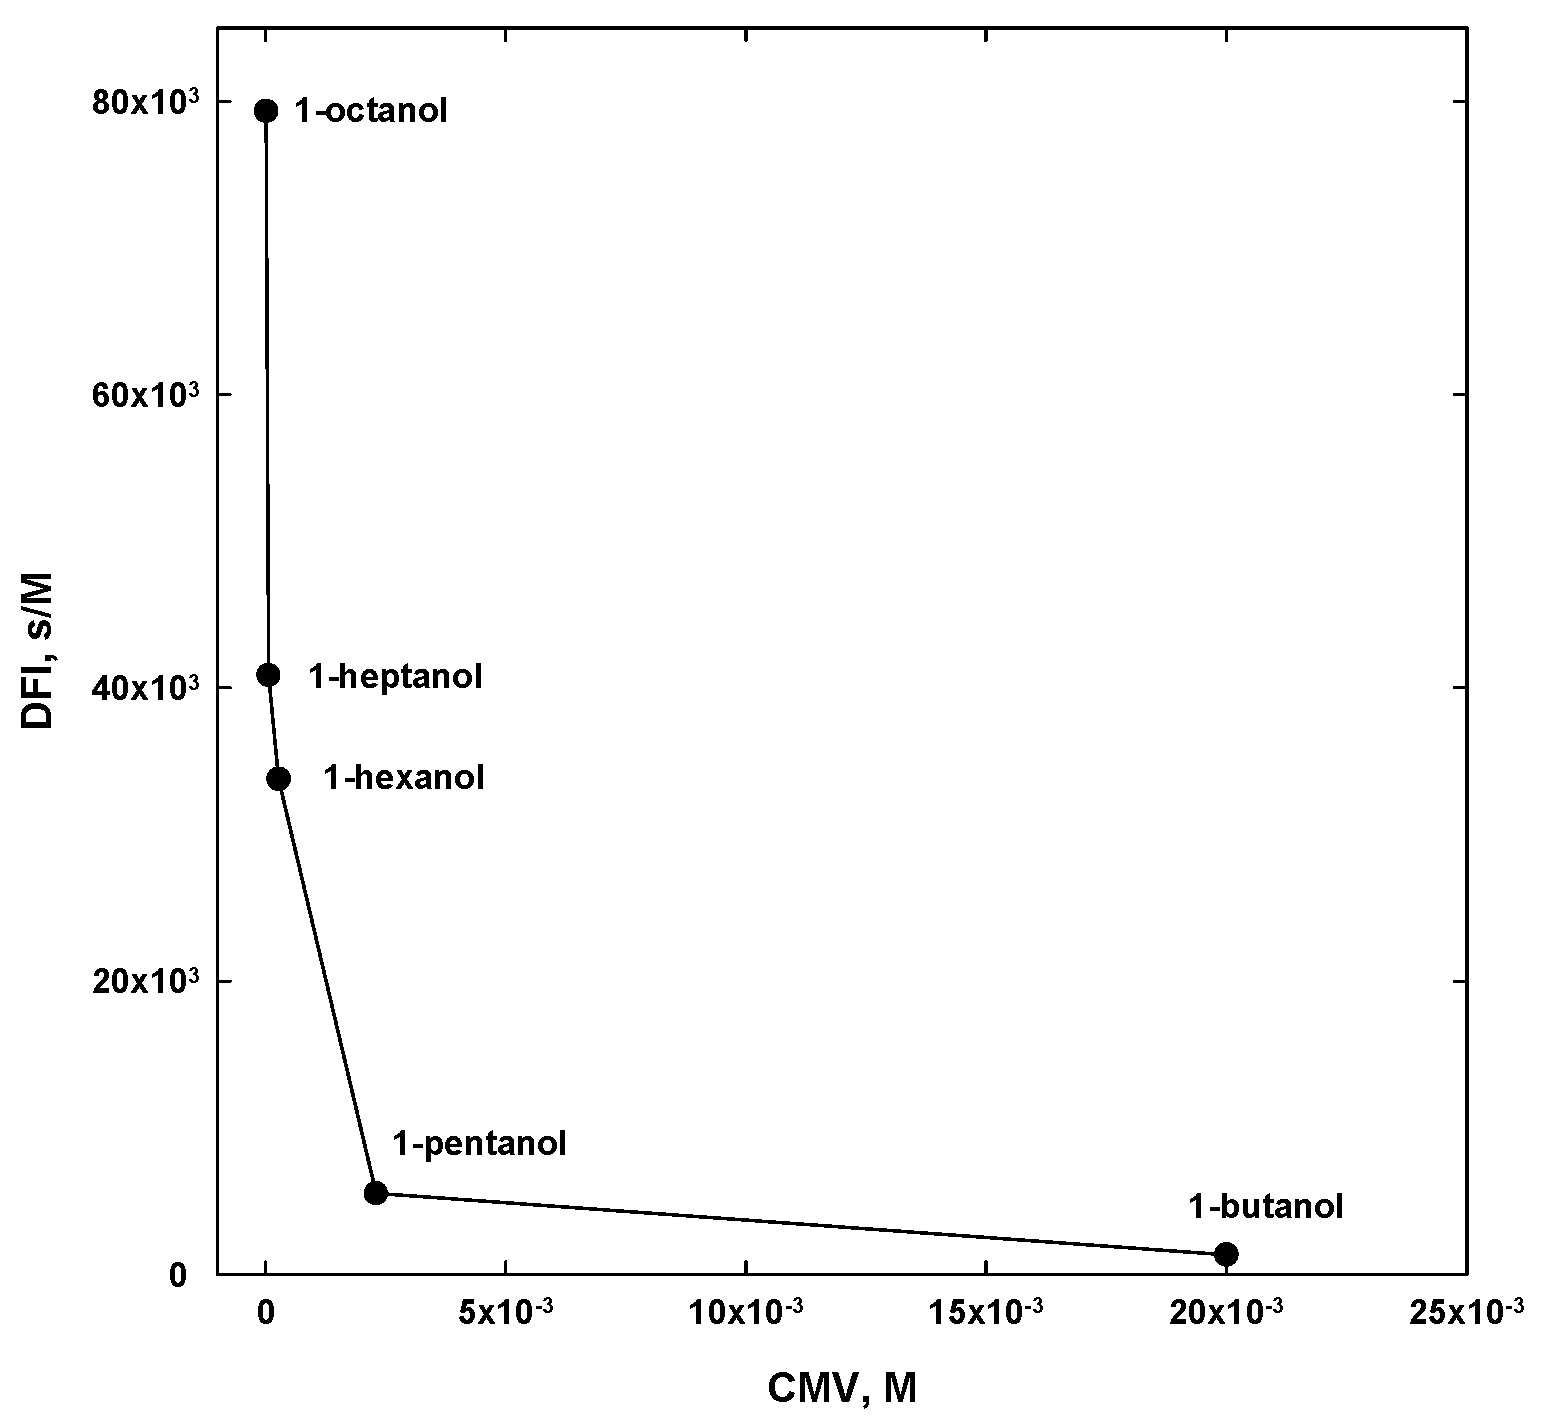
Figure 15.
Effect of the number of carbons in the alkyl chain (n) of aliphatic alcohols on CMV and DFI: (a) DFI and CMV vs. n; (b) 1/DFI and CMV vs n.
Figure 15.
Effect of the number of carbons in the alkyl chain (n) of aliphatic alcohols on CMV and DFI: (a) DFI and CMV vs. n; (b) 1/DFI and CMV vs n.
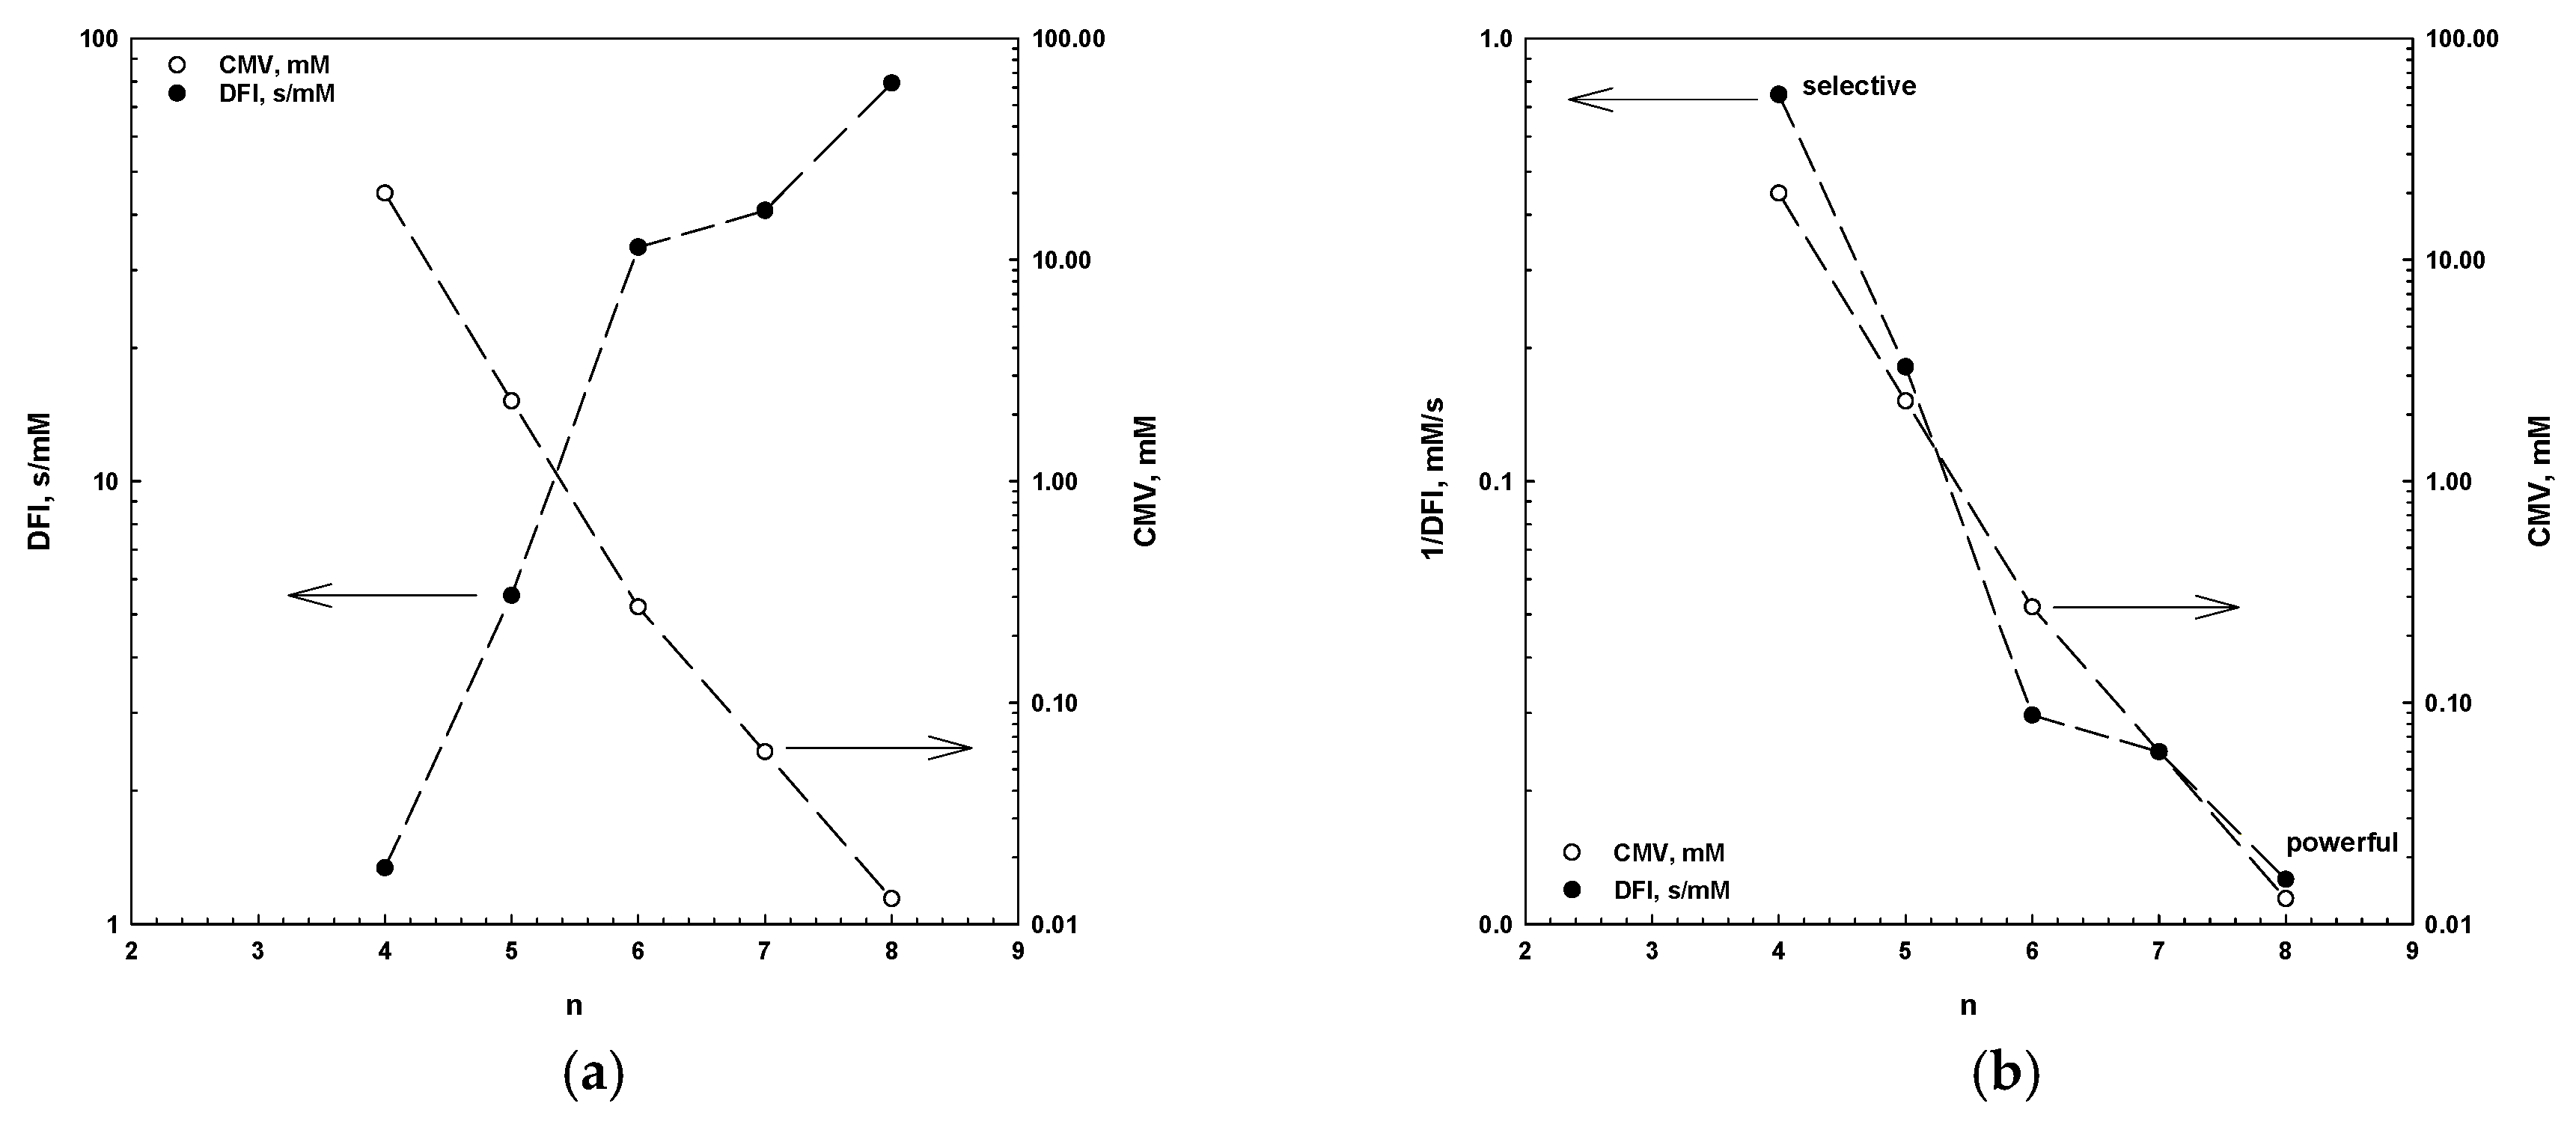
Figure 16.
Flotation recovery of coal as a function of (a) frother concentration expressed in M; and (b) products of c·DFI, c/CMV and c/CCC (data of recovery and DFI from [9]).
Figure 16.
Flotation recovery of coal as a function of (a) frother concentration expressed in M; and (b) products of c·DFI, c/CMV and c/CCC (data of recovery and DFI from [9]).
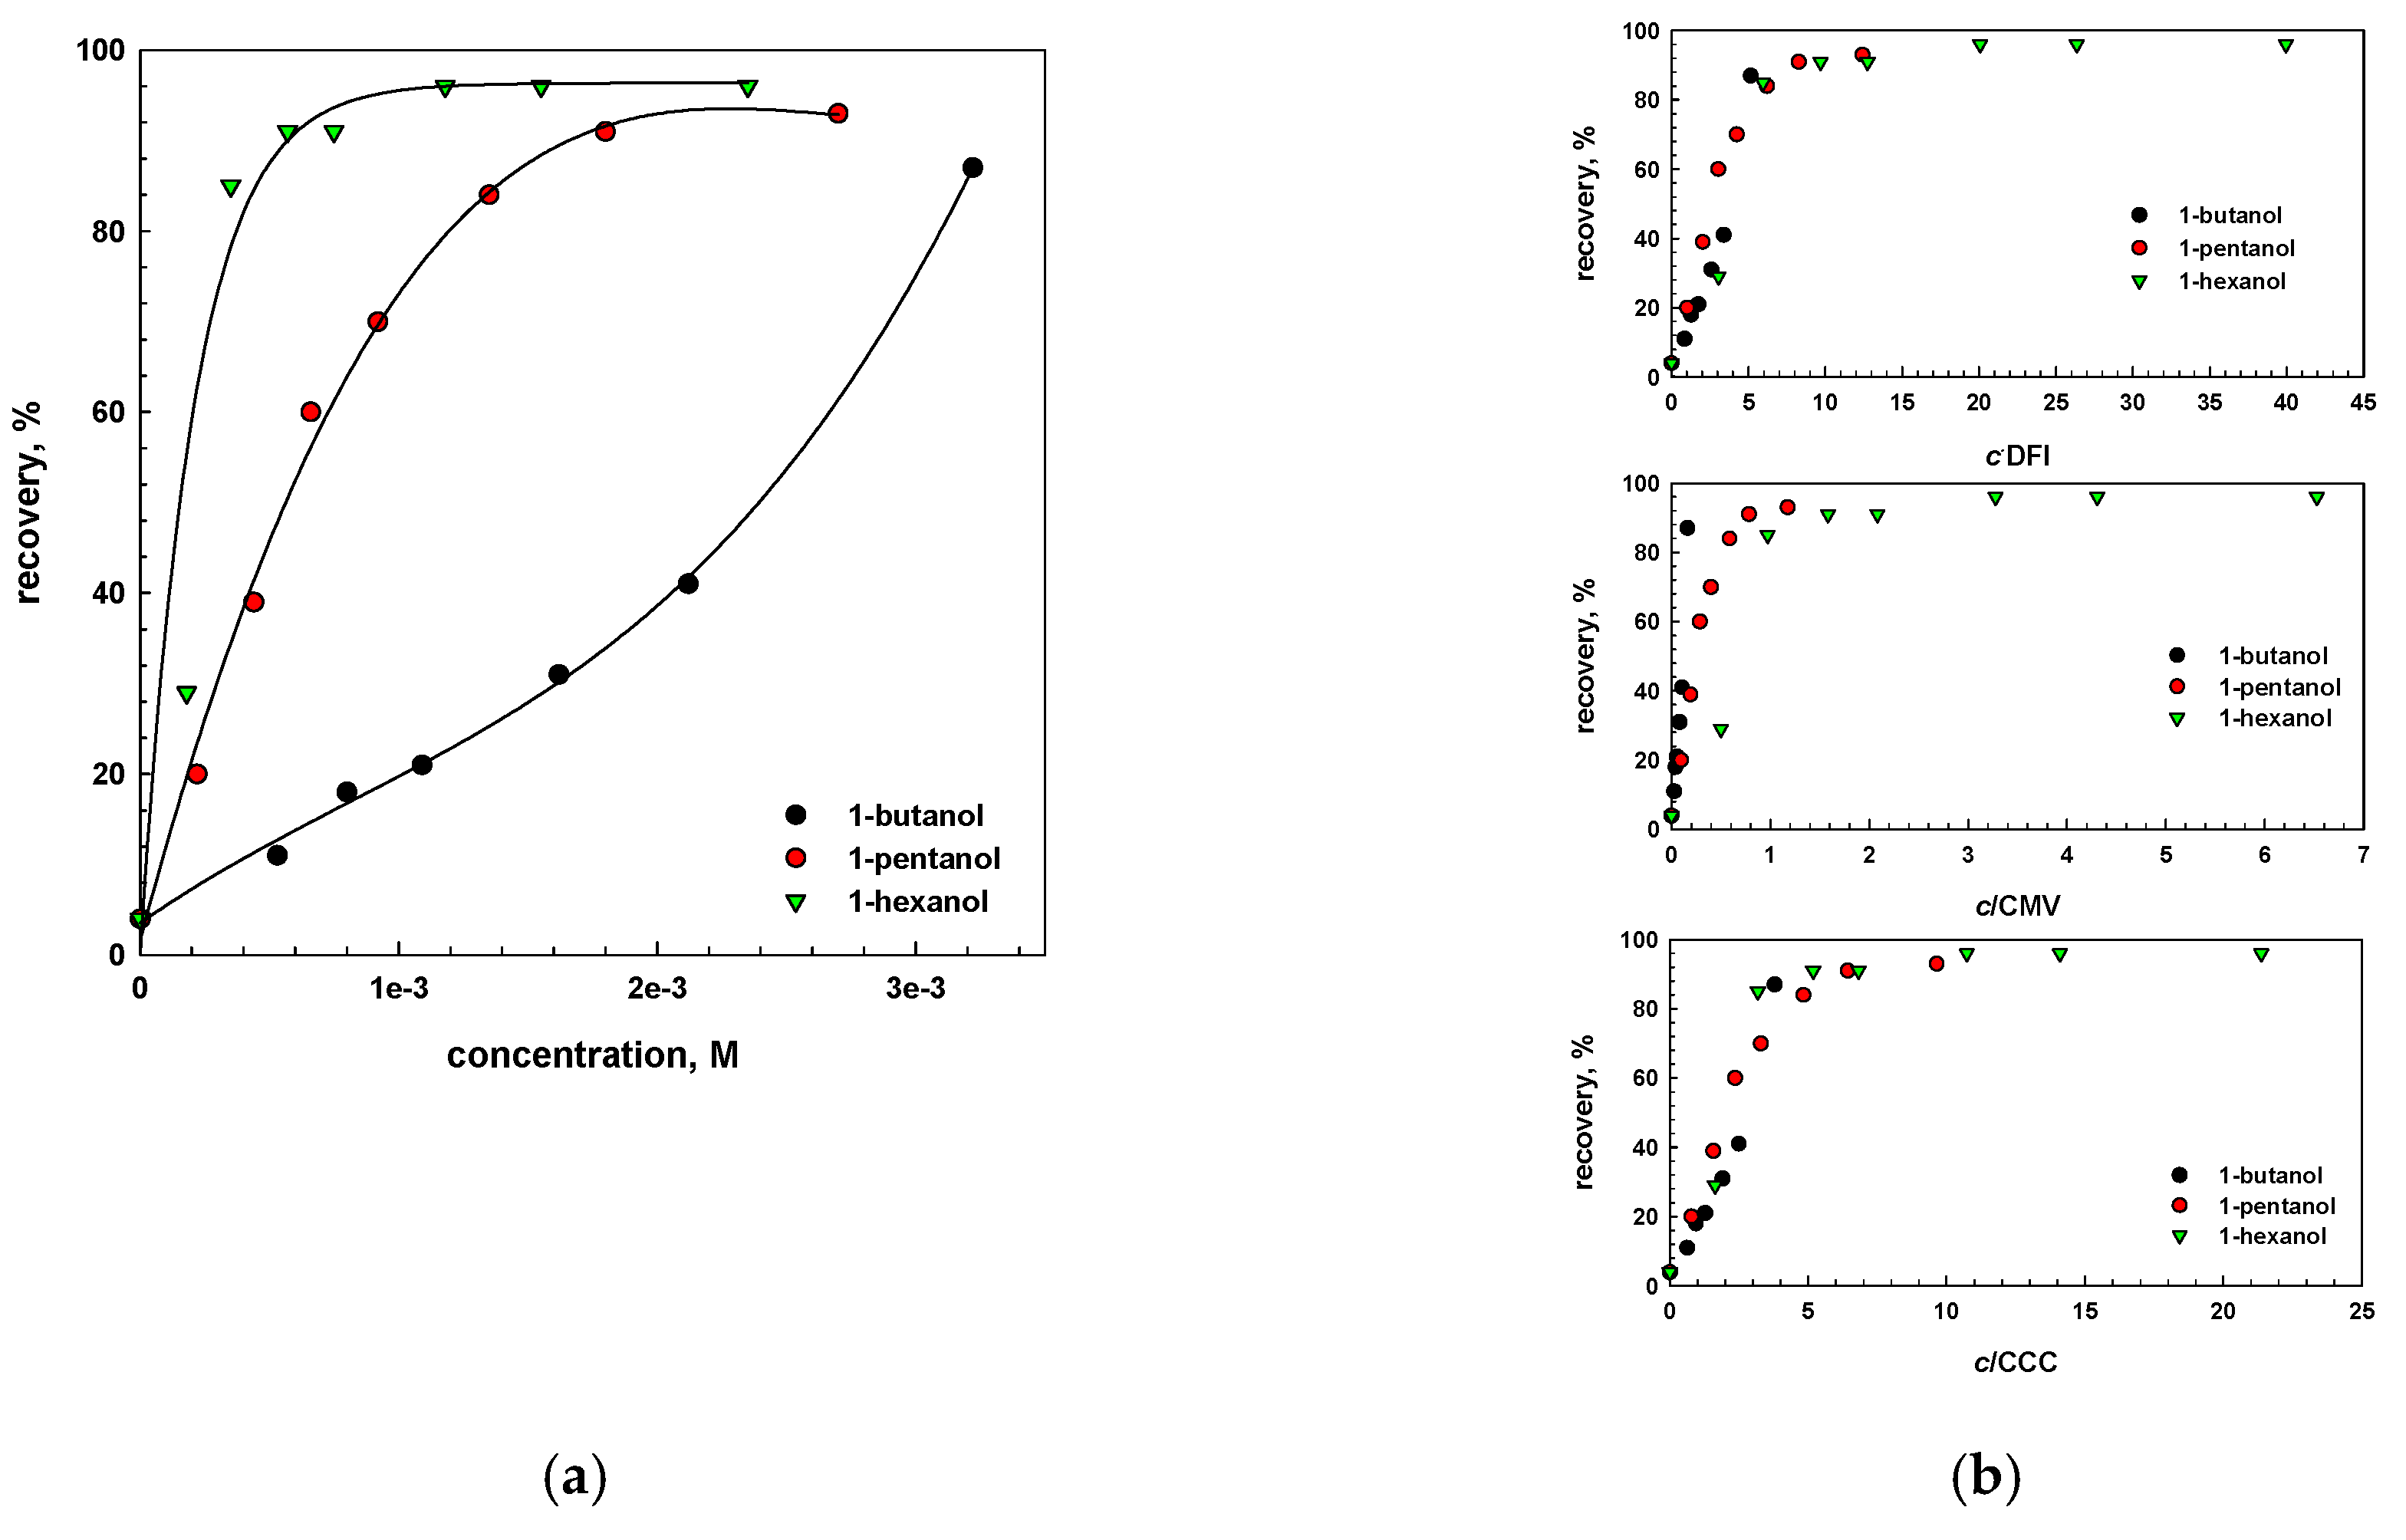

Table 1.
Properties of surfactants used in this study. Data from a [3], b [24], c [25], d [2], e [26], f [1], g [19]. Accuracy of CMV according to original source. n/d—not determined because original data were not available.
| Name | Chemical Formula | n | m | MW (g/mol) | CMVexp (mM) | CMVcalc (mM) |
|---|---|---|---|---|---|---|
| Aliphatic alcohols, Cn | ||||||
| straight alkyl chain | ||||||
| 1-butanol | CH3(CH2)3OH | 4 | - | 74.12 | 20 a | 24 |
| 1-pentanol | CH3(CH2)4OH | 5 | - | 88.15 | 2.3 a | 2.2 |
| 1-hexanol | CH3(CH2)5OH | 6 | - | 102.17 | 0.27 a | 0.30 |
| 1-heptanol | CH3(CH2)6OH | 7 | - | 116.20 | 0.06 a | 0.05 |
| 1-octanol | CH3(CH2)7OH | 8 | - | 130.23 | 0.013 b | 0.013 |
| 1-nonanol | CH3(CH2)8OH | 9 | - | 144.25 | 0.007 c | 0.007 |
| 2-pentanol | CH3(CH2)2CHOHCH3 | 5 | - | 88.15 | 2.65 d | 2.75 |
| 3-pentanol | CH3CH2CHOHCH2CH3 | 5 | - | 88.15 | 3.05 d | 3.3 |
| 2-hexanol | CH3(CH2)3CHOHCH3 | 6 | - | 102.17 | 0.30 d | 0.31 |
| 3-hexanol | CH3(CH2)2CHOHCH2CH3 | 6 | - | 102.17 | 0.36 d | 0.32 |
| branched alkyl chain | ||||||
| 2-methyl-1-butanol | CH3CH2CHCH3CH2OH | 5 | - | 88.15 | 1.95 d | 3.0 |
| 2-methyl-2-butanol | CH3CH2CH3COHCH3 | 5 | - | 88.15 | 3.5 d | n/d |
| 3-methyl-1-butanol | CH3CHCH3(CH2)2OH | 5 | - | 88.15 | 1.2 d | 1.30 |
| 3-methyl-2-butanol | CH3CHCH3CHOHCH3 | 5 | - | 88.15 | 3.2 d | 3.0 |
| 2-methyl-1-pentanol | CH3(CH2)2CHCH3CH2OH | 6 | - | 102.17 | 0.23 d | 0.22 |
| 2-methyl-2-pentanol | CH3(CH2)2CCH3OHCH3 | 6 | - | 102.17 | 0.40 d | n/d |
| 2-methyl-3-pentanol | CH3CH2CHOHCH(CH3)2 | 6 | - | 102.17 | 0.65 d | n/d |
| 3-methyl-1-pentanol | CH3CH2CHCH3(CH2)2OH | 6 | - | 102.17 | 0.14 d | 0.05 |
| 3-methyl-2-pentanol | CH3CH2CHCH3CHOHCH3 | 6 | - | 102.17 | 0.37 d | 0.40 |
| 3-methyl-3-pentanol | CH3CH2COHCH3CH2CH3 | 6 | - | 102.17 | 0.60 d | 0.60 |
| 4-methyl-1-pentanol | (CH3)2CH(CH2)3OH | 6 | - | 102.17 | 0.11 d | 0.05 |
| 4-methyl-2-pentanol (MIBC) | (CH3)2CHCH2CHOHCH3 | 6 | - | 102.17 | 0.4 f | 0.25 |
| 1,ω-diol | ||||||
| 1,2-butanediol | C2H5CHOHCH2OH | 4 | - | 90.12 | 20 a | n/d |
| 1,2-pentanediol | C3H7CHOHCH2OH | 5 | - | 104.15 | 1.8 a | 1.1 |
| 1,2-hexanediol | C4H9CHOHCH2OH | 6 | - | 118.17 | 0.18 a | 0.11 |
| 1,5-hexanediol | CH3CHOH(CH2)4OH | 6 | - | 118.17 | 0.40 a | 0.60 |
| 1,6-hexanediol | HO(CH2)6OH | 6 | - | 118.17 | 2.5 a | 2.0 |
| Poly(ethylene glycol) alkyl ethers, CnEm | ||||||
| Ethylene glycol monoethyl ether | C2H5(OC2H4)OH | 2 | 1 | 90.12 | 20 a | n/d |
| Ethylene glycol monopropyl ether | C3H7(OC2H4)OH | 3 | 1 | 104.15 | 6.5 a | n/d |
| Ethylene glycol monobutyl ether | C4H9(OC2H4)OH | 4 | 1 | 118.17 | 1.1 a | n/d |
| Di(Ethylene glycol) monomethyl ether | CH3(OC2H4)2OH | 1 | 2 | 120.15 | 25 a | 25 |
| Di(Ethylene glycol) monoethyl ether | C2H5(OC2H4)2OH | 2 | 2 | 134.15 | 10 a | 10 |
| Di(Ethylene glycol) monopropyl ether | C3H7(OC2H4)2OH | 3 | 2 | 148.20 | 1.8 a | 1.6 |
| Di(Ethylene glycol) monobutyl ether | C4H9(OC2H4)2OH | 4 | 2 | 162.23 | 0.4 a | 0.25 |
| Di(Ethylene glycol) monohexyl ether | C6H13(OC2H4)2OH | 6 | 2 | 190.28 | 0.025 a | 0.020 |
| Tri(Ethylene glycol) monomethyl ether | CH3(OC2H4)3OH | 1 | 3 | 164.20 | 7 a | n/d |
| Tri(Ethylene glycol) monoethyl ether | C2H5(OC2H4)3OH | 2 | 3 | 178.23 | 1.4 a | n/d |
| Tri(Ethylene glycol) monobutyl ether | C4H9(OC2H4)3OH | 4 | 3 | 206.28 | 0.08 a | n/d |
| Poly(propylene glycol) alkyl ethers, CnPm | ||||||
| Propylene glycol propyl ether | C3H7(OC3H6)OH | 3 | 1 | 118.17 | 3 a | n/d |
| Propylene glycol butyl ether | C4H9(OC3H6)OH | 4 | 1 | 132.20 | 0.5 a | n/d |
| Di(propylene glycol) methyl ether | CH3(OC3H6)2OH | 1 | 2 | 148.20 | 3.5 a | n/d |
| Di(propylene glycol) propyl ether | C3H7(OC3H6)2OH | 3 | 2 | 176.25 | 0.14 a | n/d |
| Di(propylene glycol) bytul ether | C4H9(OC3H6)2OH | 4 | 2 | 190.28 | 0.024 a | n/d |
| Tri(propylene glycol) methyl ether | CH3(OC3H6)3OH | 1 | 3 | 206.28 | 0.2 a | 0.15 |
| Tri(propylene glycol) propyl ether | C3H7(OC3H6)3OH | 3 | 3 | 234.33 | 0.01 a | 0.01 |
| Tri(propylene glycol) bytul ether | C4H9(OC3H6)3OH | 4 | 3 | 248.36 | 0.0014 a | 0.0014 |
| n-alkyltrimethylammonium bromides, CnTAB | ||||||
| n-octyltrimethylammonium bromide | CH3(CH2)7N(CH3)3Br | 8 | - | 252.24 | 29 b | 29 |
| n-dodecytrimethylammonium bromide | CH3(CH2)11N(CH3)3Br | 12 | - | 308.34 | 0.45 b | 0.45 |
| n-cetyltrimethylammonium bromide | CH3(CH2)15N(CH3)3Br | 16 | - | 364.45 | 0.0035 b | 0.0035 |
| Commercial frothers | ||||||
| DF250 | CH3(C3H6O)4OH | 1 | 4 | 264.35 | 0.002 f | 0.002 |
| F150 | H(C3H6O)7OH | - | 7 | 425.00 | 8 × 10⁻⁵ f | 8·× 10−5 |
| Others | ||||||
| n-octanoic acid | CH3(CH2)6COOH | 8 | - | 144.21 | 1.5·× 10−5 g | 1.5·× 10−5 g |
| n-octyl β-d-glucopyranoside | C14H28O6 | 8 | - | 292.37 | 2.0·× 10−5 g | 2.0·× 0−5 g |
| n-octyldimethylphosphine oxide | CH3(CH2)7P(O)(CH3)2 | 8 | - | 190.26 | 7.5·× 10−6 g | 7.5·× 10−5 g |
| α-terpineol | C10H18O | - | - | 154.25 | 0.042 e | 0.042 |
Table 2.
Constants in linear trends in relationship between lnCMV and n (Figure 12, lnCMV = −αn + β) that depend on frother family and goodness-of-fit statistics.
Table 2.
Constants in linear trends in relationship between lnCMV and n (Figure 12, lnCMV = −αn + β) that depend on frother family and goodness-of-fit statistics.
| Surfactant Family | α | β | Determination Coefficient R2 | Standard Error of Estimate σest | |
|---|---|---|---|---|---|
| Aliphatic alcohols, Cn | 1.6424 | 9.0449 | 0.9722 | 0.4491 | |
| Poly(ethylene glycol) alkyl ethers, CnEm | m = 1 | 1.4505 | 6.0049 | 0.9834 | 0.2664 |
| m = 2 | 1.4205 | 4.8466 | 0.9954 | 0.2144 | |
| m = 3 | 1.4821 | 3.3770 | 0.9991 | 0.0953 | |
| Poly(propylene glycol) alkyl ethers, CnPm | m = 2 | 1.6535 | 2.9283 | 0.9995 | 0.0824 |
| m = 3 | 1.6317 | 0.0891 | 0.9950 | 0.2503 | |
| n-alkyltrimethylammonium bromides, CnTAB | 1.1278 | 12.5047 | 0.9981 | 0.280 | |
| 1,2-diols | 2.3553 | 12.3992 | 0.9998 | 0.0430 | |
Table 3.
Constants in linear trends in the relationship between lnCMV and lnCCC (Figure 13, lnCMV = αlnCCC − β) that depend on frother family and goodness-of-fit statistics.
Table 3.
Constants in linear trends in the relationship between lnCMV and lnCCC (Figure 13, lnCMV = αlnCCC − β) that depend on frother family and goodness-of-fit statistics.
| Surfactant | α | β | Data Points, N | Determination Coefficient R2 | Standard Error of Estimate σest |
|---|---|---|---|---|---|
| Aliphatic alcohols, Cn | 0.4594 | 1.5232 | 8 | 0.9742 | 0.4194 |
| Poly(ethylene glycol) alkyl ethers, CnEm | 0.3026 | 1.6329 | 11 | 0.7640 | 0.3951 |
| Poly(propylene glycol) alkyl ethers, CnPm | 0.2486 | 1.8593 | 8 | 0.9193 | 0.2183 |
© 2017 by the authors. Licensee MDPI, Basel, Switzerland. This article is an open access article distributed under the terms and conditions of the Creative Commons Attribution (CC BY) license (http://creativecommons.org/licenses/by/4.0/).
Share and Cite
MDPI and ACS Style
Kowalczuk, P.B.; Zawala, J.; Drzymala, J. Concentration at the Minimum Bubble Velocity (CMV) for Various Types of Flotation Frothers. Minerals 2017, 7, 118. https://doi.org/10.3390/min7070118
AMA Style
Kowalczuk PB, Zawala J, Drzymala J. Concentration at the Minimum Bubble Velocity (CMV) for Various Types of Flotation Frothers. Minerals. 2017; 7(7):118. https://doi.org/10.3390/min7070118
Chicago/Turabian StyleKowalczuk, Przemyslaw B., Jan Zawala, and Jan Drzymala. 2017. "Concentration at the Minimum Bubble Velocity (CMV) for Various Types of Flotation Frothers" Minerals 7, no. 7: 118. https://doi.org/10.3390/min7070118
Note that from the first issue of 2016, this journal uses article numbers instead of page numbers. See further details here.