
The Interaction between Ca2+ and Molybdenite Edges and Its Effect on Molybdenum Flotation
by
He Wan
1,2,*, 
Wei Yang
1,*,
Weicheng Cao
2,
Tingshu He
1,
Yanying Liu
2,
Jianbo Yang
3,
Lin Guo
3 and
Yongjun Peng
4 1
College of Materials and Mineral Resources, Xi’an University of Architecture and Technology, Xi’an 710055, China
2
JinDuiCheng Molybdenum Co., Ltd., Xi’an 710077, China
3
China Molybdenum Co., Ltd., Luanchuan 471500, China
4
School of Chemical Engineering, The University of Queensland, St. Lucia, Brisbane 4072, Australia
*
Authors to whom correspondence should be addressed.
Minerals 2017, 7(8), 141; https://doi.org/10.3390/min7080141
Submission received: 7 July 2017
/
Revised: 2 August 2017
/
Accepted: 7 August 2017
/
Published: 9 August 2017
Abstract
:In this paper, the influence of Ca2+ on the flotation of a skarn type molybdenum ore and pure molybdenite mineral at pH 8 was studied using diesel as the collector. It was found that Ca2+ had little effect on molybdenum flotation at low concentrations. By further increasing Ca2+ concentration, the floatability of molybdenite—especially from the fine size fractions—was depressed even without the presence of fine gangue minerals. The mechanism responsible for the deleterious effect of Ca2+ on molybdenite flotation was studied by a range of techniques including zeta potential measurements, Scanning Electron Microscopy, and Energy Dispersive X-ray Spectrometer (SEM-EDS) analyses and molybdenum phase analyses. It was found that Ca2+ interacted with molybdenite edges producing CaMoO4 precipitates which were responsible for the depression of molybdenite flotation of Ca2+ by preventing the adsorption of diesel.
1. Introduction
Flotation exploits a difference in surface wettability on valuable and gangue minerals, and water quality has a significant impact on mineral flotation through the modification of surface wettability by ions in water [1,2,3,4]. Due to the scarcity of fresh water and increasingly stringent regulations on the quality of discharged water, groundwater or sea water with a high strength of ions and recycled water are used by most flotation plants. This practice has resulted in an increase in ion strength of process water as a result of evaporation and ongoing ion inputs from groundwater (or seawater), chemicals added in flotation and run off from spoil [5,6,7].
The negative impact of calcium ions in process water on the flotation of molybdenite from Cu-Mo ores has been reported in a number of studies [8,9,10]. The negative impact of calcium ions has been attributed to the bridging role of calcium ions which promote the coating of fine gangue (e.g., quartz) particles on molybdenite. It has been found that calcium ions can adsorb on molybdenite as a result of electrostatic interactions and then increase the zeta potential of molybdenite or even reverse the zeta potential from negative to positive [11].Adsorbed calcium ions are attractive to negatively charged fine quartz or other gangue particles, deteriorating molybdenite flotation. These studies were conducted on Cu–Mo ores with bulk flotation of Cu and Mo at high pH and molybdenite recovered as a by-product [12,13,14,15].
Limited studies have been conducted to understand the direct depression of calcium ions on molybdenite flotation. While contributing the slime coating induced by calcium and magnesium ions to the depression of molybdenite flotation, Zanin et al. [10] also measured contact angles on coarse molybdenite particles (+150 μm) in the proximity of their faces and edges after conditioning at different pH values and calcium ion concentrations. They found that pH had little effect on the contact angle on molybdenite faces but a great effect on the contact angle on molybdenite edges. The contact angle on molybdenite edges was lower at pH 11 than at pH 8. At both pH 11 and 8, the contact angle on molybdenite edges decreased with increasing Ca2+ concentration, especially after Ca2+ concentration reached 6 × 10⁻³ M. The study from Zanin et al. [10] suggests that Ca2+ may directly depress molybdenite flotation even in the absence of fine gangue particles.
Lucay et al. [16] studied the effect of gypsum on the floatability of molybdenite in saline solutions using a modified Hallimond tube. In their study, the flotation was conducted at a fixed concentration of Ca2+ (0.05 mol/L) by varying the concentration of SO42−. Under these conditions, a concentration of 0.14 mol/L SO42− was required to form gypsum. They found that the formation of gypsum at pH 7–8 depressed the floatability of molybdenite, especially at a fine size. They also noted that before gypsum began to form, the recovery of molybdenite was lower compared to the natural molybdenite flotation recovery, which was attributed to the adsorption of Ca2+ on the edges of molybdenite particles and the micro-edges of the micro-crystals that composed the faces of molybdenite particles. The study of Lucay et al. [16] also indicated the depression role of Ca2+ in molybdenite flotation at slightly alkaline pH.
Hirajima et al. [17] studied the effect of Mg2+ and Ca2+ on the floatability of chalcopyrite and molybdenite. They found that MgCl2 and CaCl2 solutions depressed the floatability of chalcopyrite and molybdenite at pH values higher than 9. It is interesting that Hirajima et al. [17] did not observe a depression effect of Ca2+ on the floatability of molybdenite at pH 8 in both flotation tests and contact angle measurements, which disagrees with the contact angle measured by Zanin et al. [10]. It is noted that the molybdenite sample used by Hirajima et al. [17] was a fine powder product (<30 µm) treated with acid and acetone. This molybdenite sample may be different from the natural molybdenite sample processed in flotation plants. Further, Hirajima et al. [17] did not distinguish the effect of Ca2+ on the property of molybdenite edges and faces.
In China, the major molybdenum plants—including those located at Jinduicheng and Luanchuan use sequential flotation, instead of bulk flotation, to recover molybdenite. In this case, nonpolar oil such as kerosene or diesel oil is used as collector and the pH of the flotation ranges between 7 and 8. In this study, the interaction betweenCa2+ and molybdenite edges and its effect on molybdenite flotation was investigated at pH 8 in the context of sequential flotation of molybdenum.
2. Materials and Methods
2.1. Materials and Reagents
The actual Mo ore (AM) used in flotation tests was supplied by the tungsten–molybdenum Mine of Luanchuan in Henan Province, China. It is a skarn type of tungsten–molybdenum ore, in which molybdenite (MoS2) occurs as a major phase and scheelite (CaWO3) as a minor phase. This ore was crushed to below 2 mm and then ground in a porcelain ball mill to 65% particles below 76 μm. The elemental composition of the actual Mo ore analyzed by Inductively Coupled Plasma Mass Spectrometry (ICP-MS, Thermo Fisher Scientific Inc., Waltham, MA, USA) and X ray fluorescence (Camscan Electron Optics, Ltd., Cambridge, UK) is given in Table 1. The mineralogical composition of the actual Mo ore analyzed by X-ray diffraction (Rigaku Corporation, Tokyo, Japan) analysis is given in Table 2.
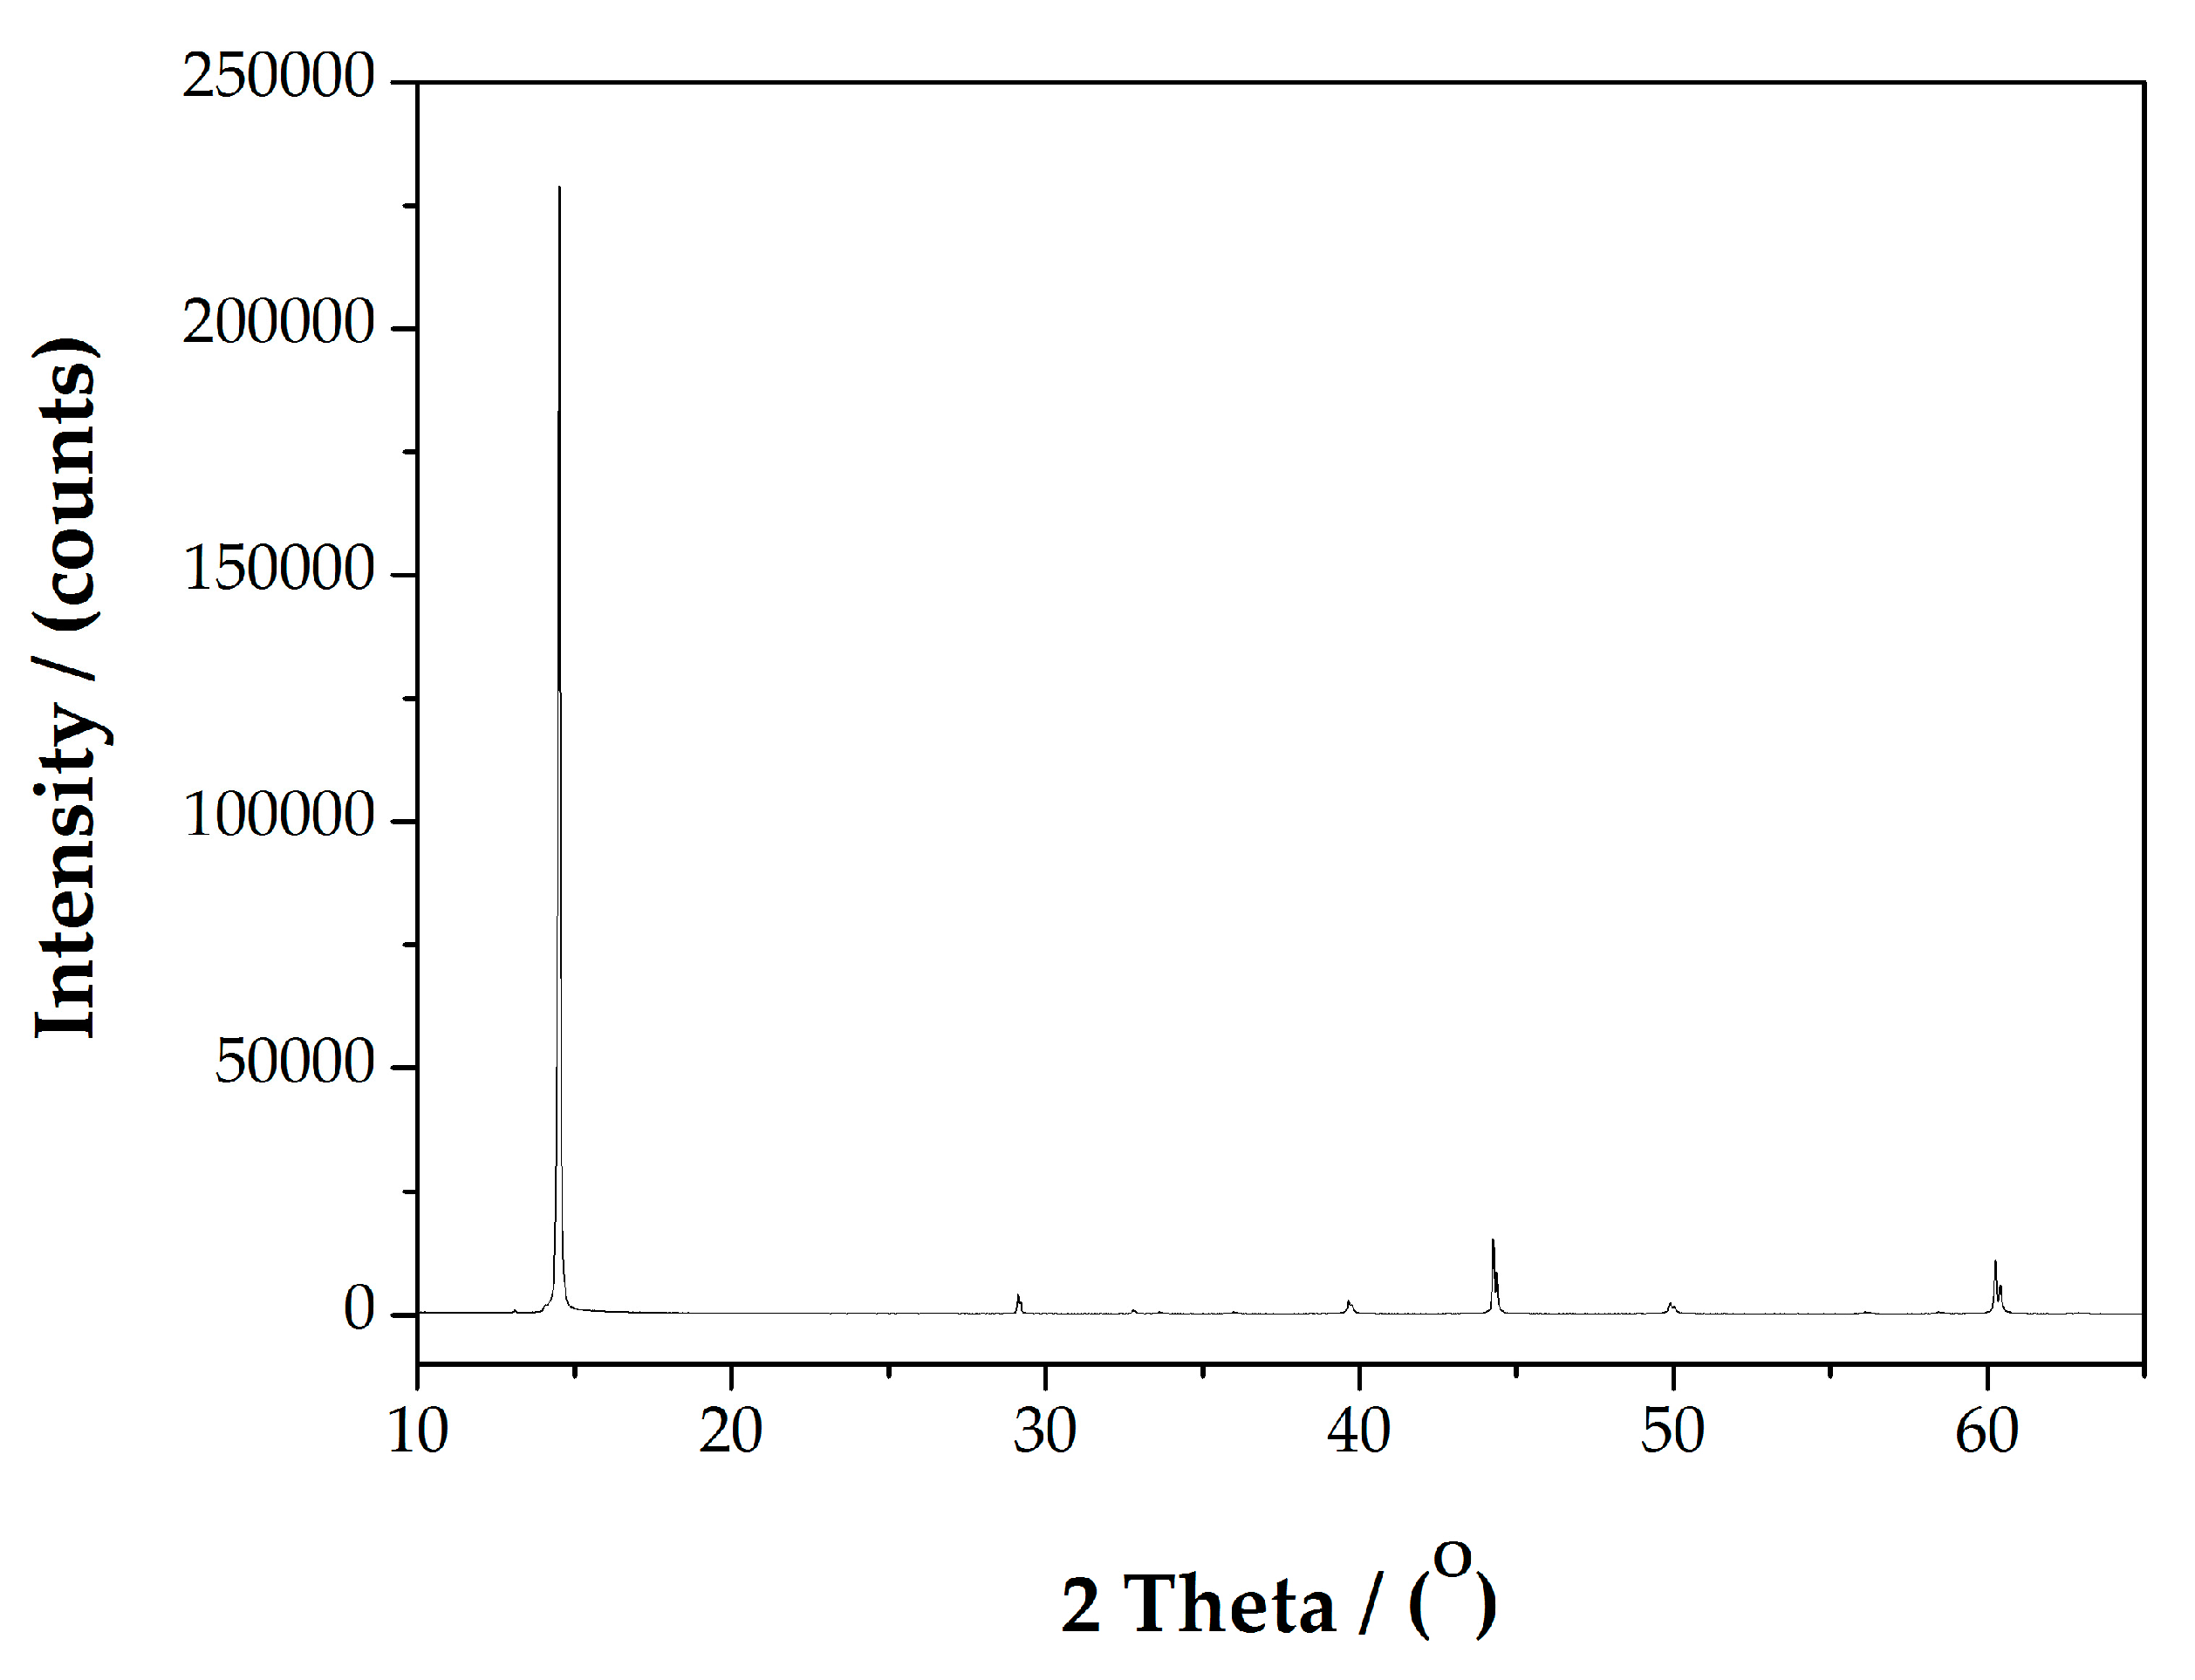
Pure molybdenite crystals (PM) used in this study were obtained from the tungsten–molybdenum Mine of Luanchuan in Henan Province, China, as well. They were first selected by hand to obtain high-grade crystals, then crushed and ground in a porcelain ball mill prior to collectorless flotation to further enrich the molybdenite. The enriched molybdenite was screened to obtain the −38 µm fraction for analysis. This material assayed 58 wt % Mo. The XRD analysis indicates 99 wt % molybdenite as shown in Figure 1.
AM and PM prepared in this study represented the nature molybdenite entering the flotation process without any chemical contamination.
Diesel oil was used as molybdenite collector in this study without emulsification. The addition rate of diesel was 180 g/t in AM flotation and varied in PM flotation. Pine oil was used as frother. The addition rate of pine oil was 100 g/tin AM flotation and 10 mg/L in PM flotation. Sodium silicate (Na2O·nSiO2, n = 1) was used as dispersant in AM flotation with an addition rate of 200 g/t. Calcium chloride was used to introduce calcium ions. Sodium hydroxide was used to adjust pH. Diesel and pine oil were of industrial grade and sodium silicate, calcium chloride, and sodium hydroxide were of analytical grade. Deionized water was used throughout this study. The different collector and frother dosages were used in AM and PM flotation to achieve a similar baseline flotation with a high molybdenite recovery in the absence of Ca2+ in the two cases.
2.2. Flotation Tests
AM flotation was conducted in a RK/FGC 3 L hitch groove flotation cell at a rotating speed of 1700 r/min. In the flotation process, 1 kg AM was added into the flotation cell, followed by the addition of dispersant, collector, and frother with conditioning time for 1, 2 and 1 min, respectively. The total flotation time was 7 min.
PM flotation was conducted in a RK/FGC 40 mL hitch groove flotation cell at a rotating speed of 1700 r/min. In the flotation process, 1 g PM was added to the flotation cell, followed by the addition of collector and frother with conditioning time for 2 and 1 min, respectively. The total flotation time was also 7 min.
2.3. Zeta Potential Measurements
Zeta potential was measured with a zeta potential analyzer from Micromeritics Instrument Corp. (Atlanta, GA, USA). The suspension containing less than 5% PM was conditioned for 15 min in a solution of 0~2000 mg/L Ca2+. Then 20 mg/L diesel oil was added and conditioned for 3 min. The suspension was then transferred to a sample vessel for the zeta potential measurement at room temperature (20 °C). The measurement was repeated five times and the average zeta potential was reported.
2.4. Scanning Electron Microscopy and Energy Dispersive X-ray Spectrometer (SEM-EDS) Analyses
A measure of 5 g PM was mixed in a solution of 800 mg/L Ca2+ and conditioned for 10 min at pH 8. The solids were then washed by deionized water, air dried and coated with carbon, and then analyzed by a Scanning Electron Microscope (SEM) fitted with an Energy Dispersive X-ray Spectrometer (EDS) from Camscan Electron Optics, Ltd., Cambridge, UK. SEM was used to map the surface topography and identify molybdenite faces and edges while EDS was used to identify elements on molybdenite faces and edges.
2.5. The Analysis of Molybdenum Phases
The presence of powellite [CaMoO4] in PM before and after conditioning in the absence and presence of 800 mg/L Ca2+ was quantified by the phase analysis. The sample with or without the conditioning in Ca2+ solution was first washed by aqueous ammonia which can remove MoO42− of molybdenite surface. The insoluble residue was heated with tartaric acid solution to dissolve powellite, but not molybdenite which would remain in the residue. Then the suspension was filtered and the filtrate was assayed for molybdenum by ICP-MS. This phase analysis has been detailed elsewhere [18,19]. MoO42− may occur on the molybdenite surface, but this analysis only detects CaMoO4. In this study, three repeat tests were conducted to determine the amount of powellite for each condition and the average was reported.
3. Results and Discussion
3.1. Flotation Tests
3.1.1. AM Flotation
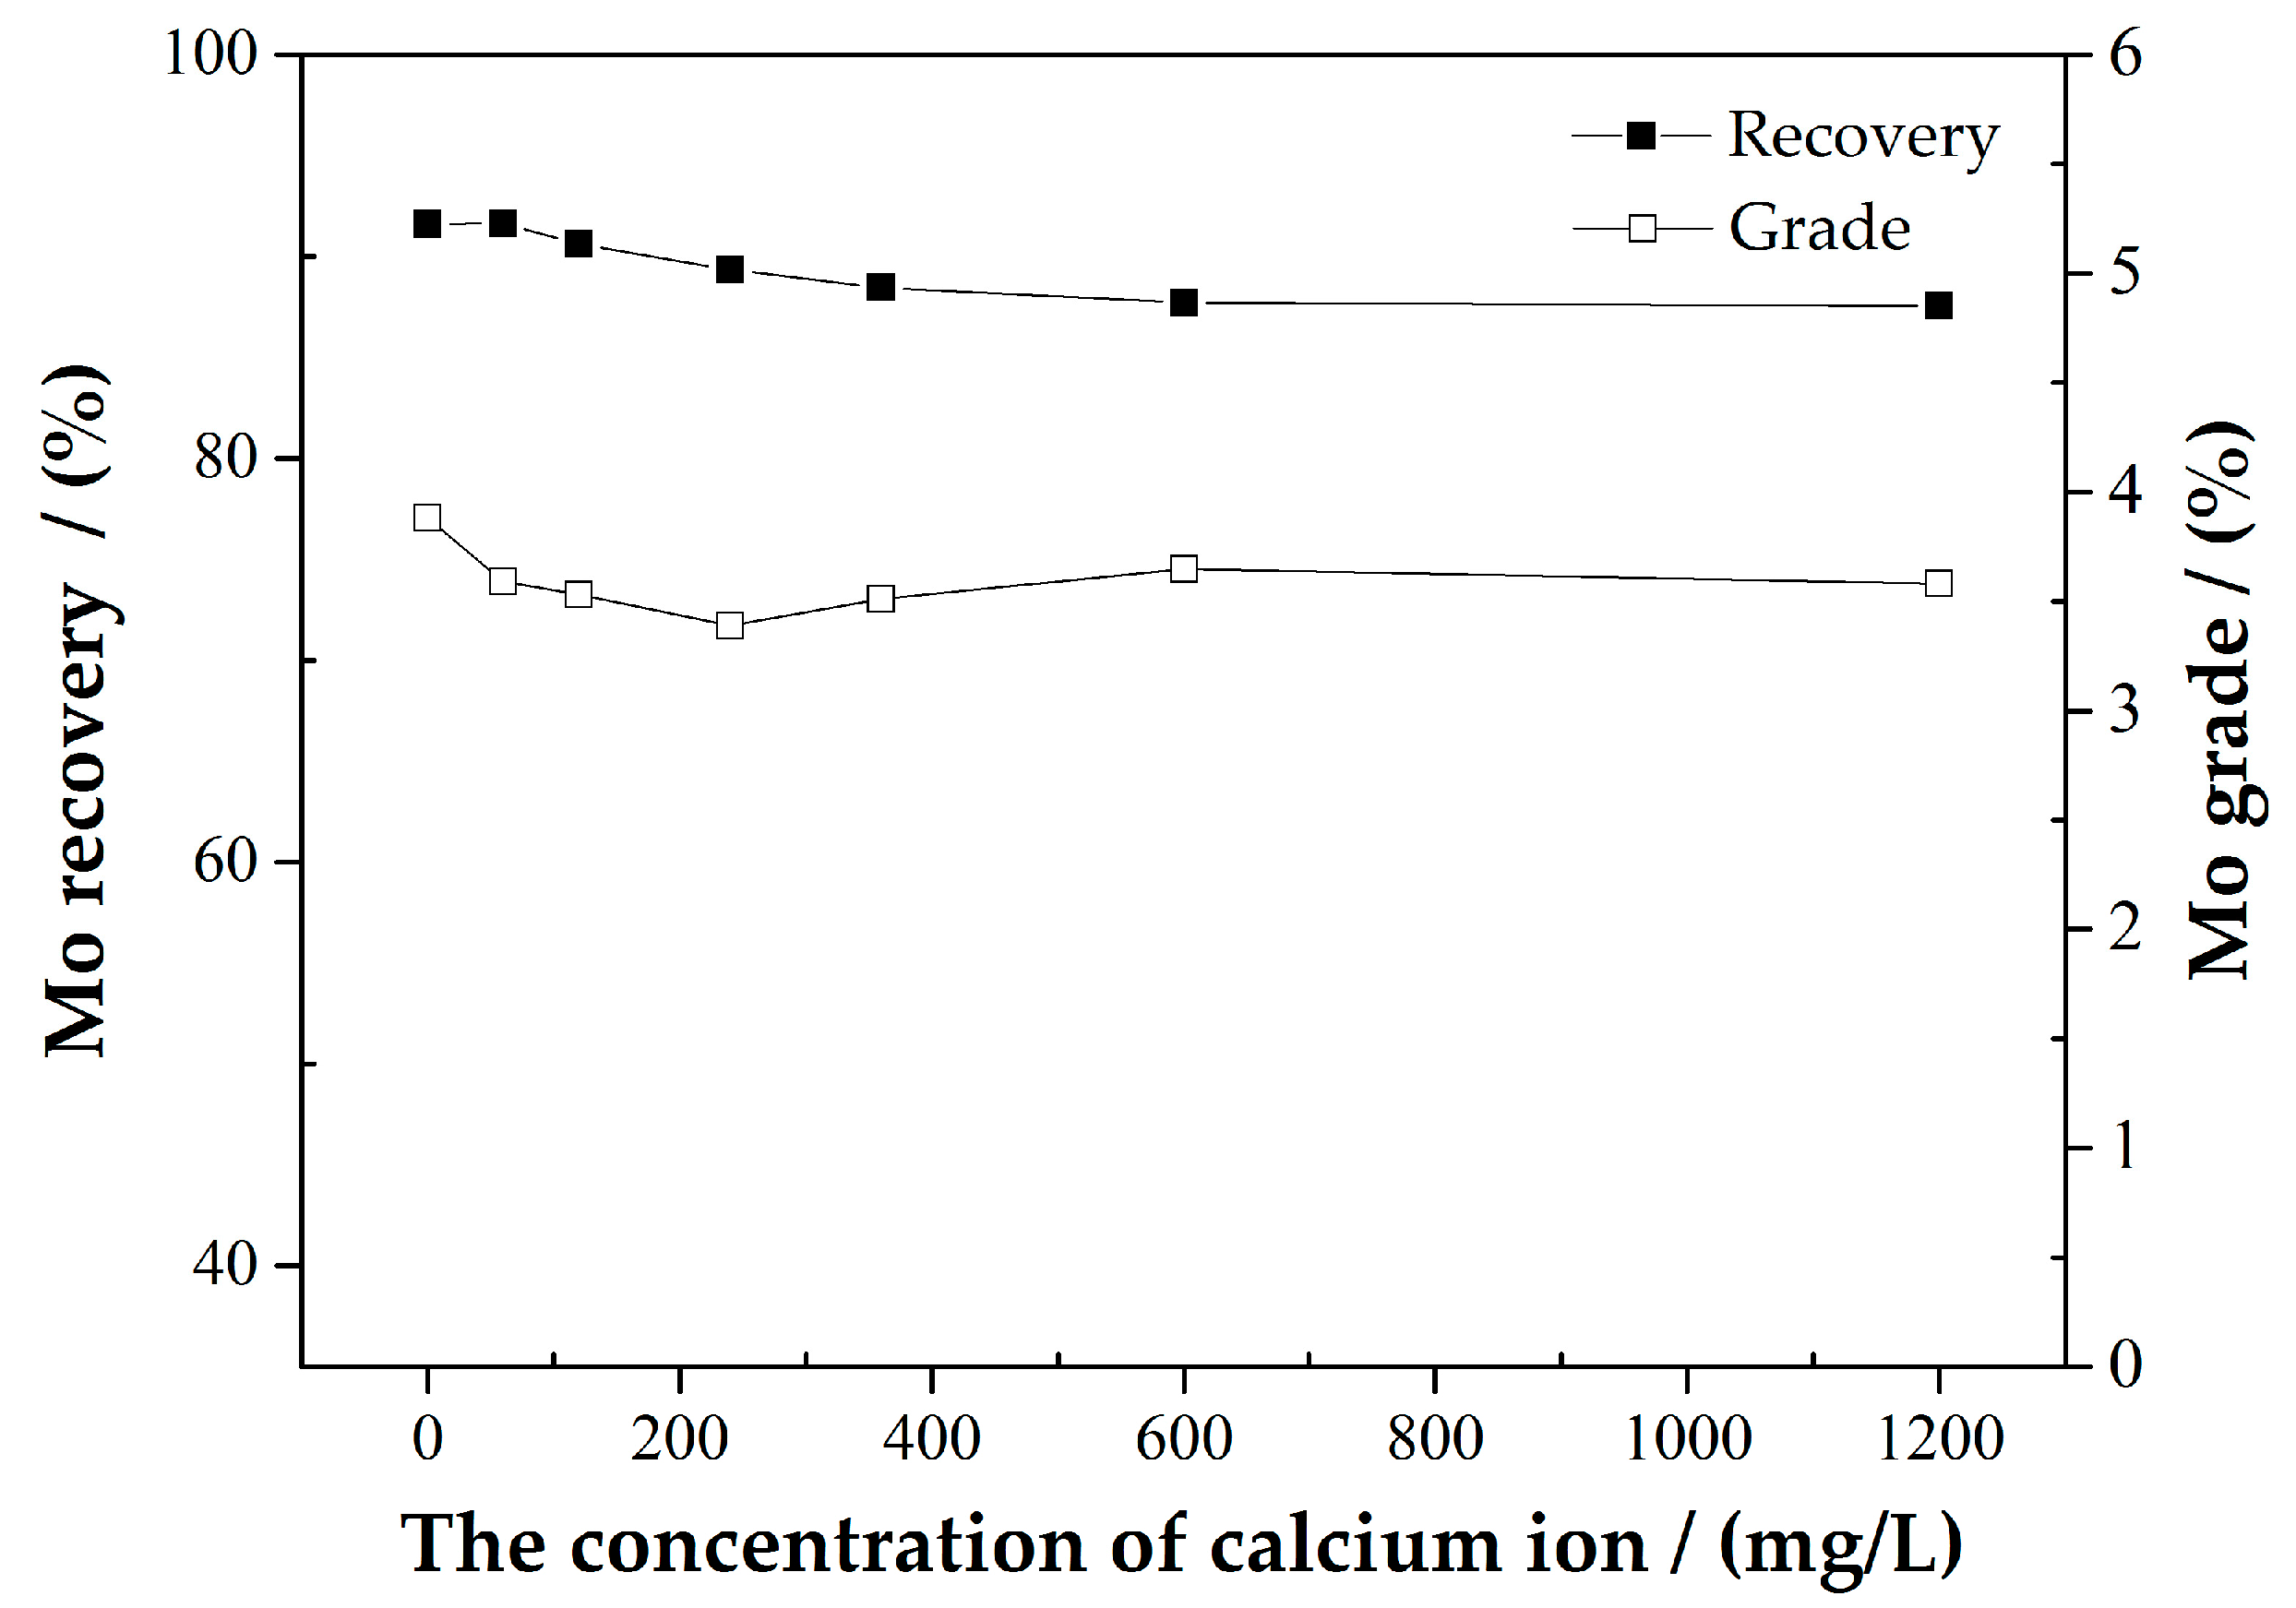
The influence of Ca2+ concentration on AM flotation at pH 8 was studied and the results are shown in Figure 2. As can been seen, molybdenum recovery remained about 91.7% in the presence of Ca2+ below 60 mg/L. Above 60 mg/L, molybdenum recovery decreased with increasing the Ca2+ concentration and reached a minimum of about 87.5% at 600 mg/L Ca2+. Figure 2 also shows that Ca2+ only had a slight effect on molybdenum grade ranging from 3.5% to 4%. Table 1 shows that AM contains calcium minerals. Obviously, these calcium minerals did not affect the floatability of molybdenite since a high molybdenite recovery was obtained without the addition of Ca2+.
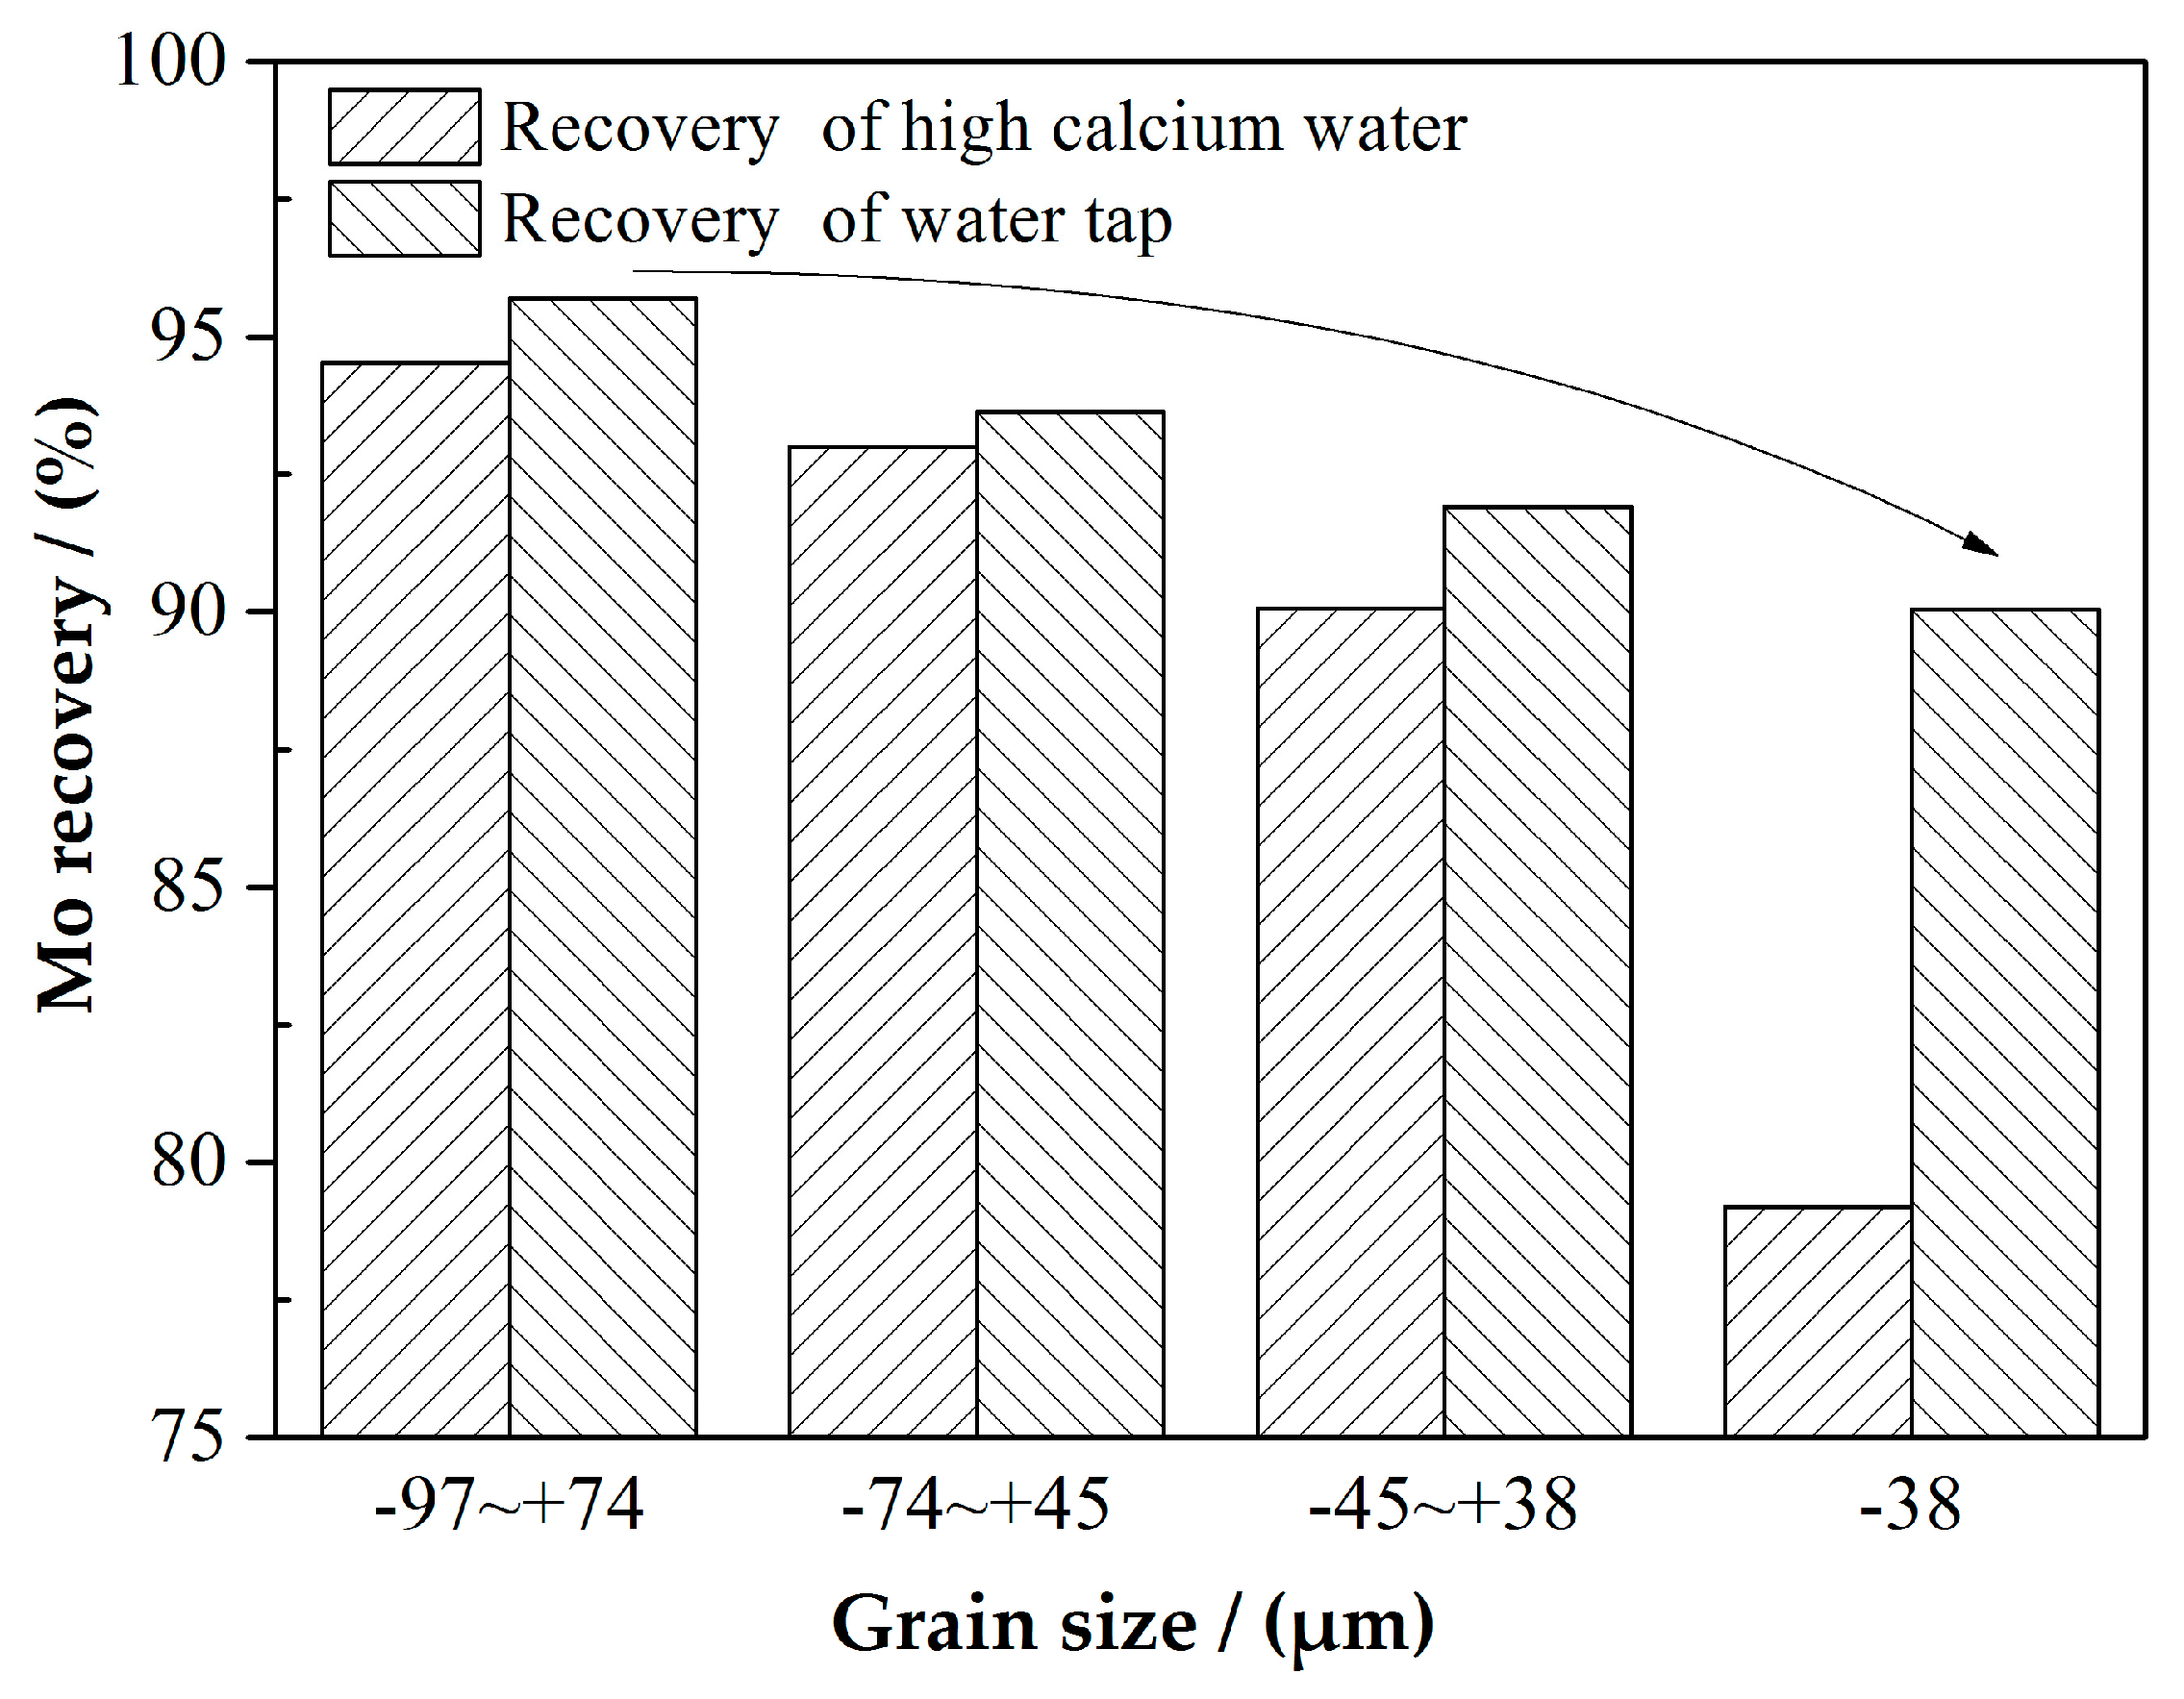
Figure 3 shows molybdenite recovery in AM flotation from different size fractions in the absence and presence of 800 mg/L Ca2+ at pH 8. It is clear that Ca2+ had a greater depression effect on the flotation of molybdenite from a fine size fraction than from an intermediate size fraction. For example, from −38 µm size fraction, molybdenite recovery decreased from about 90.1% in the absence of Ca2+ to about 79.1% in the presence of 800 mg/L Ca2+, while from −97 + 74 µm size fraction, molybdenite recovery only decreased from about 96.0% in the absence of Ca2+ to about 94.0% in the presence of 800 mg/L Ca2+. Obviously, the depression of Ca2+ on molybdenite flotation shown in Figure 2 is mainly attributed to depression from fine size fractions. As reported by Zanin et al. [10], Ca2+ did not affect the contact angle on molybdenite faces but reduced the contact angle on molybdenite edges at pH 8 [10]. This explains the more deleterious effect of Ca2+ on the flotation of fine molybdenite with a high proportion of edges in Figure 3.
3.1.2. PM Flotation
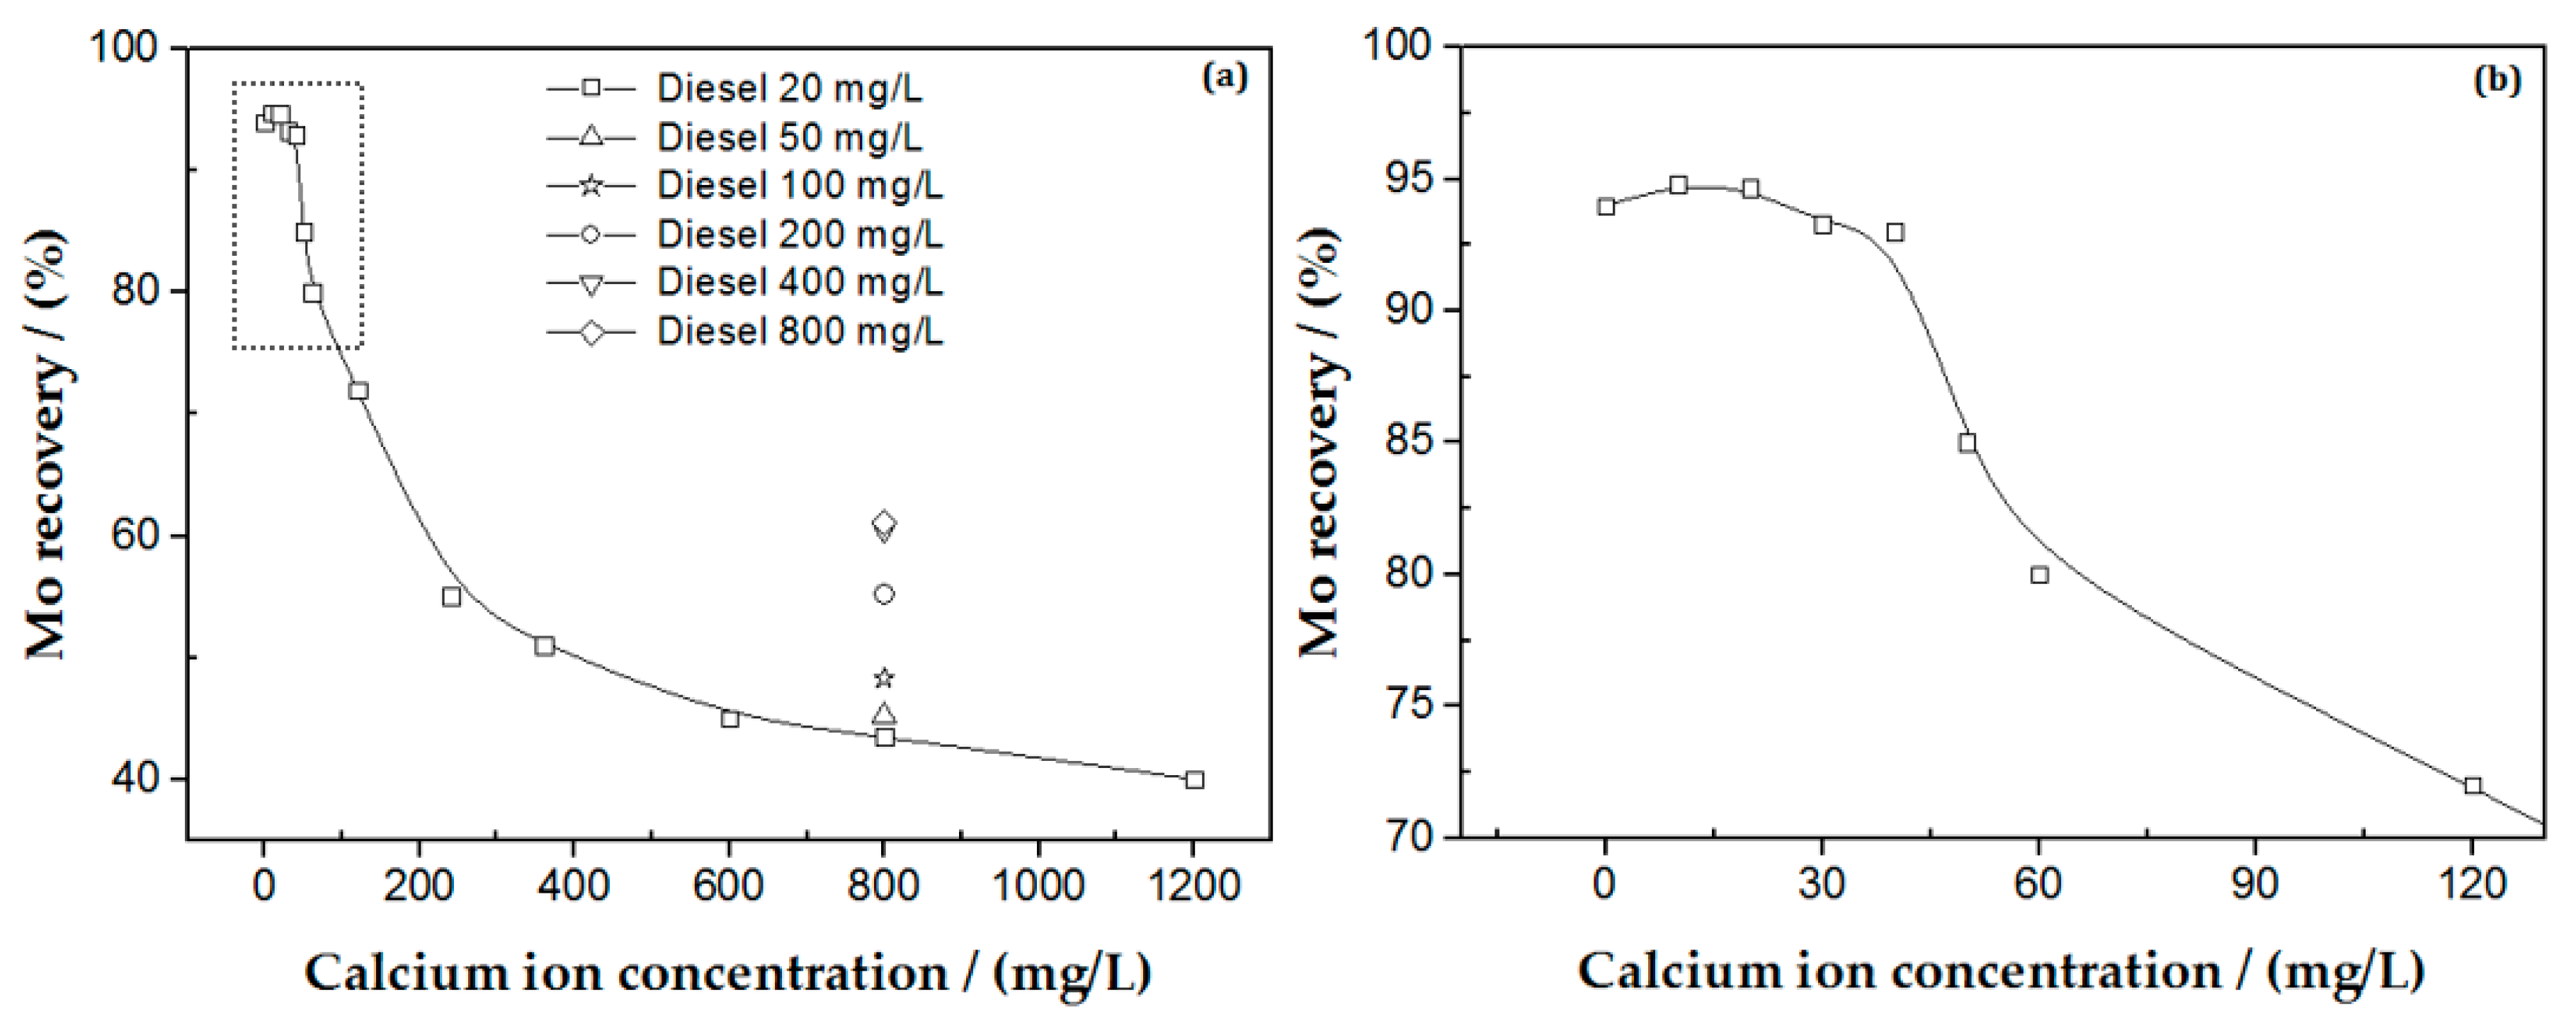
To further confirm the deleterious effect of Ca2+ on the flotation of fine molybdenite at pH 8, flotation of PM below −38 µm was conducted as a function of Ca2+ concentration and the results are shown in Figure 4.
At 20 mg/L diesel, molybdenum recovery remained high at about 94% when Ca2+ concentration was below 40 mg/L. Then, with Ca2+ concentration increasing, molybdenum recovery decreased significantly. At 600 mg/L, molybdenite recovery was about 45%. The decrease of molybdenite recovery slowed down when Ca2+ concentration was above 600 mg/L.
The single mineral flotation indicated in Figure 4 is consistent with the flotation results presented in Figure 3 in terms of a higher depression of Ca2+ on fine molybdenite flotation. It is clear that Ca2+ can depress molybdenite flotation especially from fine size fractions at pH 8 once Ca2+ concentration is high enough.
Figure 4a also shows that in the presence of 800 mg/L Ca2+, with increasing diesel concentration, the molybdenite recovery increased in PM flotation. At 400 mg/L diesel, molybdenite recovery was about 60%. Then, the increase of molybdenite recovery slowed down when diesel concentration was above 400 mg/L. This indicates that a high diesel concentration could mitigate the negative effect of Ca2+ on molybdenite flotation to some extent. Hirajima et al. [17] found that the recovery of fine molybdenite particles increased with increasing kerosene concentration in MgCl2 solution. Song et al. [20] also reported that the flocflotation of fine molybdenite particles increased with increasing kerosene concentration.
3.2. Zeta Potential Measurements
The zeta potential of molybdenite below 38 µmin the absence and presence of 20 mg/L diesel as a function of Ca2+ concentration was measured at pH 8. Results are shown in Figure 5.
Figure 5 indicates that the zeta potential of molybdenite was about −30 mV in the absence and presence of 20 mg/L diesel without the addition of Ca2+. Obviously, the adsorption of diesel on molybdenite had little effect on the zeta potential of molybdenite. It has been documented that molybdenite edges are hydrophilic and composed of Mo–S bonds, while molybdenite faces are hydrophobic and composed of S–S bonds [10,15,21]. Oily collectors such as kerosene, diesel oil, transformer oil, and solar oil only adsorb on molybdenite faces through hydrophobic interactions and van der Waals forces [11,21,22,23]. Apparently, the zeta potential in Figure 5 was mainly controlled by molybdenite edges on which diesel were not adsorbed. Given the fine size (−38 µm) of molybdenite particles in the zeta potential measurements, molybdenite edges are predominant over molybdenite faces.
Figure 5 also shows that the addition of Ca2+ increased the zeta potential of molybdenite and the zeta potential of molybdenite reversed from negative to positive at 200 mg/L Ca2+. This indicates the adsorption of Ca2+ on molybdenite. However, the addition of diesel did not affect the zeta potential of molybdenite in the presence of Ca2+. It seems that diesel did not cover the sites on which Ca2+ was adsorbed. Since diesel adsorbs on molybdenite faces, it is highly likely that Ca2+ adsorbs on molybdenite edges, which was further discussed in the subsequent study.
3.3. Scanning Electron Microscopy and Energy Dispersive X-ray Spectrometer (SEM-EDS) Analyses
Figure 6a,b show SEM images together with EDS of molybdenite faces and edges after being treated with 800 mg/L Ca2+ and 20 mg/L diesel at pH 8. It can be seen that the element composition was different on molybdenite faces and edges. In Figure 6a, only Mo, S, and O existed on molybdenite faces. This indicates that Ca2+ did not adsorb on molybdenite faces. However, Figure 6b clearly shows the presence of Ca besides Mo, S, and O on molybdenite edges. Clearly, Ca2+ did absorb on molybdenite edges.
Some studies reported heterogeneous molybdenite surfaces which are composed of micro-crystal bands with micro-faces and micro-edges [16,19].Although the micro-edges are on molybdenite faces, they behave similarly as molybdenite edges [19]. For this case, Ca2+ may adsorb on molybdenite faces through micro-edges. If the faces are heterogeneous with micro-edges, Ca should be detected on molybdenite faces. In this study, Ca was not detected on molybdenite faces suggesting the homogeneous surface without micro-edges. This is also supported by the SEM image.
3.4. The Phase Analysis of Molybdenum
The amount of CaMoO4 formed in the PM sample before and after conditioning in the absence and presence of 800 mg/L Ca2+ at pH 8 was determined by the phase analysis. The results are shown in Table 3. It is clear that the CaMoO4 did not form on PM before conditioning and after conditioning in the absence of Ca2+. However, after the sample was conditioned in the presence of 800 mg/L Ca2+, 1.25 mg CaMoO4 appeared on 1 g PM, which indicates that the interaction of Ca2+ with molybdenum edges formed this amount of CaMoO4. It was reported that the edge/face ratio of molybdenite was about 0.51~0.67 for −38 µm fraction, but increased to 1.02~1.34 once CaMoO4 precipitates formed on molybdenite edges [24]. In fact, the area of molybdenite edges is determined by the Mo–S bond length (0.154 nm) [25]. After oxidation, due to the formation of MoO42− on molybdenite edges, the area of molybdenite edges is determined by the Mo–O bond length (0.177 nm) [26]. After Ca2+ reacts with MoO42− to form CaMoO4 precipitates, the area of molybdenite edges is determined by the Ca–O bond length (0.246 nm) instead of the Mo–O bond length, because Ca2+ is at the outer most layers [26]. As a result, the formation of CaMoO4 precipitates on molybdenite edges increases the area of molybdenite edges but has little effect on the area of molybdenite faces and therefore increases the edge/face ratio of molybdenite. The results from this study together with the possibility of increasing molybdenite edge/face ratio by CaMoO4 suggest that this amount of CaMoO4 precipitates formed on molybdenite edges as shown in Table 3 is sufficient to depress molybdenite flotation. It is well known that a small coverage of hydrophilic species on a mineral surface can significantly depress the mineral flotation [27]. This study indicates that the formation of CaMoO4 on molybdenum edges prevented the adsorption of diesel leading to the depression of molybdenum floatability.
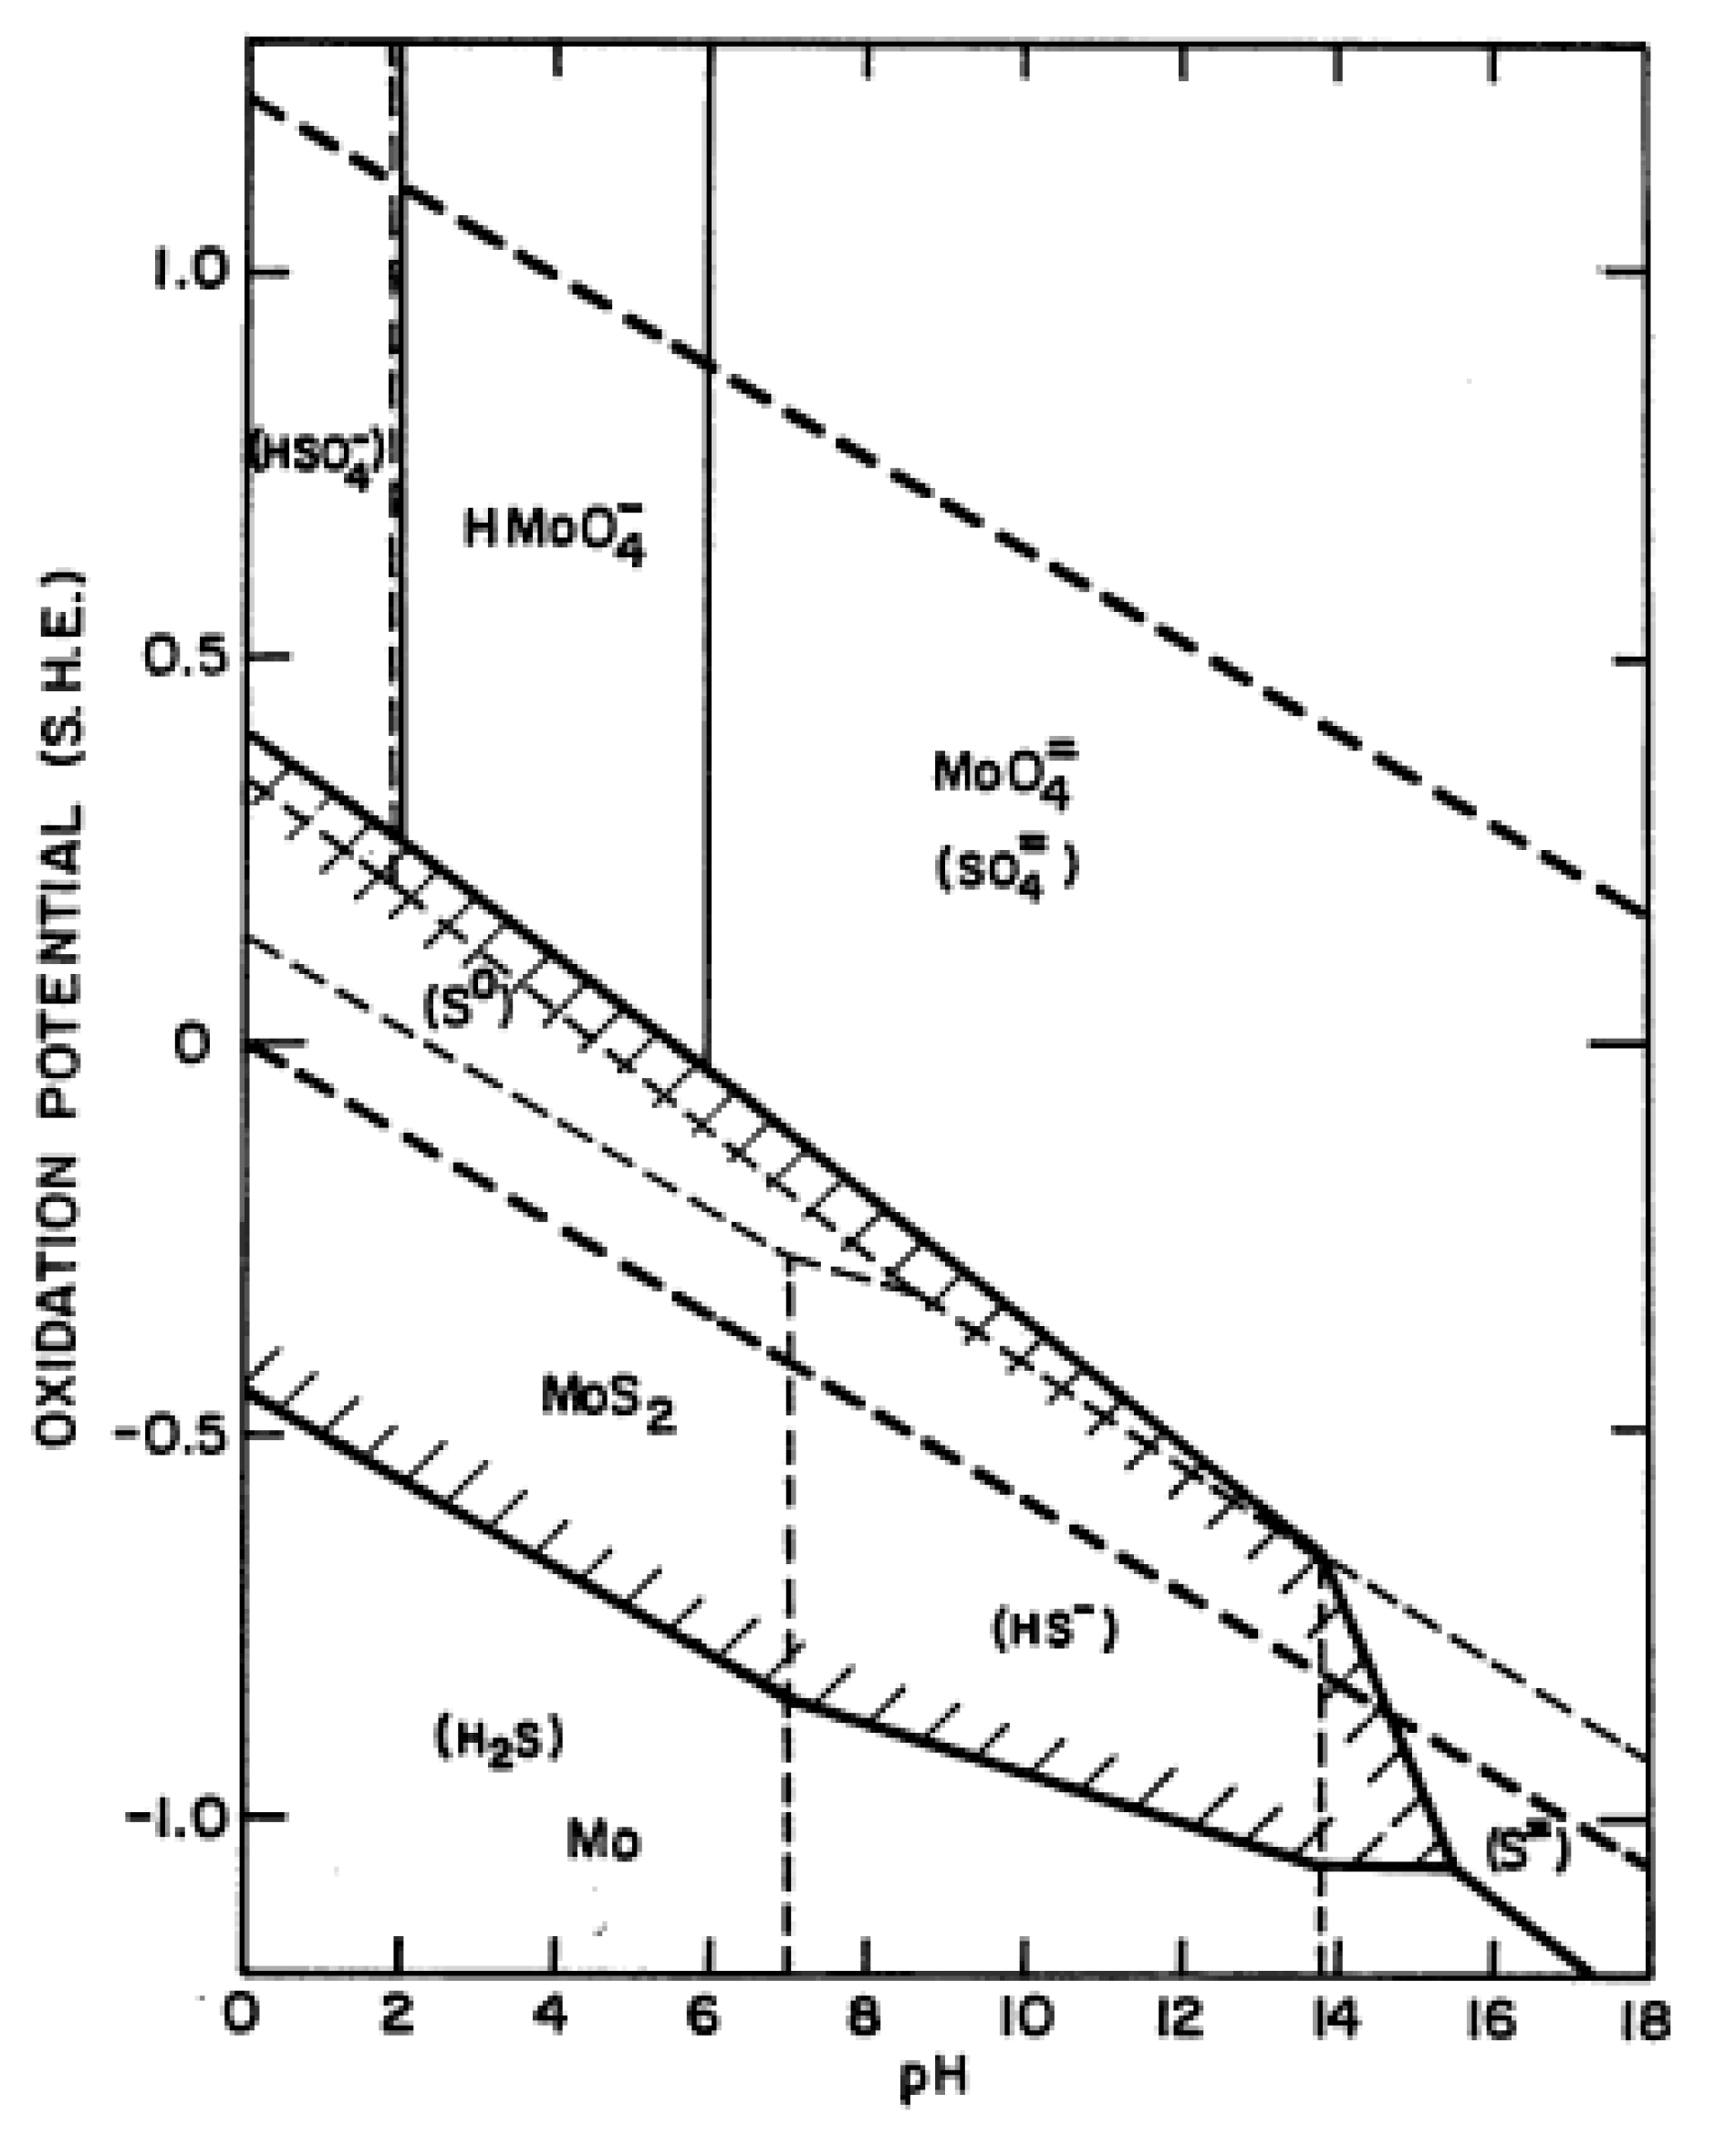
It has been documented that molybdenite edges are easily oxidized but molybdenite faces are difficult to be oxidized in water at room temperature [8,9]. Therefore, the oxidation product (MoO42− and HMoO4−) will preferentially occur on molybdenite edges and make molybdenite negatively charged, enhancing the adsorption of calcium ions by electrostatic interactions. The Eh-pH diagram of molybdenite [28] (Figure 7) shows that when the solution pH is above 2, MoS2 will be oxidized to form HMoO4−. HMoO4− can exist at pHs ranging from 2 to 6. Then, HMoO4− starts to translate into MoO42− at pH greater than 6 with the following reaction
In molybdenum flotation, the pH is generally over 7. Therefore, MoO42− will be the main oxidation product on molybdenite edges. Table 3 suggests that Ca2+ may react with MoO42− and form CaMoO4. In fact, the reaction between Ca2+ and MoO42− is a spontaneous process with the standard free energy of formation (ΔGf0) of CaMoO4 being −1405.19 ± 1.60 kJ∙mol−1 [29]. In addition, Raghavan and Hsu [9] reported the solubility of CaMoO4 which is 10−7.38 g/100 g water. The concentration of CaMoO4 presented in Table 3 is 3.12 × 10⁻³ g/100 g water far above the solubility of CaMoO4 (10−7.38 g/100 g), favoring the reaction between Ca2+ and MoO42− as
The combination of Equations (1)–(3) generates the following overall reaction which is responsible for the interaction of Ca2+ on molybdenite edges and its deleterious effect on fine molybdenite flotation [9,11]
Qiu et al. [30] reported that CaCO3 precipitated on molybdenite surfaces in the presence of 10.33 mMCa2+ and 2.33 m MHCO32− at pH above 9.5, inhibiting molybdenite flotation. While it is not clear whether CaCO3 could have a negative effect on molybdenite flotation in this study, it is clear that CaMoO4 had a deleterious effect.
4. Conclusions
A low concentration of Ca2+ in the water had little effect on molybdenite flotation with diesel as the collector at pH 8. However, a higher concentration of Ca2+ could depress molybdenite flotation even in the absence of fine gangue minerals. This depression was more pronounced on fine molybdenite particles. In this study, the deleterious effects of Ca2+ on molybdenite flotation resulted from the interaction between Ca2+ and molybdenite edges. The preferential oxidation of molybdenite edges produced MoO42− which made molybdenite edges negatively charged and attractive to Ca2+, leading to the formation of CaMoO4 precipitates responsible for depressing molybdenite flotation.
Acknowledgments
We gratefully acknowledge the financial support provided by the National Natural Science Foundation of China (Grant No. 51404185), National Natural Science Foundation of China (Grant No. 51674184), China Postdoctoral Science Foundation funded project(Grant No. 2016M592900XB), and Talent Fund of Xi’an University of Architecture and Technology (Grant No. RC1235).
Author Contributions
He Wan, Wei Yang, Tingshu He and Yongjun Peng conceived and designed the experiments; He Wan performed the experiments and analyzed the data; Jianbo Yang and Lin Guo contributed to reagents/materials preparation; Weicheng Cao and Yanying Liu contributed to the preparation of analysis tools.
Conflicts of Interest
The authors declare no conflict of interest.
References
- Ikumapayi, F.; Makitalo, M.; Johansson, B.; Rao, K.H. Recycling of process water in sulphide flotation: Effect of calcium and sulphate ions on flotation of galena. Miner. Eng. 2012, 39, 77–88. [Google Scholar] [CrossRef]
- Liu, W.Y.; Moran, C.J.; Vink, S. A review of the effect of water quality on flotation. Miner. Eng. 2013, 53, 90–100. [Google Scholar] [CrossRef]
- Ozkan, S.G.; Acar, A. Investigation of impact of water type on borate ore flotation. Water Res. 2004, 38, 1773–1778. [Google Scholar] [CrossRef] [PubMed]
- Sinche-Gonzalez, M.; Fornasiero, D.; Zanin, M. Flotation of Chalcopyrite and Molybdenite in the Presence of Organics in Water. Minerals 2016, 6, 105. [Google Scholar] [CrossRef]
- Muzenda, E. An investigation into the effect of water quality on flotation performance. Proc. World Acad. Sci. Eng. Technol. 2010, 69, 237–241. [Google Scholar]
- Levay, G.; Smart, R.S.C.; Skinner, W.M. The impact of water quality on flotation performance. J. S. Afr. Inst. Min. Metall. 2001, 101, 69–75. [Google Scholar]
- Chen, J.M.; Liu, R.Q.; Sun, W.; Qiu, G.Z. Effect of mineral processing wastewater on flotation of sulfide mineral. Trans. Nonferr. Met. Soc. China 2009, 19, 454–457. [Google Scholar] [CrossRef]
- Chander, S.; Fuerstenau, D.W. On the natural floatability of molybdenite. Trans. Am. Inst. Min. Metall. Eng. 1972, 252, 62–69. [Google Scholar]
- Raghavan, S.; Hsu, L.L. Factors affecting the flotation recovery of molybdenite from porphyry copper ores. Int. J. Miner. Process. 1984, 12, 145–162. [Google Scholar] [CrossRef]
- Zanin, M.; Ametov, I.; Grano, S.; Zhou, L.; Skinner, W. A study of mechanisms affecting molybdenite recovery in a bulk copper/molybdenum flotation circuit. Int. J. Miner. Process. 2009, 93, 256–266. [Google Scholar] [CrossRef]
- Zhou, L. Molybdenite Flotation. Master’s Thesis, Ian Wark Research Institute and University of South Australia, Mawson Lakes, Australia, May 2010; p. 14. [Google Scholar]
- Nagaraj, D.R.; Farinato, R. Chemical factor effects in saline and hypersaline waters in the flotation of Cu and Cu-Mo ores. In Proceedings of the XXVII International Mineral Processing Congress, Santiago, Chile, 20–24 October 2014. [Google Scholar]
- Triffett, B.; Bradshaw, D. The role of morphology and host rock lithology on the flotation behaviour of molybdenite at Kennecott Utah Copper. In Proceedings of the 9th International Congress for Applied Mineralogy: ICAM 2008, Brisbane, Australia, 8–10 September 2008; pp. 465–473. [Google Scholar]
- Triffett, B.; Veloo, C.; Adair, B.J.I.; Bradshaw, D. An investigation of the factors affecting the recovery of molybdenite in the Kennecott Utah copper bulk flotation circuit. Miner. Eng. 2008, 21, 832–840. [Google Scholar] [CrossRef]
- Castro, S.; Lopez-Valdivieso, A.; Laskowski, J.S. Review of the flotation of molybdenite. Part I: Surface properties and floatability. Int. J. Miner. Process. 2016, 148, 48–58. [Google Scholar] [CrossRef]
- Lucay, F.; Cisternas, L.A.; Gálvez, E.D.; López-Valdivieso, A. Study of the natural floatability of molybdenite fines in saline solutions and effect of gypsum precipitation. Metall. Process. 2015, 32, 203–208. [Google Scholar]
- Hirajim, T.; Suyantar, G.P.W.; Ichikaw, O.; Elmahdy, A.M.; Miki, H.; Sasaki, K. Effect of Mg2+ and Ca2+ as divalent seawater cations on the floatability of molybdenite and chalcopyrite. Miner. Eng. 2016, 96–97, 83–93. [Google Scholar] [CrossRef]
- Li, C.Q.; Xue, J. Phase analysis of molybdenum ores and determination of molybdenum by catalytic polarography. Part B Chem. Anal. 2012, 48, 420–422. (In Chinese) [Google Scholar]
- Zheng, M.Q.; Yu, S.X.; Cheng, X.H. A rapid phase analysis method for molybdenum ores. Rock Miner. Anal. 2011, 30, 40–42. (In Chinese) [Google Scholar]
- Song, S.; Zhang, X.; Yang, B.; Lopez-Mendoza, A. Flotation of molybdenite fines as hydrophobic agglomerates. Sep. Purif. Technol. 2012, 98, 451–455. [Google Scholar] [CrossRef]
- Ornelas Tabares, J.; Madrid Ortega, I.; Reyes Bahena, J.L.; Sánchez López, A.A.; Valdez Pérez, D.; LópezValdivieso, A. Surface properties and floatability of molybdenite. In Proceedings of the 2006 China-Mexico Workshop on Minerals Particle Technology, San Luis Potosí, Mexico, 5–7 December 2006; pp. 115–124. [Google Scholar]
- Hoover, R.; Malhotra, D. Emulsion flotation of molybdenite. In Flotation; Gaudin Memorial, A.M., Ed.; American Institute of Mining, Metallurgical, and Petroleum Engineers: New York, NY, USA, 1976; Volume 1, pp. 485–503. [Google Scholar]
- Smit, F.J.; Bhasin, A.K. Relationship of petroleum hydrocarbon characteristics and molybdenite flotation. Int. J. Miner. Process. 1985, 15, 19–40. [Google Scholar] [CrossRef]
- Lv, J.Y.; Shen, Y.P.; Zhang, H.E. Surface properties of molybdenite and its floatability. Nonferr. Met. Miner. Process. Sect. 1992, 41, 4–8. (In Chinese) [Google Scholar]
- Lin, C.Y. Molybdenum Ore Dressing and Further Processing, 1st ed.; Metallurgy Industry Press: Beijing, China, 1996; pp. 52–53. (In Chinese) [Google Scholar]
- Pu, C.Y.; Liu, T.Y.; Zhang, Q.R. Electronic structure of CaMoO4 crystal with point defects. J. Univ. Shanghai Sci. Technol. 2008, 30, 112–115. (In Chinese) [Google Scholar]
- Gontijo, C.D.F.; Fornasiero, D.; Ralston, J. The Limits of Fine and Coarse Particle Flotation. Can. J. Chem. Eng. 2007, 85, 739–747. [Google Scholar] [CrossRef]
- Krishnaswamy, P. Kinetics of the Aqueous Oxidation of Molybdenite and the Role of Crystal Anisotropy on the Electrochemical Mechanisms of the Process. Ph.D. Thesis, University of California, Berkeley, CA, USA, 1981; p. 101. [Google Scholar]
- Essington, M.E. Formation of calcium and magnesium molybdate complexes in dilute aqueous solutions. Soil Sci. Soc. Am. 1992, 56, 1124–1127. [Google Scholar] [CrossRef]
- Qiu, Z.H.; Liu, G.Y.; Liu, Q.X.; Zhong, H. Understanding the roles of high salinity in inhibiting the molybdenite flotation. Colloids Surf. A Physicochem. Eng. Asp. 2016, 509, 123–129. [Google Scholar] [CrossRef]
Figure 1.
X-ray diffraction (XRD) analysis of the enriched molybdenite sample.

Figure 2.
The influence of Ca2+ concentration on AM flotation at pH 8.

Figure 3.
Molybdenite recovery in AM flotation from different size fractions in the absence and presence of 800 mg/L Ca2+ at pH 8.
Figure 3.
Molybdenite recovery in AM flotation from different size fractions in the absence and presence of 800 mg/L Ca2+ at pH 8.

Figure 4.
The influence of Ca2+ concentration on PM flotation at pH 8: (a) the original curve, (b) the enlargement of the dashed square in the original curve.
Figure 4.
The influence of Ca2+ concentration on PM flotation at pH 8: (a) the original curve, (b) the enlargement of the dashed square in the original curve.

Figure 5.
The zeta potential of molybdenite below 38 µm as a function of Ca2+ concentration in the absence and presence of 20 mg/L diesel at pH 8.
Figure 5.
The zeta potential of molybdenite below 38 µm as a function of Ca2+ concentration in the absence and presence of 20 mg/L diesel at pH 8.
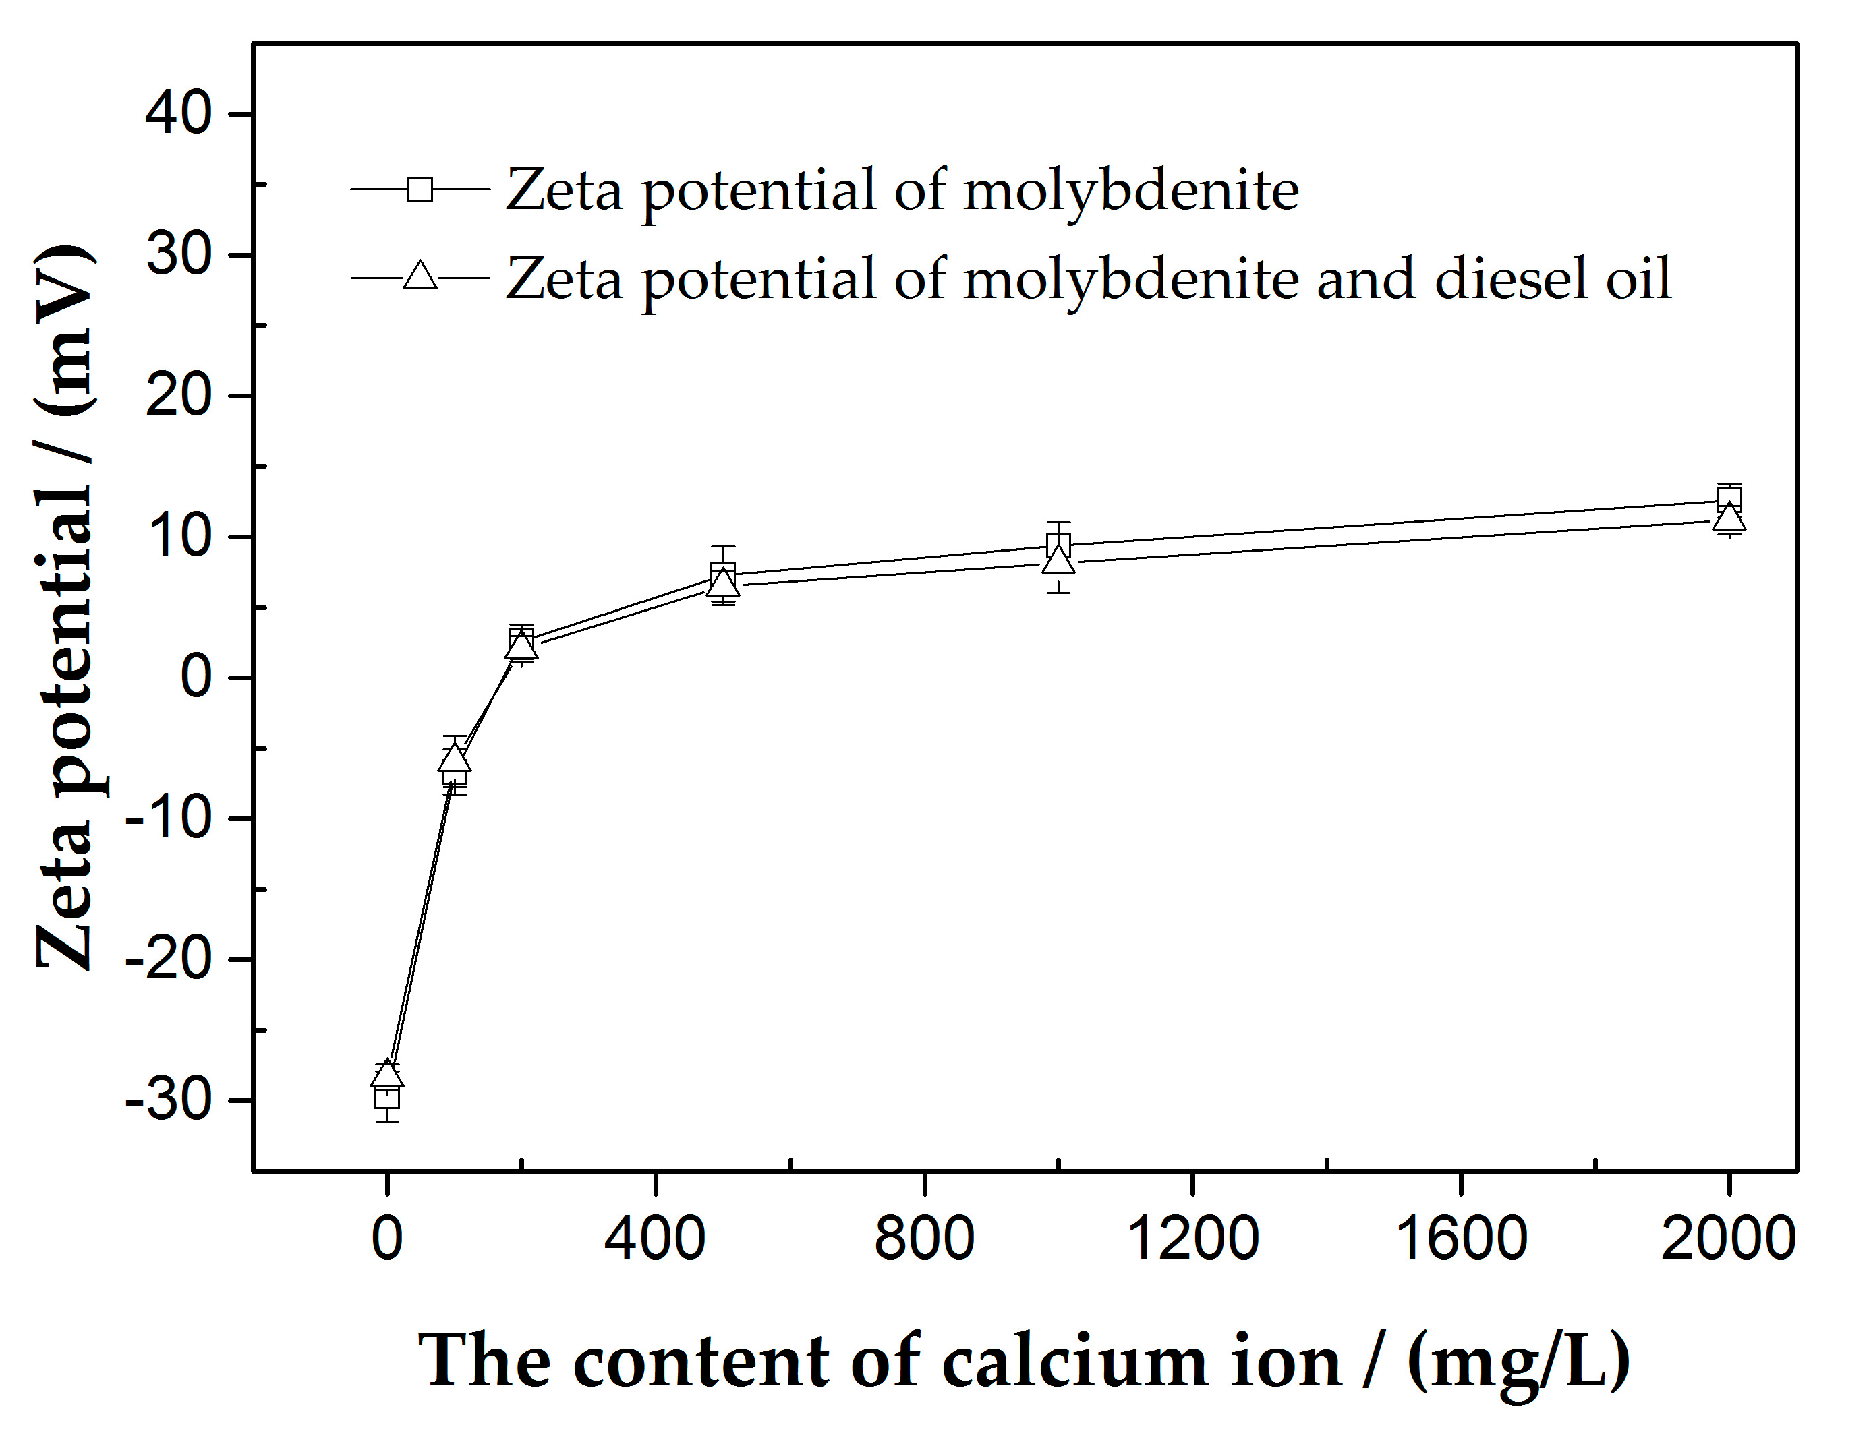
Figure 6.
SEM images and EDS analyses of molybdenite faces and edges after treated with 800 mg/L Ca2+ and 20 mg/L diesel at pH 8: (a) SEM images and EDS analyses of molybdenite faces; (b) SEM images and EDS analyses of molybdenite edges.
Figure 6.
SEM images and EDS analyses of molybdenite faces and edges after treated with 800 mg/L Ca2+ and 20 mg/L diesel at pH 8: (a) SEM images and EDS analyses of molybdenite faces; (b) SEM images and EDS analyses of molybdenite edges.
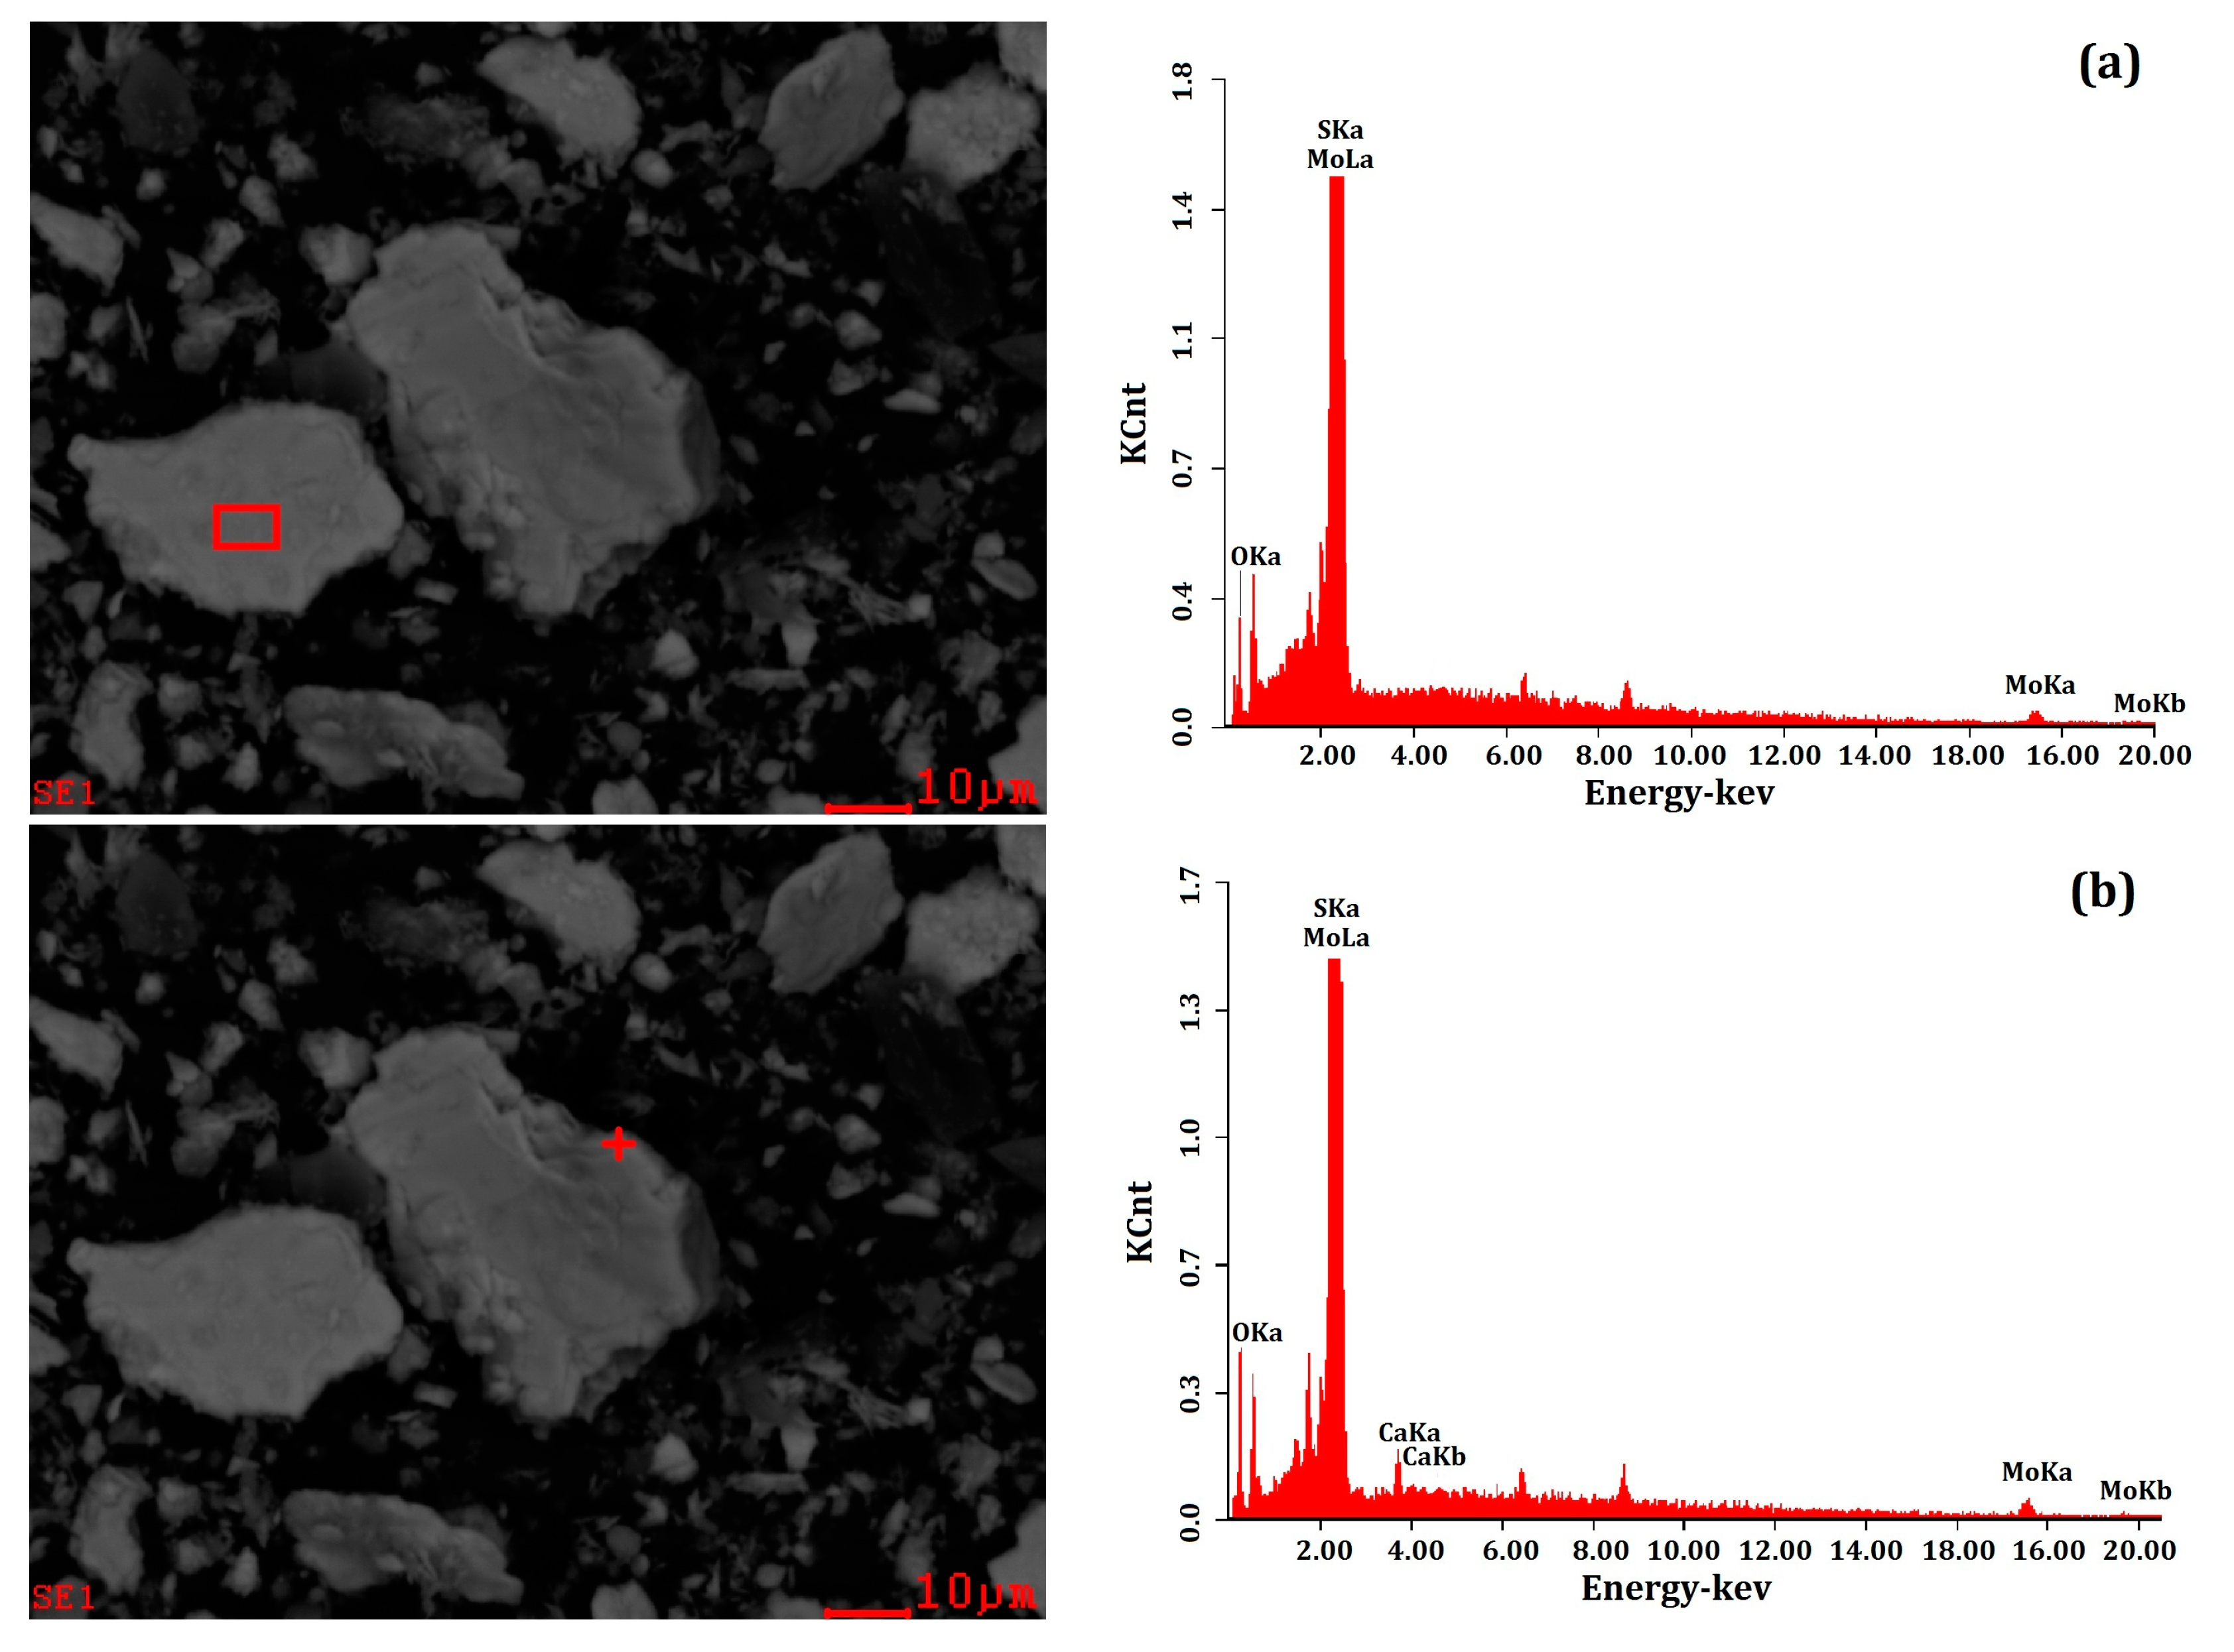
Figure 7.
The Eh-pH diagram of molybdenite [25].
Figure 7.
The Eh-pH diagram of molybdenite [25].

Table 1.
The elemental composition of the actual Mo ore (wt %).
| Compositions | Mo | WO3 | Cu | Pb | Zn | S | CaO |
| Content | 0.12 | 0.07 | 0.007 | 0.005 | 0.016 | 1.81 | 21.98 |
| Compositions | Al2O3 | SiO2 | MgO | Na2O | K2O | TFe 1 | |
| Content | 7.89 | 48.50 | 2.86 | 1.08 | 0.82 | 10.12 |
1 TFe means the total concentration of Fe in metallic and non-metallic minerals.
Table 2.
The mineralogical composition of the actual Mo ore (wt %).
| Compositions | Molybdenite | Powethite | Scheelite | Chalcopyrite |
| Content | 0.19 | trace | 0.09 | 0.02 |
| Compositions | Sphalerite | Galena | Pyrite | Magnetite |
| Content | 0.24 | trace | 1.10 | 1.00 |
| Compositions | Garnet | Diopside | Wollastonite | Quartz |
| Content | 25.70 | 18.70 | 16.30 | 14.60 |
| Compositions | Biotite | Feldspar | Calcite | Loss |
| Content | 10.10 | 9.10 | 2.00 | 0.85 |
Table 3.
The amount of CaMoO4 formed in the PM sample before and after conditioning in the absence and presence of 800 mg/L Ca2+ at pH 8.
Table 3.
The amount of CaMoO4 formed in the PM sample before and after conditioning in the absence and presence of 800 mg/L Ca2+ at pH 8.
| Title | Before Reacting | After Reacting | |
|---|---|---|---|
| Concentration of calcium in pulp (mg/L) | - | 0 | 800 |
| CaMoO4/MoS2(mg/g) | 0.00 | 0.00 | 1.25 |
© 2017 by the authors. Licensee MDPI, Basel, Switzerland. This article is an open access article distributed under the terms and conditions of the Creative Commons Attribution (CC BY) license (http://creativecommons.org/licenses/by/4.0/).
Share and Cite
MDPI and ACS Style
Wan, H.; Yang, W.; Cao, W.; He, T.; Liu, Y.; Yang, J.; Guo, L.; Peng, Y. The Interaction between Ca2+ and Molybdenite Edges and Its Effect on Molybdenum Flotation. Minerals 2017, 7, 141. https://doi.org/10.3390/min7080141
AMA Style
Wan H, Yang W, Cao W, He T, Liu Y, Yang J, Guo L, Peng Y. The Interaction between Ca2+ and Molybdenite Edges and Its Effect on Molybdenum Flotation. Minerals. 2017; 7(8):141. https://doi.org/10.3390/min7080141
Chicago/Turabian StyleWan, He, Wei Yang, Weicheng Cao, Tingshu He, Yanying Liu, Jianbo Yang, Lin Guo, and Yongjun Peng. 2017. "The Interaction between Ca2+ and Molybdenite Edges and Its Effect on Molybdenum Flotation" Minerals 7, no. 8: 141. https://doi.org/10.3390/min7080141
Note that from the first issue of 2016, this journal uses article numbers instead of page numbers. See further details here.