Contrasting Surficial Composition of Native Gold from Two Different Types of Gold Ore Deposits
by
 , , and
Vladimir L. Tauson
1,*, 
Raisa G. Kravtsova
1,
Artem S. Makshakov
1,
Sergey V. Lipko
1 and
and
Kirill Yu. Arsent’ev
2 1
A.P. Vinogradov Institute of Geochemistry, Siberian Branch of Russian Academy of Sciences, Irkutsk 664033, Russia
2
Limnological Institute, Siberian Branch of Russian Academy of Sciences, Irkutsk 664033, Russia
*
Author to whom correspondence should be addressed.
Minerals 2017, 7(8), 142; https://doi.org/10.3390/min7080142
Submission received: 5 June 2017
/
Revised: 7 August 2017
/
Accepted: 7 August 2017
/
Published: 10 August 2017
(This article belongs to the Special Issue Geochemistry and Mineralogy of Hydrothermal Metallic Mineral Deposits)
Abstract
:Native gold grains sampled at two different gold ore deposits in Eastern Russia have been studied by the techniques of electron spectroscopy (X-ray photoelectron spectroscopy (XPS) and Auger electron spectroscopy (AES)), electron microprobe analysis (EMPA), and scanning electron microscopy with energy dispersive X-ray spectrometry (SEM-EDX). The high-fineness gold of the deposit hosted by relatively high temperature gold-quartz-sulfide mesothermal ore formation contains no oxidized Au constituents on grain surfaces, whereas the less fine gold of the epithermal Au-Ag deposit contains gold oxidized to the Au (I) state, or higher, in half of the cases. At this deposit the surface of native Au consists of a thin layer (~15 nm) with elevated Ag and S contents and an underlying SiO2–containing layer ~30–60 nm thick. Such a composite coating can perform a protective function and prevent the gold-silver sulfides in surficial parts of AuAg grains from oxidation. The sulfur-enriched marginal parts of native gold particles do not always correlate with the stoichiometry of well-known binary AuAg-sulfides and have a variable composition. This may be due to the existence of solid solutions, Ag2−xAuxS, if there is enough S or S adsorption-stabilized cluster agglomerates, AgnAumS, under sulfur deficit. The effect of the formation of nano-scale surficial zonality on the surface of native gold is quite common in nature and applicable to geological exploration and technology of gold-ore processing. It can facilitate establishing the geochemical environment and genetic type of Au mineralization.
Keywords:
native gold; surface; chemical composition; electrum; sulfidation; oxidation; XPS; AES; SEM-EDX; EMPA1. Introduction
The problem of gold and its alloys’ corrosion is of interest in several aspects. In terms of genetic mineralogy, the composition of the surface of nugget gold might be indicative of the processes it went through and of their conditions. In terms of raw ore processing technology, it is important to know the chemical composition of the gold grain surface to select the most efficient flotation agent [1]. The presence of sulfur compounds on the surface of gold particles makes them less amenable to flotation, thus affecting ore concentration indices [2]. Gold parts used in electronic microcircuits might be subject to surface changes entailing far-reaching consequences for their quality. The activity of catalysts containing Au and its alloys with other metals depends heavily on the surface condition [3]. It should be noted that the role of sulfur interaction with gold’s surface or its nanoparticles is of a dual nature. On the one hand, sulfur acts as a poisoning agent for some heterogeneous reactions in the technologically-important processes [4]; on the other hand, thanks to strong bonds with the Au surface, sulfur generates ordered monolayers with extraordinary physical and chemical properties [4,5]. Finally, in jewelry and museum management (in particular, numismatics), the corrosion resistance of Au’s surface deserves close attention in terms of optimizing the storage conditions of artifacts [6].
The study of the characteristics of the chemical composition of the surface of native gold became possible due to the introduction in geological-mineralogical field work of surface-sensitive techniques, primarily those of X-ray photoelectron spectroscopy (XPS) and Auger electron spectroscopy (AES). These methods demonstrated [1,7] that the surface of lode gold particles is enriched in silver several times as compared to their volume; the silver-enriched layer is 20–40 nm thick. The surface layer of gold grains from oxidation zones of different deposits is enriched in silver to a lesser extent. The surface of placer gold, on the contrary, is depleted in silver. No data on the elemental composition of the surface (except Au and Ag) and the chemical state of Au, were presented in these publications [1,7]. Later studies using AES and secondary ion mass spectrometry (SIMS) methods confirmed enrichment of surface layers of lode gold in silver and that of placer gold—in gold [2]. The surface films with the thickness of first dozens of nanometers were shown to be enriched in carbon, sulfur, chlorine, and oxygen up to the level of the first dozens of atomic percent and to contain trace elements of Li, B, N, F, Na, K, Ca, Mg, Al, and Si, at the level of tenths of an atomic percent. The chemical state of gold in the surface layer was not established in this work [2].
A very thin layer of hypothetical gold (III) oxide was found on the surface of placer gold samples [8]. It was later shown that, unlike an insular layer with the thickness not exceeding 20 nm on placer gold, the oxide layer on the surface of lode gold from sulfide-magnetite ore has a significant thickness (at least 350 nm) and forms a continuous coating [9]. The chemical state of Au on the surface was not reliably established in these works either [8,9].
At a number of gold and gold-silver deposits of various formation types, gold grains demonstrated subtle rims consisting of silver and gold sulfides—uytenbogaardtite (Ag3AuS2), petrovskaite (AgAuS), their conglomerates, as well as a mixture of uytenbogaardtite with acanthite (Ag2S). The rims were about 20 µm thick, their individual phases, 3–5 µm thick [10]. This suggested the presence of native gold sulfidation phenomenon. However, the nature of gold-silver sulfides, in case of their occurrence in oxidation zones along with hypergene oxides, oxihydroxides and sulfates [11], is not quite clear. The above-mentioned work presents compositions of uytenbogaardtite with (Ag + Au)/S atomic ratios varying from 1.29 to 2.59 and Ag/Au atomic ratios from 1.88 to 9.63 for two gold ore deposits in Eastern Yakutia (Russia). According to the phase diagram of the silver-rich part of the Ag2S-Au2S system [12,13], the Ag3AuS2 phase has virtually no homogeneity field. Therefore, these variations of composition can imply either the existence of phase mixtures (β-Ag2S + Ag3AuS2, AgAuS + Ag3AuS2), or the existence of solid solutions of Ag and Au sulfides which, for some reason, did not undergo transformation below eutectoid point (113 °C), although high transformation rates in the Ag-Au-S system were reported [12]. Wide variations of Ag- and Au-sulfide compositions were observed at many deposits (mainly epithermal ones), which are generally confined to the oxidation zones of gold-silver epithermal deposits and are associated with hypergene minerals, such as goethite and limonite [14].
The nature of gold-copper oxisulfides found in copper deposits of the Greywacke Zone, Austria in the Eastern Alps is obscure [15]. Two types of oxisulfides were discovered. The first type refers to primary hydrothermal ores and is present in the form of inclusions in gold and in microfractures within tetrahedrite. The second type of oxisulfides is formed during weathering of tetrahedrite-rich ores and associates with cuprite, malachite, and limonite. Unfortunately, this work does not provide the chemical formula of oxisulfides; oxygen contents were assessed indirectly, and no reliable data on chemical and phase forms of gold in oxisulfides are presented. However, analysis of the data shown in [15] (Table 3, p. 92) shows that, in a number of samples, the atomic ratio (Au + Cu + Ag)/S is close to either two or one, which may indicate the existence of copper and gold phases, similar to the above-mentioned binary sulfides of silver and gold.
Thus, the silver concentrations in the surface layers of gold can be either significantly above or significantly below the volume ones [1,7], depending on the genesis of the native gold. The surface may contain oxide or sulfide compounds, the scale of which may differ greatly from the first nanometers to tens of microns. The chemical state (valence, types of chemical bonds) of Au in these compounds is virtually unexplored; the stabilization mechanism of thin sulfide rims on the surface of gold grains and oxisulfide gold phases in oxidizing conditions is not clear. The above determines the geochemical perspective of the problem addressed in the present work—the peculiarities of chemical and phase composition of native gold surface layers.
2. Sample Location and Description
2.1. Geological Setting
The characteristics of chemical and phase composition of the native gold surface layers were studied on gold grains selected from the samples of ores of two deposits located in the territory of Russia and differing in formation conditions—Kvartsevaya Sopka (Northern Okhotsk Sea Region, Magadan Oblast) and Amurskie Daiki (Eastern Trans-Baikal Region, Zabaykalsky Krai) (Figure 1).
The choice of the deposits was made for two reasons: first, these objects are contrasted in genetic and geochemical characteristics; and, second, their gold grains are characterized by high quality and amenability to clean hand-picking without reagents that might modify the composition of the surface.
The Kvartsevaya Sopka deposit is classed as a near-surface epithermal low sulfidation gold-silver, typical of volcanic belts [16]. Structurally, the deposit is located in the central part of the Okhotsk-Chukotski volcanogenic belt, a major Cretaceous volcano-tectonic structure of superimposed type, formed within a short period of time (Middle Albian–Lower Cenomanian) [17].
The gold-silver (Au-Ag) deposit Kvartsevaya Sopka was formed in late Cretaceous and corresponds to the low-sulfidation epithermal style of deposit. The ore bodies are embedded among hydrothermally altered volcanic rocks—dacites, tuffs, and ignimbrites. The host rocks of the deposits are affected by hydrothermal alteration of the adularia-sericite type, and the main minerals in the veins are quartz and adularia. The Ar/Ar dating of adularia returned ages of 80.5 ± 0.2 Ma [18].
The basic mineral composition of ores is as follows: quartz (up to 90–95% modal), adularia (5–10% modal, sometimes up to 50%), sericite, hydromica, carbonate, kaolinite (1–10% modal), and ore minerals (1–3% modal). Pyrite is the most frequent ore mineral. It accounts for up to 95% of the ore mineralization. The main ore minerals are acanthite and native gold, represented mostly by electrum. Grains varying from micrometer (2–10 µm) to small size (10–100 μm) are predominant. Visible gold particles larger than 100 μm (0.1–1 mm) are rare. Other ore minerals are represented by silver sulphosalts (proustite, pyrargyrite). Native silver, naumannite, stephanite, polybasite, and stromeyerite are infrequent, and galena, sphalerite, chalcopyrite, miargyrite, pearceite, and members of the tetrahedrite group are even rarer.
According to the study of the fluid inclusions, formation of Au-Ag ores took place at a temperature of 355–205 °C and a pressure of 170–20 bar. The ores formed from fluids of low concentration, 3.9–0.4 wt % NaCl eq., belonging to the water-salt system MgCl2 + NaCl + KCl + H2O with predominance of NaCl. Their composition considerably differs from that of fluids of magmatic and postmagmatic origin. This can be explained by the increased influence of the meteoric water, diluting magmatogenic fluids to various extents, on the processes of Au and Ag ore concentration in the subsurface conditions [19].
The Amurskie Daiki deposit is classed by most researchers as typical for orogene zones mesothermal gold-sulfide-quartz (Au-Sulf-Q) ore formation [20]. Structurally, the area of the deposit is a part of the Kara ore field and is located at the intersection of the structures with sub-latitudinal spread and the structures of the north-eastern and north-western directions, hosting gold ore mineralization [21].
The geological structure of the area is largely constituted by early Proterozoic granodiorites, granites, quartz diorites, and gabbro-diorites. All of these igneous rocks are, in turn, cross-cut by late Jurassic dyke bodies of hybrid porphyries, lamprophyres, sub-alkaline granite-porphyries, and grorudites. The gold ore mineralization with the highest grade of Au-Sulf-Q at the Amurskie Daiki deposit is associated with intensely altered dykes of hybrid porphyries and quartz diorites.
Ore mineralization in hybrid porphyries consists of veins filled by quartz or quartz-actinolite, with low-grade sulfide mineralization and large plates of native gold. However, veins in fractured quartz-diorites are infilled by quartz and orthoclase and contain visible gold in the highest altered host-rocks, which are replaced by assemblages of chlorite-carbonate-albite-pyrite. Mineralization is of the late Jurassic age [20].
The modal composition of the veinlets associated with hybrid porphyries is as follows: quartz (90–99%), actinolite (1–10%), epidote and chlorite (1–2%), and ore minerals (1–3%). Pyrite is the most frequent ore mineral. It accounts for up to 80% of 99% of ore mineralization. Magnetite is often present (1–10%), whereas chalcopyrite, bismuthite and galenobismuthite are less frequent (0.5–1%). The coarse primary native gold ranging in size from 0.1–0.2 mm up to 1–2 mm and more prevails.
The modal composition of veinlets associated with quartz diorites is more diverse. Quartz (80–90%) and orthoclase (10–20%) are predominant; albite and sericite are frequent, while biotite, chlorite, and carbonate are rarer (5–6%). Ore minerals are largely represented by pyrite (80–95% of the ore minerals); chalcopyrite and galena are frequent (1–10% of the ore minerals); the rest of the ores (1–2%) is composed by galenobismutite, sphalerite, pyrrhotite, and magnetite. The native gold grains with the size varying from 0.05 to 1 mm prevail.
According to the study of the fluid inclusions, formation of gold mineralization at Amurskie Daiki proceeded in several stages over a wide range of temperature (520–110 °C) and pressure (1300–270 bar), with salt concentration in ore-forming fluid of 56–1.2 wt % NaCl eq. [20,22]. The gold mineralization associated with hybrid porphyries and quartz diorites took place at the initial stages of the process, in the temperature range of 520–315 °C, from highly-concentrated brines, whose composition was close to that of fluids of magmatic and postmagmatic origin.
2.2. Sample Description
A brief description of native gold and ore samples, from which gold grains were selected to study the characteristics of the chemical and phase compositions of the surface layers, is presented in Table 1.
The gold crystals at the Au-Ag Kvartsevaya Sopka deposit were selected from the quartz-adularia veins. There were selected grains with size varying from 0.1 to 1 mm, having clearly distinguishable boundaries; they were quite easily detachable from the vein material. The native gold, which is typical of this ore type, normally contains quite a lot of silver, with electrum of ~600‰ to ~700‰ fineness prevailing; electrum of lower fineness (<600‰) is less common.
The gold crystals at the Amurskie Daiki Au deposit were selected from quartz and quartz-actinolite veinlets from propylitized and pyritized hybrid porphyries (V-62/3) with visible gold and from quartz and orthoclase-quartz veinlets in pyritized and silicified metasomatites of chlorite-carbonate-albite composition, developed along cataclastic diorite, also with visible gold (KP-52). Aggregates of euhedral crystals of native gold from the first case have 0.1–0.4 mm in size, those from the second case range 0.5–3 mm. In both cases, gold is high-fineness (955–997‰), with silver content not exceeding 1–5 wt %.
3. Methods
The samples of native gold were studied by surface electron spectroscopy (XPS and AES); electron microprobe analysis (EMPA), and scanning electron microscopy with energy-dispersive spectrometry (SEM-EDX). Although EMPA with wave-dispersive spectrometers (WDS) allowed quantitative analysis, it is unable to give reliable information in the range of very thin grain rims enriched in sulfur.
3.1. X-ray Photoelectron Spectroscopy and Auger Electron Spectroscopy
The surface was analyzed on the LAS-3000 spectrometer manufactured by Riber (Riber, Bezons, France). Atoms of sample surface were excited by aluminum anode non-monochromatized radiation (Al Kα = 1486.6 eV) emitted by an electron beam accelerated at 10 kV with a current of 20 mA. Vacuum pressure in the analysis chamber typically was 6.7 × 10⁻¹⁰ mbar. The spectrometer was equipped with an OPX-150 hemisphere detector and an Auger electron analyzer of the cylindrical mirror type OPC-200.
The carbon line C 1s with binding energy for hydrocarbons (contaminants) of 285.0 eV was used as an internal standard to assess electrostatic charge. Survey and narrow-range XPS spectra were recorded in increments of 0.5 and 0.05 eV, respectively. The narrow scans were fitted using the commercial CasaXPS software, the spectrometer being equipped with, after the non-linear background subtraction following Shirley and peak profile approximation with a symmetrical Gauss-Lorentz function. The Lorentz contribution of 0.3 was determined as optimal in all cases. For a more detailed study of the distribution of elements we used ion etching with Ar+ at a rate of ~6 nm/min for a period of up to 10 min. The chemical composition was determined from XPS broad scans before and after argon ion sputtering under the following conditions: energy 2 keV, emission current 20 mA. The peak areas were used with the relative sensitivity factor of each line considered. Quantitative data on chemical forms of gold were acquired by the narrow scan processing with the reference sample of pure gold (999.9‰ fineness) with respect to which we determined the shift of the Au 4f doublet and half-widths of its components. The parameters BE (binding energy) and FWHM (full width at half maximum of peak height) were obtained.
The chemical composition of the uppermost layer was determined from Auger spectra were recorded in the differential form (dN (E)/dE). The escape depth of Auger electrons is typically 0.5–1 nm, so the information proceeds from surficial 2–3 monoatomic layers. The Auger electron spectra were recorded at the primary beam energy of 2.5 eV and modulation voltage of 2.3 V. Spectra were calibrated using the carbon KLL peak at 272 eV kinetic energy.
Any chemical or mechanical treatment can change the surface composition and chemical state of elements; that is why only short-term Ar+ milling was applied for the elimination of contaminants.
3.2. Electron Microprobe Analysis
Both EMPA and SEM-EDX studies were performed on the same polished section with native gold particles embedded in epoxy resin. EMPA was applied mainly to central parts of gold grains to compare the data on bulk chemical composition with SEM-EDX data.
A JEOL JXA-8200 Superprobe microprobe supplied with energy dispersive and wave-dispersive spectrometers (WDS) was used (JEOL, Tokyo, Japan). The spectra of the analytical lines of the elements to be analyzed were recorded at an accelerating voltage of 20 kV, beam current of 20 nA, beam diameter of 1 μm, and an exposure time of 30 s (Au, Ag) and 60 s (trace elements); the spectra were then processed with the software for semi-quantitative analysis for EDX. WDS quantitative analyses were conducted under analogous parameters. The corrections for matrix effects and the concentrations of analyzed elements were calculated by the ZAF (atomic number, absorption, and fluorescence) technique, using a computer program for quantitative analysis (software of the microprobe). The standardization was done on well-characterized metal (Au, Ag, Au-Ag alloys products), chalcogenide (FeS2, ZnS, CuFeS2, PbSe) and oxide (Fe2O3, etc.) artificial and natural compounds. The minimum detection limits of trace elements determination are as follows (wt %): 0.05 As, 0.09 Te, 0.2 Se, 0.05 Cu, 0.08 Pb, 0.06 Zn, 0.5 Bi, 0.05 Fe, 0.08 S, 0.2 Sb.
3.3. Scanning Electron Microscopy with Energy Dispersive X-ray Spectrometry
The SEM-EDX study was performed on a scanning electron microscope FEI Quanta Company (FEI Company, Hillsboro, OR, USA) 200 with energy dispersive device EDAX for X-ray microanalysis. The results mostly characterize near-surface parts of gold grains where, according to [10], gold and silver sulfides are likely to be present. The microphotography was performed under high vacuum mode with the acceleration voltage of 30 kV. The maximum resolution of the device with a tungsten cathode and a standard detector of secondary and backscatter electrons equals 3.5 nm. EdaxGenesis software (EDAX, Mahwah, NJ, USA) provides not only qualitative, but also quantitative analysis by the method of three correction factors ZAF with a minimum detection limit of major elements of 0.5 wt %. The data of the EMPA and SEM-EDX in the central parts of the same grains with a uniform distribution of the material are consistent with respect to major components (Au, Ag, S, Se) within 1 at %.
4. Results
4.1. XPS and AES Data
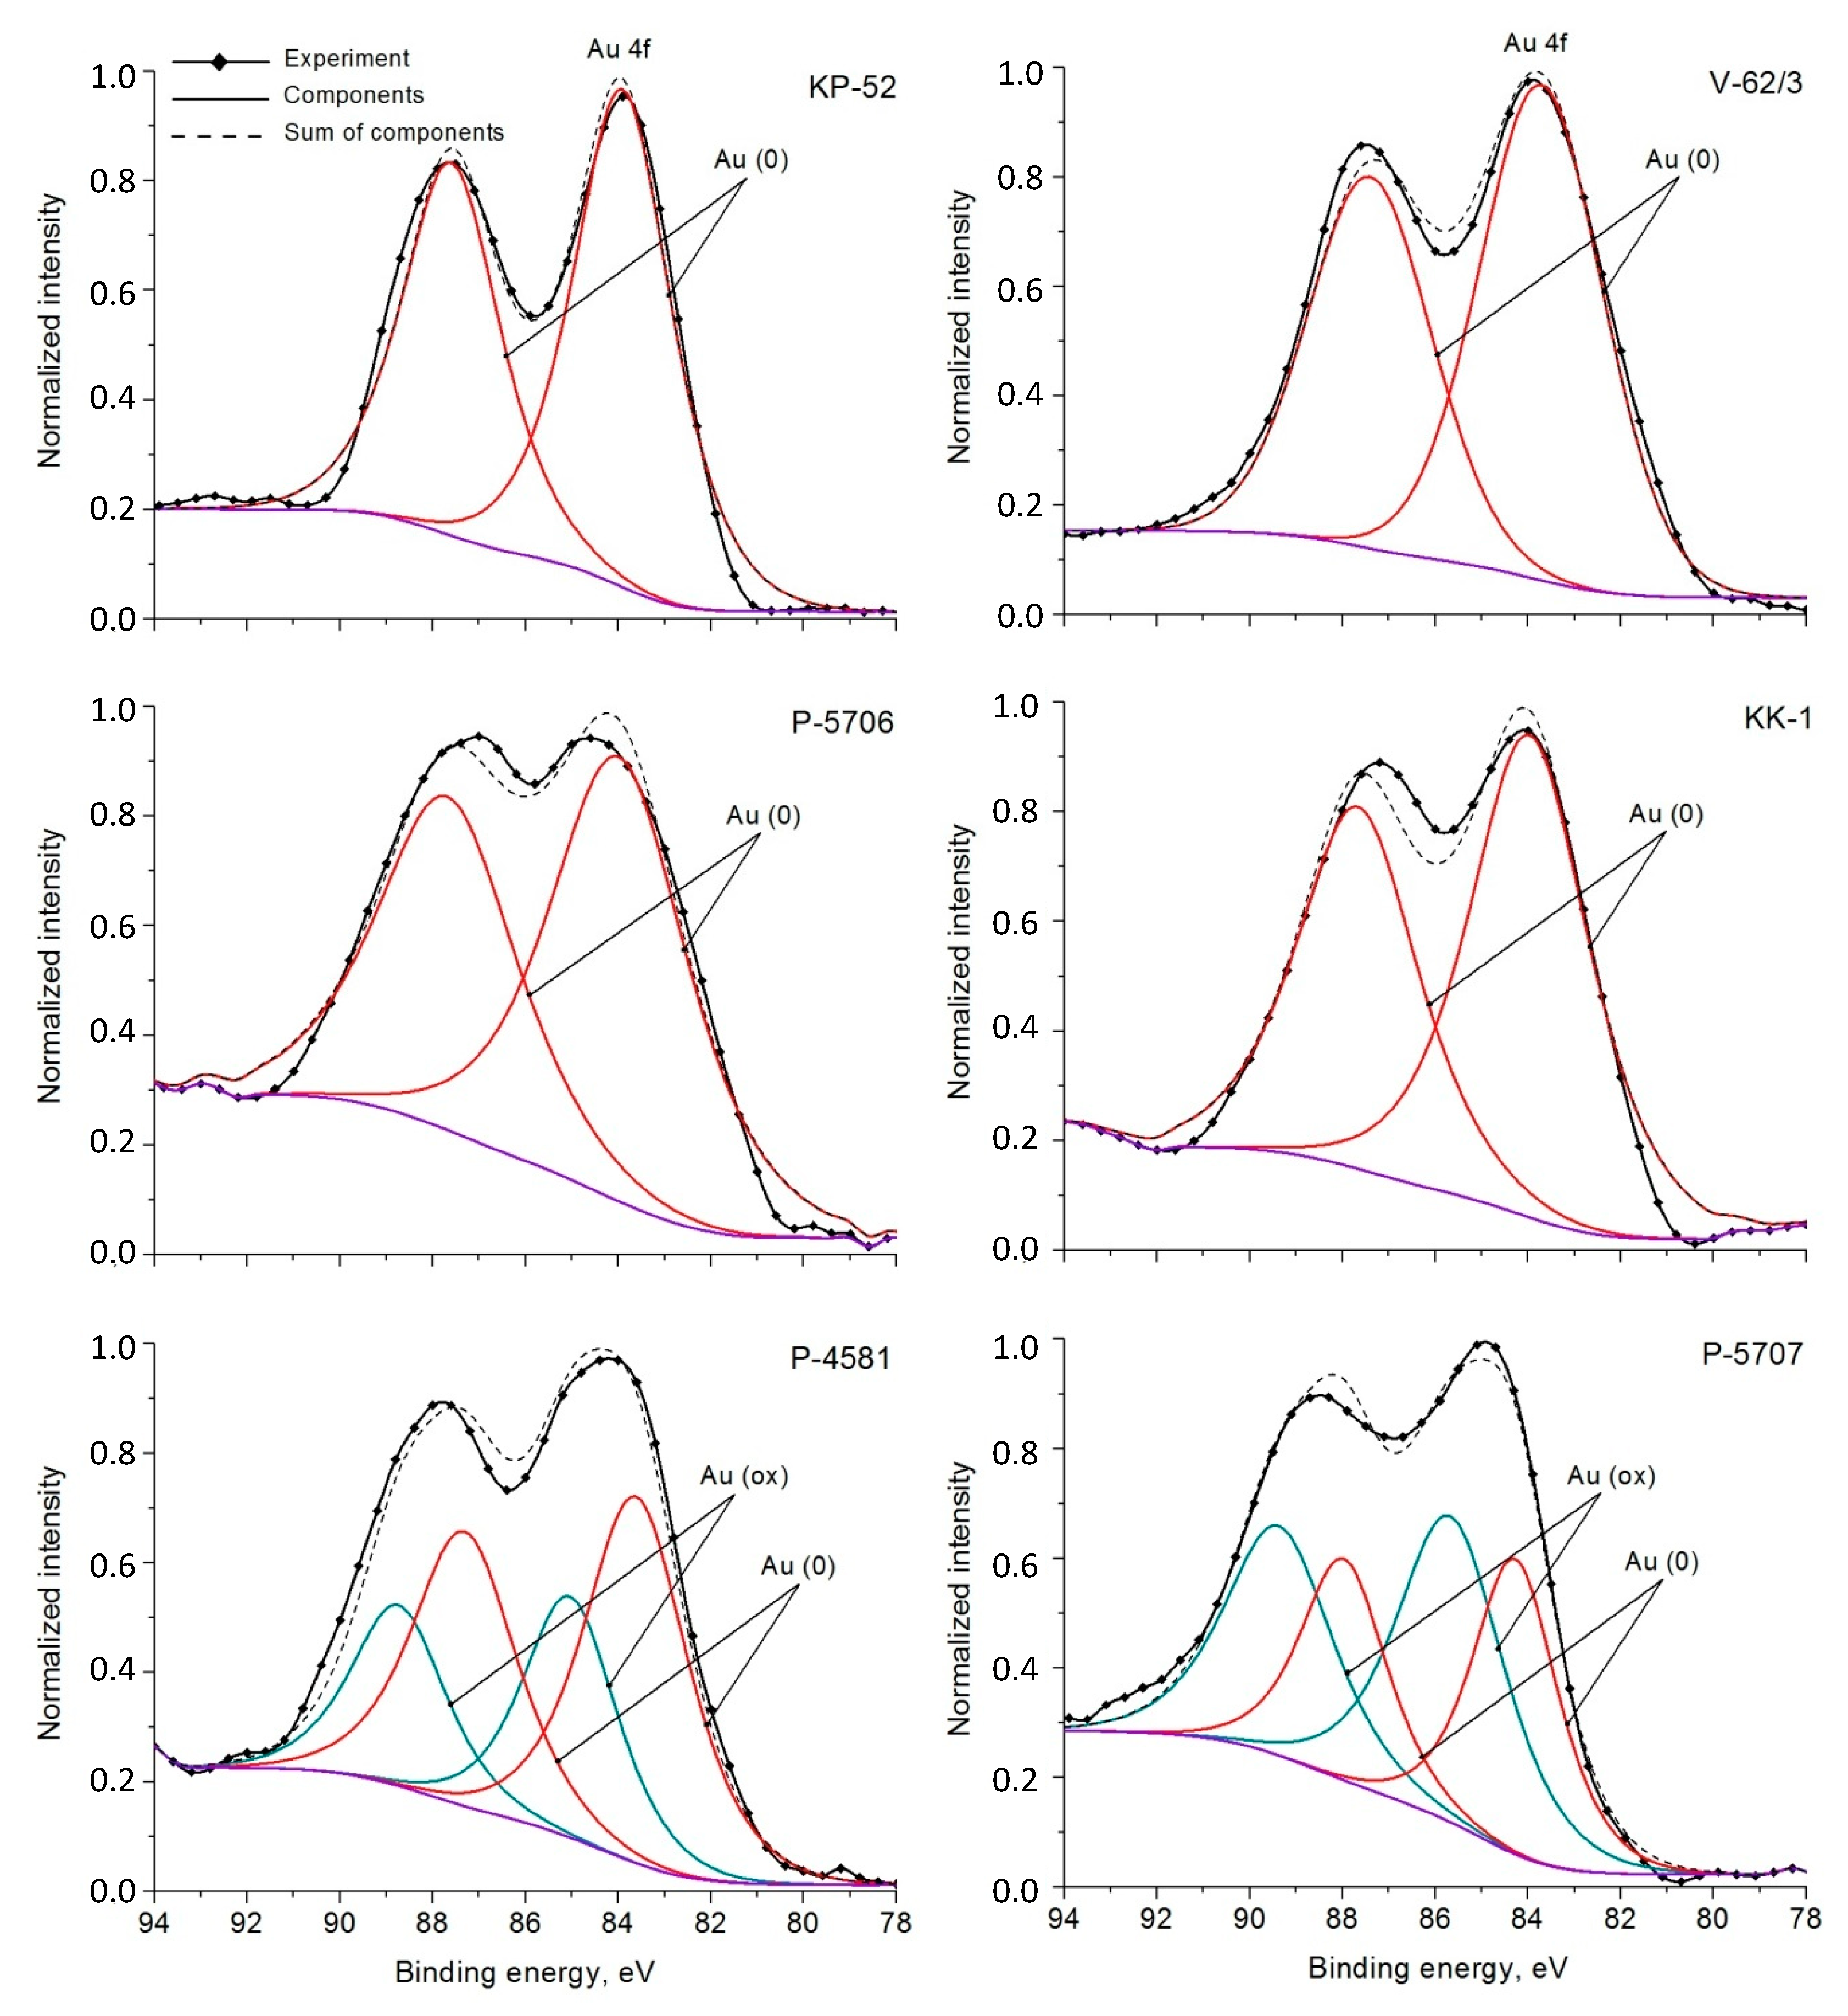
A single doublet Au 4f relating to Au (0) characterizes four of the six samples (Table 2, Figure 2). The two remaining samples, P-4581 and P-5707, taken from the Kvartsevaya Sopka deposit may not be presented in this way and the corresponding spectra must be deconvoluted with regard to other forms of Au. The second doublets (Figure 2) belong to oxidized gold Au (ox) with binding energies Au 4f7/2 85.0 (P-4581) and 85.8 eV (P-5707), with Au (ox) content on the surface being quite high—37 and 57 at %, respectively. It should be noted that the second sample, P-5707, unlike all the others, shows an intensive peak of sulfur S 2p, which provides a way for the analysis of its species on the surface (Figure 3). The assignment of sulfur peaks was performed according to [23]. There are detected monosulfide, S2−, polysulfide, Sx2− (x > 2), and sulfite sulfur species with binding energies of S 2p3/2 160.6, 162.9, and 165.8 eV, respectively, and the ratio of atomic concentrations is 44:37:19. The ion etching method found that the sulfur peak becomes virtually indistinguishable from the background within 2.5 min of etching, i.e., the thickness of the sulfide layer does not exceed 15 nm. At the same time, the ratio of Ag/Au decreases and, later, does not change.
The AES data for the Kvartsevaya Sopka samples are presented in Table 3. They confirm the enrichment of surface layer with silver and sulfur. Au, O, and Cl are present on the surface in subordinate quantities.
It is important to note that both samples, in which oxidized gold was found by XPS, have high proportions of Ag/Au on the surface (4.0 and 4.8). According to the study of isomorphic Au in argentite, the chemical shift of Au (I) peak Au 4f7/2 is 0.7–0.8 eV [24]. In the case of P-4581 and P-5707 samples it is noticeably higher (1.0–1.8 eV) and possibly corresponds to trivalent gold compounds of gold (at least for the last sample) [4,25]. Thus, according to XPS data, the high-fineness Au of the deposit belonging to relatively high-temperature mesothermal Au-Sulf-Q ore formation does not contain oxidized Au components on the surface, whereas lower fineness gold of epithermal gold-silver deposits, mostly present as electrum, in 50% of cases contains oxidized gold. The chemical shift values indicate an Au (I) or higher degree of oxidation than Au (I). Additionally, the surface of native Au of epithermal the Au-Ag deposit contains a thin layer (~15 nm) with elevated contents of Ag and S, with the ratio ~0.6–1.1. At the moment there is no direct evidence of oxidized gold belonging to it.
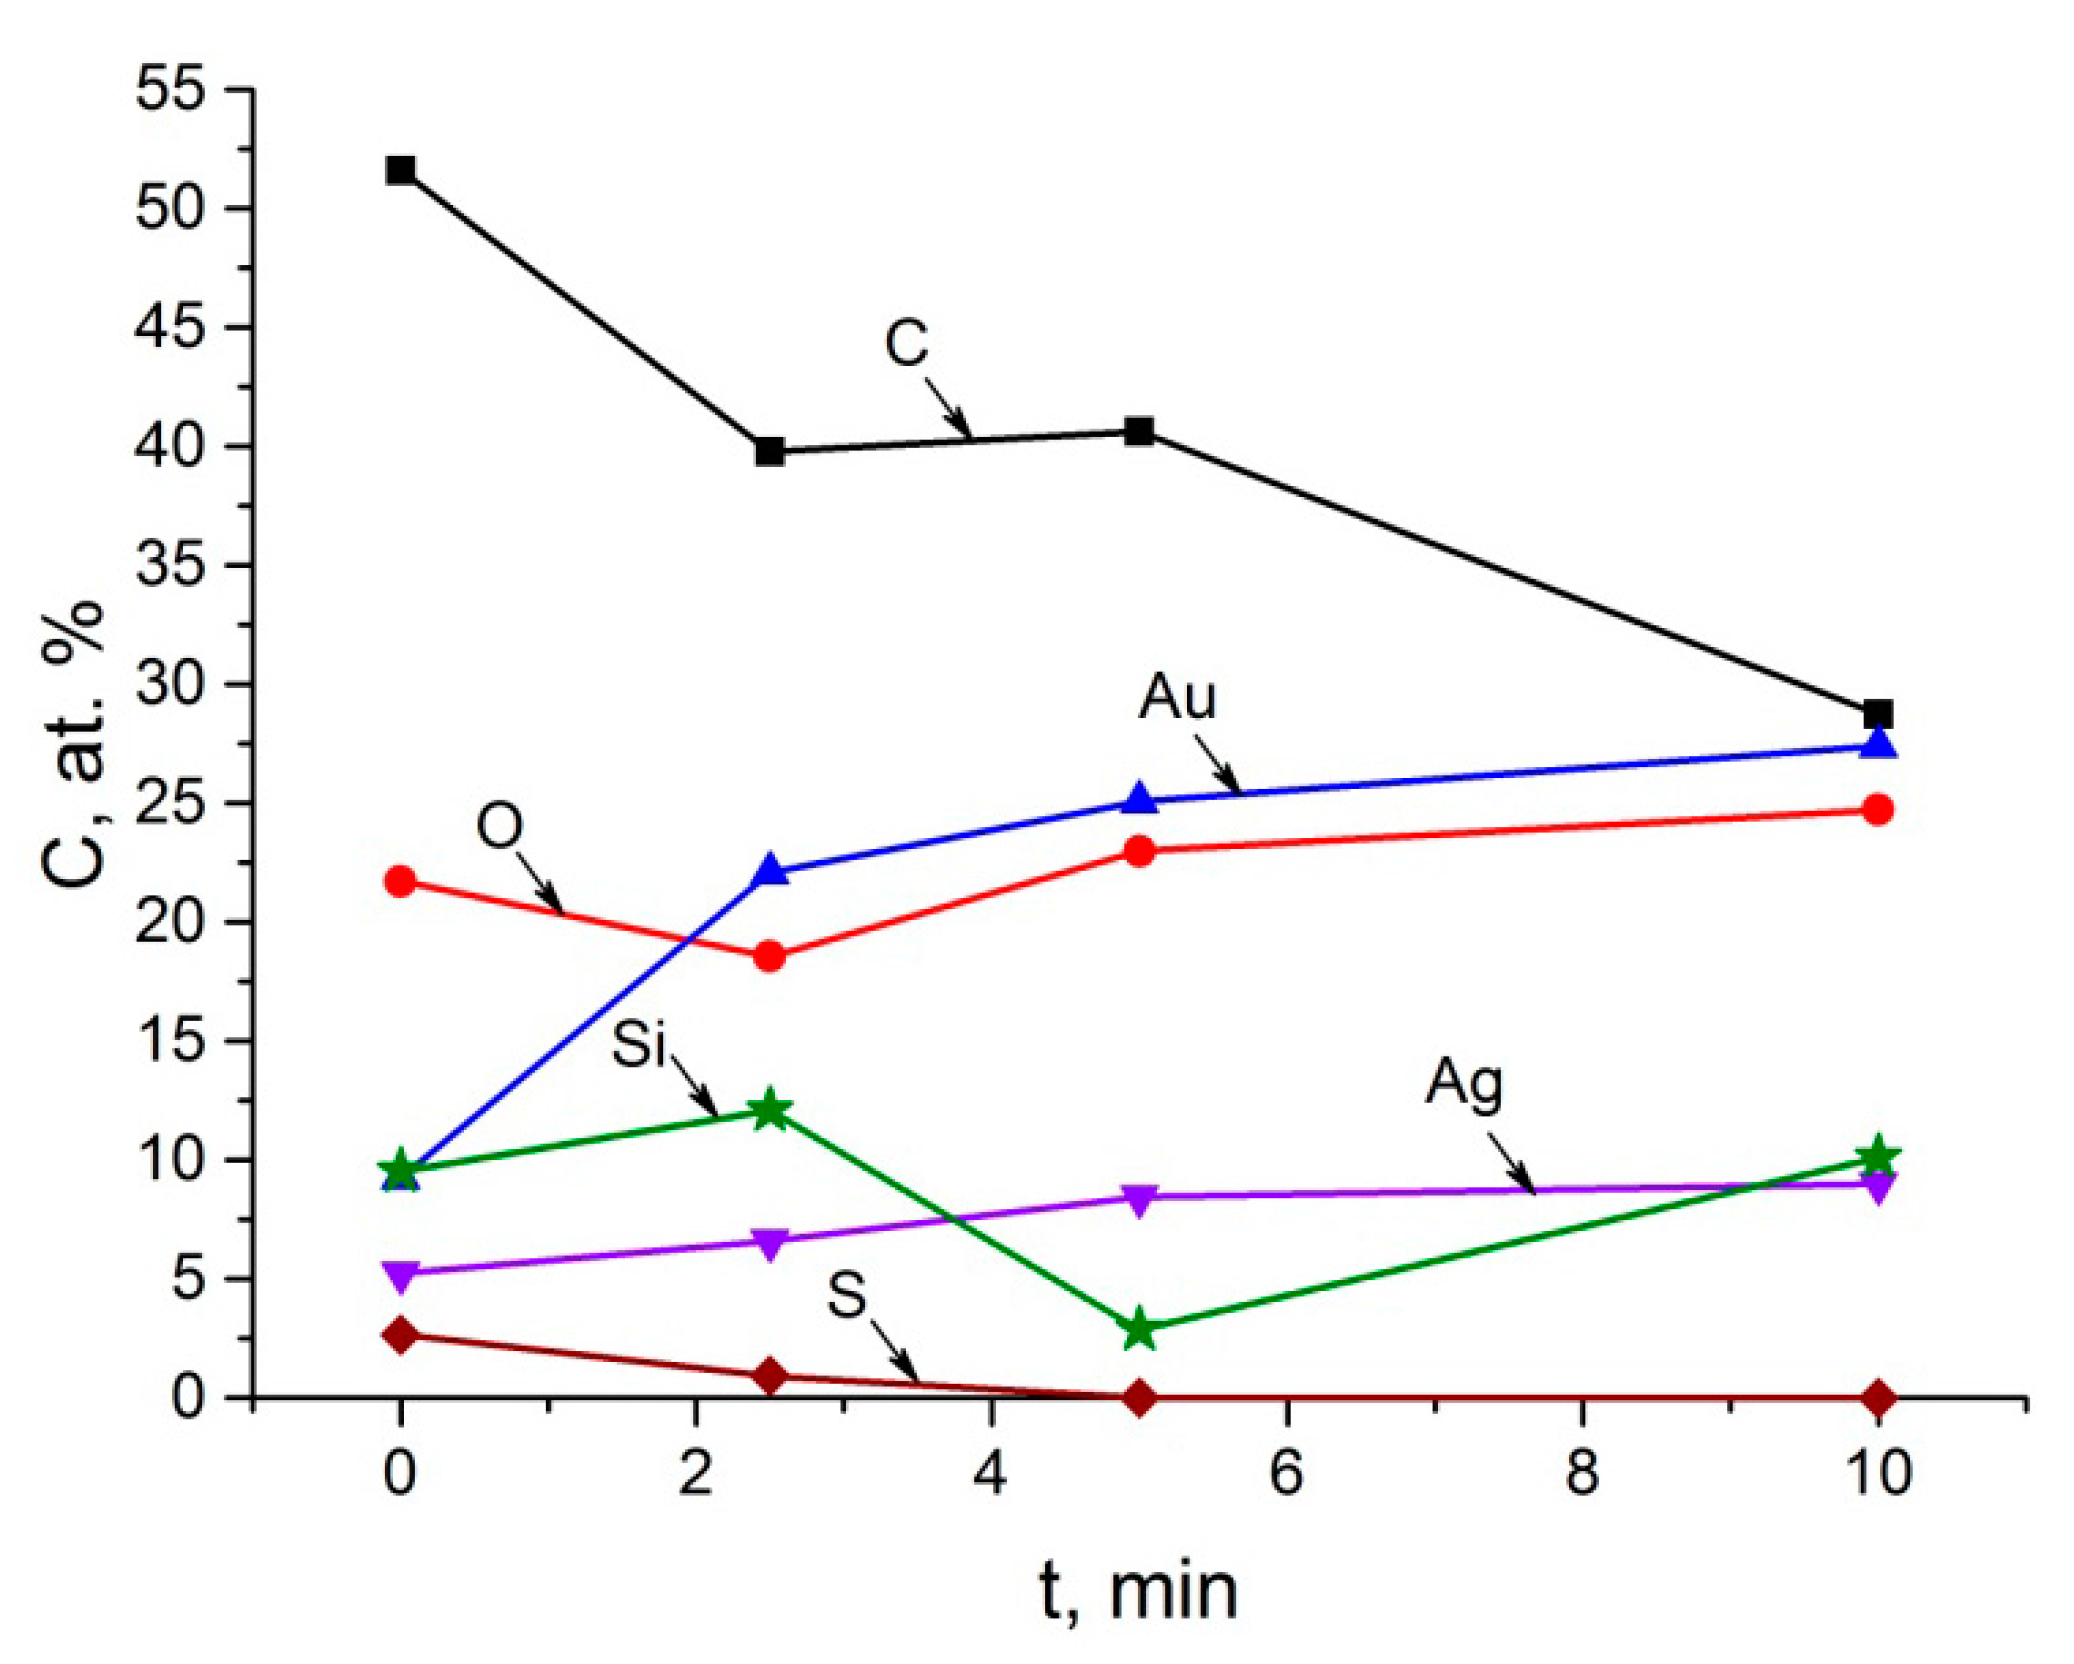
The analysis of the XPS survey spectra after Ar+ etching shows that this layer rests on the other layer enriched with silicon and oxygen. The sample P-5706 demonstrates the greatest development of this layer: content of Si and O remain high, with the etching during 10 min, i.e., the layer has a thickness of over 60 nm (Figure 4). After 2.5 min of etching the narrow scan of oxygen 1s registers the appearance of the peak 533 eV, typical of SiO2. For other samples from the Kvartsevaya Sopka deposit we noticed a reduction in the content of Si and O during etching, which indicates the thickness of this layer ~30 nm.
4.2. EMPA Data
The chemical composition of the samples studied is presented in Table 4 and Table 5. The gold crystals at the Au-Ag Kvartsevaya Sopka deposit contain Ag as a main admixture (~30 wt % on the average). Impurities in the samples are invariably represented by S (0.08–0.50 wt %), Cu (0.05–0.31 wt %), and rarely As (0.06–0.22 wt %) and Se (0.67–0.75 wt %); in addition, Te is distinctly present in the upper horizons of the deposit (0.11–0.21 wt %) whereas the lower horizons contain Bi (0.50–1.46 wt %). Other impurities, also with a predominance in the deeper horizons, are represented by Fe (0.10–0.54 wt %), Pb (0.10–0.41 wt %), and Zn (0.16–0.25% wt %) (Table 4). The gold crystals at the Amurskie Daiki Au deposit contain much less Ag (~2.2 wt % on the average). Other impurities are normally represented by Cu (0.08–0.53 wt %), and in only a few cases by S (0.08–0.11 wt %). Sb values between 0.22 and 0.29 wt % were found in gold grains from quartz and quartz-actinolite veinlets in the dykes of hybrid porphyries; Fe contents ranging 0.07–0.12 wt % occur in gold grains from orthoclase-quartz veins (Table 5).
4.3. Chemical Composition of S-Containing Native Gold Samples
The search of Ag and Au sulfides in the samples of the Kvartsevaya Sopka deposit by EMPA and SEM-EDX methods showed dual result. In the margin parts of the grains silver-enriched sectors were frequently observed. For example, in the sample P-5706 in the grain rim 10–20 µm in width contents of Ag and S amount to ~64 and ~13 wt % respectively, whereas in the particle core Au dominates (66%), with sulfur content being about 1%.
Table 6 presents the results of determination of Ag/Au and (Ag + Au)/(S + Se) ratios at the points where sulfur contents were at a level close to that of gold and silver sulfides. The Ag/Au ratios do not always correspond to the stoichiometry of binary sulfides. Only P-4581 and P-5707 samples (those where the XPS identifies oxidized gold) demonstrated areas with compositions close to the stoichiometry of uytenbogaardtite, Ag3AuS2. They are fairly loose, zonal structures similar to reaction rims on Au, Ag grains with elevated sulfur content. The data in Table 6 shows that the process of “sulfidation” [10] of native gold covers the area of higher Ag/Au ratios, compared to uytenbogaardtite, up to almost pure Ag2S. This most likely presumes the existence of solid solutions of Ag2−xAuxS [11,14].
5. Discussion
Even thermodynamically-unstable gold (I) sulfide is known to form in hydrothermal conditions at 175 °C [26]. The existence of gold and silver sulfides, which are thermodynamically stable at relatively low temperatures [12,27] at epithermal deposits of different genesis does not, therefore, seem surprising. Cocker et al. [28] studied the origin of the minerals of the Ag-Au-S-Se system on the adularia-sericite epithermal Broken Hills deposit in New Zealand. The authors concluded that uytenbogaardtite and petrovskaite can be formed both in hypogene and supergene conditions, and their precursors are solid solutions (Ag,Au)2S with a primitive cubic unit cell, stable in the conditions of formation of the main–stage mineralization at 220–250 °C. Thus, the problem is not formation, but preservation of AuAg sulfides, especially under oxidizing environment, in associations with sulfates and hydroxides in supergene conditions [10,11,14].
The data obtained indicate that the surface of the native gold from an epithermal deposit has a complex structure: thin Ag- and S-enriched layer is followed by a ~30–60 nm thick layer containing SiO2 as a protective coating for Ag,Au sulfides. Earlier coatings with a thickness below 0.5 microns with high Si and O content were found by the AES method on the surface of gold-bearing pyrite crystals from circum-ore metasomatites of the epithermal Au-Ag deposit Dal’neye (Northeast Russia) [29].
The wide variations in the composition of the AuAg-sulfides, going far beyond the limits of stoichiometric proportions of elements in well-known binary sulfides uytenbogaardtite and petrovskaite can be accounted for by two reasons. One of the options may be the situation, when solid solutions Ag2−xAuxS after their formation are arranged into AuAg sulfide phases, provided their corresponding figurative points are close in composition to Ag3AuS2 and AgAuS. If the contents of Au are low, Ag2−xAuxS phases, apparently, can be preserved in the form of solid solutions. Their nature and stabilizing factors require further study.
Harder to interpret is the situation when sulfur contents are much lower than standard values for sulfides of Ag and Au (I) and solid solutions (Ag,Au)2S (33 at % S). Experimental modeling and DFT calculations of small clusters of AgmSn, AgnAum, and AgnAumS [30,31] demonstrated that some compositions are thermodynamically more preferable than others, i.e., they have a lower free energy of formation. Although "globally" they are in non-equilibrium, locally they may exist in certain circumstances, especially when stabilized by S adsorption. They are likely to contain other stabilizing elements, such as Se or Sb. The AgnAum clusters, stabilized by sulfur, are aggregated into nanoparticles, and then into larger agglomerations, comparable with crystallites (blocks) in the solid solution. As a result crystals with highly-developed subgrain boundaries are formed. The process follows the mechanism of self-assembly of nanoparticles by oriented attachment resulting in their integration [32,33]. It is worth noting that the structural defects, in particular, dislocation walls, are formed as a consequence of this growth mechanism [32]. In our case, the sulfur will be absorbed by the subgrain boundaries [34] and perceived with resolutions available to scanning electron microscopy as evenly distributed. A similar mechanism of crystallization brings about nano-scale heterogeneity of the structure of pure precious metals. For example, native silver of both hypogene and supergene genesis from deposits of various types consists of crystallites varying in size from ~20 to ~28 nm [35].
The chemical and phase composition zonality of the anomalous surface layer was detected in studying placer gold as well [36]. According to these data, external oxide zone is followed by sulfate and further sulfide, at the micro level repeating the alternation of hypergene mineral associations in the vertical section of ore deposits oxidation zones. Therefore, the presently-described phenomenon of surface zoning at the nano-scale on the surface of native gold is normal in nature. It can be used in prospecting to define the formation type of the indigenous source of gold, which would require more extensive study of the surface of native gold from deposits of various types.
6. Conclusions
The present study established that the surface of high-fineness Au from the deposit belonging to a relatively high-temperature mesothermal gold-quartz-sulfide ore formation does not contain an oxidized Au component, whereas less fine gold from the epithermal gold-silver deposit in 50% of cases contains oxidized gold with the oxidation state Au (I) or higher. The surface of such native Au has a thin layer (~15 nm) with elevated contents of Ag and S, underlain by SiO2-containing layer with the thickness of ~30–60 nm. Such a multilayer coating may perform a protective function, ensuring the preservation of Ag and Au sulfides in the surface parts of AuAg grains in oxidizing conditions. The S-enriched rims of native gold particles do not always correspond with the stoichiometry of the known Ag and Au binary sulfides and have variable composition, suggesting the existence of solid solutions Ag2−xAuxS. Non-stoichiometric ternary phases with sulfur deficiency could be formed by aggregation of clusters of AgnAumS and subsequent self-assembly of nanoparticles into polycrystalline structures with developed dislocation subgrain boundaries, saturated with sulfur, and possibly other elements stabilizing the initial clusters (Se, Sb). The chemical and phase zonality of the native gold surface layer is a fairly common phenomenon in nature and is inherent not only to lode gold, but also to placer gold. It can be used in the process of prospecting for gold in order to establish gold correlation with specific geochemical conditions and the type of mineralization, and also be taken into account in the development of the technology of gold extraction from ore deposits of different genetic types.
Acknowledgments
The authors would like to acknowledge the Russian Foundation for Basic Research, the Siberian Branch of the Russian Academy of Sciences, and the Irkutsk Scientific Center for funding this work through grant Nos. 15-05-00612, 15-05-05767, 16-35-00102, 17-05-00095, II.2П/IX.130-5, and 1.3. We thank Yury V. Shchegol’kov for operational assistance with XPS and AES analyses at the Central Research Geological Exploration Institute of Nonferrous and Noble Metals in Moscow. Microprobe analyses were undertaken at the Common Use Center (CUC) of Isotope and Geochemical Studies in A.P. Vinogradov Institute of Geochemistry with assistance of Lyudmila F. Pavlova. Scanning electron microscopic analyses were done at CUC of Ultramicroanalysis at the Limnological Institute. We thank the authorities of both centers for providing the possibility of this study. The authors would like to thank three anonymous reviewers for their constructive criticism and useful comments.
Author Contributions
Vladimir L. Tauson formulated the problem, organized the research team, and guided the study and interpretation of results. Raisa G. Kravtsova provided samples and contributed to interpretations. Artem S. Makshakov prepared the samples and participated in the EMPA study. Sergey V. Lipko processed and attributed the XPS and AES spectra. Kirill Yu. Arsent’ev provided SEM-EDX analyses. All authors participated in writing the manuscript.
Conflicts of Interest
The authors declare no conflict of interest.
References
- Nefedov, V.I.; Zhavoronkov, N.M.; Machavariani, G.V.; Salyn, Ya.V.; Makeev, V.A.; Zelenov, V.I. The variation of silver content in native gold particles as revealed by ESCA. Phys. Chem. Miner. 1982, 8, 193–196. [Google Scholar] [CrossRef]
- Petrovskaya, N.V.; Aleshin, V.G.; Novgorodova, M.I.; Nemoshkalenko, V.V. New data on the composition of surface layers of native gold. Dokl. Earth Sci. 1987, 292, 1241–1244. (In Russian) [Google Scholar]
- Boccuzzi, F.; Chiorino, A.; Manzoli, M.; Andreeva, D.; Tabakova, T.; Ilieva, L.; Iadakiev, V. Gold, silver and copper catalysts supported on TiO2 for pure hydrogen production. Catal. Today 2002, 75, 169–175. [Google Scholar] [CrossRef]
- Lustemberg, P.G.; Vericat, C.; Benitez, G.A.; Vela, M.E.; Tognalli, N.; Fainstein, A.; Martiarena, M.L.; Salvarezza, R.C. Spontaneously formed sulfur adlayers on gold in electrolyte solutions: Adsorbed sulfur or gold sulfide? J. Phys. Chem. C 2008, 112, 11394–11402. [Google Scholar] [CrossRef]
- Quek, S.Y.; Biener, M.M.; Biener, J.; Bhattacharjee, J.; Friend, C.M.; Waghmare, U.V.; Kaxiras, E. Rich coordination chemistry of Au adatoms in gold sulfide monolayer on Au (111). J. Phys. Chem. B 2006, 110, 15663–15665. [Google Scholar] [CrossRef] [PubMed]
- Gusmano, G.; Montanari, R.; Kaciulis, S.; Montesperelli, G.; Denk, R. “Gold corrosion”: Red stain on a gold Austrian Ducat. Appl. Phys. A 2004, 79, 205–211. [Google Scholar] [CrossRef]
- Nefedov, V.I.; Salyn, Ya.V.; Makeev, V.A.; Zelenov, V.I. Surface composition of native gold and Ag/Au alloys. J. Electron. Spectrosc. Relat. Phenom. 1981, 24, 11–17. [Google Scholar] [CrossRef]
- Shchegol’kov, Yu.V.; Amosov, R.A. Oxidation of native gold in placers. Dokl. Earth Sci. 2000, 370, 520–523. (In Russian) [Google Scholar]
- Shchegol’kov, Yu.V. Formation of thin gold oxide films on the native gold in natural conditions. Zapiski RMO (Proc. Russ. Miner. Soc.) 2013, 142, 126–132. (In Russian) [Google Scholar]
- Palyanova, G.; Karmanov, N.; Savva, N. Sulfidation of native gold. Am. Mineral. 2014, 99, 1095–1103. [Google Scholar] [CrossRef]
- Anisimova, G.S.; Kondrateva, L.A.; Leskova, N.V. Sulfide compounds of gold and silver in gold-ore deposits of East Yakutia. Otechestvennaya Geol. 2008, 5, 24–32. (In Russian) [Google Scholar]
- Barton, M.D. The Ag-Au-S system. Econ. Geol. 1980, 75, 303–316. [Google Scholar] [CrossRef]
- Folmer, J.C.W.; Hofman, P.; Wiegers, G.A. Order-disorder transitions in the system Ag2−xAuxS (0< x <1). J. Less Common Met. 1976, 48, 251–268. [Google Scholar] [CrossRef]
- Savva, N.E.; Pal’yanova, G.A. Genesis of gold and silver sulfides at the Ulakhan deposit (Northeastern Russia). Russ. Geol. Geophys. 2007, 48, 799–810. [Google Scholar] [CrossRef]
- Kucha, H.; Raith, J.G. Gold-oxysulphides in copper deposits of the Greywacke Zone, Austria: A mineral chemical and infrared fluid inclusion study. Ore Geol. Rev. 2009, 35, 87–100. [Google Scholar] [CrossRef]
- Petrovskaya, N.V.; Safonov, Yu.G.; Sher, S.D. Formations of gold deposits. In Ore Formations of Endogenous Deposits; Nauka: Moscow, Russia, 1976; Volume 2, pp. 3–110. (In Russian) [Google Scholar]
- Belyi, V.F. Problems of the geological and isotope age of the Okhotsk-Chukotka volcanogenic belt. Stratigr. Geol. Correl. 2008, 16, 64–75. (In Russian) [Google Scholar] [CrossRef]
- Layer, P.W.; Ivanov, V.V.; Ratkin, V.V.; Bundtsen, T.K. Epithermal gold-silver deposits of North-East Russia: First Ar-40-Ar-39 data of ore ages. Dokl. Earth Sci. 1997, 356, 665–668. (In Russian) [Google Scholar]
- Kravtsova, R.G.; Borovikov, A.A.; Borisenko, A.S.; Prokof’ev, V.Y. Formation conditions of gold-silver deposits in the northern Okhotsk Region, Russia. Geol. Ore Depos. 2003, 45, 395–415. [Google Scholar]
- Spiridonov, A.M.; Zorina, L.D.; Kitaev, N.A. Gold-Bearing Ore-Magmatic Systems of Transbaikalia; Academic Publishing House “Geo”: Novosibirsk, Russia, 2006. (In Russian) [Google Scholar]
- Tupyakov, V.E.; Shirokih, I.N.; Rozov, D.N. The model of the ore-metasomatic column of the Kariyskoe ore field (Eastern Transbaikalia). Geol. Geophys. 1982, 23, 33–38. (In Russian) [Google Scholar]
- Prokofiev, V.Yu.; Spiridonov, A.M.; Kuzmina, T.M. Physicochemical conditions of mineralizing processes at the Kariiskoegold deposit, Eastern Transbaikalia. Geokhimiya 1997, 4, 423–434. (In Russian) [Google Scholar]
- Tauson, V.L.; Goettlicher, J.; Sapozhnikov, A.N.; Mangold, S.; Lustenberg, E.E. Sulphur speciation in lazurite-type minerals (Na,Ca)8[Al6Si6O24](SO4,S)2 and their annealing products: A comparative XPS and XAS study. Eur. J. Mineral. 2012, 24, 133–152. [Google Scholar] [CrossRef]
- Tauson, V.L.; Lustenberg, E.E. Quantitative determination of modes of gold occurrence in minerals by the statistical analysis of analytical data sampling. Geochem. Int. 2008, 46, 423–428. [Google Scholar] [CrossRef]
- Stadnichenko, A.I.; Koshcheyev, S.V.; Boronin, A.I. Oxidation of the polycrystalline gold foil surfaces and X-ray photoelectronic spectroscopy study of oxygen states in oxide layers. Vestn. Mosc. Univ. Khimia 2007, 48, 418–426. (In Russian) [Google Scholar]
- Kuo, C.-L.; Huang, M.H. Hydrothermal synthesis of free-floating Au2S nanoparticle superstructures. J. Phys. Chem. C 2008, 112, 11661–11666. [Google Scholar] [CrossRef]
- Osadchii, E.G.; Rappo, O.A. Determination of standard thermodynamic properties of sulfides in the Ag-Au-S system by means of a solid-state galvanic cell. Am. Mineral. 2004, 89, 1405–1410. [Google Scholar] [CrossRef]
- Cocker, H.A.; Mauk, J.L.; Rabone, S.D.C. The origin of Ag-Au-S-Se minerals in adularia-sericite epithermal deposits: Constrains from the Broken Hills deposit, Hauraki Goldfield, New Zealand. Miner. Depos. 2013, 48, 249–266. [Google Scholar] [CrossRef]
- Tauson, V.L.; Kravtsova, R.G. Chemical typomorphism of mineral surfaces: Surface composition specifics (by the example of gold-bearing pyrite from epithermal deposit). Russ. Geol. Geophys. 2004, 45, 222–227. [Google Scholar]
- Wu, Z.; Jiang, D.; Lanni, E.; Bier, M.E.; Jin, R.C. Sequential observation of AgnS4− (1 ≤ n ≤ 7) gas phase clusters in MS/MS and prediction of their structures. J. Phys. Chem. Lett. 2010, 1, 1423–1427. [Google Scholar] [CrossRef]
- Zhao, S.; Ren, Y.L.; Lu, W.; Wang, J.; Yin, W.P. Density functional study of AgnAum and AgnAum+ (n + m ≤ 5) clusters interaction with a single S atom. Comput. Theor. Chem. 2013, 1017, 188–193. [Google Scholar] [CrossRef]
- Banfield, J.F.; Welch, S.A.; Zhang, H.Z.; Ebert, T.T.; Penn, R.L. Aggregation-based crystal growth and microstructure development in natural iron oxyhydroxide biomineralization products. Science 2000, 289, 751–754. [Google Scholar] [CrossRef] [PubMed]
- Ivanov, V.K.; Fedorov, P.P.; Baranchikov, A.Y.; Osiko, V.V. Oriented attachment of particles: 100 years of investigations of non-classical crystal growth. Russ. Chem. Rev. 2014, 83, 1204–1222. [Google Scholar] [CrossRef]
- Abramovich, M.G.; Shmakin, B.M.; Tauson, V.L.; Akimov, V.V. Mineral typochemistry: Anomalous trace-element concentrations in solid solutions with defect structures. Int. Geol. Rev. 1990, 32, 608–615. [Google Scholar] [CrossRef]
- Spiridonov, E.M.; Yanakieva, D.Y. First results of structural study of macroscopic native silver economic deposits on the nanolevel. Dokl. Earth Sci. 2012, 444, 639–641. [Google Scholar] [CrossRef]
- Ostapenko, L.A.; Ryzhov, O.B.; Shchegol’kov, Yu.V.; Aristov, V.V. Typical features of placer gold from the Adycha river basin, East Yakutia: Grain morphology, chemistry and origin of coatings. Otechestvennaya Geol. 2011, 1, 29–42. (In Russian) [Google Scholar]
Figure 1.
Location of the Kvartsevaya Sopka (1) and the Amurskie Daiki (2) gold deposits within the territory of the Russian Federation.
Figure 1.
Location of the Kvartsevaya Sopka (1) and the Amurskie Daiki (2) gold deposits within the territory of the Russian Federation.
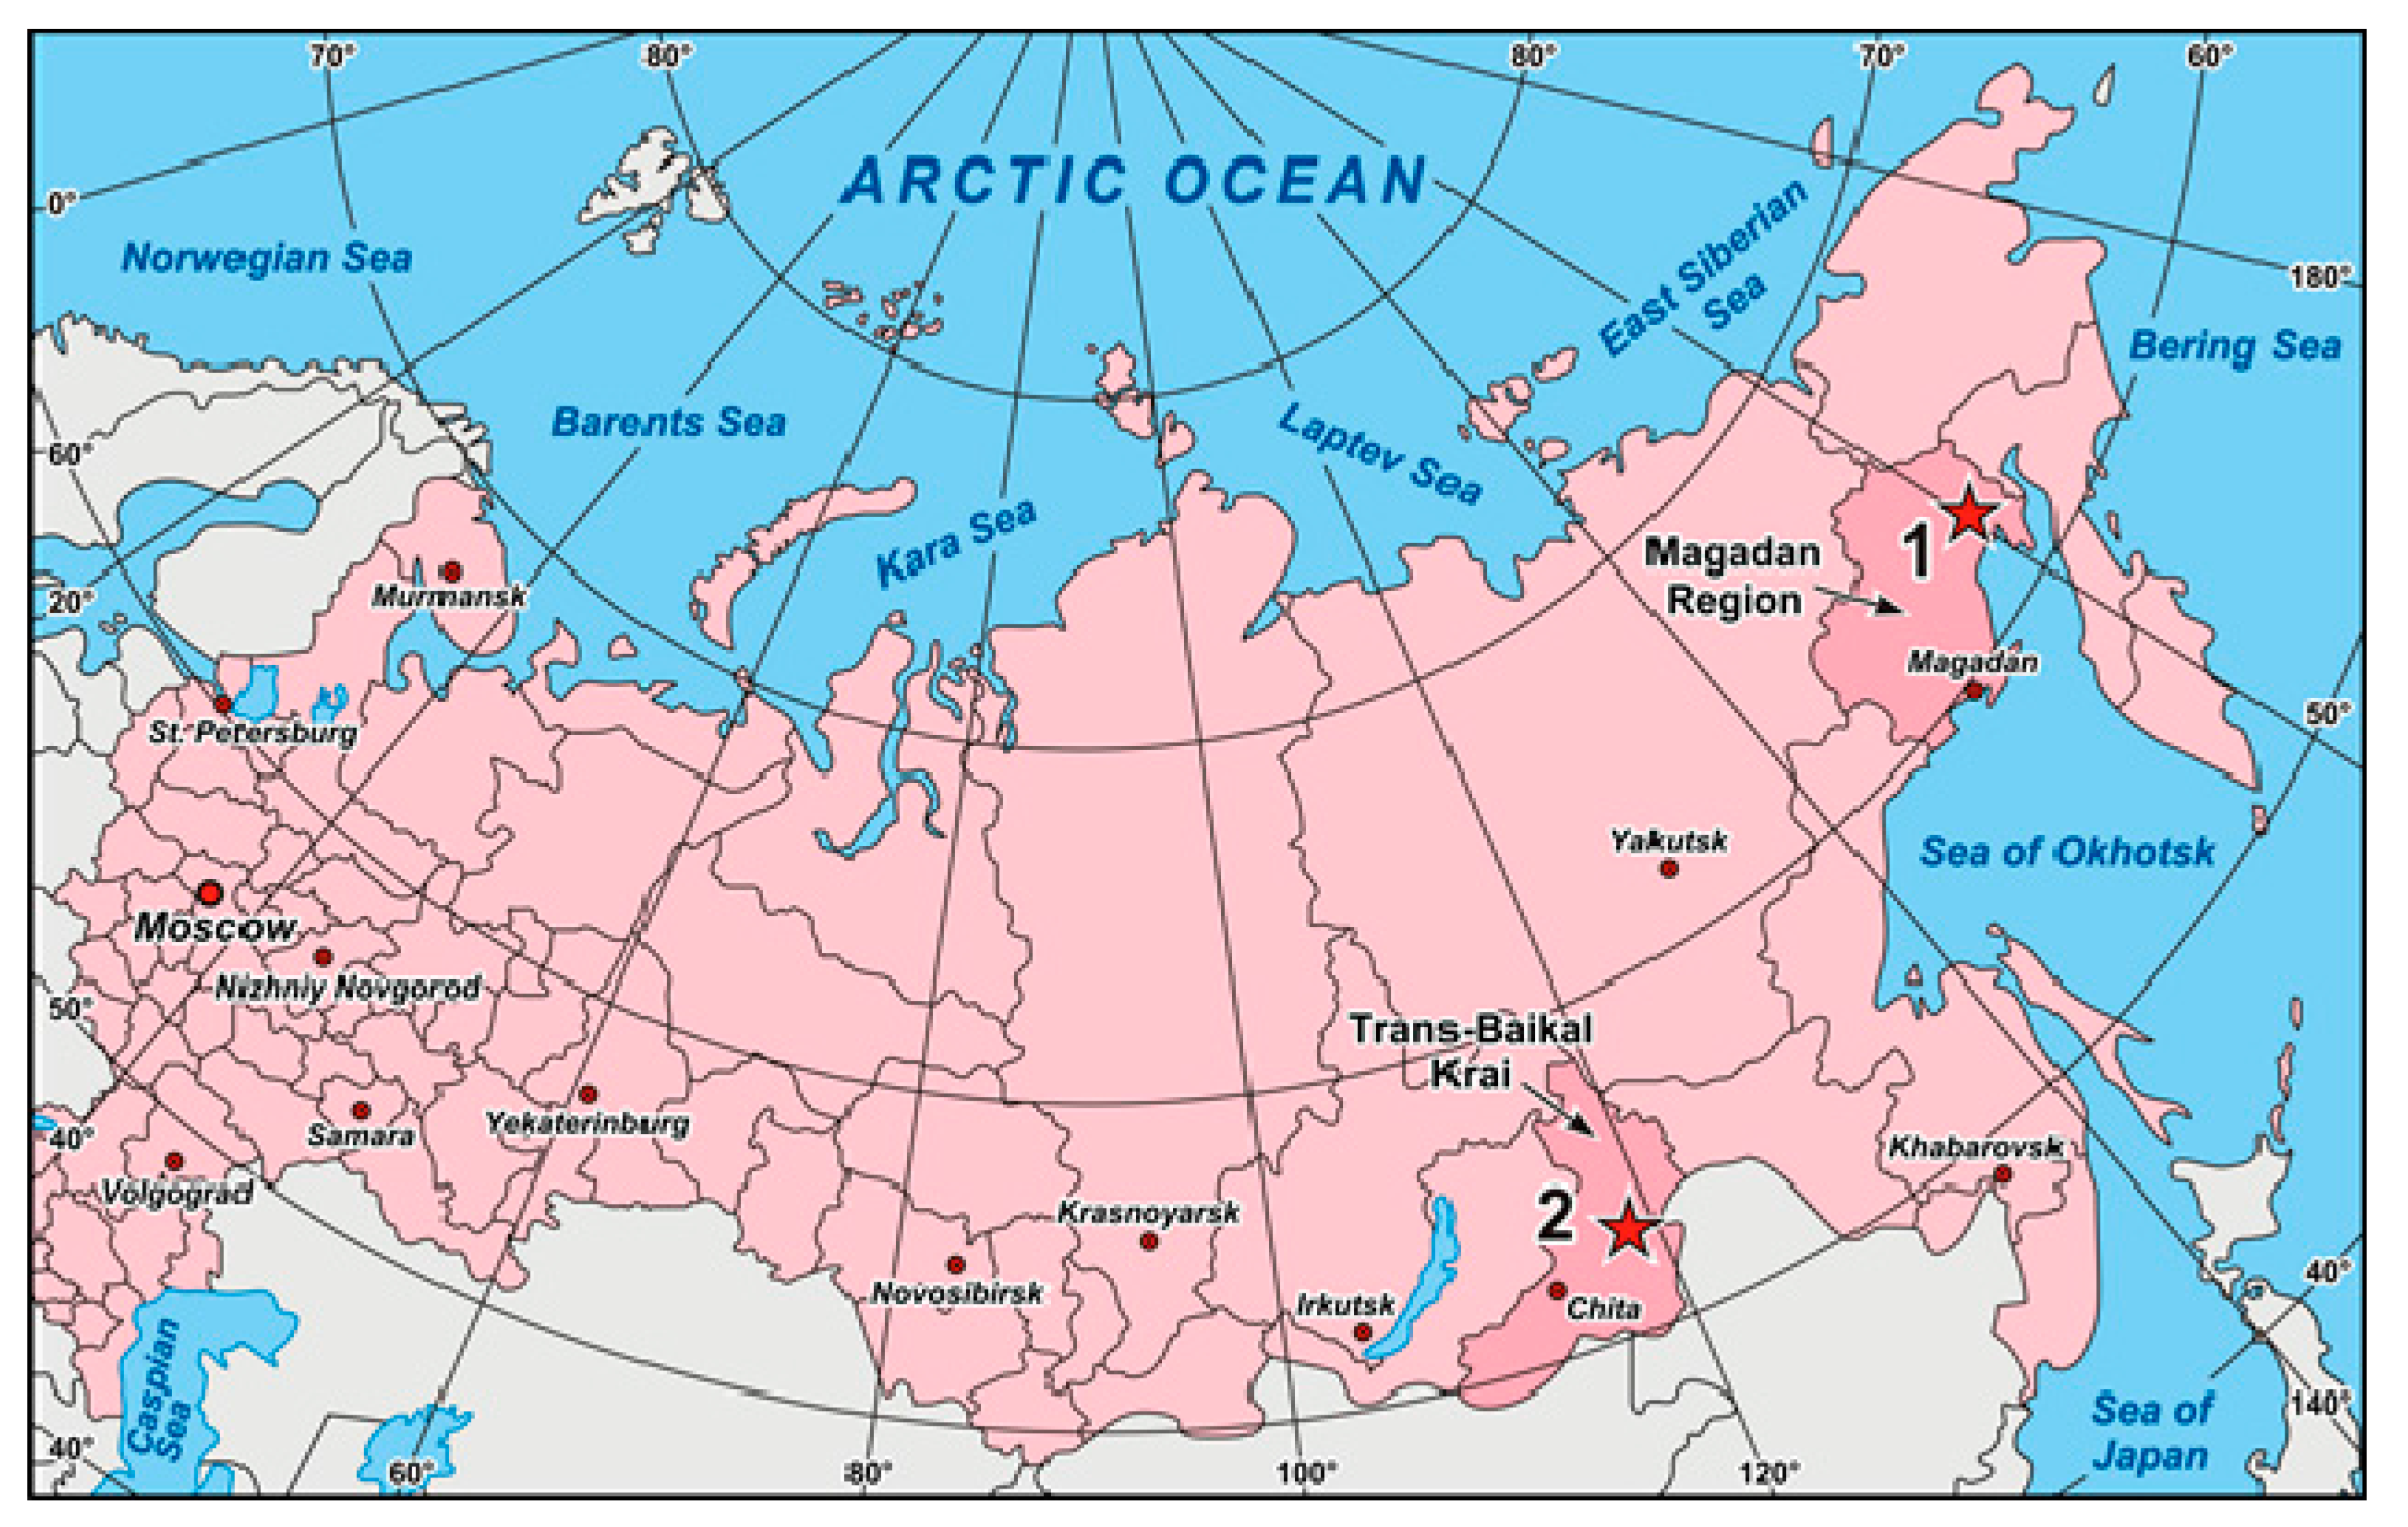
Figure 2.
X-ray photoelectron spectra of Au 4f7/2-5/2 native gold samples from the Amurskie Daiki (top line) and Kvartsevaya Sopka deposits (middle line, only metallic Au, bottom line, oxidized Au present).
Figure 2.
X-ray photoelectron spectra of Au 4f7/2-5/2 native gold samples from the Amurskie Daiki (top line) and Kvartsevaya Sopka deposits (middle line, only metallic Au, bottom line, oxidized Au present).

Figure 3.
XPS S 2p3/2-1/2. The Kvartsevaya Sopka deposit. Sample P-5707. Curve legends are presented in Figure 2.
Figure 3.
XPS S 2p3/2-1/2. The Kvartsevaya Sopka deposit. Sample P-5707. Curve legends are presented in Figure 2.
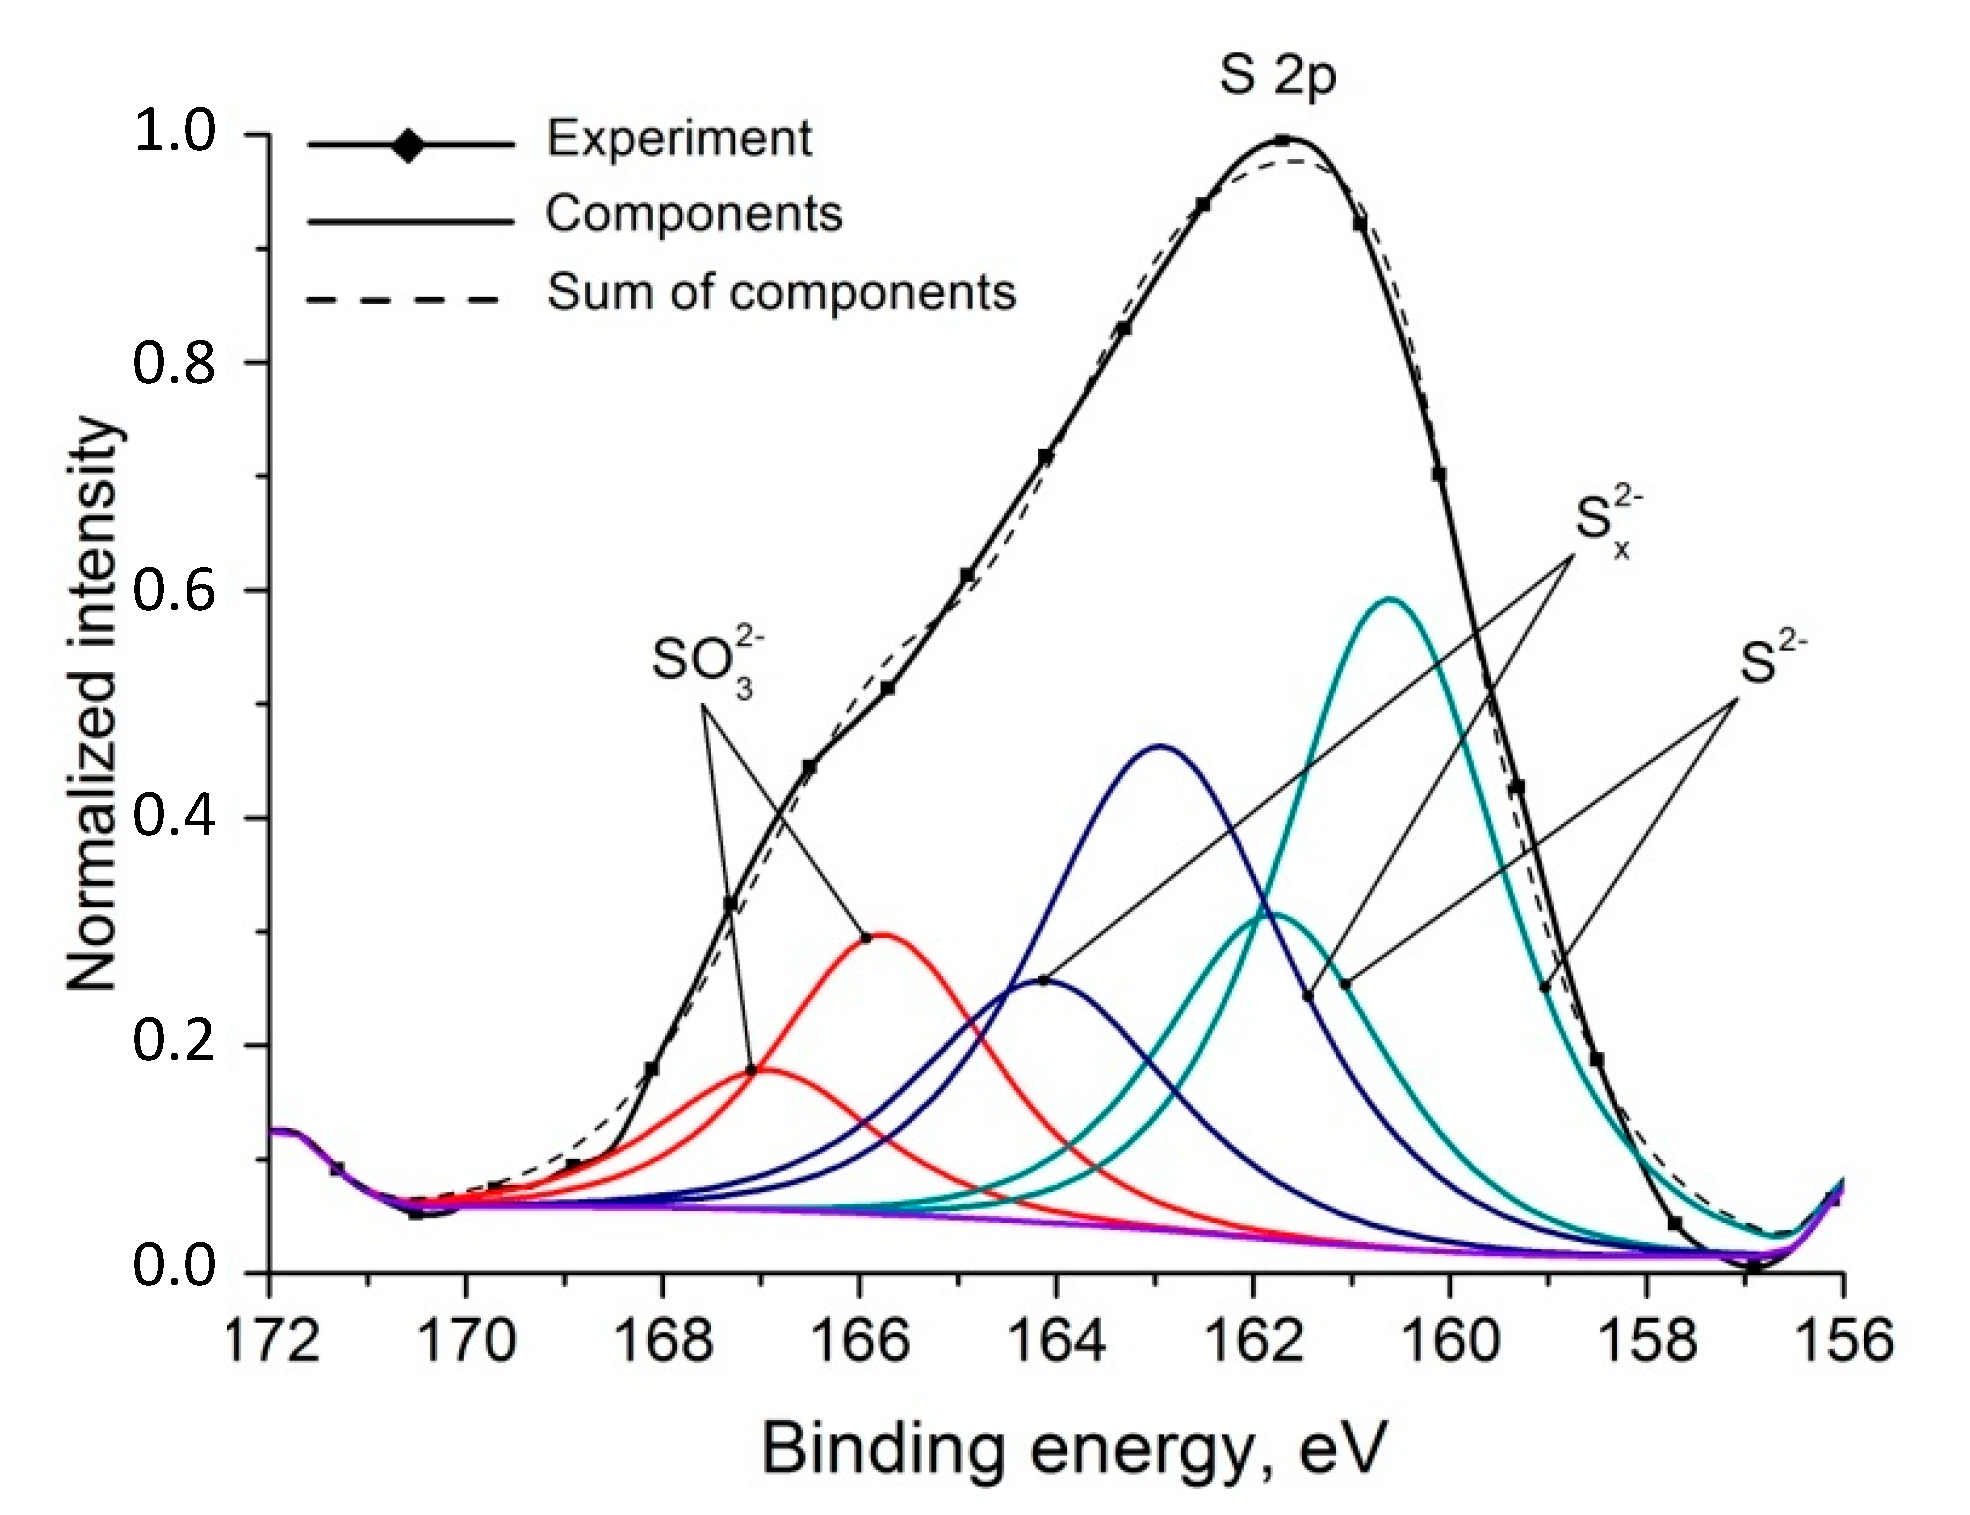
Figure 4.
Change of the elements content in the course of surface etching with Ar+ according to the analysis of XPS survey spectra. Sample P-5706.
Figure 4.
Change of the elements content in the course of surface etching with Ar+ according to the analysis of XPS survey spectra. Sample P-5706.

Table 1.
Brief description of the samples analyzed.
| Deposit | Sample No. | Sampling Point | Sample Characteristics | |
|---|---|---|---|---|
| Rock Sample | Native Gold | |||
| Kvartsevaya Sopka | P;-5706 | Natural outcrop, Trench 203 | Quartz-adularia vein with sulfides (acanthite, silver sulfosalts, pyrite), native silver and native gold (electrum) | Euhedral crystals and their aggregates 0.2–0.5 mm in size. Impurities, wt % (Table 4): 28.4–32.5 (av. 30.5) Ag, bdl-0.17 Te, bdl-0.54 S. |
| KK-1 | Adit No. 2, rise 1 | Quartz-adularia vein with sulfides (acanthite, silver sulfosalts, galena, sphalerite, pyrite) and native gold (electrum) | Euhedral crystals and their aggregates 0.5–1 mm in size. Impurities, wt % (Table 4): 27.8–31.7 (av. 29.2) Ag, bdl-0.29 Pb, bdl-0.16 Zn, bdl-0.39 S. | |
| P-5707 | Adit No. 4, inset 24 | Quartz-adularia vein with sulfides (acanthite, silver sulfosalts, minerals of the tetrahedrite group, pyrite, galena, sphalerite, chalcopyrite), naumannite and native gold (electrum) | Euhedral crystals and their aggregates 0.3–1 mm in size. Impurities, wt % (Table 4): 27.4–36.1 (av. 31.5) Ag, bdl-0.31 Cu, bdl-0.41 Pb, bdl-0.25 Zn, bdl-1.19 Bi, bdl-0.54 Fe, bdl-0.27 S, bdl-0.75 Se. | |
| P-4581 | Adit No. 4, inset 2 | Quartz-adularia vein with sulfides (acanthite, silver sulfosalts, minerals of the tetrahedrite group, pyrite, galena, sphalerite, chalcopyrite), naumannite and native gold (electrum) | Euhedral crystals and their aggregates 0.1–0.5 mm in size. Impurities, wt % (Table 4): 23.9–28.6 (av. 27.6) Ag, bdl-0.22 As, bdl-0.22 Cu, 0.5–1.5 (av. 1.2) Bi, bdl-0.3 Fe, bdl-0.36 S. | |
| Amurskie Daiki | V-62/3 | Natural outcrop (North-East) | Veinlets of quartz and actinolite-quartz composition with native gold in propylitized and pyritized hybrid porphyries | Aggregates of euhedral crystals 0.1–0.4 mm in size. Impurities, wt % (Table 5): 1.0–2.7 (av. 1.8) Ag, bdl-0.29 Sb, 0.1–0.5 (av. 0.2) Cu, bdl-0.1 S. |
| KP-52 | Natural outcrop (South-West) | K-feldspar-quartz veinlets with native gold in pyritized metasomatites of chlorite-carbonate-albite compositions, developed along cataclastic diorite | Aggregates of euhedral crystals 0.5–3 mm in size. Impurities, wt % (Table 5): 1.8–5.0 (av. 2.6) Ag, 0.1–0.5 (av. 0.3) Cu, bdl-0.1 Fe, bdl-0.1 S. | |
Note: bdl—below detection limit of EMPA (see Section 4.2).
Table 2.
XPS data of native gold samples *.
| Sample No. | Photo-Electron Peak | Binding Energy (eV) | FWHM (eV) a | MPE b | MF c |
|---|---|---|---|---|---|
| KP-52 | Au 4f7/2 | 83.9 | 2.5 | Au(0) | 1 |
| Au 4f5/2 | 87.6 | 2.5 | |||
| V-62/3 | Au 4f7/2 | 83.7 | 3.1 | Au(0) | 1 |
| Au 4f5/2 | 87.4 | 3.1 | |||
| P-5706 | Au 4f7/2 | 84 | 3.5 | Au(0) | 1 |
| Au 4f5/2 | 87.7 | 3.5 | |||
| KK-1 | Au 4f7/2 | 84 | 3.1 | Au(0) | 1 |
| Au 4f5/2 | 87.7 | 3.1 | |||
| P-4581 | Au 4f7/2 | 83.5 | 2.4 | Au(0) | 0.63 |
| Au 4f5/2 | 87.2 | 2.4 | |||
| Au 4f7/2 | 85 | 2.5 | Au(ox) | 0.37 | |
| Au 4f5/2 | 88.6 | 2.5 | |||
| P-5707 | Au 4f7/2 | 84.3 | 2.3 | Au(0) | 0.43 |
| Au 4f5/2 | 88 | 2.3 | |||
| Au 4f7/2 | 85.8 | 2.6 | Au(ox) | 0.57 | |
| Au 4f5/2 | 89.5 | 2.6 | |||
| S 2p3/2 | 160.6 | 2.7 | S2− | 0.44 | |
| S 2p1/2 | 161.8 | 2.7 | |||
| S 2p3/2 | 162.9 | 3 | Sx2− | 0.37 | |
| S 2p1/2 | 164.1 | 3 | |||
| S 2p3/2 | 165.8 | 2.6 | SO32− | 0.19 | |
| S 2p1/2 | 166.9 | 2.6 |
a Full width at half maximum of peak height; b Most probable entities from BE values: Au(0) is zero-valence gold, Au(ox)—Au(I) or Au(III), S2−—sulphide, Sx2−—polysulphide (x > 2), SO32−—sulfite species; c Mole (atomic) fraction (total element = 1) calculated from areas of doublets; * See Table 1 for sample descriptions. The Lorentz contribution to mixed function “Lorentzian + Gaussian” was taken 0.3 as optimal value in all cases.
Table 3.
Peculiarities of surface chemical composition of native gold samples from the Kvartsevaya Sopka deposit according to AES.
Table 3.
Peculiarities of surface chemical composition of native gold samples from the Kvartsevaya Sopka deposit according to AES.
| Sample No. | Atomic Percent * | Ag/Au | (Ag + Au)/S | |||||
|---|---|---|---|---|---|---|---|---|
| Ag | Au | S | O | Cl | Sb | |||
| KK-1 | 12.5 | 3.4 | 12.0 | 4.5 | 1.3 | 2.4 | 3.68 | 1.32 |
| P-4581 | 12.1 | 2.5 | 11.0 | 3.1 | 0.8 | - | 4.84 | 1.33 |
| P-5706 | 4.9 | 2.2 | 8.0 | 3.5 | - | - | 2.23 | 0.89 |
| P-5707 | 12.1 | 3.0 | 21.1 | 3.4 | 0.9 | - | 4.03 | 0.72 |
* Carbon content contributing to the total to reach 100% is not stated.
Table 4.
Representative EPMA analyses of native gold from the Kvartsevaya Sopka deposit (wt %).
| n | Au | Ag | As | Te | Se | Cu | Pb | Zn | Bi | Fe | S | Total |
|---|---|---|---|---|---|---|---|---|---|---|---|---|
| Natural Outcrop, Trench 203. Sample P-5706 | ||||||||||||
| Grain 1 | ||||||||||||
| 1 | 67.76 | 30.86 | < | < | < | < | < | < | < | < | 0.19 | 98.81 |
| 2 | 69.96 | 28.40 | < | < | < | < | < | < | < | < | < | 98.36 |
| 3 | 70.01 | 28.47 | < | < | < | < | < | < | < | < | 0.13 | 98.61 |
| 4 | 70.02 | 29.08 | < | 0.15 | < | < | < | < | < | < | < | 99.25 |
| Grain 2 | ||||||||||||
| 5 | 67.46 | 31.55 | < | < | < | 0.13 | < | < | < | < | 0.34 | 99.48 |
| 6 | 68.47 | 31.30 | < | 0.17 | < | < | < | < | < | < | 0.54 | 100.48 |
| 7 | 68.53 | 31.75 | < | 0.12 | < | < | < | < | < | < | 0.35 | 100.75 |
| 8 | 66.84 | 32.55 | < | < | < | < | < | < | < | < | 0.50 | 99.90 |
| Adit 2, rise 1. Sample KK-1 (depth from the surface 50 m) | ||||||||||||
| Grain 1 | ||||||||||||
| 9 | 67.07 | 31.71 | < | < | < | < | < | < | < | < | 0.39 | 99.17 |
| 10 | 68.97 | 29.25 | < | < | < | < | < | < | < | < | 0.14 | 98.36 |
| 11 | 69.45 | 30.65 | < | < | < | < | 0.29 | < | < | < | < | 100.39 |
| Grain 2 | ||||||||||||
| 12 | 70.47 | 27.83 | < | 0.12 | < | < | < | < | < | < | 0.21 | 98.63 |
| 13 | 70.79 | 28.53 | < | 0.15 | < | < | 0.19 | < | < | < | 0.14 | 99.80 |
| 14 | 70.85 | 28.07 | < | 0.13 | < | < | < | < | < | < | 0.15 | 99.20 |
| 15 | 70.54 | 28.13 | < | < | < | < | 0.15 | 0.16 | < | < | < | 98.98 |
| Adit 4, inset 24. Sample P-5707 (depth from the surface 150 m) | ||||||||||||
| Grain 1 | ||||||||||||
| 16 | 70.66 | 28.45 | < | < | < | < | < | < | < | 0.10 | 0.10 | 99.31 |
| 17 | 70.72 | 27.99 | < | < | < | < | < | < | < | 0.12 | 0.12 | 98.95 |
| 18 | 70.91 | 27.69 | < | < | < | < | < | < | < | < | 0.16 | 98.76 |
| Grain 2 | ||||||||||||
| 19 | 70.16 | 28.85 | < | < | < | < | < | < | < | < | 0.19 | 99.20 |
| 20 | 70.19 | 28.25 | < | < | < | < | 0.10 | < | < | 0.10 | 0.17 | 98.81 |
| 21 | 71.97 | 27.35 | < | < | < | < | 0.18 | < | < | < | < | 99.50 |
| Grain 3 | ||||||||||||
| 22 | 63.83 | 34.91 | < | < | < | 0.28 | < | 0.25 | < | < | 0.27 | 99.54 |
| 23 | 62.11 | 36.11 | < | < | < | 0.31 | < | < | < | 0.54 | < | 99.07 |
| 24 | 63.66 | 35.50 | < | < | < | < | < | 0.24 | < | < | 0.27 | 99.67 |
| 25 | 63.76 | 33.85 | < | < | < | < | 0.41 | < | 1.19 | < | 0.17 | 99.38 |
| 26 | 64.28 | 34.62 | < | < | 0.75 | < | < | < | < | < | < | 99.65 |
| 27 | 63.87 | 34.62 | < | < | 0.67 | < | < | < | < | < | < | 99.16 |
| Adit 4, inset 2. Sample P-4581 (depth from the surface 150 m) | ||||||||||||
| Grain 1 | ||||||||||||
| 28 | 70.08 | 28.08 | < | < | < | 0.09 | < | < | 1.16 | 0.18 | 0.36 | 99.95 |
| 29 | 69.53 | 28.57 | < | < | < | < | < | < | 1.44 | < | 0.18 | 99.72 |
| 30 | 70.19 | 28.24 | 0.12 | < | < | 0.12 | < | < | 1.01 | 0.14 | 0.21 | 100.03 |
| 31 | 70.05 | 28.35 | < | < | < | 0.11 | < | < | 1.12 | 0.16 | 0.12 | 99.91 |
| Grain 2 | ||||||||||||
| 32 | 70.07 | 28.50 | < | < | < | 0.22 | < | < | 1.12 | < | 0.22 | 100.13 |
| 33 | 71.49 | 26.33 | 0.22 | < | < | 0.08 | < | < | 1.46 | 0.19 | 0.28 | 100.05 |
| 34 | 71.09 | 23.95 | 0.14 | < | < | < | < | < | 1.05 | 0.15 | 0.24 | 96.62 |
| Grain 3 | ||||||||||||
| 35 | 71.92 | 26.21 | < | < | < | 0.06 | < | < | 1.31 | 0.30 | < | 99.80 |
| 36 | 70.08 | 28.21 | 0.08 | < | < | 0.06 | < | < | 1.41 | < | 0.16 | 100.00 |
| 37 | 70.36 | 27.78 | 0.13 | < | < | 0.05 | < | < | 1.28 | 0.12 | 0.08 | 99.80 |
| 38 | 70.22 | 29.23 | 0.06 | < | < | 0.06 | < | < | 0.50 | < | < | 100.07 |
Note: Hg, Sb, Mo, W, Sn, Co, Ni, Cd not established. Here and in Table 3: n—measuring points in grains, <—below detection limit.
Table 5.
Representative EPMA analyses of native gold from the Amurskie Daiki deposit (wt %).
| n | Au | Ag | Sb | Cu | Fe | S | Total |
|---|---|---|---|---|---|---|---|
| Natural Outcrop (North-East). Profile V. Sample V-62/3 | |||||||
| Grain 1 | |||||||
| 1 | 98.92 | 1.39 | 0.22 | 0.09 | < | 0.11 | 100.73 |
| 2 | 98.42 | 1.23 | < | 0.52 | < | < | 100.17 |
| 3 | 98.11 | 2.25 | < | 0.33 | < | < | 100.69 |
| 4 | 98.24 | 2.54 | < | 0.32 | < | < | 101.10 |
| 5 | 98.42 | 1.24 | < | 0.23 | < | < | 99.89 |
| Grain 2 | |||||||
| 6 | 98.21 | 2.26 | 0.22 | 0.28 | < | 0.10 | 101.07 |
| 7 | 98.21 | 2.36 | 0.23 | 0.23 | < | < | 101.03 |
| 8 | 98.30 | 2.47 | < | 0.21 | < | < | 100.98 |
| 9 | 98.04 | 2.70 | < | 0.29 | < | 0.10 | 101.13 |
| 10 | 99.71 | 1.23 | 0.29 | 0.09 | < | < | 101.32 |
| 11 | 98.30 | 2.50 | < | 0.20 | < | < | 101.00 |
| Grain 3 | |||||||
| 12 | 98.76 | 0.99 | < | 0.17 | < | < | 99.92 |
| 13 | 99.01 | 1.06 | < | 0.12 | < | 0.10 | 100.29 |
| 14 | 99.18 | 1.06 | < | 0.16 | < | < | 100.40 |
| 15 | 98.42 | 1.77 | < | 0.18 | < | < | 100.37 |
| 16 | 98.11 | 2.20 | < | 0.11 | < | < | 100.42 |
| 17 | 98.52 | 1.62 | < | 0.17 | < | < | 100.31 |
| Natural outcrop (South-West). Profile III. Sample KP-52 | |||||||
| Grain 1 | |||||||
| 18 | 97.55 | 2.06 | < | 0.27 | < | < | 99.88 |
| 19 | 96.34 | 2.15 | < | 0.08 | < | < | 98.57 |
| 20 | 96.96 | 1.83 | < | 0.19 | < | < | 98.98 |
| 21 | 96.13 | 2.74 | < | 0.08 | < | 0.09 | 99.04 |
| 22 | 97.23 | 1.80 | < | 0.21 | < | < | 99.24 |
| Grain 2 | |||||||
| 23 | 97.46 | 2.28 | < | 0.11 | < | 0.10 | 99.95 |
| 24 | 97.73 | 2.33 | < | 0.44 | < | < | 100.50 |
| 25 | 97.58 | 2.23 | < | 0.33 | < | < | 100.14 |
| 26 | 97.49 | 2.28 | < | 0.53 | 0.11 | 0.10 | 100.51 |
| 27 | 95.71 | 4.25 | < | 0.31 | 0.07 | 0.08 | 100.42 |
| 28 | 95.48 | 4.95 | < | 0.26 | 0.12 | 0.11 | 100.92 |
Note: Hg, As, Se, Pb, Zn, W, Mo, Sn, Co, Ni, Cd not established.
Table 6.
SEM-EDX data of sulfur, selenium, silver, and gold contents (at %) and their ratios in the sectors of native gold enriched with sulfur (from the Kvartsevaya Sopka deposit).
Table 6.
SEM-EDX data of sulfur, selenium, silver, and gold contents (at %) and their ratios in the sectors of native gold enriched with sulfur (from the Kvartsevaya Sopka deposit).
| Sample No. | S | Se | Ag | Au | Ag/Au | (Ag + Au)/(S + Se) |
|---|---|---|---|---|---|---|
| KK-1 | 22.69 | 3.27 | 39.29 | 1.91 | 20.57 | 1.59 |
| 23.76 | 0.87 | 43.47 | 0.2 | 217.35 | 1.77 | |
| 23.57 | 1.61 | 28.53 | 4.08 | 6.99 | 2.23 | |
| 23.57 | 2.63 | 40.81 | 3.09 | 13.21 | 1.68 | |
| P-4581 | 29.55 | 3.19 | 45.86 | 2.46 | 18.64 | 1.48 |
| 29.4 | 3.3 | 46.55 | 2.43 | 19.16 | 1.5 | |
| 27.23 | 3.95 | 46.04 | 4.62 | 9.97 | 1.62 | |
| 26.57 | 0.8 | 37.45 | 12.52 | 2.99 | 1.83 | |
| 21.8 | 3.09 | 33.08 | 9.51 | 3.48 | 1.71 | |
| 20.56 | - | 29.51 | 11.42 | 2.58 | 1.99 | |
| 24.32 | - | 34.33 | 13.11 | 2.62 | 1.95 | |
| 26.3 | - | 40.4 | 14.21 | 2.84 | 2.08 | |
| P-5706 | 30.47 | 1.97 | 44.73 | 3.04 | 14.71 | 1.47 |
| 30.72 | 1.71 | 46.37 | 2.84 | 16.33 | 1.52 | |
| P-5707 | 18.12 | 2.37 | 45.49 | 10.24 | 4.44 | 2.72 |
| 15.93 | 2.25 | 46.32 | 7.86 | 5.89 | 2.98 | |
| 26.75 | - | 42.73 | 12.58 | 3.4 | 2.07 | |
| 35.13 | - | 35.76 | 15.69 | 2.28 | 1.46 | |
| 31.89 | 2.02 | 43.69 | 1.25 | 34.95 | 1.33 |
Note: dash stands for the concentration below the limit of detection; data for the points with the composition close to uytenbogaardtite (Ag/Au = 3, (Ag + Au)/(S + Se) = 2) are highlighted in italics.
© 2017 by the authors. Licensee MDPI, Basel, Switzerland. This article is an open access article distributed under the terms and conditions of the Creative Commons Attribution (CC BY) license (http://creativecommons.org/licenses/by/4.0/).
Share and Cite
MDPI and ACS Style
Tauson, V.L.; Kravtsova, R.G.; Makshakov, A.S.; Lipko, S.V.; Arsent’ev, K.Y. Contrasting Surficial Composition of Native Gold from Two Different Types of Gold Ore Deposits. Minerals 2017, 7, 142. https://doi.org/10.3390/min7080142
AMA Style
Tauson VL, Kravtsova RG, Makshakov AS, Lipko SV, Arsent’ev KY. Contrasting Surficial Composition of Native Gold from Two Different Types of Gold Ore Deposits. Minerals. 2017; 7(8):142. https://doi.org/10.3390/min7080142
Chicago/Turabian StyleTauson, Vladimir L., Raisa G. Kravtsova, Artem S. Makshakov, Sergey V. Lipko, and Kirill Yu. Arsent’ev. 2017. "Contrasting Surficial Composition of Native Gold from Two Different Types of Gold Ore Deposits" Minerals 7, no. 8: 142. https://doi.org/10.3390/min7080142
Note that from the first issue of 2016, this journal uses article numbers instead of page numbers. See further details here.