Article

Vertical Heterogeneity of the Shale Reservoir in the Lower Silurian Longmaxi Formation: Analogy between the Southeastern and Northeastern Sichuan Basin, SW China

1
Coal Reservoir Laboratory of National Engineering Research Center of CBM Development & Utilization, China University of Geosciences, Beijing 100083, China
2
Shandong Provincial Key Laboratory of Depositional Mineralization & Sedimentary Minerals, Shandong University of Science and Technology, Qingdao 266590, China
3
Department of Energy and Mineral Engineering, G3 Center and EME Energy Institute, Pennsylvania State University, University Park, PA 16802, USA
4
SINOPEC Petroleum Exploration & Production Research Institute, Beijing 100083, China
*
Author to whom correspondence should be addressed.
Minerals 2017, 7(8), 151; https://doi.org/10.3390/min7080151
Submission received: 19 June 2017 / Revised: 10 August 2017 / Accepted: 16 August 2017 / Published: 18 August 2017

Abstract

:
Lower Silurian Longmaxi formation (LSL) shale is widely and continuously distributed in the northeastern Sichuan Basin and, based on structural analogies with the gas producing LSL formation in the southeastern Sichuan Basin, has significant potential for shale gas exploration. However, limited research has been performed to evaluate the shale gas potential in this region. Samples from a recently completed exploratory well (Well-WQ2) in the northeastern Sichuan Basin indicate that the LSL shale has a vertical property sequence that closely resembles the vertical property sequences in wells in the gas-producing sections of the southeastern Sichuan Basin. The continuous sampling and analyses of Well-WQ2 have allowed a detailed investigation of the vertical variations in lithofacies, mineral characteristics, pore structures, and organic geochemical characteristics. The Longmaxi formation was divided into two third-order sequences (SQ1 and SQ2) based on systematic core observations and well logging analyses. Both SQ1 and SQ2 include a transgressive system tract (TST) and a high-stand system tract (HST). The lithofacies exhibit an upward decrease in the organic content. From SQ1 to SQ2, the quartz content, in situ graptolite content, total organic carbon (TOC) content, and brittleness index decrease, but the clay mineral content increases. The LSL shale sections from depths of 1204 to 1214 m and from 1271 to 1282 m possess well-developed fractures and high permeability. Additionally, the average porosity and permeability in SQ1 are higher than those in SQ2. In addition, the positive correlation between the TOC and quartz contents of the assayed samples suggests that much of the quartz is of biogenic origin. Changes in the sedimentary and diagenetic environments during deposition are two key factors that contribute to the observed vertical heterogeneity of the Longmaxi formation. In conclusion, the shale sections of the lower part of the SQ1, like their analogs in the southeastern Sichuan Basin, are the most favorable targets for shale gas production in the northeastern Sichuan Basin.

1. Introduction

Shale gas is an unconventional natural gas trapped in shale formations, which act as both the source and the reservoir [1]. As a clean and efficient energy source, shale gas has become an increasingly significant resource worldwide [2,3,4,5,6]. The exploration and exploitation of shale gas has accelerated in recent years, with significant progress made in the Sichuan Basin of Southern China [7,8].
The main hydrocarbon source rocks in the Sichuan Basin include the Lower Cambrian, Upper Ordovician, Lower Silurian, Lower Permian, and Upper Permian formations [9,10]. Among these, the Lower Silurian Longmaxi Formation (abbreviated as LSL) marine shale is a significant shale gas reserve with prolific production potential. LSL shale produced approximately 1.8 × 10⁸ m3 (6.3 Bcf) of gas in 2013 in the southeastern Sichuan Basin, with an overall estimated recoverable resource of 8.1 × 10¹² m3 (286.5 Tcf) [7]. LSL shale has become the most favored target stratum for shale gas recovery in China. Recent investigations of the LSL shale in the southeastern and eastern Sichuan Basin area have probed the geochemical characteristics [10], pore development characteristics [11], and methane adsorption capacity [12]. However, few investigations have evaluated the shale gas potential in the northeastern Sichuan Basin. A newly completed shale gas exploration well (Well-WQ2) in the northeastern Sichuan Basin has confirmed the high gas content of LSL shale, which suggests that this region may potentially be the next giant production field in the Sichuan Basin [13]. Well logs, observations, and experiments using cores from Well-Q2 provide a unique window to explore the lithofacies, mineral composition, organic matter, and petrophysical properties of the LSL shale in the northeastern Sichuan Basin. Based on the evaluation of the first exploration well, this study provides insights regarding the shale gas potential in the study area from a geological view.
Vertical heterogeneity is ubiquitous in both conventional and unconventional oil/gas reservoirs due to the variations in sedimentation, diagenesis, and tectonism during formation [8,14,15]. This vertical heterogeneity can result in variations in the gas permeability, gas storage capacity, and porosity [16] and, therefore, exerts a significant influence on gas flow and transport in the reservoir [17]. In addition, vertical heterogeneity is important in predicting the propagation of hydraulic fractures [18,19]. The significant vertical heterogeneity present in many hydrocarbon reservoirs has been well documented, including in the Mississippian reservoir in North America [20], the Permian reservoir in west Texas [21], and Yanchang-formation shale in Central China [22]. The vertical heterogeneity of shale gas reservoirs ranges from the microscale to the basin scale and is significantly more complex than the vertical heterogeneity of other conventional or unconventional reservoirs [23]. Vertical heterogeneity has far-reaching implications for shale gas exploitation and exploration, especially for targeting the production section of a formation and the drilling of horizontal wells or for hydrofracturing in very thick shale strata. In this study, we complete a systematic investigation of the LSL shale of Well-WQ2 to define the vertical heterogeneity of the lithofacies related to the mineral composition, total organic carbon (TOC) content, maturity of organic matter, and physical reservoir properties. Based on the investigation of the well and the comparison with a commercial gas production well in the southeastern Sichuan basin, we evaluate the shale gas production potential in the northeastern Sichuan basin.

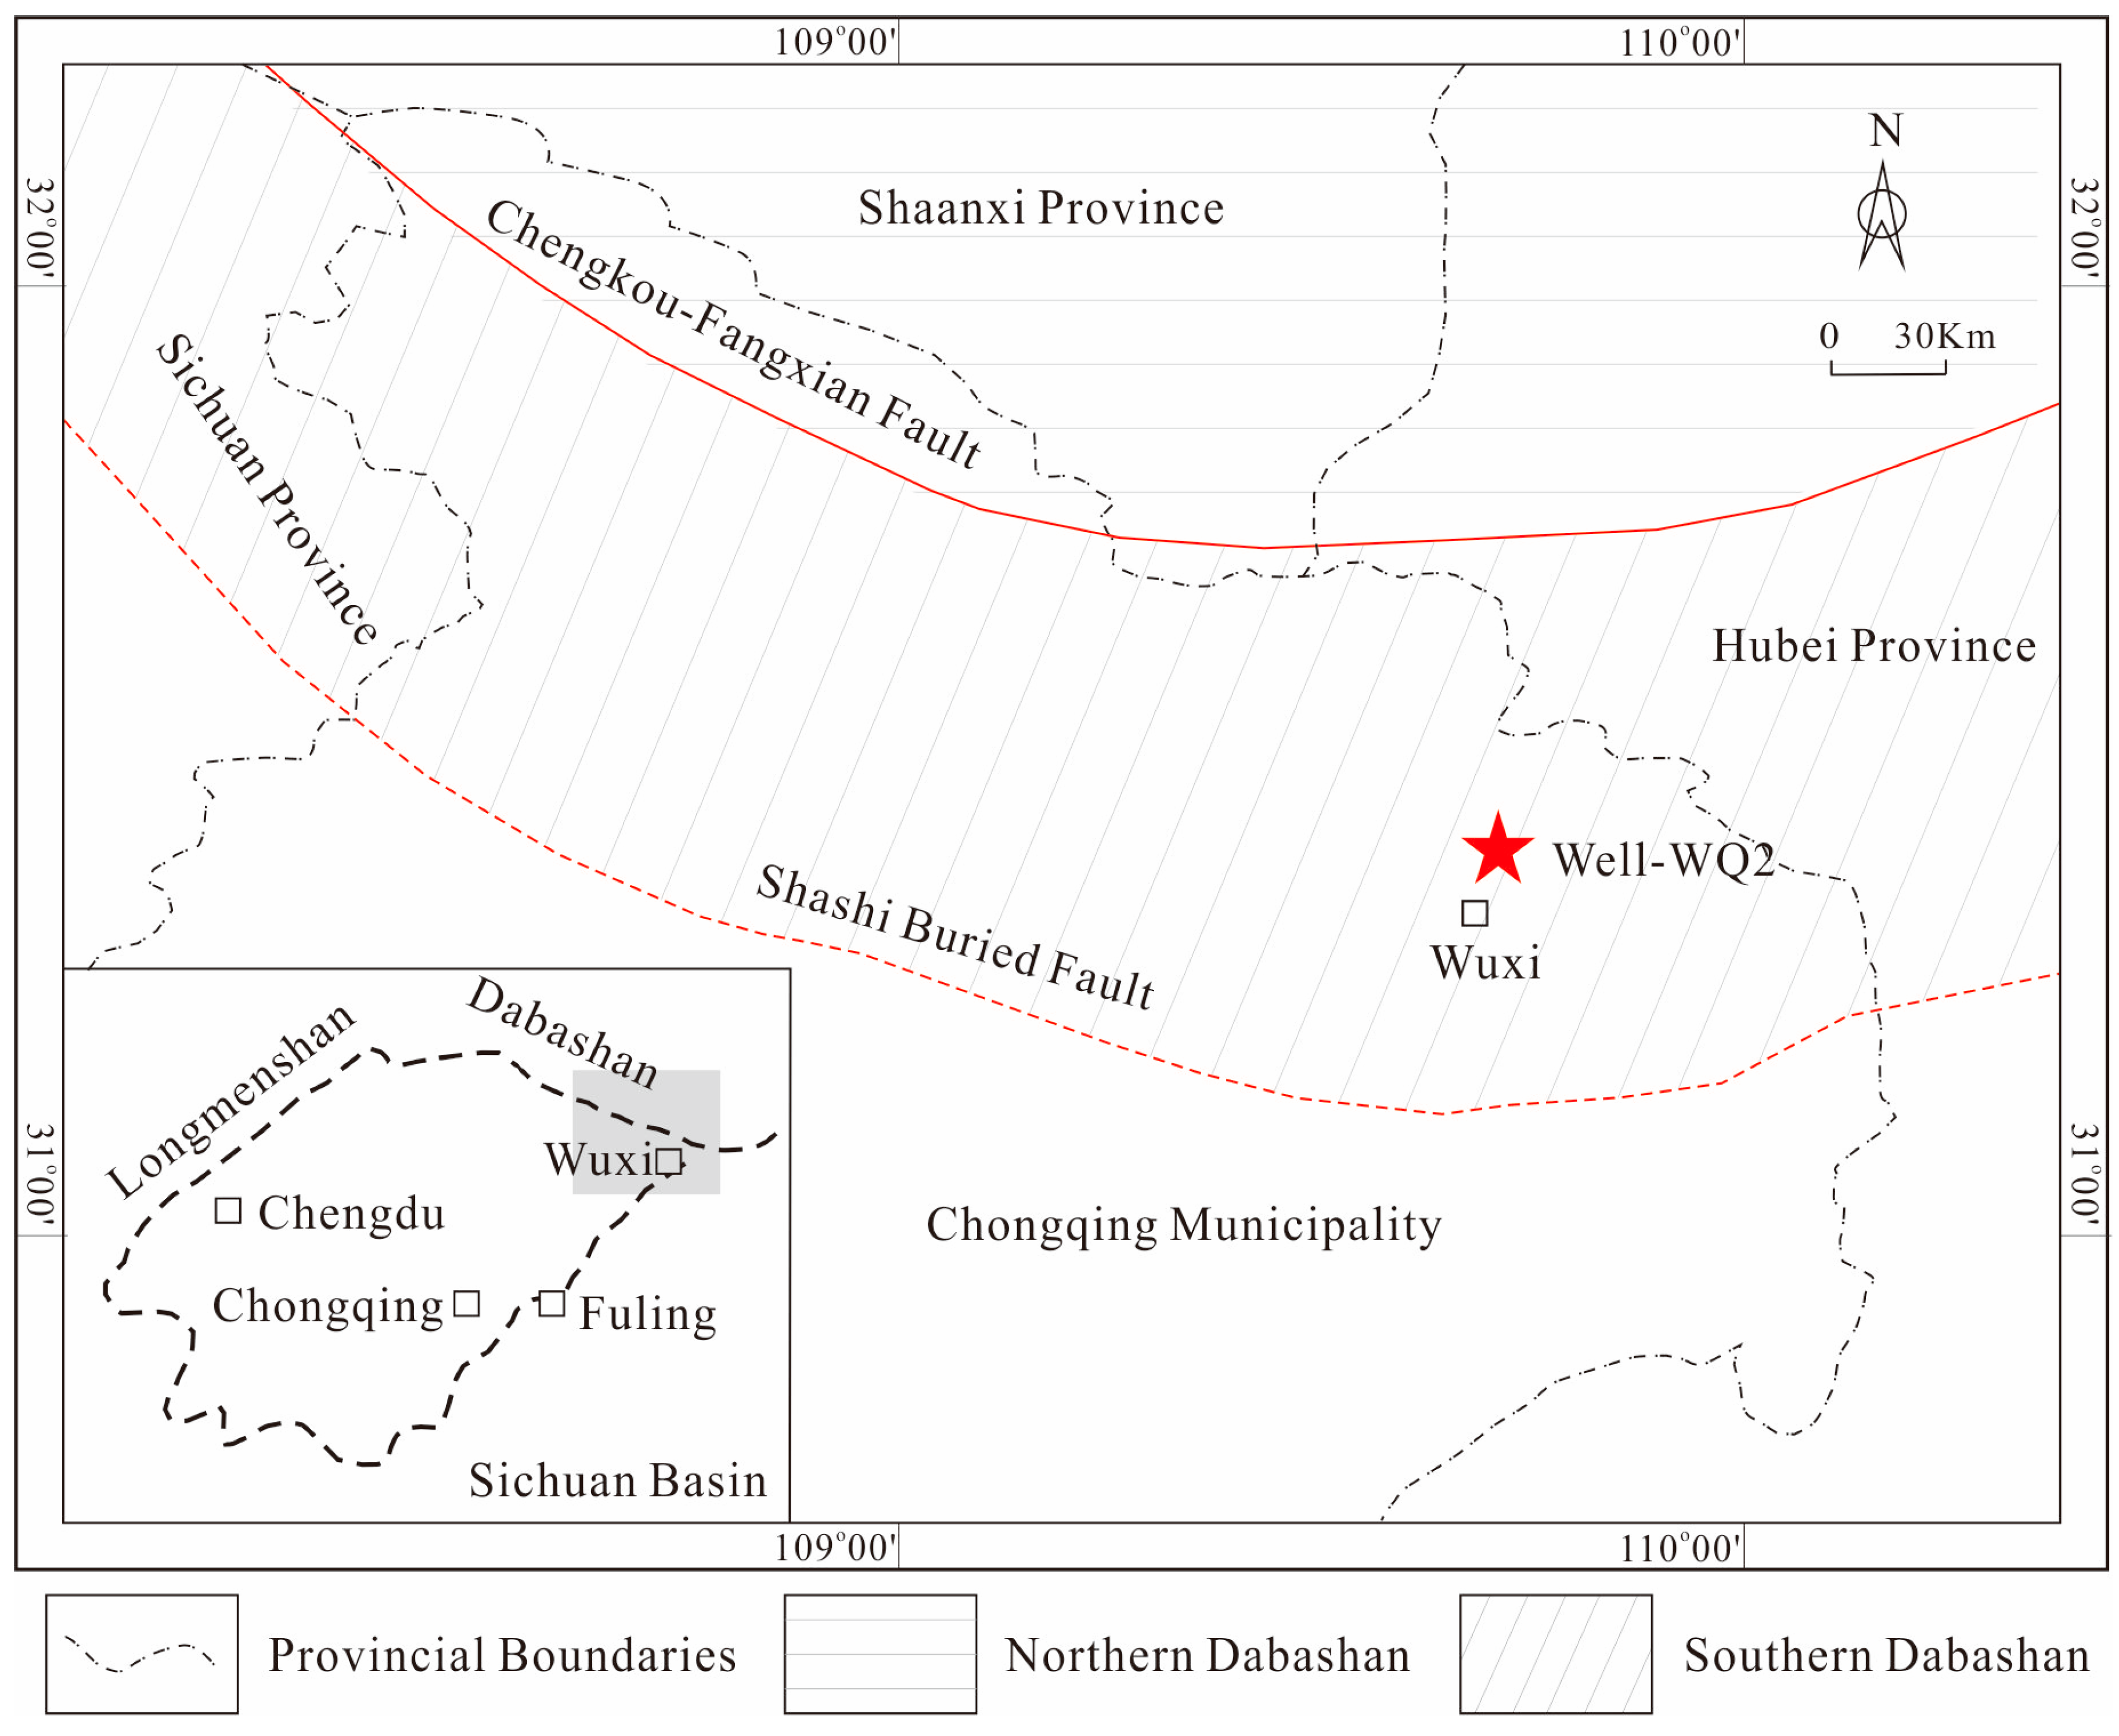
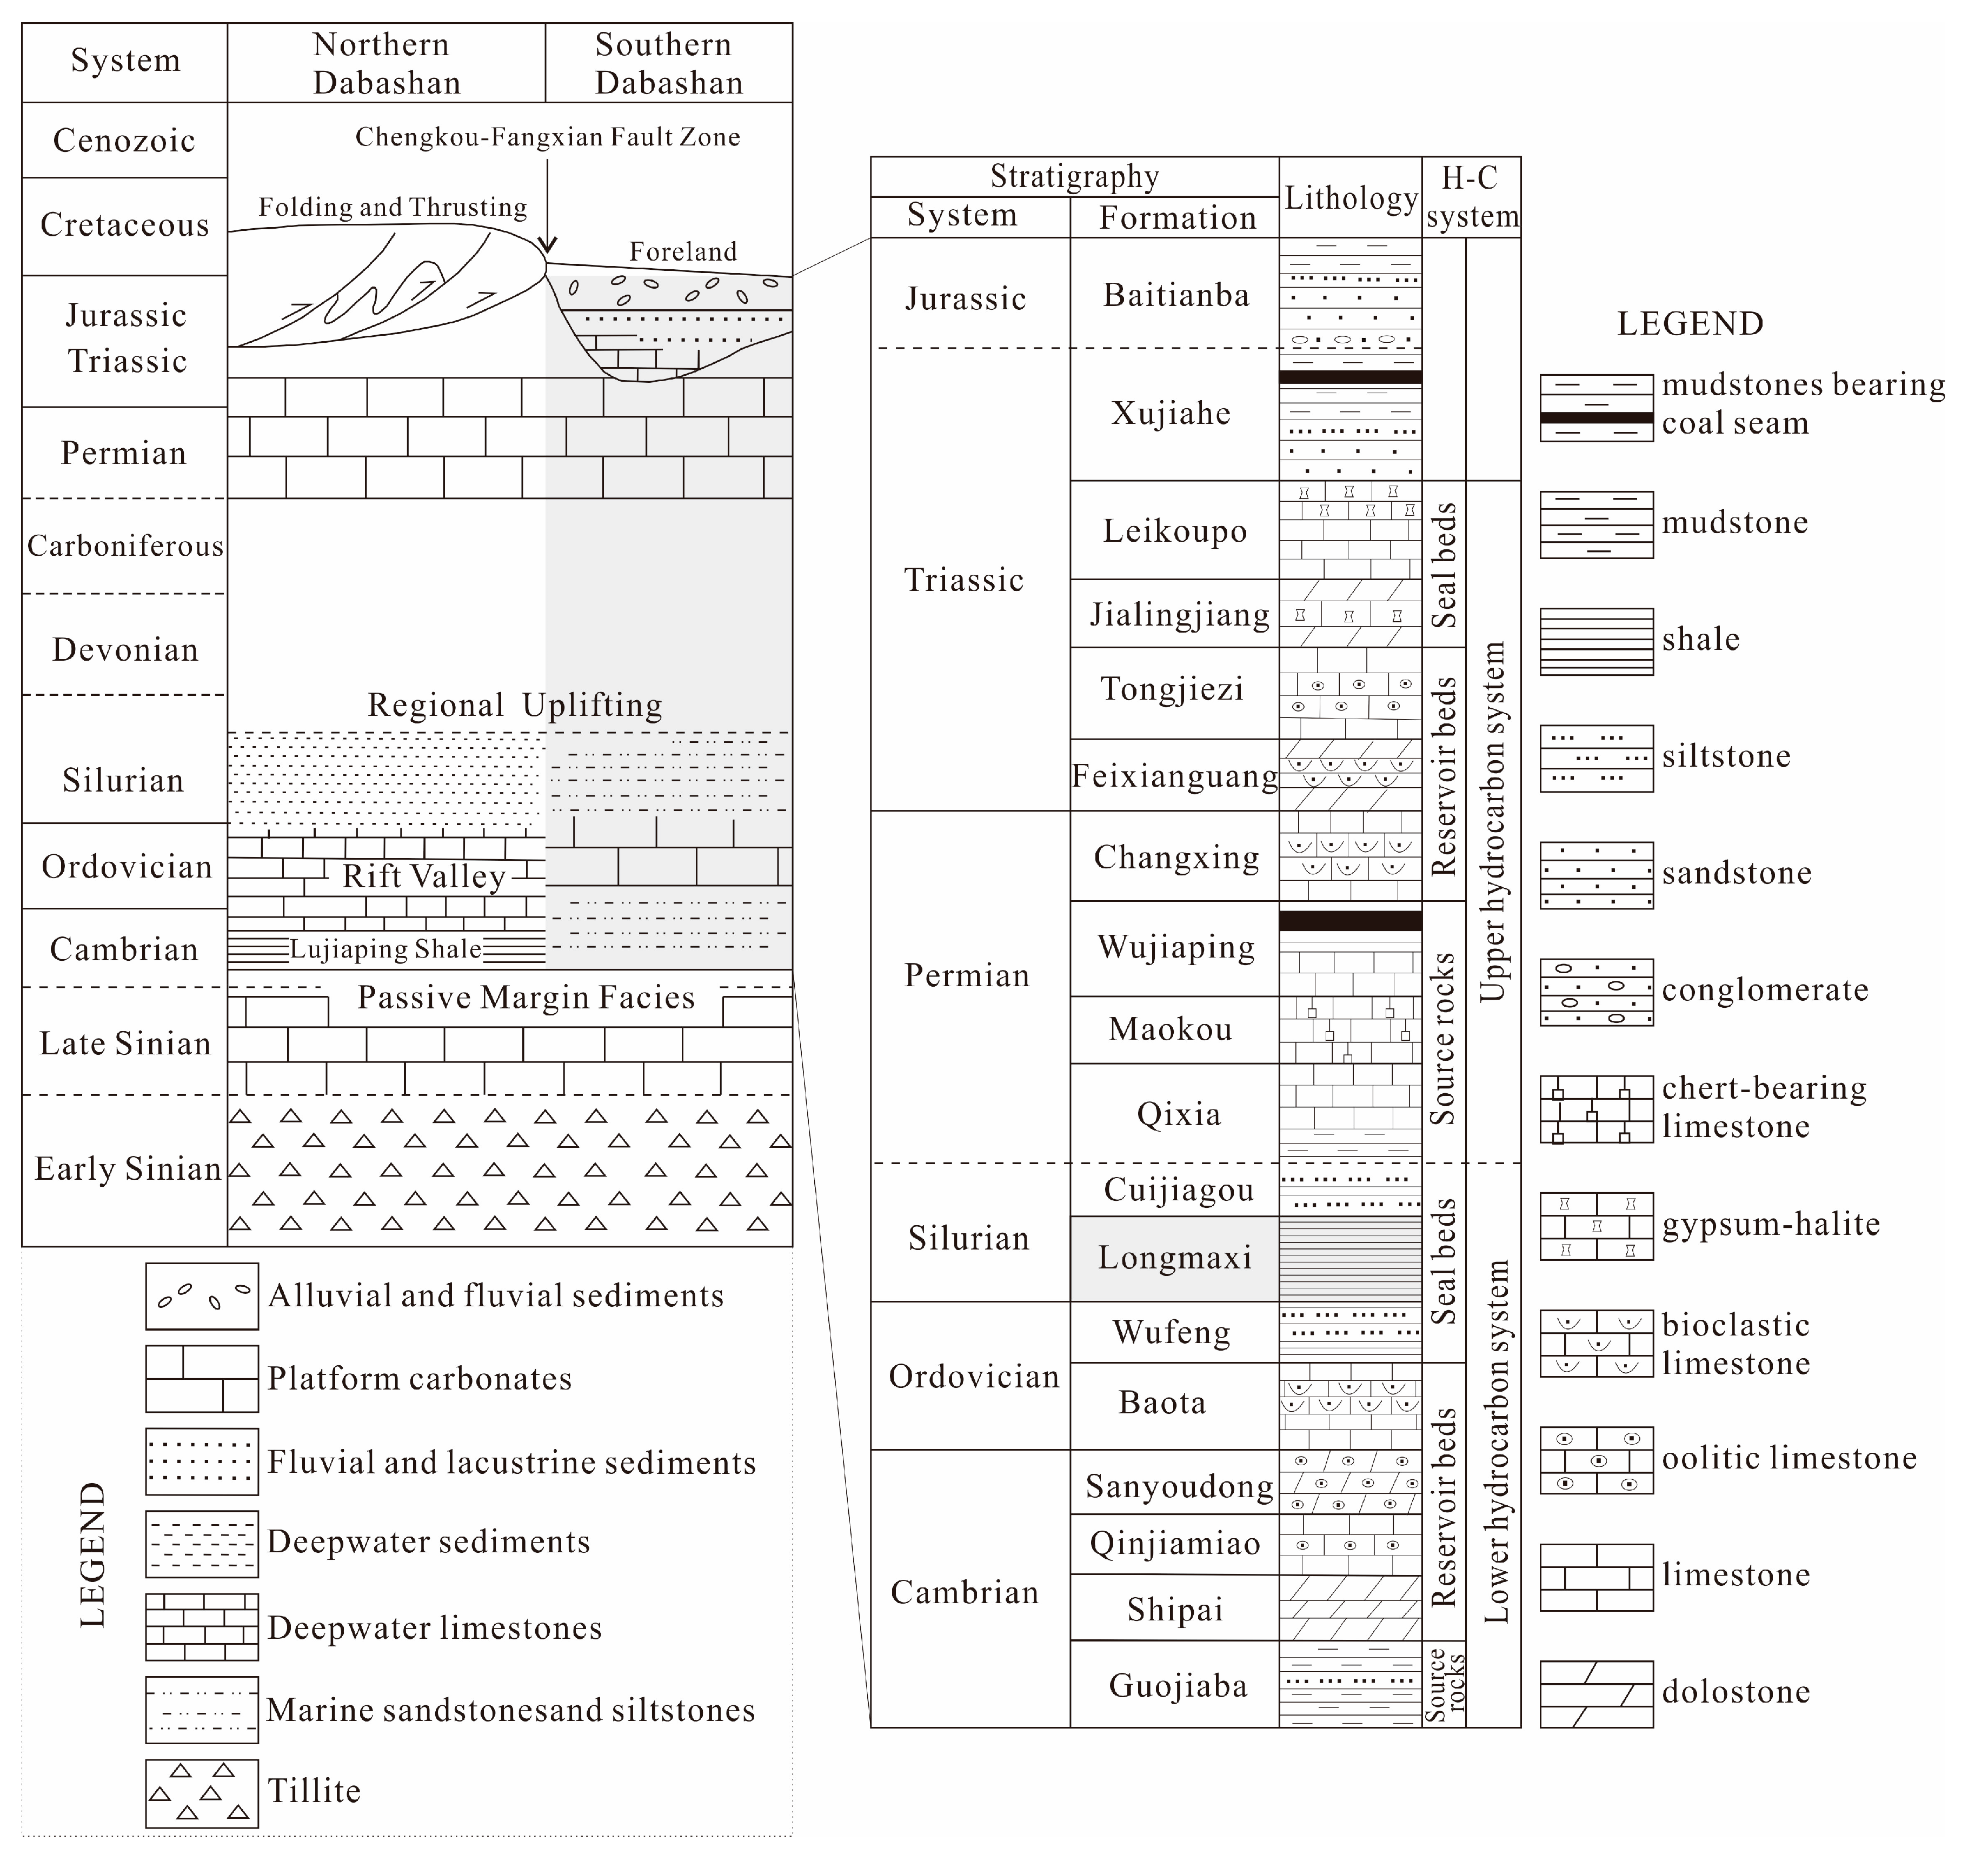
2. Geological Setting

The northeastern Sichuan Basin covers most parts of the Chongqing Municipality in SW China and some parts of the Sichuan, Shaanxi, and Hubei Provinces (Figure 1). The history of tectonic activity can be divided into three periods: from the Mesoproterozoic to the Neoproterozoic (1600 to 800 Ma), from the Nanhua Period to the Triassic (800 to 200 Ma), and after the Jurassic (since 200 Ma) [12]. These periods of tectonic activity have resulted in the formation of an arc tectonic belt system with a thrust belt trending to the southwest in the northeastern Sichuan Basin (Figure 1). The Chengkou-Fangxian Fault is a typical example of the tectonics in this region. It divides the Dabashan arc-like thrust fold belt into the northern- and southern-Dabashan regions (Figure 1) [24,25]. The study area is located in the southern Dabashan region (Figure 1).
Figure 2 shows the sedimentary succession in the study area from the Late Sinian to the Cenozoic Era, where the sedimentary strata are continuous, except for the stratigraphic gap in the Devonian to the Carboniferous Period [26]. Previous studies have indicated that there are two conventional hydrocarbon source systems in the study area (Figure 2). The lower hydrocarbon system comprises the formations from the Cambrian Guojiaba Formation to the Silurian Cuijiagou Formation, while the upper hydrocarbon system encompasses the formations from the Permian Qixia Formation to the Triassic Leikoupo Formation (Figure 2). The LSL formation is the key seal of the lower conventional hydrocarbon system and the source and reservoir rock of unconventional natural gas in the northeastern Sichuan Basin. The thickness of this formation ranges from 20 to 100 m [27].

3. Sampling and Analytic Methods

The thickness of the LSL shale in Well-WQ2 is 85 m (Figure 3). In the 85 m-thick section, nineteen shale core samples were collected from top to bottom at a spacing of ~4 m between adjacent samples (Figure 3). Each core sample has a uniform diameter of 7 cm, a length of 10 to 16 cm, and a weight of 0.97 to 1.42 kg. The lithofacies and petrological characteristics were recorded prior to transport to the laboratory. These core samples were drilled into cylindrical plugs (2.5 to 5 cm long and 2.5 cm in diameter), and the cuttings were retained.
Conventional helium porosimetry and nitrogen permeability measurements were made on the core plugs. The remaining core cuttings were crushed into small blocks or powdered for X-ray diffraction (XRD), imaging using a scanning electron microscope (SEM), and measurements of the TOC content and vitrinite reflectance (Ro). All the experiments were performed at Chongqing Mineral Resources Supervisory Test Center, Ministry of Land and Resources. Crushed samples were mixed with ethanol, hand ground, and then smear mounted on glass slides for XRD analysis, as a semi-quantitative technique for the estimation of mineral percentages. Cu Kα radiation was applied using a ZJ207 diffractometer at 40 kV and 40 mA. The relative mineral percentages were calculated using the area under the curve of the major intensity peak of each mineral, with a correction for Lorentz polarization [28].
TOC analysis was performed using a ZJ294 type TOC analyzer after removing the carbonates with dilute hydrochloric acid based on the method of Pan et al. [2]. The TOC content was calculated from the peak area of CO2 resulting from the combustion of organic matter and calibrated using carbon in steel [2]. The Ro of the shale was calibrated from bitumen reflectance (simply Rb), which was determined with polished core samples under reflected light and measured using a ZJ257 microscope photometer with an immersion objective. The calibration method was based on that proposed by Jacob [29], namely, Ro = 0.618 × Rb + 0.4. The Ro of each sample is an average calibrated statistic of 20 random measurements of Rb.

4. Results and Discussion

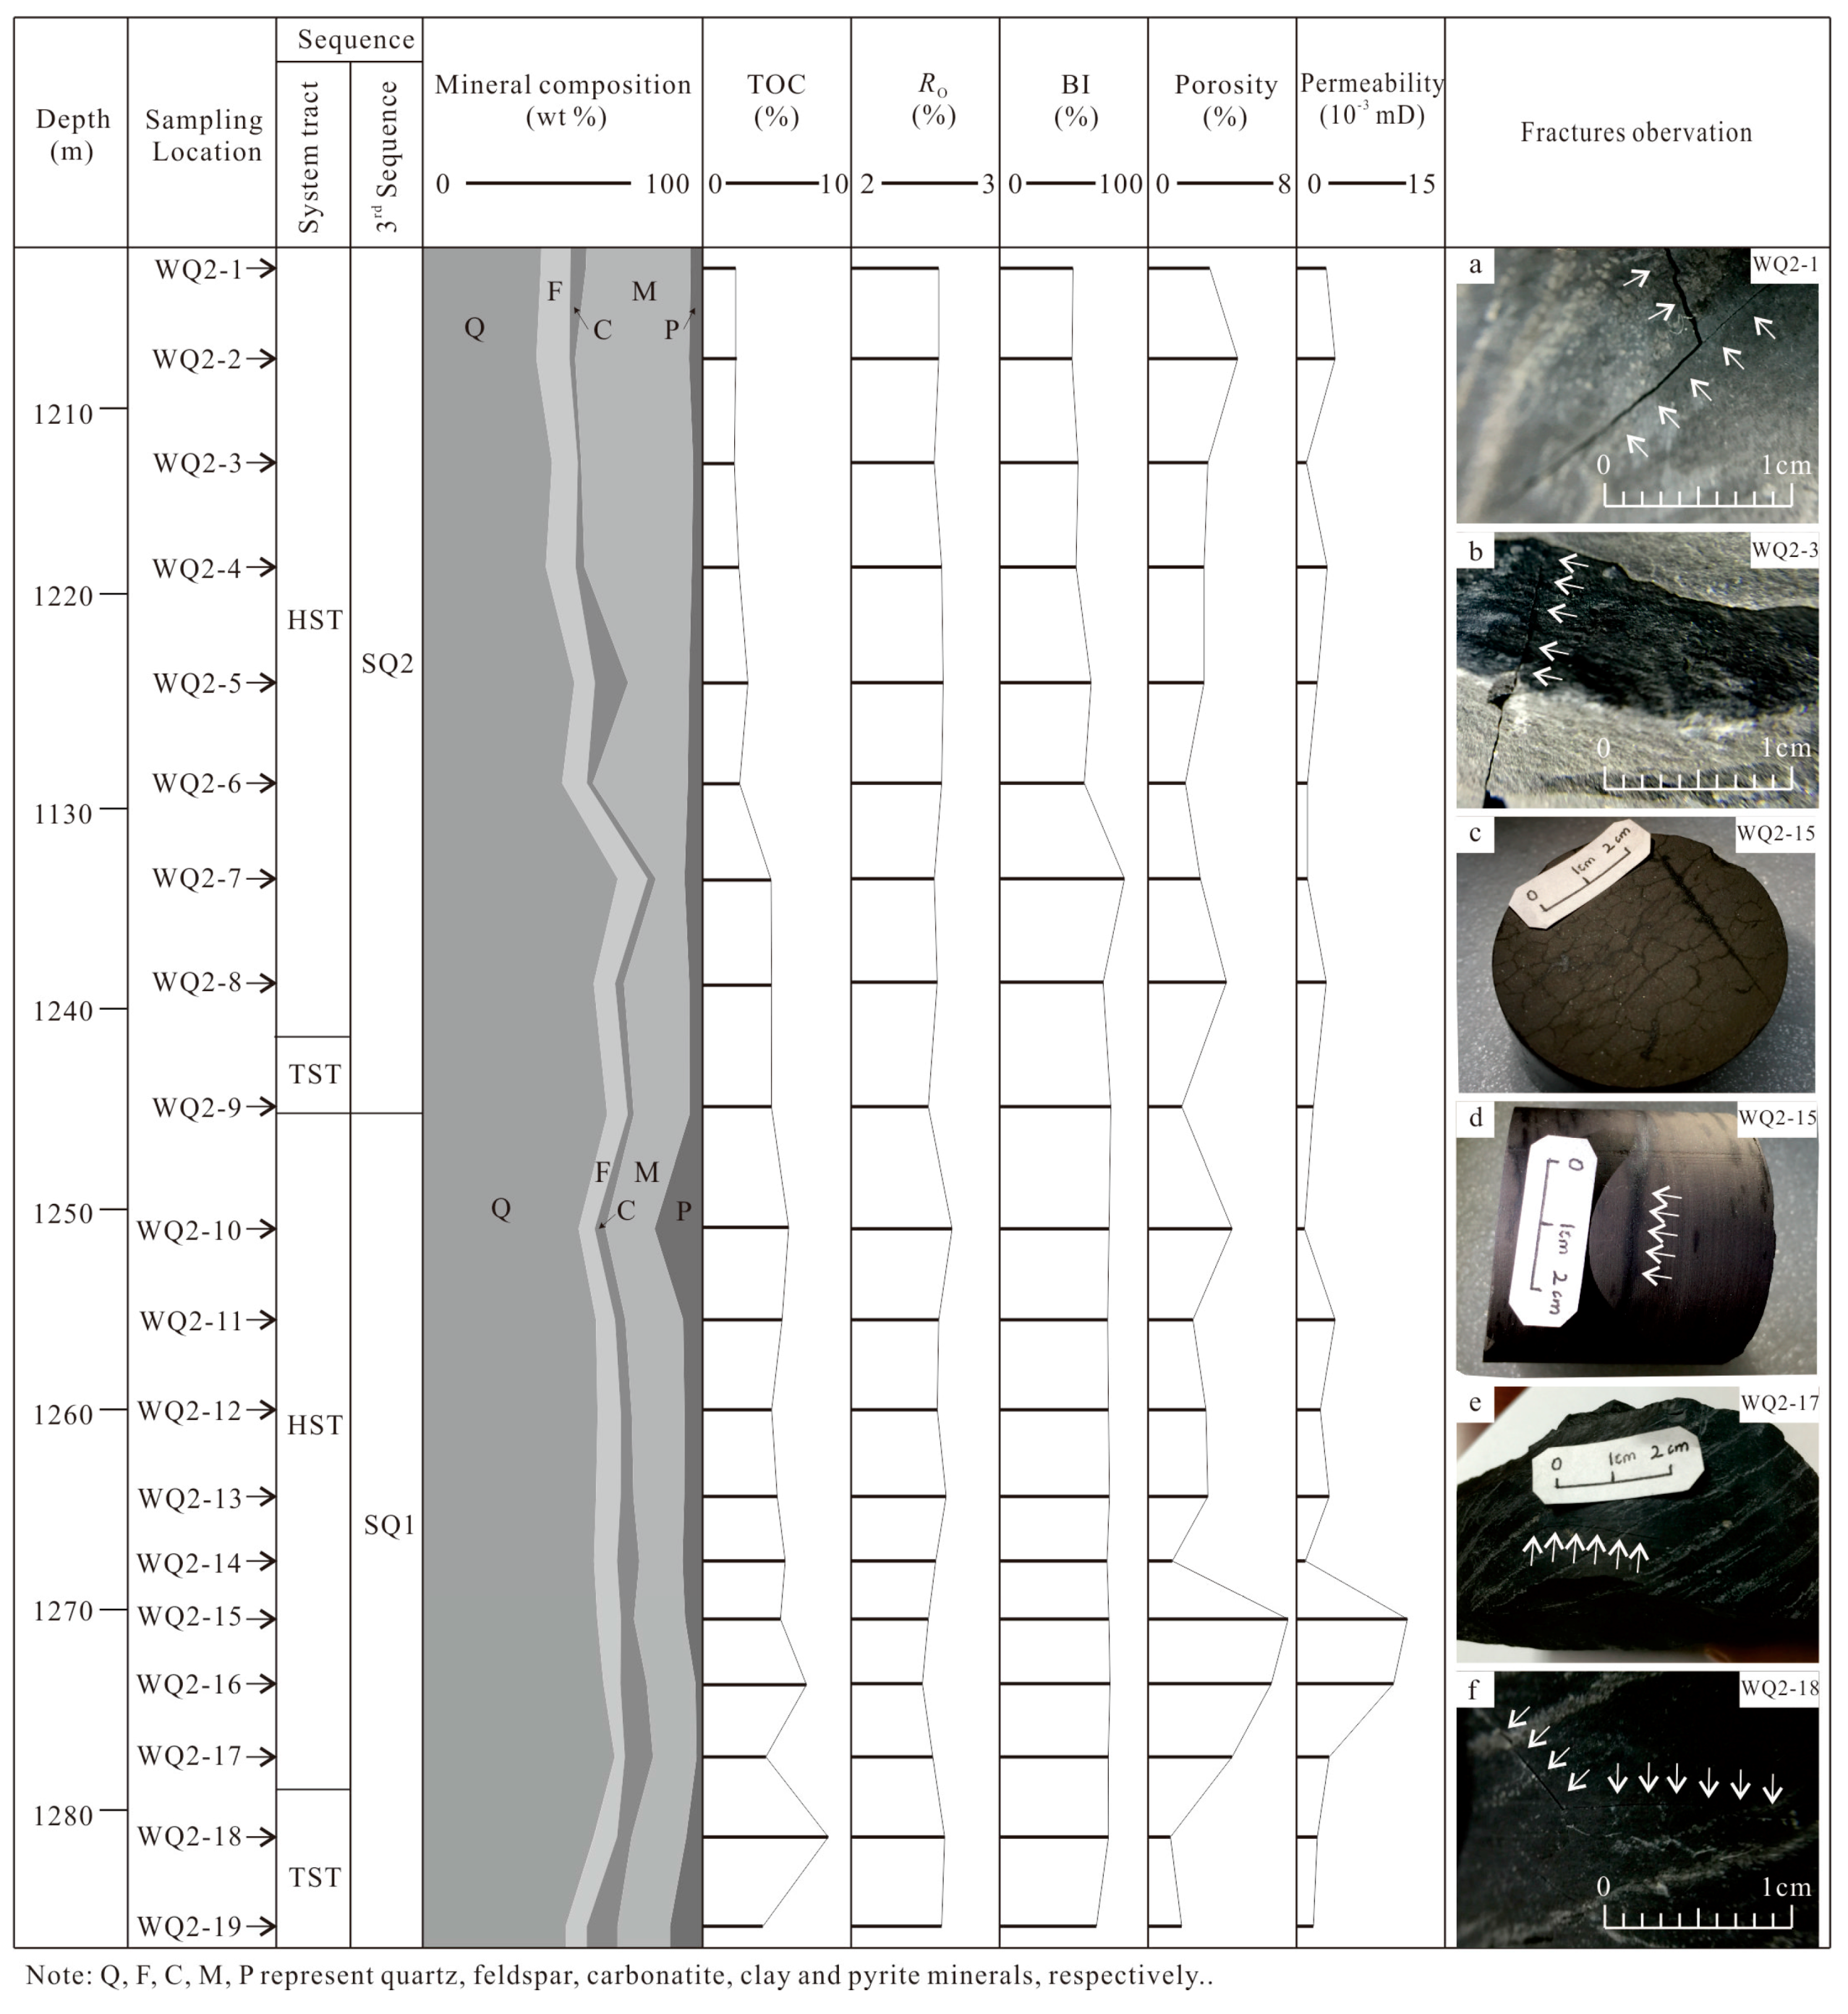
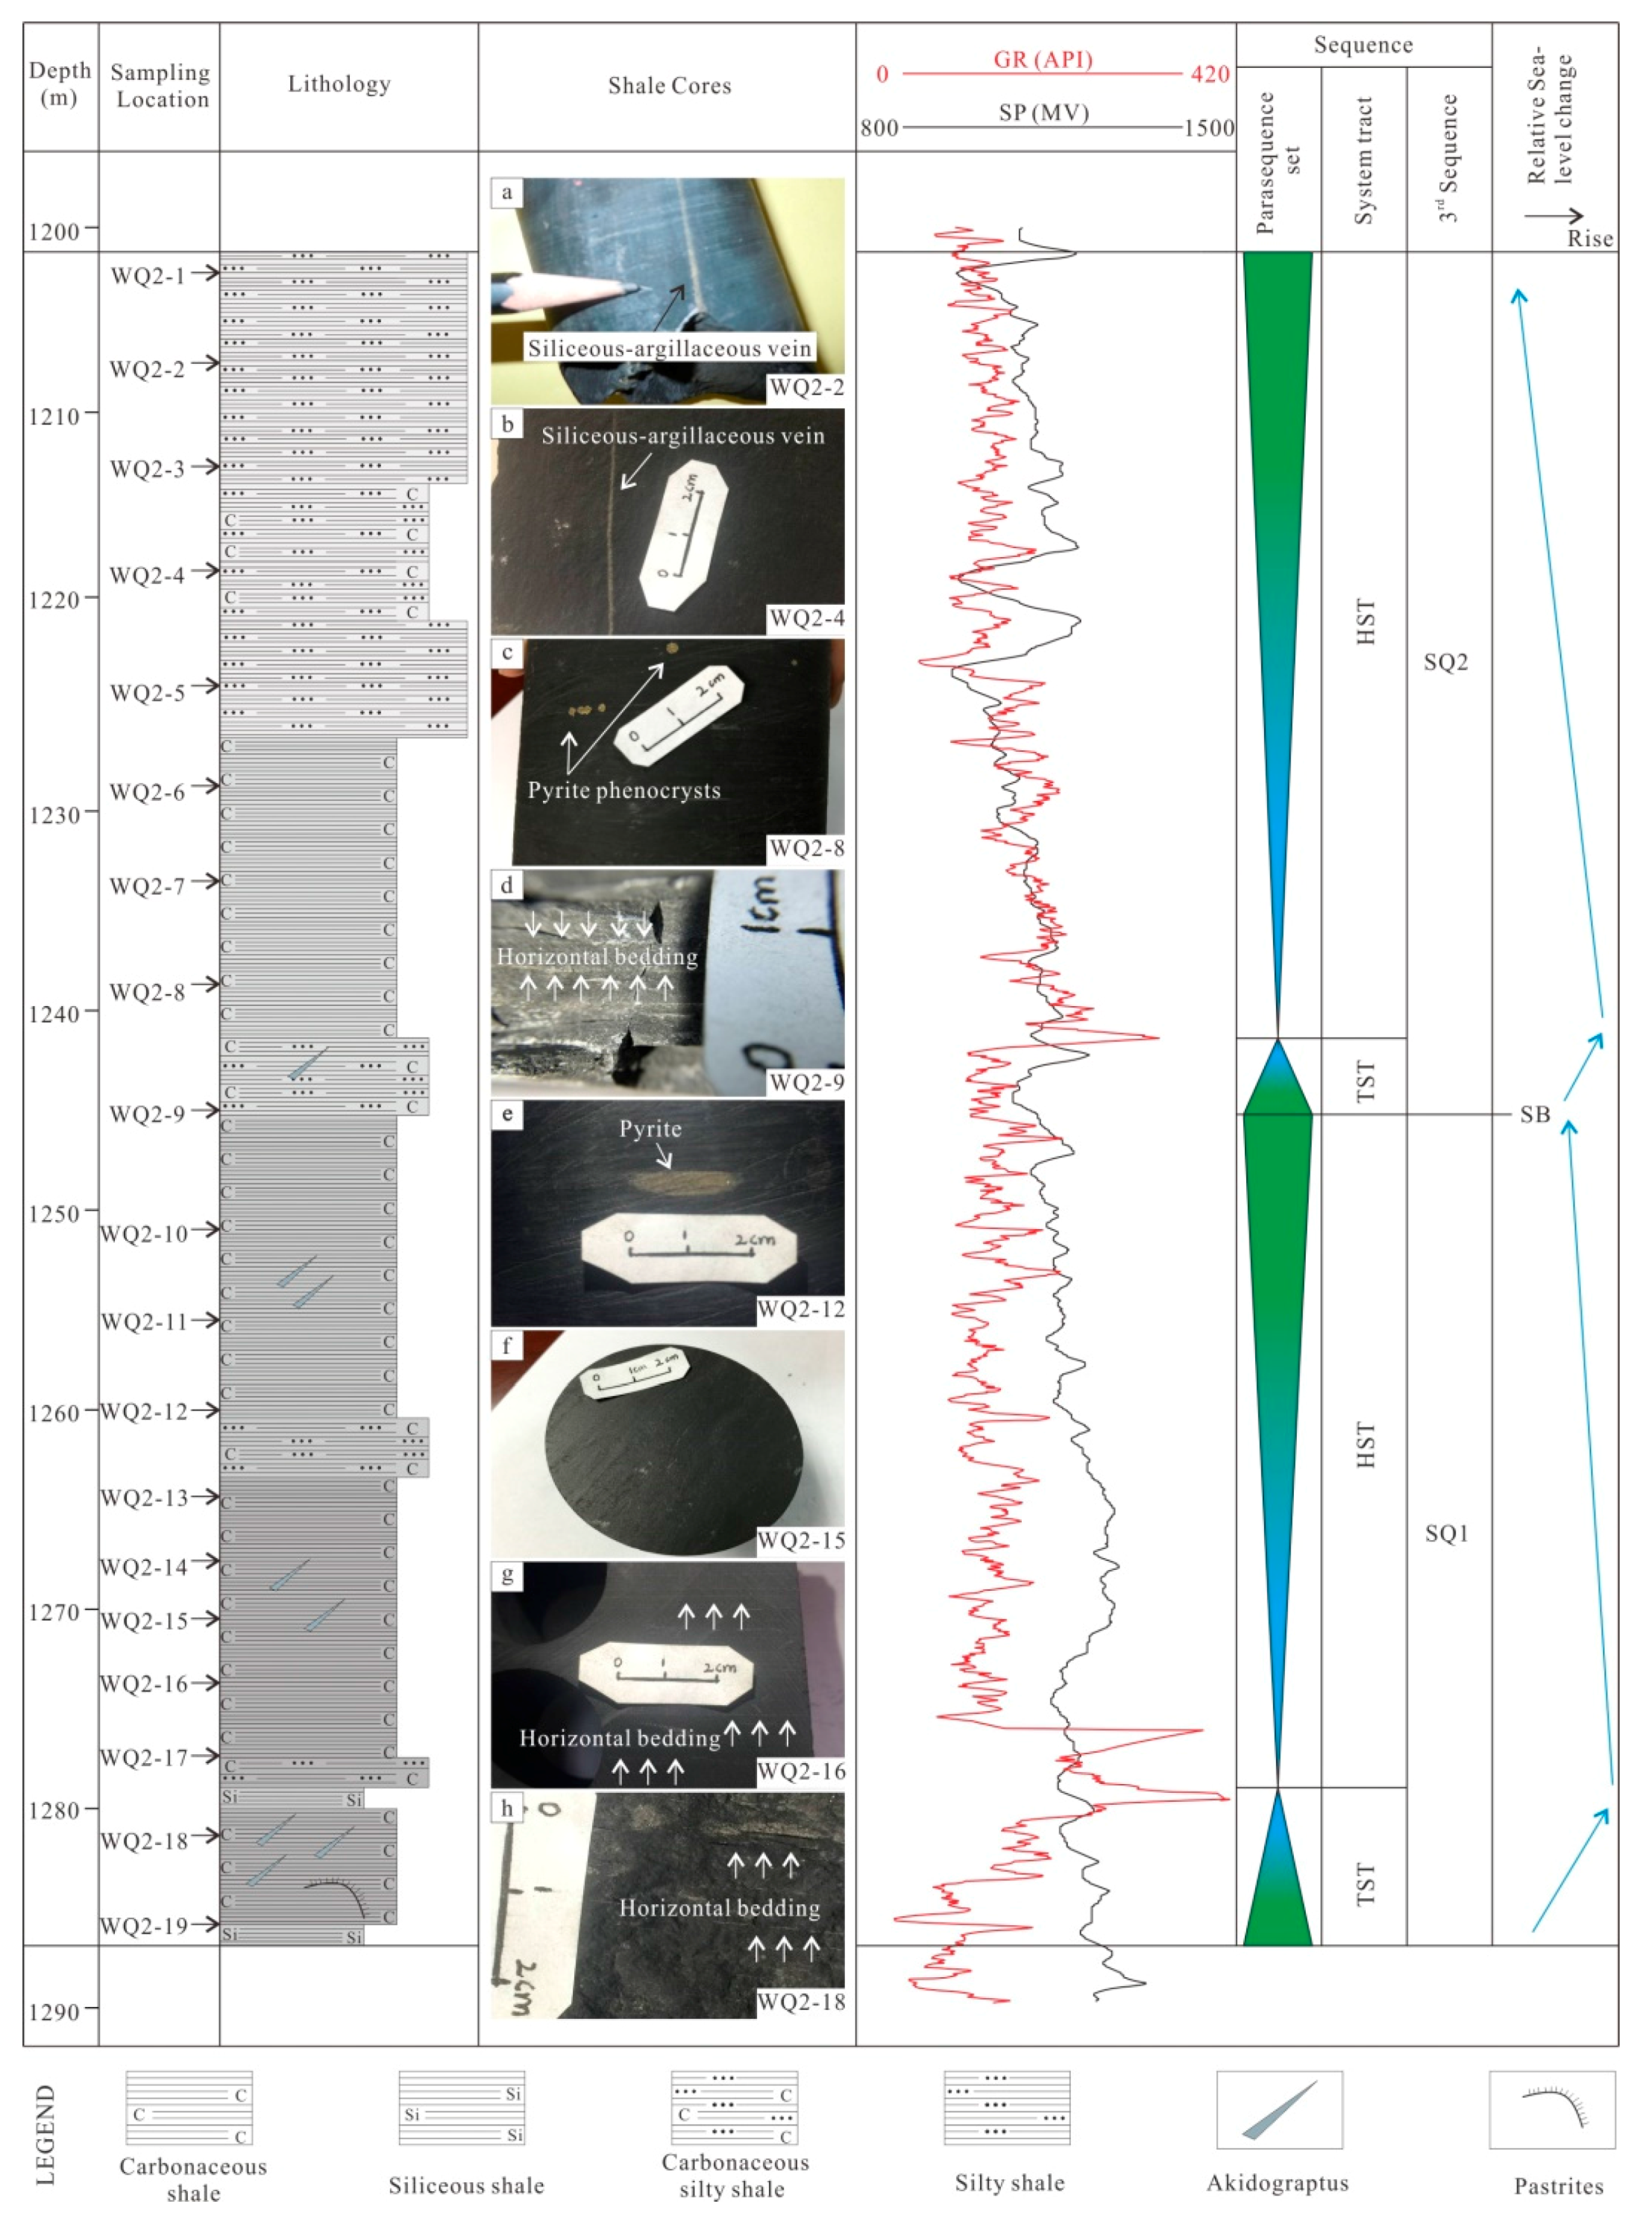
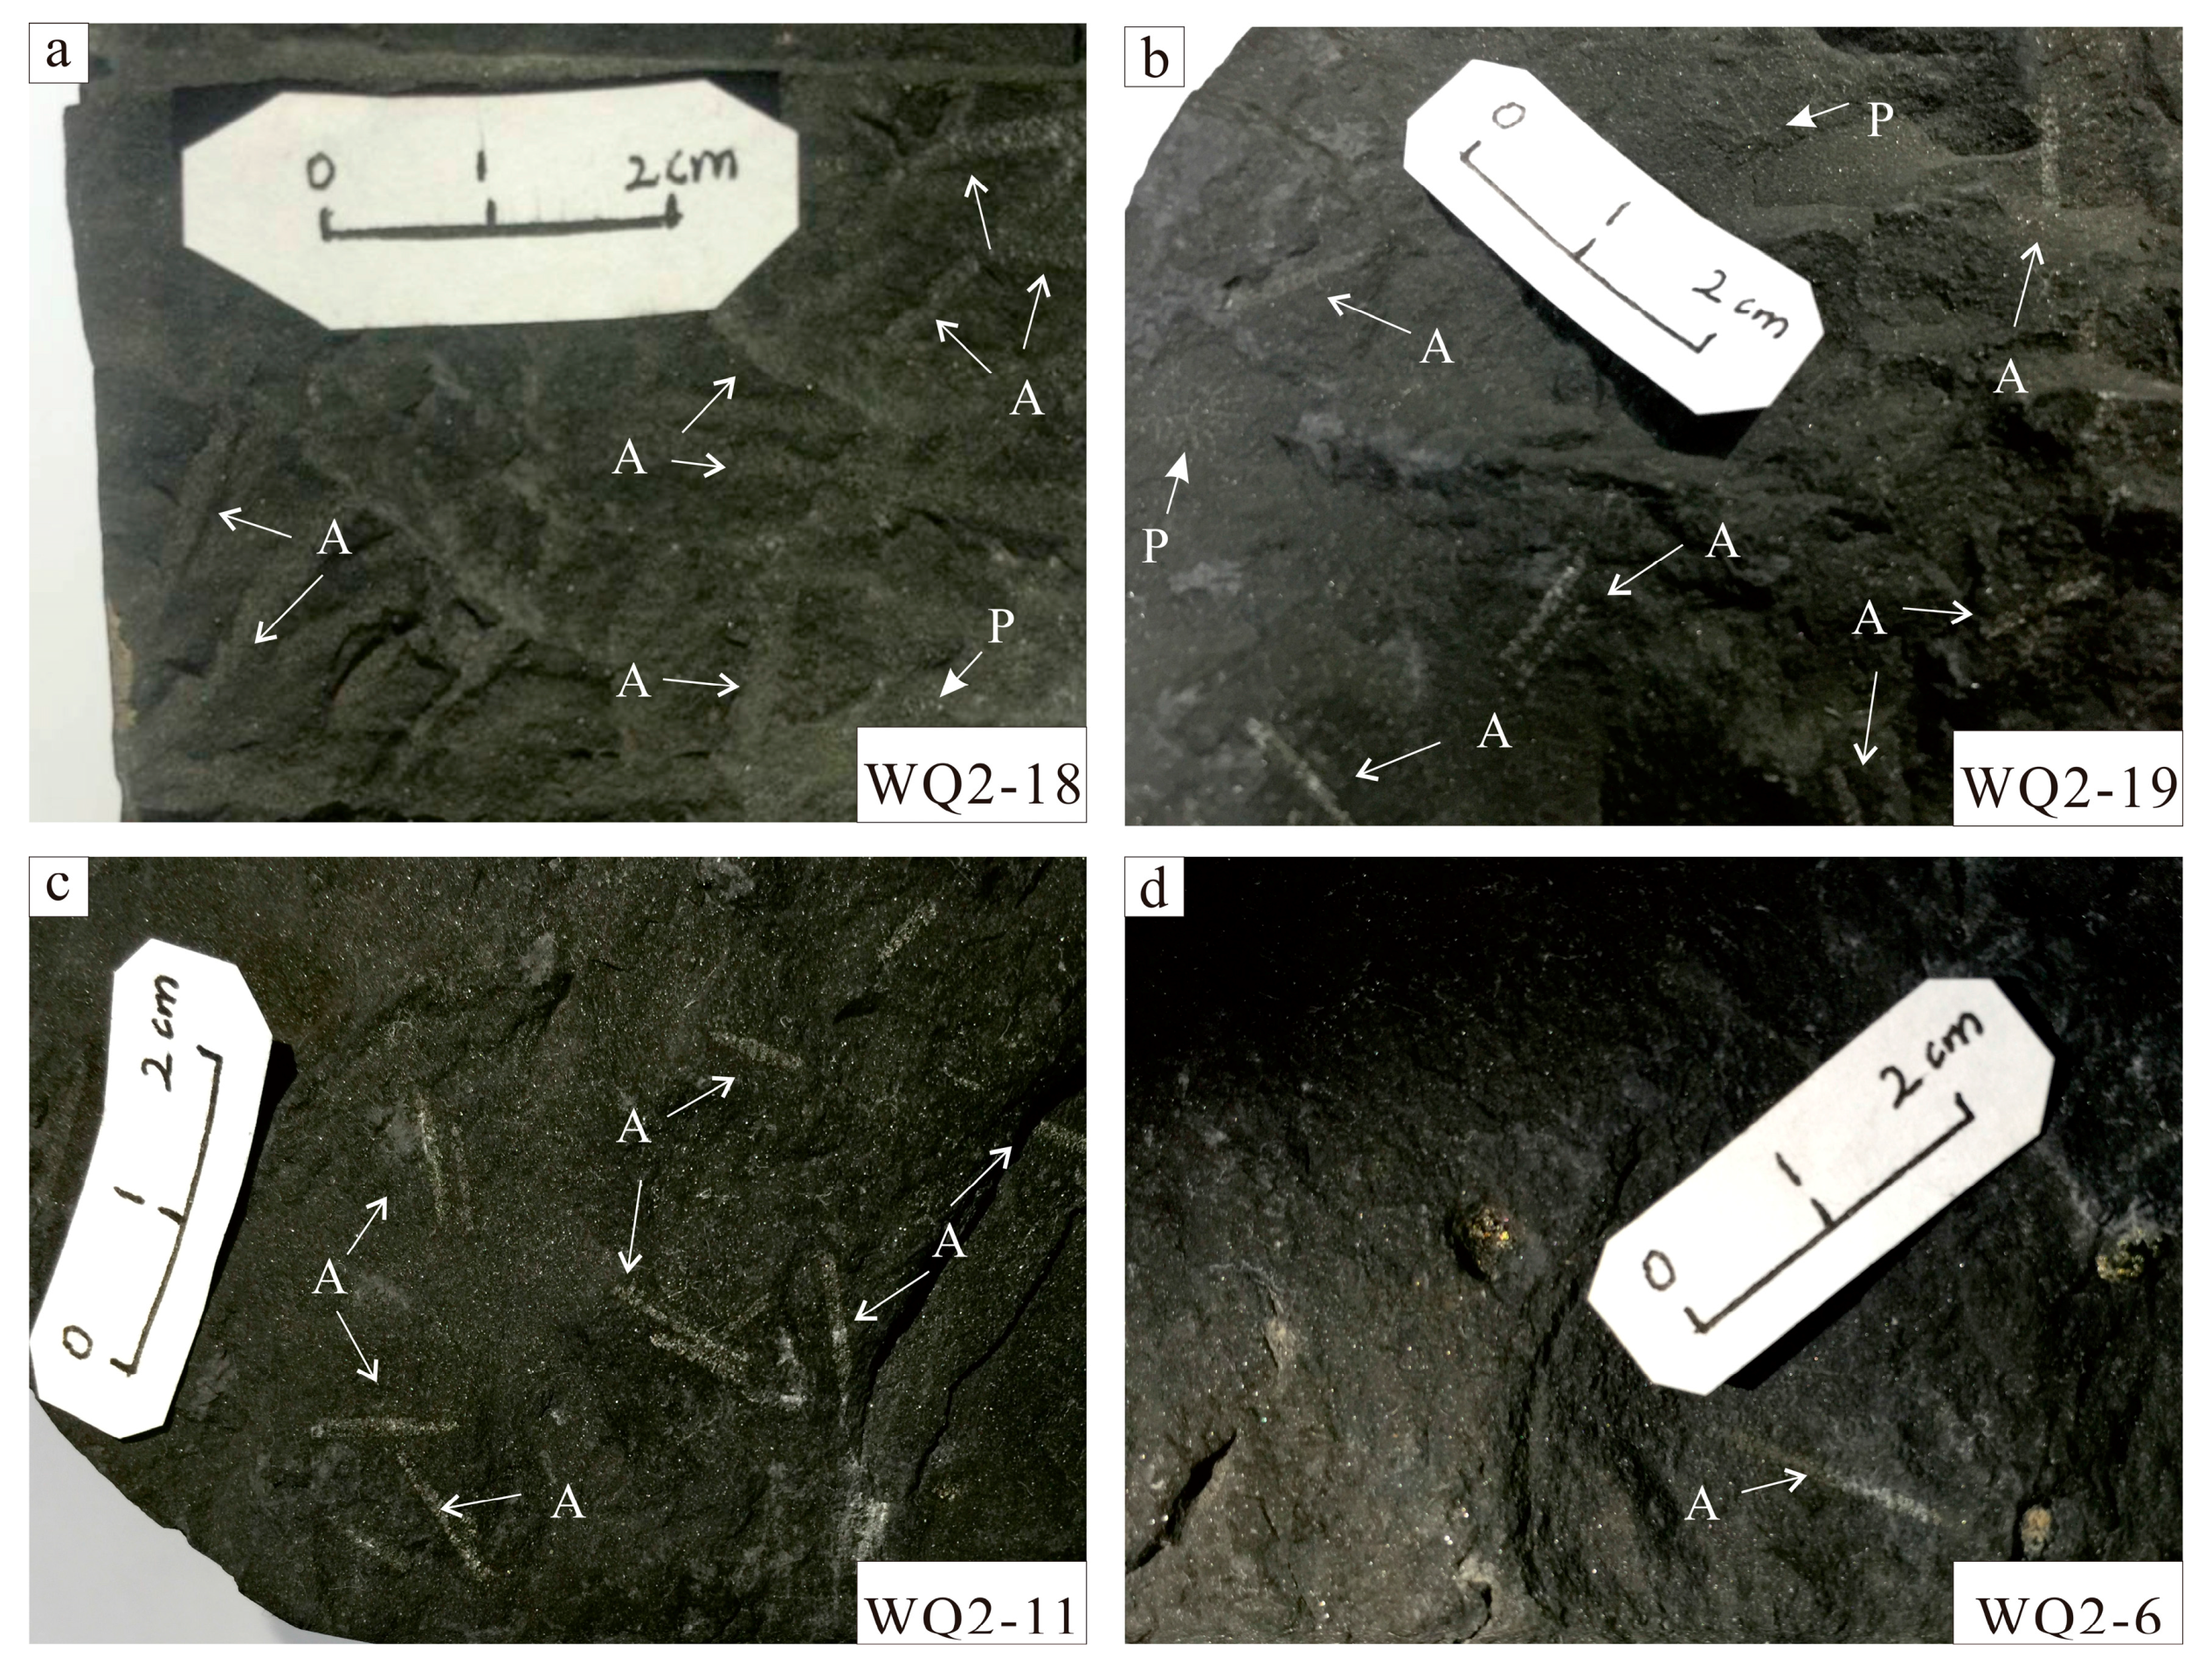
4.1. Vertical variation of Lithofacies

Although limited research has been conducted on stratigraphic sequences in the LSL formation of the northeastern Sichuan Basin, some investigations related to the LSL formation in the southern and southeastern Sichuan Basin have been performed (Xiong et al. [8], Wang et al. [9], and Chen et al. [7,30]). Based on research in the southern and southeastern Sichuan Basin by Xiong et al. [8], Wang et al. [9], and Chen et al. [7,30], detailed core observations, and well logging analyses in the study area, we identified a sequence boundary in the LSL formation and established the sequence stratigraphic framework of Well-WQ2 in the LSL formation (Figure 3).
The sequence boundary is manifested as a flooding surface indicated by a sharp increase in natural gamma-ray (GR) and spontaneous potential (SP) values, which divide the LSL formation of Well-WQ2 into two third-order sequences (SQ1 and SQ2) from the lower section to the upper section (Figure 3). The sequence division for LSL formation is consistent with Xiong et al. [8], Wang et al. [9], and Chen et al. [7,30]. SQ1 and SQ2 are both composed of a transgressive system tract (TST) and a high-stand system tract (HST) according to the vertical variation in GR logging. The TST exhibits an upward increasing trend, while the HST displays an upward decreasing trend based on the GR response. The boundary between the TST and HST in SQ1 and SQ2 is interpreted as a maximum flooding surface, which represents the period with the highest water depth during the deposition of SQ1 and SQ2. On the basis of the sequence division, the reservoir characteristics between SQ1 and SQ2 were compared to judge the vertical properties of LSL shale. Additionally, the vertical variation of relative sea level and thus the hydrodynamic conditions during the sedimentary period can also be identified according to the sequence division.
In SQ1, the TST is characterized by siliceous shale and carbonaceous shale with a horizontal bedding texture (Figure 3h). The siliceous shale is rich in Si-minerals (>85%) and is associated with high hardness values. The carbonaceous shale is an organic-rich shale that is usually black in color and contains a high quartz content (>50%) and low clay mineral content (<20%). In the TST, Akidograptus and Pastrites are common and randomly oriented in both shales (Figure 4a,b). In the HST, a horizontal bedding texture is common in the pure carbonaceous shale (Figure 3f) and is sometimes observed in the carbonaceous silty shale (Figure 3g). The carbonaceous silty shale is gray or dark gray in color with moderate contents of organic matter, quartz (~50%), and clay minerals (20~30%). Compared with the TST, the HST has fewer graptolites (mostly Akidograptus) (Figure 4c). In SQ1, almost all the cores are black and dark gray shale, with some pyrite present (Figure 3e).
In SQ2, the TST is mainly composed of carbonaceous shale, carbonaceous silty shale, and silty shale with a horizontal bedding structure (Figure 3d). The silty shale is organic-lean and characterized by a low quartz content (~45%) and a high clay mineral content (>30%). Additionally, the shale is light gray or gray in color. In this section, very few graptolites can be observed (Figure 4d). In the HST, the lithology is defined as carbonaceous shale, carbonaceous silty shale, and silty shale (Figure 3). The morphology of the pyrite in this section is different from that in SQ1. Notably some pyrite phenocrysts with good roundness are present (Figure 3c). Additionally, some tawny siliceous-argillaceous veins are present in the HST at the top of SQ2 (Figure 3a,b). These veins are almost orthogonal to the bedding plane, and they are formed by the filling and mineralization of primary fissures/fractures [31].
Generally, the amount and species of graptolites exhibit upward decreasing trends, indicating that the water depth was much deeper in the early phase of the deposition (SQ1) of the LSL formation than in the late phase (SQ2) [7,9]. Therefore, compared with SQ1, the sedimentary environment can be characterized as relatively oxygenic with strong hydrodynamics, and the sediment sources contained more terrigenous sand and silty materials during the sedimentary process of SQ2. The tawny siliceous-argillaceous veins are only present in the top section of the HST of SQ2, suggesting that the top sections of the LSL formation experienced considerable filling and mineralization of primary fissures/fractures compared to other sections during the geological period.

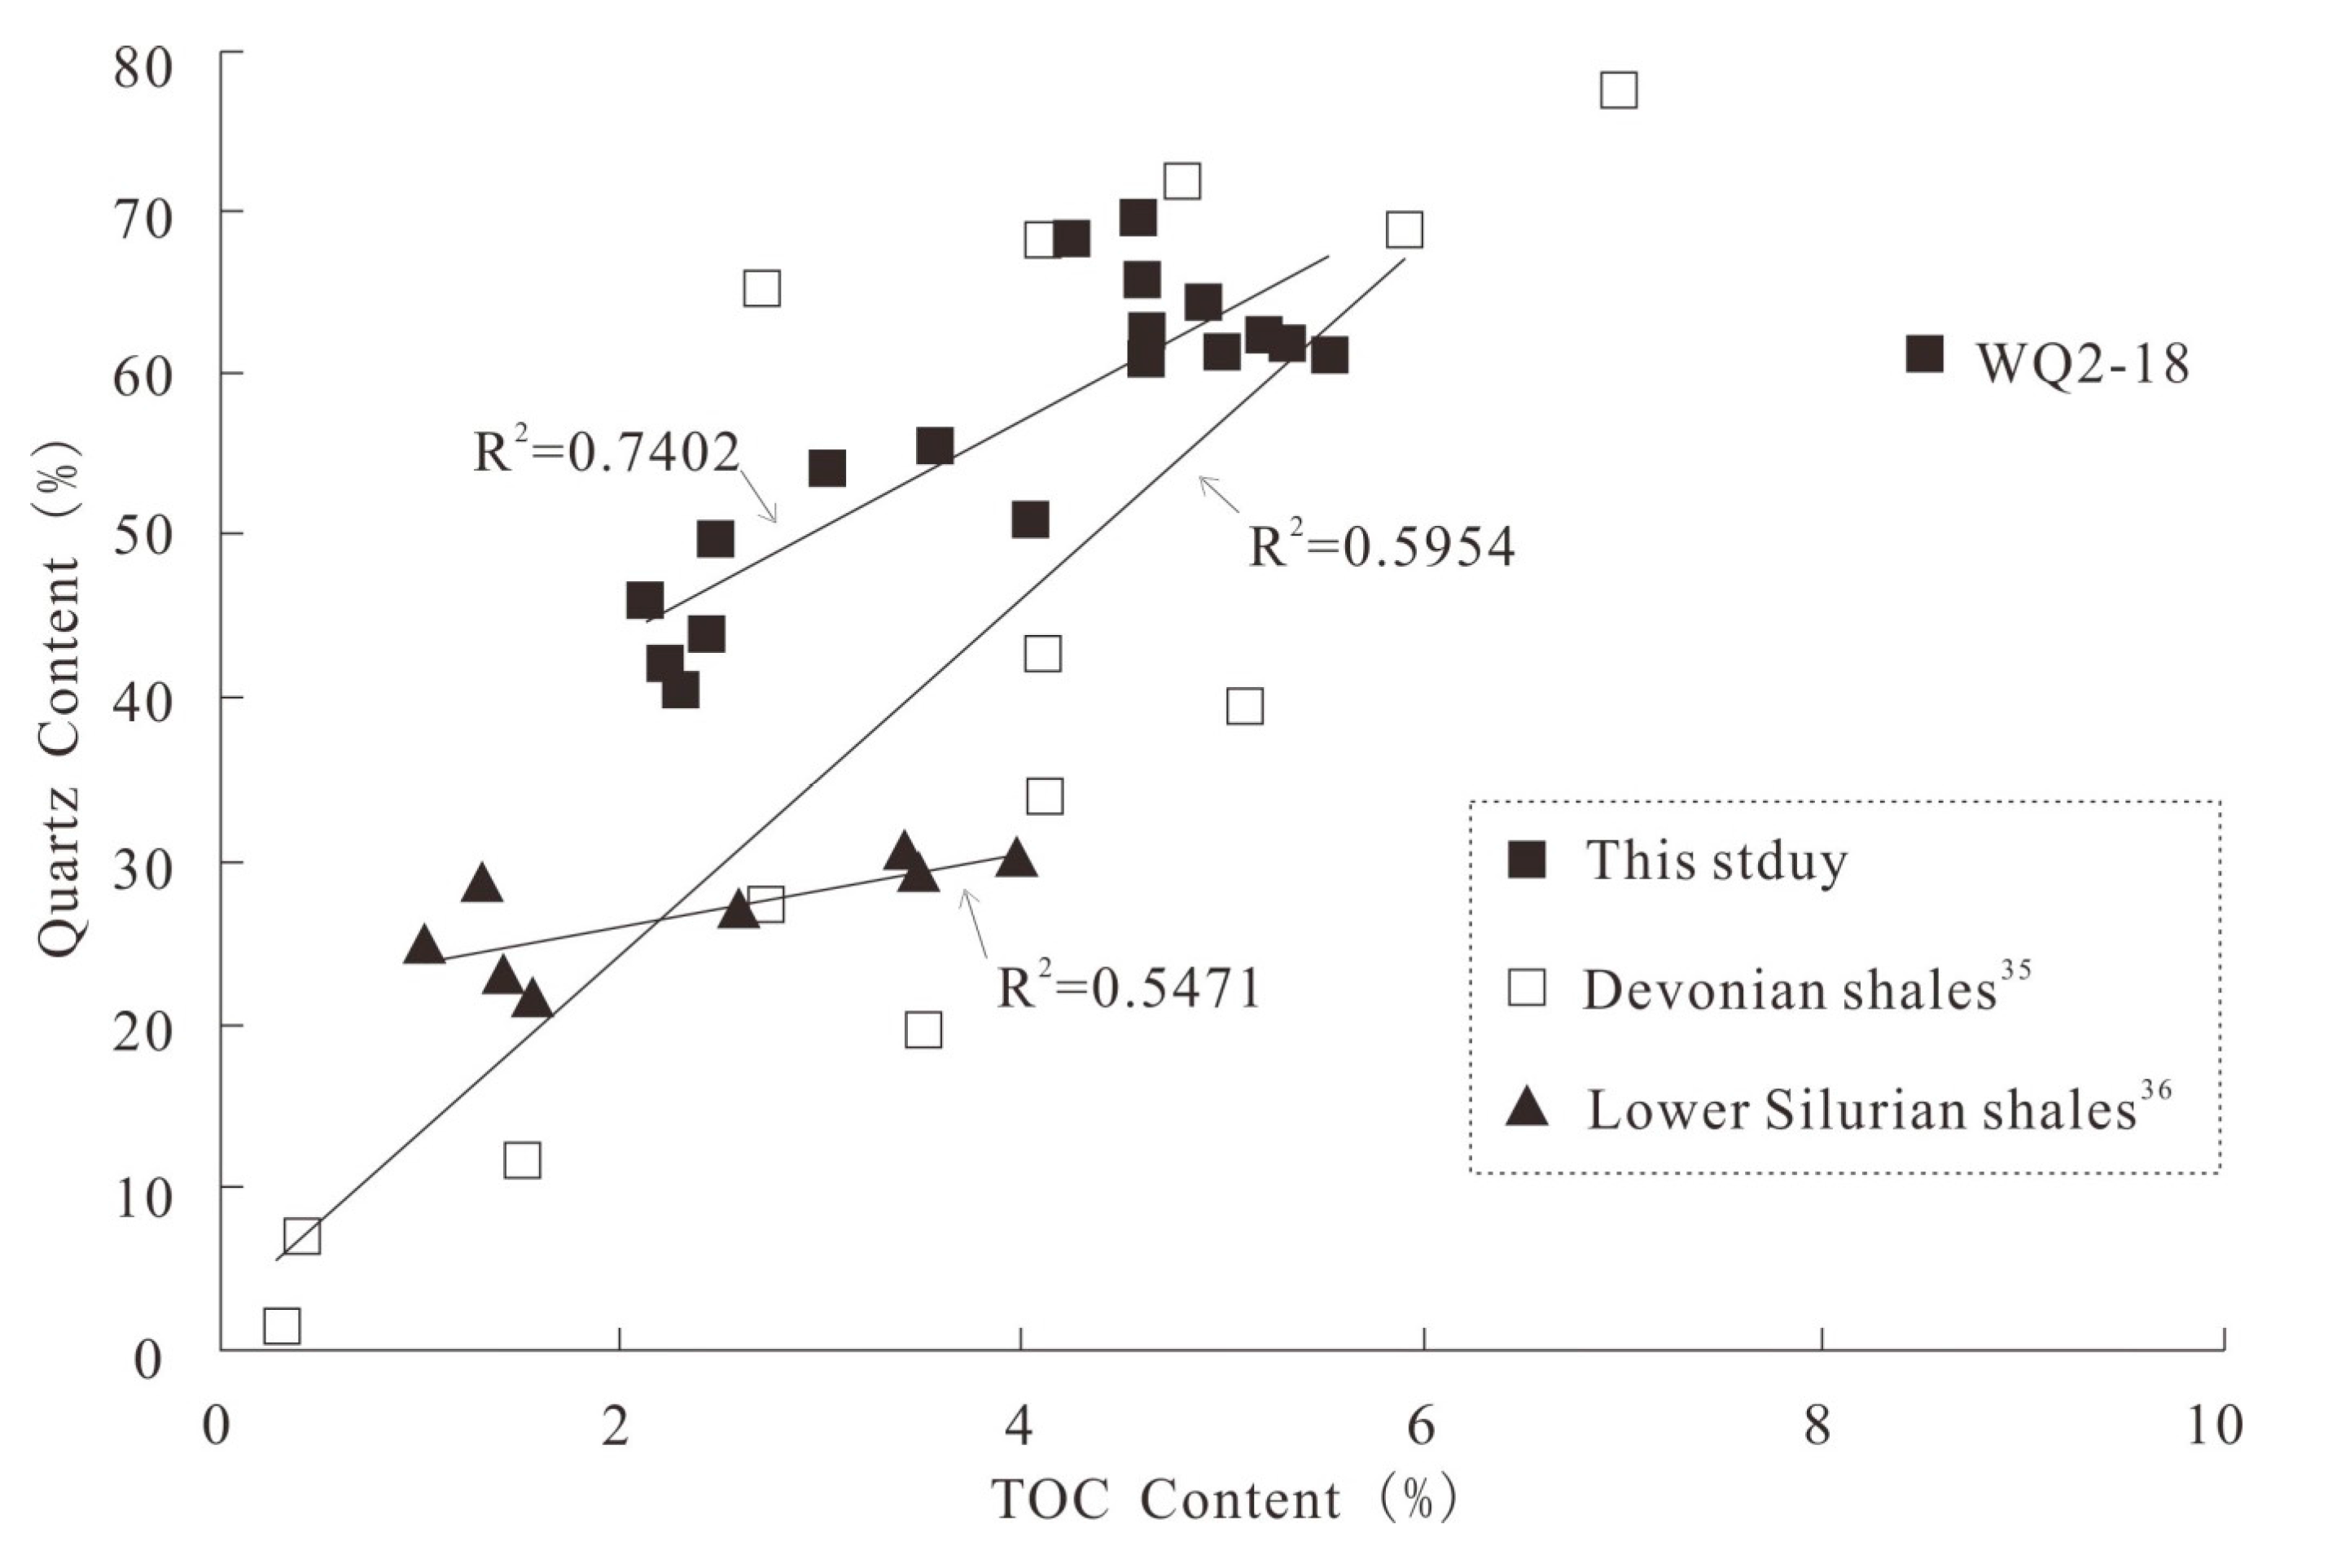
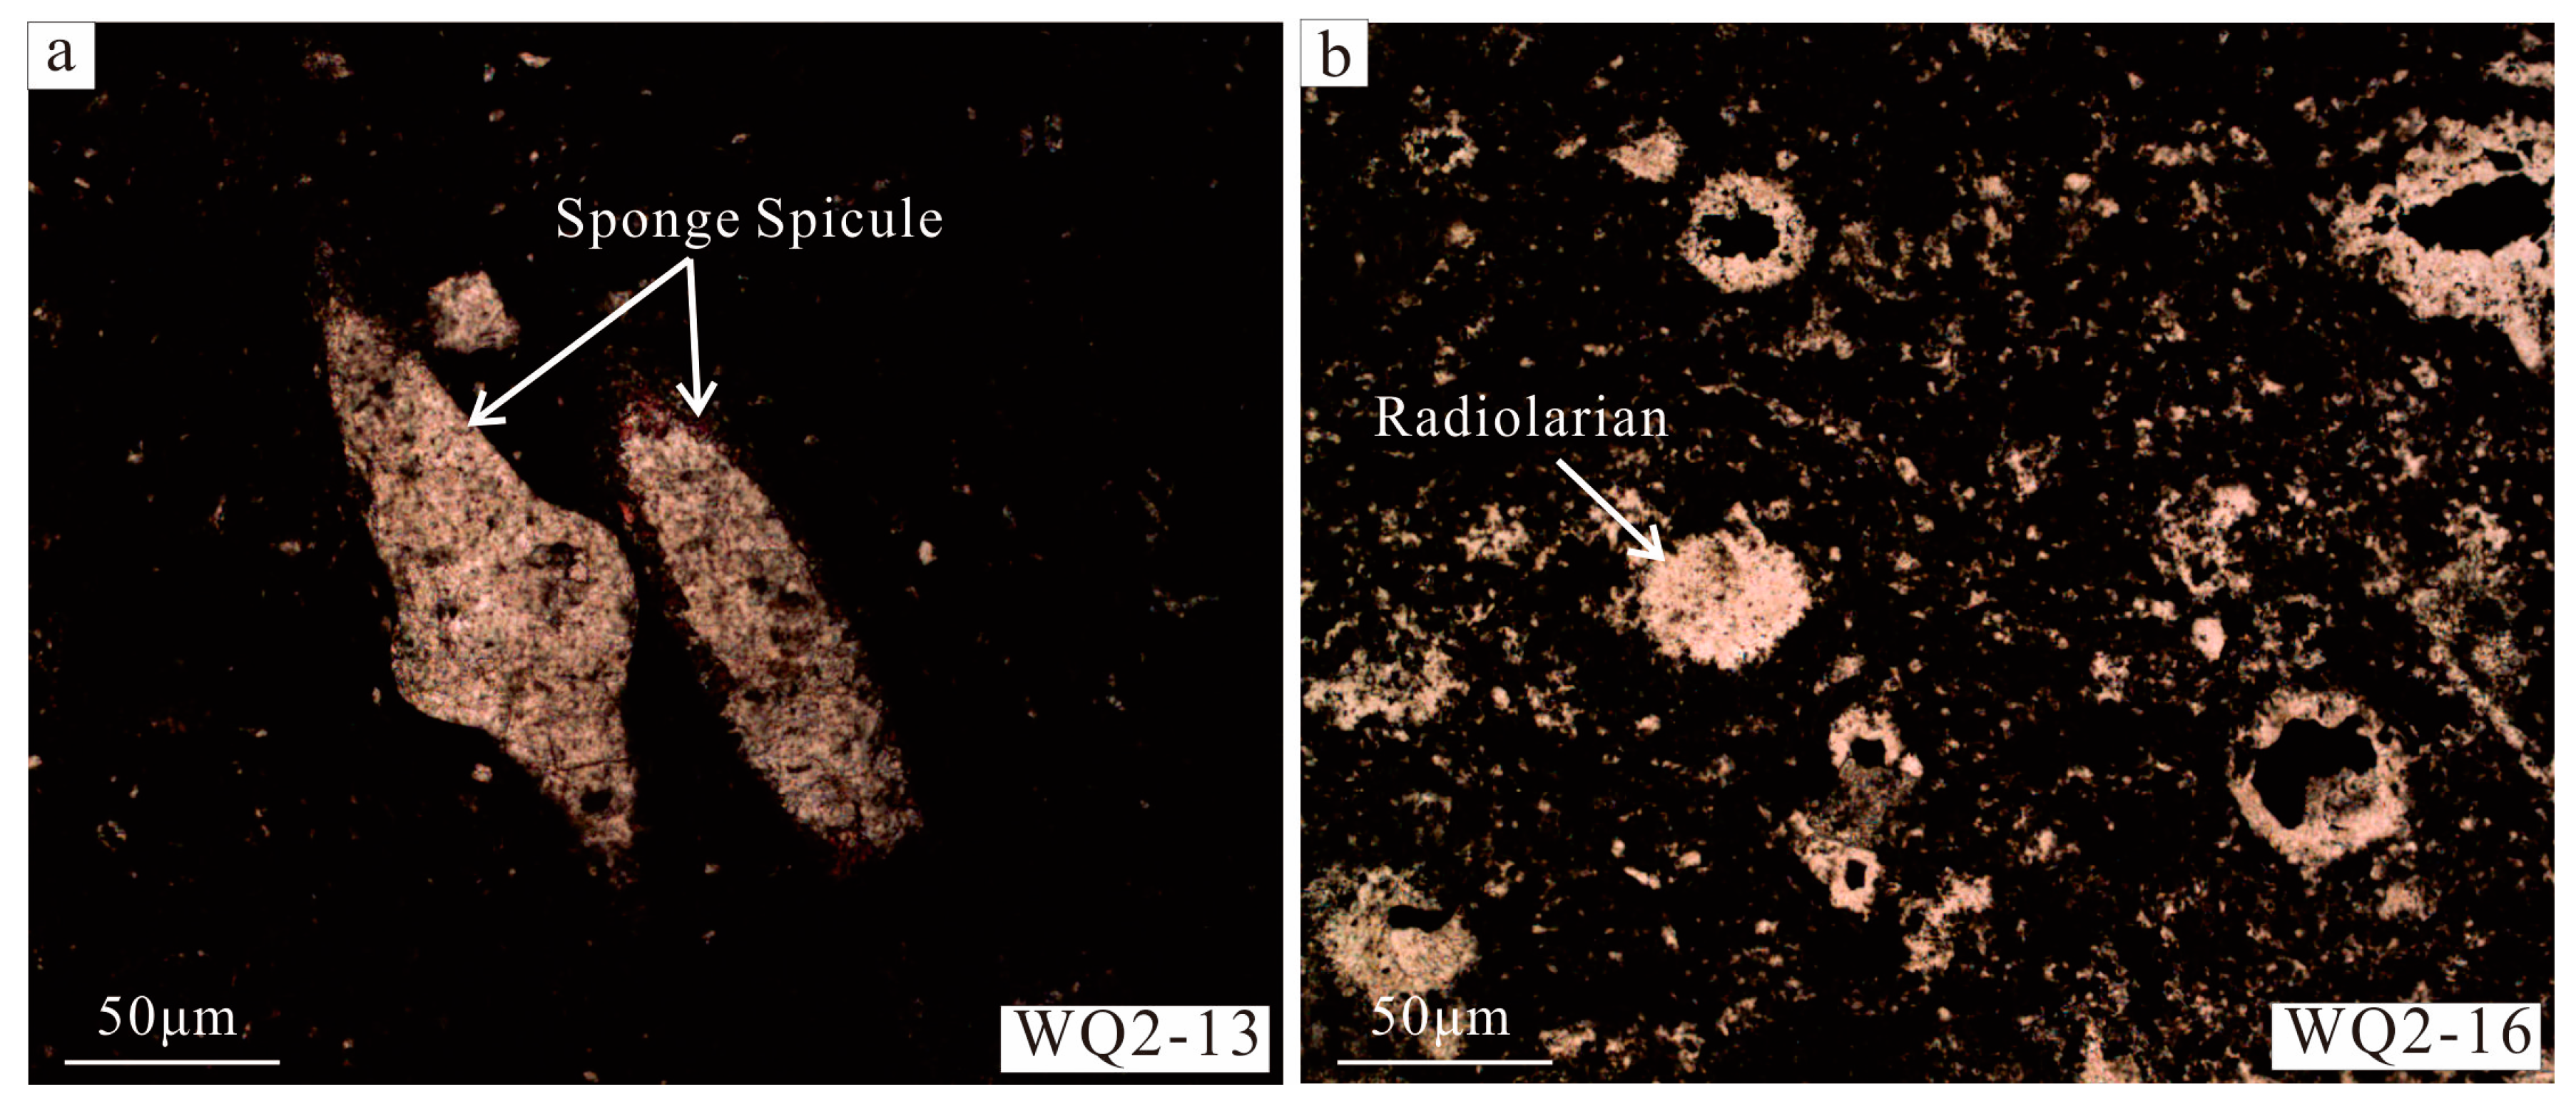
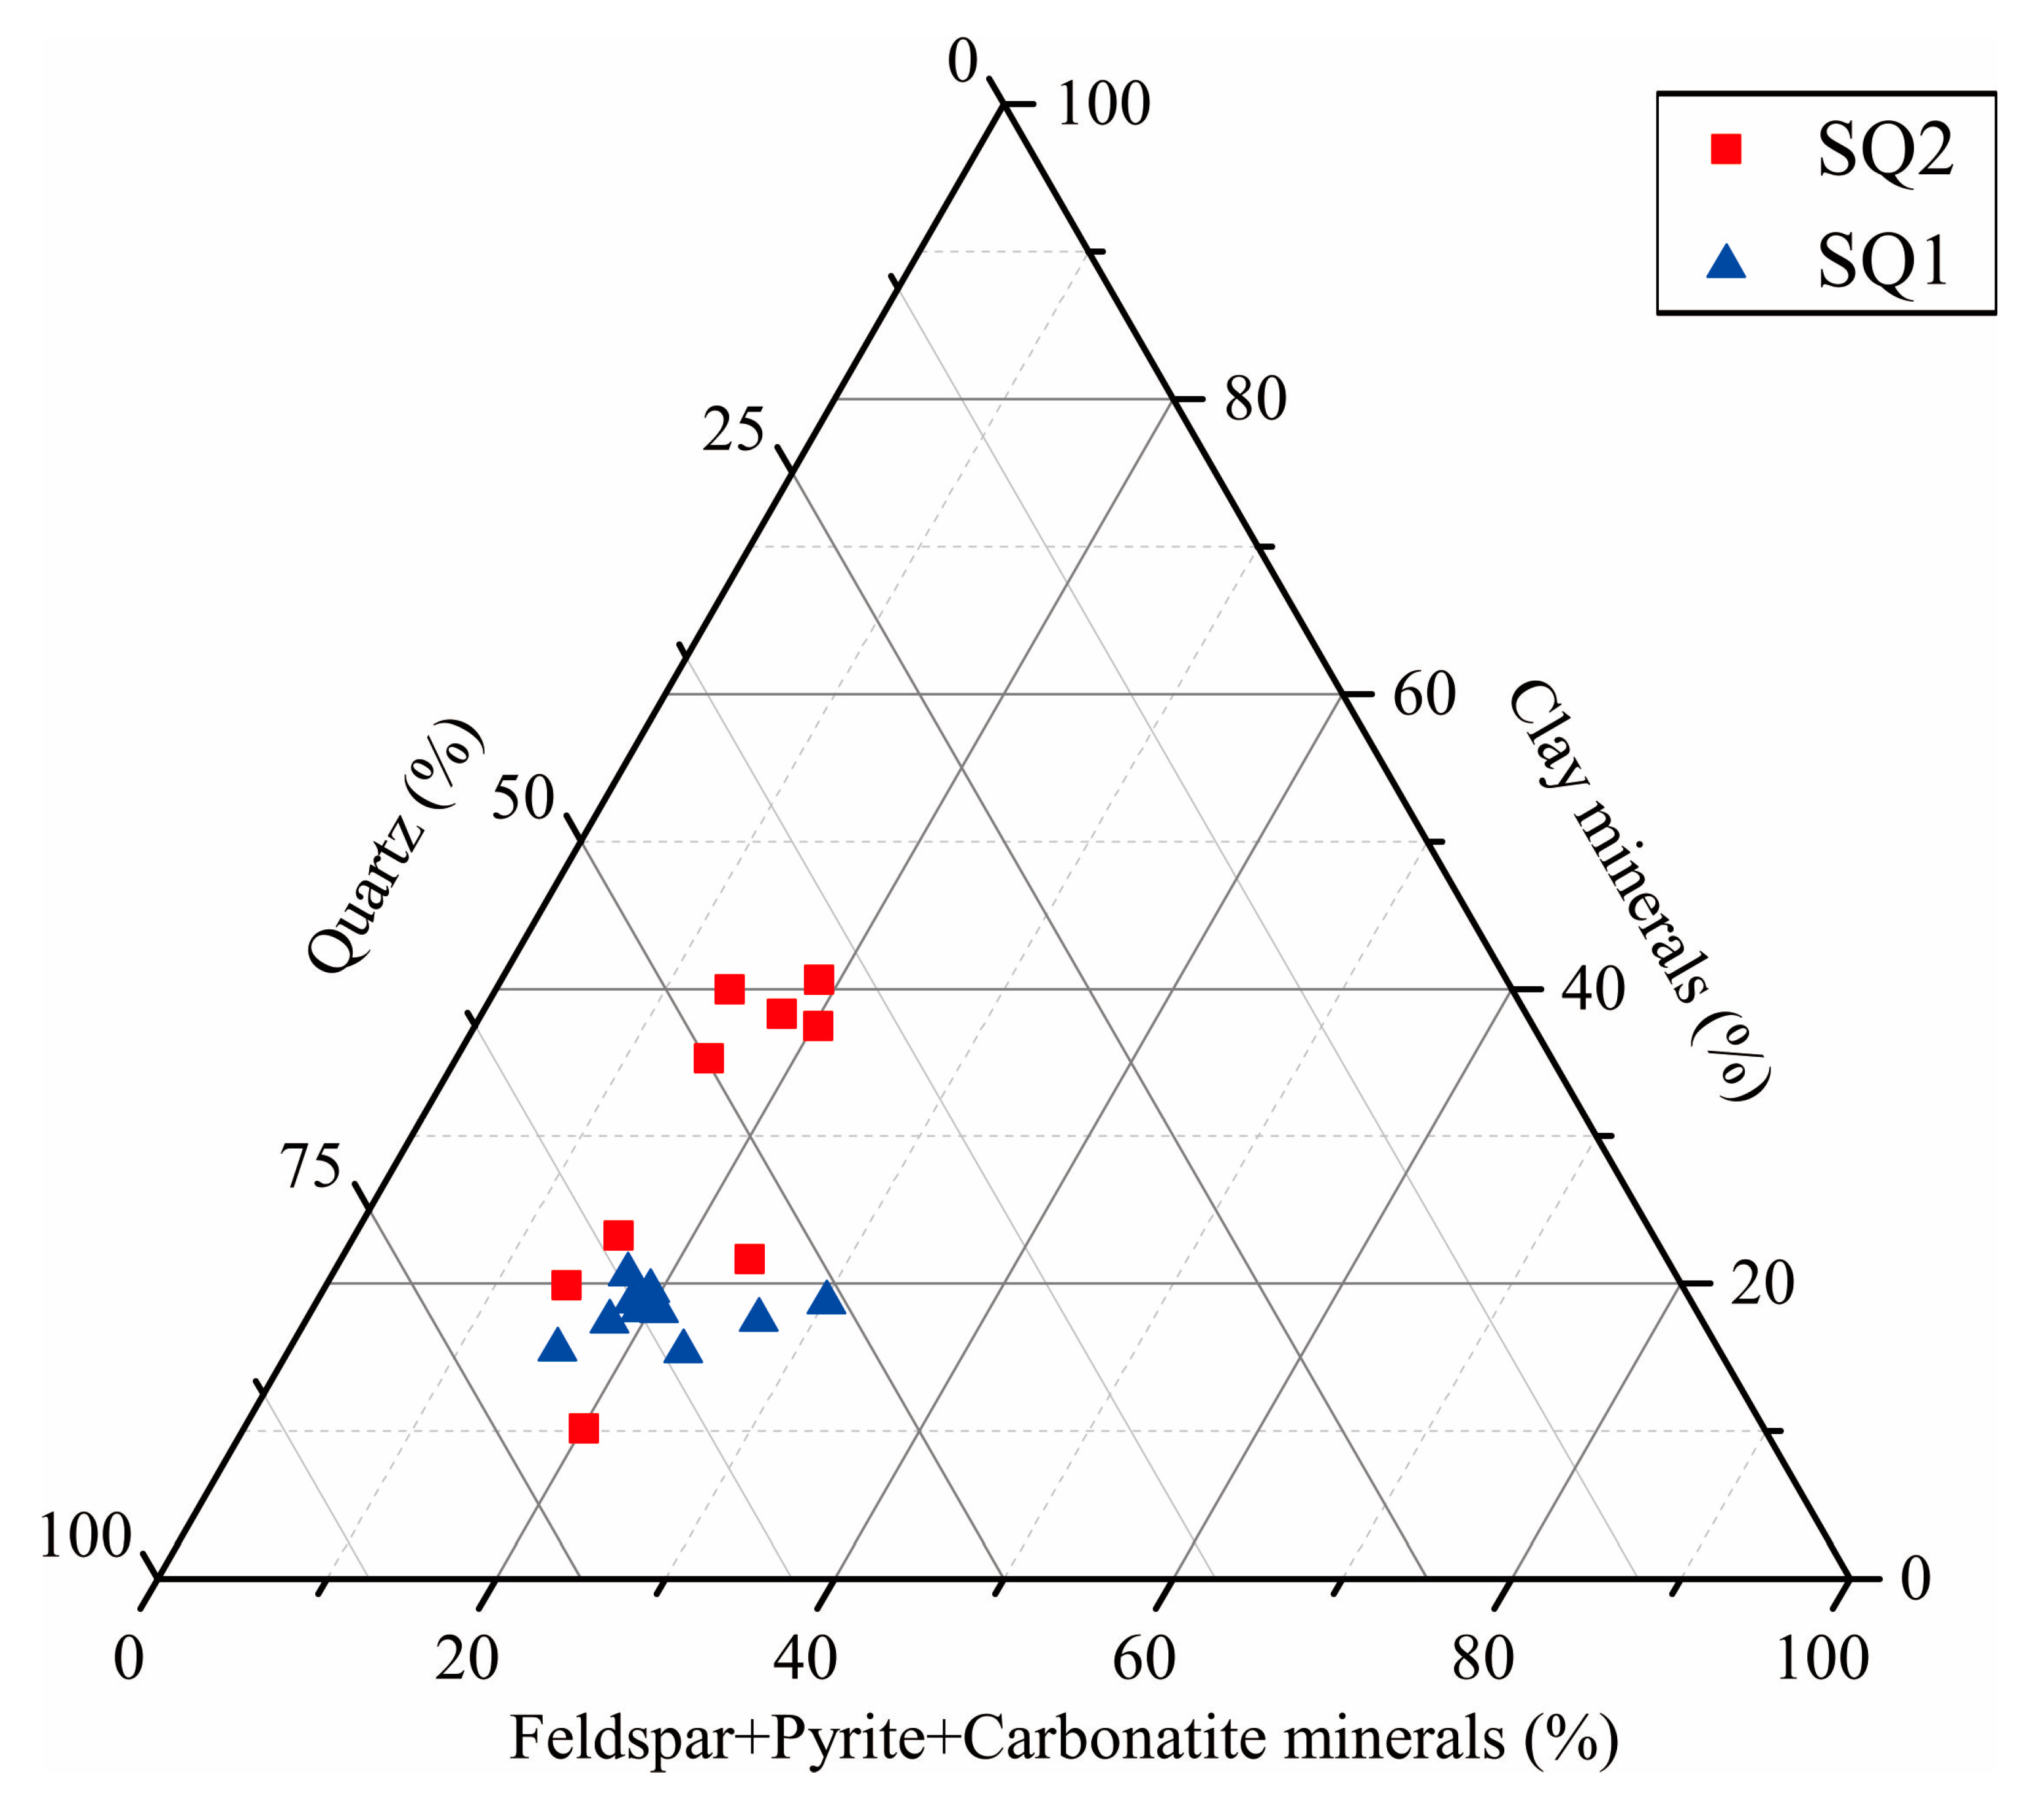
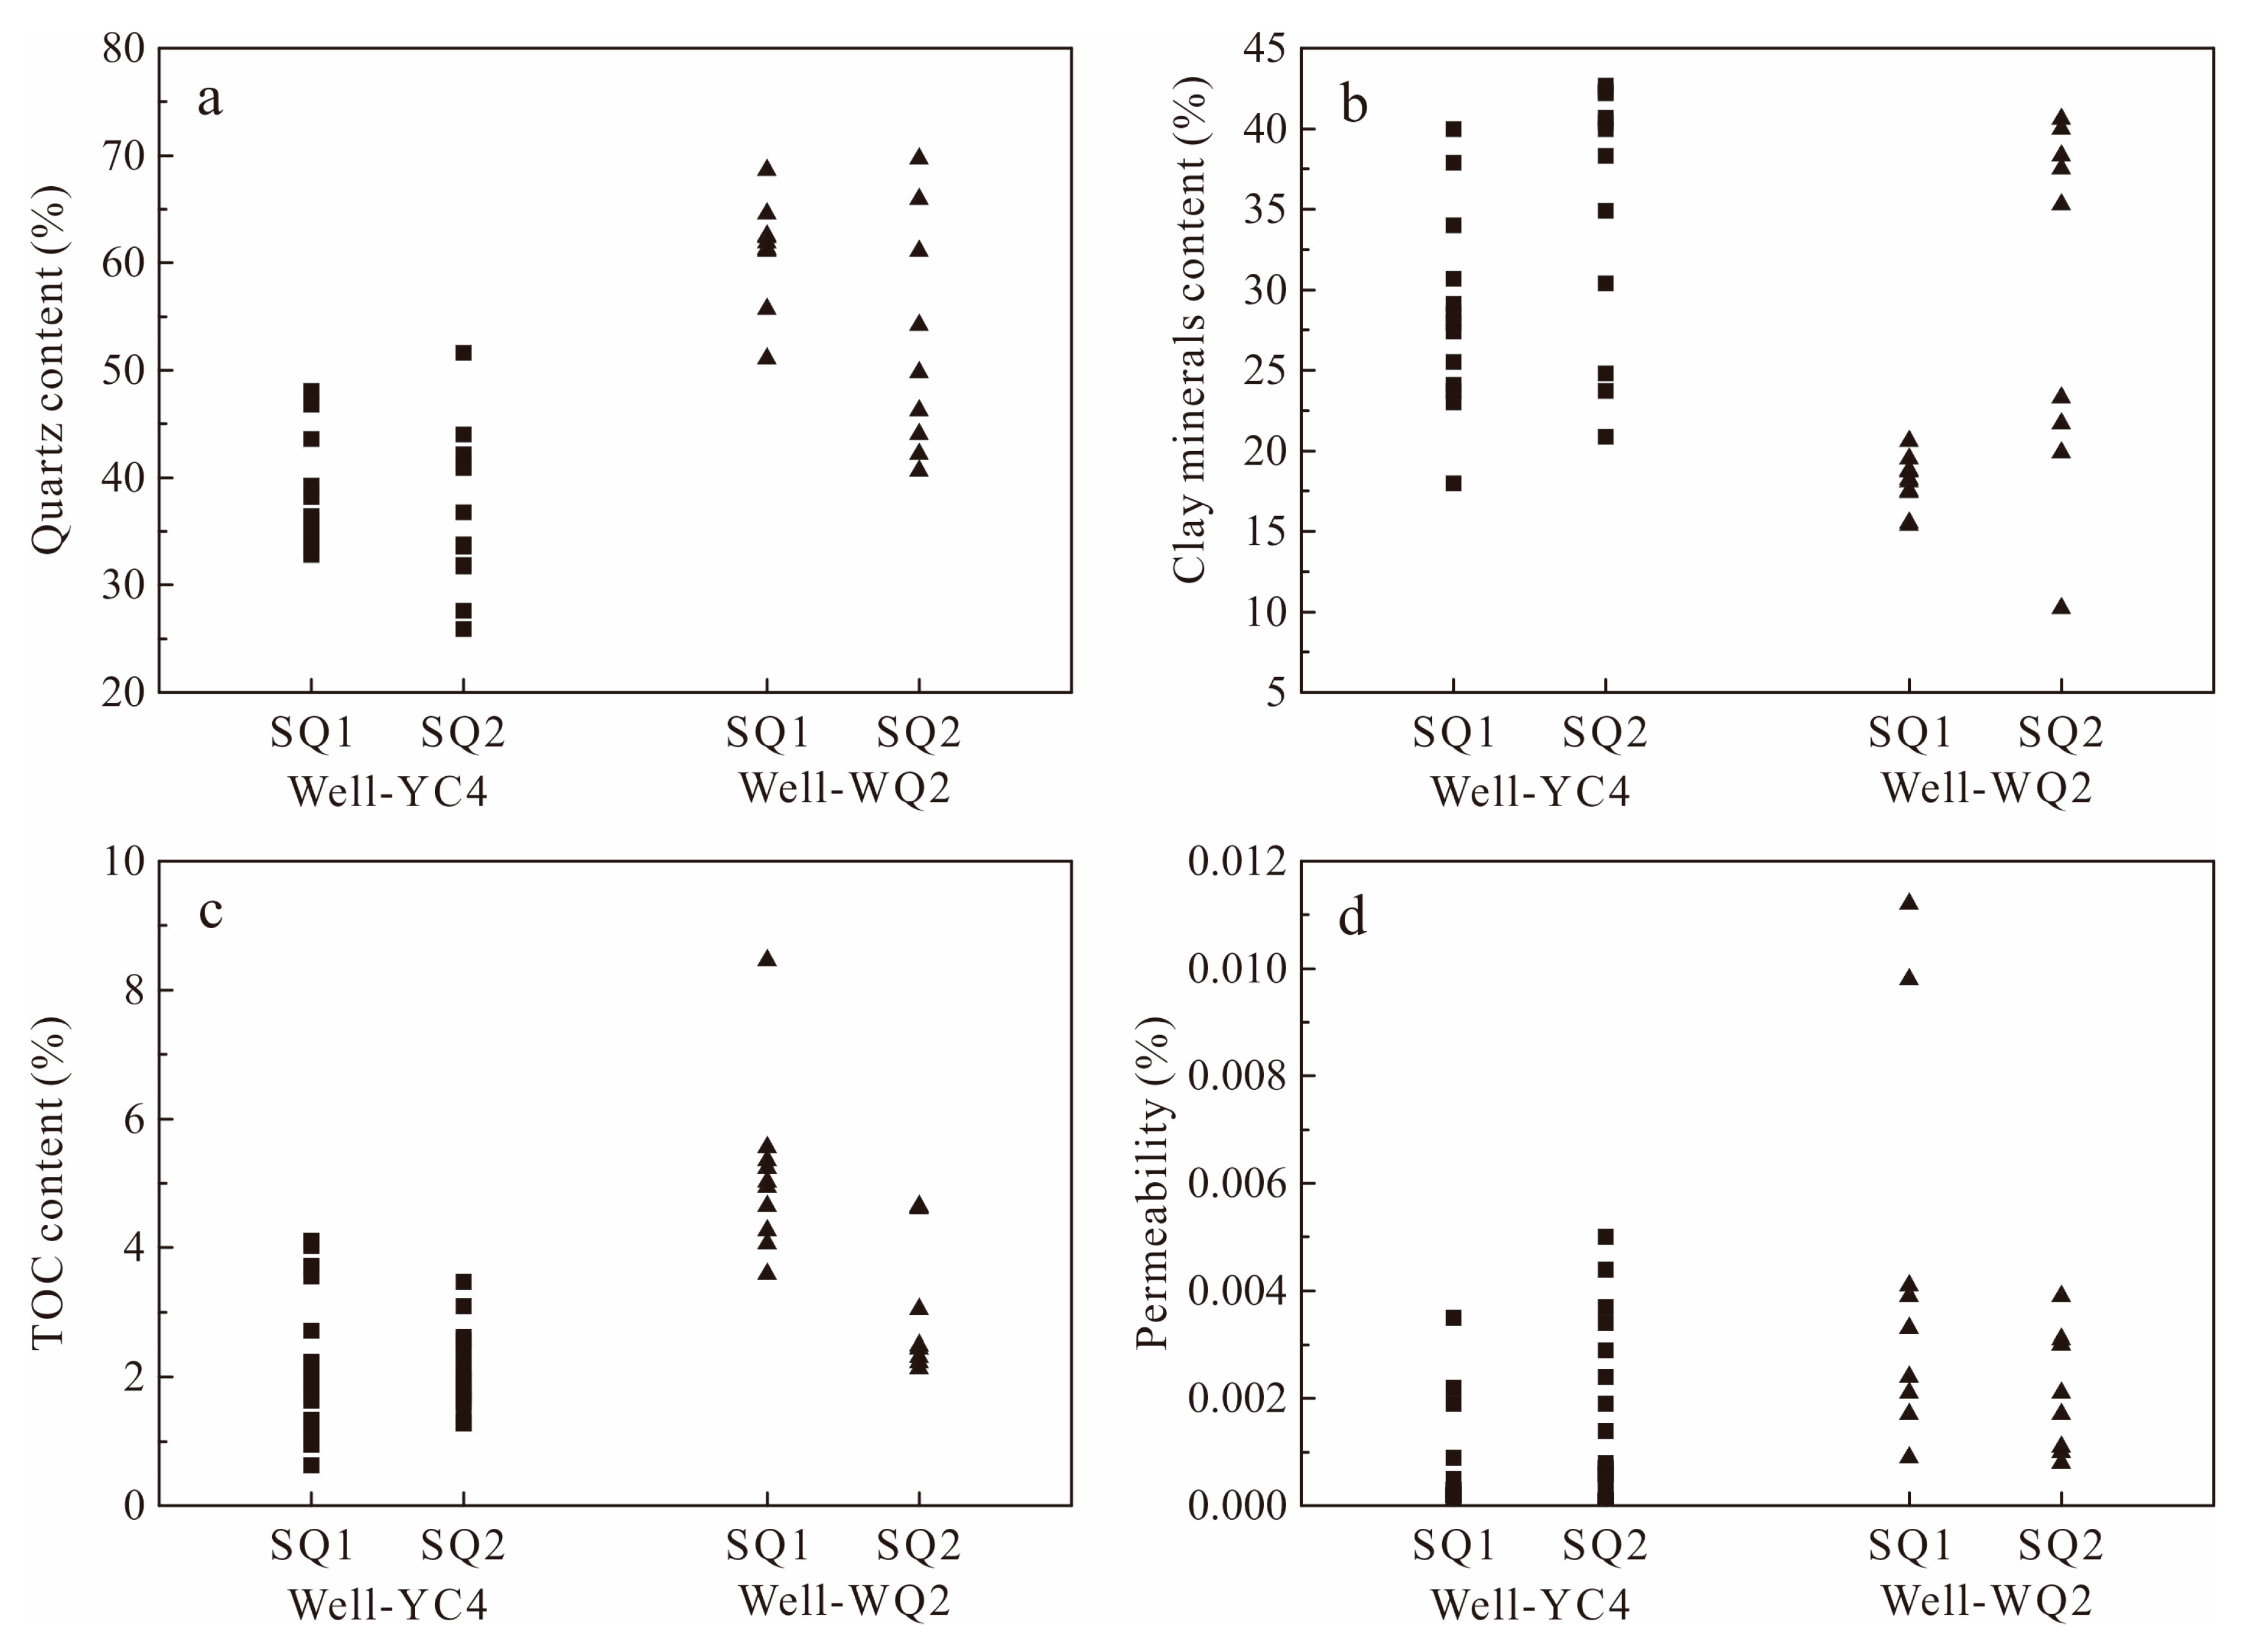
4.2. Mineralogical Characteristic of LSL Shale

In both SQ1 and SQ2, the mineral composition of the LSL shale includes quartz, feldspar, pyrite, carbonate, and clay minerals (Figure 5 and Figure 6). The contents of pyrite and carbonate exhibit unobvious vertical variations. The quartz content in SQ1 (average of 61.0%) is higher than that in SQ2 (average of 52.6%) (Figure 5 and Figure 6), while the clay mineral content in SQ1 (average of 18.0%) is lower than that in SQ2 (average of 29.6%) (Figure 5). The vertical heterogeneity of the mineral composition in SQ1 is more homogeneous than that in SQ2 (Figure 6) due to less water movement and more homogeneous sedimentary inputs in SQ1 [7].
The vertical properties of the mineral composition mainly result from the different sediment sources of SQ1 and SQ2. The quartz in the LSL shale is mainly derived from siliceous organisms (Figure 7), which gradually became less abundant as the sea level declined. Additionally, the clay minerals mainly come from terrigenous materials [8] that continually increased in abundance as the sea level declined.
Brittleness is a key factor in promoting hydraulic fracturing as a stimulation method. The brittleness index (BI) is commonly used to represent the brittleness and is a key parameter in the evaluation of gas reservoirs. The BI is calculated from the mineral composition of shale, as follows [32]:
B I = Q / ( Q + C + C l y ) × 100 %
where BI is the brittleness index and Q, C and Cly represent the contents of quartz, carbonate minerals, and clay minerals, respectively.
Based on Equation (1), the calculated results of BI for the selected samples are shown in Figure 5. The BI averages 71.7% and ranges between 63.2% and 73.4% in SQ1, while the average is 61.1% with a variation from 48.7% to 84.1% in SQ2. The BI values in SQ1 are higher than those in SQ2, and the vertical variation in the BI in SQ1 is smaller than that in SQ2 (Figure 5). Thus, from the aspect of rock mechanics, SQ1 is better suited for hydraulic fracturing than is SQ2.

4.3. Characteristic of TOC Content

As one of the indices used to evaluate the organic matter abundance, TOC is a key factor for the assessment of hydrocarbon generation potential. In the study area, TOC gradually decreases upward, although the organic matter maturity (characterized by Ro) does not exhibit a clear relationship with depth. As shown in Figure 5, the TOC of SQ1 (average of ~5.11%) is distinctly higher than that of SQ2 (average of ~3.17%), indicating that the potential for hydrocarbon generation in SQ1 is higher than in SQ2. Moreover, the shales in SQ1 may have a higher methane adsorption capacity than those in SQ2 because the methane adsorption capacity is commonly positively correlated with the TOC content but weakly and insignificantly correlated with the clay mineral content [33,34].
The relationship between the TOC content and the quartz content has been used in analyses of the sedimentary environment. According to observations of Devonian shales in Canada [35] and Lower Silurian shales in China [36], the TOC content increases with the quartz content, which indicates that biogenic quartz is present in these shales and that quartz and TOC are both mainly derived from siliceous organisms. Similarly, in the study area, the TOC content of LSL shale displays a moderate positive correlation with the increase in the quartz content, excluding sample WQ2-18, which exhibited an extremely high value of 8.46% (Figure 7). This suggests that abundant biogenic quartz is likely present in the LSL shale in the northeastern Sichuan Basin. This may result from the involvement of siliceous organisms such as siliceous radiolarian, sponge spicule, and diatoms in the sedimentation process. This theory is confirmed by microscopic observations of the LSL shale collected from Well-WQ2 (Figure 8).
The main reason for the vertical heterogeneity in TOC is related to the change in the depositional environment during the deposition of SQ1 and SQ2. At the early stage of SQ1, the sea water was relatively deep, and the sedimentary facies was restricted to the deep-water shelf [37]. The sediment sources were mainly minerals and organic matter from the deposition of suspended particles, as well as some low-energy terrigenous clastic inputs [38]. The depositional environment was characterized as oxygen-deficient, with an increase in the relative sea level resulting in the accumulation of organic material under conditions of sediment starvation. Thus, the lithology mainly includes organic-rich shales, and the TOC content of SQ1 is relatively higher than that of SQ2. In addition, during the sedimentary process of SQ1, the hydrodynamics at the bottom of the ocean were relatively weak at the high sea level state; therefore, the deposition of SQ1 was minimally affected by hydrodynamic forces from the ocean. Thus, the organic matter content and mineral composition of SQ1 exhibit relatively little vertical heterogeneity.
Following SQ1, as the relative sea level gradually declined (Figure 3), the study area evolved into a shallow-water shelf in the early stages of SQ2 [38]. The area then further evolved into a tidal flat in the late stages of SQ2 [37], when the sediment sources and oxidation-reduction environment changed slowly. The sediment inputs included minimal organic matter from suspended deposition and bioclasts because of the shallow seawater, but they also included relatively abundant high-energy terrigenous clastics that further diluted the organic matter. Preserving the organic matter became difficult because of the gradual increase in the oxygen content in the sedimentary environment, which resulted from the decrease in the relative sea level. In addition, the hydrodynamics at the bottom of the ocean became stronger during the deposition of SQ2, making the preservation of organic matter difficult and resulting in a decrease in the TOC content. These changes explain the low TOC content in SQ2 relative to that in SQ1.

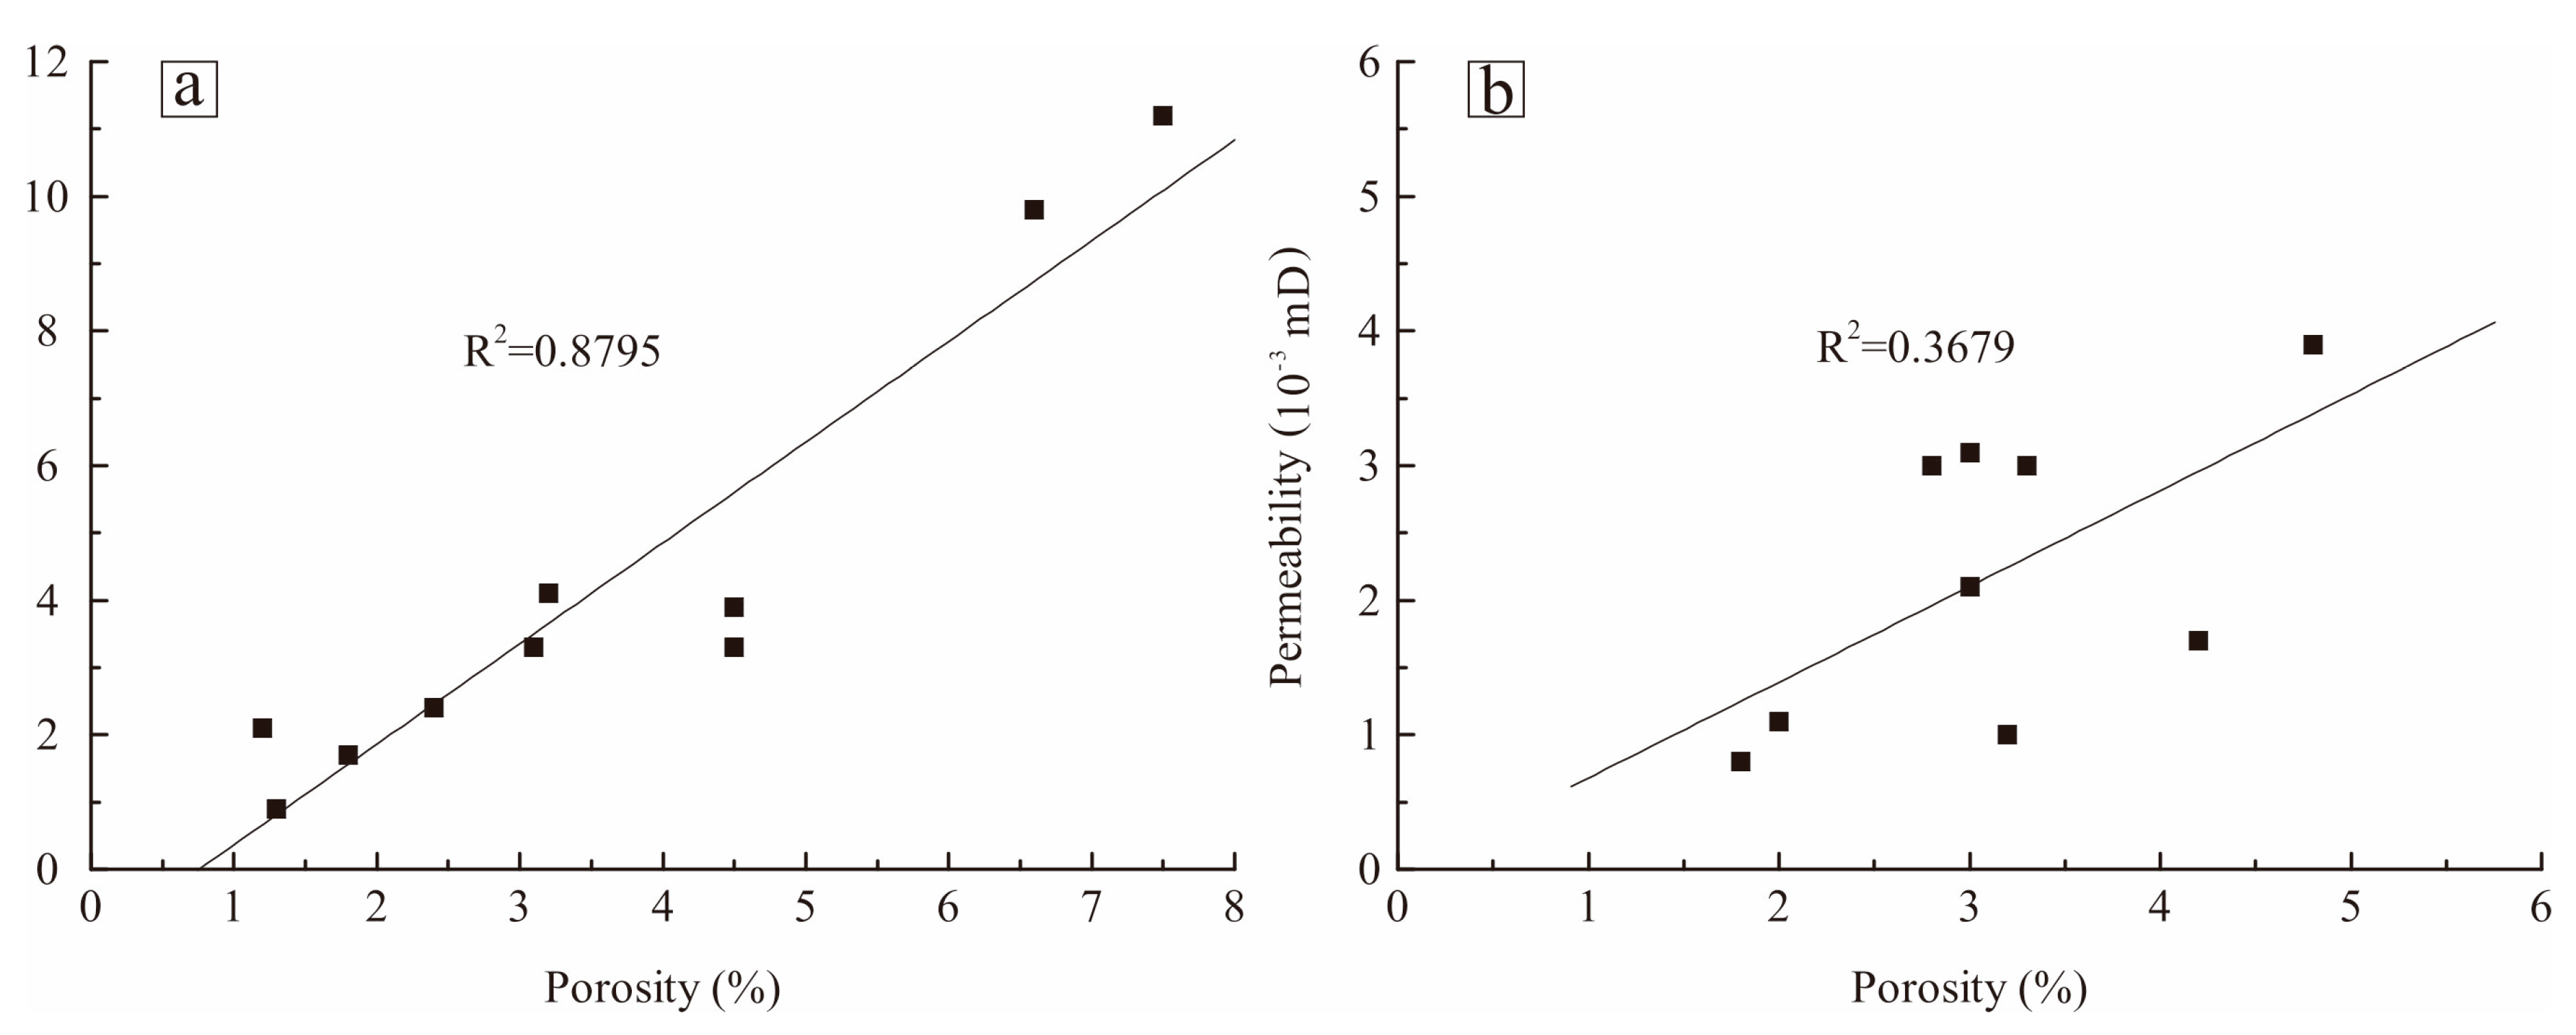
4.4. Porosity and Permeability

The porosity and permeability exhibit extremely high heterogeneity in the vertical direction (Figure 5). The porosity and permeability of SQ1 are high relative to those of SQ2. At the base of the HST in SQ1, between the depths of 1271 to 1282 m, the LSL shales exhibit maximum porosity (average of 4.95%) and permeability (average of 0.0067 mD).
The development of fractures may provide an important contribution to permeability. Microscopic observations reveal that fractures are better developed in cores with higher permeability. For example, in the sections from 1204 to 1214 m and from 1271 to 1282 m, the core samples exhibit well-developed fractures and relatively high permeabilities (Figure 5). By contrast, fractures are rare in the cores from other sections with low porosity and permeability.
The characteristics of pore connectivity and mineral infilling are also important in defining permeability. In SQ1, the permeability exhibits a positive correlation with porosity (Figure 9a), suggesting that the connectivity of pores and/or fractures is good and that the contribution of pores to permeability is significant. By contrast, in SQ2, the relationship between porosity and permeability is poor (Figure 9b), indicating a relatively poor connectivity between pores in these sections. Moreover, the majority of pores or fractures are filled with minerals (e.g., calcite) in SQ2 but not in SQ1 (Figure 10). This filling explains why SQ1 has a higher permeability than SQ2. Thus, merely from consideration of the physical properties of the reservoir, the lower section of SQ1, especially between the depths of 1271 to 1282 m, is the most favorable target section for shale gas production.
The observed porosity and pore development characteristics are related to the diagenetic history of the LSL shale. While sedimentary compaction can gradually reduce porosity with increasing burial depth due to increased pressure in the overlying formation, the increase in formation temperature with burial depth may also promote siliceous and calcareous cementation, sometimes ceasing the associated porosity reduction. Alternately, cements filled some pores and/or pore throats and limited their connectivity, so the porosity and permeability further decreased. However, in some situations, late diagenesis increased the porosity and permeability. With increasing formation pressure and paleotemperature, dissolution diagenesis dissolved some minerals, resulting in intra-particle pores and an increase in porosity. As the burial depth increased, generated hydrocarbons may have escaped from the shale formation, resulting in the generation of massive organic pores and the improvement of shale porosity. Meanwhile, tectonism during diagenesis may develop microfractures that increase shale permeability. Therefore, these different diagenetic processes evolving in the vertical profile result in different compaction, cementation, dissolution, and hydrocarbon generation histories and contribute to the observed heterogeneity in the petrophysical properties of SQ1 and SQ2. For example, SQ1 has a relatively high content of brittle minerals (e.g., quartz), and it contains more microfractures formed by tectonism during diagenesis (Figure 5). However, the specific mechanisms that contribute to this heterogeneity require significantly more research.

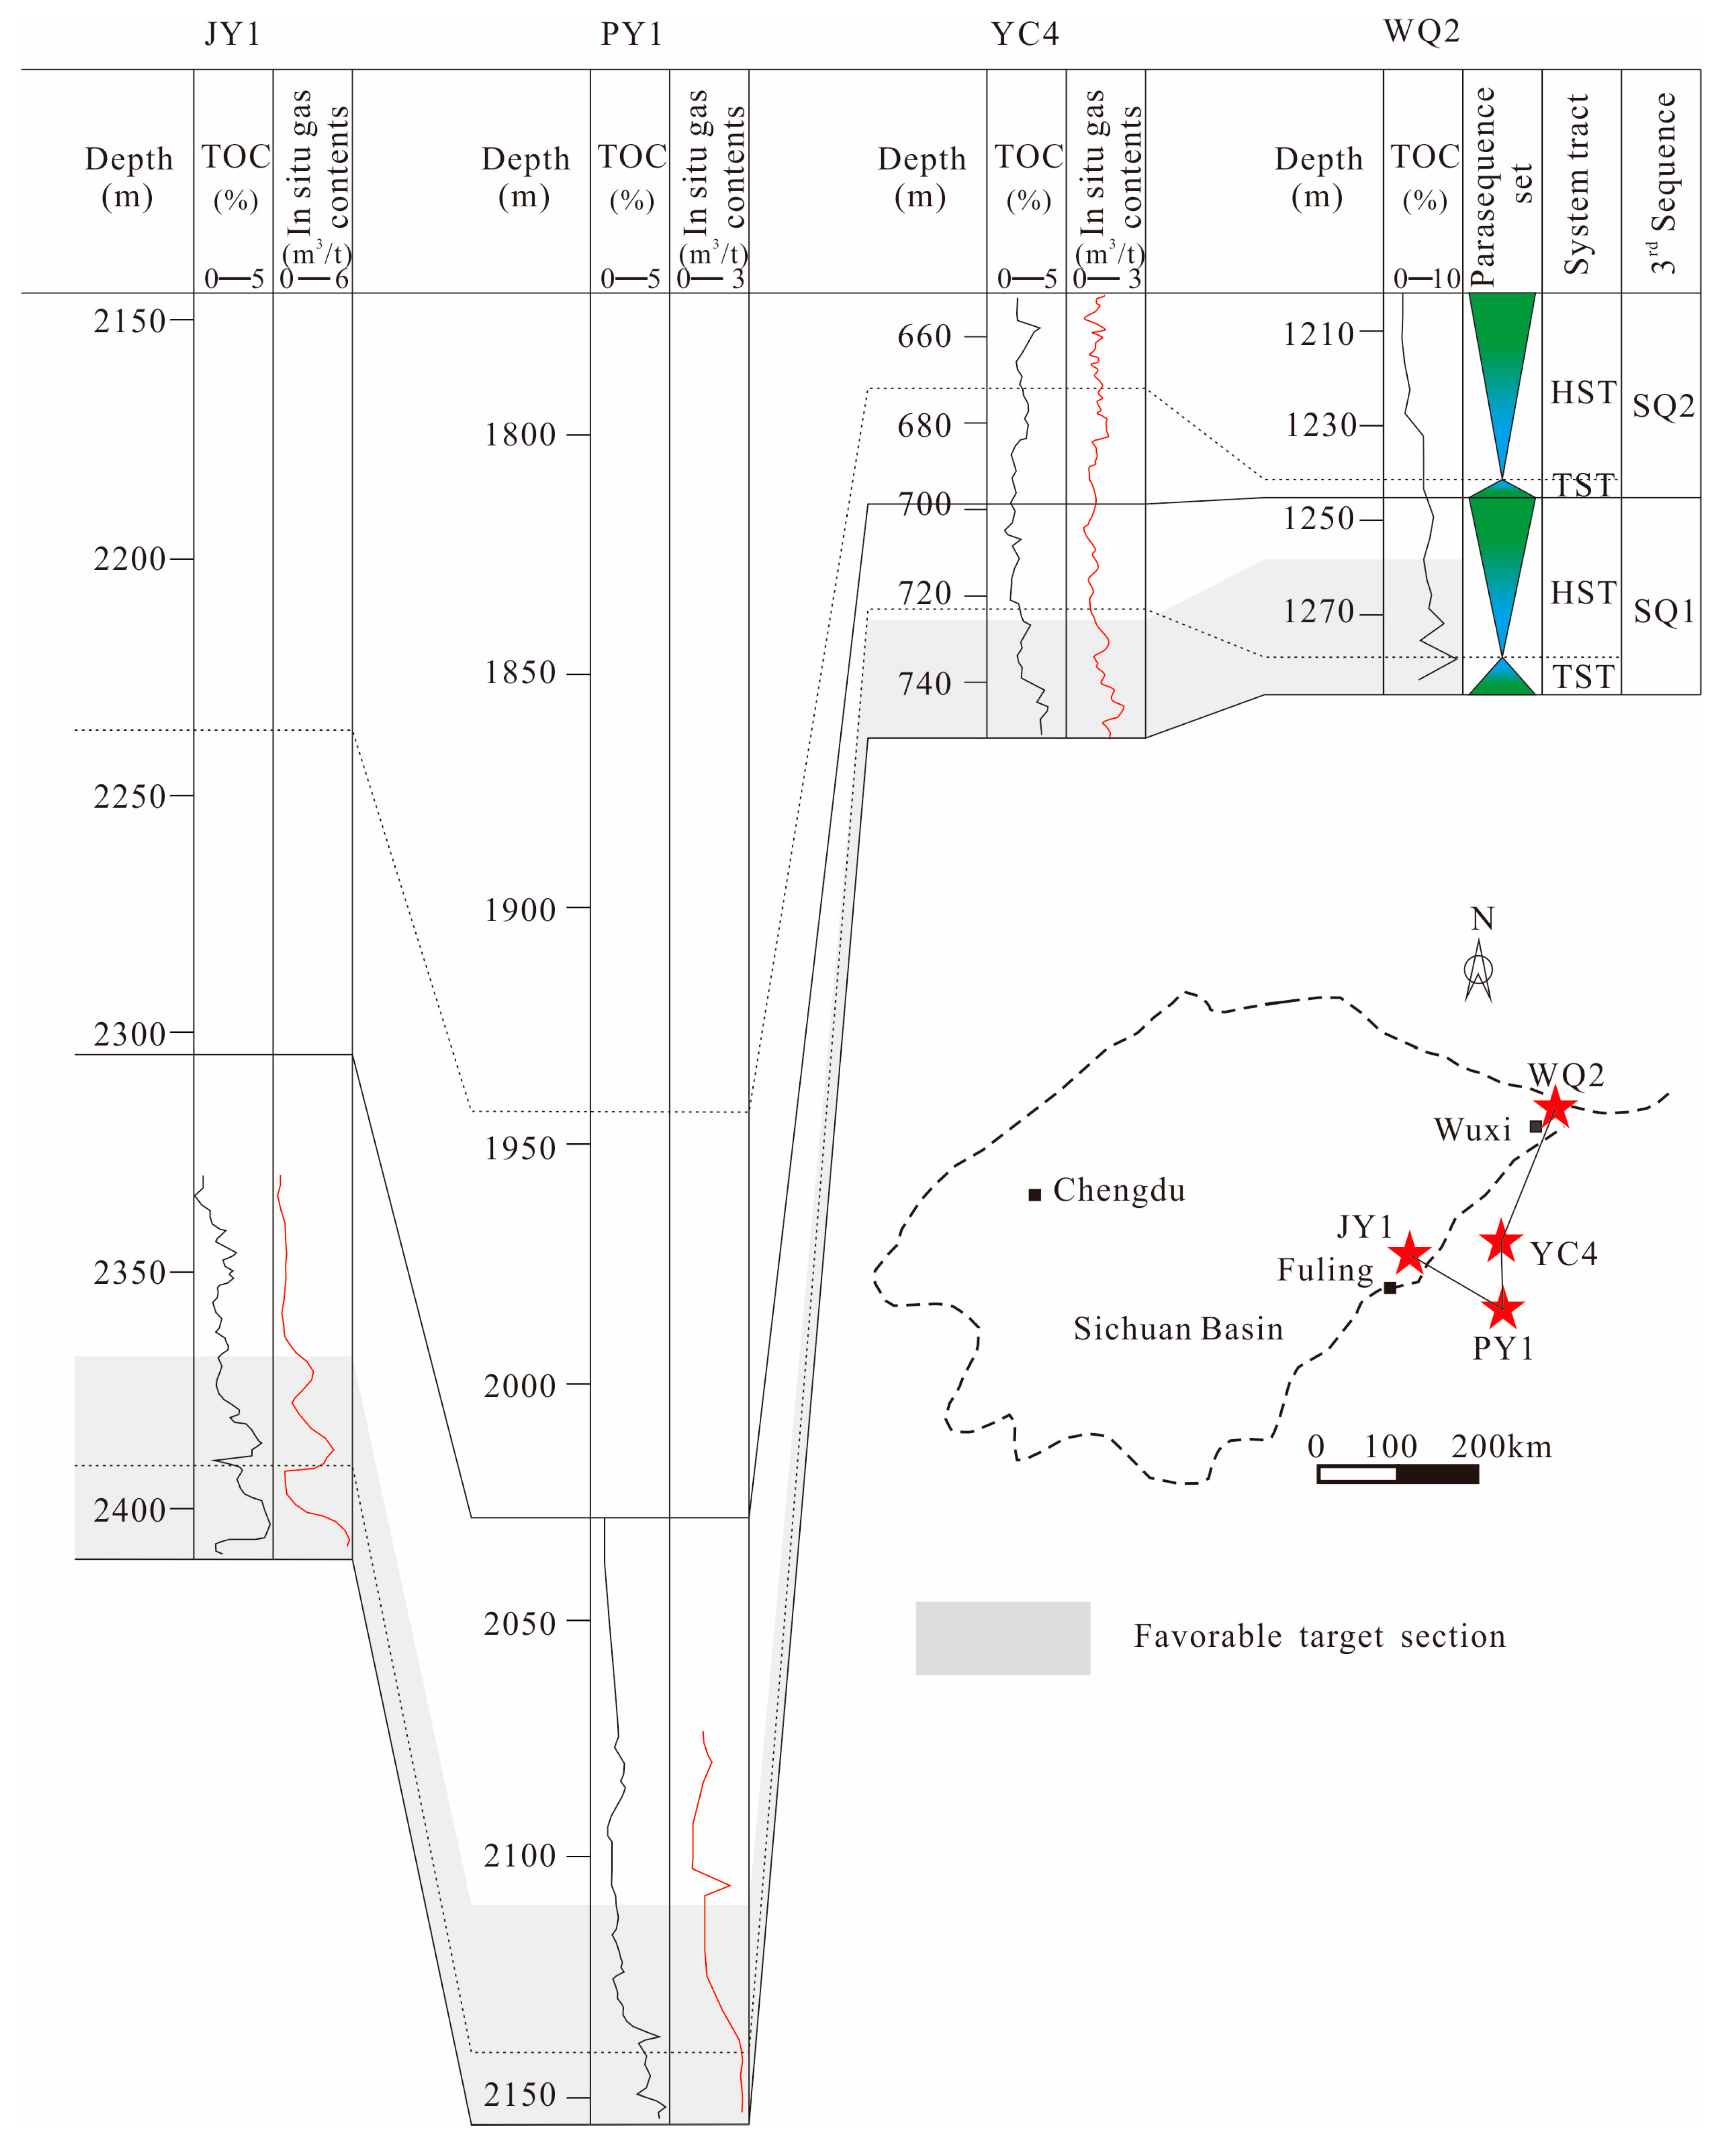
4.5. Compared to the LSL Shale in Southeastern Sichuan Basin

Due to the fact that there is an absence of in situ gas content in Well-WQ2 and very limited exploration wells in the northeastern Sichuan Basin, it is hard to accurately evaluate the favorable shale gas production targeting section in a regional scale. Alternatively, we compared the LSL shale in the study area with that in the southeastern Sichuan Basin, where more than one hundred shale gas wells have achieved commercial gas yield. In this study, Well-YC4, reported by Xiong et al. [8], and Well-JY1 and Well-PY1 in the research of Chen et al. [7] are referenced as typical wells for this comparison (Figure 11 and Figure 12).
There lies a similar law about the vertical variation of reservoir parameters from SQ1 to SQ2 in different shale gas wells [7,8,9]. Taking Well-WQ2 and Well-YC4 as examples, SQ1 has higher quartz and TOC contents but a lower clay mineral content than SQ2 (Figure 11a–c). However, a slight difference exists as well. SQ1 exhibits a lower permeability than SQ2 in Well-YC4, whereas the situation in Well-WQ2 is just the opposite (Figure 11d).
The sequence framework of LSL shale in different wells exhibited that both vertical heterogeneity and lateral heterogeneity commonly exist in LSL shale in and around Sichuan Basin (Figure 12). Vertically, the TOC content and the in situ gas content are variable from SQ1 to SQ2 in each shale gas well. Horizontally, reservoir parameters such as burial depth, strata thickness, and TOC content are heterogeneous in the same third-order sequence of different wells. Nevertheless, a general rule can be identified in that the lower section of SQ1 contains the highest TOC content for all wells and the highest in situ gas content for the referenced wells (Well-JY1, Well-PY1, and Well-YC4) (Figure 12). In the southeastern Sichuan Basin, practical experience demonstrates that SQ1 is the current commercial shale gas production interval for its high gas yield [7]. For example, the horizontal well (length of 1008 m) of Well-JY1 was drilled at an equivalent depth of 2385~2415 m (lower section of SQ1), which got a shale gas yield of 6 × 10⁴ m3/d on average in the first year of trial-production [39].
On the basis of the comparison between LSL shales from the northeastern and southeastern Sichuan Basin, we suggested that the lower part of SQ1 is the most favorable target section for commercial gas extraction by means of drilling horizontal wells with hydraulic fracturing, even though vertical and lateral heterogeneities are regionally expected for LSL shale in the northeastern Sichuan Basin.

5. Conclusions

Based on well logging data and core observations from Well-WQ2 in the northeastern Sichuan Basin, the Silurian Longmaxi formation was divided into two third-order sequences (bottom SQ1 and upper SQ2). Both SQ1 and SQ2 include a TST and HST. The vertical variations in the lithofacies, mineralogical properties, porosity, permeability, TOC, and organic matter maturity of the LSL shale were analyzed and discussed in detail.
Compared with SQ2, SQ1 has high quartz content, high TOC content, high BI, and an abundance of in situ graptolites but low clay mineral content. The vertical heterogeneity exhibited by the lithofacies, mineralogical properties, and TOC content is mainly due to changes in the relative sea level, oxidation-reduction environment, and sediment inputs during the depositional process.
Compared with SQ2, SQ1 has high porosity and permeability, well-developed fractures, and a very low abundance of mineral filling within the fractures. The vertical heterogeneity of the physical properties of the reservoir have resulted from diagenesis, including compaction, cementation, dissolution, and hydrocarbon generation.
The shale of the lower part of SQ1 (especially between the depths of 1271 to 1282 m) has the highest TOC content, BI, porosity, and permeability. Thus, in the Longmaxi formation, the sections in the lower part of SQ1 are the most favorable target for the drilling of horizontal wells and for hydraulic fracturing in the northeastern Sichuan Basin.

Acknowledgments

We acknowledge financial support from the National Natural Science Foundation of China (No. 41472137); the Royal Society Edinburgh and National Natural Science Foundation China (NSFC 41711530129) and the Fundamental Research Funds for the Central Universities (No. 2652016120). We also acknowledge the financial support for a one-year visiting scholar fellowship from the China Scholarship Council (No. 201706400020). This study would not have been possible without the assistance of the Chongqing Institute of Geology and Mineral Resources, especially their support of our fieldwork, geological sampling, and experimental analyses.

Author Contributions

The manuscript was written with contributions from all the authors. All the authors have approved the final version of the manuscript.

Conflicts of Interest

The authors declare no conflicts of interest.

References

  1. Curtis, J.B. Fractures shale-gas system. AAPG Bull. 2002, 86, 1921–1938. [Google Scholar]
  2. Pan, L.; Xiao, X.M.; Tian, H.; Zhou, Q.; Chen, J.; Li, T.F.; Wei, Q. A preliminary study on the characterization and controlling factors of porosity and pore structure of the Permian shales in Lower Yangtze region, Eastern China. Int. J. Coal Geol. 2015, 146, 68–78. [Google Scholar] [CrossRef]
  3. Aljamaan, H.; Holmes, R.; Vishal, V.; Haghpanah, R.; Wilcox, J.; Kovscek, A.R. CO2 storage and flow capacity measurements on idealized shales from dynamic breakthrough experiments. Energy Fuels 2017, 31, 1193–1207. [Google Scholar] [CrossRef]
  4. Mahanta, B.; Tripathy, A.; Vishal, V.; Singh, T.N.; Ranjith, P.G. Effects of strain rate on fracture toughness and energy release rate of gas shales. Eng. Geol. 2017, 218, 39–49. [Google Scholar] [CrossRef]
  5. Vishal, V.; Jain, N.; Singh, T.N. 3-D modeling of propagation of hydraulic fractures in shale at different injection pressures. Sustain. Environ. Res. 2015, 25, 217–225. [Google Scholar]
  6. Firouzi, M.; Alnoaimi, K.; Kovscek, A.; Wilcox, J. Klinkenberg effect on predicting and measuring helium permeability in gas shales. Int. J. Coal Geol. 2014, 123, 62–68. [Google Scholar] [CrossRef]
  7. Chen, L.; Lu, Y.C.; Jiang, S.; Li, J.Q.; Guo, T.L.; Luo, C. Heterogeneity of the Lower Silurian Longmaxi marine shale in the Southeast Sichuan Basin of China. Mar. Pet. Geol. 2015, 65, 232–246. [Google Scholar] [CrossRef]
  8. Xiong, F.Y.; Jiang, Z.X.; Tang, X.L.; Li, Z.; Bi, H.; Li, W.B.; Yang, P.P. Characteristics and origin of the heterogeneity of the Lower Silurian Longmaxi marine shale in Southeastern Chongqing, SW China. J. Nat. Gas Sci. Eng. 2015, 27, 1389–1399. [Google Scholar] [CrossRef]
  9. Wang, Y.M.; Dong, D.Z.; Li, X.J.; Huang, J.L.; Wang, S.F.; Wu, W. Stratigraphic sequence and sedimentary characteristics of Lower Silurian Longmaxi Formation in Sichuan Basin and its peripheral areas. Int. Nat. Gas Ind. B 2015, 2, 222–232. [Google Scholar] [CrossRef]
  10. Dai, J.X.; Zou, C.N.; Liao, S.M.; Dong, D.Z.; Ni, Y.Y.; Huang, J.L.; Wu, W.; Gong, D.Y.; Huang, S.P.; Hu, G.Y. Geochemistry of the extremely high thermal maturity Longmaxi shale gas, southern Sichuan Basin. Org. Geochem. 2014, 74, 3–12. [Google Scholar] [CrossRef]
  11. Tang, X.L.; Jiang, Z.X.; Li, Z.; Gao, Z.Y.; Bai, Y.Q.; Zhao, S.; Feng, J. The effect of the variation in material composition on the heterogeneous pore structure of high-maturity shale of the Silurian Longmaxi Formation in the Southeastern Sichuan Basin, China. J. Nat. Gas Sci. Eng. 2015, 23, 464–473. [Google Scholar] [CrossRef]
  12. Ji, W.M.; Song, Y.; Jiang, Z.X.; Chen, L.; Li, Z.; Yang, X.; Meng, M.M. Estimation of marine shale methane adsorption capacity based on experimental investigations of Lower Silurian Longmaxi Formation in the Upper Yangtze Platform, South China. Mar. Pet. Geol. 2015, 68, 94–106. [Google Scholar] [CrossRef]
  13. Wu, J.; Liang, F.; Bai, W.H.; Lin, W.; Zhao, R. Exploration prospect of Lower Silurian Longmaxi Formation shale gas in Northeastern Chongqing City. Spec. Oil Gas Reserv. 2015, 22, 50–55, (In Chinese with English abstract). [Google Scholar]
  14. Westphal, H.; Eberli, G.P.; Smith, L.B.; Grammer, G.M.; Kislak, J. Reservoir characterization of the Mississippian Madison Formation, Wind River Basin, Wyoming. AAPG Bull. 2004, 88, 405–432. [Google Scholar] [CrossRef]
  15. Jiang, Z.X.; Guo, L.; Liang, C. Lithofacies and sedimentary characteristics of the Silurian Longmaxi shale in the Southeastern Sichuan Basin, China. J. Palaeogeogr. 2013, 2, 238–251. [Google Scholar]
  16. Eaton, T.T. On the importance of geological heterogeneity for flow simulation. Sediment. Geol. 2006, 184, 187–201. [Google Scholar] [CrossRef]
  17. Weber, K. Influence of common sedimentary structures on fluid flow in reservoir models. J. Pet. Technol. 1982, 34, 665–672. [Google Scholar] [CrossRef]
  18. Cartoon, M.R. The effects of reservoir heterogeneity on predicted waterflood performance in the Dodsland Field. J. Can. Pet. Technol. 1993, 34, 31–38. [Google Scholar]
  19. Ouchi, H.; Foster, T.; Sharma, M.M. Effect of reservoir heterogeneity on the vertical migration of hydraulic fractures. J. Pet. Sci. Eng. 2016, 151, 384–408. [Google Scholar] [CrossRef]
  20. Burchette, T.P.; Wright, V.P.; Faulkner, T.J. Oolitic sandbody depositional models and geometries, Mississippian of Southwest Britain: Implications for petroleum exploration in carbonate ramp settings. Sediment. Geol. 1990, 68, 87–115. [Google Scholar] [CrossRef]
  21. Kerans, C.; Lucia, F.J.; Senger, R.K. Integrated characterization of carbonate ramp reservoirs using Permian San Andres Formation outcrop analogs. AAPG Bull. 1994, 78, 181–216. [Google Scholar]
  22. Wang, X.Z.; Zhang, L.X.; Gao, C. The heterogeneity of lacustrine shale gas reservoir in Yanchang formation, Xiasiwan area, Ordos Basin. Acta Geol. Sin. Eng. 2015, 89, 99–101. [Google Scholar] [CrossRef]
  23. Houben, M.E.; Desbois, G.; Urai, J.L. A comparative study of representative 2D microstructures in shaly and sandy facies of opalinus clay (Mont Terri, Switzerland) inferred form BIB-SEM and MIP methods. Mar. Pet. Geol. 2014, 49, 143–161. [Google Scholar] [CrossRef]
  24. Li, R.X.; Dong, S.W.; Lehrmann, D.; Duane, L.Z. Tectonically driven organic fluid migration in the Dabashan Foreland Belt: Evidenced by geochemistry and geothermometry of vein-filling fibrous calcite with organic inclusions. J. Asian Earth Sci. 2013, 75, 202–212. [Google Scholar] [CrossRef]
  25. Ma, Y.; Zhong, N.N.; Li, D.H.; Pan, Z.J.; Cheng, L.J.; Liu, K.Y. Organic matter/clay mineral intergranular pores in the Lower Cambrian Lujiaping shale in the north-eastern part of the Upper Yangtze area, China: A possible microscopic mechanism for gas preservation. Int. J. Coal Geol. 2015, 137, 38–54. [Google Scholar] [CrossRef]
  26. Meng, Q.R.; Zhang, G.W. Geologic framework and tectonic evolution of the Qinling Orogen, Central China. Tectonophysics 2000, 323, 183–196. [Google Scholar] [CrossRef]
  27. Nie, H.K.; Zhang, J.C.; Bao, S.J.; Bian, R.K.; Song, X.J.; Liu, J.B. Shale gas accumulation conditions of the Upper Ordovician–Lower Silurian in Sichuan Basin and its periphery. Oil Gas Geo. 2012, 33, 335–345, (In Chinese with English abstract). [Google Scholar]
  28. Pecharsky, V.K.; Zavalij, P.Y. Fundamentals of Powder Diffraction and Structural Characterization of Minerals; Kluwer Academic Publishers: New York, NY, USA, 2003; p. 713. [Google Scholar]
  29. Jacob, H. Dispersed solid bitumens as an indicator for migration and maturity in prospecting for oil and gas. Erdöl Kohle Erdgas Petrochem. 1985, 38, 365–392. [Google Scholar]
  30. Chen, L.; Lu, Y.C.; Jiang, S.; Li, J.Q.; Guo, T.L.; Luo, C.; Xing, F.C. Sequence stratigraphy and its application in marine shale gas exploration: A case study of the Lower Silurian Longmaxi Formation in the Jiaoshiba shale gas field and its adjacent area in southeast Sichuan Basin, SW China. J. Nat. Gas Sci. Eng. 2015, 27, 410–423. [Google Scholar] [CrossRef]
  31. Shi, X.Y.; Jiang, G.Q.; Zhang, C.H.; Gao, L.Z.; Liu, J. Sand veins and MISS from the Mesoproterozoic black shale (ca. 1.7 Ga) in north China: Implication for methane degassing from microbial mats. Sci. China-Earth Sci. 2008, 51, 1525–1536. [Google Scholar] [CrossRef]
  32. Jarvie, D.M.; Hill, R.J.; Ruble, T.E.; Pollastro, R.M. Unconventional shale-gas system: The Mississippian Barnett shale on north-center Texas as one model for thermogenic shale-gas assessment. AAPG Bull. 2007, 91, 475–499. [Google Scholar] [CrossRef]
  33. Zhang, T.W.; Ellis, G.S.; Ruppel, S.C.; Milliken, K.; Yang, R.S. Effect of organic-matter type and thermal maturity on methane adsorption in shale-gas systems. Org. Geochem. 2012, 47, 120–131. [Google Scholar] [CrossRef]
  34. Gasparik, M.; Bertier, P.; Gensterblum, Y.; Ghanizadeh, A.; Krooss, B.M.; Littke, R. Geological controls on the methane storage capacity in organic-rich shales. Int. J. Coal Geol. 2013, 123, 34–51. [Google Scholar] [CrossRef]
  35. Chalmers, G.R.L.; Ross, D.J.K.; Bustin, R.M. Geological controls on matrix permeability of Devonian gas shales in the Horn River and Liard Basins, Northeastern British Columbia, Canada. Int. J. Coal Geol. 2012, 103, 120–131. [Google Scholar] [CrossRef]
  36. Tian, H.; Pan, L.; Xiao, X.M.; Wilkins, R.W.T.; Meng, Z.P.; Huang, B.J. A preliminary study on the pore characterization of Lower Silurian black shales in the Chuandong Thrust Fold Belt, southwestern China using low pressure N2 adsorption and FE-SEM methods. Mar. Petrol. Geol. 2013, 48, 8–19. [Google Scholar] [CrossRef]
  37. Zheng, H.R.; Gao, B.; Peng, Y.M.; Nie, H.K.; Yang, F.R. Sedimentary evolution and shale gas exploration direction of the Lower Silurian in Middle-Upper Yangtze area. J. Palaeogeogr. 2013, 15, 645–656, (In Chinese with English abstract). [Google Scholar]
  38. Cheng, L.X.; Wang, Y.J.; Chen, H.D.; Wang, Y.; Zhong, Y.J. Sedimentary and burial environment of black shales of Sinian to Early Palaeozoic in Upper Yangtze region. Acta Pet. Sin. 2013, 29, 2906–2912. [Google Scholar]
  39. Guo, T.L.; Zhang, H.R. Formation and enrichment mode of Jiaoshiba shale gas field, Sichuan Basin. Pet. Explor. Dev. 2014, 4, 28–36, (In Chinese with English abstract). [Google Scholar] [CrossRef]
Figure 1. Locations of the northeastern Sichuan Basin, tectonic provinces, and sampled shale gas well.
Minerals 07 00151 g001
Figure 2. Integrated stratigraphic column of the northeastern Sichuan Basin. H-C is the abbreviation for hydrocarbon.
Minerals 07 00151 g002
Figure 3. Vertical variations in the lithofacies, sedimentary sequence, and relative sea level of the Lower Silurian Longmaxi formation (LSL) of Well-WQ2. TST = transgressive system tract. HST = a high-stand system tract. SB = sequence boundary. (a,b) Tawny siliceous-argillaceous veins with a width of ~1 mm; (c) Pyrite phenocrysts with good roundness (diameter of ~1 mm); (d,g,h) Horizontal bedding structure shown by the cross-sections of cores; (e) Pyrite spot with an elliptical shape; (f) Typical pure carbonaceous shale.
Minerals 07 00151 g003
Figure 4. Graptolites of Pastrites (P) and Akidograptus (A) in the collected cores. (a,b) Graptolites are randomly oriented in shales and dominated by Akidograptus and a few Pastrites; (c) Only a few Akidograptus exist; (d) Very few graptolites can be observed.
Minerals 07 00151 g004
Figure 5. Vertical variations in the mineral composition, total organic carbon (TOC), vitrinite reflectance (Ro), and brittleness Index (BI) of the LSL shales of Well-WQ2. TST = transgressive system tract; HST = high-stand system tract. (a,b,f) Well-developed fractures illustrated by microfocus photography; (c,d) Microfracture system shown saturating the core with distilled water; (e) Developed fracture with a width of ~0.1 mm.
Minerals 07 00151 g005
Figure 6. Ternary plot of the mineral compositions of SQ1 and SQ2.
Minerals 07 00151 g006
Figure 7. Relationship between the TOC content and quartz content.
Minerals 07 00151 g007
Figure 8. Photomicrographs of some siliceous organisms in the collected shale samples (plane-polarized light). (a) Sponge spicule with monaxonid megascleres; (b) Radiolarian belonging to the Phaeodaria group.
Minerals 07 00151 g008
Figure 9. Relationship between the porosity and permeability of the shales from (a) SQ1 and (b) SQ2.
Minerals 07 00151 g009
Figure 10. Scanning electron microscope (SEM) images showing fractures and mineral filling. (a) Well-developed microfractures system and good connectivity between intergranular pores; (b,c) Microfractures filled by certain minerals and poor connectivity between intergranular pores.
Minerals 07 00151 g010
Figure 11. The comparisons of (a) quartz content; (b) clay minerals content; (c) TOC content and (d) permeability for LSL shale between the study well and Well-YC4 from the southeastern Sichuan Basin. The data of Well-YC4 is referenced from Xiong et al. [8]. The location of Well-YC4 is identified in Figure 12.
Minerals 07 00151 g011
Figure 12. Sequence framework of the Longmaxi Formation across the southeastern and northeastern Sichuan Basin. The data for Well-JY1 and Well-PY1 are referenced from Chen et al. [7], and Well-YC4 is from Xiong et al. [8].
Minerals 07 00151 g012

