Optical Observations and Geochemical Data in Deep-Sea Hexa- and Octo-Coralla Specimens


1
Institut de Physique du Globe de Paris (IPGP), UMR CNRS 7154, Université Paris Diderot, 1 Rue Jussieu, F-75238 Paris CEDEX 05, France
2
Museum National d’Histoire Naturelle, CR2P, 8 rue Buffon, 75005 Paris, France
3
Laboratoire des Sciences du Climat et de l’Environnement (LSCE), UMR 8212 (CEA/CNRS/UVSQ/UPS) 4, Avenue de la Terrasse, F-91198 Gif-sur-Yvette CEDEX, France
*
Author to whom correspondence should be addressed.
Minerals 2017, 7(9), 154; https://doi.org/10.3390/min7090154
Submission received: 13 July 2017
/
Revised: 17 August 2017
/
Accepted: 23 August 2017
/
Published: 25 August 2017
(This article belongs to the Special Issue Organo-Mineral Interactions)
Abstract
:Coral skeletons are built by Ca-carbonate (calcite or aragonite) crystals that exhibit distinct morphological patterns and specific spatial arrangements that constitute skeletal microstructures. Additionally, the long-standing recognition that distinct coral species growing in similar conditions are able to record environmental changes with species-specific responses provides convincing evidence that, beyond the thermodynamic rules for chemical precipitation, a biological influence is at work during the crystallization process. Through several series of comparative structural and geochemical (elemental and isotopic) data, this paper aims to firmly establish the specific properties of the distinct major taxonomic units that are commonly gathered as deep-water “corals” in current literature. Moreover, taking advantage of recent micrometric and infra-micrometric observations, attention is drawn to the remarkable similarity of the calcareous material observed at the nanoscale. These observations suggest a common biomineralization model in which mineralogical criteria are not the leading factors for the interpretation of the geochemical measurements.
1. Introduction
Reconstructing accurate environmental parameters for seawater is one of the main goals in paleoceanography as interactions between seawater and atmosphere have many implications on the Earth climate system. The conditions of the sea surface (e.g., Temperature, Salinity, pH) are well-studied from diverse biocarbonates with the pioneering works of [1,2,3]. Since the 1990s, deep-sea scleractinian aragonitic corals (DSSC, Figure 1c,d) have been used as deep-ocean archives to mainly characterize the physico-chemical properties of deep-water masses from their oxygen isotopic compositions, 14C content and elemental ratios ([4,5,6,7,8] and references therein). While paleoclimatic applications involving DSSC are numerous (e.g., [9,10,11,12,13]), fundamental questions on the understanding of their biomineralization mechanisms are still under debate (e.g., [8,14,15,16]).
More recently, to extend the range of paleoceanographic data and to overcome the problem linked to biomineralization processes, the scientific community has been interested in another type of coral, calcitic in nature, the deep-sea octocorallian corals (DSOC, Figure 1a,b) (e.g., [17,18,19,20,21,22,23]). DSSC and DSOC both share the advantages of being well distributed in the global oceans over a large range of depth and having a long longevity [24]. However, their use as environmental archives is complicated by physiological factors (the so-called vital effects) [2]. The effects of these factors have been more commonly described for DSSC, and they could include processes like change in the chemistry of the calcifying medium via active biological pumps, increase of the internal pH [25,26,27], and kinetic effects [28,29,30]. In DSSC, the main particularity is the link between the geochemical signature and the optically observable microstructures, i.e., centers of calcification and fibers ([31], for a review see [8,15]; and references therein). These microstructures were first observed in tropical corals and were described as “the points from which fibers diverge” [32]. However, these microstructures seem not to be present in DSOC, implying that these corals could be easier to utilize as paleoenvironmental archives relative to DSSC.
Calcareous skeletons built by the Scleractinia corals (Anthozoa Hexacoralla) and the Bamboo corals (Octocoralla, Isididae) exhibit clear differences with respect to the anatomical relationship between the soft tissues and the underlying calcareous hard-parts. In both cases, formation of the solid skeletons is due to mineralizing activity of the basal ectodermic epithelium but, in Bamboo corals, the polyps are not involved in the formation of the massive axes.
The main calcareous structure on which chemical measurements are carried out is produced by the basal ectoderm of the animal but only by the part of the soft tissues that join the polyps together (Figure 1f). Polyps of the Bamboo corals have their own mineralizing activity but, as in many Octocoral families, polyps of the Bamboo corals also produce tiny calcareous units called the spicules (Figure 1f) that are built by either a single or a small number of associated ectodermal cells. Morphological diversity of these spicules is remarkable and clearly linked to taxonomy. Each species produces its own specific assemblage of spicules where morphologies are so diverse and precise that they have been used as taxonomic criteria since the early corallian studies. Unfortunately, although closely bound together during polyp life, the spicules remain basically free and are typically dispersed after decay of the polyp tissues. This makes a precise identification of the fossil axes generally impossible at the species level. Contrastingly, in the Scleractinia, either solitary (Figure 1a,b) or colonial, the polyp itself is the mineralizing unit. However, in many colonial forms, individuality of the polyps is hardly recognizable (e.g., Figure 2d).
To test the potential difference between the aragonite or calcite mineralizing corals, we present in this study bulk and in situ elemental (Li, Na, Mg, and Sr) and isotopic (δ18O, δ13C and δ11B) measurements in samples of gorgonian Bamboo corals carried out on recently collected samples from the collection of the Muséum National d’Histoire Naturelle (MNHN) of Paris integrated in a comparison involving results from the literature. The new results generated from analyses of these Bamboo corals were then compared to the Scleractinia literature data, allowing for parallels to be drawn between this geochemical synthesis and a series of observation data illustrating recent changes in the concept of crystalline calcium carbonate polymorphs (viewed as the basic unit of coral skeletons).
2. Materials and Methods
2.1. Scleractinian Coral and Octocorallan Coral
In the Scleractinia, nowhere is the precise biological control exerted by the polyp on Ca-carbonate deposition more visible than at the growing edge of the septa, as illustrated by Figure 2b,c,e,f. The obvious control exerted by the polyp on the morphology of its skeletal components explains why, from Milne-Edwards [33] up to Wells [34], morphology was almost exclusively used as taxonomic criteria. However, at the end of the 19th century, the pioneering investigations of Ogilvie [32] initiated a new taxonomical approach by studying the microstructure of the coral skeletons, i.e., the three-dimensional arrangements of the fibrous units that built the septa and walls of the corallites. The remarkably simple organization of the skeleton in the DSSC Lophelia illustrates the surprising difference in the crystallization pattern between the two areas that are involved in building the septa and walls in every Scleractinia coral (Figure 1c,d and Figure 2g,j).
Remarkably, this innovative method was almost universally rejected over decades. The main reason is that observation of thin sections of coral observed in transmitted polarized light (Figure 3a), and later confirmed by Scanning Electron Microscope (SEM) views (Figure 3b,c) provides obvious support to the concept of “spherulitic crystallization” as a mechanism for skeleton formation in corals [35]. Reinforced by the statement that coral skeletons were “biologically induced” structures (i.e., with skeletal organization weakly controlled [36,37]), this resulted in the long-term consensus that the chemical measurements made on coral skeletons can be interpreted only from a purely chemical and thermodynamic viewpoint.
From a historical perspective, Weber and Woodhead [38] were able to establish the first data that progressively led to an opposite view. The species-specific differences of oxygen isotopic fractionations made obvious the existence of a biological mechanism able to influence not only the morphology of the scleractinian coral skeletons, but also their composition up to the isotopic level (as hypothesized by Urey et al. [2] by the expression “vital effect”). Several decades of chemical and physical investigations were required to establish converging support to the Weber and Woodhead [38] evidence by showing that, up to the nanometric level, specific organic components interfere with the crystallization process. In this slow methodological progression, evidence of the specific composition and structure of the initial mineralization area was an important step, illustrated by Figure 3d–g. Interestingly, the essential role of these early mineralizing areas as the developmental framework of coral skeletons was proposed more than a century ago in paleontological investigations by Volz [39] who termed the shape formed by these particular areas “urseptum” (=primitive septum).
The observation of the presence of organic components associated with the formation of any biological Ca-carbonate was generalized during the last decades. This feature appears also in the studied bamboo corals, which are used as representatives of biological calcite in this study (Figure 4). Noticeably, owing to the origin of the solid axis secreted by the common tissues joining the polyps, the microstructure of these skeletal samples is simpler compared to the Scleractinia corallites. No distinction between centers of calcification and fibers can be made in this type of corals. However, as in the skeletons of the Scleractinia, organic components can be characterized into the crystallized structure of the DSOC axes (Figure 4d–f).
2.2. Description of the Corals Measured in the Study
Three bamboo corals were studied: two modern samples coming from the collection of the Museum National d’Histoire Naturelle de Paris (Terrasses and Jasus samples, Figure 5a,b), and one sample coming from the collection of the Laboratoire des Sciences du Climat et de l’Environnement (Valpareso sample, Figure 5c). The Terrasses sample (MNHN-IK-2008-1541) was collected in October 2008 at a depth between 511 m and 1050 m, off New Caledonia (21°58′ S, 167°07′ E). The Jasus sample (MNHN-IK-2011-1576), Isidella sp., was recovered in July 1986 from a depth between 1575 m and 2100 m, near Saint Paul Island (38°38′ S, 77°19′ E). The Valpareso sample was collected off the coast of Chile (33° S, 77° W) at a depth of 500 m [40].
To determine the age of the Chilean DSOC (Valpareso sample), five 14C datations were performed at the national facility ARTEMIS, Laboratoire de Mesure du Carbone 14 (UMS 2572, Gif-sur-Yvette, France). The samples were taken from the center to the periphery of the Valpareso section. After collection of the carbonate powder (equivalent to about 1 mg of C), the calcite samples were attacked with dehydrated orthophosphoric acid at 60 °C to produced CO2 (see [41] for a full description of the system). The CO2 was then reduced by H2 in the presence of iron powder at 600 °C. The amount of iron was equal to 3 times the amount of carbon. The carbon was then deposited onto the iron powder and the resulting assembly was then pressed into a target.
The 14C activity of the sample was calculated by comparing the sequentially measured intensities of the 14C, 13C and 12C bundles of each sample with those of CO2 standards prepared from the oxalic reference acid HOxII. It is expressed in pMC (percent modern carbon) standardized at a δ13C value of −25‰. The radiocarbon ages were calculated according to [42] by correcting the fractionation with the δ13C calculated from the measurement of the 13C/12C ratio on ARTEMIS. This δ13C analysis includes fractionation occurring both during sample preparation and during Accelerator Mass Spectrometry (AMS) measurement. The measurement error takes into account the statistical error, the variability of the results and the blank subtracted from the result. The result is given without reservoir age subtraction.
The data on Valpareso sample indicate a duration of formation of the calcititic skeleton between 397 years and 659 years (Table 1). The mean growth rate is in between 45 μm and 75 μm per year, in agreement with others estimates [43,44,45]. However, the first 10 mm of the specimen exhibited faster growth compared to that of the next 20 mm.
2.3. Bulk Measurements
2.3.1. Oxygen and Carbon Isotopic Measurements
On the Valpareso and Jasus samples, two different sub-sampling strategies were carried out. We first applied macro-sampling (Valpareso sample) to document the stable isotopic composition of our samples with those previously published by applying a similar subsampling technique. For this coral sample, about 20 aliquots from equidistant locations on the radius were taken from the inner part to the outer part of the skeleton. The carbonate powders were obtained using a dental drill (0.8 mm diameter) thus providing about 200 μg of carbonate.
The second sampling strategy was based on studies taking into consideration the microstructure of DSSC [25,46,47,48,49]. Therefore, we used a micro-sampling technique to allow for a continuous sampling of “Jasus” skeleton. A slab of coral was cut perpendicular to its growth axis and mounted with epoxy on a glass slide. The sample was then polished with abrasive paper to obtain a flat surface that was first digitalized and then milled using a micro-sampler (Micromill, New Wave Research, ESI Inc., Fremont, CA, USA). The resolution of the sampling using this technic is about 250 μm, and was used to derive an estimate of the isotopic variability at the surface of the sample.
About 100 μg of carbonate (either from micro-drilling or classical drilling) were reacted with 100% phosphoric acid at 90 °C in an automated line coupled to an OPTIMA VG mass spectrometer. (Isoprime Inc., Manchester, UK) Results are reported in delta notation expressed in per mil relative to V-PDB (Vienna Pee Dee Belemnite). The reproducibility (1 SD) is ±0.07‰ for δ18O and ±0.05‰ for δ13C.
2.3.2. Trace Element Measurements
Powders obtained by microdrill were also used to perform trace element measurements by ICP-MS (Inductively Coupled Plasma Mass Spectrometry). The coral powders were dissolved in ultraclean HNO3 solution (0.5 N). The isotopes of 23Na, 24Mg, 43Ca, 44Ca and 88Sr were measured to determine the TE/Ca ratios. The carbonate standard JCp-1 was analyzed before and after the 22 coral samples to ensure of the stability and the accuracy of the measurements. A reproducibility of ±0.5% was obtained for Na/Ca, Mg/Ca and Sr/Ca ratios.
2.4. SIMS Measurements
For SIMS (Secondary Ion Mass Spectrometry) measurements, a branch of the studied corals (Jasus, Terrasses, and Valpareso) was cut perpendicular to the growth axis. The samples were mounted in epoxy and then polished down to 1-μm diamond paste. Ion probe analyses were performed at CRPG-CNRS (Nancy, France) using the Cameca ims 1280 HR2 for isotopic measurements and the Cameca ims 3f for the elemental analyses.
2.4.1. Oxygen and Boron Isotopic Measurements
The instrumental conditions are similar to those described in [50]. Briefly, a primary beam of Cs+ ions with an impact energy of 10 kV and an intensity of 5 nA was focused to a spot of approximately 5 μm wide and 15 μm long. A normal-incidence electron flood gun was used to compensate for sample charging during analysis. Measurements of O isotopes were conducted in multicollection mode (secondary ions counted simultaneously) using two off-axis Faraday cups (L’2 and H1). The measurements were performed with ion intensities of about 5 × 10⁶ counts per second (cps) on the 18O− peak. The typical acquisition sequences were 25 cycles of 2 s duration each. In multicollection, the L’2 and H1 Faraday cup gains were systematically inter-calibrated at the beginning of each analytical session. During the analytical session, the internal reproducibility was better than ±0.1‰ and the external reproducibility, based on repeated measurements of two in-house calcite reference materials (MEX and CARB, [50]), was between ±0.1‰ and ±0.3‰ (1σ), depending on the analytical session. As gorgonian corals are composed of high-Mg calcite, the effect of Mg content on the instrumental mass fractionation was corrected using the method described in [51]. All of the following δ18O values are expressed relative to the V-PDB international standard.
For the ion probe analyses, we used the same technique as described in [27,49]. A primary beam of 16O− ions with an intensity of about 50 nA was focused to a spot of about 15-μm wide and 35-μm long. A mass resolution of ≈3000 was used for B isotope analyses. The boron isotopes were analyzed in monocollection mode using the central electron multiplier. The typical intensities of 11B+ were about 6000 cps. The analysis consists of 60 cycles of 10 s for 10B+ and 6 s for 11B+ after a presputtering of 60 s. Thus a typical internal error of ±0.8‰ was reached for the samples. The reference material was a calcium carbonate with a B concentration of 22 ppm and a δ11B of 17.8‰ relative to NIST SRM 951 standard. The average external error, as estimated by multiple measurements of the reference material, was ±1.1‰ (1σ).
2.4.2. Trace Elements
For trace element measurements (Li, Na, Mg, Sr/Ca), the analytical conditions are the same as described in [30]. A focused O− ion beam of about 10 nA was used to analyze the samples. Ions of 7Li+, 23Na+, 24Mg+, 44Ca+ and 88Sr+ were measured using a −70 eV energy filtering after a presputtering time of 2 min, in monocollection mode on an electron multiplier. The possible isobaric interference of 88Sr2+ on 44Ca+ was checked by measuring the mass 43.5 (87Sr2+) and was observed as negligible. The calcite in-house reference OKA-C was used to determine the Na/Ca and Mg/Ca ion yields (Na/Ca = 1.94 mmol/mol, Mg/Ca = 4.55 mmol/mol, Sr/Ca = 19.3 mmol/mol, [52]), and CAL-HTP [53] was used to calibrate the Li/Ca. The external reproducibility was determined by multiple measurements of the reference materials, and for, Li/Ca measurements, it was ±10%; for Na/Ca, ±3%; and ±1.5% for Mg/Ca and Sr/Ca (1σ).
3. Results
3.1. Oxygen and Carbon Isotopic Compositions
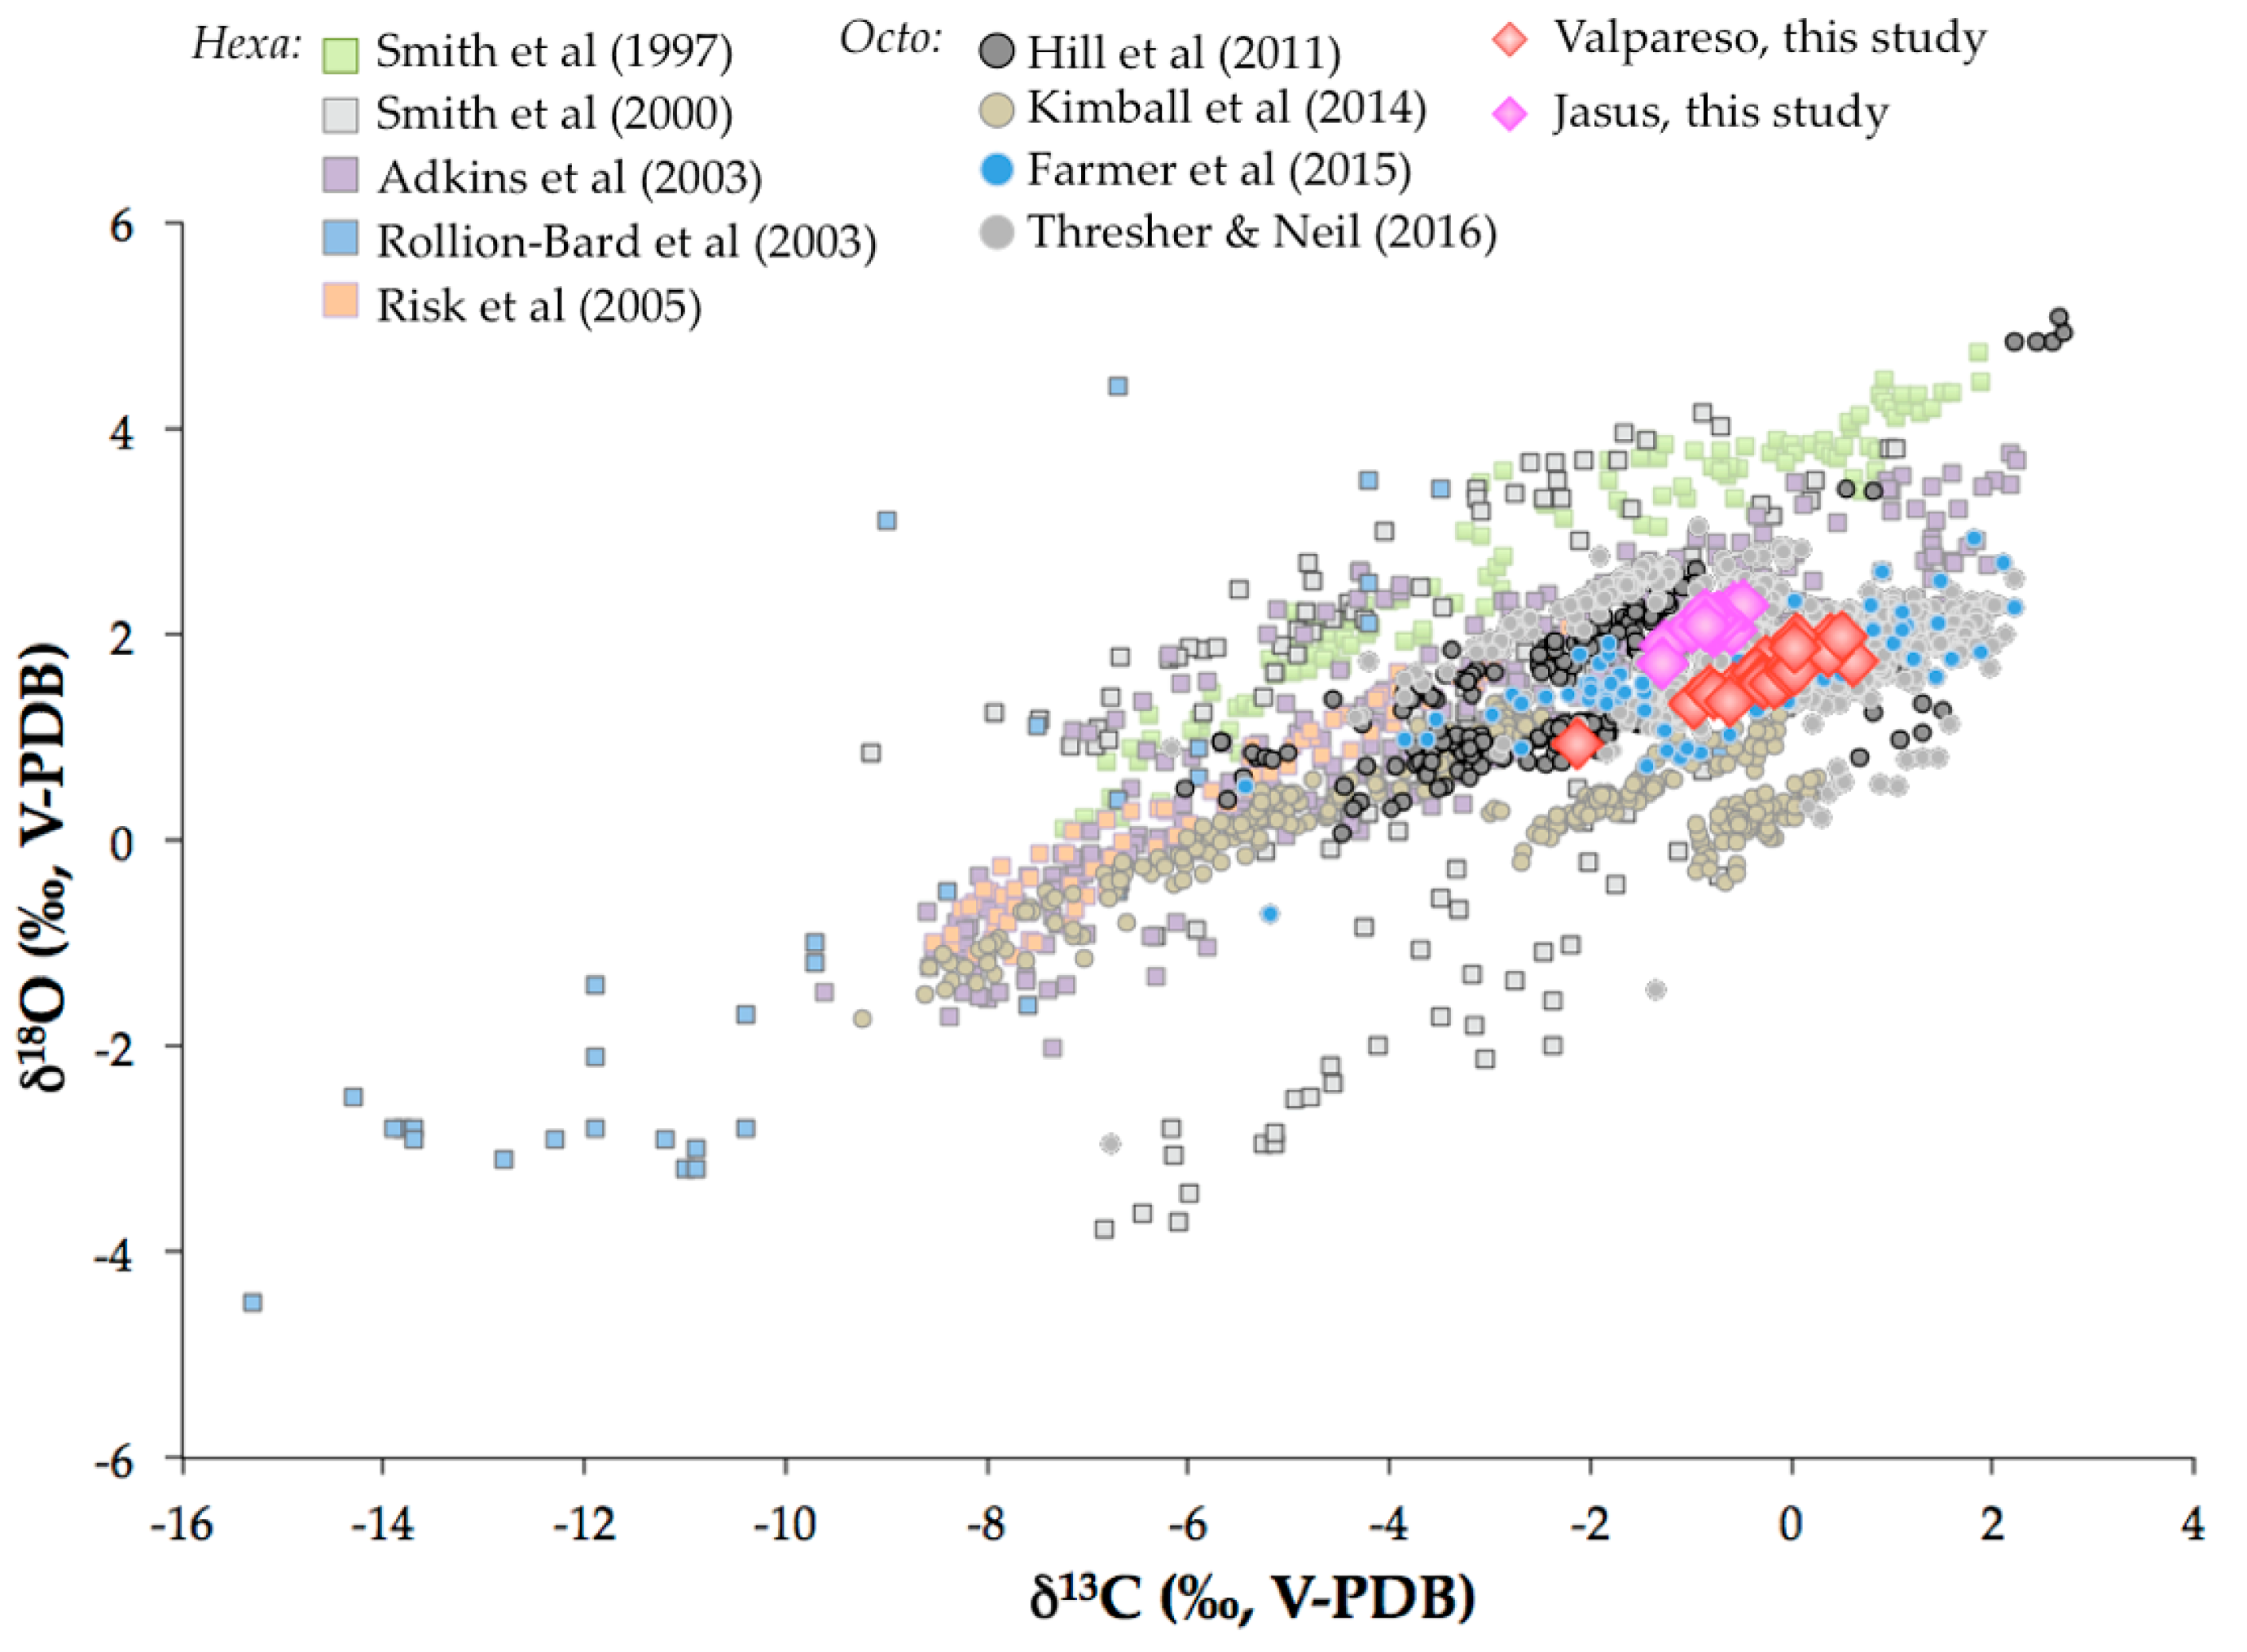
The Valpareso and Jasus samples were measured by bulk techniques for their oxygen and carbon isotopic compositions. The isotopic variability for Valpareso is 1.05‰ for δ18O (from 0.93‰ to 1.98‰) and 2.75‰ for δ13C (from −2.13‰ to 0.62‰); for Jasus the range of δ18O values is 0.56‰ (from 1.71‰ to 2.28‰) and 0.81‰ for δ13C measurements (from −1.29‰ to −0.48‰) (Table S1). For both samples, δ18O versus δ13C values present a strong linear relationship (R2 = 0.82 for Valpareso, and R2 = 0.69 for Jasus) (Figure 6). The slope and intercept are 0.374 ± 0.040 and 1.702 ± 0.026, respectively, for Valpareso sample, and 0.518 ± 0.099 and 2.504 ± 0.084 for Jasus sample. These slopes and intercepts are similar to previous observations from the literature not only for octocorallian corals (e.g., [22,54,55,56,57,58]), but also for scleractinian corals (e.g., [7,9,25,48,59,60]) (Figure 6), likely pointing to a similar mechanism of biomineralization.
SIMS oxygen isotopic measurements were also performed in Valpareso sample, and show a total range of 2.3‰, from 0.26‰ ± 0.14‰ to 2.57‰ ± 0.15‰ (Figure 7 and Table S2), with an average of 1.51‰ ± 0.48‰. This average is in agreement, within errors, with that obtained for the isotopic analyzes carried out on bulk samples (1.61‰ ± 0.25‰). As already seen for scleractinian corals [48] or octocorallian corals [58], the heterogeneity obtained by SIMS is higher than the overall range measured by bulk, i.e., 2.3‰ compared to 1.05‰, respectively. This is due simply to the scale effects as explained in details in [60]. This scale effect can also be apprehended by applying a moving average on the SIMS data (Figure 7).
3.2. Boron Isotopic Compositions
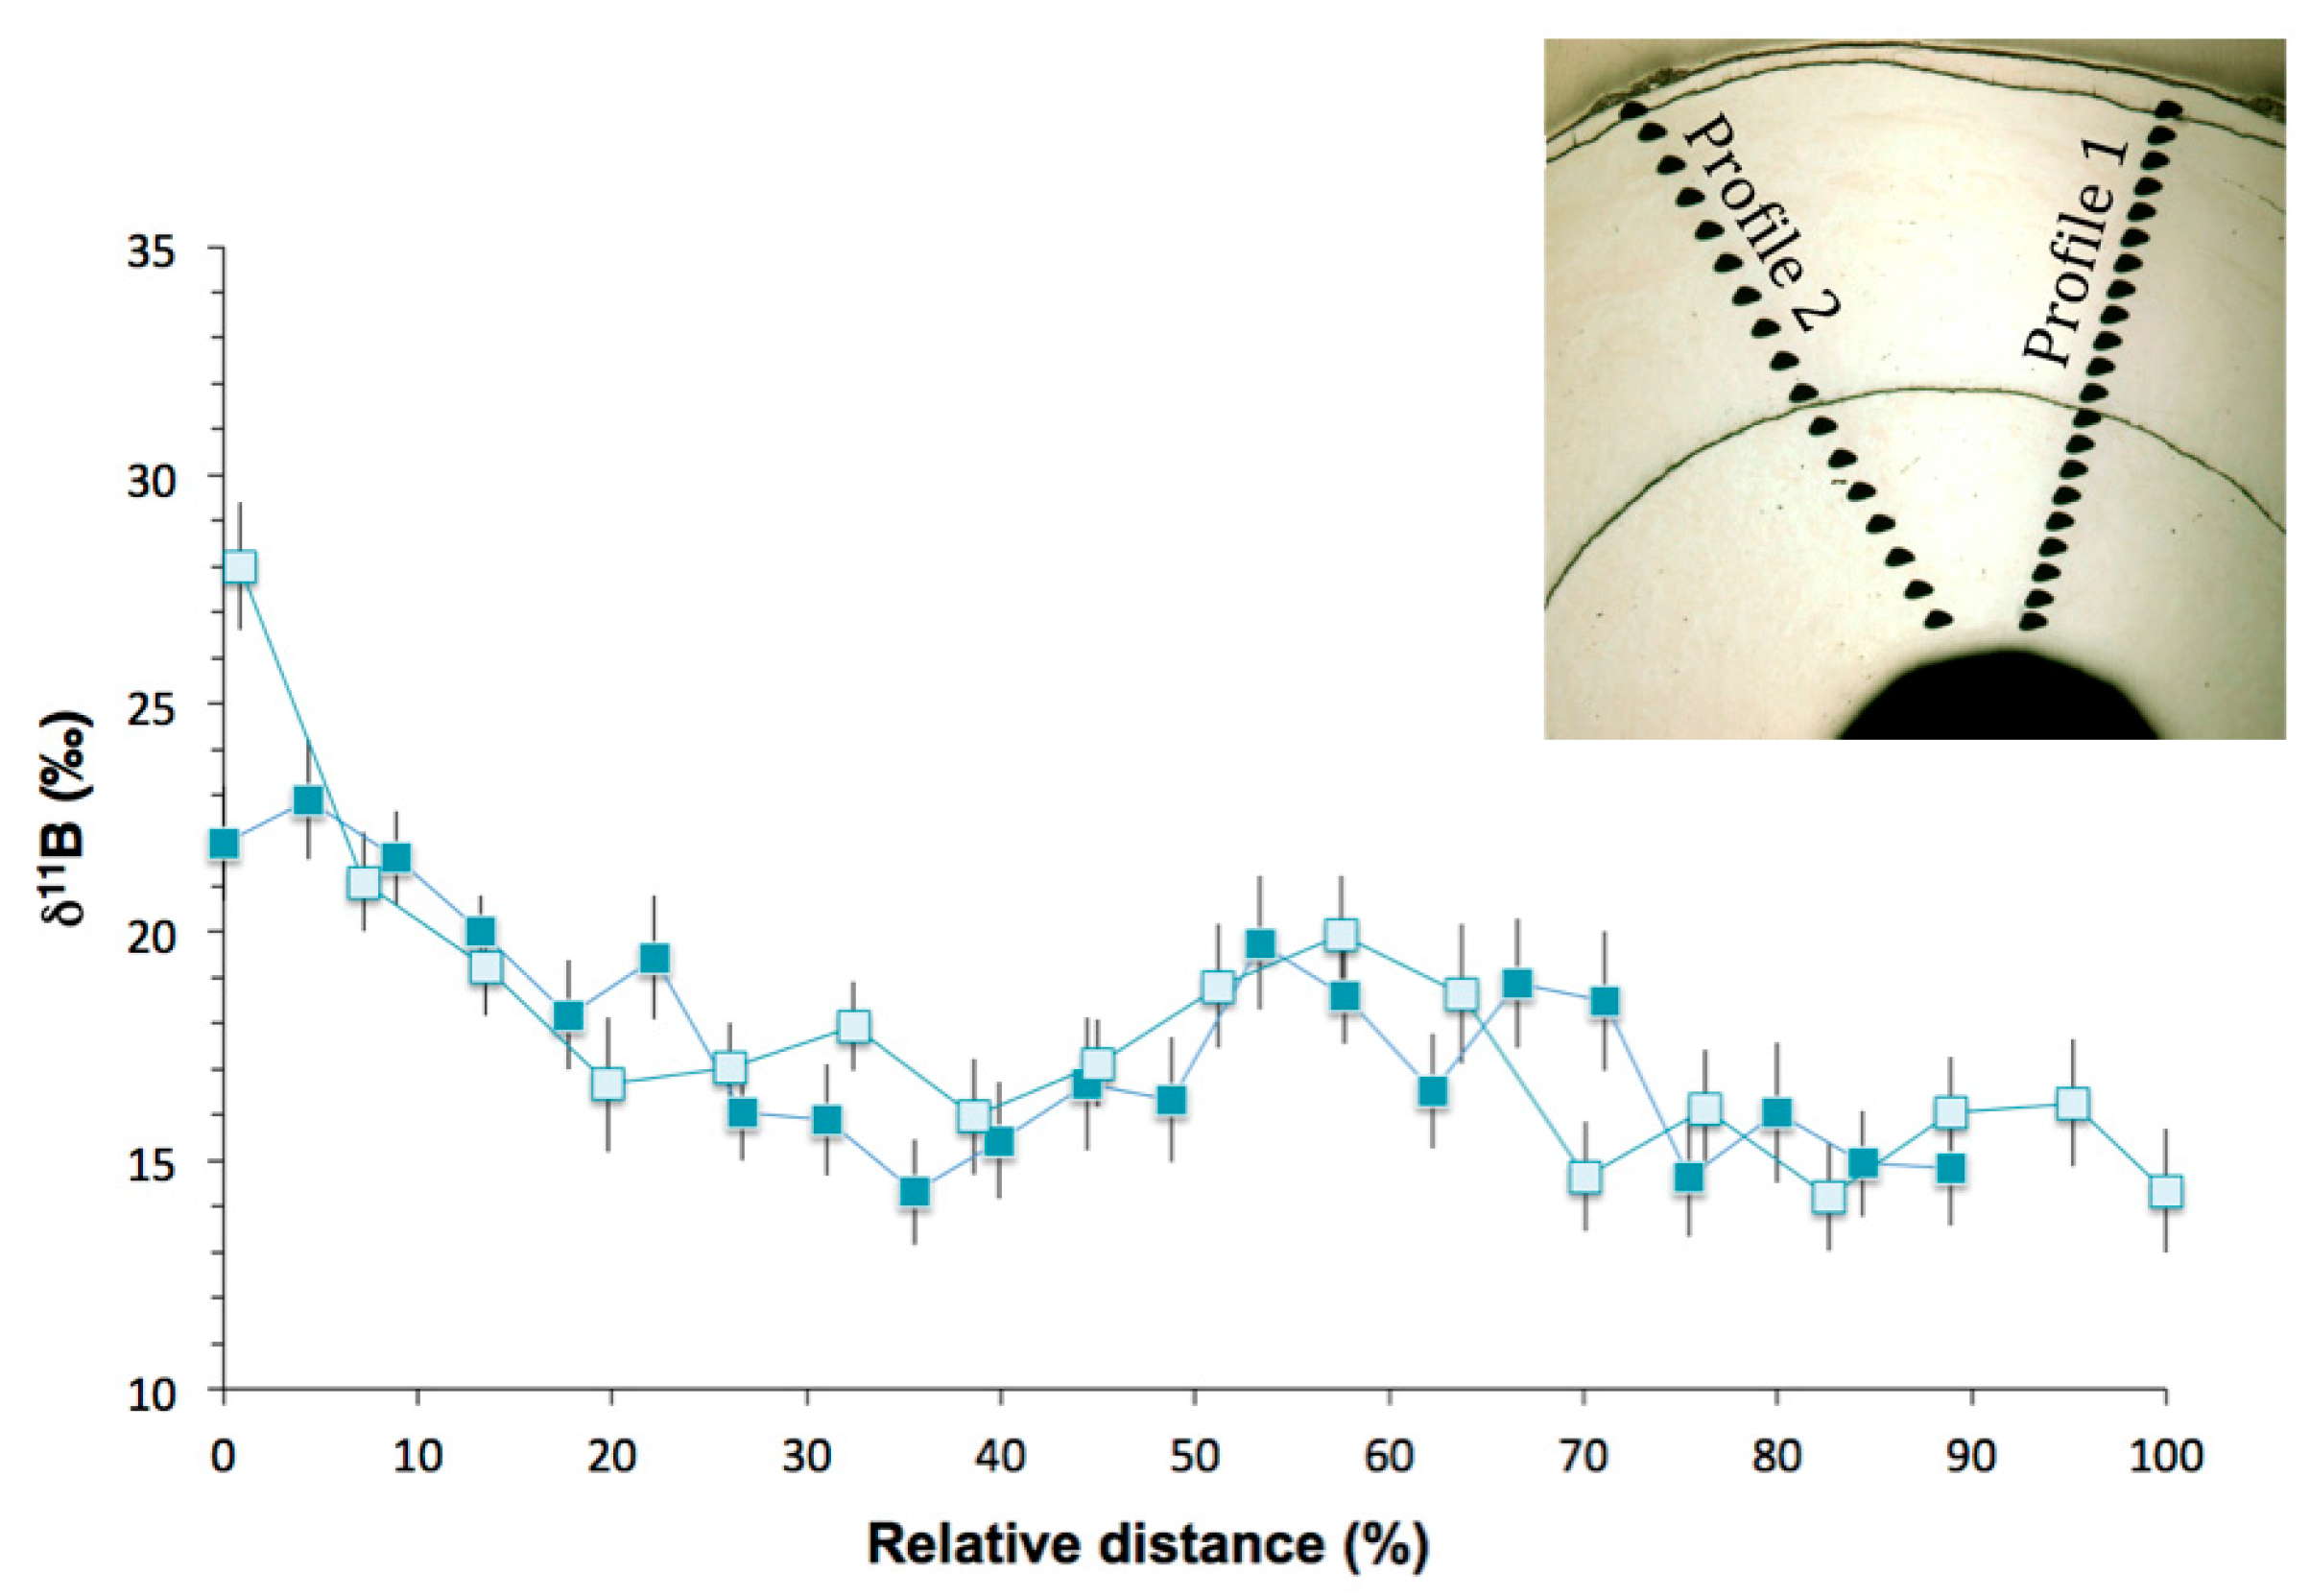
Ion microprobe δ11B analyses were performed in two profiles in Terrasses sample. The profiles start in the inner part of the coral skeleton and proceed radially outward. Figure 8 illustrates the δ11B data as a function of the relative distance to provide an easier comparison of the data, with 0% being the innermost data point and 100% representing the border of the skeleton. The overall δ11B variability is about 8‰ for profile 1 (from 14.3 ± 1.1‰ to 22.9 ± 1.3‰) and about 14‰ for profile 2 (from 14.2 ± 1.2‰ to 28.0 ± 1.4‰) (Table S3).
Except for the first point of the profile 2, the two profiles both show the same general pattern of initially with high δ11B values near the center of the skeleton, followed by a steep decrease to more stable values in the part of the skeleton formed when the animal was older (Figure 8). These higher δ11B values near the center of the skeleton were already observed in the study of Farmer et al. [22] and were attributed to higher growth rate in the juvenile stage of bamboo corals [22]. However, no evidence of precipitation rate effect on δ11B was observed in inorganic calcite experiments [61,62].
3.3. Trace Element Compositions
All the trace element (TE) ratios measured in this study are reported in Tables S4 and S5, and plotted in Figure 9 relative to the distance for Valpareso sample.
The Mg/Ca ratio in Valpareso sample ranges from 77.1 to 93.6 mmol/mol for SIMS measurements and from 81.6 to 89.7 mmol/mol for bulk analyses. These values are in agreement with previously reported data in octocorallian corals [18,63,64,65,66]. The Sr/Ca ratios show a varition between 2.88 and 3.18 mmol/mol for SIMS measurements and between 3.10 and 3.26 mmol/mol for bulk analyses. This is also in agreement with literature data [21,63,66,67,68]. It should be noted that there is a small discrepency between SIMS and bulk Sr/Ca values. This could be due to the heterogeneity in Sr/Ca from grain to grain of the standard OKA-C used to correct the ion microprobe data [69]. The SIMS Na/Ca ratios range from 13.9 to 19.7 mmol/mol, and bulk Na/Ca ratios are from 12.96 to 18.86 mmol/mol. These Na/Ca ratios are in agreement with data of [67]. The ion microprobe Li/Ca ratios are from 23.3 to 54.1 μmol/mol. To our knowledge, no literature data are available for lithium content in DSOC. Figure 10 represents a box plot of the TE/Ca measured by SIMS and bulk techniques and shows that overall there is good agreement within error between the two techniques.
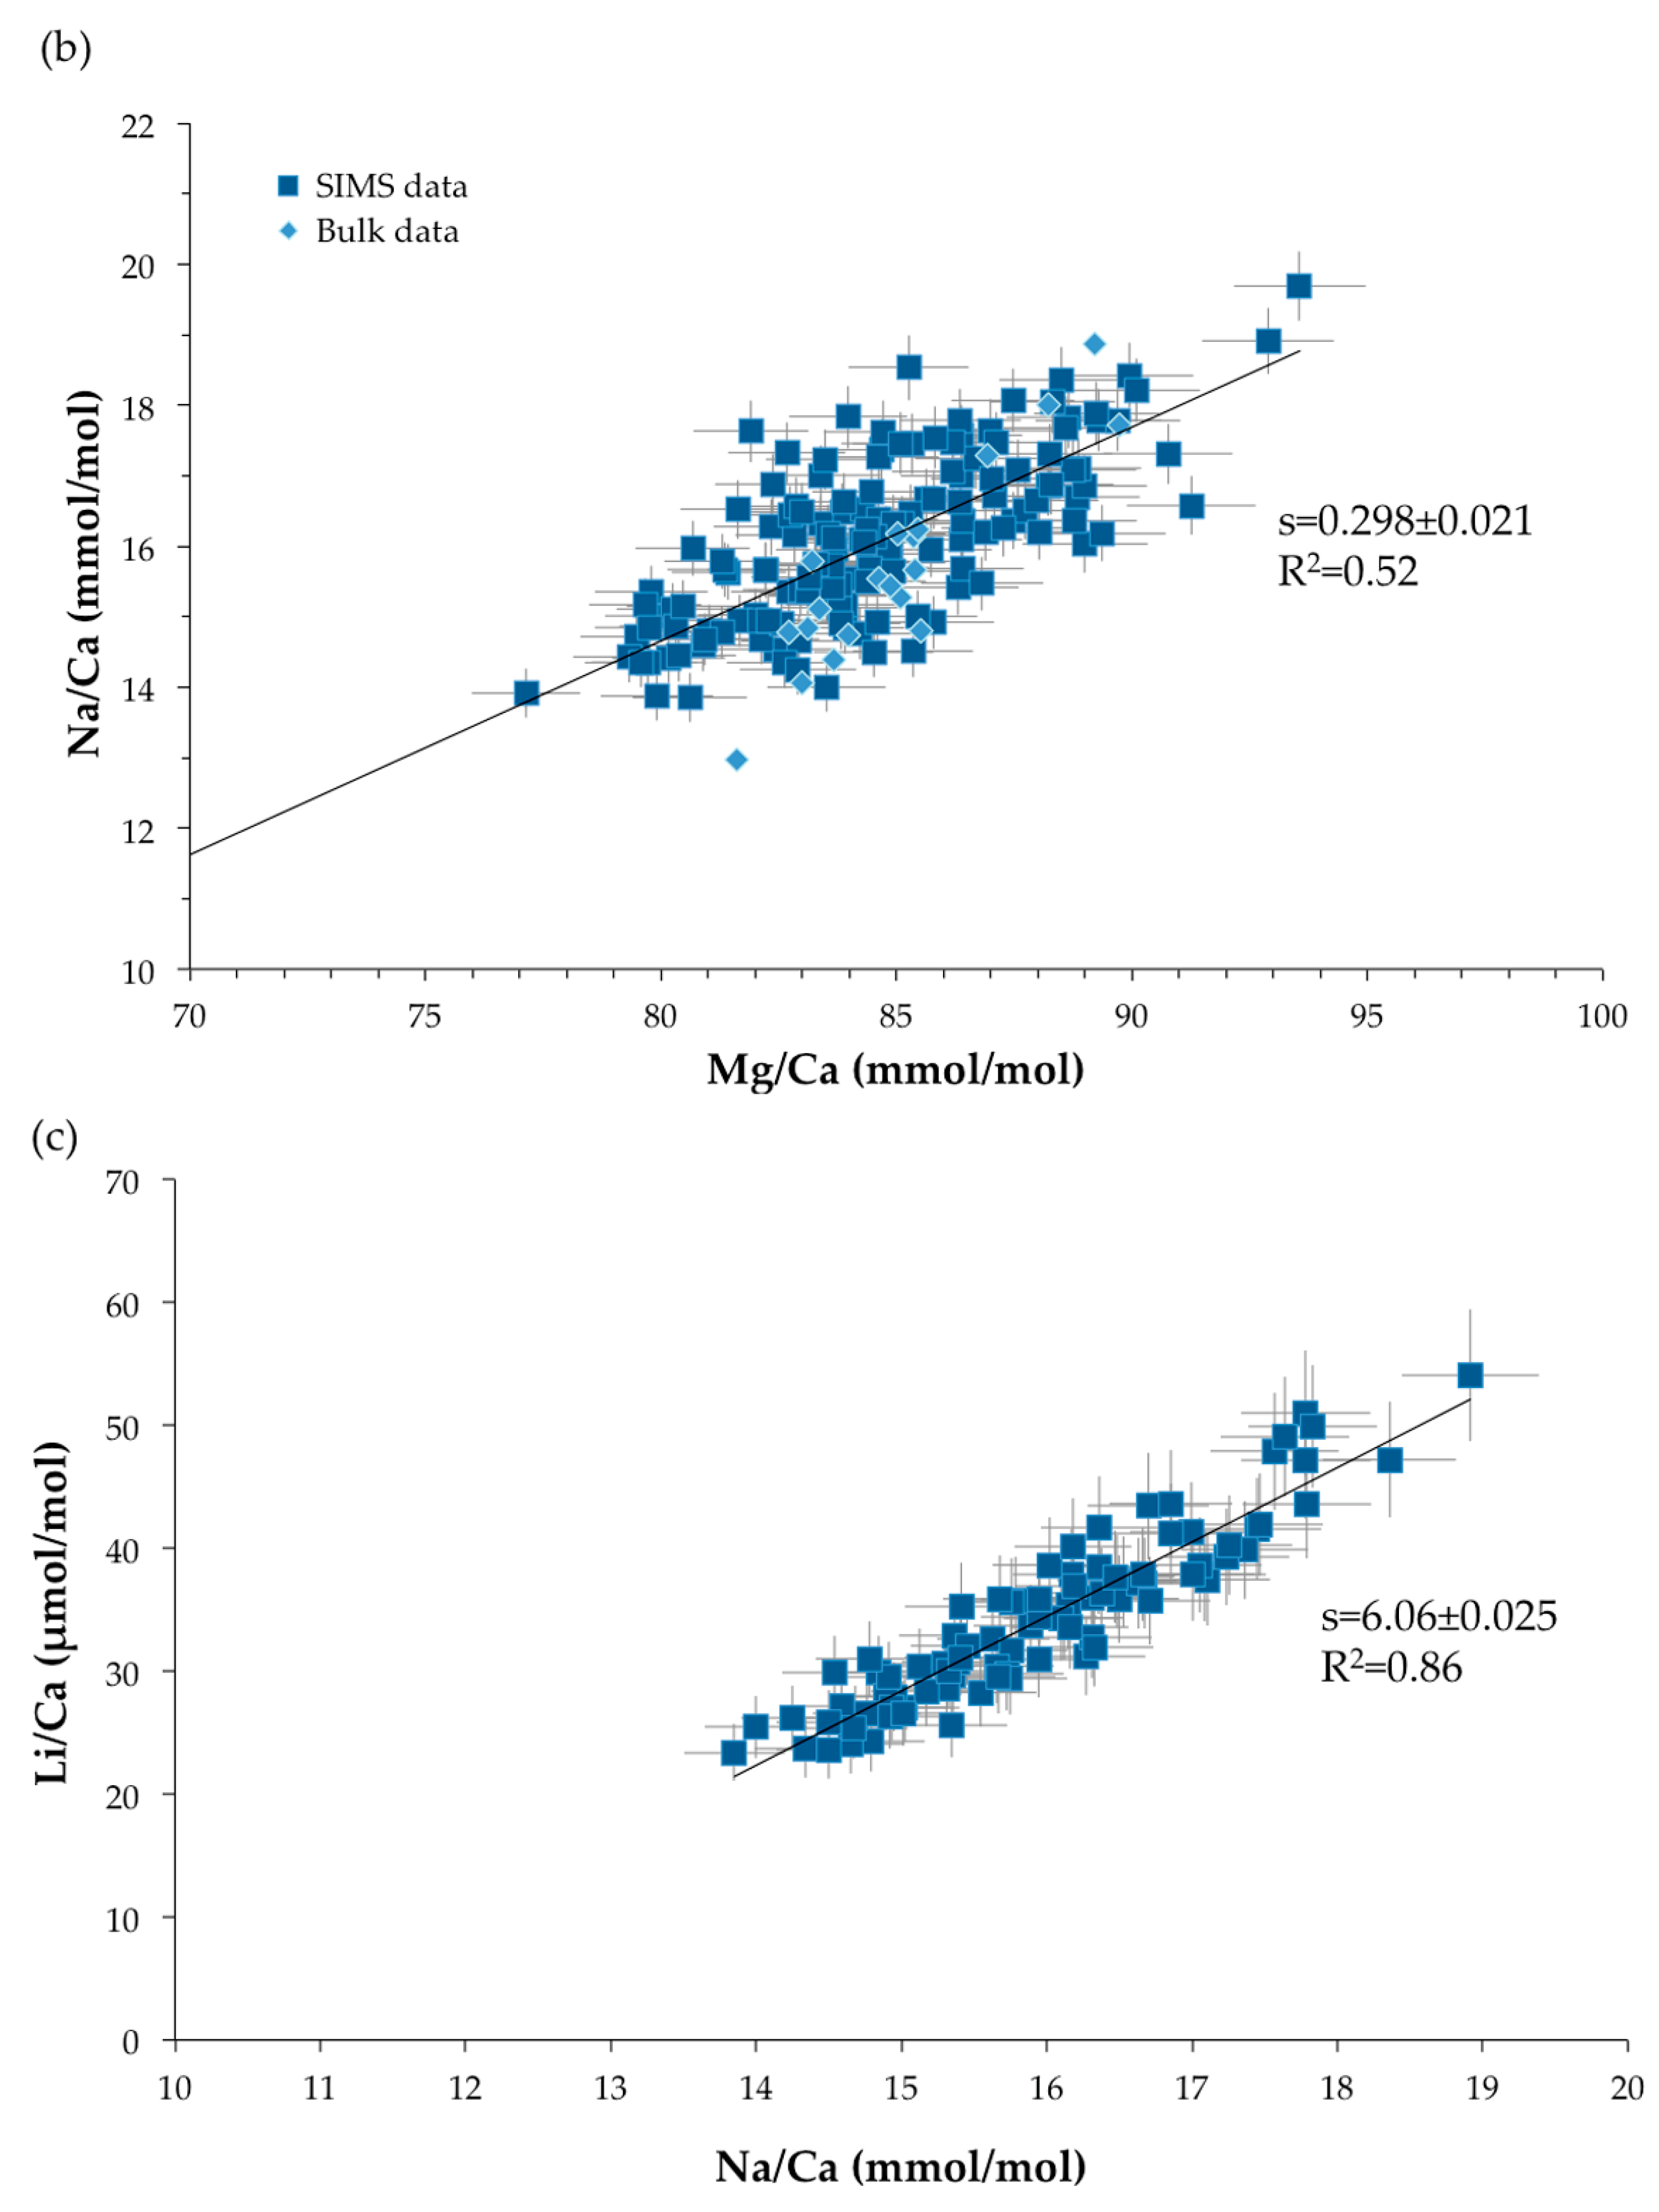
Strong positive relationships are observed between Mg/Ca, Li/Ca and Na/Ca ratios, with a coefficient of correlation of 0.65 for Li/Ca (μmol/mol) versus Mg/Ca (mmol/mol), of 0.52 for Na/Ca (mmol/mol) function of Mg/Ca (mmol/mol) and of 0.86 for Li/Ca (μmol/mol) and Na/Ca (mmol/mol) plot (Figure 11). These relationships were also observed in scleractinian aragonitic corals [30,70,71,72,73]. It should be noted that, even if the relationships are the same, the slopes and intercepts of the correlations are not identical due to the different partition coefficients for aragonite and high-Mg calcite. On the other hand, no significant relationship exists between Mg/Ca and Sr/Ca ratios (R2 = 0.11 for SIMS measurements and R2 = 0.40 for bulk analyses—not shown here).
4. Discussion
4.1. What Can We Learn from the Geochemical Signatures?
4.1.1. Boron Isotopic Composition as Proxy of Calcification pH
For a decade, it has been suggested that the δ11B values measured in biogenic carbonates reflect the pH at the sites of calcification (e.g., [27,49]). This assumption has been further confirmed by direct measurements of pH by microelectrode [74] or fluorescent dye [75,76,77]. The use of boron isotopic compositions as a pH proxy is based on: (1) the distribution of the two major dissolved boron species, B(OH)3 and B(OH)4−, which is pH dependent; and (2) a large B isotopic fractionation existing in solution between these species, with B(OH)3 being enriched in 11B by 27.2‰ relative to B(OH)4− at 25 °C [78]. The δ11B value of carbonate is related to pH because B incorporation seems to occur predominantly from seawater B(OH)4− [79], even if the presence of B(OH)3 was observed for corals [15,80,81] and coralline algae [82]. If the presence of B(OH)3 is documented in the coral skeleton, the question of whether its originating from the medium or corresponds to a by-product of a boron species remains for the moment still under discussion (see [62,80] for a more detailed discussion of the mechanisms). In the following, we assume that only borate ions are incorporated into the carbonate. With this assumption, it is then possible to calculate the pH of the solution from the δ11B value of the coral according to:
where δ11Bc represents the measured boron isotopic composition of the carbonate, δ11Bsw is the boron isotopic composition of modern seawater (δ11Bsw = 39.61 ± 0.20‰, [83]), pKB is the dissociation constant of boric acid and is function of temperature and salinity [84], and α3-4 is the isotopic fractionation factor between B(OH)3 and B(OH)4− [78].
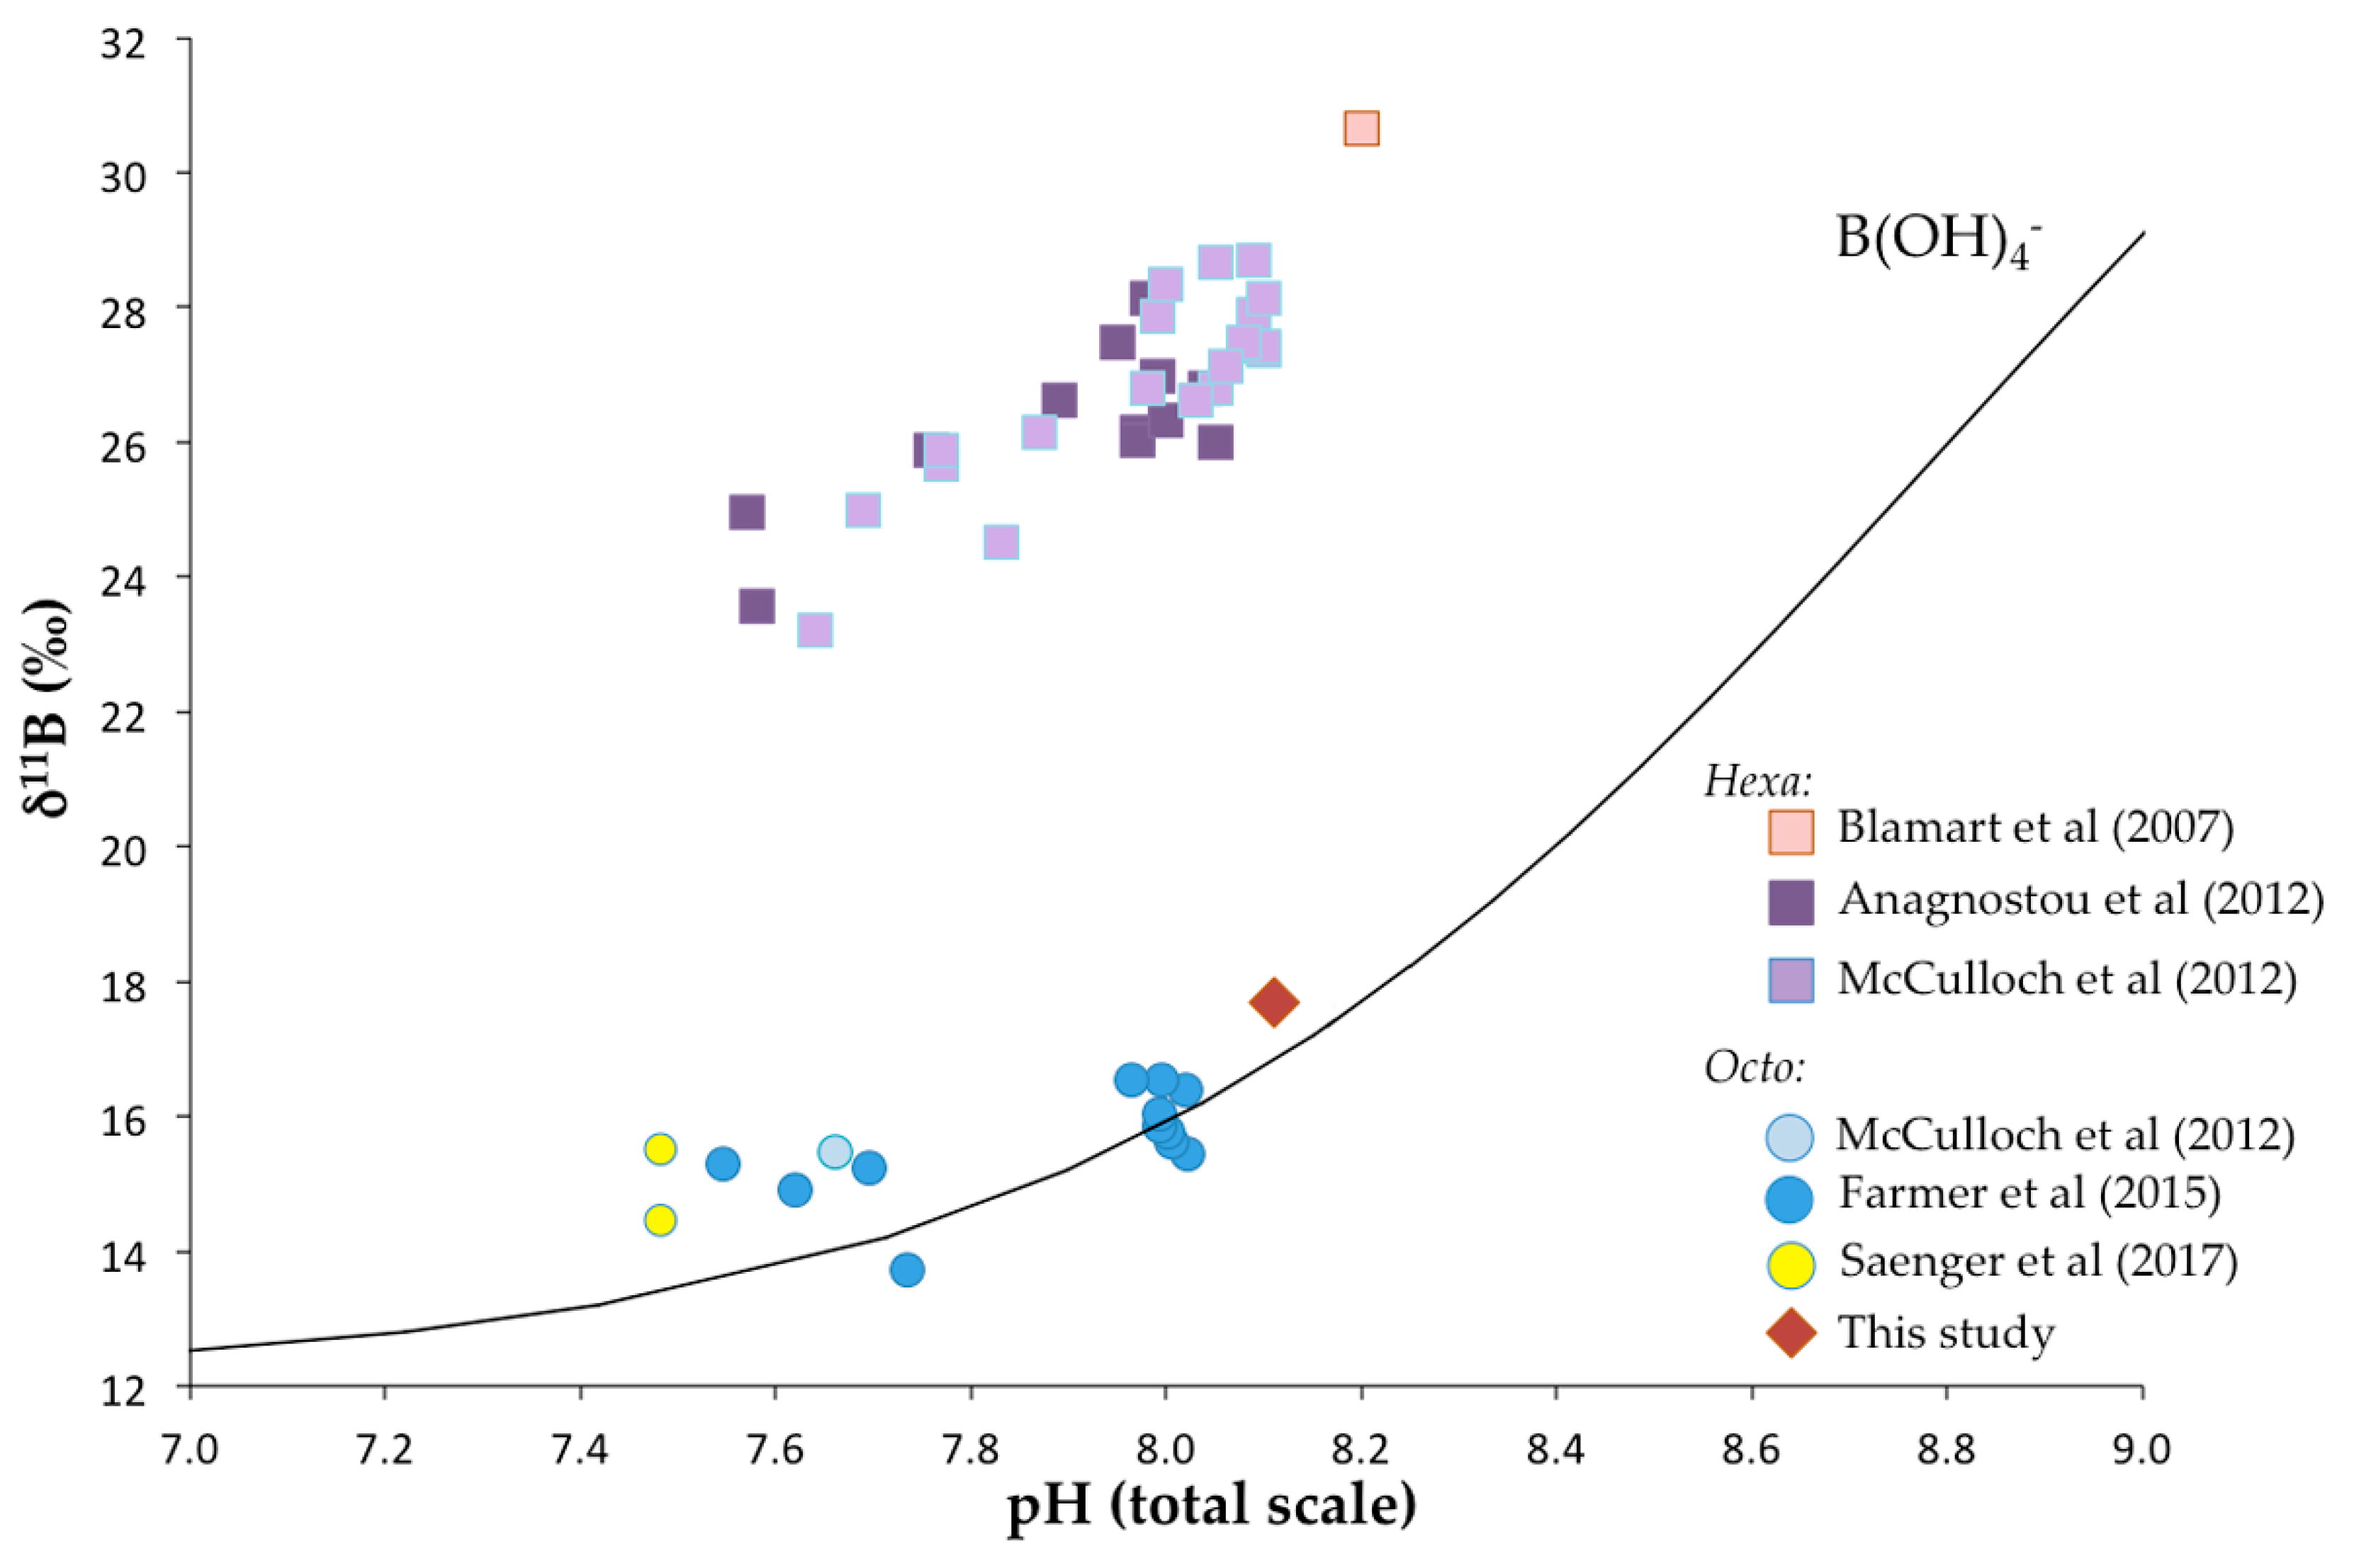
Figure 12 shows that there is a clear difference in strategy regarding the increase of pH at the sites of calcification between DSSC and DSOC. Whereas the calculation based on the δ11B values of the scleractinian corals and Equation (1) shows a significant increase of up to pH ≈ 9 at the sites of calcification, it seems that this strategy is not adopted by the octocorallian corals, as it was already suggested by Farmer et al. [22]. This so-called “biologically pH up-regulation” [85] of scleractinian corals is thought to be achieved by Ca-ATPase enzymes that exchange Ca2+ ions with two protons [28,74,86]. As this enzyme activity was also detected in octocorallian corals [87], it is then surprising that the pH at the sites of calcification of DSOC broadly reflects the pH of the surrounding seawater (Figure 12) even if findings from Farmer et al. [22] and Saenger et al. [58] suggested a pH increase of up to 0.4 for some DSOC specimens.
In summary, DSSC seems to increase their pH at the sites of calcification by ≈ 1 unit, whereas the pH at the sites of calcification of the DSOC is elevated up to 0.4-pH unit relative to the pH of the surrounding seawater. Through the perspective of geochemical proxies, the use of DSOC appears to be more adapted since the deviation of pHcf from seawater pH is smaller than for DSSC, indicating limited vital effects.
4.1.2. Geochemical Signatures as Temperature Proxies
• The “line method”
Based on the analyses of 32 specimens of deep-sea scleractinian corals, Smith et al. [7] proposed a method to extract the temperature based on the regression between δ18O and δ13C values, the so-called “line method”. For each δ13Ccoral = δ13C(DIC)seawater, they determined the corresponding δ18ODSSC value. This value, when corrected for the δ18O of seawater (defined as δ18Ointercept), is dependent on the temperature, following:
T(°C) = −4.49 (δ18Ointercept) + 20.48
Based on this study, and on the observation that octocorallian corals also show strong relationships between their δ18O and δ13C values (see Figure 6), Kimball et al. [54] and Hill et al. [55] tested this method on deep-sea bamboo corals and established the following relationship:
T(°C) = −4.12 ± 0.38 (δ18Ointercept) + 12.33 ± 0.75
The slopes of Equations (2) and (3) are identical within errors, but the intercepts are different due to the different type of calcium carbonate polymorphs [54]. If Equation (3) is applied to our data, with δ18Oseawater = 0‰, and δ13CDIC = 0‰, we obtained a temperature of 2.0 °C for Jasus sample and of 5.3 °C for Valpareso sample. The temperature for Jasus sample is in agreement, even if a little too cold, with the estimates of the Levitus Atlas (between ≈3.5 °C at 1500 m water depth, and ≈2.5 °C at 2100 m water depth).
• TE/Ca as temperature proxy
It was suggested that Mg/Ca ratios in DSOC could be used as temperature proxy [63,64,68,89], and the following equation was proposed for Isidids [63]:
T(°C) = −0.505 + 0.048 Mg/Ca (mmol/mol) (calibrated between 3 and 6 °C)
Considering an average bulk value for Mg/Ca ratio in Valpareso sample of 85.01 ± 2.15 mmol/mol, it gives a seawater temperature of 3.6 ± 0.1 °C. This temperature is different from the temperature found using the “line method”, i.e., 5.3 °C. This discrepancy could be due to our application of the “line method” because: (1) we did not know the exact values of δ18O and δ13C of seawater at the sampling location; and (2) the precision of this method is not better than ±1 °C [60]. The variation recorded by SIMS measurements gives a total temperature range of 0.8 °C, between 3.2 and 4.0 °C.
As Li/Ca and Na/Ca correlate with Mg/Ca, if we assume the Mg/Ca ratio variations are only due to temperature change, then we could postulate that Li/Ca and Na/Ca could also be used as temperature proxies. With temperature calculated from Mg/Ca (TMg/Ca), we propose the following equations:
TMg/Ca(°C) = 2.129 (±0.111) + 0.089 (±0.007) Na/Ca (mmol/mol) (R2 = 0.52)
TMg/Ca(°C) = 3.080 (±0.040) + 0.014 (±0.001) Li/Ca (μmol/mol) (R2 = 0.65)
As also observed in [63], Sr/Ca ratios do not seem to be a temperature proxy since no significant correlation exists with Mg/Ca. Nevertheless, as the temperature variation is quite small (i.e., 0.8 °C calculated from SIMS Mg/Ca measurements), it is difficult to judge whether a temperature dependence on Sr incorporation is present in the DSOC.
If the Mg/Ca ratio is assumed to be a temperature proxy, then the Mg/Ca-temperature sensitivity is about 21 mmol/mol/°C (from Equation (4)). This sensitivity is much higher than that for inorganic calcite [90], suggesting an efficient physiological control on the uptake of magnesium into the DSOC skeleton.
4.1.3. Common Mechanism of Biomineralization between Scleractinian and Octocorallian Deep-Sea Corals
One of the striking features of the geochemical signatures is that both δ18O vs. δ13C and TE/Ca relationships show the same behavior between scleractinian and octocorallian deep-sea corals (Figure 6 and Figure 11) despite their different mineralogy, i.e., aragonite vs. high-Mg calcite, respectively and their different microstructures. Based on this similarity, the model of Adkins et al. [25] was also employed to explain the oxygen and carbon behaviors in DSOC. In this model, the authors propose that the correlation between δ18O and δ13C values is best explained by a mixing between seawater Dissolved Inorganic Carbon (DIC) and a passive flux of CO2, this mixing being driven by a pH gradient due to the activity of the Ca-ATPase. One of the main problems in transposing this model to DSOC is the amplitude of the pH gradient. Indeed, in the model of Adkins et al. [25], the required pH gradient is between the surrounding seawater pH and values of pH higher than the secondary dissociation constant of carbonate, pKa2 (see Figure 9 in [25]), i.e., ≈ 10. As in DSOC, the pH increase measured is only up to 0.4 relative to seawater. Hence, it appears difficult to explain the δ18O-δ13C relationships and the amplitude of variation of these two isotopic systems. It is then noteworthy that the relationships between δ18O and δ13C as well as the amplitude of variations (Figure 6) are identical between DSOC and DSSC. As a result, the validity of Adkins et al. [25] model needs to be questioned.
The best explanation so far for both δ18O vs. δ13C and TE/Ca relationships might be kinetic effects linked to different precipitation rates of the coral skeleton. In the case of oxygen and carbon isotopic compositions, these kinetic effects are due to the incomplete equilibration of HCO3− with H2O in the calcification zone [28,29,49]. This kinetic effect was also recently proposed by Chabaane et al. [57] to explain the δ18O data in Corallium rubrum. On the other hand, kinetic effects were also proposed as the main factor controlling the TE/Ca relationships in DSSC [30].
Such a similarity of the geochemical features between DSOC and DSSC despite their mineralogical and microstructural differences appears to be quite an unexpected conclusion. To reconcile these two aspects, it seems necessary to call upon a common entity, the nanograins, from which the geochemical inheritance could be derived.
4.2. The Biomineralization Mechanisms Inferred from the Similarity between Calcitic and Aragonitic Ca-Biocarbonates Observed at the Nanometer Scale
Figure 6 has made obvious the striking similarity between the sensitivity of calcite and aragonite skeletons to variations in the environmental parameters. Such a result drives the attention to another type of unexpected resemblance between these calcite and aragonite materials that are observed when examined at the infra-micrometer scale.
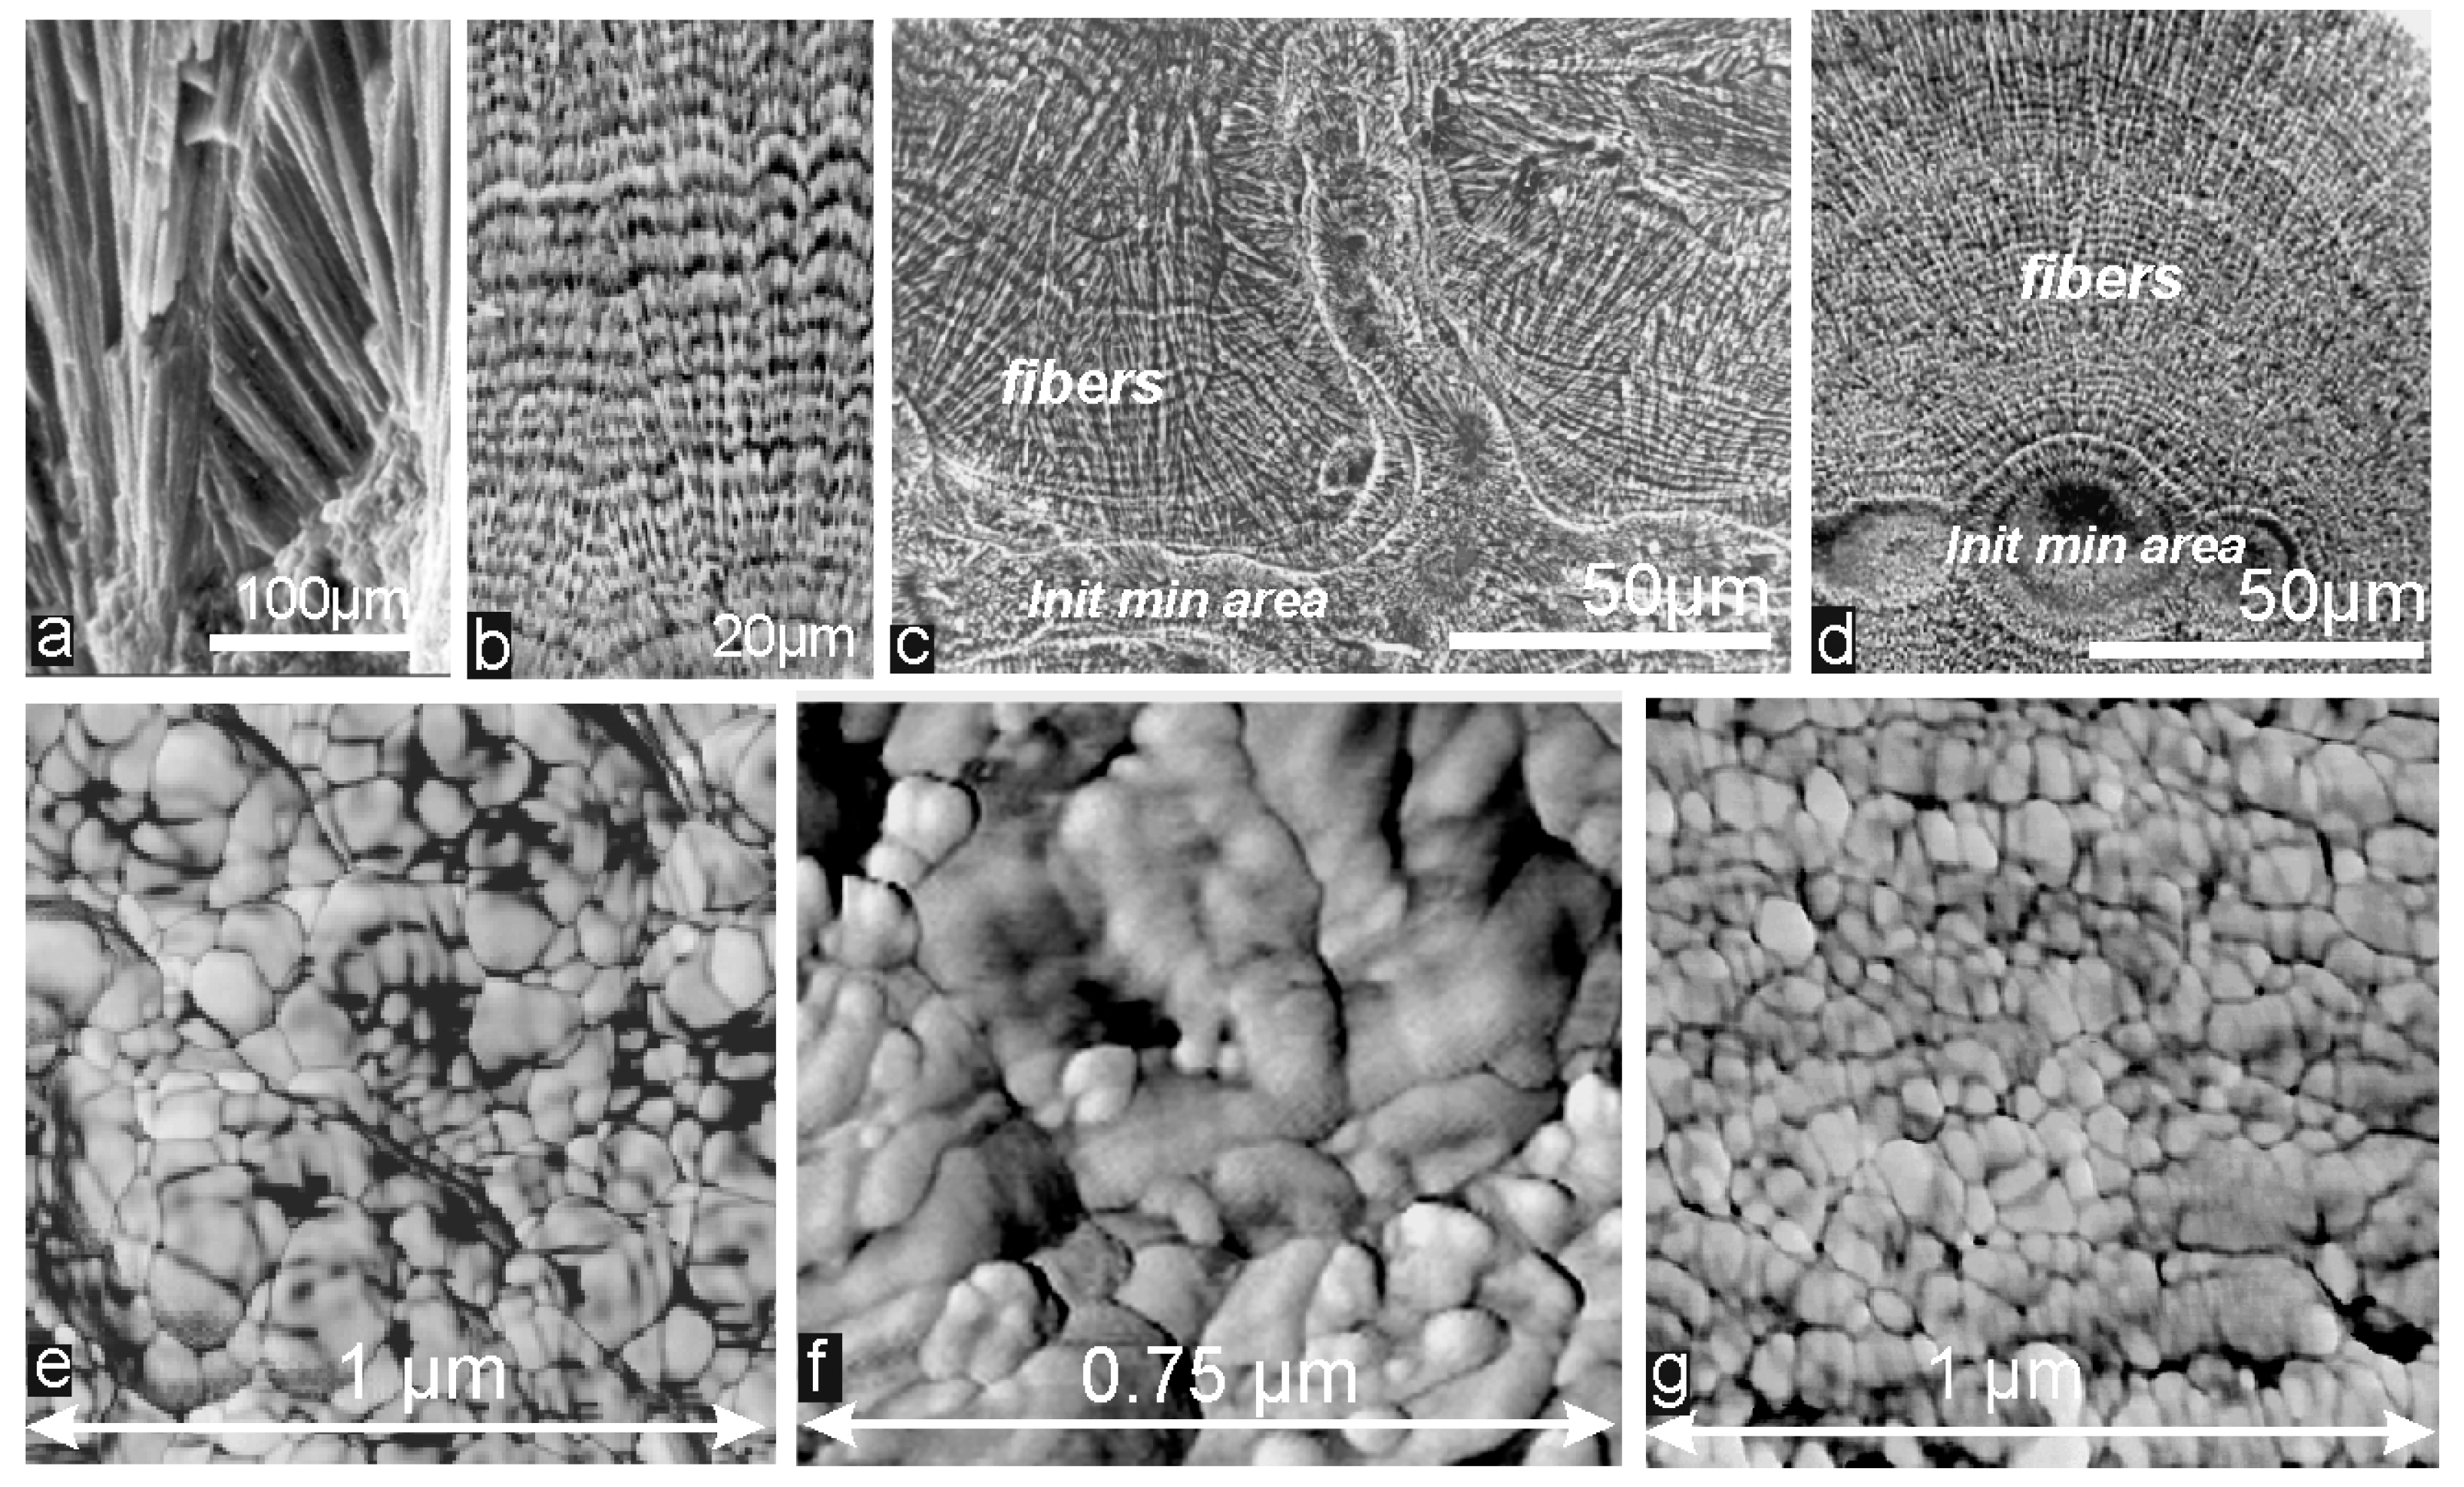
Extensive investigations in Cuif et al. [91] have revealed that, whatever their taxonomic position and related complexity, the crystal-like skeleton units are built through a remarkably common mode of biomineralization. In the Scleractinia for instance, the crystal-like unit fibers that were considered for decades as “single crystal of orthorhombic aragonite” [35] are actually built by superimposition of micrometer thick growth layers, which are synchronous amongst adjacent fibers (Figure 13a,b). As a result, the model based on “spherulitic crystallization” in which mineral fibers are independently growing within a liquid compartment is an inappropriate way to describe formation of the coral fibers. The basal ectoderm of the polyp determines the three-dimensional arrangement of fibers in the underlying corallite through a strict control of their growth exerted at the micrometer scale. This layered growth and crystallization mode has been illustrated in so many coral species from various places and geological ages that little doubt exists as to whether this mechanism is ubiquitous throughout the whole phylum [92,93].
Deficiency of the “liquid layer model” is strongly reinforced by the chemical and isotopic differences measured between the fibrous areas of the skeleton and the adjacent and simultaneously growing initial mineralization areas (see Figure 5 in [29]). This is also a permanent pattern of the skeletons built by the polyps, with the intensity varying according to species. None of the current geochemical models is able to explain how two adjacent and simultaneously deposited aragonite materials can differ all along the repeatedly produced growth layers. This well-established fact that isotope fractionation and trace element partitioning differ despite aragonite being present in both skeletal areas obviously indicates that mineralogy is not the leading factor in fractionation and partitioning mechanisms.
These paradoxical results become more understandable when taking into account the currently developing concept of a biomineralization mechanism running as a sequential process that associates an intracellular preparative phase followed by an extracellular crystallization step. During the two last decades, two distinct approaches provided the structural and biological data supporting the emergence of this unifying model. Essential to this concept of a two-phase mineralization process is the physical evidence that an intracellular amorphous mineralization phase predates formation of the crystallized materials that build the growth layers [94]. During this intracellular phase, amorphous Ca-carbonate stabilized by organic components is prepared. Thus, the repeatedly produced growth layers may have basically an intracellular origin, as they result from the synchronic exocytosis of this amorphous material that crystallizes only outside the mineralizing cell layer.
This major conceptual change found a structural correspondence in the infra-micrometric observations of the crystallized layers carried out by using atomic force microscopy. This investigation revealed that the mineral layers were not purely crystalline but made of densely packed round grains 50–100 nanometer in diameter covered by an irregular organic coating (Figure 13e,g). To explain the quite general structure of these biologically produced Ca-carbonate (no exception has been found to date [95]), it can be hypothesized that during the crystallization step the physical link between the just exocytosed amorphous Ca-carbonate with its stabilizing organic compounds is disrupted. Thus, crystallization of the calcite or aragonite grains occurs within an organic medium whose composition is species-specific. Formation of each crystallized grain leads to the segregation of the organic and mineral components and rejection of the residual organic material at the periphery of the crystallized grains where their irregular coating is produced.
With respect to isotopic fractionation and minor element partitioning, the preparative intracellular phase is well compatible with the coexistence of two juxtaposed but distinct geochemical areas in the DSSC (e.g., [29,96]). With a much simpler microstructure, measurements can be more easily carried out at the solid axes of the DSOC, but regarding the behaviors of calcite and aragonite skeletons as it results from this study, the hypothesis emerges that in both cases the environmental conditions may have their major influences during the preparative phase of the skeletogenesis. This could explain both the specific responses of distinct mineralizing areas in a given specimen and the global species-specific responses to environmental variations (vital effect).
As a result, it appears that the chemical properties of the coral skeletons could be better explained by focusing on the molecular and nanometer scaled processes that are running at the growth layer level because, in spite of their crystalline appearance, crystallization and resulting properties of fibers considered as a whole are all but thermodynamically predictable.
5. Conclusions
The aragonitic scleractinian corals show the characteristic to have a significant geochemical difference between the centers of calcification and the fibers (for a review [8,15]). The high-Mg calcitic octocorallian corals offer the possibility to test the hypothesis of the strong relationship between microstructure and geochemical signature, since they do not present any COC structure. Conclusively, the biomineralization processes of both DSSC and DSOC corals appear to be identical to those of other calcifying invertebrates. In this study, we showed that δ18O and δ13C relationships are similar between DSSC and DSOC, as are the relationships between Li/Ca, Mg/Ca and Na/Ca ratios. These observations favor a geochemical organization on a scale lower than the centers of calcification, probably on the scale of layers of nanograins, the micrometer-thick elementary growth layer whose crystallization is the actual environment recording unit [97]. For example, it is surprising that the δ11B values of the biominerals seems to mainly depend on the calcium carbonate polymorph, rather than the organisms (see Figure 8 in [62]) with the δ11B values being higher for aragonitic than calcitic biominerals. To our knowledge, the only exception is the boron isotopic compositions of coralline algae [79,98]. However, it is worth noting that, in this case, the calcareous structure is not used by the organisms as a part of its living architecture because mineralization of the wall leads to the death of its cells.
Supplementary Materials
The following are available online at www.mdpi.com/2075-163X/7/9/154/s1, Table S1: Bulk oxygen and carbon isotopic of Valpareso and Jasus samples. Table S2: SIMS oxygen isotopic compositions of Valpareso sample. Table S3: SIMS boron isotopic compositions of Terrasses sample. Table S4: Bulk elemental ratios (Na/Ca, Mg/Ca, Sr/Ca) of Valpareso sample. Table S5: SIMS trace element ratios (Li/Ca, Na/Ca, Mg/Ca, Sr/Ca) of Valpareso sample.
Acknowledgments
This work was supported by an INSU INTERRVIE grant. Nicole M. Fernandez is thanked for her careful reading of the manuscript. We thank two anonymous reviewers for insightful comments, which contributed to improve the manuscript. This is IPGP contribution n°3875.
Author Contributions
C.R.-B., J.-P.C. and D.B. conceived the project, and wrote the paper. C.R.-B. and D.B. performed the geochemical analyses. J.-P.C. performed all the structural observations.
Conflicts of Interest
The authors declare no conflict of interest.
References
- Emiliani, C. Pleistocene temperatures. J. Geol. 1955, 63, 538–578. [Google Scholar] [CrossRef]
- Urey, H.C.; Lowenstam, H.A.; Epstein, S.; McKinney, C.R. Measurement of paleotemperatures and temperatures of the Upper Cretaceous of England, Denmark, and the southeastern United States. Geol. Soc. Am. Bull. 1951, 62, 399–416. [Google Scholar] [CrossRef]
- Epstein, S.; Buchsbaum, R.; Lowenstam, H.A.; Urey, H.C. Revised carbonate-water isotopic temperature scale. Geol. Soc. Am. Bull. 1953, 64, 1315–1326. [Google Scholar] [CrossRef]
- Mikkelsen, N.; Erlenkeuser, H.; Killingley, J.S.; Berger, W.H. Norwegian corals: Radiocarbon and stable isotopes in Lophelia pertusa. Boreas 1982, 11, 163–171. [Google Scholar] [CrossRef]
- Adkins, J.F.; Cheng, H.; Boyle, E.A.; Druffel, E.R.; Edwards, R.L. Deep-sea coral evidence for rapid change in ventilation of the deep North Atlantic 15,400 years ago. Science 1998, 280, 725–728. [Google Scholar] [CrossRef] [PubMed]
- Mortensen, P.B.; Rapp, H.T.; Båmstedt, U. Oxygen and carbon isotope ratios related to growth line patterns in skeletons of Lophelia pertusa (L)(Anthozoa, Scleractinia): Implications for determination of linear extension rate. Sarsia 1998, 83, 433–446. [Google Scholar] [CrossRef]
- Smith, J.E.; Schwarcz, H.P.; Risk, M.J.; McConnaughey, T.A.; Keller, N. Paleotemperatures from deep-sea corals: Overcoming ‘vital effects’. Palaios 2000, 15, 25–32. [Google Scholar] [CrossRef]
- Robinson, L.F.; Adkins, J.F.; Frank, N.; Gagnon, A.C.; Prouty, N.G.; Brendan Roark, E.; van de Flierdt, T. The geochemistry of deepsea coral skeletons: A review of vital effects and applications for palaeoceanography. Deep Sea Res. Part II Top. Stud. Oceanogr. 2014, 99, 184–198. [Google Scholar] [CrossRef]
- Smith, J.E.; Risk, M.J.; Schwarcz, H.P.; McConnaughey, T.A. Rapid climate change in the North Atlantic during the Younger Dryas recorded by deep-sea corals. Nature 1997, 386, 818–820. [Google Scholar] [CrossRef]
- Smith, J.E.; Brand, U.; Risk, M.J.; Schwarcz, H.P. Mid-Atlantic Ridge hydrothermal events recorded by deep-sea corals. Can. J. Earth Sci. 1999, 36, 511–517. [Google Scholar] [CrossRef]
- Frank, N.; Paterne, M.; Ayliffe, L.; van Weering, T.; Henriet, J.P.; Blamart, D. Eastern North Atlantic deep-sea corals: Tracing upper intermediate water Δ14C during the Holocene. Earth Planet. Sci. Lett. 2004, 219, 297–309. [Google Scholar] [CrossRef]
- Marali, S.; Wisshak, M.; Correa, M.L.; Freiwald, A. Skeletal microstructure and stable isotope signature of three bathyal solitary cold-water corals from the Azores. Palaeogeogr. Palaeoclimatol. Palaeoecol. 2013, 373, 25–38. [Google Scholar] [CrossRef]
- Raddatz, J.; Rüggeberg, A.; Flögel, S.; Hathorne, E.C.; Liebetrau, V.; Eisenhauer, A.; Dullo, W.C. The influence of seawater pH on U/Ca ratios in the scleractinian cold-water coral Lophelia pertusa. Biogeosciences 2014, 11, 1863–1871. [Google Scholar] [CrossRef] [Green Version]
- Shirai, K.; Kusakabe, M.; Nakai, S.; Ishii, T.; Watanabe, T.; Hiyagon, H.; Sano, Y. Deep-sea coral geochemistry: Implication for the vital effect. Chem. Geol. 2005, 224, 212–222. [Google Scholar] [CrossRef]
- Rollion-Bard, C.; Blamart, D. SIMS method and examples of applications in coral biomineralization. In Biomineralization Sourcebook: Characterization of Biominerals and Biomimetic Materials; DiMasi, E., Gower, L.B., Eds.; CRC Press: Boca Raton, FL, USA, 2014; pp. 249–261. [Google Scholar]
- Spooner, P.T.; Guo, W.; Robinson, L.F.; Thiagarajan, N.; Hendry, K.R.; Rosenheim, B.E.; Leng, M.J. Clumped isotope composition of cold-water corals: A role for vital effects? Geochim. Cosmochim. Acta 2016, 179, 123–141. [Google Scholar] [CrossRef] [Green Version]
- Noé, S.U.; Dullo, W.C. Skeletal morphogenesis and growth mode of modern and fossil deep-water isidid gorgonians (Octocorallia) in the West Pacific (New Zealand and Sea of Okhotsk). Coral Reefs 2006, 25, 303–320. [Google Scholar] [CrossRef]
- Thresher, R.; Rintoul, S.R.; Koslow, J.A.; Weidman, C.; Adkins, J.; Proctor, C. Oceanic evidence of climate change in southern Australia over the last three centuries. Geophys. Res. Lett. 2004, 31. [Google Scholar] [CrossRef]
- Sherwood, O.A.; Thresher, R.E.; Fallon, S.J.; Davies, D.M.; Trull, T.W. Multi-century time-series of 15N and 14C in bamboo corals from deep Tasmanian seamounts: Evidence for stable oceanographic conditions. Mar. Ecol. Prog. Ser. 2009, 397, 209–218. [Google Scholar] [CrossRef]
- LaVigne, M.; Hill, T.M.; Spero, H.J.; Guilderson, T.P. Bamboo coral Ba/Ca: Calibration of a new deep ocean refractory nutrient proxy. Earth Planet. Sci. Lett. 2011, 312, 506–515. [Google Scholar] [CrossRef]
- Hill, T.M.; LaVigne, M.; Spero, H.J.; Guilderson, T.; Gaylord, B.; Clague, D. Variations in seawater Sr/Ca recorded in deep-sea bamboo corals. Paleoceanography 2012, 27. [Google Scholar] [CrossRef]
- Farmer, J.R.; Hoenisch, B.; Robinson, L.F.; Hill, T.M. Effects of seawater-pH and biomineralization on the boron isotopic composition of deep-sea bamboo corals. Geochim. Cosmochim. Acta 2015, 155, 86–106. [Google Scholar] [CrossRef]
- Thresher, R.E.; Fallon, S.J.; Townsend, A.T. A “core-top” screen for trace element proxies of environmental conditions and growth rates in the calcite skeletons of bamboo corals (Isididae). Geochim. Cosmochim. Acta 2016, 193, 75–99. [Google Scholar] [CrossRef]
- Roberts, J.M.; Wheeler, A.J.; Freiwald, A.; Cairns, S.D. Cold-Water Corals: The Biology and Geology of Deep-Sea Coral Habitats; Roberts, J.M., Wheeler, A.J., Freiwald, A., Cairns, S.D., Eds.; Cambridge University Press: Cambridge, UK, 2009; 333p. [Google Scholar]
- Adkins, J.F.; Boyle, E.A.; Curry, W.B.; Lutringer, A. Stable isotopes in deep-sea corals and a new mechanism for “vital effects”. Geochim. Cosmochim. Acta 2003, 67, 1129–1143. [Google Scholar] [CrossRef]
- Sinclair, D.J.; Risk, M.J. A numerical model of trace-element coprecipitation in a physicochemical calcification system: Application to coral biomineralization and trace-element ‘vital effects’. Geochim. Cosmochim. Acta 2006, 70, 3855–3868. [Google Scholar] [CrossRef]
- Blamart, D.; Rollion-Bard, C.; Meibom, A.; Cuif, J.P.; Juillet-Leclerc, A.; Dauphin, Y. Correlation of boron isotopic composition with ultrastructure in the deep-sea coral Lophelia pertusa: Implications for biomineralization and paleo-pH. Geochem. Geophys. Geosyst. 2007, 8. [Google Scholar] [CrossRef]
- McConnaughey, T. 13C and 18O isotopic disequilibrium in biological carbonates: I. Patterns. Geochim. Cosmochim. Acta 1989, 53, 151–162. [Google Scholar] [CrossRef]
- Rollion-Bard, C.; Blamart, D.; Cuif, J.P.; Dauphin, Y. In situ measurements of oxygen isotopic composition in deep-sea coral, Lophelia pertusa: Re-examination of the current geochemical models of biomineralization. Geochim. Cosmochim. Acta 2010, 74, 1338–1349. [Google Scholar] [CrossRef]
- Rollion-Bard, C.; Blamart, D. Possible controls on Li, Na, and Mg incorporation into aragonite coral skeletons. Chem. Geol. 2015, 396, 98–111. [Google Scholar] [CrossRef]
- Cuif, J.P.; Dauphin, Y. Microstructural and physico-chemical characterizations of the“centers of calcification” in the septa of some recent Scleractinian corals. Paläont. Zeit. 1998, 72, 257–270. [Google Scholar] [CrossRef]
- Ogilvie, M.M. Microscopic and systematic study of Madreporarian types of corals. Philos. Trans. R. Soc. B 1896, 187, 83–345. [Google Scholar] [CrossRef]
- Milne-Edwards, H. Histoire Naturelle des Coralliaires ou Polypes Proprement Dits; Roret: Paris, France, 1860; Volume 1, 326p; Volume 2, 633p.; Volume 3, 560p. [Google Scholar]
- Wells, J.W. Scleractinia. In Treatise on Invertebrate Paleontology; Coelenterata, P.F., Moore, R.C., Eds.; The University of Kansas Press: Lawrence, KS, USA, 1956; pp. F328–F344. [Google Scholar]
- Bryan, W.H.; Hill, D. Spherulitic crystallization as a mechanism of skeletal growth in the hexacorals. Proc. R. Soc. Qld. 1941, 52, 78–91. [Google Scholar]
- Lowenstam, H.A. Minerals formed by organisms. Science 1981, 211, 1126–1131. [Google Scholar] [CrossRef] [PubMed]
- Veis, A. A window on biomineralization. Science 2005, 307, 1419–1420. [Google Scholar] [CrossRef] [PubMed]
- Weber, J.N.; Woodhead, P.M. Temperature dependence of oxygen-18 concentration in reef coral carbonates. J. Geophys. Res. 1972, 77, 463–473. [Google Scholar] [CrossRef]
- Volz, W. Die Korallen der Schichten von St. Cassian in Süd-Tirol (Frech, Fritz; Volz, Wilhelm: Die Korallenfauna der Trias. Monographisch bearbeitet. II). Palaeontographica 1896, 2, 1–124. [Google Scholar]
- Balan, E.; Aufort, J.; Pouillé, S.; Dabos, M.; Blanchard, M.; Lazzeri, M.; Rollion-Bard, C.; Blamart, D. Infrared spectroscopic study of sulfate-bearing calcite from deep-sea bamboo coral. Eur. J. Mineral. 2017, 29, 1–12. [Google Scholar] [CrossRef]
- Tisnérat-Laborde, N.; Paterne, M.; Métivier, B.; Arnold, M.; Yiou, P.; Blamart, D.; Raynaud, S. Variability of the northeast Atlantic sea surface Δ14C and marine reservoir age and the North Atlantic Oscillation (NAO). Quat. Sci. Rev. 2010, 29, 2633–2646. [Google Scholar] [CrossRef]
- Mook, W.G.; Van Der Plicht, J. Reporting 14C activities and concentrations. Radiocarbon 1999, 41, 227–239. [Google Scholar] [CrossRef]
- Roark, E.B.; Guilderson, T.P.; Dunbar, R.B.; Ingram, B.L. Radiocarbon-based ages and growth rates of Hawaiian deep-sea corals. Mar. Ecol. Prog. Ser. 2006, 327, 1–14. [Google Scholar] [CrossRef]
- Thresher, R.E. Environmental and compositional correlates of growth rate in deep-water bamboo corals (Gorgonacea; Isididae). Mar. Ecol. Prog. Ser. 2009, 397, 187–196. [Google Scholar] [CrossRef]
- Farmer, J.R.; Robinson, L.F.; Hönisch, B. Growth rate determinations from radiocarbon in bamboo corals (genus Keratoisis). Deep Sea Res. Part I 2015, 105, 26–40. [Google Scholar] [CrossRef]
- Lazier, A.V.; Smith, J.E.; Risk, M.J.; Schwarcz, H.P. The skeletal structure of Desmophyllum cristagalli: The use of deep-water corals in sclerochronology. Lethaia 1999, 32, 119–130. [Google Scholar] [CrossRef]
- Cuif, J.P.; Dauphin, Y.; Doucet, J.; Salome, M.; Susini, J. XANES mapping of organic sulfate in three scleractinian coral skeletons. Geochim. Cosmochim. Acta 2003, 67, 75–83. [Google Scholar] [CrossRef]
- Rollion-Bard, C.; Blamart, D.; Cuif, J.P.; Juillet-Leclerc, A. Microanalysis of C and O isotopes of azooxanthellate and zooxanthellate corals by ion microprobe. Coral Reefs 2003, 22, 405–415. [Google Scholar] [CrossRef]
- Rollion-Bard, C.; Chaussidon, M.; France-Lanord, C. pH control on oxygen isotopic composition of symbiotic corals. Earth Planet. Sc. Lett. 2003, 215, 275–288. [Google Scholar] [CrossRef]
- Rollion-Bard, C.; Mangin, D.; Champenois, M. Development and application of oxygen and carbon isotopic measurements of biogenic carbonates by ion microprobe. Geostand. Geoanal. Res. 2007, 31, 39–50. [Google Scholar] [CrossRef]
- Rollion-Bard, C.; Marin-Carbonne, J. Determination of SIMS matrix effects on oxygen isotopic compositions in carbonates. J. Anal. At. Spectrom. 2011, 26, 1285–1289. [Google Scholar] [CrossRef]
- Bice, K.L.; Layne, G.D.; Dahl, K. Application of secondary ion mass spectrometry to the determination of Mg/Ca in rare, delicate, or altered planktonic foraminifera: Examples from the Holocene, Paleogene, and Cretaceous. Geochem. Geophys. Geosyst. 2005, 6. [Google Scholar] [CrossRef]
- Vigier, N.; Rollion-Bard, C.; Spezzaferri, S.; Brunet, F. In situ measurements of Li isotopes in foraminifera. Geochem. Geophys. Geosyst. 2007, 8. [Google Scholar] [CrossRef]
- Kimball, J.B.; Dunbar, R.B.; Guilderson, T.P. Oxygen and carbon isotope fractionation in calcitic deep-sea corals: Implications for paleotemperature reconstruction. Chem. Geol. 2014, 381, 223–233. [Google Scholar] [CrossRef]
- Hill, T.M.; Spero, H.J.; Guilderson, T.; LaVigne, M.; Clague, D.; Macalello, S.; Jang, N. Temperature and vital effect controls on bamboo coral (Isididae) isotope geochemistry: A test of the “lines method”. Geochem. Geophys. Geosyst. 2011, 12. [Google Scholar] [CrossRef]
- Thresher, R.E.; Neil, H. Scale dependence of environmental and physiological correlates of δ18O and δ13C in the magnesium calcite skeletons of bamboo corals (Gorgonacea; Isididae). Geochim. Cosmochim. Acta 2016, 187, 260–278. [Google Scholar] [CrossRef]
- Chaabane, S.; Correa, M.L.; Montagna, P.; Kallel, N.; Taviani, M.; Linares, C.; Ziveri, P. Exploring the oxygen and carbon isotopic composition of the Mediterranean red coral (Corallium rubrum) for seawater temperature reconstruction. Mar. Chem. 2016, 186, 11–23. [Google Scholar] [CrossRef]
- Saenger, C.; Gabitov, R.I.; Farmer, J.; Watkins, J.M.; Stone, R. Linear correlations in bamboo coral δ13C and δ18O sampled by SIMS and micromill: Evaluating paleoceanographic potential and biomineralization mechanisms using δ11B and ∆47 composition. Chem. Geol. 2017, 454, 1–14. [Google Scholar] [CrossRef]
- Risk, M.J.; Hall-Spencer, J.; Williams, B. Climate records from the Faroe-Shetland Channel using Lophelia pertusa (Linnaeus, 1758). In Cold-Water Corals and Ecosystems; Freiwald, A., Roberts, J.M., Eds.; Springer: Berlin, Germany, 2005; pp. 1097–1108. [Google Scholar]
- Lutringer, A.; Blamart, D.; Frank, N.; Labeyrie, L. Paleotemperatures from deep-sea corals: Scale effects. In Cold-Water Corals and Ecosystems; Freiwald, A., Roberts, J.M., Eds.; Springer: Berlin, Germany, 2005; pp. 1081–1096. [Google Scholar]
- Gabitov, R.I.; Rollion-Bard, C.; Tripati, A.; Sadekov, A. In situ study of boron partitioning between calcite and fluid at different crystal growth rates. Geochim. Cosmochim. Acta 2014, 137, 81–92. [Google Scholar] [CrossRef]
- Noireaux, J.; Mavromatis, V.; Gaillardet, J.; Schott, J.; Montouillout, V.; Louvat, P.; Rollion-Bard, C.; Neuville, D.R. Crystallographic control on the boron isotope paleo-pH proxy. Earth Planet. Sci. Lett. 2015, 430, 398–407. [Google Scholar] [CrossRef]
- Thresher, R.E.; Wilson, N.C.; MacRae, C.M.; Neil, H. Temperature effects on the calcite skeletal composition of deep-water gorgonians (Isididae). Geochim. Cosmochim. Acta 2010, 74, 4655–4670. [Google Scholar] [CrossRef]
- Sherwood, O.A.; Heikoop, J.M.; Scott, D.B.; Risk, M.J.; Guilderson, T.P.; McKinney, R.A. Stable isotopic composition of deep-sea gorgonian corals Primnoa spp.: A new archive of surface processes. Mar. Ecol. Prog. Ser. 2005, 301, 135–148. [Google Scholar] [CrossRef]
- Sinclair, D.; Sherwood, O.; Risk, M.; Hillaire-Marcel, C.; Tubrett, M.; Sylvester, P.; McCulloch, M.; Kinsley, L. Testing the reproducibility of Mg/Ca profiles in the deep-water coral Primnoa resedaeformis: Putting the proxy through its paces. In Cold-Water Corals and Ecosystems; Freiwald, A., Roberts, J.M., Eds.; Springer: Berlin, Germany, 2005; pp. 1039–1060. [Google Scholar]
- Sinclair, D.J.; Williams, B.; Allard, G.; Ghaleb, B.; Fallon, S.; Ross, S.W.; Risk, M. Reproducibility of trace element profiles in a specimen of the deep-water bamboo coral Keratoisis sp. Geochim. Cosmochim. Acta 2011, 75, 5101–5121. [Google Scholar] [CrossRef]
- Pilkey, O.H.; Harris, R.C. The effect of intertidal environment on the composition of calcareous skeletal material. Limnol. Oceanogr. 1966, 11, 381–385. [Google Scholar] [CrossRef]
- Bond, Z.A.; Cohen, A.L.; Smith, S.R.; Jenkins, W.J. Growth and composition of high-Mg calcite in the skeleton of a Bermudian gorgonian (Plexaurella dichotoma): Potential for paleothermometry. Geochem. Geophys. Geosyst. 2005, 6. [Google Scholar] [CrossRef]
- Gabitov, R.I.; Gagnon, A.C.; Guan, Y.; Eiler, J.M.; Adkins, J.F. Accurate Mg/Ca, Sr/Ca, and Ba/Ca ratio measurements in carbonates by SIMS and NanoSIMS and an assessment of heterogeneity in common calcium carbonate standards. Chem. Geol. 2013, 356, 94–108. [Google Scholar] [CrossRef]
- Case, D.H.; Robinson, L.F.; Auro, M.E.; Gagnon, A.C. Environmental and biological controls on Mg and Li in deep-sea scleractinian corals. Earth Planet. Sci. Lett. 2010, 300, 215–225. [Google Scholar] [CrossRef]
- Hathorne, E.C.; Felis, T.; Suzuki, A.; Kawahata, H.; Cabioch, G. Lithium in the aragonite skeletons of massive Porites corals: A new tool to reconstruct tropical sea surface temperatures. Paleoceanography 2013, 28, 143–152. [Google Scholar] [CrossRef]
- Raddatz, J.; Liebetrau, V.; Rüggeberg, A.; Hathorne, E.; Krabbenhöft, A.; Eisenhauer, A.; Böhm, F.; Vollstaedt, H.; Fietzke, J.; Lopez-Correa, M.; et al. Stable Sr-isotope, Sr/Ca, Mg/Ca, Li/Ca and Mg/Li ratios in the scleractinian cold-water coral Lophelia pertusa. Chem. Geol. 2013, 352, 143–152. [Google Scholar] [CrossRef]
- Montagna, P.; McCulloch, M.; Douville, E.; Correa, M.L.; Trotter, J.; Rodolfo-Metalpa, R.; Dissard, D.; Taviani, M.; Goldstein, S.; Mazzoli, C.; et al. Li/Mg systematics in scleractinian corals: Calibration of the thermometer. Geochim. Cosmochim. Acta 2014, 132, 288–310. [Google Scholar] [CrossRef]
- Al-Horani, F.A.; Al-Moghrabi, S.M.; De Beer, D. The mechanism of calcification and its relation to photosynthesis and respiration in the scleractinian coral Galaxea fascicularis. Mar. Biol. 2003, 142, 419–426. [Google Scholar] [CrossRef]
- Venn, A.A.; Tambutté, E.; Lotto, S.; Zoccola, D.; Allemand, D.; Tambutté, S. Imaging intracellular pH in a reef coral and symbiotic anemone. Proc. Natl. Acad. Sci. USA 2009, 106, 16574–16579. [Google Scholar] [CrossRef] [PubMed]
- Venn, A.A.; Tambutté, E.; Holcomb, M.; Allemand, D.; Tambutté, S. Live tissue imaging shows reef corals elevate pH under their calcifying tissue relative to seawater. PLoS ONE 2011, 6, e20013. [Google Scholar] [CrossRef] [PubMed]
- Venn, A.A.; Tambutté, E.; Holcomb, M.; Laurent, J.; Allemand, D.; Tambutté, S. Impact of seawater acidification on pH at the tissue-skeleton interface and calcification in reef corals. Proc. Natl. Acad. Sci. USA 2013, 110, 1634–1639. [Google Scholar] [CrossRef] [PubMed]
- Klochko, K.; Kaufman, A.J.; Yao, W.; Byrne, R.H.; Tossell, J.A. Experimental measurement of boron isotope fractionation in seawater. Earth Planet. Sci. Lett. 2006, 248, 276–285. [Google Scholar] [CrossRef]
- Hemming, N.G.; Hanson, G.N. Boron isotopic composition and concentration in modern marine carbonates. Geochim. Cosmochim. Acta 1992, 56, 537–543. [Google Scholar] [CrossRef]
- Klochko, K.; Cody, G.D.; Tossell, J.A.; Dera, P.; Kaufman, A.J. Re-evaluating boron speciation in biogenic calcite and aragonite using 11 B MAS NMR. Geochim. Cosmochim. Acta 2009, 73, 1890–1900. [Google Scholar] [CrossRef]
- Rollion-Bard, C.; Blamart, D.; Trebosc, J.; Tricot, G.; Mussi, A.; Cuif, J.P. Boron isotopes as pH proxy: A new look at boron speciation in deep-sea corals using 11B MAS NMR and EELS. Geochim. Cosmochim. Acta 2011, 75, 1003–1012. [Google Scholar] [CrossRef]
- Cusack, M.; Kamenos, N.A.; Rollion-Bard, C.; Tricot, G. Red coralline algae assessed as marine pH proxies using 11B MAS NMR. Sci. Rep. 2015, 5. [Google Scholar] [CrossRef] [PubMed]
- Foster, G.L.; Pogge von Strandmann, P.A.E.; Rae, J.W.B. Boron and magnesium isotopic composition of seawater. Geochem. Geophys. Geosyst. 2010, 11. [Google Scholar] [CrossRef]
- Dickson, A.G. Thermodynamics of the dissociation of boric acid in synthetic seawater from 273.15 to 318.15 K. Deep Sea Res. Part A 1990, 37, 755–766. [Google Scholar] [CrossRef]
- McCulloch, M.; Falter, J.; Trotter, J.; Montagna, P. Coral resilience to ocean acidification and global warming through pH up-regulation. Nat. Clim. Chang. 2012, 2, 623–627. [Google Scholar] [CrossRef]
- Ip, Y.K.; Lim, A.L.L.; Lim, R.W.L. Some properties of calcium-activated adenosine triphosphatase from the hermatypic coral Galaxea fascicularis. Mar. Biol. 1991, 111, 191–197. [Google Scholar] [CrossRef]
- Kingsley, R.J.; Watabe, N. An autoradiographic study of calcium transport in spicule formation in the gorgonian Leptogorgia virgulata (Lamarck) (Coelenterata: Gorgonacea). Cell Tissue Res. 1985, 239, 305–310. [Google Scholar] [CrossRef]
- Anagnostou, E.; Huang, K.F.; You, C.F.; Sikes, E.L.; Sherrell, R.M. Evaluation of boron isotope ratio as a pH proxy in the deep sea coral Desmophyllum dianthus: Evidence of physiological pH adjustment. Earth Planet Sci. Lett. 2012, 349, 251–260. [Google Scholar] [CrossRef]
- Weinbauer, M.G.; Brandstätter, F.; Velimirov, B. On the potential use of magnesium and strontium concentrations as ecological indicators in the calcite skeleton of the red coral (Corallium rubrum). Mar. Biol. 2000, 137, 801–809. [Google Scholar] [CrossRef]
- Oomori, T.; Kaneshima, H.; Maezato, Y.; Kitano, Y. Distribution coefficient of Mg2+ ions between calcite and solution at 10–50 °C. Mar. Chem. 1987, 20, 327–336. [Google Scholar] [CrossRef]
- Cuif, J.P.; Dauphin, Y.; Sorauf, J.E. Biominerals and Fossils through Time; Cambridge University Press: Cambridge, UK, 2010; 512p. [Google Scholar]
- Cuif, J.P. Calcification in the Cnidaria through Time: An Overview of Their Skeletal Patterns from Individual to Evolutionary Viewpoints. In The Cnidaria, Past, Present and Future; Springer: Berlin, Germany, 2016; pp. 163–179. [Google Scholar]
- Cuif, J.P. The Rugosa-Scleractinia gap re-examined through microstructural and biochemical evidence: A tribute to HC Wang. Palaeoworld 2014, 23, 1–14. [Google Scholar] [CrossRef]
- Beniash, E.; Aizenberg, J.; Addadi, L.; Weiner, S. Amorphous calcium carbonate transforms into calcite during sea urchin larval spicule growth. Proc. R. Soc. Lond. B Biol. Sci. 1997, 264, 461–465. [Google Scholar] [CrossRef]
- Cuif, J.P.; Dauphin, Y.; Farre, B.; Nehrke, G. Distribution of sulphated polysaccharides within calcareous biominerals indicates a widely shared layered growth-mode for the Invertebrate skeletons and suggests a two-step crystallization process for the mineral growth units. Mineral. Mag. 2008, 72, 233–237. [Google Scholar] [CrossRef]
- Meibom, A.; Cuif, J.P.; Hillion, F.; Constantz, B.R.; Juillet-Leclerc, A.; Dauphin, Y.; Watanabe, T.; Dunbar, R.B. Distribution of magnesium in coral skeleton. Geophys. Res. Lett. 2004, 31. [Google Scholar] [CrossRef]
- Cuif, J.P.; Dauphin, Y. The environmental recording unit in coral skeleton—A synthesis of structural and chemical evidences for a biochemically driven, stepping-growth process in fibres. Biogeosciences 2005, 2, 61–73. [Google Scholar] [CrossRef]
- Sutton, J.N.; Liu, Y.W.; Ries, J.B.; Guillermic, M.; Ponzevera, E.; Eagle, R.A. δ11B as monitor of calcification site pH in marine calcifying organisms. Biogeosci. Dis. 2017. [Google Scholar] [CrossRef]
Figure 1.
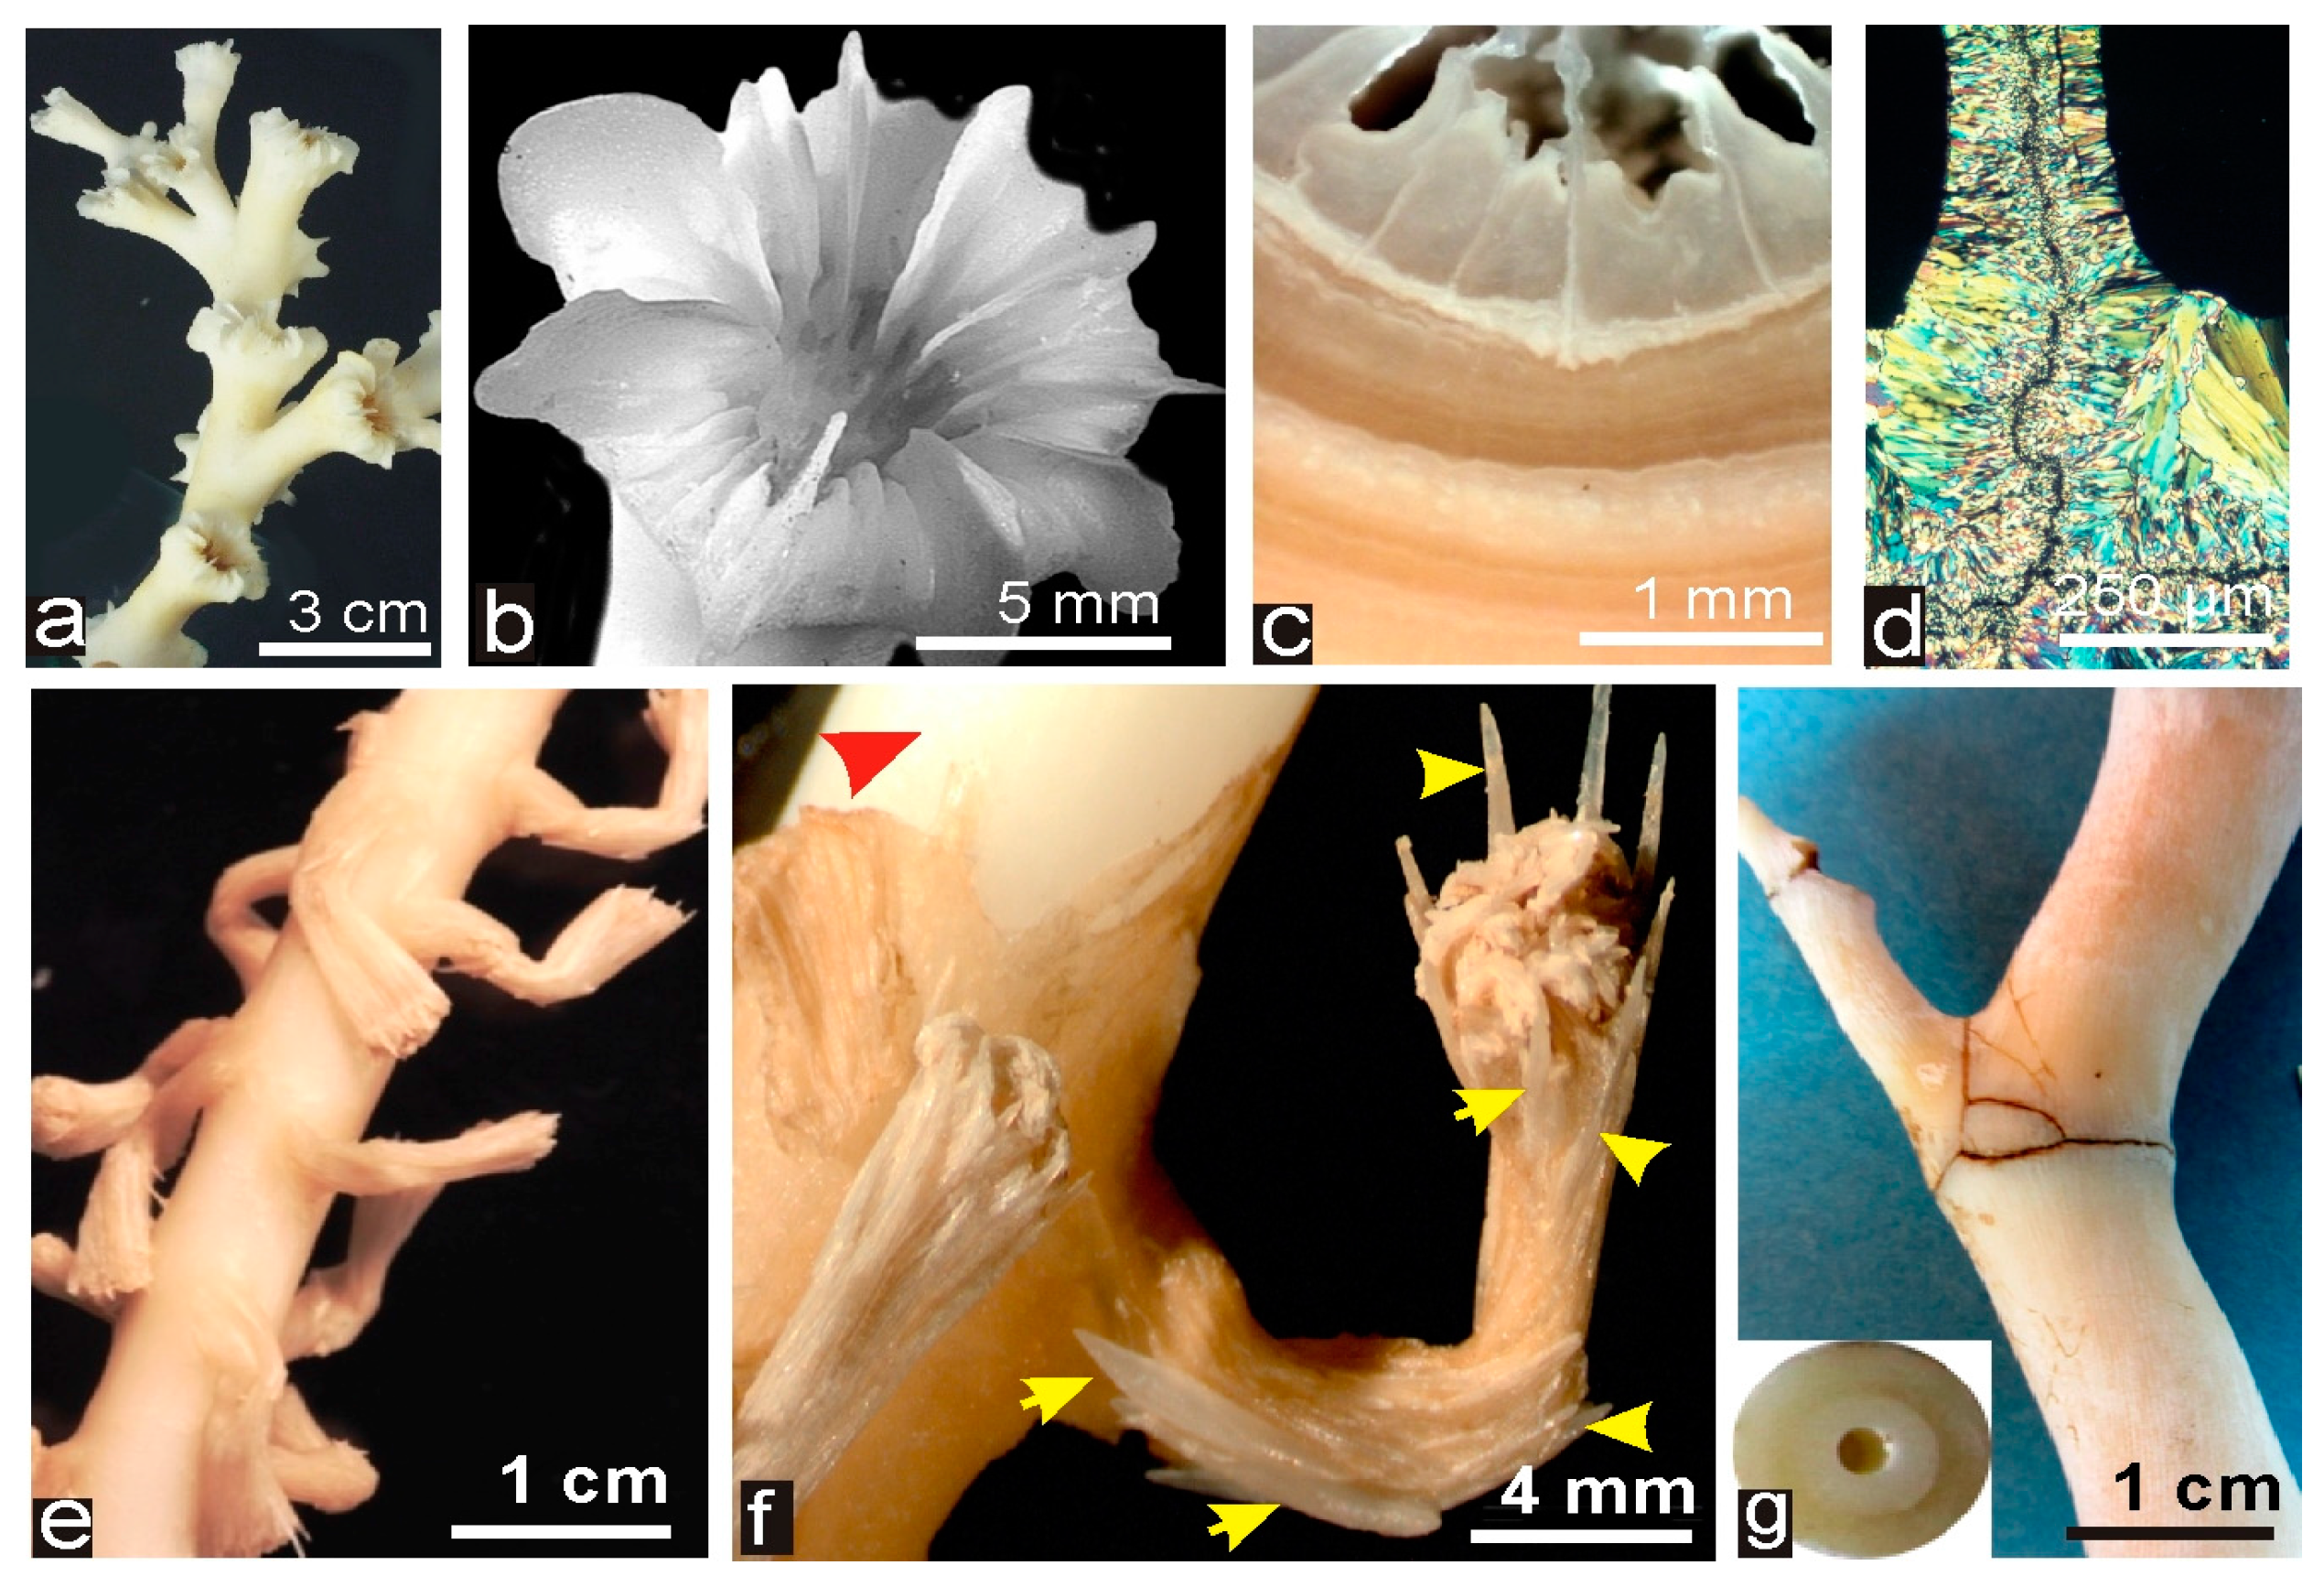
Deep-Sea Scleractinia corals (DSSC) and Deep-Sea Octocoralla Corals (DSOC). (a–d) Morphology and microstructure in one of the most studied DSSC: Lophelia pertusa. Dendroid colonies (a) are built by simple corallites (b) with radial linear septa and thick walls (c–e). Thin sections of septa exhibit typical crystal-like fibers perpendicular to the median continuous area). (e) Axis and polyps in one of the studied DSOC specimen (cf. Acanella sp., Muséum National d’Histoire Naturelle-MNHN-collections, Paris); (f) red arrow indicates the solid axis (normally covered by the common tissues joining the polyps) and yellow arrows point to the calcareous spicules that form the dense but flexible skeleton of the polyps; and (g) view of the articulated solid axis and the studied section (named Terrasses from the place it was collected).
Figure 1.
Deep-Sea Scleractinia corals (DSSC) and Deep-Sea Octocoralla Corals (DSOC). (a–d) Morphology and microstructure in one of the most studied DSSC: Lophelia pertusa. Dendroid colonies (a) are built by simple corallites (b) with radial linear septa and thick walls (c–e). Thin sections of septa exhibit typical crystal-like fibers perpendicular to the median continuous area). (e) Axis and polyps in one of the studied DSOC specimen (cf. Acanella sp., Muséum National d’Histoire Naturelle-MNHN-collections, Paris); (f) red arrow indicates the solid axis (normally covered by the common tissues joining the polyps) and yellow arrows point to the calcareous spicules that form the dense but flexible skeleton of the polyps; and (g) view of the articulated solid axis and the studied section (named Terrasses from the place it was collected).

Figure 2.
Taxonomy-linked skeletal patterns in the Scleractinia: (a–c) distal growth edge of Favia fragum; and (d–f) Distal growth edge of Diploria labyrinthica. These species illustrate the specific and easily recognizable morphologies of the distal growth edges, each of them corresponding to a specific distribution of the two distinct mineralizing areas. (g,j) Organization of calcareous components in the septum of the DSSC Lophelia sp. The linear septum of the Lophelia corallites (see Figure 1a,b) is built by two microstructurally distinct areas: the distal growth edge (h); and symmetrically deposited onto lateral sides the layers of fibrous tissue (i). Interestingly, these two microstructurally distinct aragonitic compartments (j) exhibit specific and strongly distinct chemical, biochemical and isotopic properties [8,15,29], although synchronically deposited by the basal ectoderm layer of the polyp.
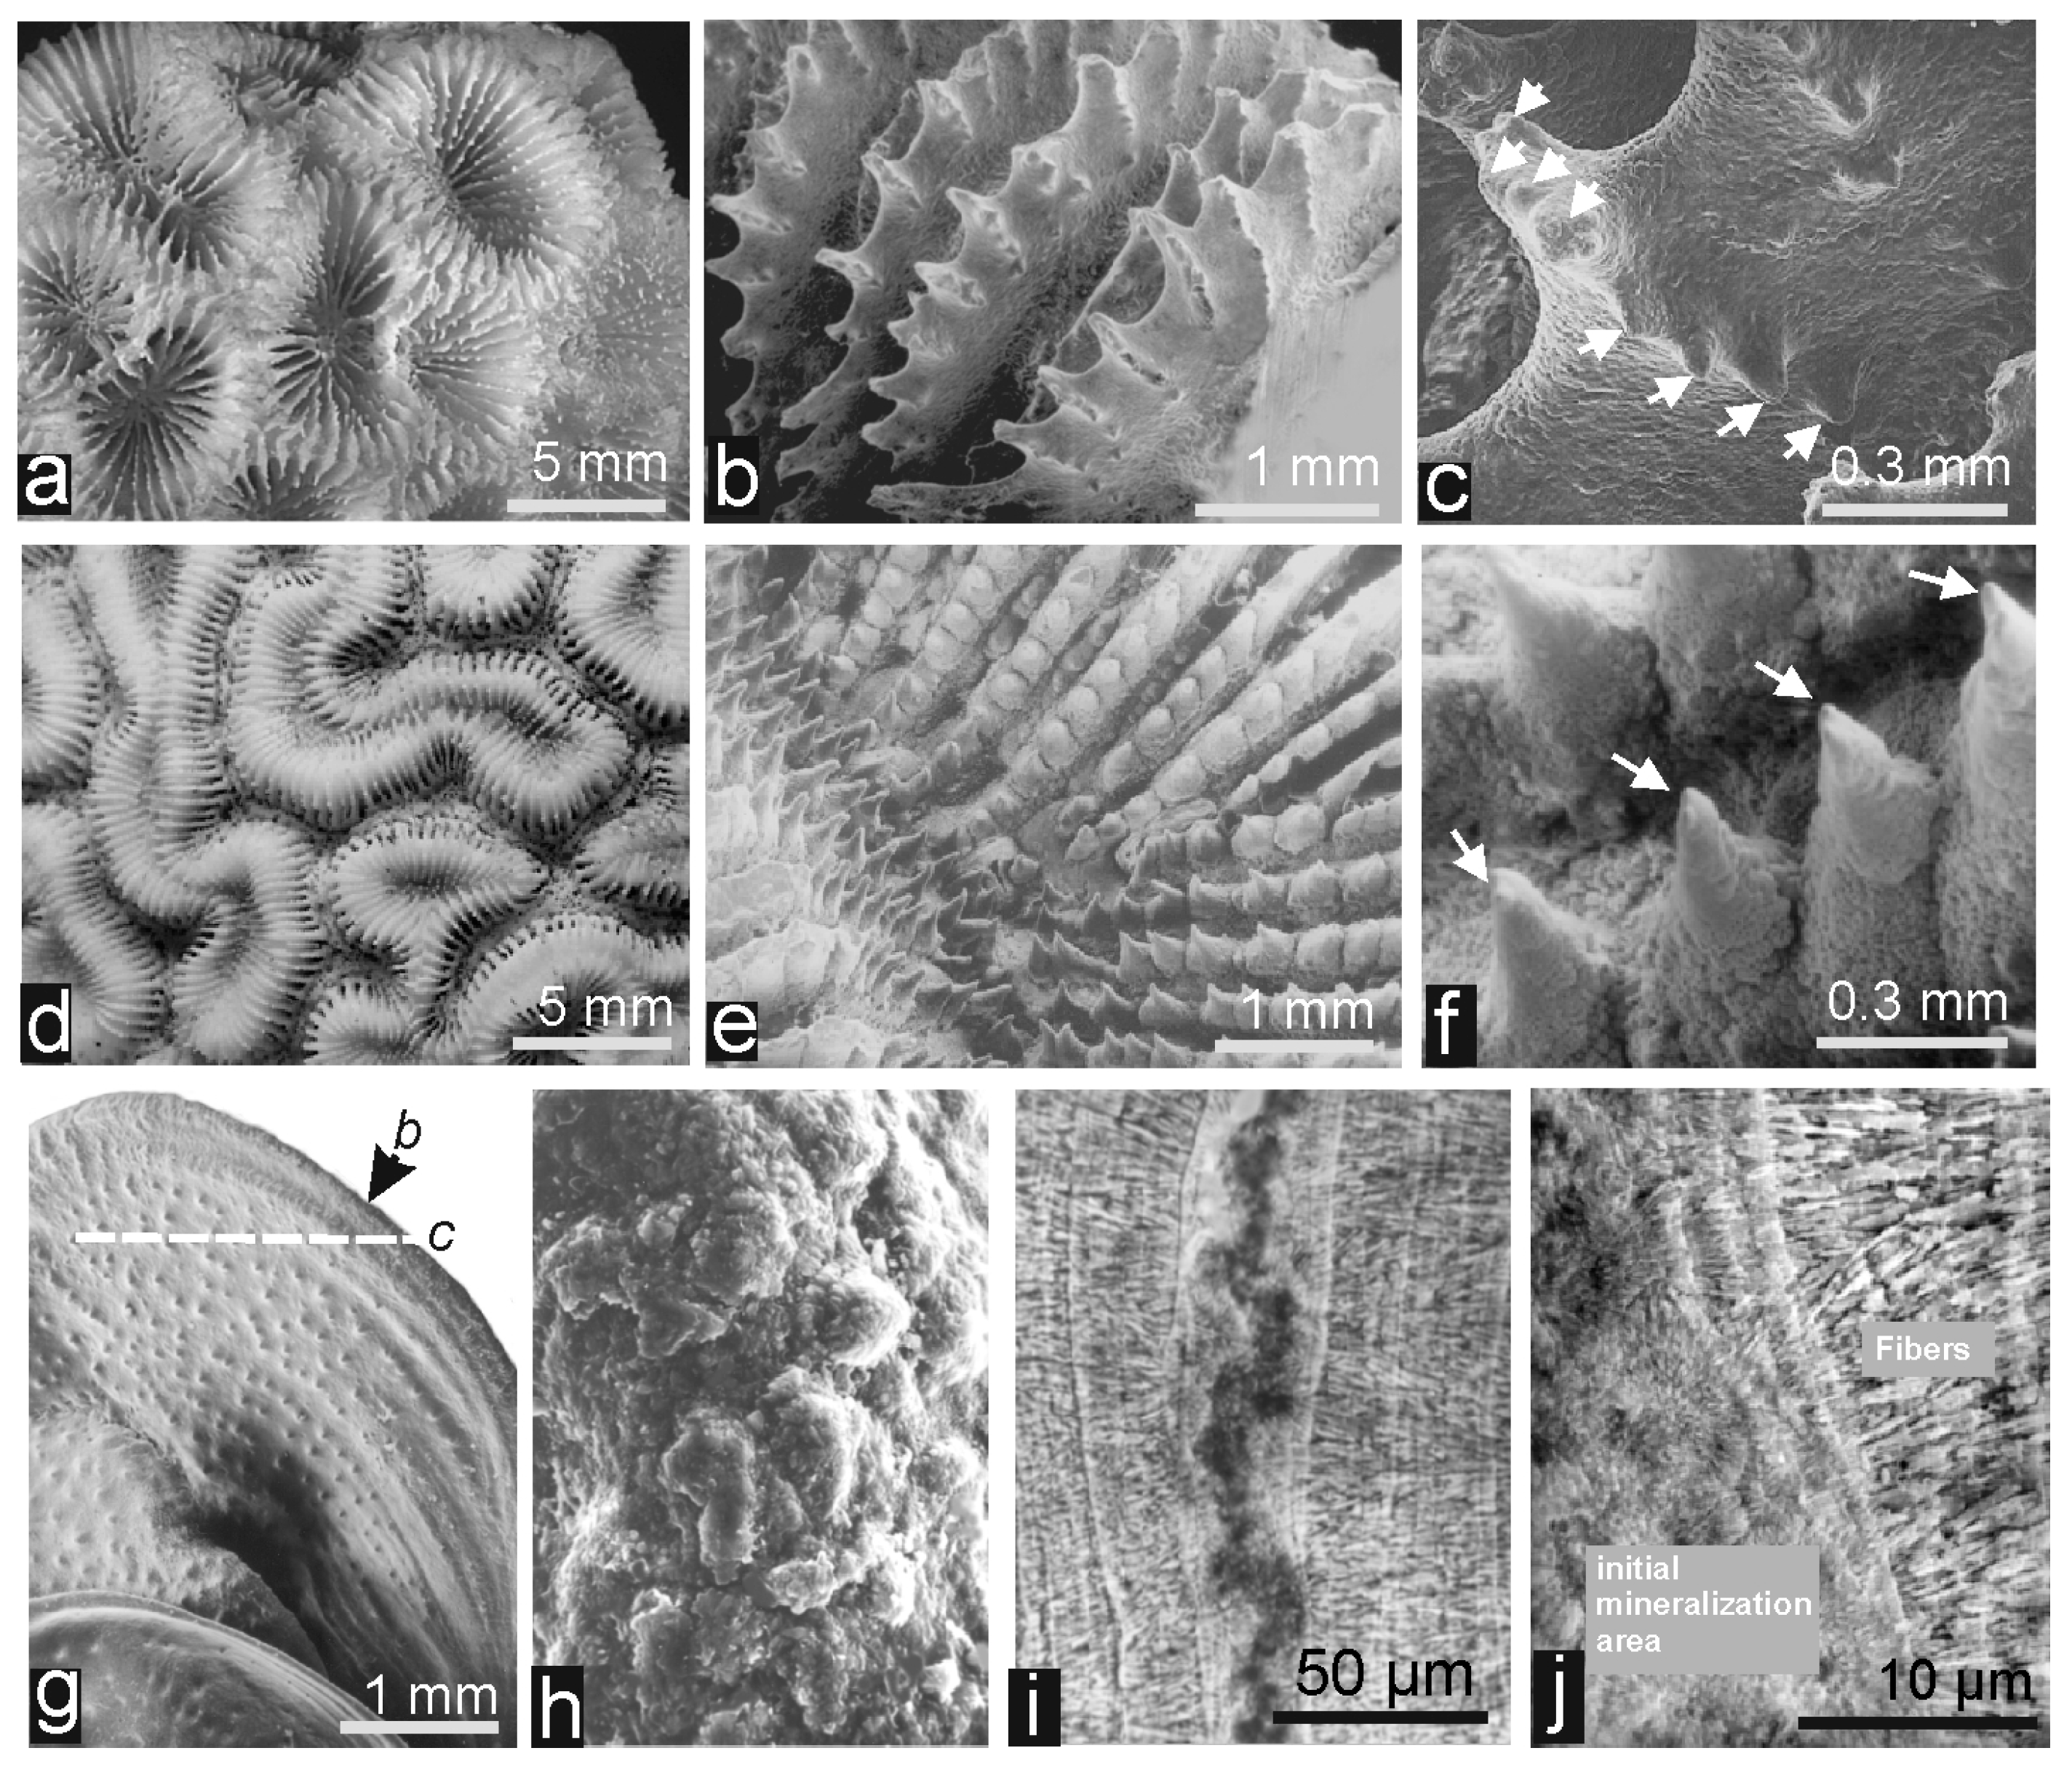
Figure 3.
The crystal-like fibers and spherulitic crystallization of coral skeletons (a,c) and the biochemical evidence of an initial mineralization area with specific biochemical properties. (a,b) Thins section viewed in polarized light (a); and SEM picture of a fracture surface clearly support the concept of “spherulitic crystallization” of the fibers (c); (d–g) The initial mineralization area in Montasdrea (d) illustrates: the biochemical specificity by UV fluorescence (e); acridine orange staining (f); and XANES (X-ray Absorption Near Edge Structure) mapping of sulfated polysaccharides (g).
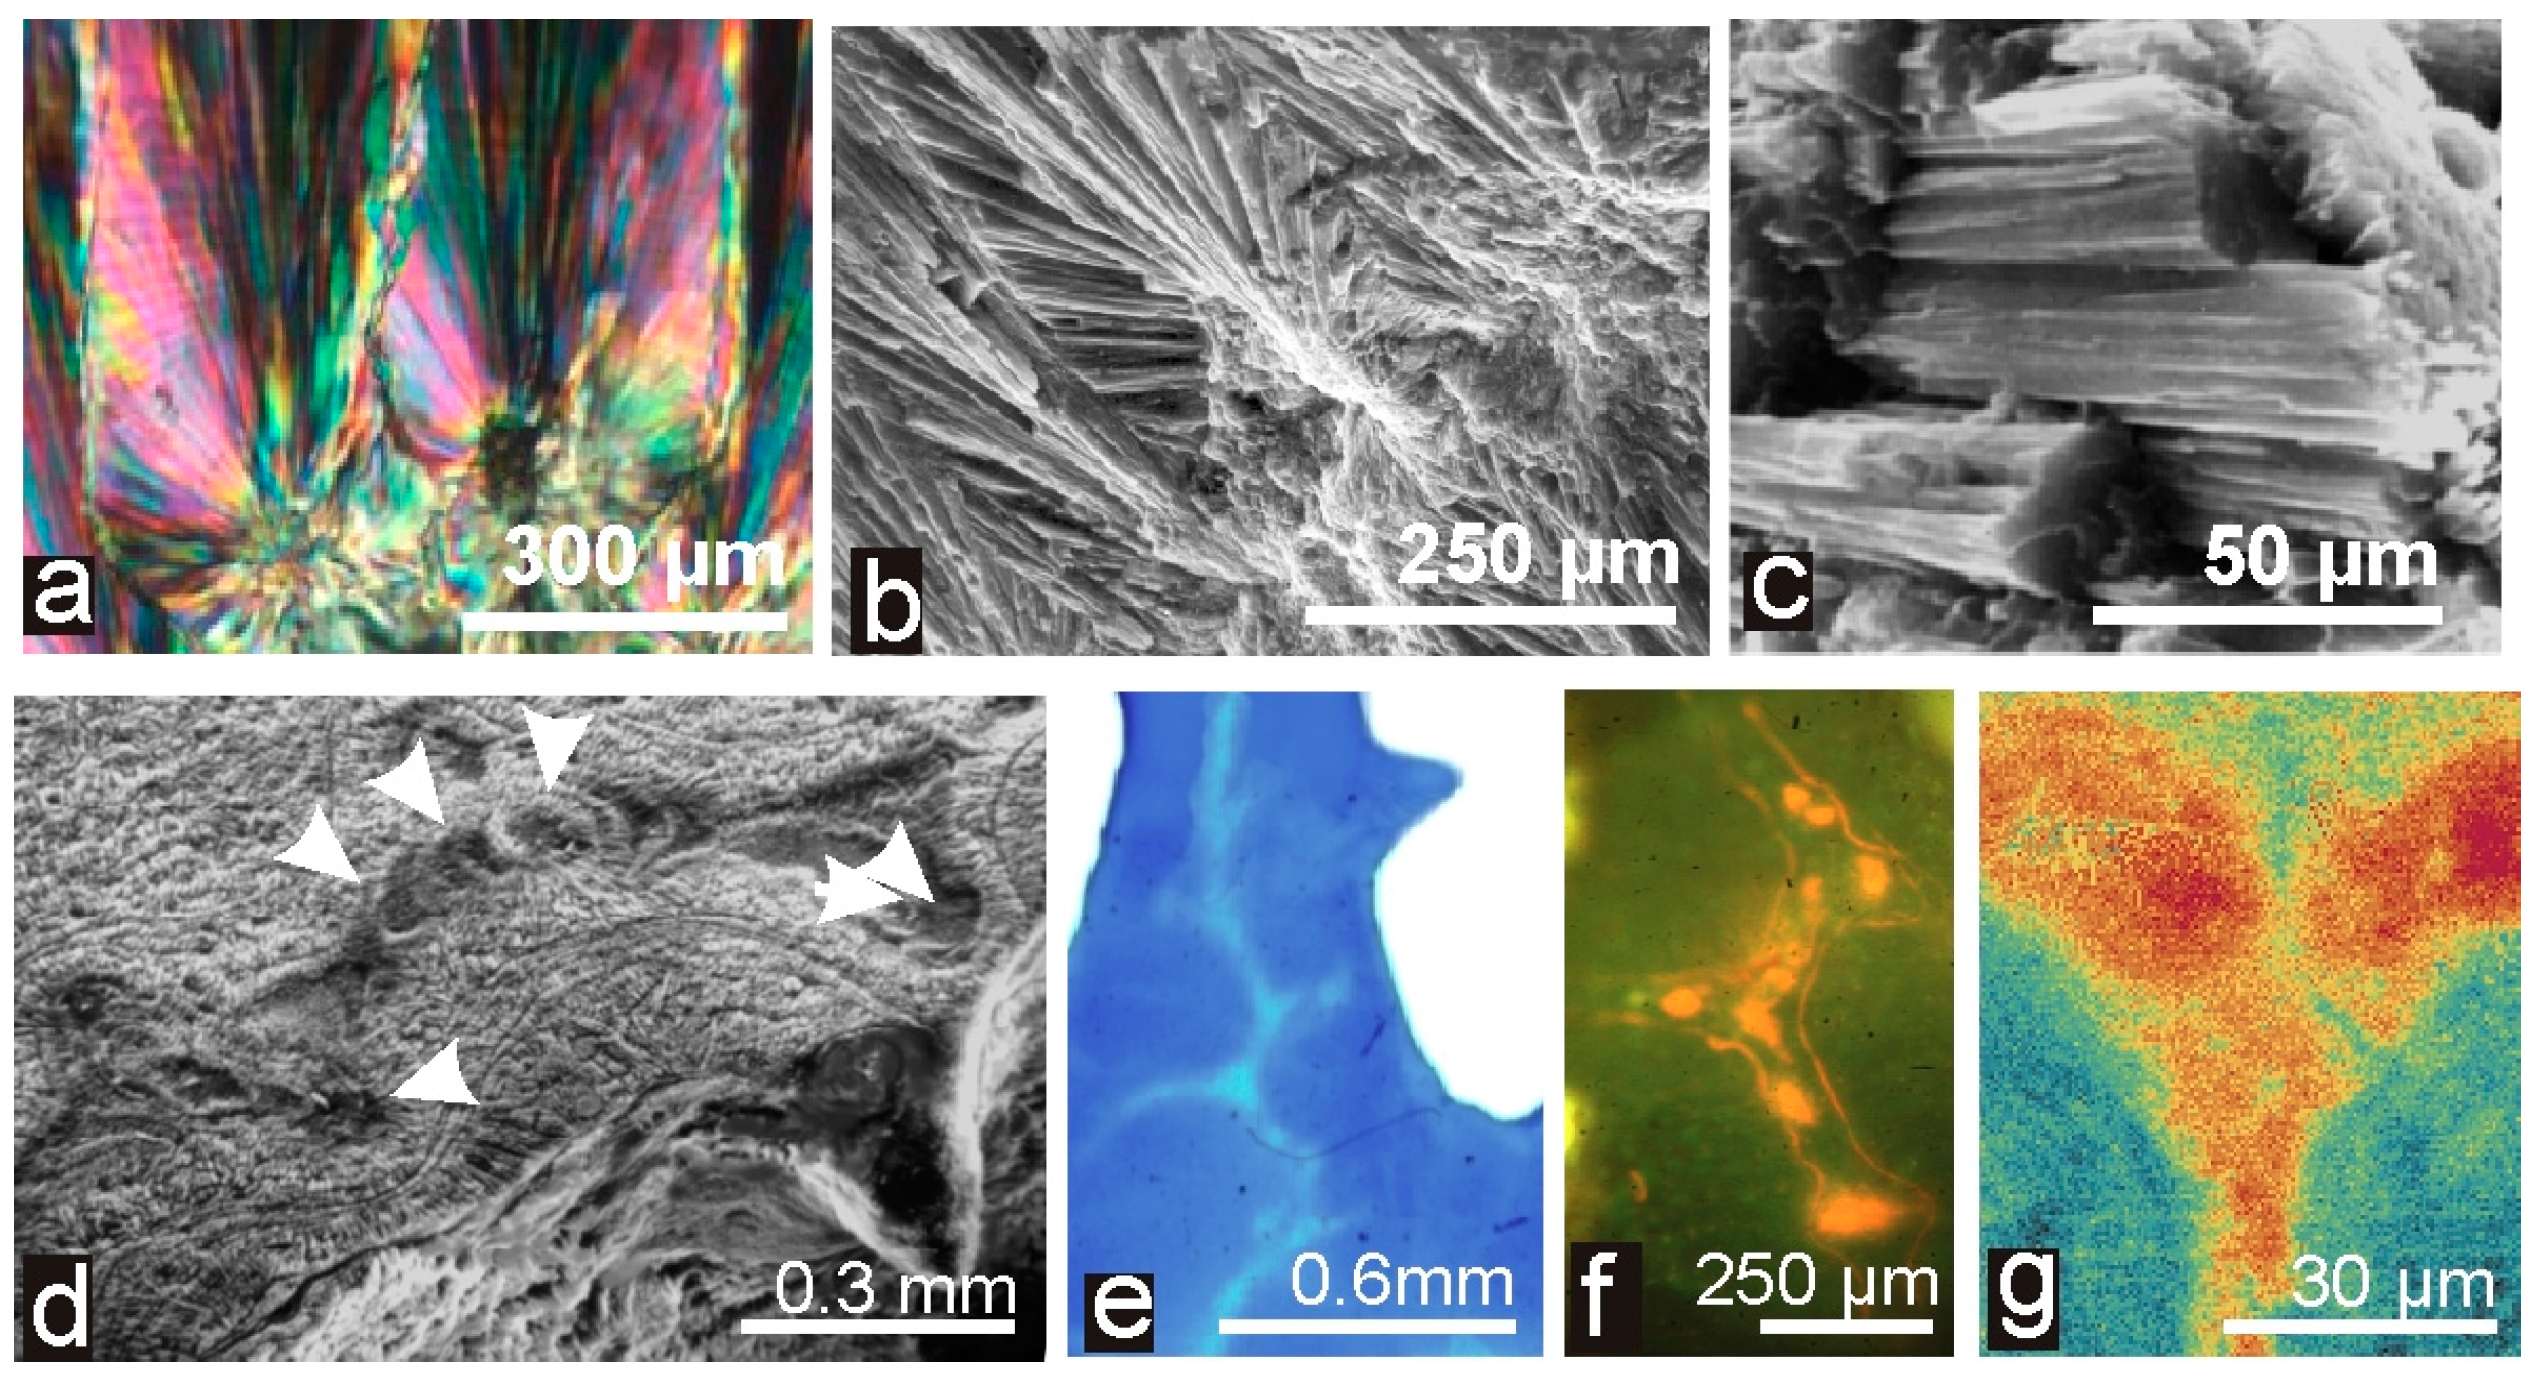
Figure 4.
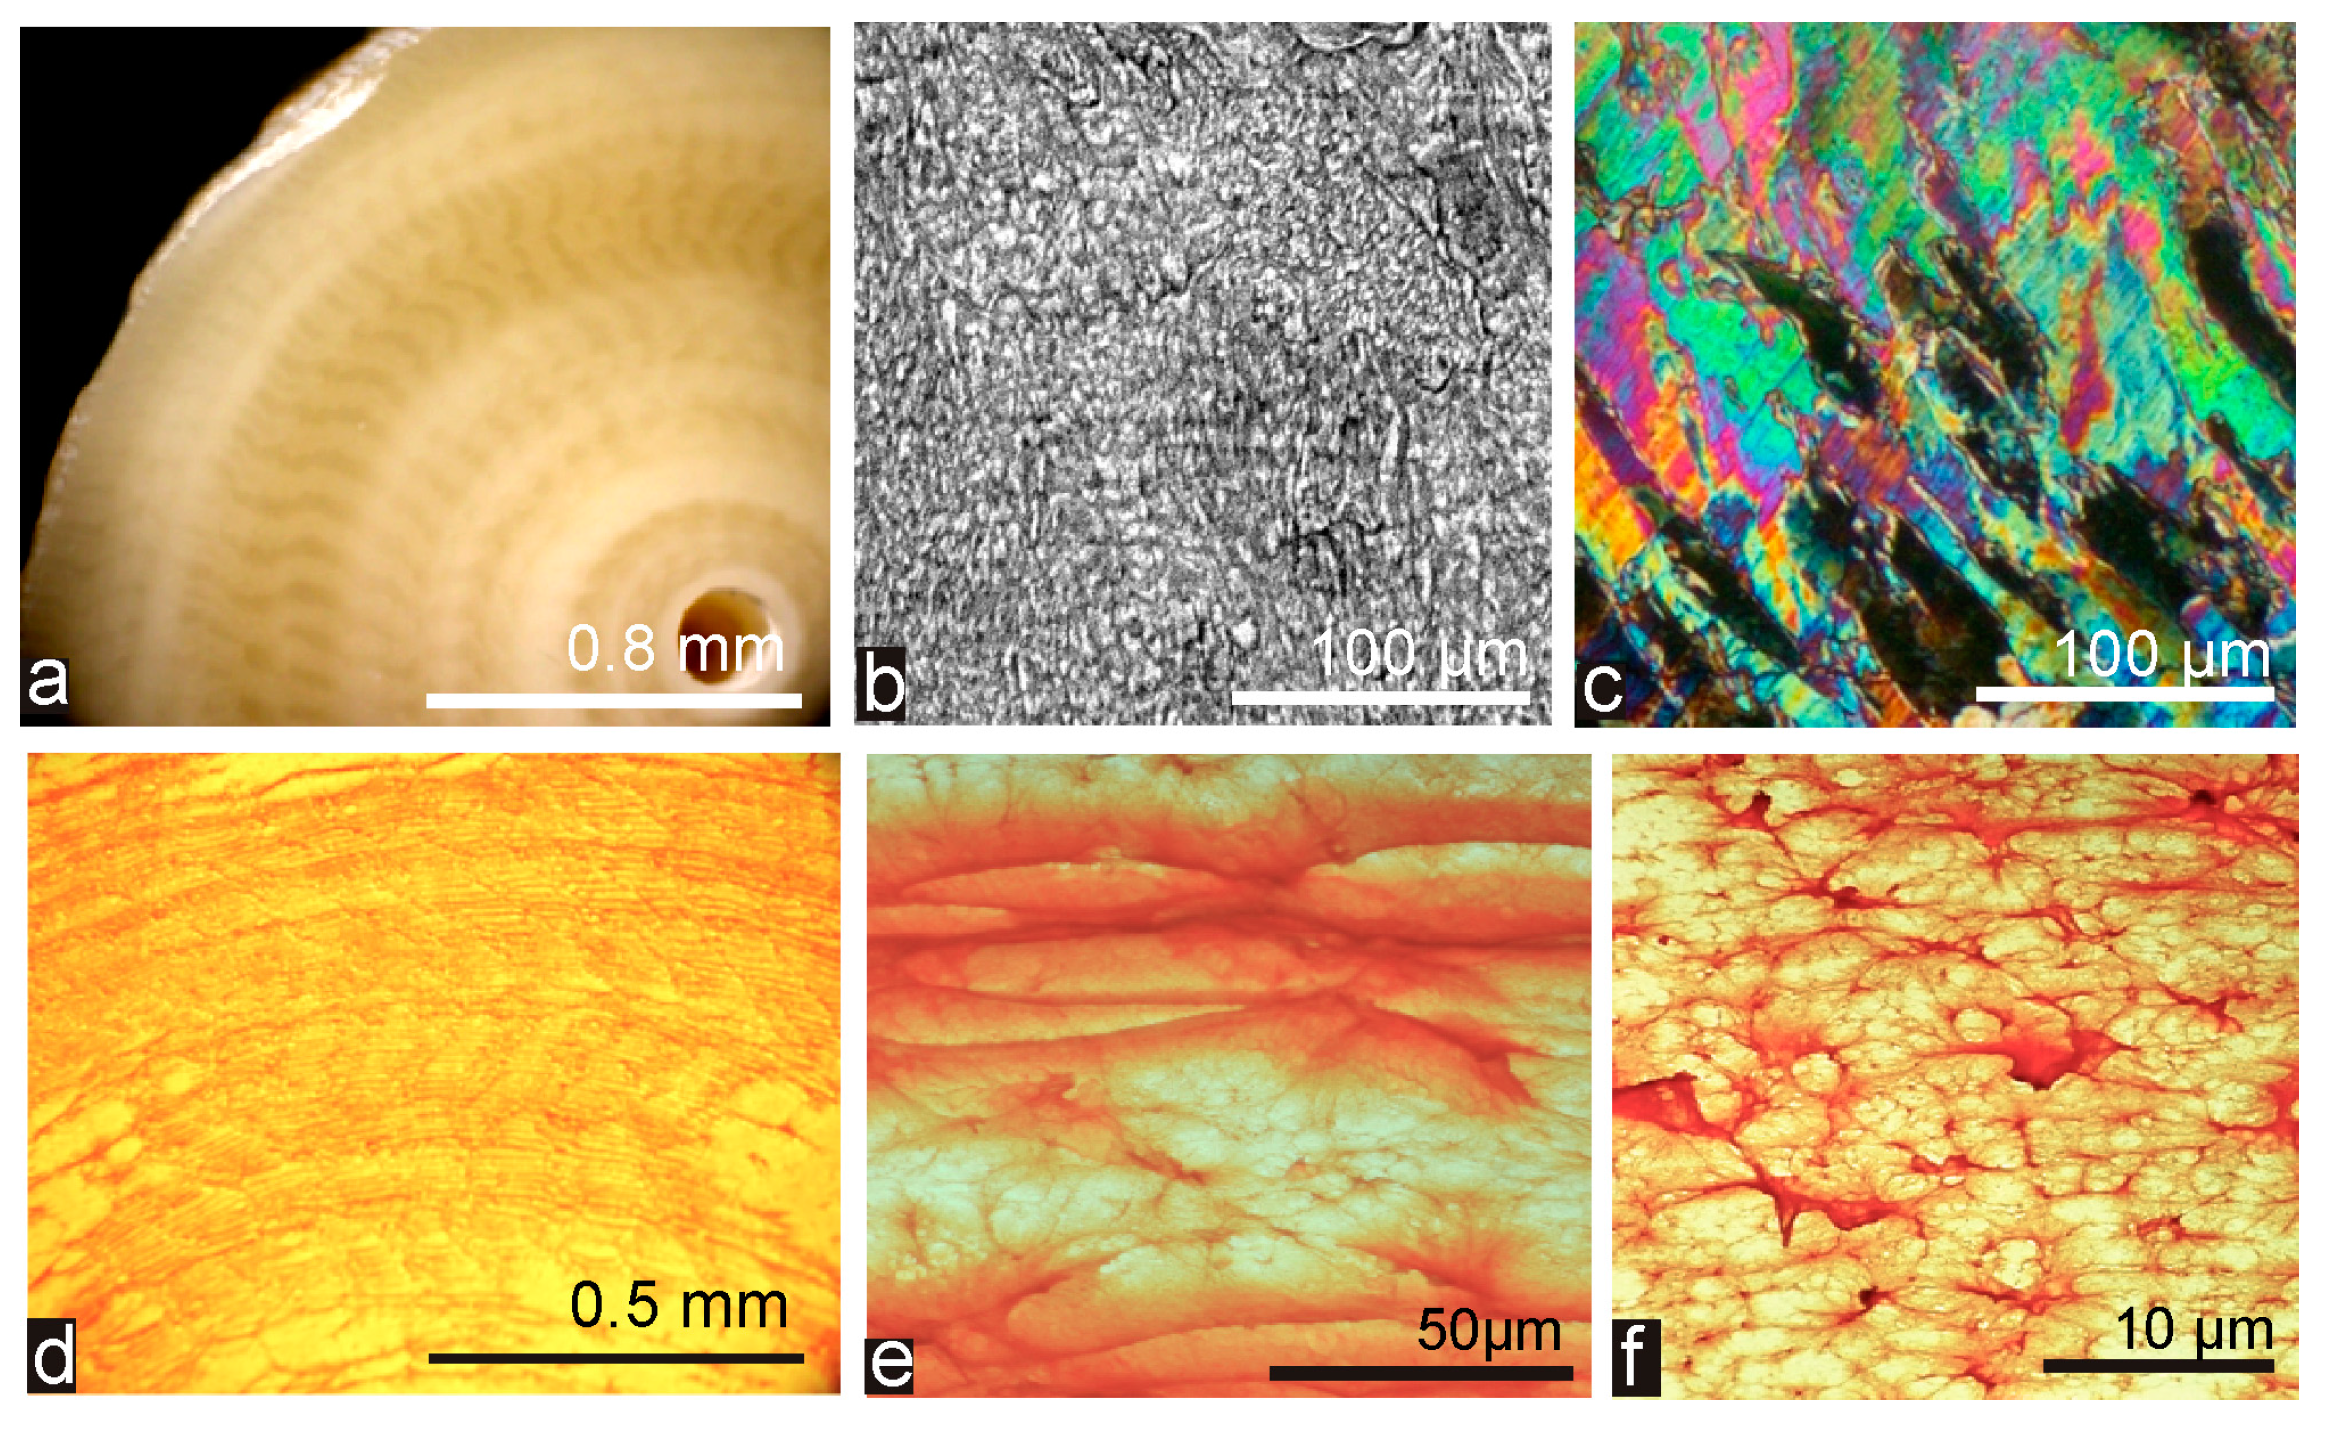
Microstructure, cristallinity and organic distribution in the Bamboo coral “Jasus” used in this study: (a) partial view of the specimens; (b) SEM view at medium enlargement: no clear indication of elongated and continuous fibers; (c) at the same enlargement, calcite is crystallized as small and rather disordered units; and (d–f) Acridine orange staining of the regular concentric growth layers (d).
Figure 4.
Microstructure, cristallinity and organic distribution in the Bamboo coral “Jasus” used in this study: (a) partial view of the specimens; (b) SEM view at medium enlargement: no clear indication of elongated and continuous fibers; (c) at the same enlargement, calcite is crystallized as small and rather disordered units; and (d–f) Acridine orange staining of the regular concentric growth layers (d).

Figure 5.
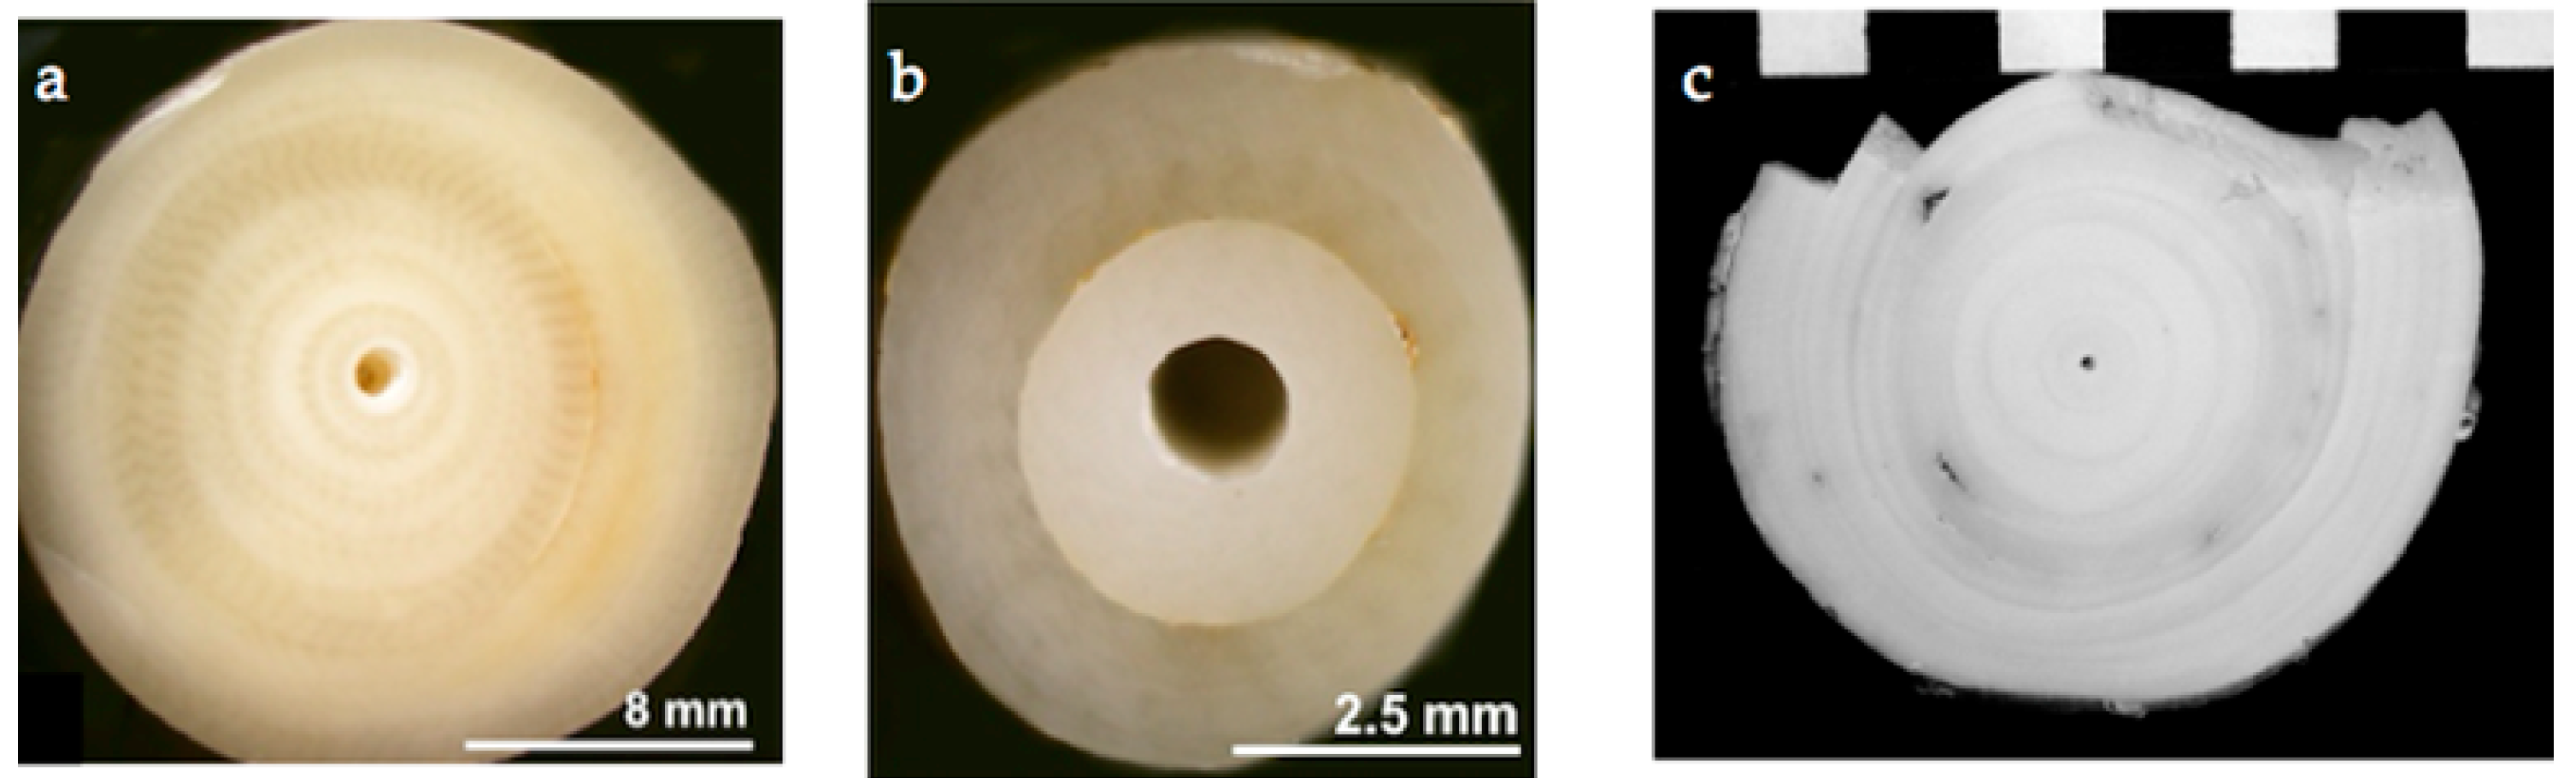
Samples measured in this study: (a) Jasus; (b) Terrasses; and (c) Valpareso.

Figure 6.
Comparison of the δ18O and δ13C measurements expressed in per mil (V-PDB) in Valpareso (red diamonds) and Jasus (pink diamonds) samples with data from the literature. Square symbols represent the data for scleractinian corals (data from [7,9,25,48,59]); circle symbols are for octocorallian corals (data from [22,54,55,56]).

Figure 7.
δ18O values measured by SIMS in Valpareso coral. The red curve represents the moving average (4 points). The grey area is the range of δ18O variation measured by bulk technique. Error bar is ±1σ.
Figure 7.
δ18O values measured by SIMS in Valpareso coral. The red curve represents the moving average (4 points). The grey area is the range of δ18O variation measured by bulk technique. Error bar is ±1σ.
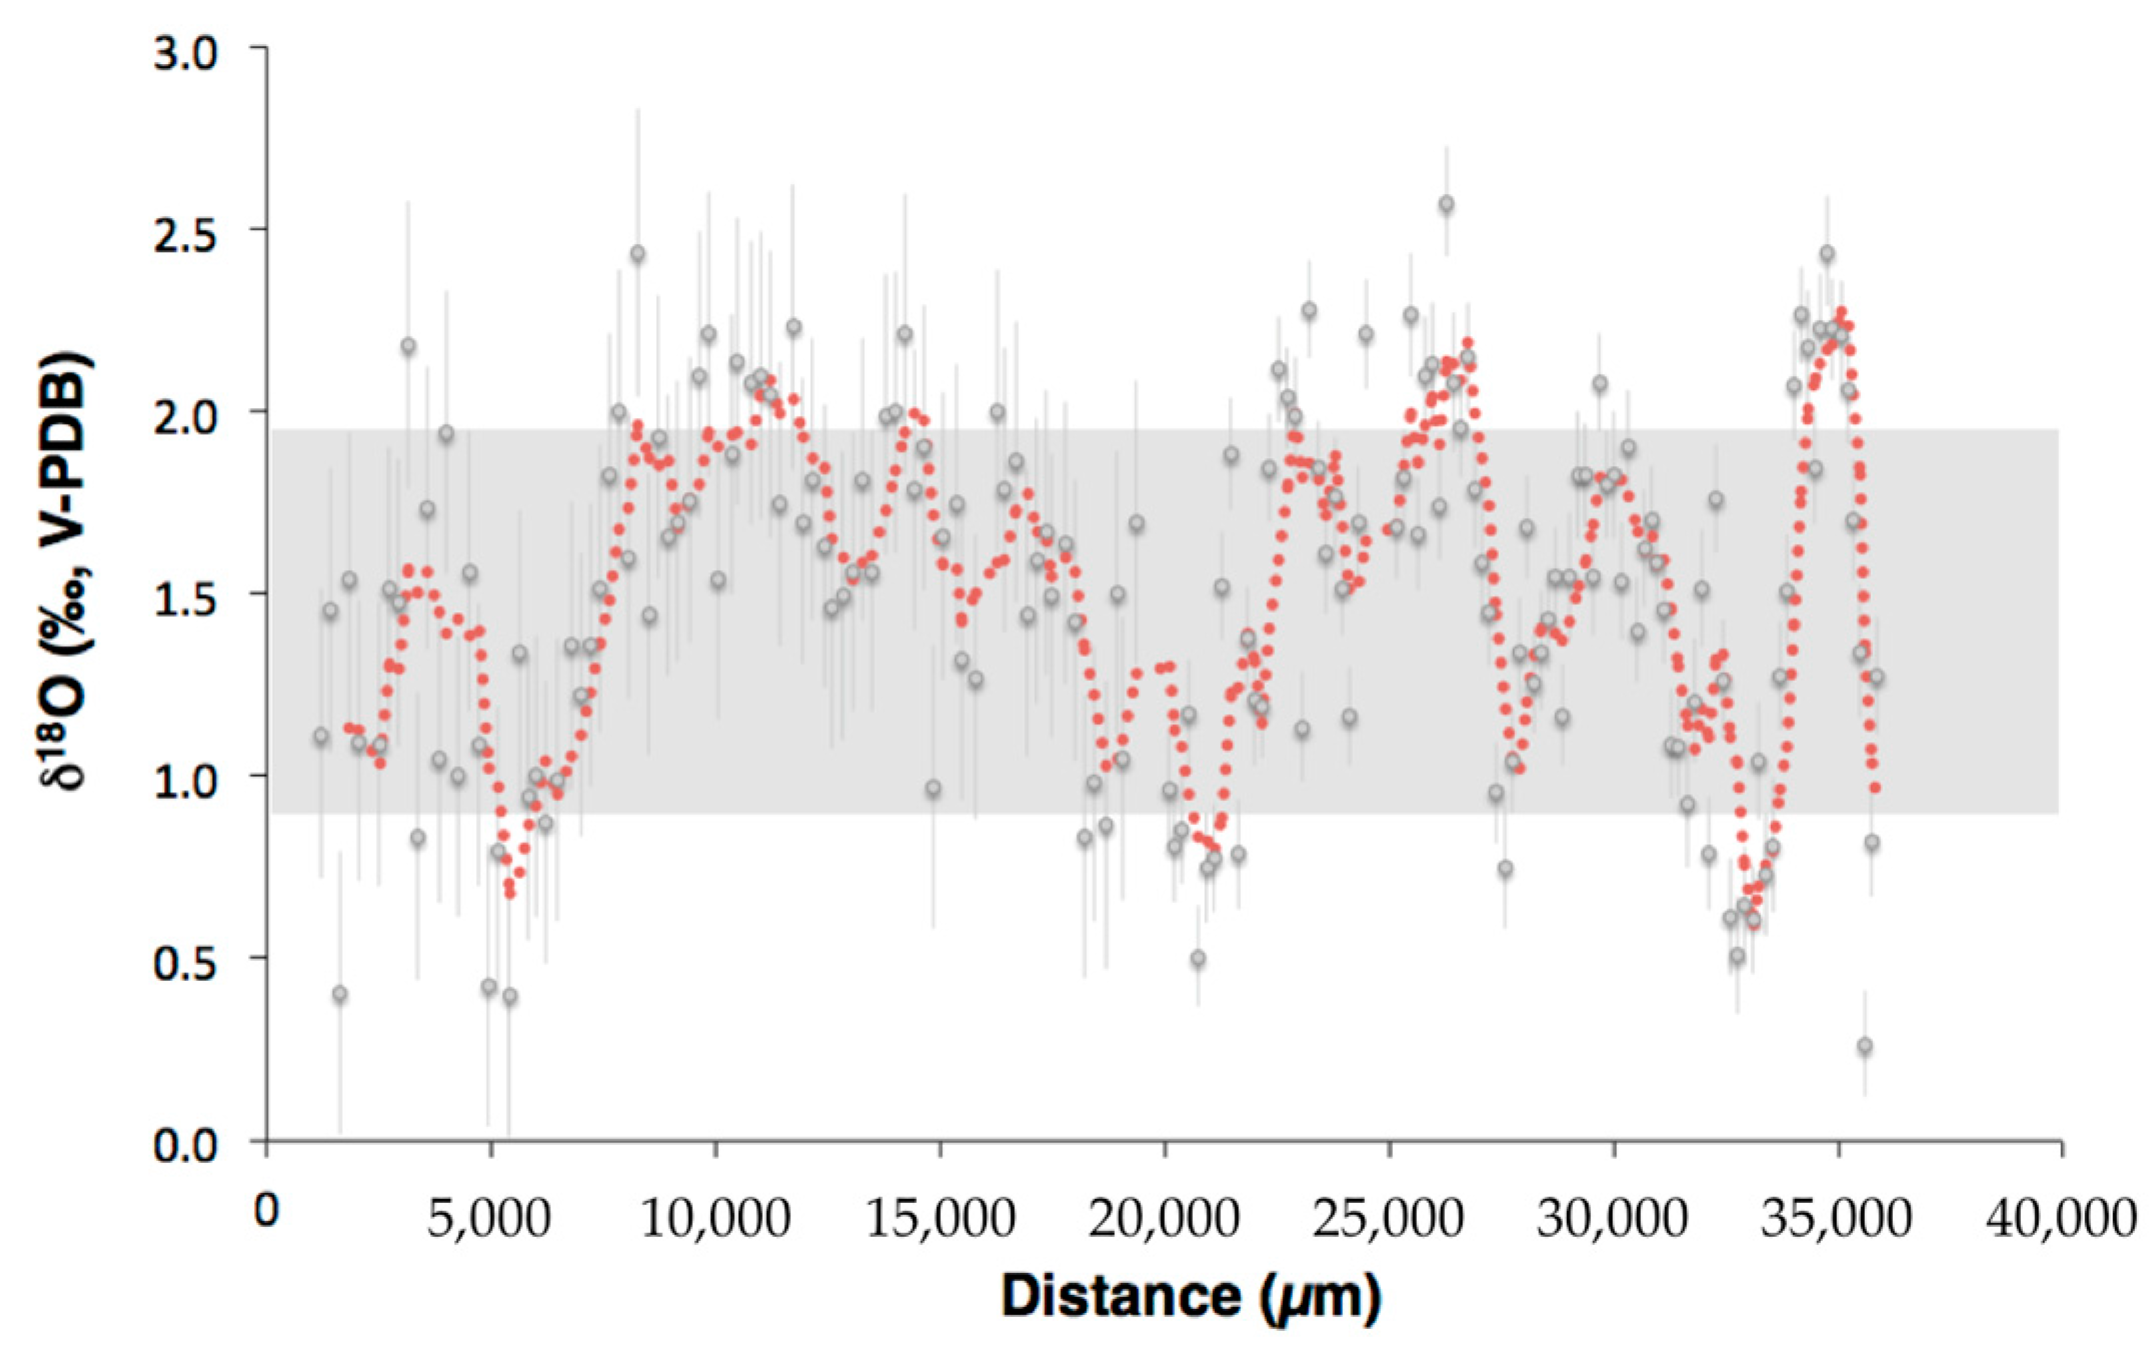
Figure 8.
δ11B profiles versus the relative distance from the coral center in Terrasses sample. Profile 1 is represented by the dark blue squares and profile 2 by the light blue squares. Error bars are ±1σ.
Figure 8.
δ11B profiles versus the relative distance from the coral center in Terrasses sample. Profile 1 is represented by the dark blue squares and profile 2 by the light blue squares. Error bars are ±1σ.

Figure 9.
Elemental ratios measured by SIMS relative to the distance (μm) from the center to the outermost part of Valpareso sample. (a) The primary y-axis represents Mg/Ca (mmol/mol) and the secondary y-axis Na/Ca (mmol/mol) and Li/Ca (μmol/mol). (b) Sr/Ca (mmol/mol) versus the distance (μm). In the two panels, the grey area stands for the range of bulk measurements (note that Li/Ca ratios were not measured in bulk). Error bars are ±2σ.
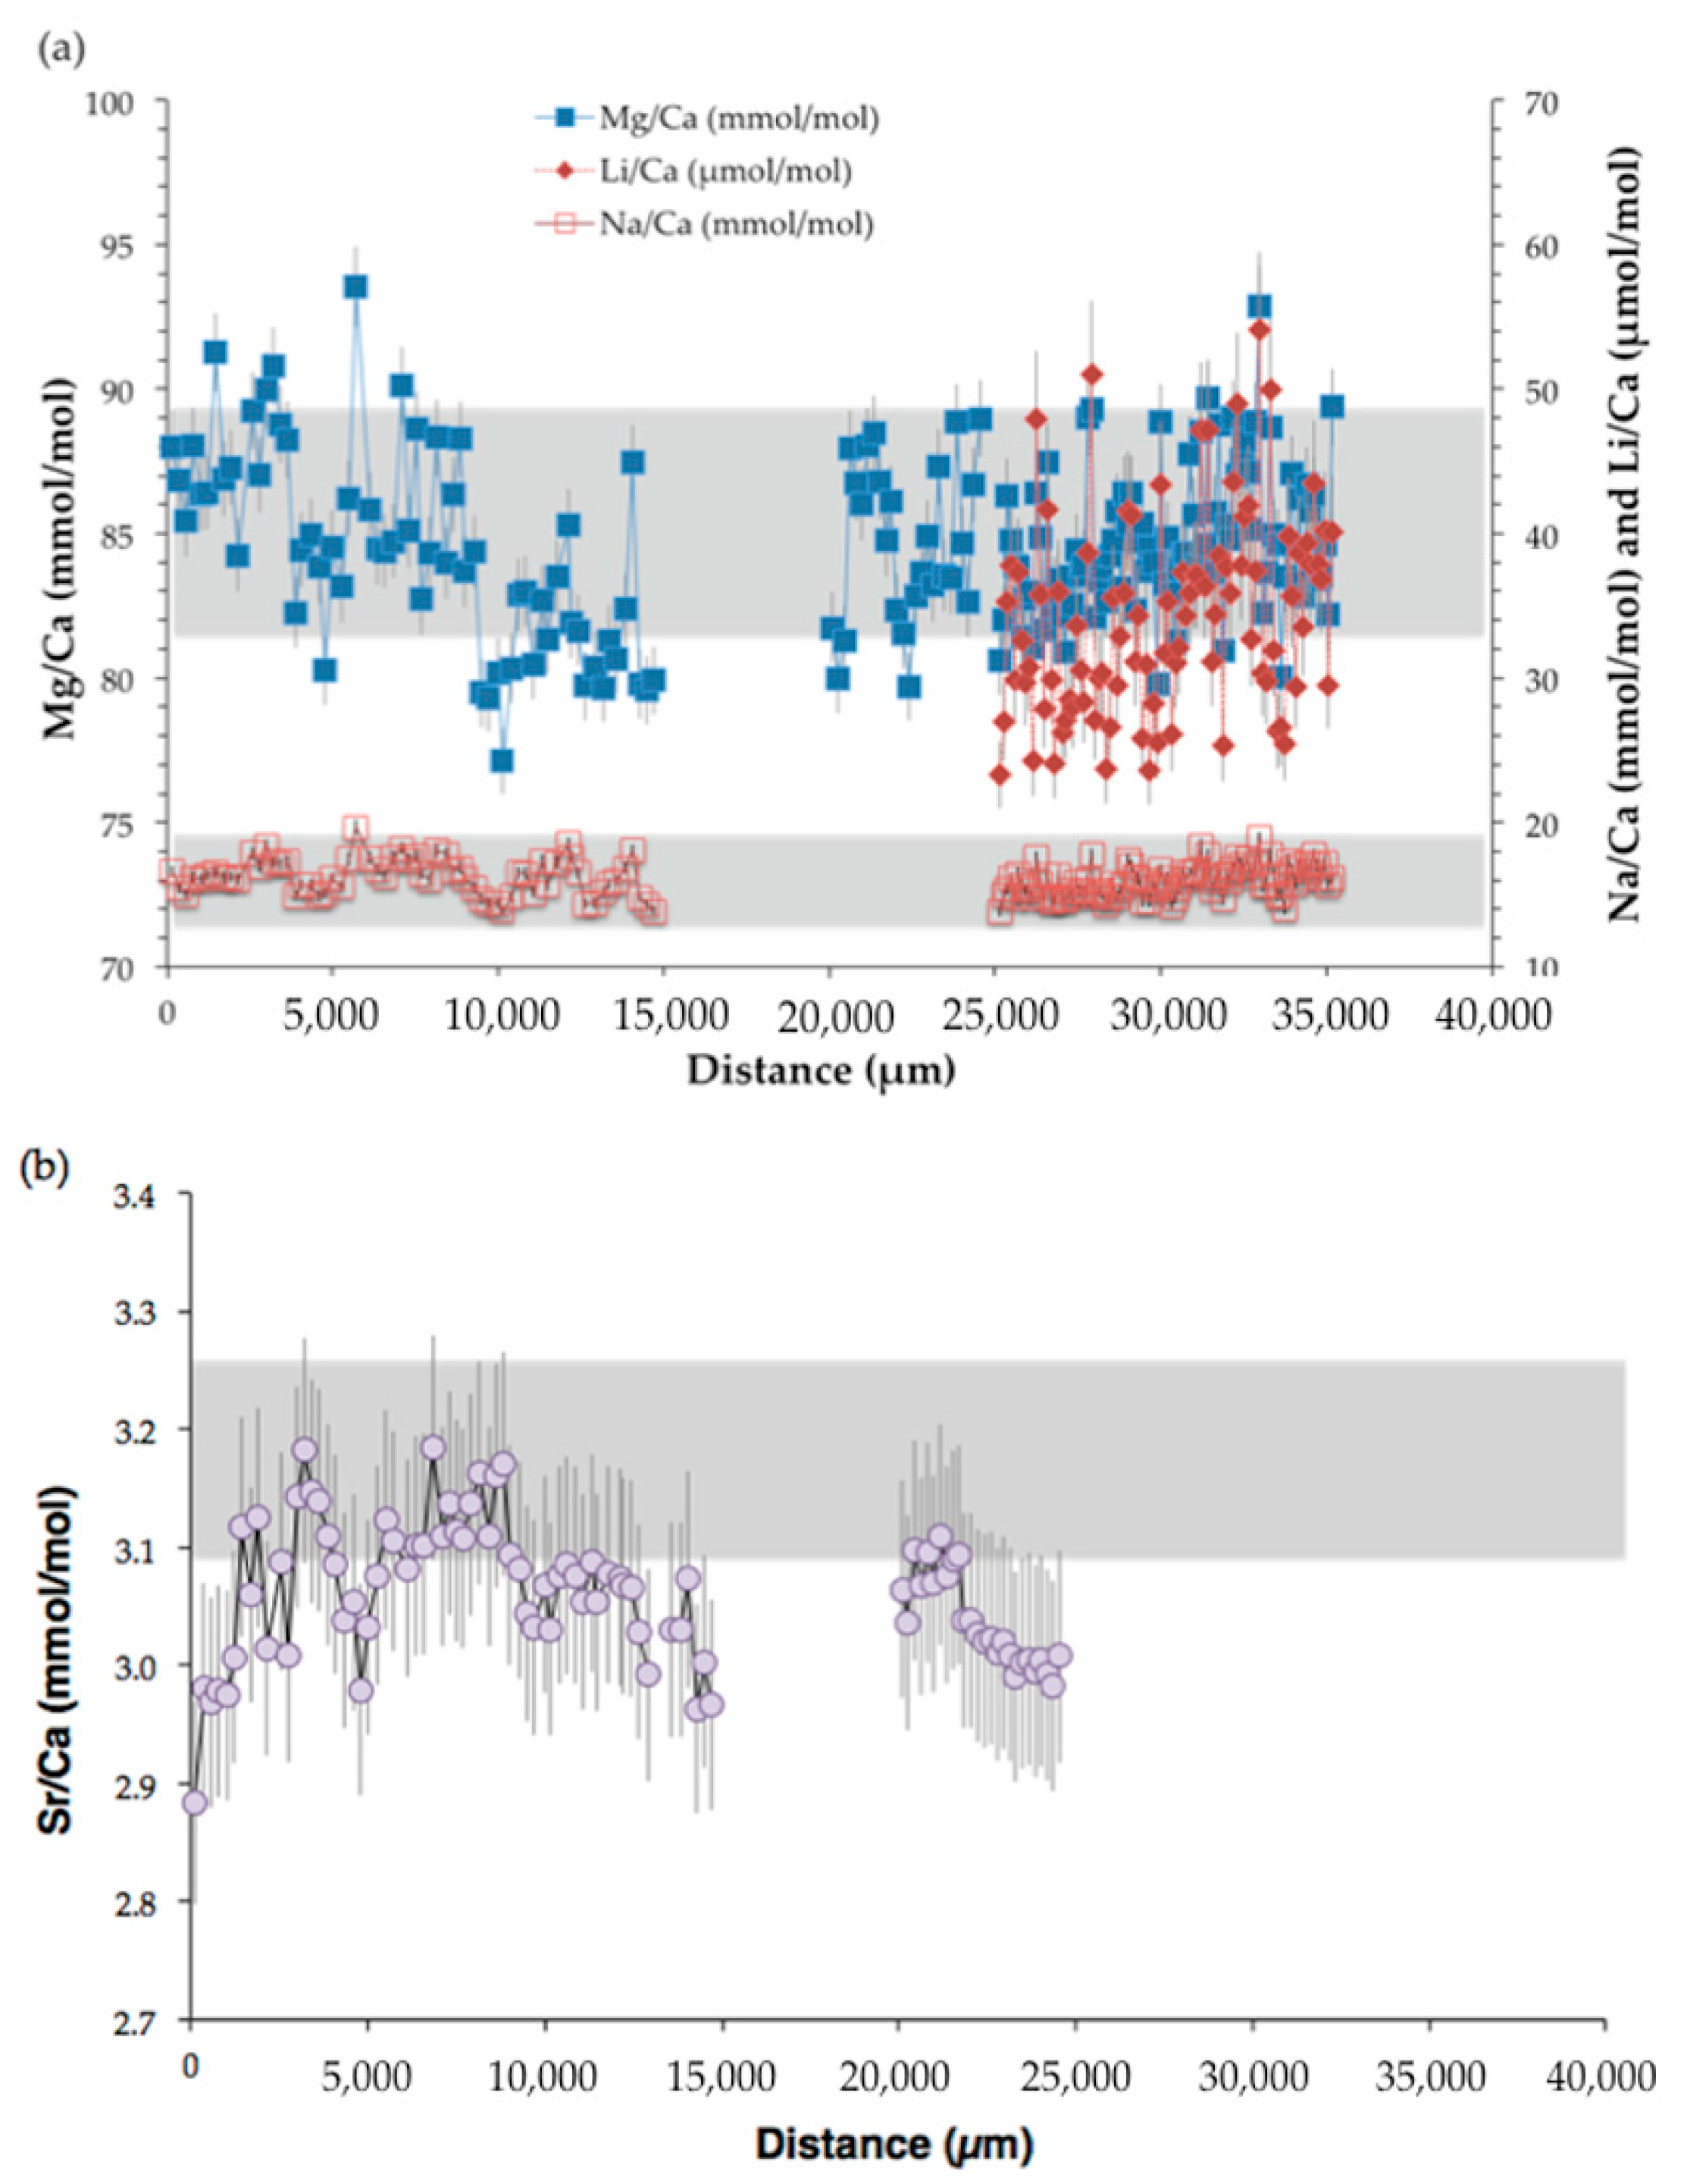
Figure 10.
Box plots of Na/Ca, Mg/Ca and Sr/Ca ratios (mmol/mol) measured in Valpareso coral sample by bulk and SIMS techniques. The lower and upper levels of boxes are at the 25th and 75th percentiles, respectively. The center horizontal line is the median value. Whiskers represent the maximum and minimum values.
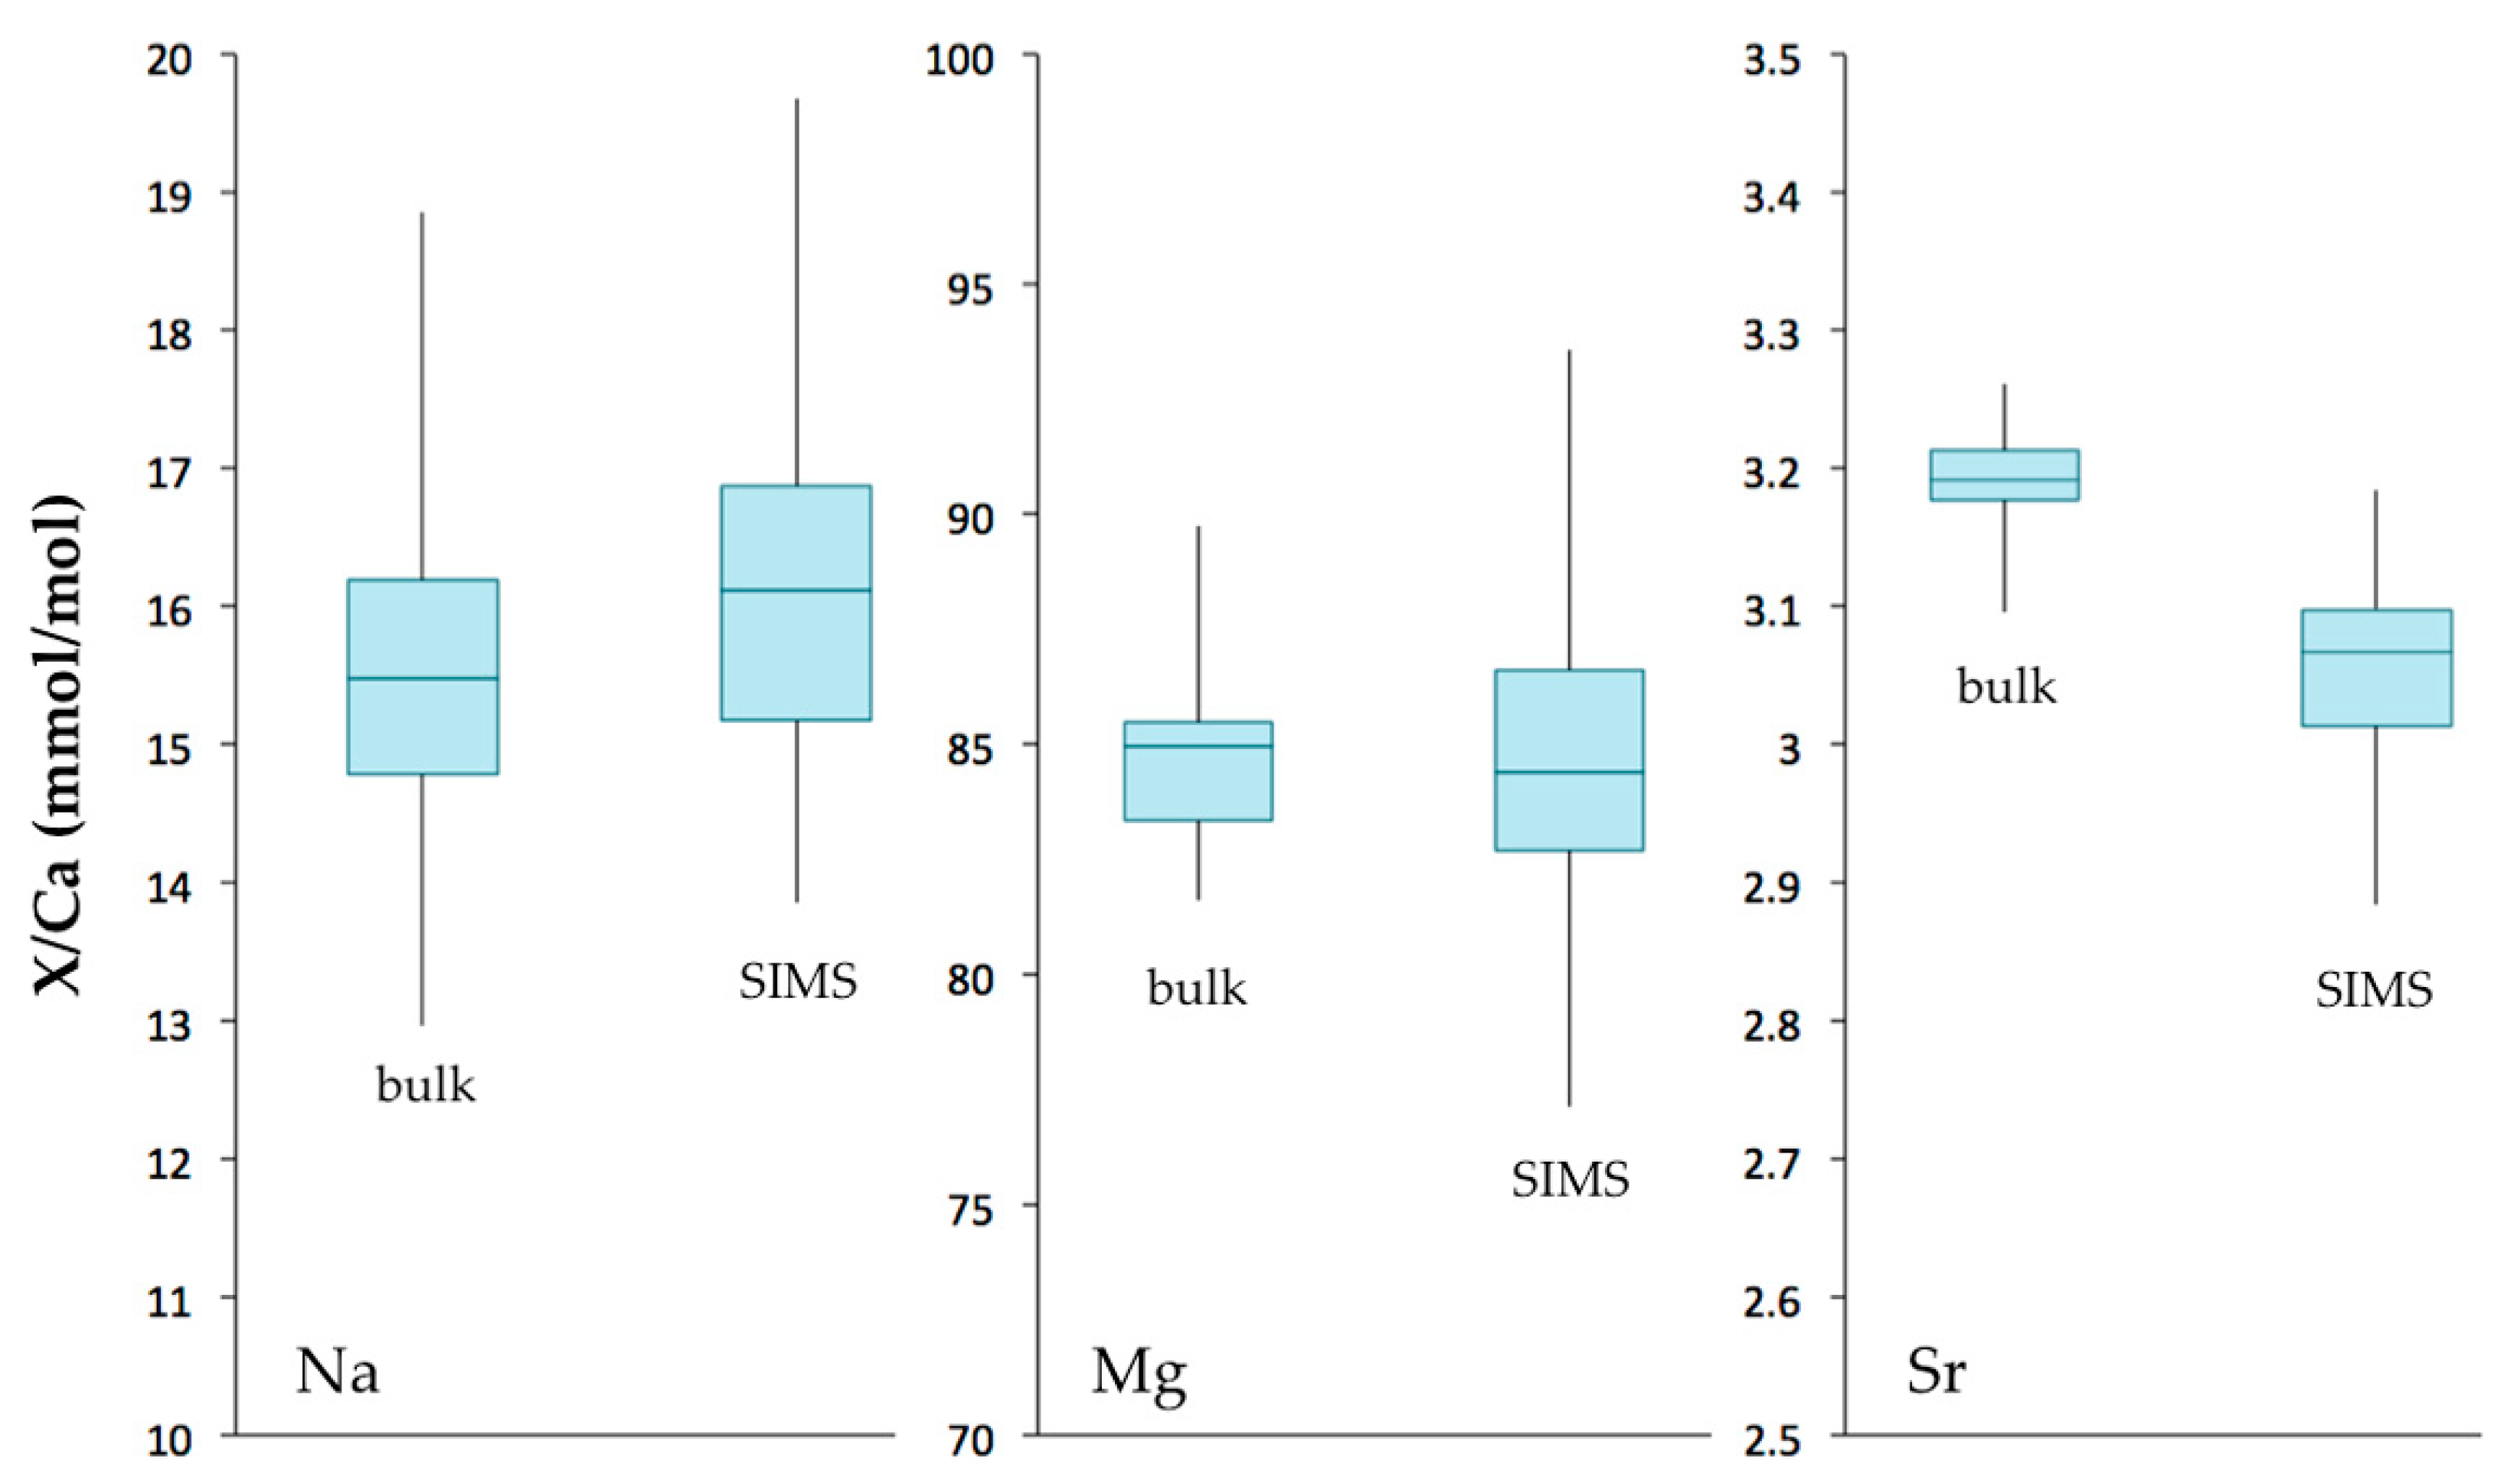
Figure 11.
Relationships between TE/Ca ratios. s represents the slope of the linear correlation: (a) Li/Ca (μmol/mol) versus Mg/Ca (mmol/mol). (b) Na/Ca (mmol/mol) versus Mg/Ca (mmol/mol). The blue squares represent the SIMS measurements and the blue diamonds the bulk data. (c) Li/Ca (μmol/mol) versus Na/Ca (mmol/mol). Error bars are ±2σ.
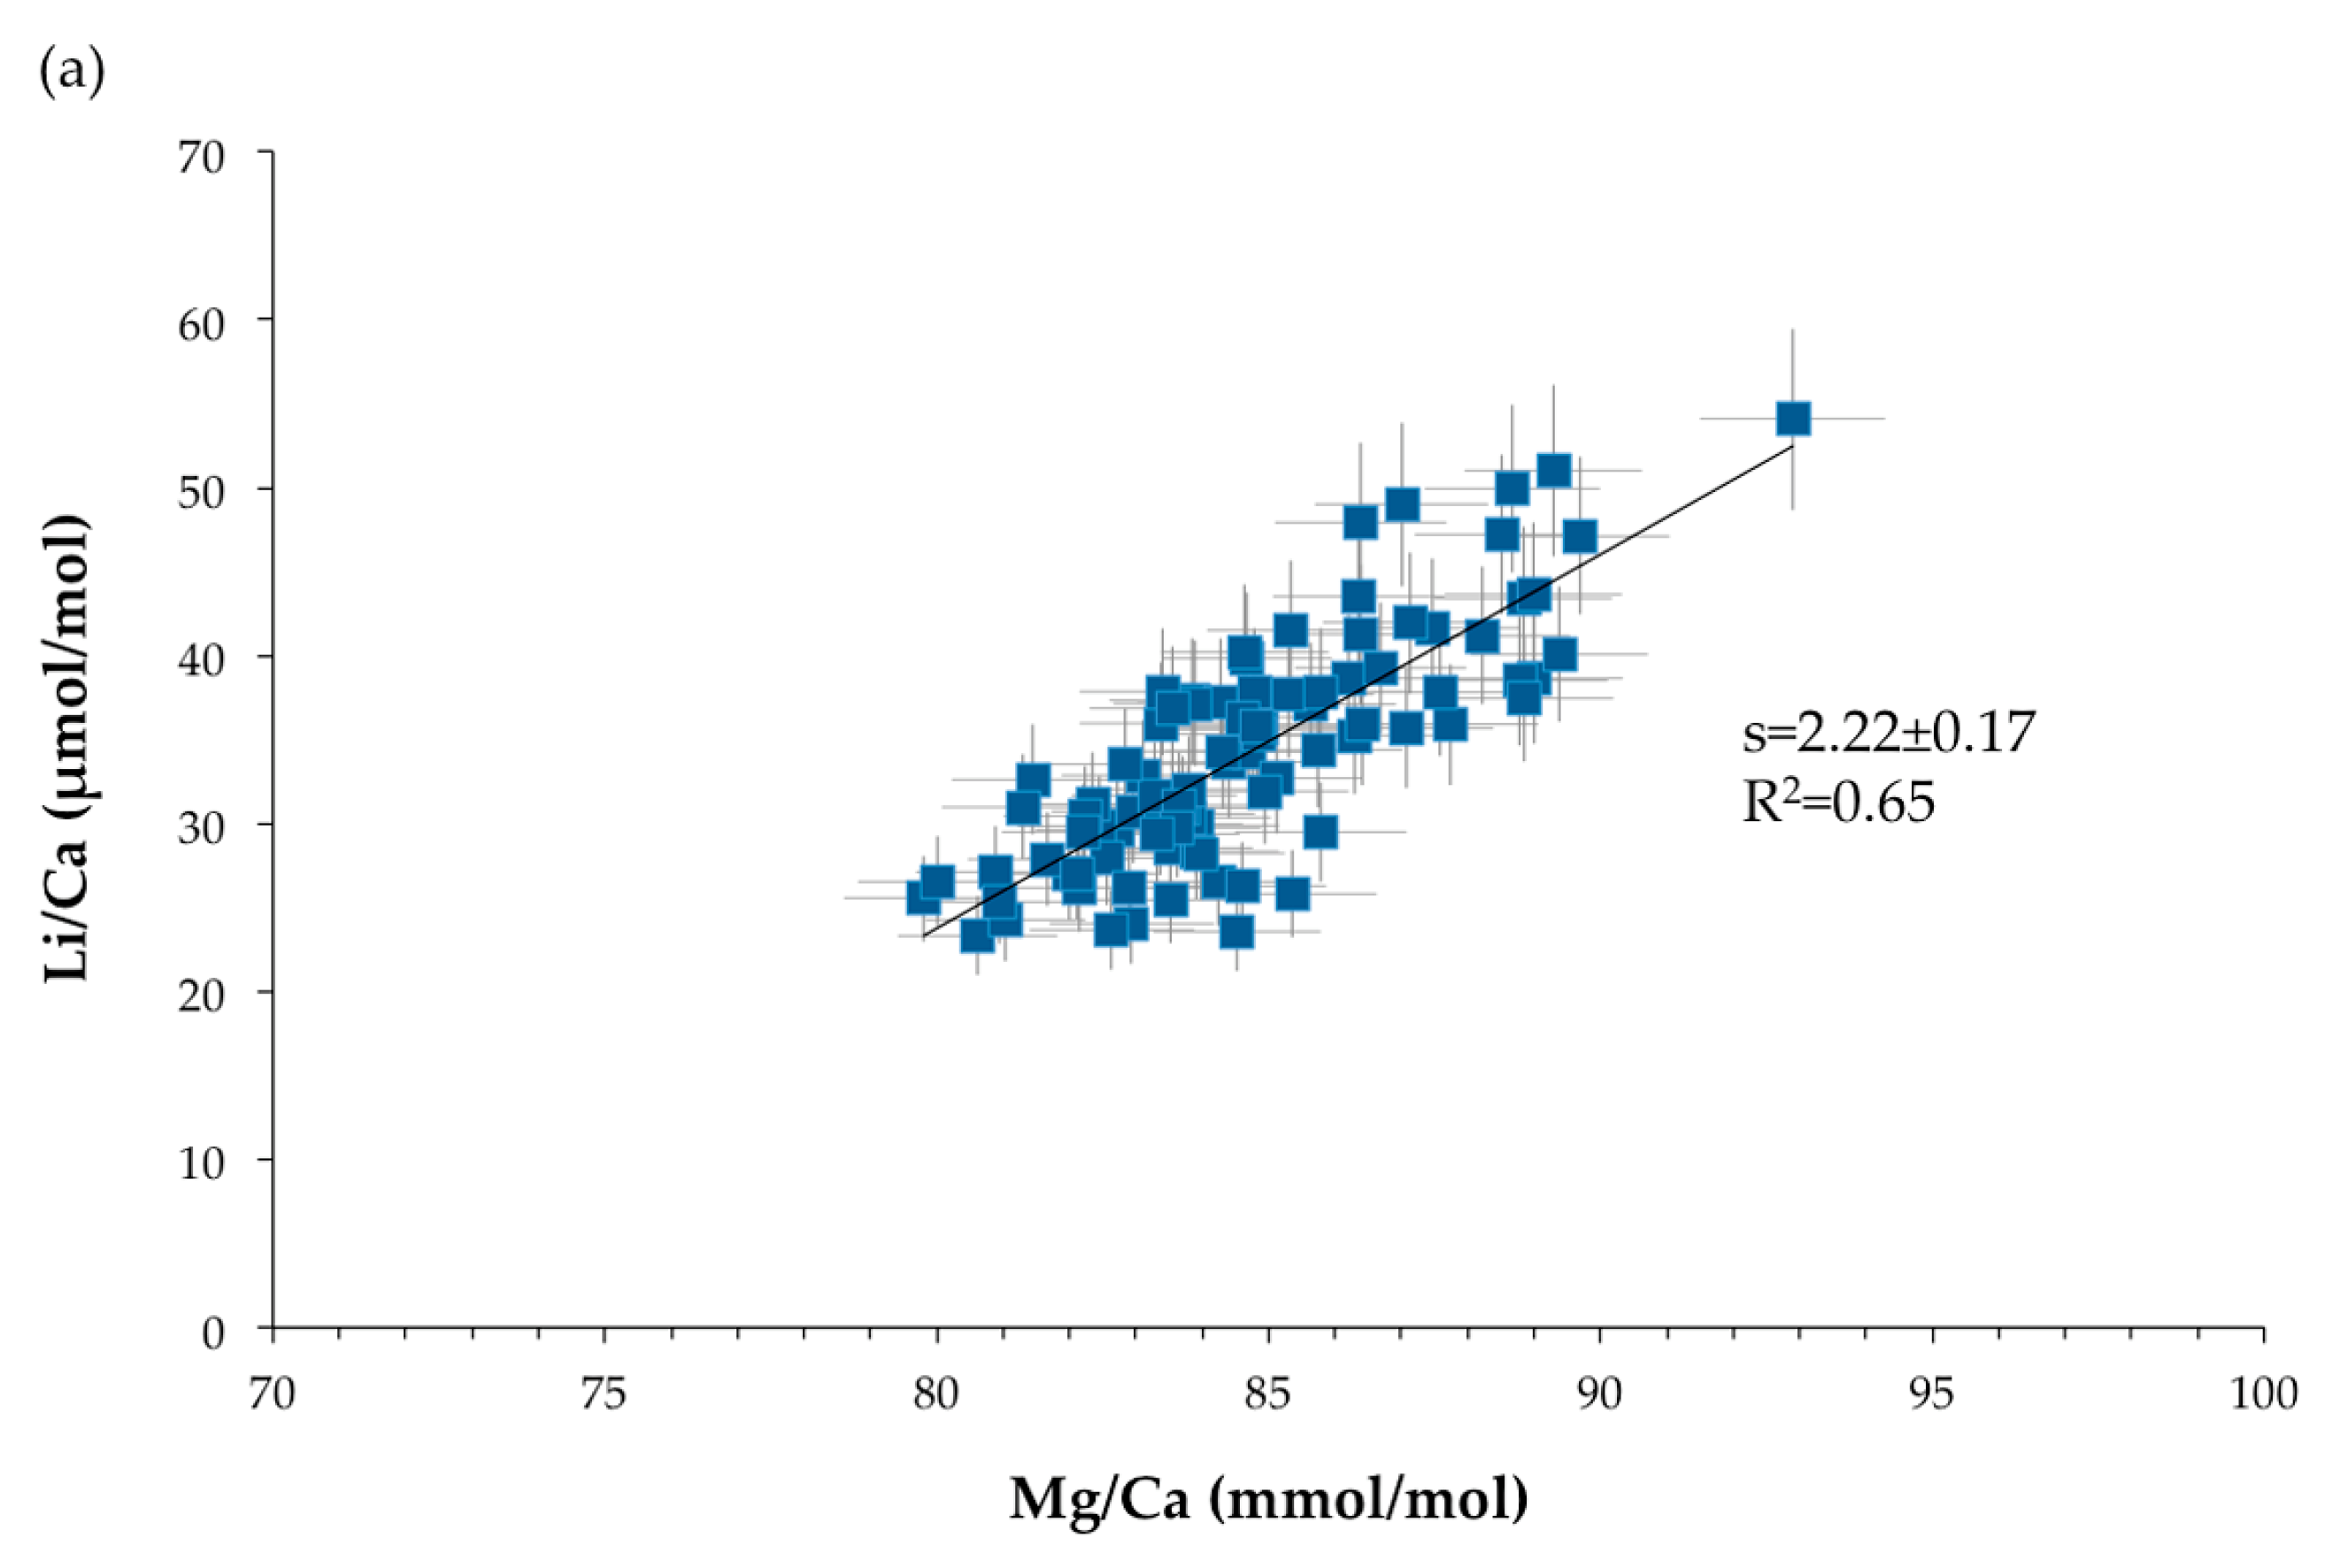

Figure 12.
The δ11B values of scleractinian and octocorallian coral as a function of seawater pH. The black line represents the boron isotopic composition of borate ion calculated with the isotopic fractionation factor of Klochko et al. [78]. The circles represent literature data for octocorallian coral [22,58,85] and squares are for data of scleractinian deep-sea corals [27,85,88]. Note that the data from [27] were corrected with a revisited value of the standard (i.e., δ11B = 17.8‰). The diamond is the average δ11B value of this study for Terrasses sample. The pH value for Terrasses sampling location is from IFREMER oceanic data (pH = 8.11 ± 0.05).

Figure 13.
Layered growth of fibers (a–d); and nano-scaled granular structure of the growth layers in DSSC and DSOC (e–g). (a) The crystal-like fibers observed on a surface fracture of a Sleractinia skeleton (Caryophyllia sp.); (b) polished and etched section showing the layered growth mode of fibers (same species); (c,d) examples of layered growth mode in the skeleton for Favia (c) and Diploria (d); (e) nanometer-scaled grains in fibers of recent Scleractinia; and (f,g) permian fossil coral ((f) Calophyllum); and Bamboo coral ((g) Isididae).


Table 1.
14C datation of Valpareso sample. BP: Before Present; AD: Anno Domini.
| Sample Ref | Sample Name | mg C | Age BP (1σ) | Age AD Calibrated (2σ) |
|---|---|---|---|---|
| Sac40169 | B1 2.50 | 1.26 | 1505 (±30) | 530–637 |
| Sac40170 | B2 9.00 | 1.24 | 1470 (±30) | 545–645 |
| Sac40171 | B3 15.50 | 1.41 | 1300 (±30) | 661–773 |
| Sac40172 | B4 21.50 | 1.36 | 1015 (±30) | 972–1047 |
| Sac40173 | B5 28.80 | 1.41 | 910 (±30) | 1034–1189 |
© 2017 by the authors. Licensee MDPI, Basel, Switzerland. This article is an open access article distributed under the terms and conditions of the Creative Commons Attribution (CC BY) license (http://creativecommons.org/licenses/by/4.0/).
Share and Cite
MDPI and ACS Style
Rollion-Bard, C.; Cuif, J.-P.; Blamart, D. Optical Observations and Geochemical Data in Deep-Sea Hexa- and Octo-Coralla Specimens. Minerals 2017, 7, 154. https://doi.org/10.3390/min7090154
AMA Style
Rollion-Bard C, Cuif J-P, Blamart D. Optical Observations and Geochemical Data in Deep-Sea Hexa- and Octo-Coralla Specimens. Minerals. 2017; 7(9):154. https://doi.org/10.3390/min7090154
Chicago/Turabian StyleRollion-Bard, Claire, Jean-Pierre Cuif, and Dominique Blamart. 2017. "Optical Observations and Geochemical Data in Deep-Sea Hexa- and Octo-Coralla Specimens" Minerals 7, no. 9: 154. https://doi.org/10.3390/min7090154
Note that from the first issue of 2016, this journal uses article numbers instead of page numbers. See further details here.