Article

Experimental Investigation of Biotite-Rich Schist Reacting with B-Bearing Fluids at Upper Crustal Conditions and Correlated Tourmaline Formation

by
Andrea Orlando
1,*,
Giovanni Ruggieri
1,
Laura Chiarantini
1,2,
Giordano Montegrossi
1 and
Valentina Rimondi
1,2
1
Istituto di Geoscienze e Georisorse–CNR, U.O.S. di Firenze, 50121 Firenze, Italy
2
Dipartimento di Scienze della Terra, Università degli Studi di Firenze, 50121 Firenze, Italy
*
Author to whom correspondence should be addressed.
Minerals 2017, 7(9), 155; https://doi.org/10.3390/min7090155
Submission received: 16 June 2017 / Revised: 25 July 2017 / Accepted: 22 August 2017 / Published: 28 August 2017
(This article belongs to the Special Issue High Pressure Minerals)

Abstract

:
Fluid–rock interaction experiments between a biotite-rich schist (from Mt. Calamita Formation, Elba Island, Italy) and B-bearing aqueous fluids were carried out at 500–600 °C and 100–130 MPa. The experiments have been carried out in order to reproduce the reaction, which would have produced tourmalinisation of the biotite schist, supposedly by circulation of magmatic fluids issued from leucogranitic dykes. The reacting fluids were either NaCl-free or NaCl-bearing (20 wt %) aqueous solutions, with variable concentration of H3BO3 (0.01–3.2 M). The experimental results show that tourmaline (belonging to the alkali group) crystallise under high-temperature and upper crustal conditions (500–600 °C, 100–130 MPa) when H3BO3 concentration in the system is greater than 1.6 M. The composition of tourmaline is either dravitic (Mg-rich) or schorlitic (Fe-rich), depending if an NaCl-bearing or NaCl-free aqueous solution is used. In the first case, a significant amount of Fe released from biotite dissolution remains in the Cl-rich solution resulting from the experiment. By contrast, when pure water is used, Na/K exchange in feldspars makes Na available for tourmaline crystallisation. The high concentration of Fe in the residual fluid has an important metallogenic implication because it indicates that the interaction between the saline B-rich fluid of magmatic derivation and biotite-rich schists, besides producing tourmalinisation, is capable of mobilising significant amounts of Fe. This process could have produced, in part or totally, the Fe deposits located close to the quartz–tourmaline veins and metasomatic bodies of the Mt. Calamita Formation. Moreover, the super-hot reservoir that likely occurs in the deepest part of the Larderello–Travale geothermal field would also be the site of an extensive reaction between the B-rich fluid and biotite-bearing rocks producing tourmaline. Thus, tourmaline occurrence can be a useful guide during deep drilling toward a super-hot reservoir.

1. Introduction

Tourmaline is a common accessory mineral in granitoids, mainly in peraluminous leucogranites, in related pegmatites, and in hydrothermal quartz vein and breccia systems that frequently develop around granitoids [1,2,3,4,5,6]. Tourmaline crystallises either as a magmatic mineral, or during the magmatic/hydrothermal transition and as a late post-magmatic hydrothermal mineral. During the crystallisation of peraluminous melts, Fe and Mg are initially incorporated in phases such as biotite and cordierite, whereas B increases in the residual magma [7]. When tourmaline saturation is reached, B-rich residual melts eventually react with earlier Fe-Mg phases, causing tourmaline formation. However, a significant amount of B originally present in magma can be released to wall rocks. The reaction of the B-rich magmatic derived fluid with the wall rocks will lead to the precipitation of tourmaline (or axinite, danburite, etc.) [7].
This process likely occurred in the metamorphic Mt. Calamita Formation (Complex I), in southeastern Elba Island (Italy) (Figure 1), in which metasomatic tourmaline bodies, quartz–tourmaline (showing extensive zonation) veins and tourmaline-bearing leucogranitic dykes are widespread [8].
In particular, tourmaline deposition in the Mt. Calamita Formation was interpreted as a result of the interaction of B-rich fluids issued from the leucogranitic dykes with biotite-rich layers in the hornfels occurring in the Mt. Calamita Formation [8]. In this study, fluid–rock interaction experiments were performed to verify the metasomatic reaction between B-bearing fluids and the biotite-rich layers of the Mt. Calamita Formation. The experiments were performed by reacting a saline (H2O + NaCl), B-bearing fluid with a typical biotite-rich schist, taking into account the characteristics (i.e., relatively high salinity and high temperature) of the fluid inclusions examined in quartz–tourmaline veins of the Mt. Calamita Formation by [11,12]. The experiments were performed at different H3BO3 concentrations that comprise the H3BO3 concentration found [13] in fluid inclusions trapped in tourmalines of aplite–pegmatite dykes associated with the Mt. Capanne Pluton, western Elba Island.
Tourmalines are also outstanding indicators of the physical and chemical conditions of their host environment ([3,14,15,16] and references therein) and their common zonation [13] may be a record of an evolving fluid system. Thus, in order to ascertain the changes of tourmaline composition due to the presence/absence of NaCl in the reacting fluid, some experiments were also performed using a B-bearing aqueous fluid without NaCl. In addition, analyses of fluids recovered at the end of some experiments were carried out in order to track fluid chemistry after interaction.
The implications of the experimental results on the metallogeny of eastern Elba iron deposits and on the understanding of deep-seated very high-temperature geothermal reservoir imaged by geophysics in Larderello–Travale geothermal field will also be presented. In fact, the B-metasomatic hydrothermal system in the eastern Elba Island system is considered a proxy of the high-temperature system currently active in the deep portion of the Larderello–Travale geothermal field [8,17]. Thus, the investigation on tourmaline formation as a consequence of fluid–rock interactions may contribute to the understanding of processes that likely occur in deep-seated unconventional geothermal reservoirs, which are a major challenge in the future exploitation of geothermal energy.

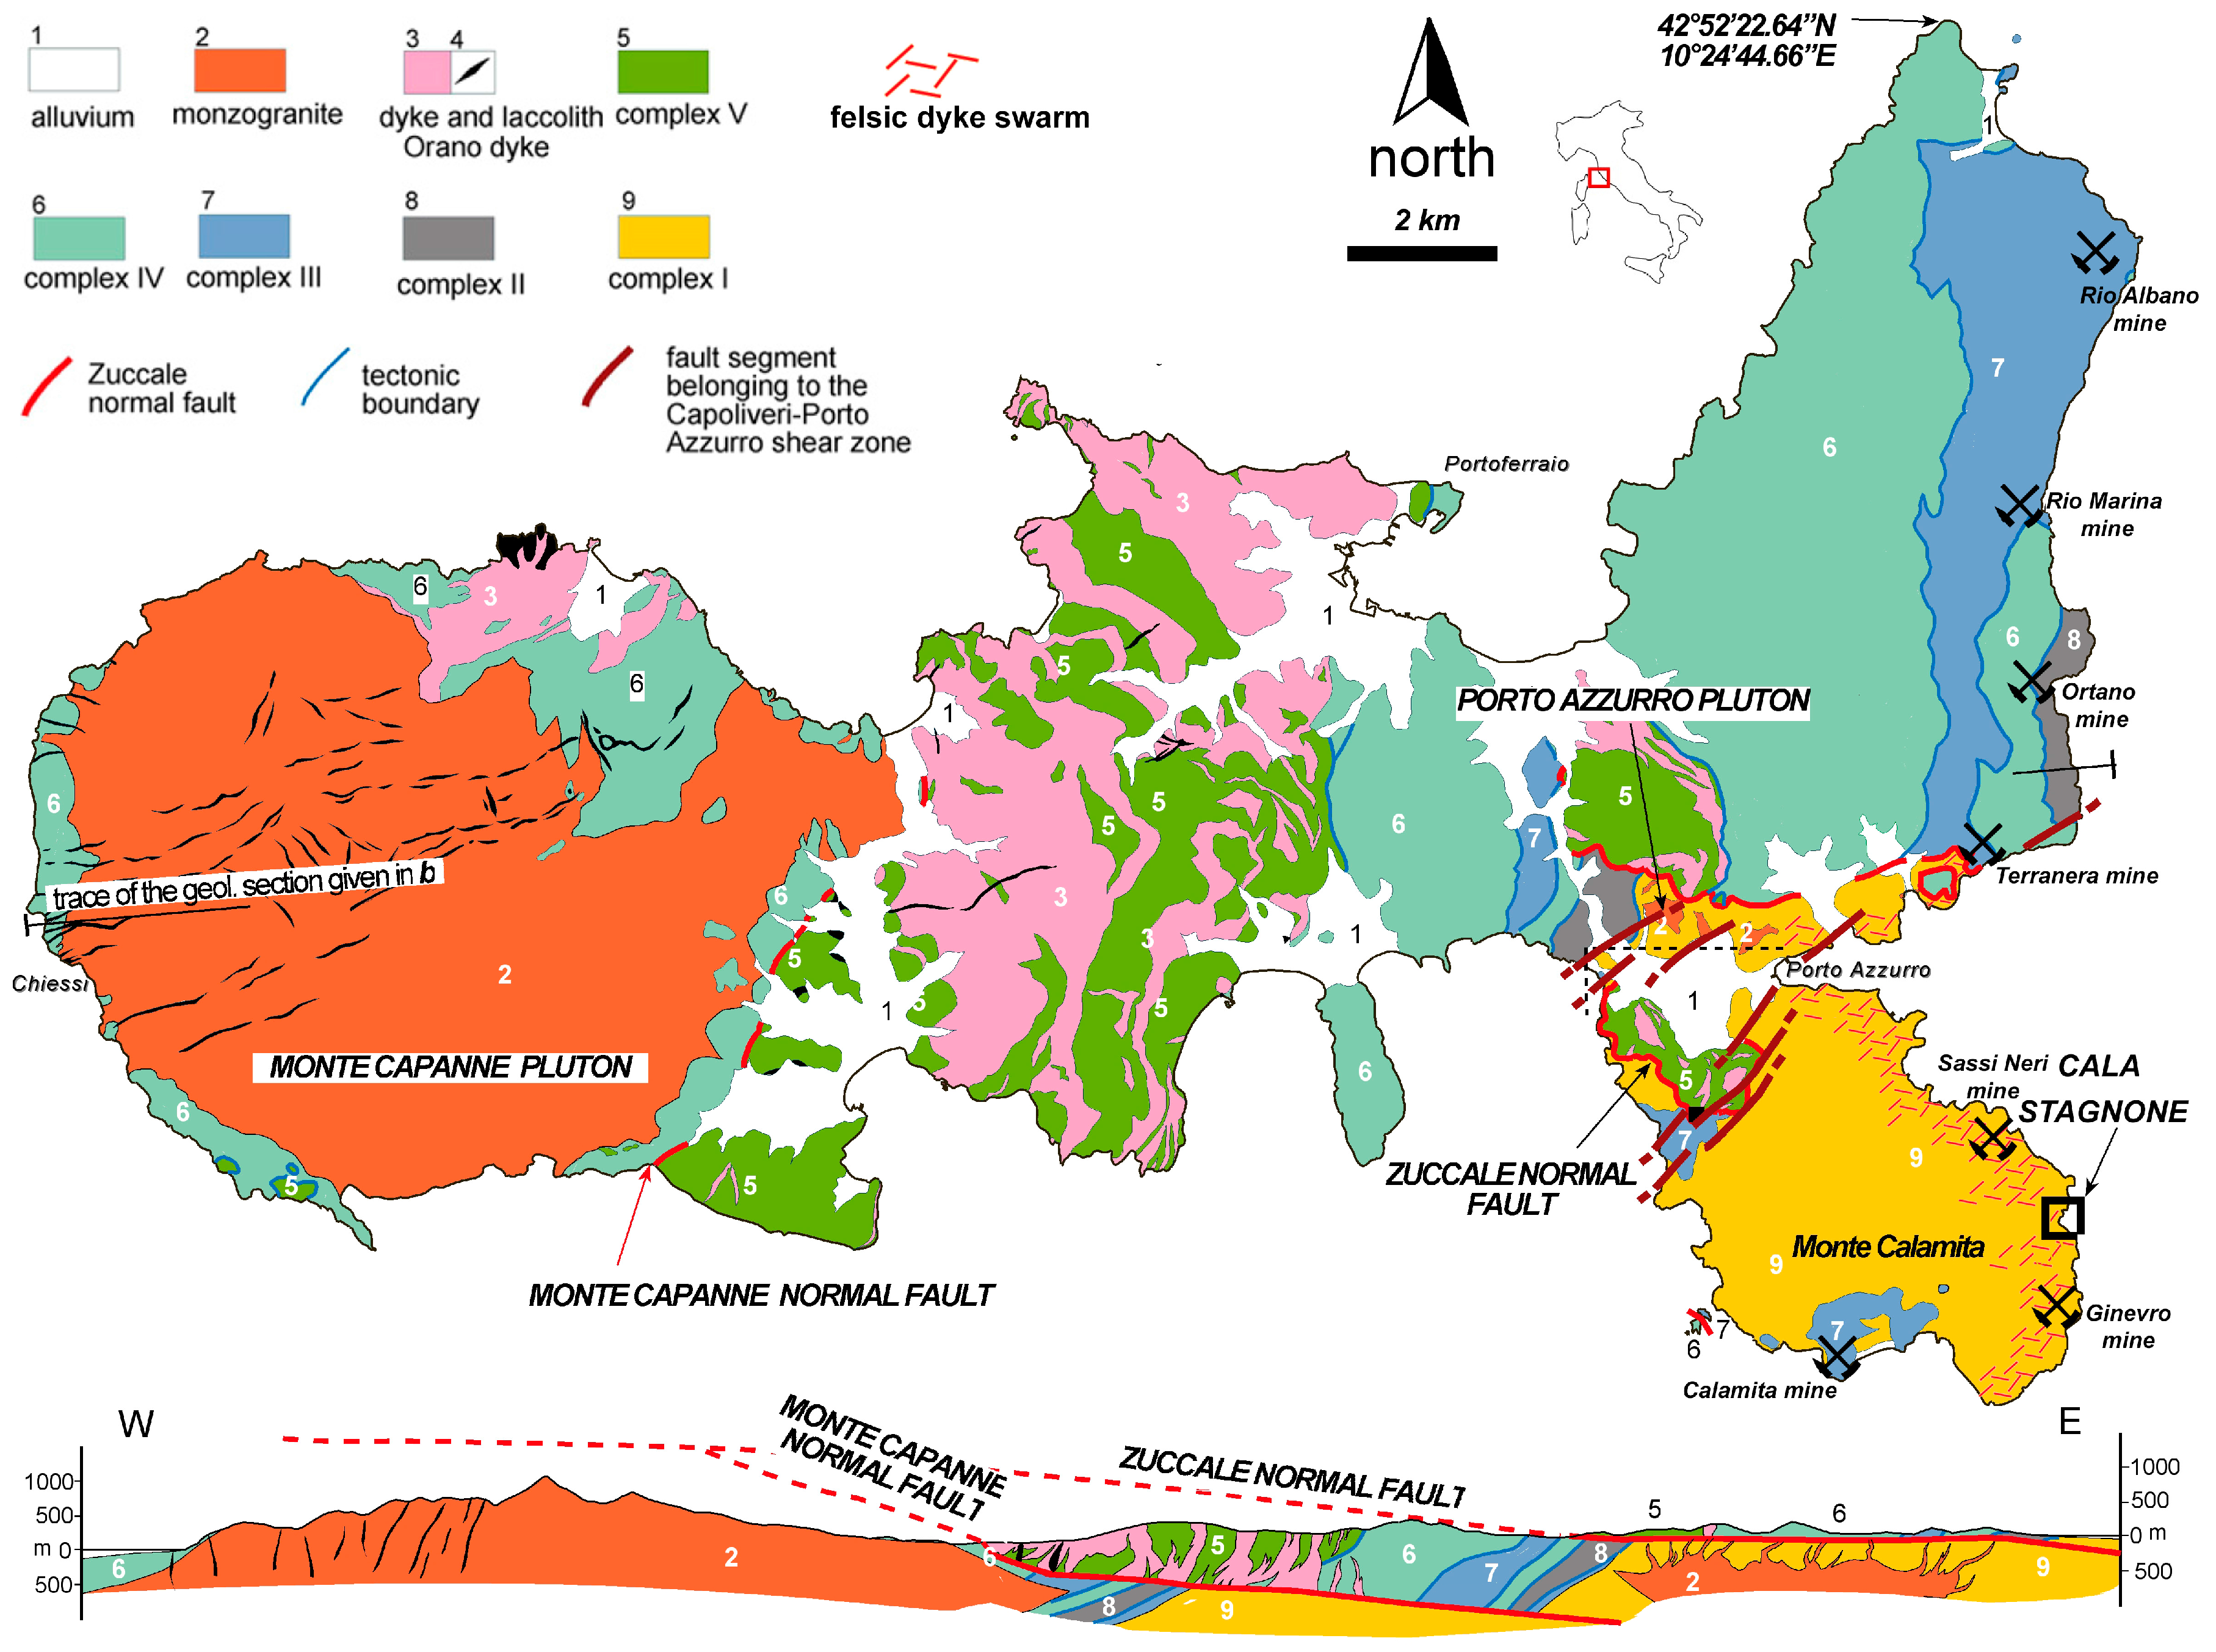
2. Geological Sketch and Iron Deposits of Southeastern Elba Island

The Mt. Calamita Formation (Complex I in Figure 1), forming a large part of the Calamita peninsula (southeastern Elba Island), consists of medium- and high-grade pelitic–psammitic hornfelses along with minor interlayered amphibolite bodies, overlain by medium-grade contact metamorphic marble (Calanchiole Marble) [8,18,19].
The Mt. Calamita Formation was affected by contact metamorphism related to the emplacement of the Porto Azzurro pluton (5.9–6.2 Ma) [20,21] and the related network of leucogranitic sills and dykes. The pluton, which forms small outcrops north of the Mt. Calamita promontory (Figure 1), is a slightly peraluminous monzogranite belonging to the Tuscan Magmatic Province [22,23].
The contact aureole (6.2 Ma) [20] affecting the Mt. Calamita Formation consists of medium- to high-grade hornfels with biotite + muscovite + andalusite + cordierite + K feldspar + wollastonite mineral assemblages [19,24]. Temperatures attained during contact metamorphism of the Porto Azzurro pluton in eastern Elba range from 300 °C (biotite zone) to 650 °C (andalusite, K feldspar and wollastonite zones), with a maximum pressure of 240 MPa (at 600 °C), or 200 MPa (at 650 °C) [24,25]. Metamorphic grade increases eastward across the Mt. Calamita promontory; the highest-grade hornfelses crop out in the easternmost part, where leucogranitic dykes, tourmaline–quartz veins and metasomatic bodies reach the maximum frequency [8,18,19,26].
The well-known iron deposits of Elba Island are located along the eastern coast of Elba, describing a narrow N–S belt from Mt. Calendonzio (Rio Albano) to the Mt. Calamita promontory [27]. In particular, three deposits occur at the Mt. Calamita promontory: Sassi Neri, Ginevro, and Capo Calamita (Figure 1). The first two deposits consist of massive/disseminated magnetite ore, associated to ferropargasite (±hedenbergite, epidote, ilvaite and actinolite) skarn [27]. On the other hand, the Capo Calamita deposits, characterised by a magnetite + hematite ± Fe-Cu sulphide disseminated/massive ore associated to hedenbergite–ilvaite (±andradite and epidote) skarn are hosted by carbonate formations (Calanchiole Marble [18]).
Different explanations were proposed for the metallogenys of Elba Island iron deposits, concerning in particular the role of the Porto Azzurro monzogranite. Early theories suggested an exclusively epigenetic origin, with a direct derivation of the mineralizing elements and fluids from the Porto Azzurro pluton [28,29]. Later [30] suggested that Fe (and other elements such as Mg, Mn and K) could have been produced as a consequence of the reaction between saline fluids, coming from the rocks hosting the intrusion (i.e., connate or metamorphic waters), and biotite-rich xenoliths embedded in the granite pluton. A syngenetic origin in a volcano-sedimentary environment with a later, syn-magmatic remobilisation was proposed by [31,32,33].

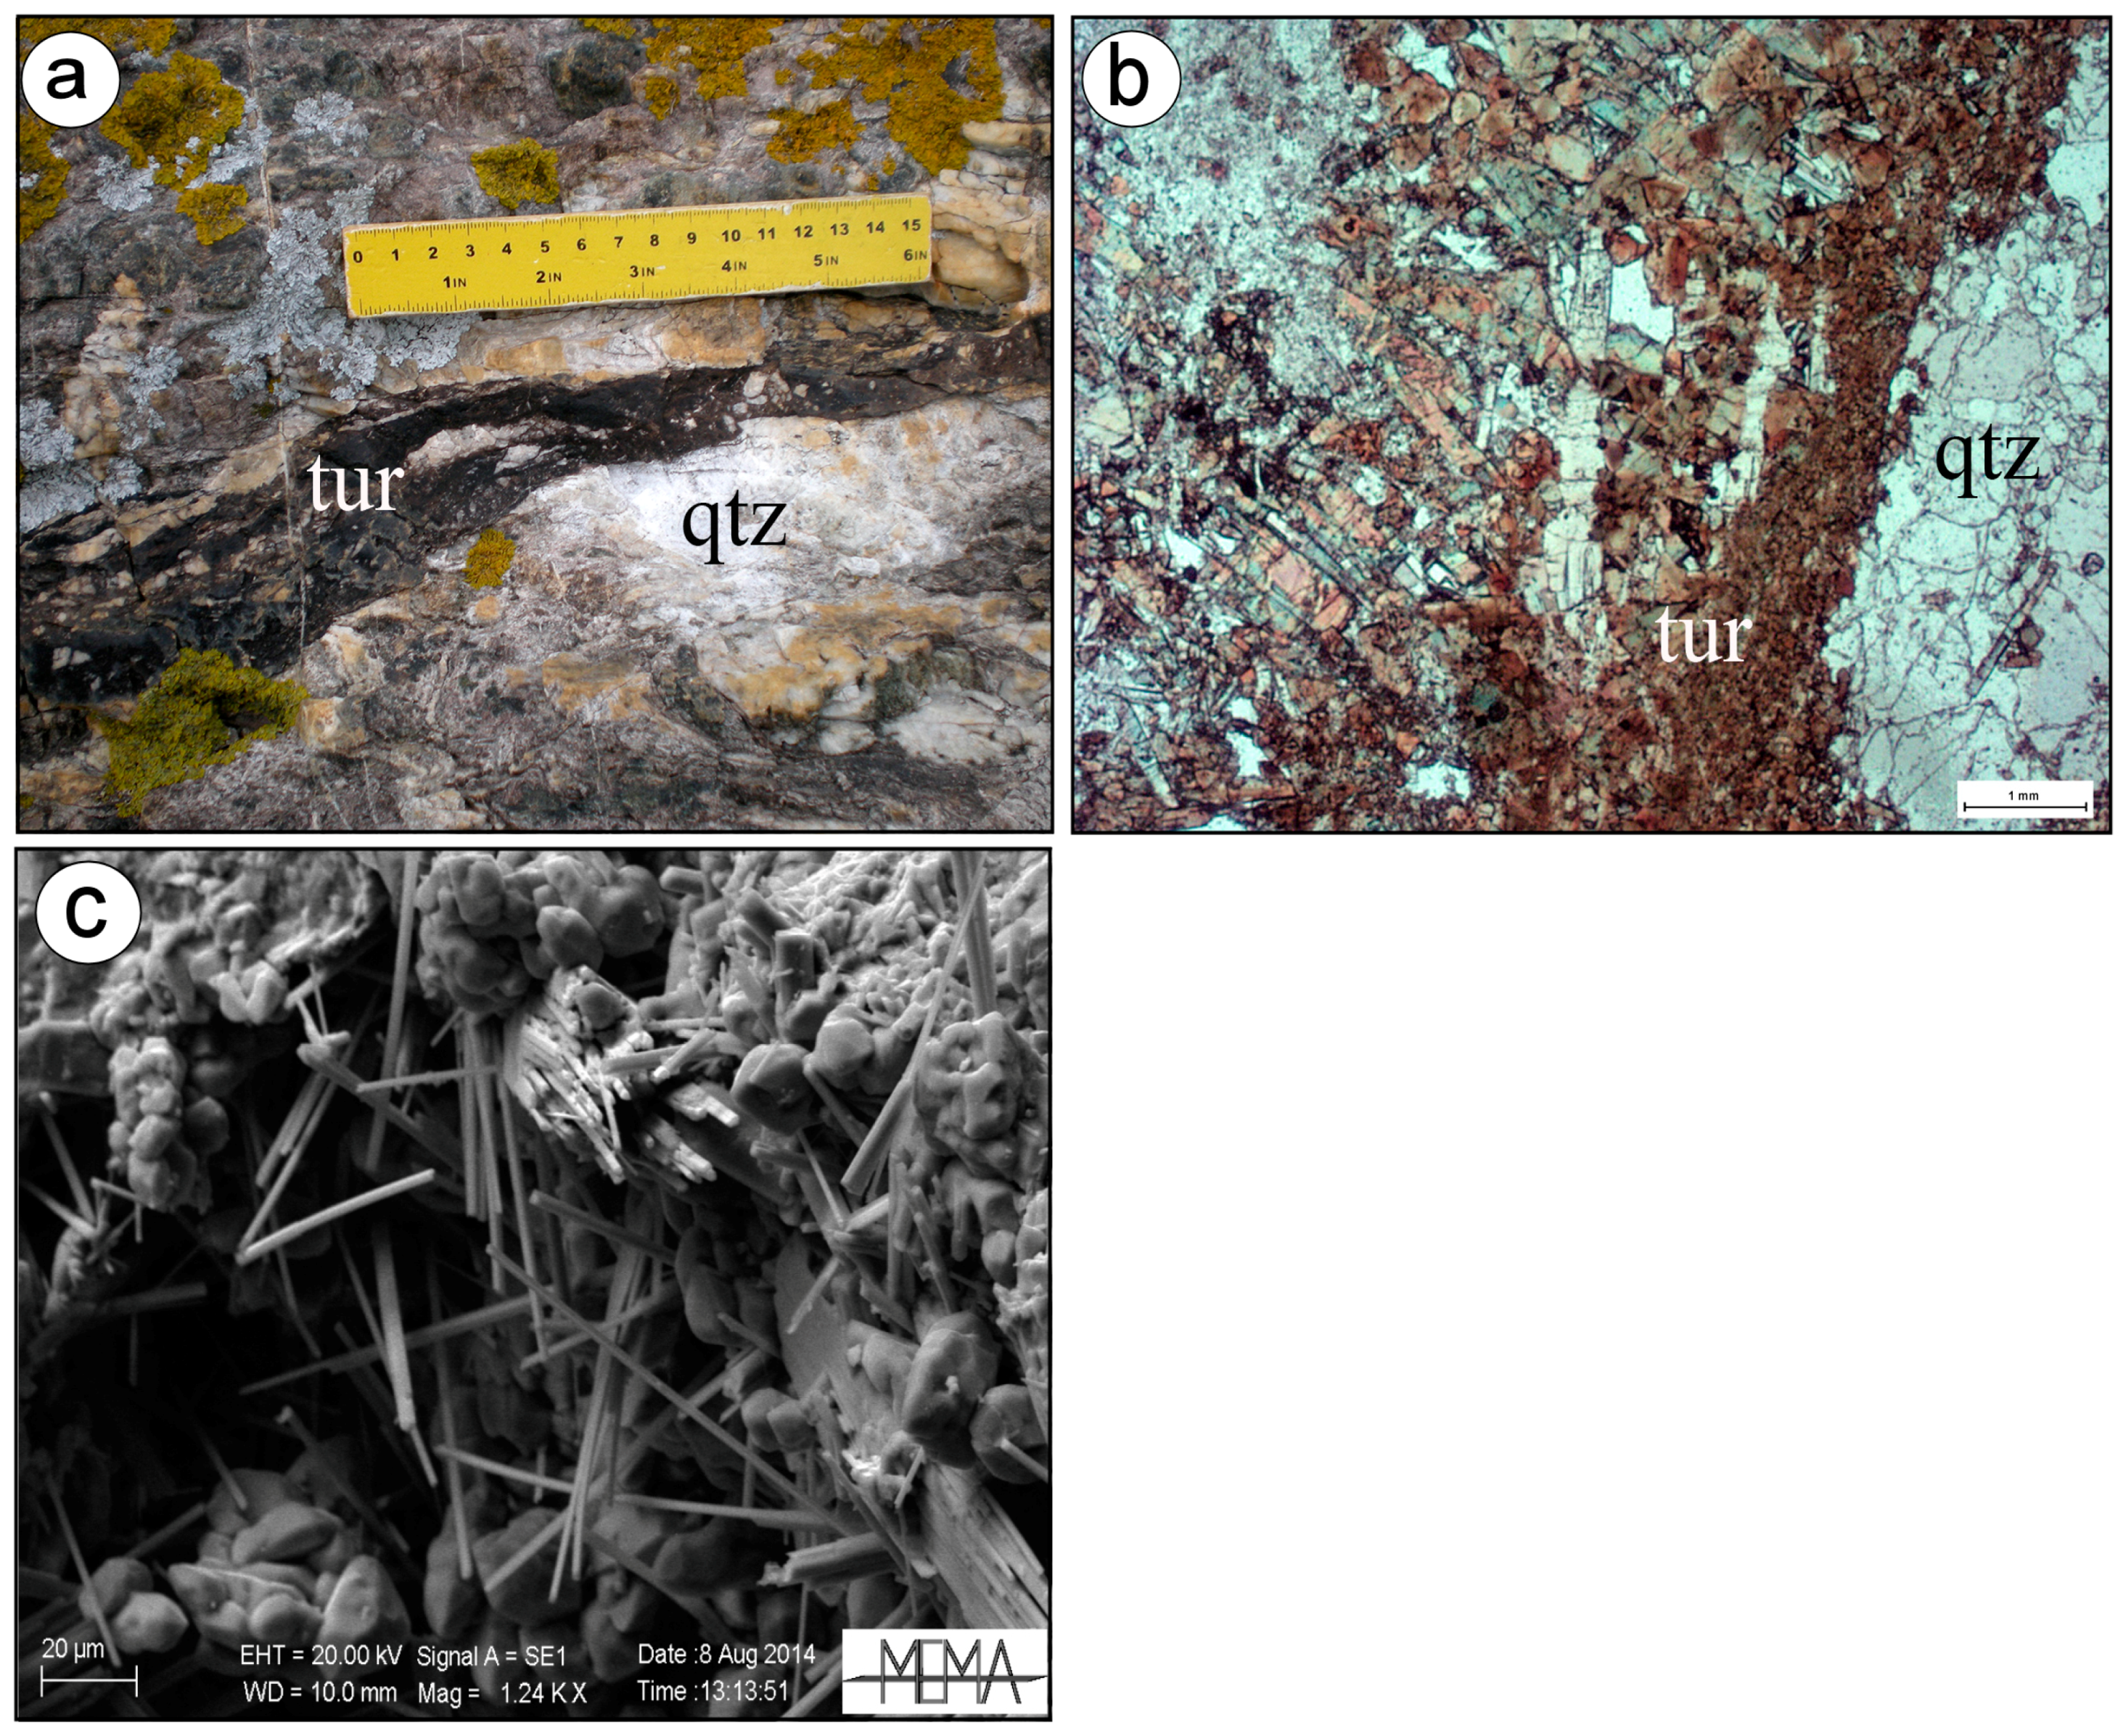
3. Tourmaline Veins and Metasomatic Bodies

The tourmaline–quartz veins and metasomatic bodies are found in the high-grade hornfels of the Mt. Calamita Formation, largely along the eastern part of the Calamita promontory, encompassing an area exceeding 20 km2 [8]. The veins mainly strike N–S to NW–SE; a few strike WNW–ESE [19]. A spectacular outcrop at Cala Stagnone (Figure 1), with a high concentration of quartz–tourmaline veins and bodies and leucogranitic dykes, was examined in detail by [8]. Tourmaline–quartz veins at Cala Stagnone have thicknesses ranging from 0.1 to 25 cm and cut across leucogranitic felsic dykes and metasomatic bodies (Figure 2a,b). The latter were developed at the contact between the dykes and the host hornfels, with preferential metasomatic replacement of biotite-rich layers in the hornfels by black tourmaline and quartz. Tourmaline in metasomatic bodies forms fine-grained (100–500 µm) clusters of subhedral to euhedral crystals with prismatic and acicular habit (Figure 2c). In the veins tourmalines, associated with minor quartz, are prismatic; their aggregates display variable sizes from fine-grained (100–500 µm) to very fine-grained (50–200 µm). Some veins show a coarse-grained cataclastic fabric with angular fragments of host rock and early tourmaline vein infill cemented by very fine-grained tourmaline and minor quartz.
The formation of quartz–tourmaline veins and metasomatic bodies has been ascribed to a hydrothermal system developed in the Mt. Calamita Formation dominated by B-rich and saline fluid related to felsic dykes [8]. Tourmalines in felsic dykes are schorl (-foitite), but in the veins and metasomatic bodies their compositions shift toward more Mg-rich compositions in consequence of progressive interaction of the B-rich fluids with the biotite-rich layers of the Mt. Calamita Formation [8]. Finally, late tourmalines in veins display a more Ca-rich composition (i.e., uvite) presumably because of a fluid reaction with the psammitic hornfels.
Fluid inclusion studies on quartz–tourmaline veins of Mt. Calamita Formation showed that both minerals contain two main types of fluid inclusions [11,12]:
(1)
multi-phase inclusions (liquid + vapour + halite and one or more other solids) characterised by halite final melting temperature between 141 and 415 °C, temperature of bubble disappearance from 192 to 330 °C and a computed salinity range of 29–49 wt % NaCl equivalent;
(2)
two-phase inclusions (liquid + vapour) displaying low eutectic temperature (~−55/−50 °C), final ice melting temperature between −31.1 and −7.1 °C, total homogenisation (either to the liquid or the vapour phase) from 242 to 596 °C, and calculated salinity between 11 and 29 wt % NaCl equivalent.
Trapping pressure–temperature conditions are within 74–160 MPa and 420–650 °C ranges for two-phase inclusions, and within 110–200 MPa and 370–420 °C ranges for multi-phase inclusions [12]. These ranges were estimated considering fluid inclusion isochores, pressure at maximum total homogenisation temperatures, andalusite stability field, and maximum pressure and temperature at the contact metamorphic peak.
Both fluid inclusion types present a composition dominated by Na, Cl, Fe and K, and also contain B, as indicated by LA-ICPMS analysis [12]. However, Refs. [11,12] did not report the occurrence of sassolite in the examined inclusions, suggesting a relatively low B content in such inclusions.
The occurrence of at least two populations of fluid inclusions within both tourmaline and quartz and the rather variable compositions of the veins tourmaline points toward a complex physicochemical evolution of the fluid(s) in the veins [8,11,12]. In particular, Ref. [12] suggest an evolution from higher temperature fluids trapped in two-phase inclusions towards lower temperature fluids recorded by multi-phase inclusions.
A recent study reported data of fluid inclusions trapped in minerals of leucogranitic and aplite–pegmatitic dykes sampled in thermally metamorphosed rocks associated with the Mt. Capanne pluton (western Elba) [13]. In particular, fluid inclusions in tourmaline from aplite–pegmatite dykes contain up to 4.2 wt % H3BO3, in addition to a gas mixture and NaCl, and they were trapped at temperature and pressure ranges of 680–740 °C and 230–270 MPa, respectively. These ranges are higher than those estimated for the trapping of fluid inclusions in quartz–tourmaline veins studied by [12], and somewhat higher than the conditions estimated (575–625 °C, 150–200 MPa) for the contact metamorphism in the Mt. Capanne thermal aureole by [34].
The pressure and temperature of two-phase fluid inclusions trapping estimated by [12] are more consistent with those (100–130 MPa, 425–650 °C) estimated by [35] for the trapping of magmatic and contact metamorphic fluids within inclusions in quartz of granite dykes and high-temperature assemblages (quartz + tourmaline + biotite + Ca-plagioclase) found in deep wells of the Larderello geothermal field. Here, similar to eastern Elba, granitic bodies intruded Paleozoic metamorphic rocks and tourmaline occurs in leucogranitic dykes and in veins crosscutting the metamorphic rocks [17,36].

4. Materials and Methods

4.1. Starting Material

4.1.1. Solids

A representative biotite-rich schist (sample GN1B) from the Mt. Calamita Formation was selected for experiments. It is formed (in order of abundance, based on optical microscopy) of plagioclase (albite and oligoclase), biotite, quartz, chlorite, muscovite, andalusite, cordierite and ilmenite. Only the first three phases are detectable through XRD; by Rietveld refinement the three most abundant phases are estimated at 41, 27, and 25 wt %, respectively. The 60–120 µm granulometric fraction was selected for the experiments. A further starting material was prepared by (passively) enriching biotite crystals by means of Franz isodynamic magnetic separator. This was done with the perspective to favour the expected tourmaline crystallisation since biotite was thought to be the major supplier to the crystallisation of this phase. In this case, the separate (GN1B sep.) was composed mainly of biotite (47 wt %, Rietveld refinement estimation), plagioclase (44 wt %), chlorite (5 wt %) and quartz (4 wt %). EMP analyses revealed that biotite crystals in the starting material have major oxides in the following ranges (Table 1): SiO2= 32.1–33.8 wt %, TiO2 = 2.2–3.7 wt %, Al2O3 = 18.4–20.4 wt %, FeO = 22.5–24.7 wt %, MnO = 0.3–1.3 wt %, MgO = 5.3–6.9 wt %, Na2O = 0.1–0.3 wt %, K2O = 9.3–10.4 wt %. XMg (=Mg/(Fe + Mg)) varies from 0.28 to 0.35.

4.1.2. Fluids

The reacting fluid should approximate the composition of a fluid exsolved from the leucogranitic dykes. Considering the Fe-Mg-poor nature of leucogranitic melts, the elements that will be partitioned in the exsolved aqueous phase would be principally Cl, Na, K and B. The concentrations of these elements in the reacting fluid could be established on the basis of two-phase fluid inclusions (i.e., the earliest fluid) of quartz–tourmaline veins. However, in general such inclusions do not record the fluid exsolved from the leucogranitic dykes; rather, they trapped the fluid precipitating quartz and tourmaline that already reacted with the biotite-rich schist of Mt. Calamita Formation, as suggested by the occurrence of significant concentrations of dissolved Fe in the inclusions [12].
General information on the chemical features of the aqueous fluid exsolved from granites can be given by fluid inclusions trapped in pegmatitic minerals. Peretyazhko et al. [37] reported a wide range of salinities (from 1 to 38.2 wt % NaCl equivalent) and H3BO3 concentrations (from 2.4 to 26.5 wt %) of fluid inclusions from the cavity and near-cavity mineral assemblages of 31 miarolitic pegmatites of 11 world regions.
Thus, in order to cover different exsolved fluid compositions in our experiments, two main types of B-bearing reacting fluids were considered: (1) a rather saline one, constituted by H2O + H3BO3 + NaCl; and (2) an NaCl-free fluid: H2O + H3BO3. The concentration of NaCl in the first fluid was set at 20 wt %, which is an intermediate value of the salinities of the two-phase inclusions in the Cala Stagnone quartz–tourmaline veins computed from final ice melting temperature [11] and of the salinity range reported by [37]. The concentration of H3BO3 in the reacting fluids was also variable from 0.01 to 3.2 M (i.e., from 0.06 to 20 wt % of H3BO3), and encompasses the H3BO3 range concentration (2.8–5.0 wt %) found in the liquid phase of inclusions in tourmaline of an aplite–pegmatite dyke of the eastern Mt. Capanne plutonic complex [13].
H3BO3 was chosen since acid solutions are considered the most favourable for tourmaline crystallisation, e.g., [38]. With increasing T, H3BO3 dehydrates (at T approaching 400 °C) in a few steps, producing B2O3. The water so released only slightly decreases the real H3BO3 concentrations in aqueous solutions.
Saline solution was prepared using NaCl Suprapur Merck chemical compound. The solid/fluid ratio in experiments varied from 0.5 to 1. These values were arbitrarily chosen, being a good compromise between experimental design (which does not allow us to insert a great amount of fluid into capsules) and the need to ensure that the solid inside the capsule is completely wet.

4.2. Experimental Conditions and Apparatus

Experimental details about experiments are reported in Table 2. All experiments lasted 168 h. Unbuffered experiments were performed in the range 100–130 MPa and 500–600 °C, on the basis of the pressure–temperature range estimated from fluid inclusion data on quartz–tourmaline veins (see Section 3). Since the quartz–tourmaline veins hosting the fluid inclusions are spatially associated with the leucogranitic dykes, the information given by fluid inclusion data would reflect the pressure and temperature conditions of the exsolved fluid.
Experiments were performed by using a Leco Corp. (model HR-2B-2, Leco Corp., St. Joseph, MI, USA) cold seal pressure vessel equipment. For each experiment, solid starting material plus fluid was sealed in Au capsules (4.8 mm external diameter, 4.6 mm internal diameter), and inserted in a René 41 pressure vessel (Leco Corp.). Lengths of capsules were generally in the range 15–25 mm; longer lengths (100 mm) were used only in those experiments planned to recover the fluid after fluid-solid interaction runs. In these cases, particular care was taken to place the capsules in the equalised zone of the furnace, which was measured to be ~20 mm wide. P was measured by pressure gauges while T was controlled and monitored by K-type thermocouples attached on the outside. At the end of each experiment, the pressure vessel was extracted from the oven, and the capsule was recovered when the vessel was at ambient T (approximately 1 h after the end of the experiment). Experiments were considered successful if the capsules did not change their weights after the runs.

4.3. Analyses

4.3.1. Solids

Solids (starting material and some experimental products) were characterised through the following techniques:
  • XRD: Philips PW 1050/37 diffractometer (Philips, Amsterdam, The Netherlands), Cu Kα source, 2° 2Θ/min step size. Rietveld refinements of powder diffraction patterns were performed on some selected spectra using the MAUD software package [39];
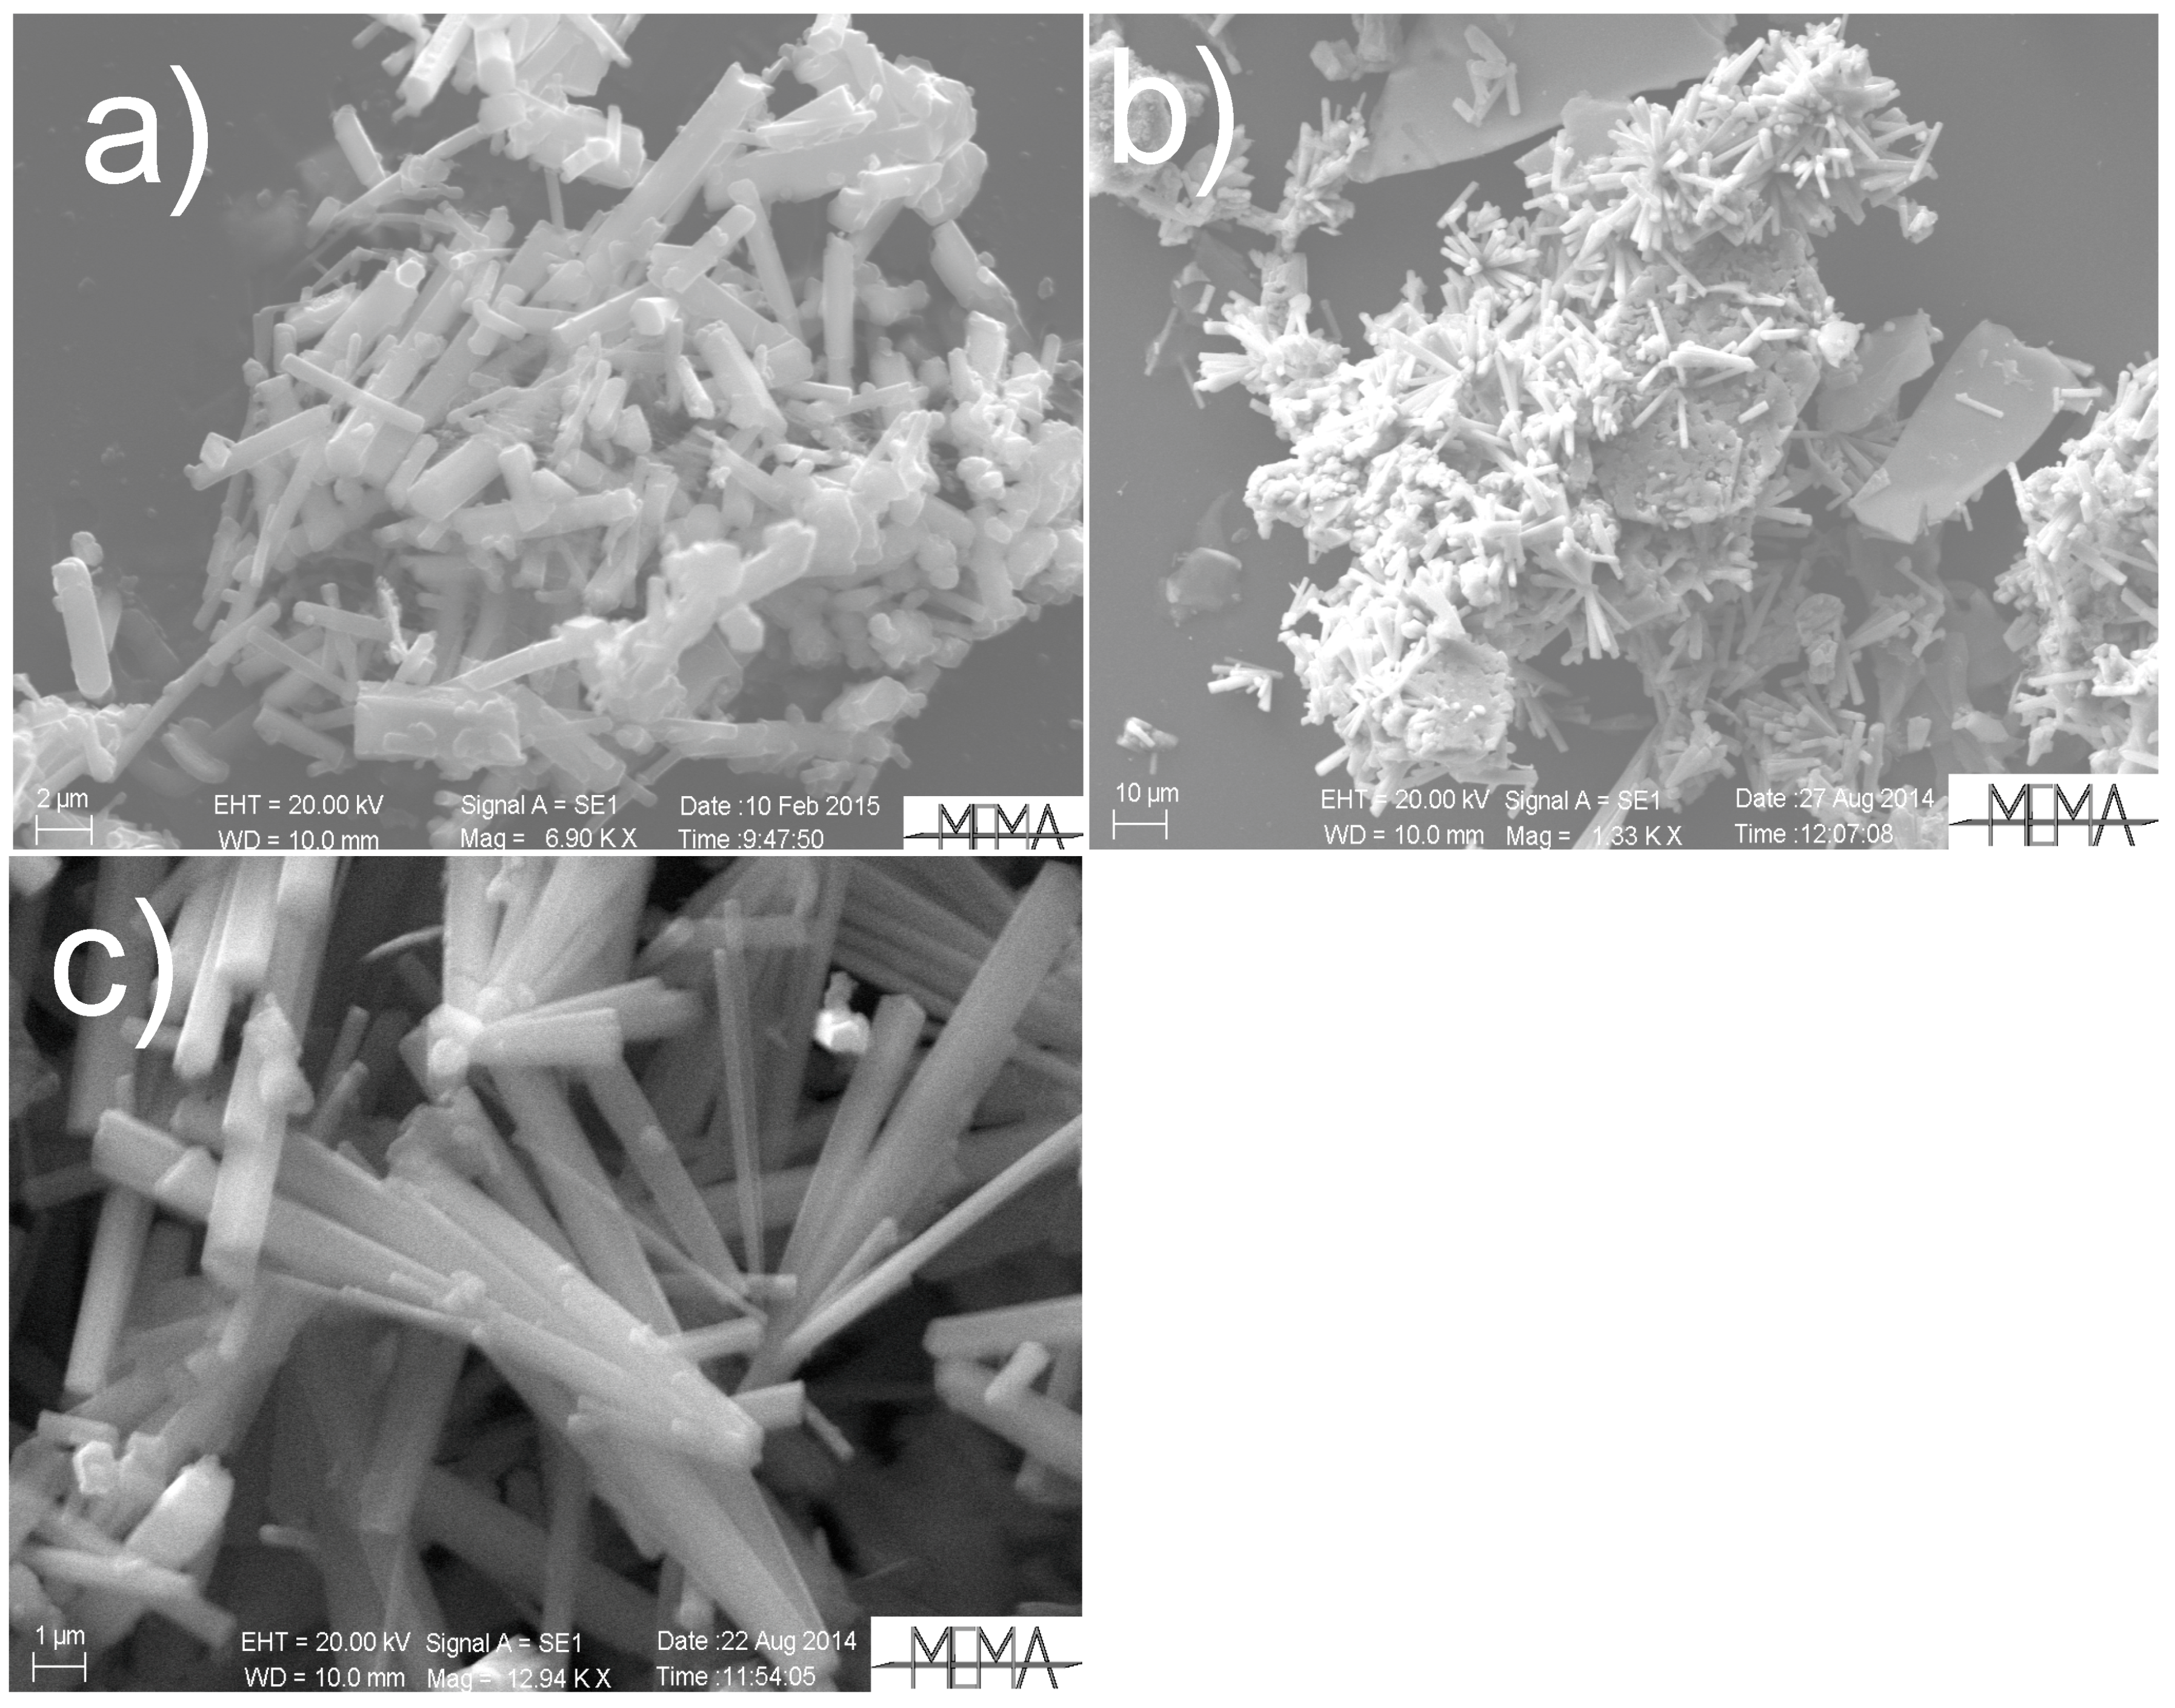
  • SEM: Zeiss EVO MA15 instrument (Zeiss, Oberkochen, Germany), equipped with an Oxford Inca 250 EDS detector (Oxford Instruments, Abingdon-on-Thames, UK), 20 kV accelerating voltage. EDS spectra and semi-quantitative analyses were acquired for the whole set of experimental products;
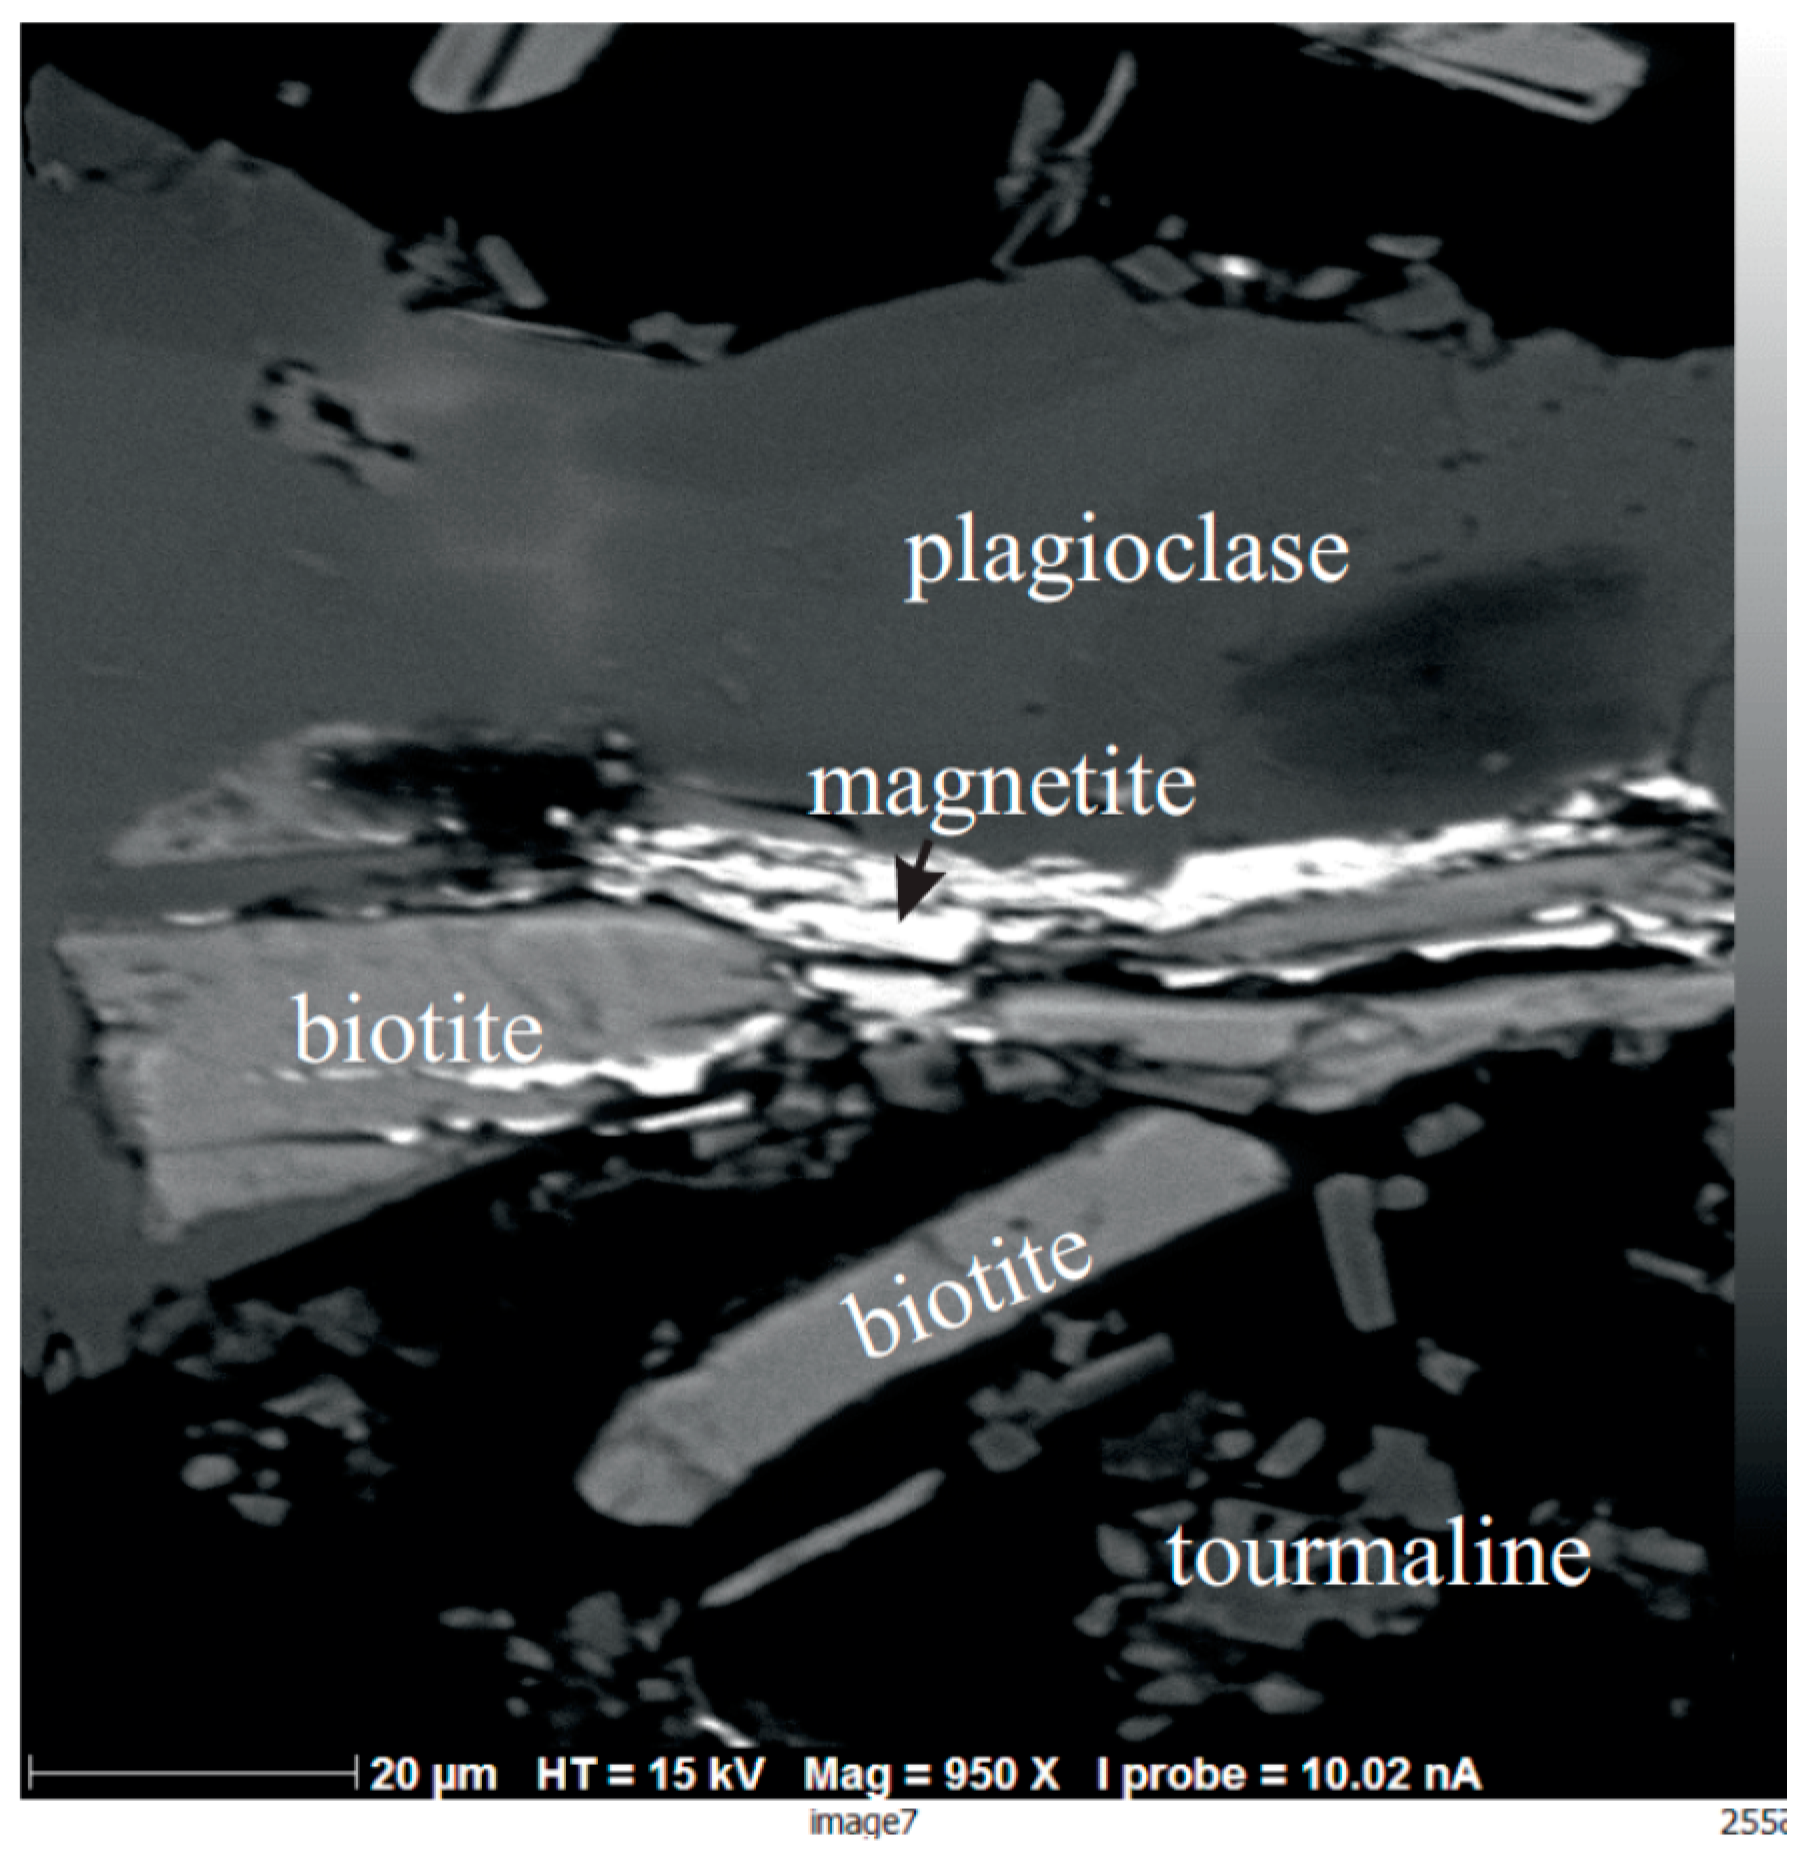
  • EMPA: JEOL JXA-8600 (Jeol Ltd., Tokyo, Japan) electron microprobe using 15 kV accelerating voltage, 10 nA beam current, spot size ~5 µm, and 15 s counting times for each element (Si, Ti, Al, Cr, Fe, Mn, Mg, Ca, K) but10 s for Na. Data were collected considering the PAP model [40]. Mineral analyses by this technique were performed only on some selected experimental products.
In addition to experimental products, tourmalines from quartz tourmaline veins and metasomatic bodies from the Cala Stagnone outcrop (Figure 1) were analysed through EMPA, for a direct comparison with synthetic crystals.

4.3.2. Fluids

Three experiments (Experiments 6, 17 and 20, Table 2) were performed to recover and analyse fluid and solid phases. The utilisation of long (100 mm) capsule was planned to maximise the amount of fluid in the capsule and, consequently, minimise errors during subsequent dilution. Fluids were extracted as follows:
  • the capsule was immersed in milli-Q water into a test tube with a porous stopper;
  • the capsule was crimped (and opened) using pliers, thus allowing the fluid into the capsule to dilute into the milli-Q water. Knowing the amount of the fluid inserted into the capsule the dilution was then calculated;
  • the immersion of the test tube in ultrasonic bath for 3 h favoured the homogenisation of the aqueous solution and the powder removal from the capsule;
  • after 48 h, the powder fully deposited to the bottom of the test tube and the solution was thus recovered through a pipette, and subsequently analysed.
Solutions were analysed through Liquid Chromatography by using 861 Advanced Compact IC Metrohm and 761 Compact IC Metrohm for anions (F, Cl, NO3, SO4, NH4) and by means of ICP-OES (PerkinElmer Optima 8000, PerkinElmer, Waltham, MA, USA) for cations (Li, Na, K, Mg, Ca, Fe, Mn, Si, Ni). Fluid composition was then calculated taking into account the operated dilution.

5. Results

5.1. Solid Phases

5.1.1. General Remarks

The indication of the presence of tourmaline among products in the different experiments is reported in Table 2. Tourmaline is detected in runs where the boric acid concentration was equal or greater than 1.6 M, irrespective of the solid and fluid used as starting materials. Tourmalines are found as coalesced acicular crystals with the longest size ranging up to 20 µm (Figure 3) in the whole investigated T range. In XRD spectra the main peaks diagnostic of this phase were found at d = 2.57, 3.98, 4.22, 2.04 and secondarily at 2.96, 3.48 and 1.92 Å. Moreover, tourmaline abundance in experimental products seems independent from T. At the same time, the formation of tourmaline is accompanied by a sharp decrease of biotite amounts in experimental products; this diminution appears independent of both T and the salinity of the aqueous solution used as fluid reactant. For low boric acid concentrations (0.01 and 0.1 M), tourmaline was detected in neither the XRD spectra nor the SEM observations.
Chemical analyses of tourmalines show differences based on the presence/absence of NaCl in the fluid used in the experiments (Table 2); on the contrary, the use of the selected rock or its biotite enriched separate did not significantly affect the mineralogy and mineral chemistry of experimental products. On this basis, experiments performed using NaCl-bearing aqueous solutions and NaCl-free solutions will be presented separately.
It is worth noting the disappearance of muscovite among experimental products; the other minor phases in solid starting material (chlorite, andalusite, cordierite and ilmenite) were sometimes found during SEM observations, even if never detected through XRD.
After the experiments, residual biotite does not show compositional differences with respect to crystals from the starting material (Table 1).

5.1.2. Experiments Performed Using Saline Aqueous Solutions

XRD spectra reveal tourmaline as the main neo-formed phase in experimental products. Rietveld refinement estimations on XRD spectra of Experiments 6 and 17 are reported in Table 2. Mineral chemistry of tourmaline reveals that this phase can be mostly classified as dravite [41] (Table 3). In addition, a few crystals are classified as schorl [41]. Moreover, EMP analyses reveal that tourmaline is not the only neo-formed phase in these experiments. In fact, investigations using backscattered electrons allowed for finding tiny veins (width < 20 µm) of Fe oxides (Figure 4) or Fe oxyhydroxides, with SiO2 (~2–3 wt %) and Al2O3 (~1 wt %) contents. Possibly, this phase is not fully crystalline, like amorphous oxyhydroxides, and this could explain why it was not detected by XRD investigation. Plagioclase increase in the experimental products (Table 2) is likely related to the high Na concentration in the aqueous solution that favoured plagioclase (albite) crystallization. A minor neo-formed phase is K-feldspar (Table 2).

5.1.3. Experiments Performed Using Pure Water

Rietveld refinement estimations on XRD spectra of Experiments 8 and 20 are reported in Table 2. Experiments show that tourmaline also forms when pure water is utilised. In this case, Na required for its crystallisation is not necessarily furnished directly by the fluid, but most likely comes from a Na/K exchange process affecting feldspars ([43] and references therein), where K in the solution is provided by a biotite reaction. As a matter of fact, XRD spectra reveal tourmaline and K feldspar as the main neo-formed phases. The former can be classified as schorls (Table 3). Furthermore, abundant K feldspars were sometimes found among experimental products, mainly surrounding plagioclase relicts of the starting material (Figure 5). Their composition, detected through EMPA, is An0–3Ab21–28Or65–77.
SEM investigations using backscattered electrons allowed identifying rare Fe oxides (amorphous oxyhydroxides?); they are less abundant with respect to those observed among the experimental products obtained with saline solution (see Section 5.1.2).

5.2. Fluids

The compositions of fluids extracted from Experiments 6, 17 and 20 are reported in Table 4. Fluids sampled from experiments completed using a saline fluid show a decrease of Na with respect to the starting solution. On the contrary, K, Fe and, secondarily, Ca, Mg, Mn and Li show opposite trends. This evidence confirms the occurrence of biotite dissolution during the experiments. The elevated Fe contents in solutions are remarkable (Table 4); this observation, coupled with the finding of Fe oxides or amorphous oxyhydroxides in experimental products, testifies to Fe mobility during the fluid–rock interaction experiments. In the run completed using pure water (Experiment 20), K and Fe contents are one order of magnitude less than in saline fluids (Table 4). On the contrary, Si is about seven times more abundant than in Experiment 17 (performed in similar conditions; see Table 2, Table 3 and Table 4); this difference could be due to different amounts of plagioclase in the relative solids, considering that this phase is more abundant when saline fluid was utilised (Table 2). The paucity of K in solution complements the occurrence of K feldspars among experimental products in this run. As it regards element variations with T (runs with saline fluid), the opposite trends shown by K and Fe should be noted. They cannot be explained by less efficient dissolution of biotite at 500 °C with respect to 600 °C, but likely to a greater stabilisation of K feldspars at the lowest investigated temperature. This statement is supported by the observation of phases found in experimental products, suggesting the independence of T and biotite dissolution (Section 5).
Ca found in the solutions (and also within tourmaline) is likely derived from the plagioclase through Na–Ca exchange between plagioclase and the NaCl-rich solution (Experiments 6 and 17) or from the replacement of plagioclase by K-feldspar in the NaCl-free experiment (Experiment 20).
Fluids extracted have considerable F contents (77–130 µg/g). In our experiments, similar to what commonly happens in groundwater, F originates from the dissolution of biotite, which may contain significant fluorine in the OH sites of the octahedral sheet e.g., [44] and references therein. Biotite dissolution can be a source of Cl as well. In fact, the Cl content (479 µg/g) in the NaCl-free experiment strongly supports this hypothesis.

6. Discussion

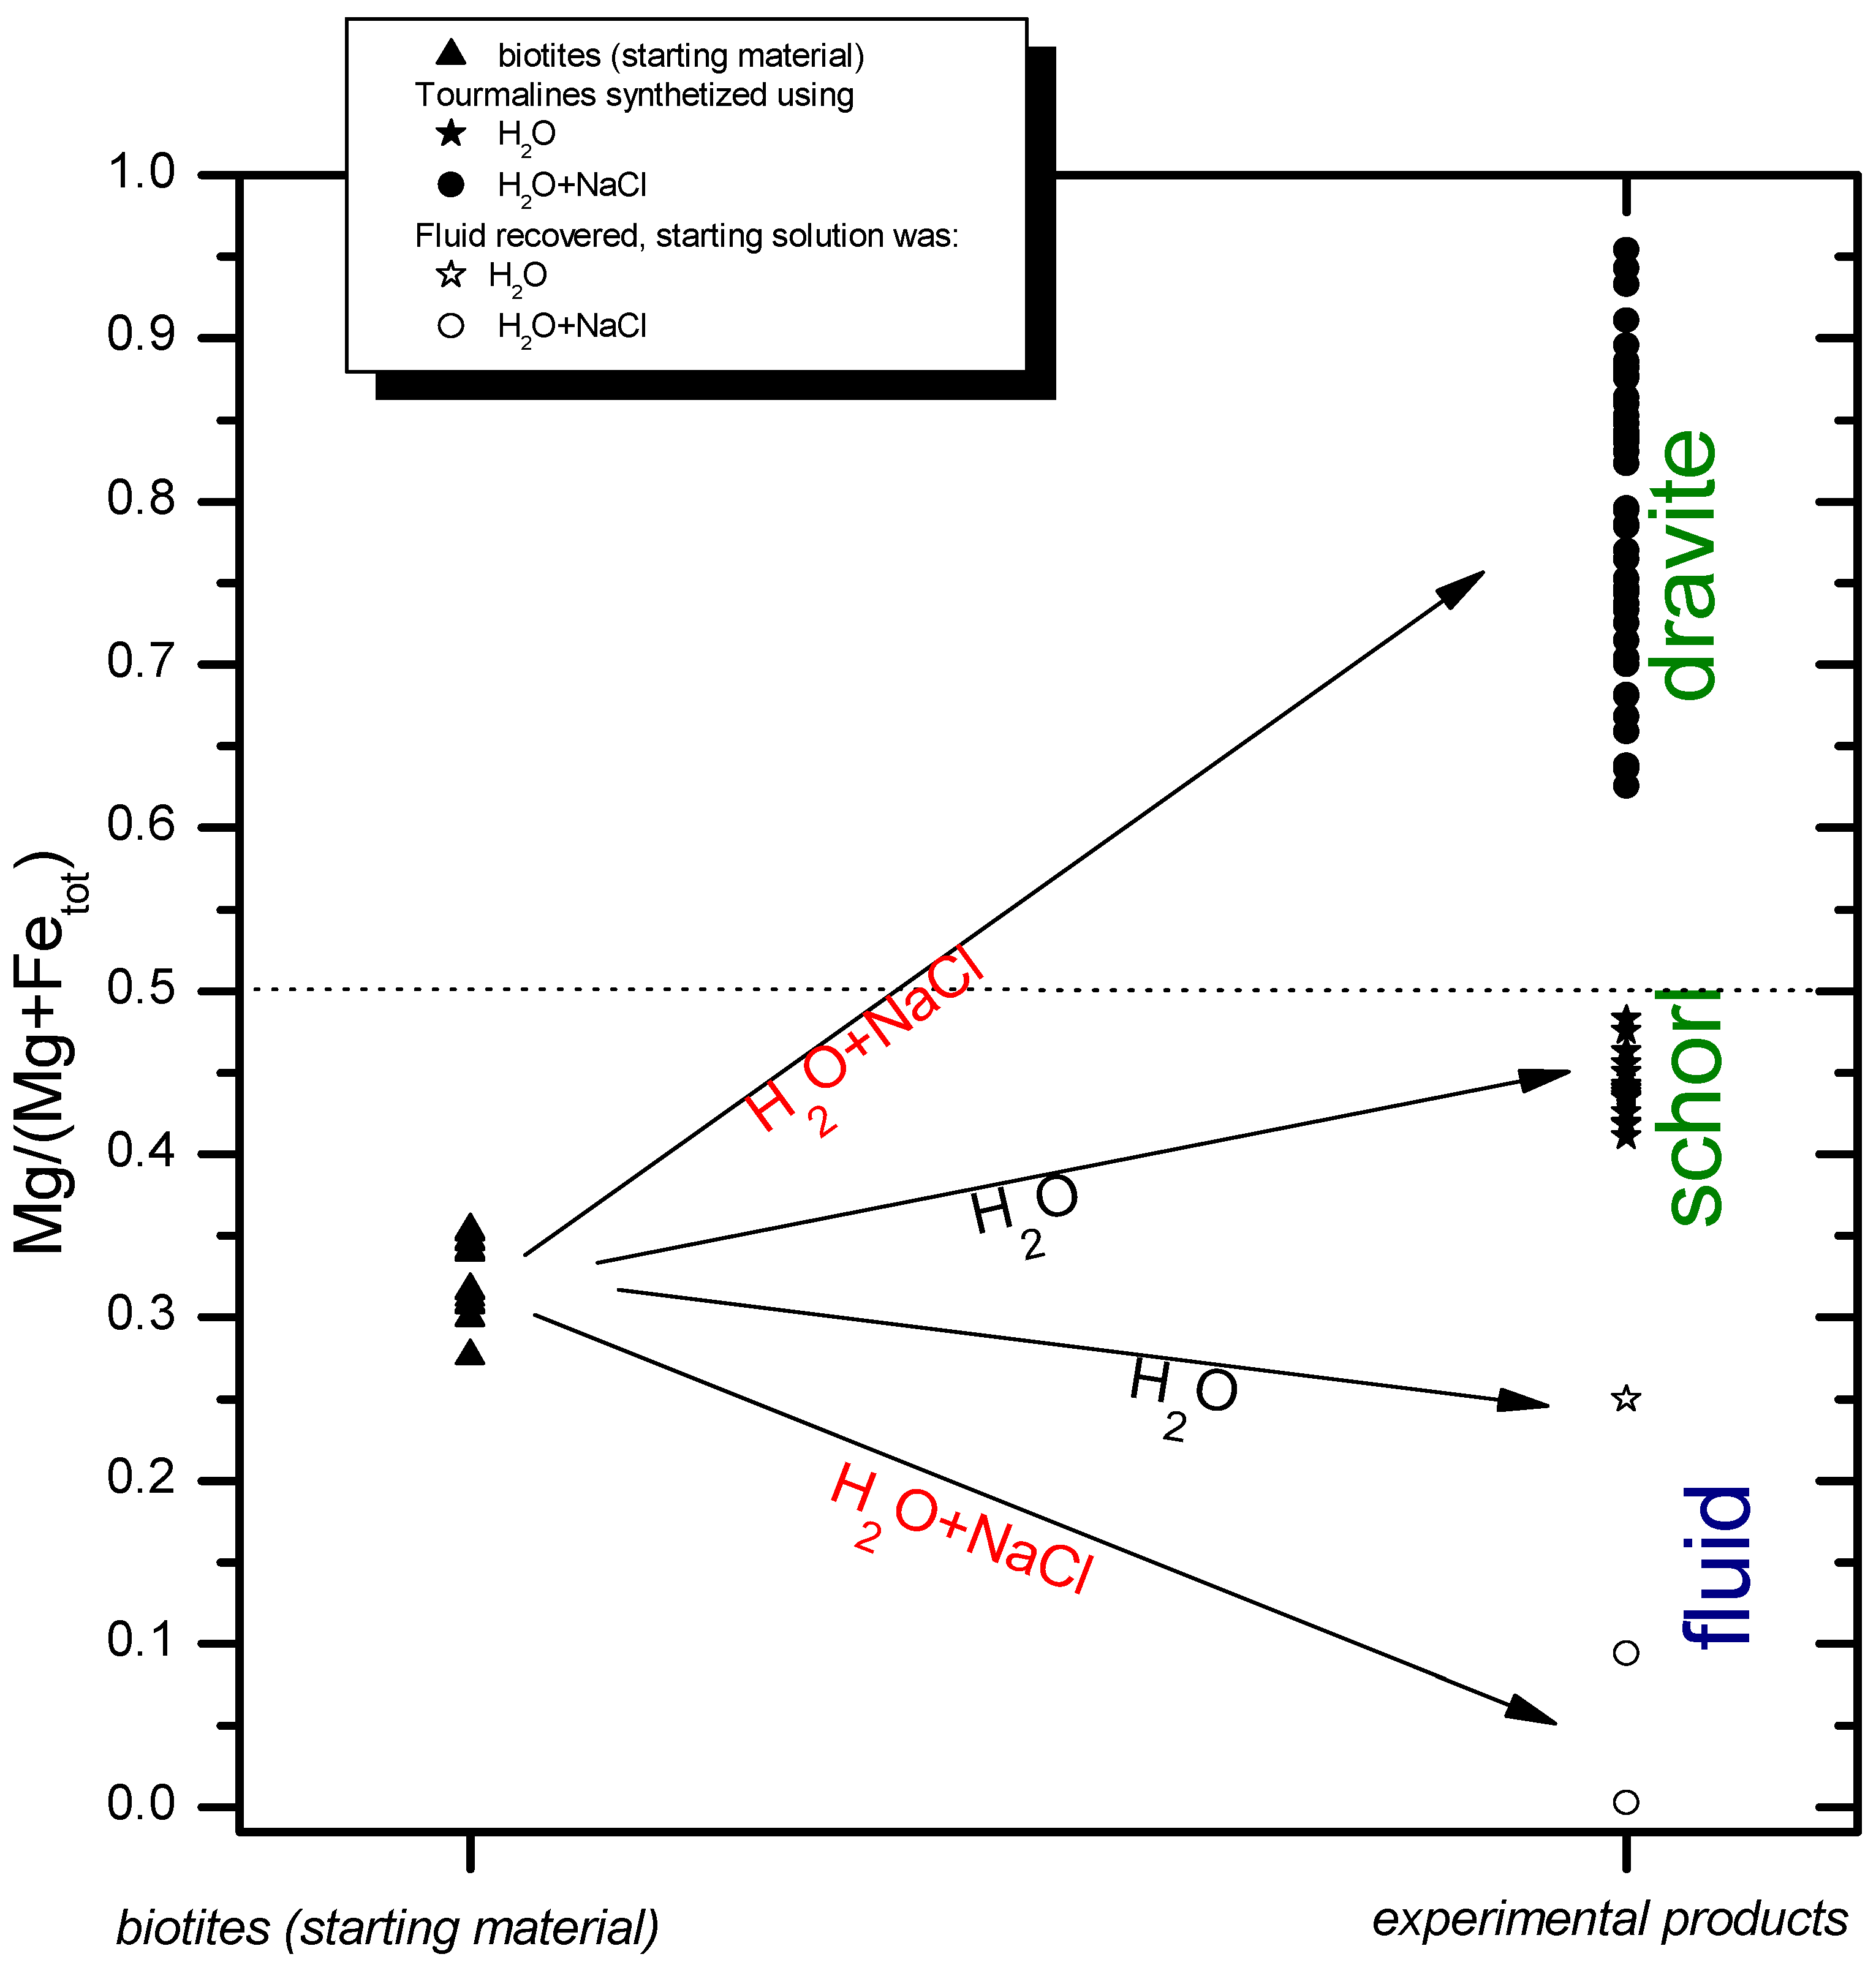
6.1. Tourmaline Formation

The results of the experiments indicate that the reaction of B-bearing fluid with biotite-rich schist of the Mt. Calamita Formation under relatively high temperature (500–600 °C) and upper crust pressure (100–130 MPa) conditions causes relatively abundant tourmaline crystallisation.
Biotite is the major supplier for tourmaline crystallisation and its dissolution mainly causes K and Fe mobilisation in the resulting fluid, as well as Fe oxide formation in experimental products. The reaction responsible for biotite dissolution and tourmaline crystallisation can be sketched for Fe (and Mg, in parentheses) end-members, as follows:
6annite (phlogopite) + 5H+ + Na+ + 3H3BO3 + 4H2O ↔ schorl (dravite) + 15Fe2+ (Mg2+) + 30OH + 6K+ + 12SiO2
The proposed tourmaline crystallisation through reaction (1) is similar to the process experimentally identified by [45] in an amphibolite reacting with boron-bearing aqueous fluids at 200 MPa and 475–600 °C. In their experiments, Ref. [45] found that the formation of tourmaline from acidic fluids (containing >0.5–1.0 wt % B2O3) involved the dissolution of hornblende and plagioclase. Moreover, tourmaline-forming reactions proceed only in acidic conditions (pH < 6), so that its crystallisation is prevented in alkaline conditions even in the presence of a B source [45]. In our experiments, tourmaline formed when the H3BO3 content was ≥1.6 M (i.e., B2O3 ≥ 5.5 wt %), whereas the use of H3BO3 concentrations ≤0.1 M (i.e., ≤0.35 wt %) does not allow tourmaline crystallisation. The lack of tourmaline formation in the experiments at 600 °C and relatively low H3BO3 concentrations agree with the experimental data of [3], indicating that at subsolidus conditions fluids equilibrated with tourmaline at 600 °C when B2O3 is >0.7 wt %.
Fe mass balance calculation, taking into account Rietveld refinements (Table 2) on both starting material and experimental products, is in accordance with Reaction (1). In particular, as regards Experiment 6, considering a KFe2.1Mg0.9AlSi3O10(OH)2 mica composition (simplifying and approximating the composition of mica in the starting material), it can be determined that about 13 wt % of the Fe produced by mica enters in tourmaline, and the remaining can be complexed in fluid (see below) and is eventually available for Fe oxide formation. In this case Mg-rich (dravitic) tourmaline crystallises. On the other hand, when an NaCl-free solution is used (e.g., Experiment 8) tourmaline “sequesters” as much as 70% of the Fe produced by mica dissolution, forming Fe-rich (schorlitic) crystals. Mg produced by mica dissolution is less than Fe, and it is found in small amounts (tens or hundreds of µg/g) in both H2O + NaCl and H2O fluids (Table 4). This is reasonable in experiments in which a saline fluid was used; in fact, Mg-rich tourmaline here forms. In experiments in which H2O was used as a fluid reactant, the greater amount (although Fe-rich) of tourmaline crystallisation can explain the Mg paucity in the fluid. Nevertheless, if Reaction (1) is taken into account, the expected Mg contents in fluid should be higher than the measured values. Thus, it is likely that the amount of tourmaline effectively formed can be higher than that calculated from Rietveld refinement. Considering K mass balance, Rietveld calculations are in accordance with Reaction (1), and the quite different K contents found in experimental fluids (Table 4) are in agreement with the occurrence of K feldspar crystallisation (Figure 5) in the NaCl-free experiment (i.e., Experiment 20).
The experiments show that the compositions of tourmalines and fluid recovered at the end of experiments vary significantly in function of the composition of fluid inserted in the capsules. Crystal chemistry shows that synthetic tourmalines belong to the alkali group according to the nomenclature of [41]; however, if a NaCl-rich fluid was used, dravites mainly crystallised (Table 3), and the recovered fluid has considerable K (640–11500 µg/g) and Fe (1800–2700 µg/g) contents (Table 4).
On the contrary, schorls crystallise when using pure water as a fluid reactant, and the recovered fluid has one order of magnitude less K (530 µg/g) and Fe (310 µg/g) contents (Table 4). Mg and Fe distribution in solids and fluids in experimental products can be visualised, taking into consideration their Mg/(Mg + Fetotal) values (Figure 6). In this graph, the relative values of biotites in starting material and tourmalines and fluids sampled in experimental products are visualised when using NaCl-rich or pure water starting fluids. The use of an NaCl-rich fluid in experiments produce tourmalines and fluids with quite different Mg/(Mg + Fetotal) values, while the use of pure water narrows these values. This is likely related to the presence of Cl, which acts as a complexing agent, forming different Fe(II) and Fe(III) complexes (i.e., FeCl+ FeCl2+, FeCl20, FeCl42−) in relation to temperature, pH, oxygen fugacity and Cl concentration, favouring its mobilisation in hydrothermal solutions [46,47,48,49,50].
Fe mobilisation in solution could have hindered its entering the tourmaline structure, just allowing crystallisation of dravites. Moreover, Fe could have precipitated as Fe oxides or amorphous oxyhydroxides at the end of experiments, when P and T conditions were decreasing together with the stability of Fe–Cl complexes in solution. In fact, the stability of Fe–Cl species generally decreases with falling temperature [48,49]. On the contrary, Fe-rich tourmalines (schorls) crystallised when Fe cannot be complexed, and consequently mobilised, by Cl in solution.
F and Li contents found in the recovered fluid (Table 4) can also be related to biotite dissolution. Even if these elements were not analysed in micas from starting materials, it is likely that mica’s dissolution contributed extensively to their occurrence in extracted fluids.
Tourmaline crystallises even when Na was not included in the starting reactant fluid. This observation strongly suggests the occurrence of a Na/K exchange between feldspar and fluid, making Na available for tourmaline crystallisation and causing K feldspars surrounding plagioclase crystals.
Besides biotite dissolution and tourmaline crystallisation, it is noteworthy to remark the muscovite (KAl2(AlSi3)O10(OH)2) disappearance among solid products at the end of experiments. Puxeddu et al. [51] proposed albitisation of muscovite as an important process occurred during the metasomatism in the Calamita promontory. The reaction, reported as follows,
3Na+ + KAl2(AlSi3)O10(OH)2 + 6SiO2 = 3NaAlSi3O8 + 2H+ + K+
could have occurred during our experimental runs too, even if SEM observations do not support this hypothesis, probably due to the paucity of muscovite in the starting material.
This reaction is favoured by the availability of SiO2 and Na; these components were indeed produced through Reaction (1) during the experiments. Moreover, Reaction (2) could have supplied additional K, besides that produced through biotite dissolution.

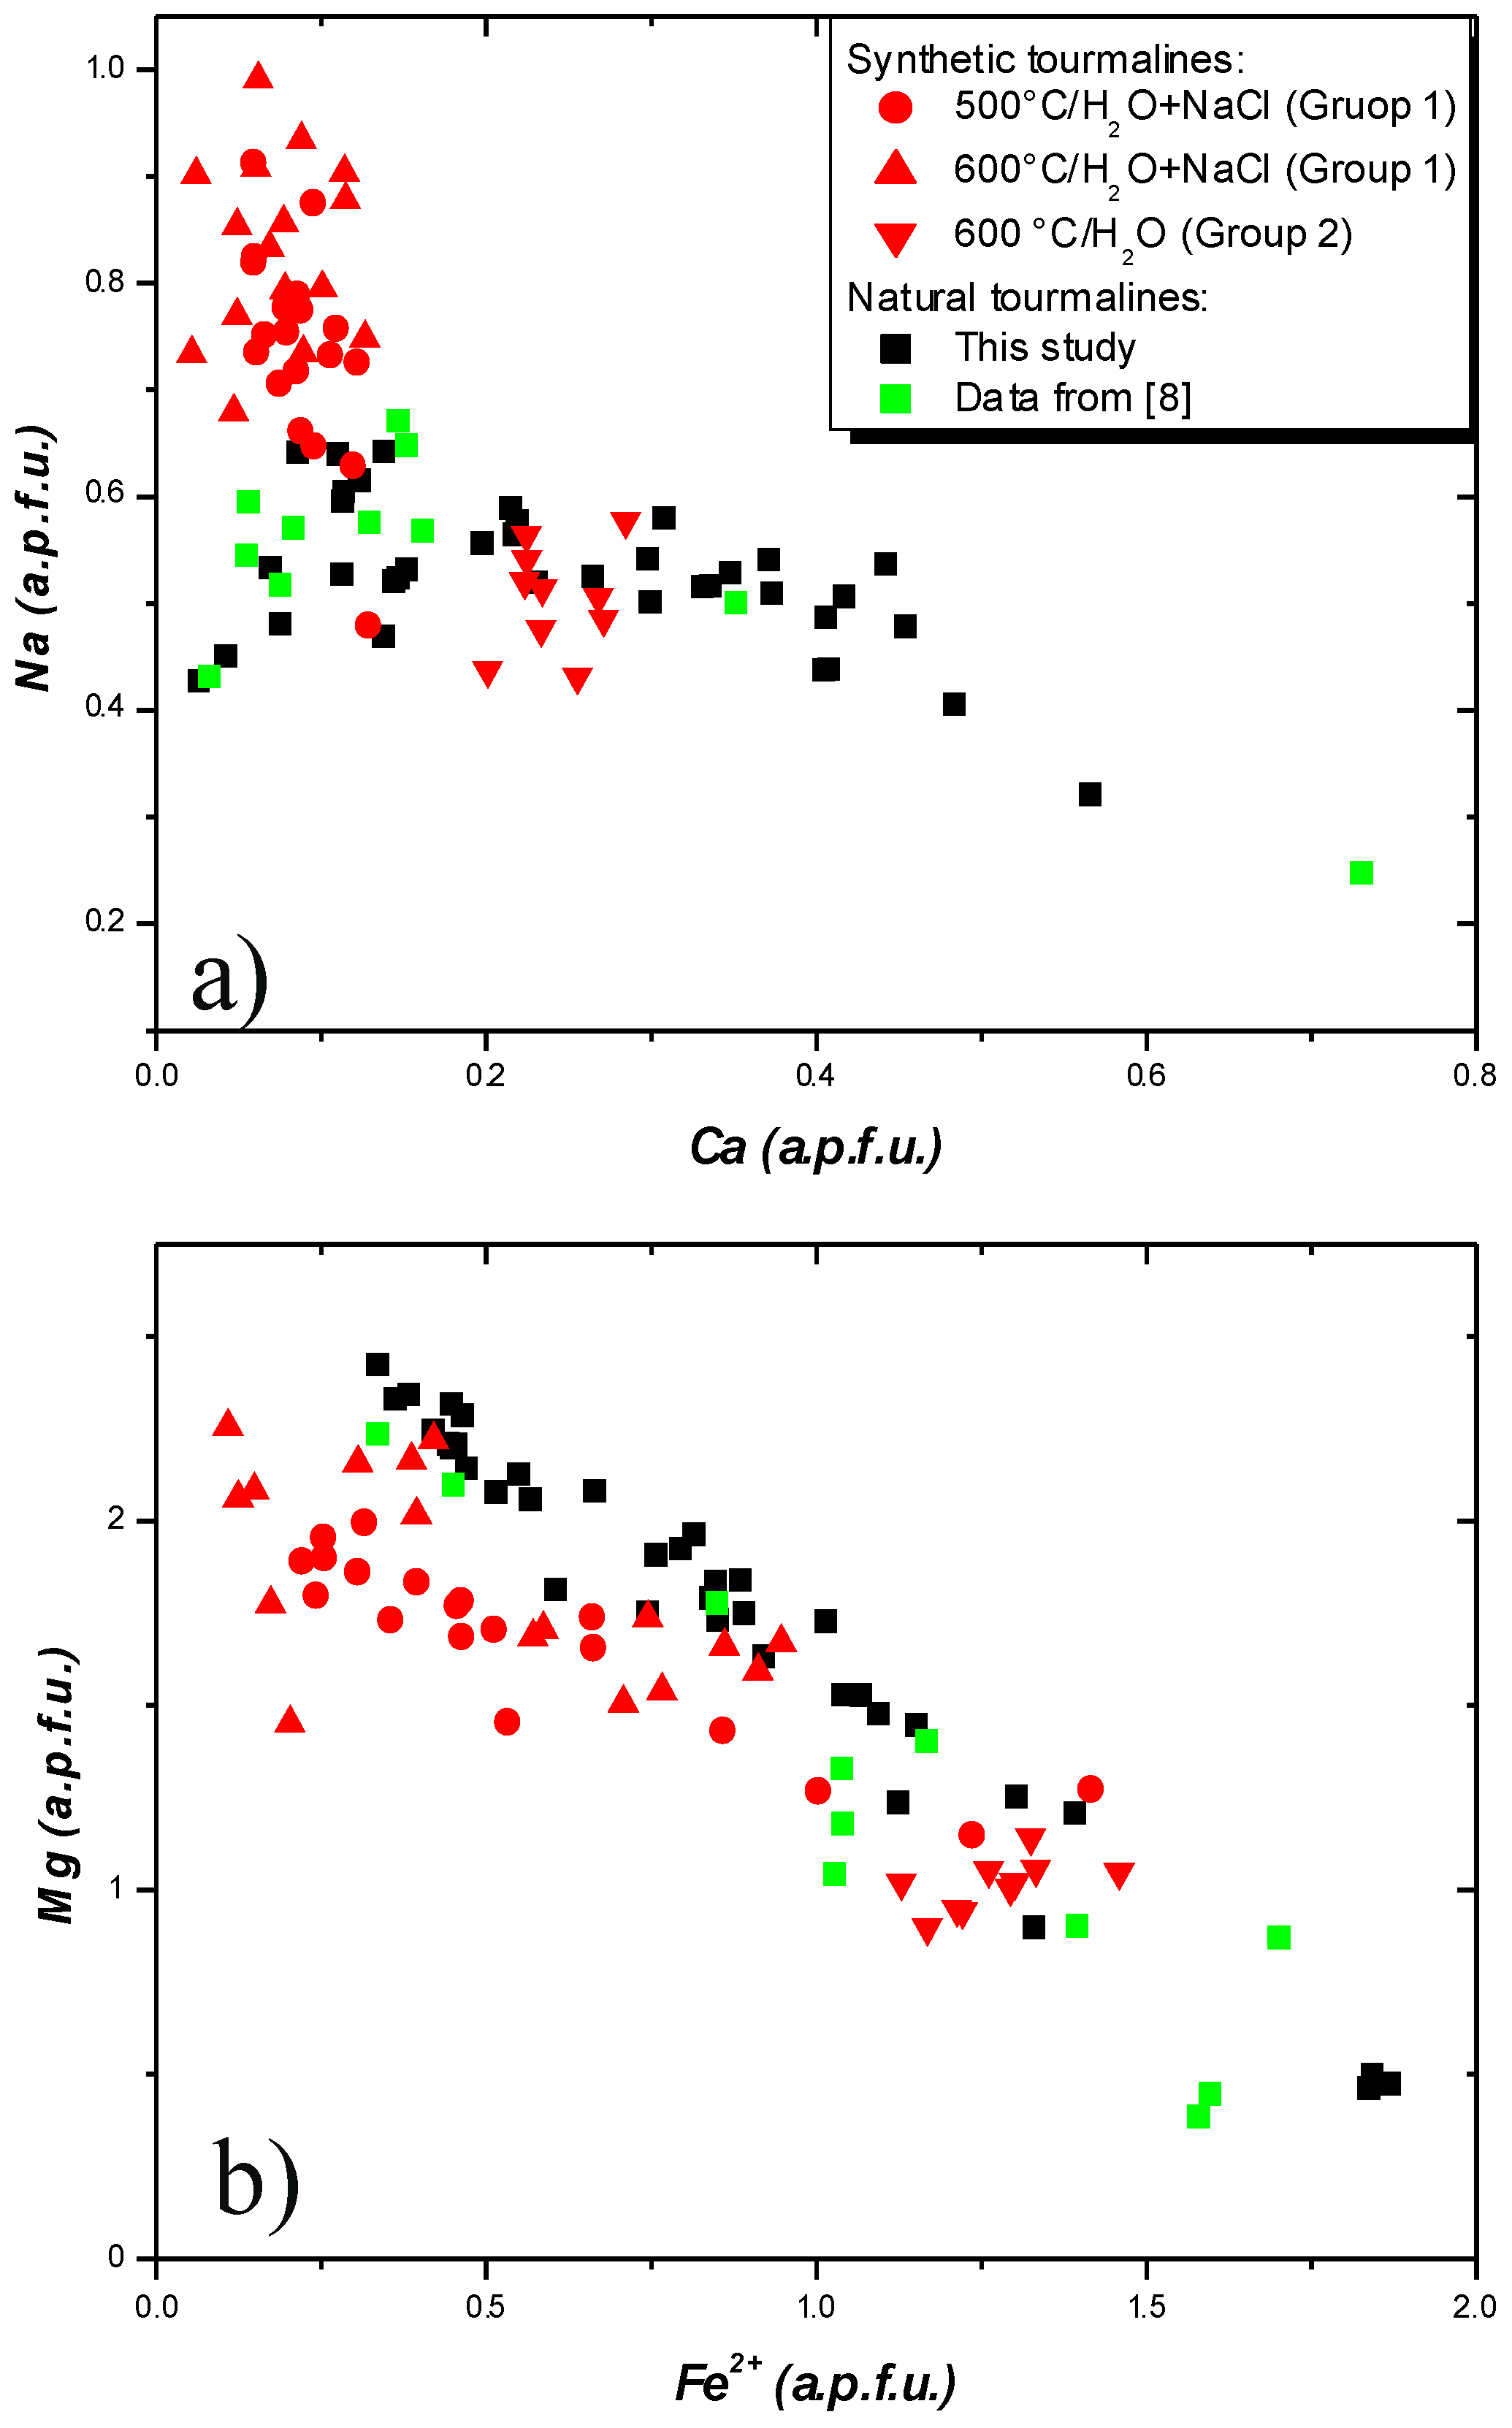
6.2. Synthetic and Natural Tourmalines

A comparison of significant element variations in natural (from this study and from [8]) and synthetic tourmalines is shown in Figure 7. Synthetic crystals were split into crystals formed in saline (H2O-NaCl, 500 and 600 °C: Group 1) and pure water (H2O, 600 °C: Group 2) aqueous environments. Both groups show Na and Ca variability; Group 1 is also characterised by a wide variation of Fe and Mg, whereas in Group 2 Fe and Mg display smaller variations. On the other hand, no significant differences exist among tourmalines of the same group formed at 500 and 600 °C. Compositional changes shown by synthetic tourmalines formed under similar P–T conditions and NaCl concentrations suggest that full equilibrium was not attained during the experiments. Nevertheless, some observations can be made from Figure 7.
In particular, Group 2 tourmalines have Na values largely similar to natural crystals and generally lower than tourmalines from Group 1, whose Na contents are in most cases higher than the contents in natural tourmaline. On the contrary, the Ca values of Group 2 tourmalines are higher than the contents in Group 1; both groups are within the range of natural crystals.
It is also noteworthy that Li was not analysed in either synthetic or natural tourmalines. Consequently, some tourmalines reported here could conceivably shift their composition toward the Li end-member of the alkali group. The presence of Li is compatible with the low sums of Y sites in tourmalines, which is generally lower than the ideal stoichiometric value of 3 (Table 3).
The Fe and Mg contents of Group 2 tourmalines are higher and lower, respectively, than those from Group 1, and partially overlap with the values of natural crystals (Figure 7b). Group 1 tourmalines have lower Fe contents with respect to natural tourmaline at constant Mg contents; this difference can be related to a different composition of the reacting fluid with respect to the fluid exsolved from leucogranitic dykes. In particular, Fe, Mg and Na concentrations in synthetic tourmaline are related to the presence/absence of NaCl in the reacting fluid. Thus, it is plausible that a fluid with a concentration of NaCl lower than 20 wt % will produce tourmaline with a composition similar to the natural ones. In addition, the choice to use only Na as the cation species in the reacting fluid is an oversimplification, since the fluid exsolved from leucogranitic dykes likely contains additional cations such as K and Li.
Experimental observations made by [52] on Fe-free tourmalines synthesised at 300–700 °C and 200 MPa showed that, at a given temperature, the amount of Na in the X-site of tourmaline is related to the Na concentration in the final fluid. The significant difference of the Na contents between Group 1 and 2 tourmalines is in agreement with this result. However, our data do not agree with the linear relations at constant temperatures between the Na contents in final fluid and in tourmaline proposed by [52] (see their Figure 7). This may be related to incomplete attainment of equilibrium conditions in our experiments and/or to the complexity of our chemical systems compared to those studied in [52].
Tourmaline composition varies with changing P–T–X conditions in its host environment e.g., [53]. Our experimental results indicate that initial fluid composition is a crucial parameter in controlling the chemistry of tourmalines, in particular their Fe and Mg contents. According to [54], a variation of the crystallisation temperature of tourmaline could be responsible of schorl–dravite shifting composition. These authors invoke a marked decrease in such a parameter to explain the compositional trend from early dravitic to late schorlitic tourmalines in the San Rafael Sn–Cu lode (SE Peru). In tourmalines from veins and metasomatic bodies within the Mt. Calamita Formation, the compositional evolution of tourmaline from schorl–dravite to dravite compositions observed in zoned crystals and in tourmaline of different generations was interpreted to indicate progressive biotite replacement of the biotite-rich layer [8]. The present results suggest that schorl–dravite compositional variations, beyond being associated with T and/or Fe–Mg changes in the fluid, can also be related to variations in NaCl concentration.
In this view, the evolution of tourmaline toward dravitic composition at Cala Stagnone can be due to an increasing salinity of fluids from which tourmalines crystallised. Fluid inclusion studies on samples from quartz–tourmaline veins at Cala Stagnone [11] disclose the exclusive presence of relatively high-salinity fluids and do not register fluids with low salinity. However, two-phase inclusions in quartz–tourmaline veins are characterised by a rather wide range of salinities (11–29 wt % NaCl equivalent) and complex compositions, showing not only Na as the main cation but also significant amounts of K and Fe in the fluid. This observation agrees with the compositions of fluids recovered in our experiments, in which the NaCl-bearing solution was used as a starting solution (Table 4). Thus, the concomitant increase of salinity (i.e., Cl) and Na/K/Fe relative variations may account for the evolution of tourmaline composition toward dravitic compositions. Moreover, it cannot be ruled out that additional fluid inclusion studies will identify lower salinity fluids that can account for the crystallisation of early tourmaline with more schorlitic composition.

6.3. Implications of Tourmalinisation for the Metallogeny of Eastern Elba Iron Deposits and the Exploration of the Larderello-Travale Geothermal Field

Our experimental results support the epigenetic model for genesis of eastern Elba Fe deposits. Early epigenetic theories [28,29] suggested a direct derivation of Fe and fluids from the Porto Azzurro pluton; however, such Fe origin is unlikely because of the leucogranitic nature (i.e., Fe-poor) of the pluton. Nevertheless, Ref. [30] proposed that Fe (and other elements such as Mg, Mn and K) could have been produced as a consequence of the reaction between biotite-rich xenoliths occurring within the pluton and saline fluids (i.e., connate or metamorphic waters) mobilised after pluton emplacement. In this case, the relatively small amount of xenoliths present in leucogranite is in contrast with the large amount of Fe of Elba Island deposits (>60 million tons of Fe ore extracted from ancient times in the whole of Elba Island [55]). Biotite dissolution with tourmaline formation through Reaction (1) will produce significant Fe mobilisation, as also testified by the elevated Fe contents in solutions resulting from Experiments 6 and 17 coupled with the finding of Fe oxides or amorphous oxyhydroxides in experimental products. Thus, the reaction of B-rich saline fluids of magmatic derivation with the schist of Mt. Calamita Formation, which crop out extensively in the southeastern part of Elba Island (Figure 1), can produce a fluid enriched in Fe and tourmalinisation. The relatively close spatial association between quartz–tourmaline veins and Fe deposits (i.e., Ginevro, Sassi Neri and Calamita) in the Mt. Calamita promontory (Figure 1) supports a direct link between the circulation of B-rich saline fluids and the formation of Fe deposits in this area. Such a reaction might also have supplied the Fe of other iron deposits of eastern Elba: Rio Albano, Rio Marina and Ortano mines (Figure 1). Although the schists of Mt. Calamita Formation do not crop out in the area of these deposits, their presence at a depth below the tectonic complexes hosting the deposits is indicated by geological data (see cross section in Figure 1).
Reaction (1) also produced a significant amount of Mg, which was likely in part enclosed in tourmaline, in particular during the late precipitation of uvite (containing up to 12.08 wt % of MgO) in the quartz–tourmaline veins [8]. Mg can also be transported with iron and could have precipitated in the skarn minerals associated with the iron deposits. Mg-rich minerals, such as pyroxenes and amphiboles, are commonly found, e.g. at Ginevro and Sassi Neri deposits. In particular, early pyroxene and amphibole in these deposits are characterised by salitic and pargasitic composition, respectively [56]. Both deposits are totally enclosed in the schists of Mt. Calamita Formation [57], whereas indications of former carbonate rocks metasomatised during skarn formation, which could have produced Mg and Ca, are not evident. Thus, if Mg (together with Fe) incorporated in skarn silicates was produced by Reaction (1), Ca in the silicates could have been provided by reactions between fluids and plagioclase of the Mt. Calamita schist, similarly to what was indicated by the presence of Ca in the residual fluids and in the tourmaline of the experiments.
The results of this paper also show the important role of Cl as a complexing agent of Fe, thus allowing its transportation in solution. Furthermore, in oxygen-deficient (anoxic) conditions the concentration of Fe in solution can be considerably higher than that measured in more oxidizing conditions [58]; thus, the Fe mobility in solutions circulating in the Mt. Calamita Formation could have been much greater than that envisaged based on these experiments. It must also be noted that other metals besides Fe can be effectively transported as chloride complexes in hot, reducing, relatively acidic and saline solutions [59,60]. For instance, this process could explain the enrichment in Sn and W commonly observed in hematite-rich ores from eastern Elba [61].
Moreover, the B-metasomatic hydrothermal system that formed quartz–tourmaline veins in eastern Elba Island is considered a proxy of the high-temperature system active in the deep portion of the Larderello–Travale geothermal field, where seismic reflectors (bright spots) and an anomalously conductive crust have been detected close to the contact aureoles of Plio–Pleistocene granites [8]. Such a system, imaged by geophysics, would constitute a super-hot reservoir present below the presently exploited Larderello–Travale geothermal reservoirs and constitute a potentially valuable exploration target. Plio–Pleistocene granites under the Larderello–Travale intruded a metamorphic complex similar to that existing in eastern Elba Island [36,62]. Thus, also in the Larderello–Travale the interaction between biotite-bearing rocks and B-rich saline fluids, exsolved from acidic intrusion, caused extensive tourmalinisation, as indicated by the finding of schorl–dravite–ferridravite tourmalines in the deep wells of the Larderello–Travale geothermal field [8,17]. High-temperature tourmaline-bearing assemblages represent a partially exhumed hydrothermal system that has been considered as a fossil analogue of the deeper high-temperature system imaged by geophysics [63]. Fluid inclusion trapping in these assemblages occurred at temperatures up to 650 °C [35]. Thus, the finding of tourmaline-rich rocks during drilling could suggest the approach of the drilling to the super-hot reservoir. Such a reservoir may contain B-rich, saline fluids with a high content of metals (in particular Fe).

7. Conclusions

Experiments show that the formation of tourmaline veins in eastern Elba is compatible with the interaction between a B-bearing fluid (concentration of boric acid ≥1.3 M) with biotite-rich schist from the Mt. Calamita Formation at T = 500–600 °C and P = 100–130 MPa. Tourmaline formation is driven by biotite dissolution; its composition is highly dependent upon the NaCl content of the fluid interacting with the biotite-rich schist. Fe-rich tourmalines (schorl) form if Fe cannot be complexed by Cl in solution, whereas Mg-rich tourmalines (dravite) crystallise if Fe is complexed. Tourmaline crystallisation occurs even if Na is not present in the fluid; in this case, the occurrence of an Na/K exchange between feldspars and fluid allows tourmaline crystallisation and causes the stabilisation of K feldspars.
NaCl concentration in fluid should therefore be an important parameter in controlling the chemistry of tourmaline (e.g., Mg, Fe, Ca, Na contents) found in the Mt. Calamita Formation. Concordantly, Na and Ca occupancies in the X site were considered tracers of fluid composition related to tourmaline crystallisation by [52,64].
Thus, the reaction of B-rich saline fluids of magmatic derivation with the schist of Mt. Calamita Formation, found extensively in the southeastern part of Elba Island (Figure 1), can produce fluid enriched in Fe and tourmalinisation.
An important consequence of the experiments concerns the genesis of Fe deposits found in eastern Elba Island. In fact, high Fe mobilisation resulting from the reaction of saline B-bearing fluids issued from the Porto Azzurro pluton with the biotite-rich schists of Mt. Calamita Formation could have supplied Fe oxides, precipitated from solutions due to a change of physical-chemical (i.e., P-T-oxygen fugacity) conditions.
Similar tourmalinisation processes likely occur within a high-temperature hydrothermal system active in the deepest part of the Larderello–Travale geothermal area. This system represents an important unconventional geothermal resource, and a challenge in the exploration/exploitation of the Larderello–Travale geothermal field.

Acknowledgments

The research leading to these results has received funding from the European Community’s Seventh Framework Program under grant agreement No. 608553 (Project IMAGE, Integrated Methods for Advanced Geothermal Exploration). The authors thank Andrea Dini, who inspired this research. The authors also wish to thank Daniele Borrini (for technical assistance during experiments and SEM investigations), Maurizio Ulivi (for SEM investigations performed at Centro di Servizi di Microscopia Elettronica e Microanalisi—MEMA—of the Università degli Studi di Firenze) and Mario Paolieri (for technical assistance during ICP-OES analysis) of the Università degli Studi di Firenze. The authors would like to thank Pierfranco Lattanzi, Tobias B. Weisenberger and the three anonymous reviewers for their helpful and constructive comments that greatly contributed to improving the final version of the paper.

Author Contributions

Andrea Orlando and Giovanni Ruggieri conceived and designed the experiments and wrote the paper; Andrea Orlando performed the experiments, Giordano Montegrossi performed Rietveld refinements; Laura Chiarantini and Valentina Rimondi analysed and discussed the data.

Conflicts of Interest

The authors declare no conflict of interest.

References

  1. London, D.; Manning, D.A.C. Chemical variation and significance of tourmaline from Southwest England. Econ. Geol. 1995, 90, 495–519. [Google Scholar] [CrossRef]
  2. London, D. Granitic Pegmatites. Geol. Soc. Am. Spec. Pap. 1996, 315, 305–319. [Google Scholar]
  3. London, D. Experimental synthesis and stability of tourmaline: A historical overview. Can. Mineral. 2011, 49, 117–136. [Google Scholar] [CrossRef]
  4. Buriánek, D.; Novák, M. Compositional evolution and substitutions in disseminated and nodular tourmaline from leucocratic granites: Examples from the Bohemian Massif, Czech Republic. Lithos 2007, 95, 148–164. [Google Scholar] [CrossRef]
  5. Slack, J.F.; Trumbull, R.B. Tourmaline as a recorder of ore-forming processes. Elements 2011, 7, 321–326. [Google Scholar] [CrossRef]
  6. Gawęda, A.; Müller, A.; Stein, H.; Kądziołko-Gaweł, M.; Mikulski, S. Age and origin of the tourmaline-rich hydraulic breccias in the Tatra Granite, Western Carpathians. J. Geosci. 2013, 58, 133–148. [Google Scholar] [CrossRef]
  7. London, D. Stability of tourmaline in peraluminous granite systems: The boron cycle from anatexis to hydrothermal aureoles. Eur. J. Mineral. 1999, 11, 253–262. [Google Scholar] [CrossRef]
  8. Dini, A.; Mazzarini, F.; Musumeci, G.; Rocchi, S. Multiple hydro-fracturing by boron-rich fluids in the Late Miocene contact aureole of eastern Elba Island (Tuscany, Italy). Terra Nova 2008, 20, 318–332. [Google Scholar] [CrossRef]
  9. Liotta, D.; Brogi, A.; Meccheri, M.; Dini, A.; Bianco, C.; Ruggieri, G. Coexistence od low-angle normal and high-angle strike- to oblique-slip faults during Late Miocene mineralization in eastern Elba Island (Italy). Tectonophysics 2015, 660, 17–34. [Google Scholar] [CrossRef]
  10. Trevisan, L. L’Elba orientale e la sua tettonica di scivolamento per gravità. Mem. Istituto Geol. Univ. Padova 1950, 16, 1–30. (In Italian) [Google Scholar]
  11. Zucchi, M.; Brogi, M.; Liotta, D.; Rimondi, V.; Ruggieri, G.; Montegrossi, G.; Caggianelli, A.; Dini, A. Permeability and hydraulic conductivity of faulted micaschist in the eastern Elba Island exhumed geo-thermal system (Tyrrhenian Sea, Italy): Insights from Cala Stagnone. Geothermics 2017, 70, 125–145. [Google Scholar] [CrossRef]
  12. Liotta, D.; Brogi, A.; Zucchi, M.; Bianco, C.; Ciacci, M.; Fregola, R.A.; Caggianelli, A.; Friðleifsson, G.Ó.; Hersir, G.P.; Helgadóttir, H.M.; et al. IMAGE Project, Public Deliverables IMAGE-D3.01, 2015. Final Report on: Understanding from Deep Drilling and Exhumed Systems. Available online: http://www.image-fp7.eu/reference-documents/deliverables/IMAGE-D3.01-v2015.10.31-deep%20drilling%20and%20exhumed%20systems-incl-annex%20-%20public.pdf (accessed on 23 August 2017).
  13. Bakker, R.J.; Schilli, S.E. Formation conditions of leucogranite dykes and aplite-pegmatite dykes in the eastern Mt. Capanne plutonic complex (Elba, Italy): Fluid inclusion studies in quartz, tourmaline, andalusite and plagioclase. Mineral. Petrol. 2016, 110, 43–63. [Google Scholar] [CrossRef]
  14. Fuchs, Y.; Lagache, M.; Linares, J. Fe-tourmaline synthesis under different T and fO2 conditions. Am. Mineral. 1998, 83, 525–534. [Google Scholar] [CrossRef]
  15. Van Hinsberg, V.J.; Henry, D.J.; Marschall, H.R. Tourmaline: An ideal indicator of its host environment. Can. Mineral. 2011, 49, 1–16. [Google Scholar] [CrossRef]
  16. Dutrow, B.L.; Henry, D.J. Tourmaline. Elements 2011, 7, 301–306. [Google Scholar] [CrossRef]
  17. Cavarretta, G.; Puxeddu, M. Schorl-dravite-ferridravite tourmalines deposited by hydrothermal magmatic fluids during early evolution of the Larderello geothermal field, Italy. Econ. Geol. 1990, 85, 1236–1251. [Google Scholar] [CrossRef]
  18. Garfagnoli, F.; Menna, F.; Pandeli, E.; Principi, G. The Porto Azzurro Unit (Mt. Calamita Promontory, southeastern Elba Island, Tuscany): Stratigraphic, tectonic and metamorphic evolution. Boll. Soc. Geol. Ital. 2005, 3, 119–138. [Google Scholar]
  19. Mazzarini, F.; Musumeci, G.; Cruden, A.R. Vein development during folding in the upper brittle crust: The case of tourmaline-rich veins of eastern Elba Island, northern Tyrrhenian Sea, Italy. J. Struct. Geol. 2011, 33, 1509–1522. [Google Scholar] [CrossRef]
  20. Musumeci, G.; Mazzarini, F.; Tiepolo, M.; Di Vincenzo, G. U-Pb and 40Ar-39Ar geochronology of Palaeozoic units in the northern Apennines: Determining protolith age and alpine evolution using the Calamita Schist and Ortano Porphyroid. Geol. J. 2011, 46, 288–310. [Google Scholar] [CrossRef]
  21. Maineri, C.; Benvenuti, M.; Costagliola, P.; Dini, A.; Lattanzi, P.; Ruggieri, G.; Villa, I.M. Sericitic alteration at the La Crocetta mine (Elba Island, Italy): Interplay between magmatism, tectonics, and hydrothermal activity. Miner. Depos. 2003, 38, 67–86. [Google Scholar] [CrossRef]
  22. Innocenti, F.; Serri, G.; Manetti, P.; Ferrara, G.; Tonarini, S. Genesis and classification of the rocks of the Tuscan Magmatic Province: Thirty years after Marinelli’s model. Acta Vulcanol. 1992, 2, 247–265. [Google Scholar]
  23. Peccerillo, A. The Tuscany Province. In Cenozoic Volcanism in the Tyrrhenian Sea Region; Springer: Cham, Switzerland, 2017. [Google Scholar]
  24. Mazzarini, F.; Musumeci, G. Hydrofracturing related sill and dyke emplacement at shallow crustal level: The eastern Elba Dyke Complex, Italy. In Structure and Emplacement of High-Level Magmatic Systems; Thomson, K., Petford, N., Eds.; Special Publications; Geological Society: London, UK, 2008; Volume 302, pp. 121–129. [Google Scholar]
  25. Duranti, S.; Palmeri, R.; Pertusati, P.C.; Ricci, C.A. Geological evolution and metamorphic petrology of the basal sequences of Eastern Elba (Complex II). Acta Vulcanol. 1992, 2, 213–229. [Google Scholar]
  26. Principi, G.; Bortolotti, V.; Pandeli, E.; Benvenuti, M.; Fanucci, F.; Chiari, M.; Dini, A.; Fazzuoli, M.; Menna, F.; Moretti, S.; et al. Note Illustrative della Carta Geologica d’Italia alla Scala 1:50.000—2015, Foglio 316, 317, 328, 329 Isola d’Elba; Selca: Firenze, Italy, 2011. [Google Scholar]
  27. Tanelli, G.; Benvenuti, M.; Costagliola, P.; Dini, A.; Lattanzi, P.; Maineri, C.; Mascaro, I.; Ruggieri, G. The iron mineral deposits of Elba Island: State of the art. Ofioliti 2001, 26, 239–248. [Google Scholar]
  28. Savi, P. Sulla miniera di ferro dell’Isola d’Elba. In Nuovo Giornale Letteratura; Nistri: Pisa, Italy, 1836; Volume 31, 45p. [Google Scholar]
  29. Lotti, B. Carta Geologica Dell’isola d’Elba alla Scala 1:25.000; Regio Ufficio Geologico d’Italia: Roma, Italy, 1884. [Google Scholar]
  30. Marinelli, G. II magmatismo recente in Toscana e le sue implicazioni minerogenetiche. Mem. Soc. Geol. Ital. 1983, 25, 111–124. [Google Scholar]
  31. Deschamps, Y.; Dagallier, G.; Macaudière, J.; Marignac, C.; Moine, B.; Saupé, F. Le gisement de pyrite-hématite de ValleGiove (Rio Marina, Ile d’Elbe, Italie). Schweiz. Mineralog. Petrogr. Mitt. 1983, 63, 149–165. [Google Scholar]
  32. Lattanzi, P.; Benvenuti, M.; Costagliola, P.; Tanelli, G. Anoverview on recent research on the metallogeny of Tuscany, with special reference to the Apuane Alps. Mem. Soc. Geol. Ital. 1994, 48, 613–625. [Google Scholar]
  33. Tanelli, G. Mineralizzazioni metallifere e minerogenesi in Toscana. Mem. Soc. Geol. Ital. 1983, 25, 91–109. [Google Scholar]
  34. Rossetti, F.; Tecce, F.; Billi, A.; Brilli, M. Patterns of fluid flow in the contact aureole of the Late Miocene Monte Capanne pluton (Elba Island, Italy): The role of structures and rheology. Contrib. Mineral. Petrol. 2007, 153, 743–760. [Google Scholar] [CrossRef]
  35. Cathelineau, M.; Marignac, C.; Boiron, M.C.; Gianelli, G.; Puxeddu, M. Evidence for Li-rich brines and early magmatic fluid rock interaction in the Larderello geothermal system. Geochim. Cosmochim. Acta 1994, 58, 1083–1099. [Google Scholar] [CrossRef]
  36. Dini, A.; Gianelli, G.; Puxeddu, M.; Ruggieri, G. Origin and evolution of Pliocene–Pleistocene granites from the Larderello geothermal field (Tuscan Magmatic Province, Italy). Lithos 2005, 81, 1–31. [Google Scholar] [CrossRef]
  37. Peretyazhko, I.S.; Prokofev, V.Y.; Zagorskii, V.E.; Smirnov, S.Z. Role of Boric Acids in the Formation of Pegmatite and Hydrothermal Minerals: Petrologic Consequences of Sassolite (H3BO3) Discovery in Fluid Inclusions. Petrol. C/C Petrol. 2000, 8, 214–237. [Google Scholar]
  38. Frondel, C.; Collette, R.L. Synthesis of tourmaline by reaction of mineral grains with NaCl-H3BO3 solution, and its implicatioins in rock metamorphism. Am. Mineral. 1957, 42, 754–758. [Google Scholar]
  39. Lutterotti, L.; Matthies, S.; Wenk, H.R. MAUD: A friendly Java program for material analysis using diffraction. IUCr Newslett. CPD 1999, 21, 14–15. [Google Scholar]
  40. Pouchou, J.L.; Pichoir, F. Quantitative analysis of homogeneous or stratified microvolumes applying the model “PAP”. In Electron Probe Quantitation; Springer: Berlin, Germany, 1991; pp. 31–75. [Google Scholar]
  41. Henry, D.J.; Novák, M.; Hawthorne, F.C.; Ertl, A.; Dutrow, B.L.; Uher, O.; Pezzotta, F. Nomenclature of the tourmaline-super- group minerals. Am. Mineral. 2011, 96, 895–913. [Google Scholar] [CrossRef]
  42. Selway, J.B.; Xiong, J. Tourmaline-Recalculation Software Quoted in Tindle et al. 2002. Available online: http://www.open.ac.uk/earth-research/tindle/ (accessed on 23 August 2017).
  43. Neusser, G.; Abart, R.; Fischer, F.D.; Harlov, D.; Norberg, N. Experimental Na/K exchange between alkali feldspar and NaCl–KCl salt melt: Chemically induced fracturing and element partitioning. Contrib. Mineral. Petrol. 2012, 164, 341–358. [Google Scholar] [CrossRef]
  44. Chae, G.; Yun, S.-T.; Kwon, M.-J.; Kim, Y.-S.; Mayer, B. Batch dissolution of granite and biotite in water: Implication for fluorine geochemistry in groundwater. Geochem. J. 2006, 40, 95–102. [Google Scholar] [CrossRef]
  45. Morgan, G.B.; London, D. Experimental reactions of amphibolite with boron-bearing aqueous fluids at 200 MPa: Implications for tourmaline stability and partial melting in mafic rocks. Contrib. Mineral. Petrol. 1989, 102, 281–297. [Google Scholar] [CrossRef]
  46. Heinrich, C.A.; Seward, T.M. A spectrophotometric study of aqueous iron (II) chloride complexing from 25 to 200 °C. Geochim. Cosmochim. Acta 1990, 54, 2207–2221. [Google Scholar] [CrossRef]
  47. Fein, J.B.; Hemley, J.J.; D’Angelo, W.M.; Komninou, A.; Sverjensky, D.A. Experimental study of iron-chloride complexing in hydrothermal fluids. Geochim. Cosmochim. Acta 1992, 56, 3179–3190. [Google Scholar] [CrossRef]
  48. Ding, K.; Seyfried, W.E., Jr. Determination of Fe-Cl complexing in the low pressure supercritical region (NaCl fluid): Iron solubility constraints on pH of subseafloor hydrothermal fluids. Geochim. Cosmochim. Acta 1992, 56, 3681–3692. [Google Scholar] [CrossRef]
  49. Seward, T.M.; Barnes, H.L. Metal transport by hydrothermal ore fluids. Geochem. Hydrotherm. Ore Depos. 1997, 3, 435–486. [Google Scholar]
  50. Stefánsson, A.; Lemke, K.H.; Seward, T.M. Iron (III) complexation in hydrothermal solutions—An experimental and theoretical study. In Proceedings of the 15th International Conference on the Properties of Water and Steam, Berlin, Germany, 2008; pp. 7–11. [Google Scholar]
  51. Puxeddu, M.; Saupé, F.; Déchomets, R.; Gianelli, G.; Moine, B. Geochemistry and stratigraphic correlations—Application to the investigation of geothermal and mineral resources of Tuscany, Italy. Chem. Geol. 1984, 43, 77–113. [Google Scholar] [CrossRef]
  52. Von Goerne, G.; Franz, G.; Heinrich, W. Synthesis of tourmaline in the system Na2O-MgO-Al2O3-SiO2-B2O3-HCl and the distribution of Na between tourmaline and fluid at 300 to 700 °C and 200 MPa. Contrib. Mineral. Petrol. 2001, 141, 160–173. [Google Scholar] [CrossRef]
  53. Pesquera, A.; Torres-Ruiz, J.; García-Casco, A.; Gil-Crespo, P.P. Evaluating the controls on tourmaline formation in granitic systems: A case study on peraluminous granites from the Central Iberian Zone (CIZ), Western Spain. J. Petrol. 2013, 54, 609–634. [Google Scholar] [CrossRef]
  54. Mlynarczyk, M.S.J.; Williams-Jones, A.E. Zoned tourmaline associated with cassiterite: Implications for fluid evolution and tin mineralization in the San Rafael Sn-Cu deposit, southeastern Peru. Can. Mineral. 2006, 44, 347–365. [Google Scholar] [CrossRef]
  55. Dini, A. Ore deposits, industrial minerals and geothermal resources. Period. Mineral. 2003, 72, 41–52. [Google Scholar]
  56. Dünkel, I. The Genesis of East Elba Iron ore Deposits and Their Interrelation with Messinian Tectonics. Ph.D. Thesis, Institut und Museum für Geologie und Paläontologie der Universität Tübingen, Tübingen, Germany, 2002; 143p. [Google Scholar]
  57. Gillieron, F. Osservazioni sulla geologia dei giacimenti di ferro dell’Elba orientale. L’Ind. Min. 1959, 10, 1–10. (In Italian) [Google Scholar]
  58. Murakami, T.; Ito, J.-I.; Utsunomiya, S.; Kasama, T.; Kozai, N.; Ohnuki, T. Anoxic dissolution processes of biotite: Implications for Fe behavior during Archean weathering. Earth Planet. Sci. Lett. 2004, 224, 117–129. [Google Scholar] [CrossRef]
  59. Eugster, H.P.; Wilson, G.A. Transport and deposition of ore-forming elements in hydrothermal systems associated with granites. In High Heat Production (HHP) Granites, Hydrothermal Circulation and Ore Genesis; Halls, C., Ed.; Institution of Mining and Metallurgy: London, UK, 1985; pp. 87–98. [Google Scholar]
  60. Müller, B.; Seward, T.M. Spectrophotometric determination of the stability of tin (II) chloride complexes in aqueous solution up to 300 °C. Geochim. Cosmochim. Acta 2001, 65, 4187–4199. [Google Scholar] [CrossRef]
  61. Benvenuti, M.; Dini, A.; D’Orazio, M.; Chiarantini, L.; Corretti, A.; Costagliola, P. The tungsten and tin signature of iron ores from Elba Island (Italy): A tool for provenance studies of iron production in the mediterranean region. Archaeometry 2013, 55, 479–506. [Google Scholar] [CrossRef]
  62. Bertini, G.; Casini, M.; Gianelli, G.; Pandeli, E. Geological structure of a long-living geothermal system, Larderello, Italy. Terra Nova 2006, 18, 163–169. [Google Scholar] [CrossRef]
  63. Dini, A.; Brogi, A.; Liotta, D.; Rimondi, V.; Ruggieri, G.; Zucchi, M. The Eastern Elba Island Magmatic-Hydrothermal Complex: A Proxy for the Supercritical Roots of Larderello Geothermal System (Italy). In Proceedings of the Goldschmidt 2016, Yokohama, Japan, 26 June–1 July 2016; Volume 580. [Google Scholar]
  64. Von Goerne, G.; Franz, G.; van Hinsberg, V.J. Experimental determination of Na–Ca distribution between tourmaline and fluid in the system CaO–Na2O–MgO–Al2O3–SiO2–B2O3–H2O. Can. Mineral. 2011, 49, 137–152. [Google Scholar] [CrossRef]
Figure 1. Schematic geological map of Elba Island (after [9]). Geological units are grouped ad described as five “complexes” following [10]. Natural tourmalines analysed in this manuscript (see Table 2) come from Cala Stagnone (black box).
Minerals 07 00155 g001
Figure 2. Tourmaline (tur)–quartz (qtz) vein cutting across leucogranitic dykes at mesoscopic (a) and microscopic (b) scale at Cala Stagnone (Elba Island, Italy). Secondary Electrons (SE) image of acicular tourmaline crystals found at Cala Stagnone (c).
Minerals 07 00155 g002
Figure 3. SE images of tourmalines synthesised in Experiment 8 (a); Experiment 5 (b); and Experiment 4 (c).
Minerals 07 00155 g003
Figure 4. Backscattered electron (BSE) image showing neo-formed magnetite (white) associated with biotite, plagioclase and tourmaline (Experiment 6).
Minerals 07 00155 g004
Figure 5. BSE image showing neo-formed K feldspar surrounding an albite relict from the starting material (Experiment 8).
Minerals 07 00155 g005
Figure 6. Mg/(Mg + Fetot) in the biotites from the starting material and relative values in synthesised tourmalines and fluids recovered from capsules using H2O and H2O + NaCl starting solutions.
Minerals 07 00155 g006
Figure 7. Ca vs. Na (a) and Fe vs. Mg (b) contents in synthetic and natural tourmalines. The former are distinguished on the basis of fluid salinity used in experiments. The latter include both analyses of this study and data from the literature [8].
Minerals 07 00155 g007
Table 1. Representative biotite (mica) and plagioclase (plag) analyses (wt %) in the rock selected as starting material, bdl = below detection limit, calc = calculated, Mg# = Mg/(Mg + Fe2+).
SampleGN1BGN1BGN1BGN1BGN1BGN1BGN1BGN1BGN1BSampleGN1BGN1BGN1BGN1B
PhasebiotitebiotitebiotitebiotitebiotitebiotitebiotitebiotitebiotitePhaseplagioclaseplagioclaseplagioclaseplagioclase
SiO233.3932.7033.1932.9133.3333.4232.8733.3732.79SiO264.7366.8266.9066.43
TiO23.022.693.143.312.753.373.492.930.71TiO20.030.06bdl0.23
Al2O319.7419.8819.4518.9319.7019.1919.0319.8021.16Al2O318.7919.1019.8219.21
Cr2O30.490.310.240.180.230.580.070.350.18Cr2O30.420.920.25bdl
FeO23.8023.9723.4924.1522.5022.9024.2623.2422.49FeO0.780.750.870.17
MnO0.700.961.150.640.960.681.100.910.84MnO1.400.780.940.70
MgO5.735.976.126.066.906.655.846.706.87MgObdlbdl0.090.02
CaObdl0.07bdlbdl0.20bdl0.01bdlbdlCaO0.450.440.870.39
Na2O0.130.180.310.200.200.140.290.230.22Na2O12.1611.6911.5911.49
K2O9.569.329.5110.1910.1010.4210.049.6210.37K2O0.130.210.050.37
sum96.5596.0596.6096.5796.8697.3596.9997.1795.62sum98.89100.76101.3899.01
Cations per 22 OCations per 8 O
Si5.1705.1045.1465.1365.1395.1435.1165.1295.121Si2.9422.9652.9392.972
IVAl2.8302.8962.8542.8642.8612.8572.8842.8712.879Al1.0070.9991.0261.013
Fe3+0.0330.0310.0360.007
sum8.0008.0008.0008.0008.0008.0008.0008.0008.000sum3.9813.9954.0003.992
VIAl0.7720.7610.6990.6180.7180.6220.6070.7151.015
Ti0.3520.3160.3660.3890.3190.3910.4080.3390.083Ca0.0220.0210.0410.019
Fe2+3.0853.1313.0483.1542.9042.9503.1602.9892.940Na1.0721.0060.9870.996
Mn0.0920.1270.1510.0840.1250.0880.1450.1190.111K0.0080.0120.0030.021
Mg1.3231.3911.4151.4101.5871.5251.3561.5351.600sum1.1011.0391.0301.036
Cr0.0600.0380.0300.0230.0290.0710.0090.0420.022
sum5.6835.7645.7095.6785.6835.6475.6845.7405.772sum cations5.0835.0335.0305.028
Ca0.0000.0120.0000.0000.0320.0000.0010.0000.000End-members (mol %)
Na0.0400.0540.0940.0620.0600.0420.0860.0700.066anorthite2.02.04.01.8
K1.8891.8571.8812.0281.9872.0461.9931.8872.066albite97.396.895.896.2
sum1.9291.9231.9752.0902.0792.0882.0811.9572.132orthoclase0.71.20.32.1
sum cations15.61215.68815.68415.76815.76215.73515.76615.69715.904
Mg #0.300.310.320.310.350.340.300.340.35
H2O calc3.883.853.873.843.893.913.853.913.84
sum calc100.499.9100.5100.4100.8101.3100.8101.199.5
Table 2. List of experiments with related details. All experiments lasted 168 h. GN1B = rock, GN1B sep. = biotite-enriched separate (see text), H2O-NaCl = aqueous solution (20 wt % NaCl). Tourmaline was detected in experimental products through either XRD and/or SEM. Tourmaline of some selected experiments were analysed through EMPA (XMg = Mg/(Mg + Fe2+)). The results of Rietveld refinements (phase wt %) on some selected experiments are also reported, in brackets phase wt % in the starting material.
Experiment2456891011151617181920
Starting Material
Rock/sep.GN1B sep.GN1B sep.GN1B sep.GN1B sep.GN1BGN1BGN1BGN1BGN1B sep.GN1B sep.GN1B sep.GN1B sep.GN1BGN1B sep.
FluidH2O-NaClH2O-NaClH2O-NaClH2O-NaClH2OH2OH2O-NaClH2O-NaClH2O-NaClH2O-NaClH2O-NaClH2O-NaClH2OH2O
Rock/sep. (g)0.03110.02750.04080.31640.04210.05230.05390.04860.02760.0310.32840.04510.04860.2504
Fluid (g)0.07860.03940.05140.65930.08310.08390.08360.08540.04040.07590.64870.09190.08670.5215
H3BO3 (g)0.00780.00550.01020.07910.01140.00050.00010.00050.000020.00730.06570.01340.01150.0626
H3BO3 (M)1.62.33.21.92.20.10.010.10.011.61.62.42.11.9
Solid/Fluid0.50.81.00.60.60.60.60.60.70.50.60.60.70.6
P-T Conditions
T (°C)500500500600600600600600600500500600600500
P (MPa)130130130100100100100100100100100100100100
Note long capsule long capsule long capsule
Results
tourmalineyesyesyesyesyesnonononoyesyesyesyesyes
XMg0.63–0.900.71–0.880.68–0.850.66–0.880.44–0.45 0.73–0.740.64–0.950.42–0.47
Rietveld Refinement (wt %)
biotite 22 (47)3 (27) 15 (47) 21 (47)
plagioclase 49 (44)29 (41) 59 (44) 47 (44)
tourmaline 2543 20 29
K-feldspar 217 5
quartz 2 (4)8 (25) 1 (4) 4 (4)
Table 3. Representative EMP analyses of both synthetic and natural tourmalines. The formulas of tourmaline were calculated on the basis of 31 anions using the Excel spreadsheet of [36], where B2O3, H2O and Li2O are calculated by stoichiometry, assuming B = 3 apfu, OH + F = 4 apfu. Classification according to [42]; bdl = below detection limit.
Synthetic TourmalinesNatural Tourmalines (Cala Stagnone)
SampleExp2Exp2Exp2Exp2Exp2Exp4Exp4Exp5Exp6Exp6Exp18Exp8Exp8Exp19Exp19Exp19Exp19Exp19F1ST1AF2ST3AF2ST3AF2ST3AF1ST4CF1ST4C
Label6111618191619177131410234581412345
FluidH2O-NaClH2O-NaClH2O-NaClH2O-NaClH2O-NaClH2O-NaClH2O-NaClH2O-NaClH2O-NaClH2O-NaClH2O-NaClH2OH2OH2OH2OH2OH2OH2O
SiO235.5435.7535.4435.1034.5237.1435.6834.8634.2832.4931.4933.7235.0732.8734.7033.3835.9732.8236.1036.0135.0435.5636.0035.68
TiO20.390.480.500.410.560.410.430.941.321.061.160.650.870.720.720.810.620.490.770.260.980.421.810.63
Al2O334.6635.5134.8934.7634.4934.0235.2732.2333.5133.9835.8833.9133.9534.0433.5536.3734.2035.4229.7831.2832.1834.6328.2832.29
Cr2O30.02bdl0.160.31bdl0.070.050.090.090.020.06bdl0.140.10bdlbdlbdl0.020.180.540.340.190.210.65
FeO3.721.873.332.304.771.781.868.713.056.715.009.229.159.118.698.178.888.223.255.919.3613.467.475.40
MnO0.080.040.03bdl0.07bdl0.090.04bdlbdl0.110.03bdl0.100.080.060.03bdl0.520.600.510.430.560.49
MgO6.978.107.288.177.077.417.824.559.046.645.974.064.293.973.764.143.893.5410.707.995.052.058.027.14
CaO0.420.550.450.370.600.480.500.710.510.380.481.481.271.561.511.321.331.402.320.780.640.431.881.12
Na2O2.222.062.462.372.292.282.091.462.302.552.851.551.691.751.491.601.501.311.382.011.871.521.601.74
K2Obdl0.030.070.10bdl0.18bdl0.070.030.07bdlbdlbdl0.31bdl0.070.660.40bdl0.07bdlbdlbdl0.29
Sum84.0184.4084.6083.8984.3783.7683.8083.6784.1383.8982.9984.6286.4384.5384.4985.9487.0883.6384.9985.4685.9688.6985.8285.43
H2O *3.63.73.73.73.63.73.73.53.63.63.53.63.63.53.63.63.73.53.73.63.63.73.63.6
B2O3 *10.610.710.610.610.510.710.710.310.510.310.310.310.510.210.310.510.610.210.610.510.410.610.410.6
Total98.2498.8498.9298.1598.5298.1298.1497.4698.3297.7496.8098.48100.6298.3098.40100.09101.3897.4099.2299.63100.00102.9899.8799.63
Structural formula based on 31 anions (O, OH, F) and 3 B
Si5.845.795.795.755.706.055.825.915.655.495.335.695.785.585.835.515.885.585.935.945.835.825.995.87
Al0.160.210.210.250.300.000.180.090.350.510.670.310.220.420.170.490.120.420.070.060.170.180.010.13
sum T6.006.006.006.006.006.056.006.006.006.006.006.006.006.006.006.006.006.006.006.006.006.006.006.00
Al6.006.006.006.006.006.006.006.006.006.006.006.006.006.006.006.006.006.005.706.006.006.005.546.00
Mg0.000.000.000.000.000.000.000.000.000.000.000.000.000.000.000.000.000.000.300.000.000.000.460.00
sum Z6.006.006.006.006.006.006.006.006.006.006.006.006.006.006.006.006.006.006.006.006.006.006.006.00
Al0.550.570.500.470.420.530.590.350.150.250.490.430.370.390.480.590.470.670.000.020.150.490.000.14
Ti0.050.060.060.050.070.050.050.120.160.130.150.080.110.090.090.100.080.060.090.030.120.050.230.08
Cr0.000.000.020.040.000.010.010.010.010.000.010.000.020.010.000.000.000.000.020.070.040.020.030.08
Mg1.711.961.772.001.741.801.901.152.221.671.511.021.051.000.941.020.950.902.321.961.250.501.531.75
Mn0.010.010.000.000.010.000.010.010.000.000.020.000.000.010.010.010.000.000.070.080.070.060.080.07
Fe2+0.510.250.450.320.660.240.251.240.420.950.711.301.261.291.221.131.211.170.450.811.301.841.040.74
sum Y2.832.842.812.872.902.632.822.872.973.002.882.842.812.812.742.852.712.802.952.992.952.972.902.87
Ca0.070.100.080.070.110.080.090.130.090.070.090.270.220.280.270.230.230.260.410.140.110.070.340.20
Na0.710.650.780.750.730.720.660.480.730.830.930.510.540.580.490.510.480.430.440.640.600.480.520.56
K0.000.010.010.020.000.040.000.020.010.010.000.000.000.070.000.010.140.090.000.010.000.000.000.06
sum X0.780.750.870.840.840.840.750.620.830.921.020.770.770.930.760.760.850.770.850.790.720.560.850.81
Classif.DraviteDraviteDraviteDraviteDraviteDraviteDraviteSchorlDraviteDraviteDraviteSchorlSchorlSchorlSchorlSchorlSchorlSchorlDraviteDraviteSchorlSchorlDraviteDravite
Table 4. Analyses of fluid (by ICP and LC) recovered after the experiments; na = not analysed, bdl = below detection limit. Starting fluid composition is also indicated for saline solutions (H2O-NaCl).
Experiment61720
T (°C)600500500
P (MPa)100100100
FluidH2O-NaClH2O-NaClH2O
Values in μg/g
ICP
Na57,44664,636bdl
Li1318519
K11,4396438529
Mg1858104
Ca22932685
Fe17862709312
Mn2371641.9
Sina2741994
Nina1.7na
LC
Cl109,368119,527479
F12077128
SO49544295
NO3bdl1739
NH4bdl2852
Starting Fluid Composition (LC)
Na (LC)87,856bdl
Cl (LC)128,872bdl
Li (ICP)28bdl
K (ICP)281bdl

