Article

Bioelectrochemical Changes during the Early Stages of Chalcopyrite Interaction with Acidithiobacillus Thiooxidans and Leptospirillum sp.

by
Irene López-Cázares
1,
O. Araceli Patrón-Soberano
2 and
J. Viridiana García-Meza
1,*
1
Geomicrobiología, Facultad de Ingeniería-Metalurgia, UASLP Unidad de Posgrado e Investigación, Sierra Leona 550, Lomas 2°, San Luis Potosí 78210, Mexico
2
División de Biología Molecular, Instituto Potosino de Investigación Científica y Tecnológica (IPICyT), Camino a la Presa San José 2055, Lomas 4°, San Luis Potosí 78216, Mexico
*
Author to whom correspondence should be addressed.
Minerals 2017, 7(9), 156; https://doi.org/10.3390/min7090156
Submission received: 21 July 2017 / Revised: 19 August 2017 / Accepted: 21 August 2017 / Published: 28 August 2017

Abstract

:
A bioelectrochemical study of charge transfer in the biofilm–chalcopyrite interface was performed to investigate the effect of surficial reduced sulfur species (RSS), in the form of non-stochiometric compounds or polysulfides (Sn2−) and elemental sulfur (S0) on a biofilm structure, during the earliest stages (1, 12 and 24 h) of chalcopyrite biooxidation by Acidithiobacillus thiooxidans alone and adding Leptospirillum sp. The surface of massive chalcopyrite electrodes was exposed to the bacteria, which were analyzed electrochemically, spectroscopically, and microscopically. At the studied earlier times, charge transfer and significant differences in the biofilm structure were detected, depending on the presence of Leptospirillum sp. acting on A. thiooxidans biofilms. Such differences were a consequence of a continuous chalcopyrite pitting and promoting changes in biofilm hydrophobicity. A. thiooxidans modifies the reactive properties of RSS and favors an acidic dissolution, which shifts into ferric dissolution when Leptospirillum sp. is present. A. thiooxidans allows H+ and Fe3+ diffusion, and Leptospirillum sp. enables to surpass the charge transfer (reactivity) barrier between the mineral interface and the ions. The observed changes of hydrophobicity on the interface are associated to ions and electrons activity and transfer. Finally, a model of S0 biooxidation by A. thiooxidans alone or with Leptospirillum sp. is proposed.

1. Introduction

Chalcopyrite (CuFeS2) is the most important source of copper in the world. For this reason, this Cu sulfide is intensively studied to gain fundamental knowledge for improving copper extraction. Bioleaching is a growing technology to recover Cu during chalcopyrite dissolution; thus, the fate of chalcopyrite oxidation depends on enhanced biooxidation, which is determined by the evolution of the mineral and by the interaction of chemolithoautotroph microorganisms (i.e., Acidithiobacillus thiooxidans, A. ferrooxidans). Most studies have focused on analyzing biooxidation processes at long time intervals (>120 h), even though initial stages are a key factor at determining the evolution of biooxidation processes.
According to Crundwell [1], the slow rate of chalcopyrite dissolution is explained by its electronic structure as a semiconductor. The electrochemical oxidizing mechanism of chalcopyrite implies that mineral dissolution is a surficial phenomenon, where anodic and cathodic reactions occur simultaneously at the whole mineral surface. Thus, charge transfer between the mineral surface and ferric ions (Fe3+) in the solution determines the rate of mineral dissolution of both chemical and bacterial oxidation [2]. This gives rise to multiple phenomena, by which chalcopyrite is further oxidized by bioleaching microorganisms that enhance H+ and Fe2+/Fe3+ availability. Consequently, charge transfer and other simultaneous phenomena must be carefully analyzed on the biofilm–mineral–electrolyte interface during the first stages of the biooxidation process. Bevilaqua et al. [3] have used cyclic voltammetry (CV), chronoamperometry (CA), electrochemical noise (EN), and electrochemical impedance spectroscopy (EIS) to extensively analyze the surface properties to better describe the electrochemical behavior of biofilm–mineral interfaces. Since diverse secondary compounds appear on mineral surfaces and interact with biofilm-forming bacteria, the use of electrochemical techniques together with surface analysis techniques, such as scanning electronic microscopy (SEM) and confocal laser scanning microscopy (CLSM), yield information about the structure of such interfaces, as well as about the mechanisms of electrochemical reactions.
It is currently accepted that bacteria attachment to the surface influences the rate of dissolution of a mineral, since complex surface phenomena occur (mixed potential decreases, kinetics, and mass-transport phenomena) [2]; these changes also influence the structural characteristics of the formed biofilms on the surface, mainly the composition of the extracellular polymeric substances (EPS) of the matrix wherein microorganisms are embedded. García-Meza et al. [4] suggested a strong correlation between surface speciation (reactivity of Sn2−, S0, CuS), hydrophobic domains in EPS, and biofilm thickness during chalcopyrite biooxidation by the sulfur-oxidizing microorganism (SOM) A. thiooxidans. Meanwhile, Florian et al. [5] discussed how biofilms contribute to change the surficial properties through enhancing the microbiological activity and mineral dissolution, which is more significant if iron-oxidizing microorganisms (IOM; Leptospirillum spp.) are present in mixed biofilms. Also, it has been suggested that reduced sulfur species (RSS) formed during bioleaching influence the availability of Fe, and consequently, bioleaching rates [6]. However, a comprehensive assessment of surface processes produced by incipient A. thiooxidans and Leptospirillum sp. attachment is still needed.
The aim of this work is to account for the relationships between chalcopyrite biooxidation and complex-surface processes taking place at the biofilm–mineral interface during chalcopyrite biooxidation, first only with the SOM A. thiooxidans and then adding Leptospirillum sp. (SOM+IOM) during the first stages (1, 12 and 24 h) of the bacteria–mineral interaction. A combined methodology was used to obtain closer details to describe complex biofilms, utilizing electrochemical (CV, CA, EN, and EIS), spectroscopic (Raman), and microscopic (SEM and CLSM) techniques. The present study could contribute to better understanding the initial stages of chalcopyrite biooxidation by mixed SOM+IOM and its relationship with surface properties (reactivity, secondary compounds, dissolution), thus, favoring strategies for enhanced chalcopyrite dissolution for larger times of bioleaching.

2. Materials and Methods

2.1. Analysis and Obtainment of RSS on Chalcopyrite

Chalcopyrite samples were acquired from San Luis Potosí (Mexico). The samples were selected as high-purity crystals. Mineral identity, composition and purity were verified by X-ray diffraction patterns (XRD Rigaku 22002, θ = 0.02°, 10° to 90°, Cu-Kα radiation), and SEM coupled to energy dispersive X-ray spectroscopy, SEM-EDS (Philips XL-30, Amsterdam, The Netherlands); accordingly, the mineral sample comprised: 99.6 wt % chalcopyrite, 0.2 wt % pyrite (FeS2) and 0.2 wt % quartz (SiO2).
The selected chalcopyrite crystals were used to construct massive chalcopyrite electrodes (MCE). We used MCE instead of carbon-chalcopyrite paste electrodes to analyze the same surface electrochemically, spectroscopically, and microscopically, and to avoid the capacitive contribution of carbon paste.
The MCE were potentiostatically modified, as indicated previously [4] (Appendix A), using a potentiostat (EPSILON BASi 2.10.73). The electrochemical oxidation of MCE surfaces facilitates a rapid, significant and quasi-homogeneous generation of RSS (Sn2−/S0) to sustain metabolic activity of A. thiooxidans. The RSS were generated by applying an anodic pulse (Ean) from 0.36 to 1.015 V vs. SHE (the standard hydrogen electrode). The occurrence of RSS was verified by Raman spectroscopy for each electrochemically modified MCE (referred as MCE* surface throughout the text). Since RSS change the mineral reactivity, a different Sn2−-to-S0 ratio was obtained on each specific MCE* surface. On the first one, a Sn2− surface enrichment (MCE*-Sn2−) was observed, whereas on the second one, mainly S0 (MCE*-S0) was detected. This is important considering that the formation of RSS comprises several stages, including mainly Sn2− and S0, in which different responses of bacterial attachment are expected. Thus, the proportion of such RSS as well as of EPS modifies the hydrophobicity of the initial biofilm–mineral interface.

2.2. Biofilm Formation

The strain A. thiooxidans ATCC-19377 (SOM) was aerobically cultured in an ATCC-125 (M1) medium (pH 2.0), which contained per one litter of distilled water: 0.4 g of (NH4)2SO4, 0.5 g of MgSO4·7H2O, 0.25 g of CaCl2, 3 g of KH2PO4, 0.005 g of FeSO4·7H2O, and 5 g of S0 (Baker); the pH was fixed at 2.0 with concentrated H2SO4. A wild strain of Leptospirillum sp. was aerobically cultured in an ATCC-882, M2) medium, which in turn contained the following salts per one litter of distilled water: 0.132 g of (NH4)2SO4, 0.5 g of MgCl·6H2O, 0.027 g of KH2PO4, 0.147 g of CaCl2·2H2O, and 20 g of FeSO4·7H2O; the pH was also fixed at 2.0 with concentrated H2SO4. The mixed SOM+IOM culture of A. thiooxidans and Leptospirillum sp. was made by adding SOM and IOM biomass in a ratio of 1:1, aerobically cultured in a previously mixed medium (1:1, M1:M2), to set a 1:10 cells:medium ratio. All cultures were aerobically incubated at 30 °C under orbital agitation (120 rpm).
The biotic experiments were carried out using separately MCE*-Sn2− or MCE*-S0 surfaces, which were settled inside an Erlenmeyer flask with 50 mL of M1 or M1 + M2 inoculated with ca. 3 × 10⁷ cells/mL of SOM or SOM+IOM, respectively. All the cultures were incubated at 30 °C and 120 rpm during 1, 12 and 24 h. All the experiments were performed in triplicate; abiotic controls were also carried out in triplicate to compare between chemical and biological oxidation of Sn2− or S0. Immediately afterwards, the biooxidized MCE*-RSS (MCE*-Sn2− and MCE*-S0) surfaces were dried with direct nitrogen current for spectroscopic and microscopic analyses.

2.3. Electrochemical Assessment of the MCE*-RSS Reactivity

Mineral reactivity is a measure of oxidation capacity, which can be used to assess variations of this parameter caused by external perturbations, such as secondary compounds emerging as well as the dissolution of passive phases; these parameters can be systematically studied using cyclic voltammetry. Accordingly, these analyses were performed using a potentiostat (PAR VersaSTAT 3F). For all the electrochemical analyses, the MCE*-RSS (MCE*-Sn2− or MCE*-S0) was used as working electrode, a saturated Hg/Hg2SO4 (0.615 V vs. SHE) as a reference, and a graphite rod (Alfa Aesar, Haverhill, MA, USA, 99.9995% purity) as counter electrode; the specific culture medium for SOM (M1) or SOM+IOM (M1-M2) was used as electrolyte. Immediately before (0 h) and 1, 12 and 24 h after the MCE*-RSS (bio)oxidation assays, the surficial reactivity was assessed using positive-going scans at 20 mV/s.
Electrochemical potential noise (EPN) and electrochemical current noise (ECN) analyses were also acquired for a complete description of the MCE*-RSS surface reactivity, using a zero-resistance amperemeter (ZRA) and an acquisition rate of 1024 points. These analyses were performed assuming that no-aliasing effects were produced by the electrochemical system itself (i.e., parasitic noise due to electrical devices). Therefore, the obtained EPN and ECN were used as an indirect approach to elucidate the global oxidation behavior on surficial RSS after chemical and biological MCE treatment. For the EPN analyses, the electrolyte was maintained under orbital agitation at 120 rpm. The data analysis was carried out with MATLAB software.
An electrochemical impedance spectroscopy (EIS) analysis was also performed to describe further bacteria and chalcopyrite interactions using a FRA Z module coupled to a PAR VersaSTAT 3F potentiostat.
Before each EIS analysis, the stabilization time of open circuit potential (OCP) was taken, and EIS OCP vs. time measurements were made at seven points per decade and using a range of frequency from 10 kHz to 1 mHz, respectively. To fit the experimental data, equivalent electric circuits (cee) were proposed.
Finally, the diffusivity coefficients of H+, Fe2+ and Fe3+ (DH+, DFe2+ and DFe3+) (Equation (1)) were calculated according to He et al. [7] and Jin et al. [8]:
D = R T n 2 F 2 A 2 [ 1 D 0 x 1 2 C ° o x + 1 D r e d 1 2 C ° r e d ]
where, R: The gas constant; n: Number of transferred electrons; F: Faraday constant; A: Electroactive area (m2); C: Bulk concentration of diffusing species (mol/m3).

2.4. Surficial Analyses after the Biooxidation of MCE*-RSS

The electrodes MCE*-Sn2− and MCE*-S0 were analyzed using Raman spectroscopy and SEM-EDS. Also, environmental scanning electron microscopy (ESEM) was conducted with a FEI Quanta 200. Previously, the biooxidized MCE*-RSS surfaces were fixed with a volume of 3% v/v glutaraldehyde at 4 °C; then, the biofilms were rinsed three times with a phosphate buffer solution (pH 7.2), dehydrated in 30%, 50%, 70%, and 100% ethanol, and critical-CO2 dried in a Samdri-PVT-3D (Tousimis, Maryland, USA). The dry samples were mounted and coated with gold particles with a Cressington sputter (108 auto).
Forming biofilms on MCE* surfaces were comprised of an organic fraction (cells and EPS) and an inorganic fraction of the Sn2− and S0, previously electrogenerated (S1). The proportion of these fractions modifies the hydrophobicity of the initial biofilm–mineral interface. Thus, the biooxidized MCE* surfaces were stained to analyze their hydrophobicity by means of confocal laser scanning microscopy (CLSM; Leica DMI4000B, Wetzlar, Germany, with argon laser and 63× immersion objective). This analysis was done with an apochromatic plan 20× on a surface of 3.4 × 10⁻⁵ μm2, after the micrographics were 3D reconstructed with LAS AF 2.4.1-version software. The images were generated from the 3D reconstruction at a same angle of a stack in the Z direction (depth 153 μm).
For the exopolysaccharides (α-mannose and α-glucose), the lectin Canavalia ensiformis (Con-A, tetramethylrhodamine conjugated; Molecular Probes, Eugene, OR, USA) was used for hydrophilic compounds; an excited signal at 554 nm was used and the maxima of emitted signal was detected using a band-pass filter I3 and N2.1) for emission at 576 nm. A Red Nile (NR; Sigma-Aldrich, St. Louis, MO, USA) fluorochrome was used to stain hydrophobic domains [9]; an excited signal at 552 nm emission and a band-pass filter for emission at 636 nm were used. These analyses were performed to describe the changes in the biochemical composition (proportion of hydrophobic and hydrophilic domains) associated with biofilm/RSS.
Raman spectra were recorded with a spectrometer (T64000 Jobin Yvon, Horiba, Kyoto, Japan) coupled to a confocal-imaging module (Olympus BH2-UMA, Kyoto, Japan), which used a laser beam (λ = 532 nm). For calibration purposes, a Si wafer disc (521 cm−1) was used. The vibrational range was from 100 to 750 cm−1, as the Sn2−, the S0, and main copper-bearing compounds show their main active modes within this interval [10,11]. At least 10 Raman spectra were collected for each sample.
After biotic and abiotic assays (batch systems), leachates were recovered by vacuum filtration, and the extracted solutions were immediately analyzed for pH and oxidation-reduction potential (ORP; Thermo Electron pH-meter, Waltham, MA, USA), total Fe (AAS-GF, Perkin Elmer 3100 atomic absorption spectrometer), Fe2+ (titration with 0.01 N K2Cr2O7) and Fe3+ ions (difference between the total Fe and Fe2+ concentrations). Also, the non-attached bacteria were counted microscopically in a Neubauer chamber; the number of attached bacteria was calculated by subtracting the non-attached bacteria number from the initially added, 3 × 10⁶ cells/mL, to determine the planktonic/colonizing ratio.

3. Results

3.1. SOM Biofilms and Biooxidation of Sn2− and S0

The MCE*-Sn2− displayed a higher surficial Q (up to 0.77 mC) than the MCE*-S0 (up to 0.44 mC) after 12 and 24 h of SOM biooxidation activity (Figure 1a), due to the lability of -Sn2− compared to -S0, as it was also indicated by the EN analyses: Lower Rn (up to 2.15 mΩ/cm2) during the Sn2− biooxidation; this process is clearly microbiological, since the Rn of the corresponding abiotic control increased significantly (14.5 mΩ/cm2, p < 0.05) (Figure 1b). The fast biooxidation of Sn2− is also evidenced by the Raman spectra, which only showed chalcopyrite on the MCE*-Sn2− at 12 and 24 h (Figure 2a). Finally, the MCE*-Sn2− was poorly colonized by bacteria (Figure 3a,b), and a hydrophilic surface persisted (Figure 3a’,b’). The previous results suggest that Sn2− favors the incipient attachment of bacteria (scant biofilm formation), and that biofilms are formed once Sn2− has been oxidized to S0, in direct relationship with RSS reactivity (Figure 1).
In contrast, the Rn of the MCE*-S0 exposed to SOM during 1 and 12 h did not show significant differences (Figure 1b). At such times, the S0 remained at the MCE* surface (Figure 2c). The bacteria were extensively attached on the MCE*-S0 surface from the first hour of assays (Figure 3c), indicating a rapid colonization that continued throughout 24 h. After 24 h, a biofilm with EPS was detected (Figure 3d) as well as a hydrophobic MCE*-S0 surface (Figure 3d’). Also, the non-attached biomass increased (Figure S2c) due to the RSS biooxidation.

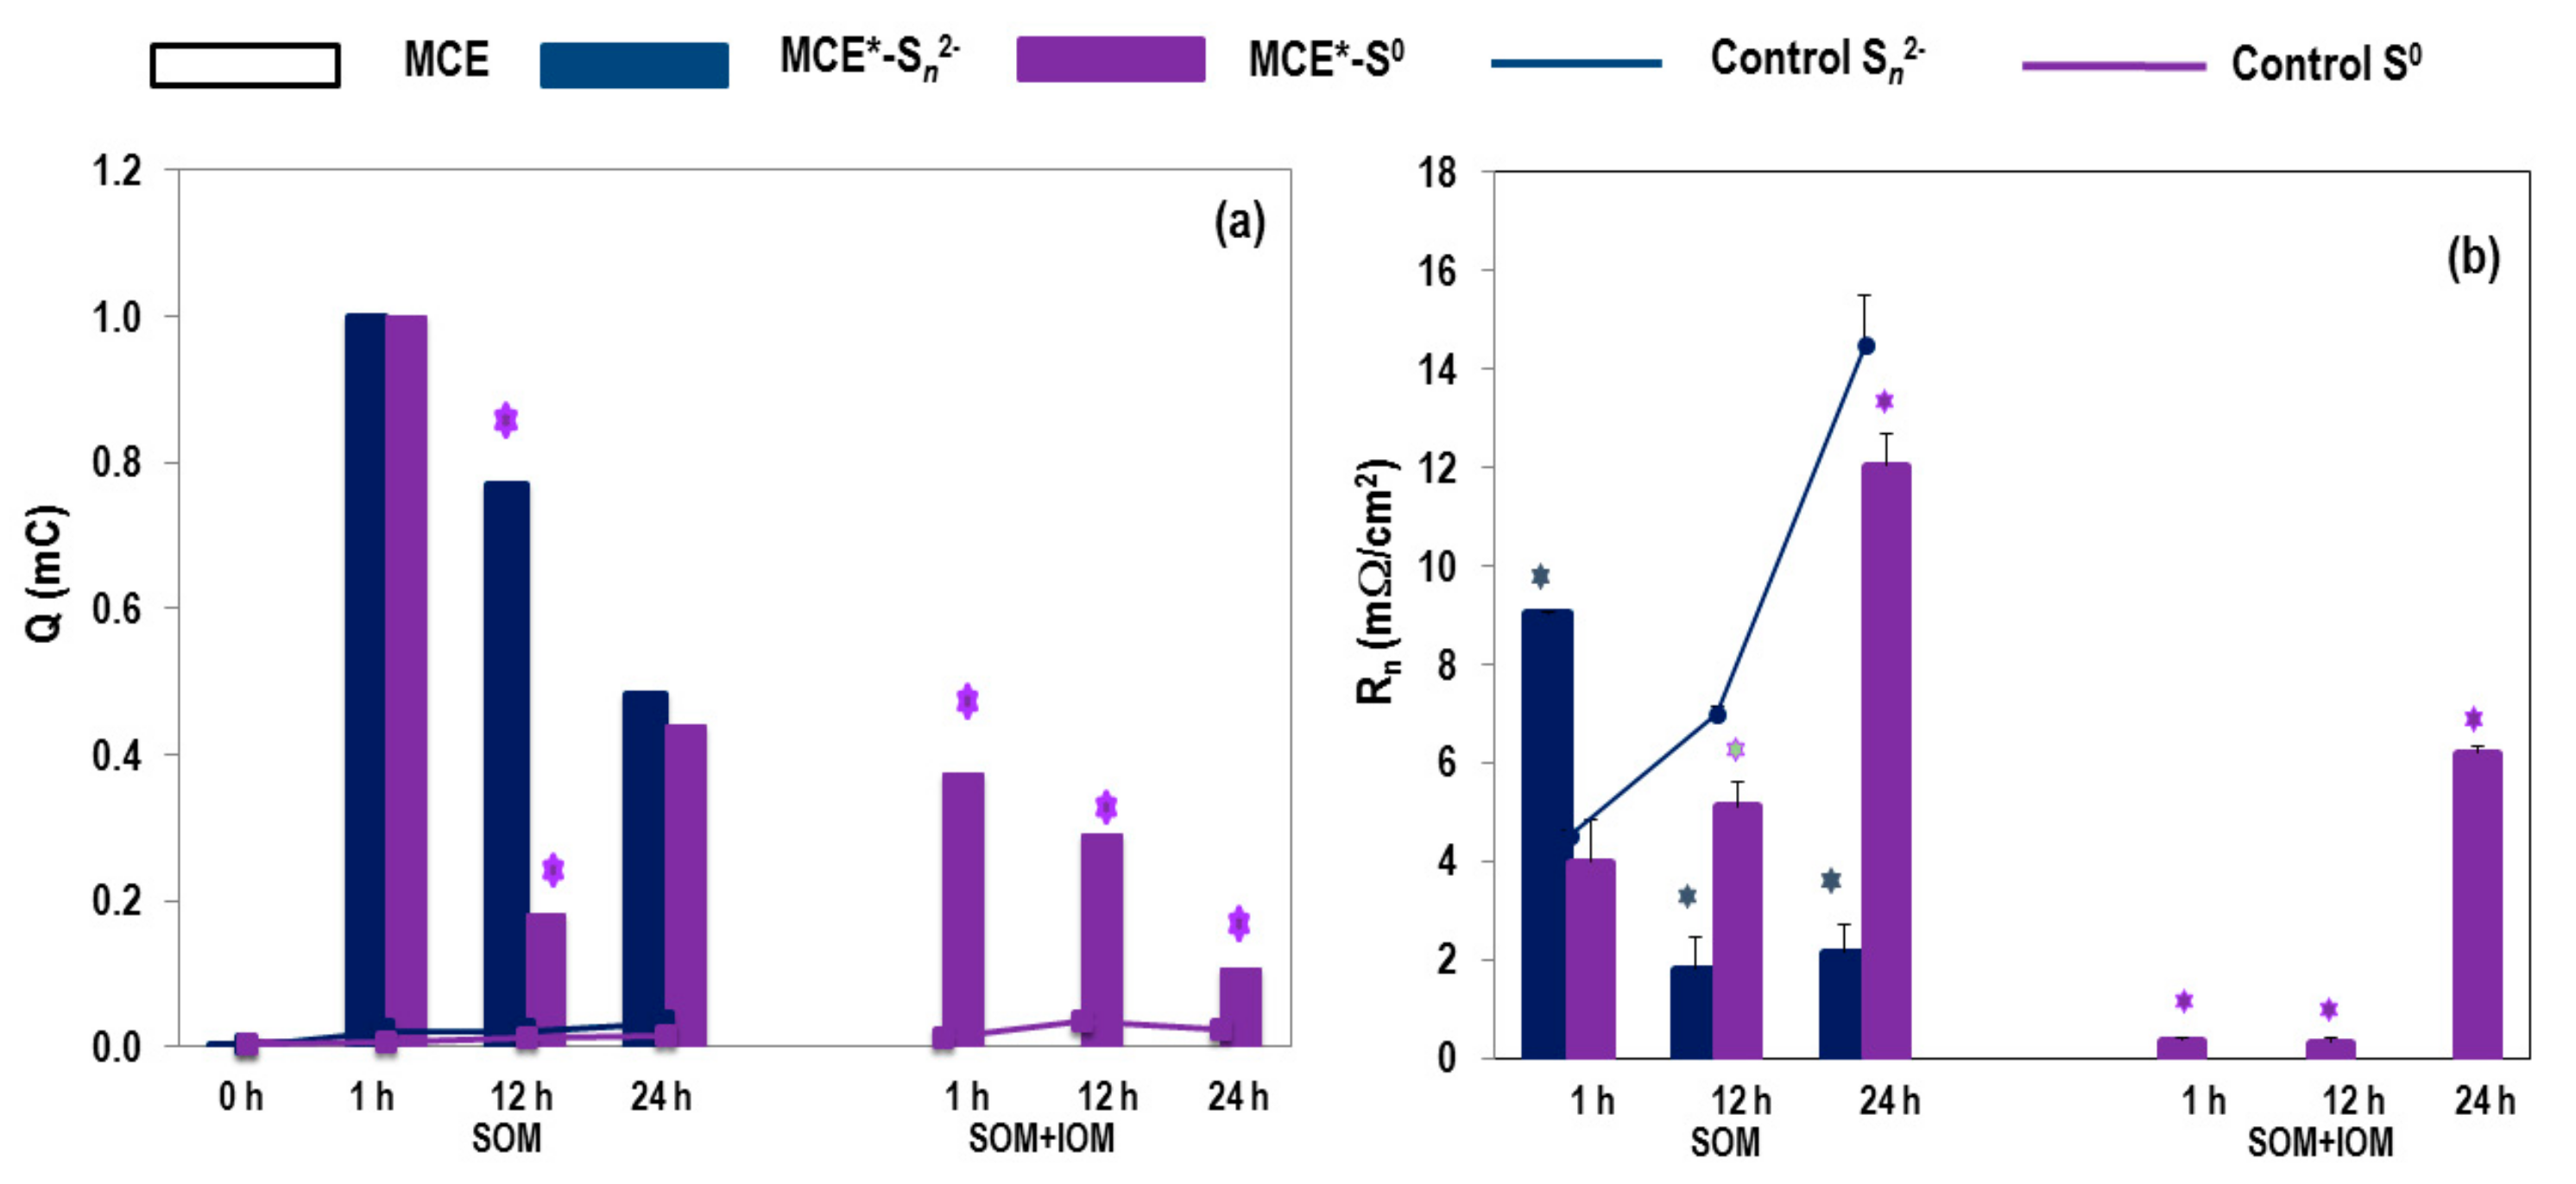
3.2. Biooxidation of MCE*-S0 by SOM and IOM

Because of the SOM biooxidation of the MCE*-Sn2−, we only analyzed the electrochemical behavior of the MCE*-S0 exposed to the mixed SOM+IOM and its abiotic control. In the MCE*-S0 exposed to SOM+IOM, the interfacial Q decreased from 0.38 to 0.11 mC (Figure 1a). However, comparing the SOM and the SOM+IOM assays, the Rn is the lowest using both species: 3.6 mΩ/cm2 in average after 1 and 12 h, and 6.2 mΩ/cm2 at 24 h (Figure 1b). The lowest Q and Rn confirm that the simultaneous activity of SOM and IOM improves S0 biooxidation. These facts indicate that the fate of RSS produced in assays, including IOM (affecting SOM activity), results from continuous surface pitting (Figure 3a–f) associated to IOM and chalcopyrite interactions.
The CLSM and SEM results showed that the number of attached SOM+IOM cells on the MCE*-S0 decreased after 24 h (Figure 3e,f), and the interface became hydrophilic (Figure 3f’). The number (per mL) of non-attached SOM+IOM was high at 1 and 24 h, but decreased significantly after 12 h (Figure S2c).
The acidity and ORP of the bulk media significantly increased after 24 h of assays with SOM+IOM; significant differences (p < 0.05) were found between the biotic and abiotic controls (Figure S2). The bioleaching of Cu and Fe initiated since the first hour of exposure of the MCE*-S0 to the microorganisms, but the Fe bioleached first and after 12 h, the Cu bioleaching initiated.

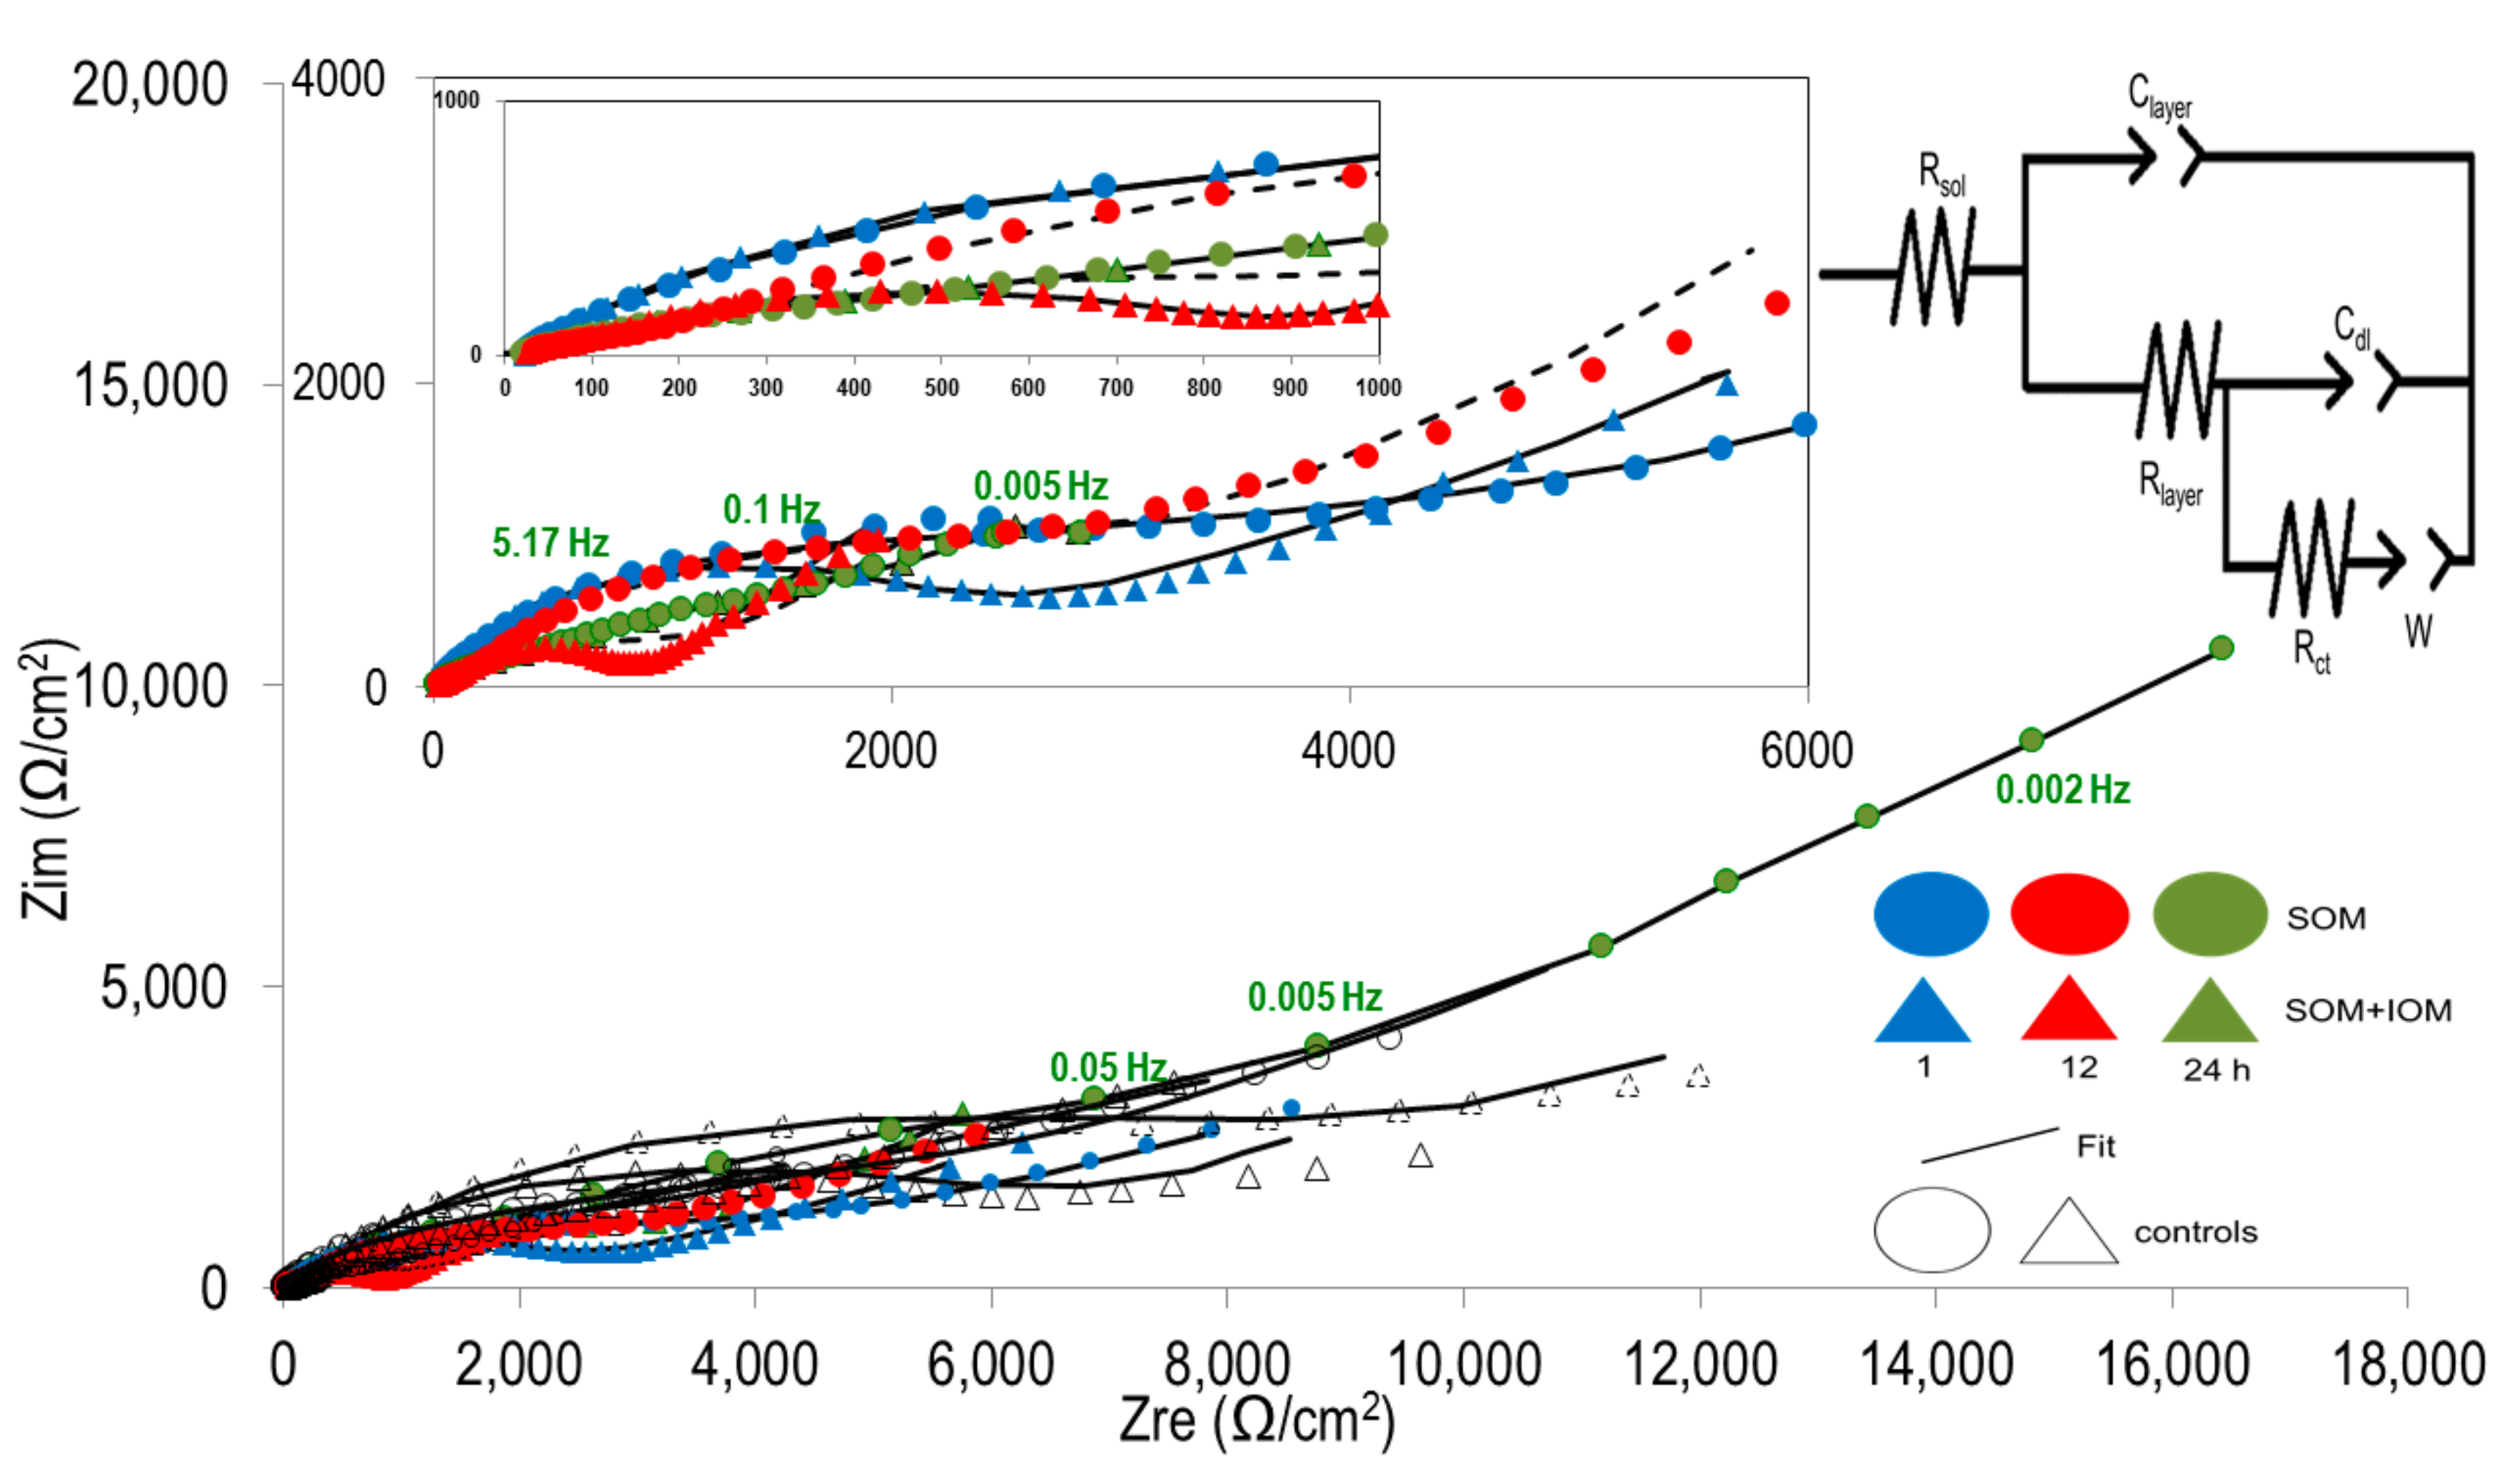
3.3. EIS Analyses of MCE*-S0 with SOM or SOM+IOM Biofilms

Figure 4 shows experimental and fitted Nyquist spectra obtained for all types of MCE surfaces in M1 and M1 + M2. As observed, a semi-circle with larger real components, compared to the imaginary ones, was recorded for low frequencies and is followed by a diffusive component (W or Warburg type). The diagrams collected for all types of samples were fitted to an electrical circuit denoting two times constant in the EIS measurements (Figure 4):
Rsol × (Clayer − Rlayer × (Cdl Rct × Z(ω))
where Rsol is the resistance of the solution (electrolyte), Clayer and Rlayer are the effective capacitance activity and resistance in the MCE*-S0/biofilm interface, respectively. Specifically, Rlayer is associated to the interface thickness. Cdl and Rct represent the charge redistribution and resistance on the interface, respectively, and thus, the (bio)oxidative activity on the MCE* without S0. Finally, Z(ω) (or W) is the Warburg impedance that indicated the infinite diffusion process or mass transport.
In general, the activity of soluble ions (Rsol values) was lower (15.3–20 Ω/cm2) in biotic assays than in abiotic controls (up to 37.2 Ω/cm2) and tended to decrease (Table 1). Similarly, the increments of Clayer and Rlayer at 24 h were significantly different comparing biotic and abiotic assays, and between the initial (1 h) and final (24 h) assayed times (Table 1). Consequently, the final Rct, Cdl, and Z(ω) values are lower, mainly after SOM interaction with the MCE-S0 surface (Table 1). Thus, all the MCE* surfaces show the same Nyquist contributions (capacitance Clayer, and Warburg impedance, W) (Figure 4). However, in the presence of SOM biofilms, the diffusive parameter is enhanced, which suggests a more important activity of mass transport due to the porosity of this RSS (Figure 5b). The decrease of W for SOM+SOM assays suggests a lower diffusion process occurring at the interface, which seems to be related to a rapid access of IOM interacting with the surface, in agreement with the change of hydrophobicity previously determined by CLSM (Figure 3a’–f’) and EN analyses (Figure 1b). Note that Figure 4 and Table 1 allow the identification of the main stages in biooxidation mechanisms, in conjunction with EN, CLSM, Raman and SEM analyses.

4. Discussion

The analysis of the culture media, MCE* surface, as well as of the interface biofilm/chalcopyrite confirmed that the biooxidation of both Sn2− and S0, previously formed on MCE by electrooxidation, was faster than the abiotic oxidation. Meanwhile, the electrochemical analyses allowed to disclose these processes suggested that the charge transfer due to the biocorrosion is mainly uniform; thus, the chalcopyrite and cells interactions are controlled by a quasi-homogeneous distribution of RSS.
According to Fowler et al. [12] and Holmes and Crundwell [13], “the Sn2− layers are not inherently passivating”. Even a low Q transfer is enough to remove Sn2− in the presence of SOM (Figure 1b) due to the characteristics of Sn2−, a partially dissolved, hydrophilic, linear and lower bond length than that of cyclic S8 (2.04 and 2.057 Å for Sn2− and S0, respectively) [14]. The hydrophilic character of Sn2− configures a hydrophilic surface (Figure 3a’,b’), in which few SOM cells attach after 24 h (Figure 3b). Meanwhile, the values of Q and Rn indicate that SOM attachment to the hydrophobic S0 is an energy-dependent process, and the bacteria essentially activate the S0 (Figure 1); in other words, the S0 is prone to biooxidation. Thus, the SOM attachment and S0 activation are the limiting steps. In other words, the greater hydrophobic surface overridden mainly by S0 compounds, the greater effect on bacteria attachment [15,16].
With both microorganisms, the SOM A. thiooxidans and the IOM Leptospirillum sp., exposed to the MCE*-S0, the decay of Rsol and the increase of Cdl (Table 1) were more notable. The RSS were removed after the first hour (Figure 2d), and a greater attachment of bacteria was observed (Figure 3e). That means that the Cdl increases because of the hydrophobic S0, but also probably because of charged species in the biofilms. Accordingly, we suggested that the energy is stored in the EPS of biofilm as a pseudocapacitor that does not involve Q transfer, but capacitive current. Because of the pseudocapacitance, the reaction rate diminished, as indicated by the Rsol (Table 1).
Accordingly, the Rlayer increased when we assayed only the SOM (0.48 to 2.8 kΩ/cm2; Table 1), because the active microorganisms gradually removed the RSS, shaping a thick resistivity interface with RSS agglomerates (Figure 5b) that limits the H+ diffusion (Table 2) and charge and mass transfer. Consequently, the final Rct, Cdl, and W values were lower in the SOM and MCE-S0 assays (Table 1) in the absence of the Leptospirillum sp. that regenerates Fe3+. Specifically, the lowest Rct in the SOM+IOM assays demonstrated that the IOM Leptospirillum sp. favors the biooxidation of MCE*.
Significant differences of SOM attachment have been reported in the presence of IOM in a bi- or multi-specific cultures [5,17,18]. Its presence shapes a progressive reactive surface due to the regenerated Fe3+, which accelerates RSS biooxidation and chalcopyrite dissolution [19]. In this work, the EIS also confirms that the SOM+IOM biofilm is electrochemically more active, and that the removal of RSS increases the mixed potential [13]. With both bacteria, the biooxidation of S0 initiates since the first hour, when the Q transfer (Figure 1b) and the W values increase (Table 1). Therefore, the surface is less resistive (Figure 1b) and modifies the semiconductor character of the MCE*.
The higher W value of the SOM+IOM assays (up to 7.0 KΩ/cm2s0.5; Table 1) showed that mass transfer (due to SOM activity) controlled the overall biooxidation rate of the MCE*-S0. Additionally, the lower pH in the MCE* exposed to SOM+IOM may result because of a higher diffusivity of H+ to the interface that may alter the pH in the formed biofilm [12,13]. Thus, the removal of reactive RSS enhances the diffusion of chemical species through its porous and spongy structure (Figure 5c), which improved the Cu bioleaching kinetics by diffusion process [20,21]. This porous and spongy RSS are characteristic of a catalytic process and may be formed because of vacancies or point defects during the biooxidation [22].
The electrochemical analyses indicated that S0 and EPS hindered the charge (as pseudocapacitor), as it was observed by Bevilaqua et al. [23]. Although both SOM and SOM+IOM biofilms were formed on MCE*-S0, the different electrochemical dynamics between them are associated to the role of Fe3+ions into the biofilms, as Rohwerder and Sand [24] have indicated. The Fe3+ acts as an electron acceptor or electrophile, and may form Fe-EPS complexes that enhance the biooxidation. This mechanism explains the performance of IOM, since the Fe-EPS complexes could be considered the main intermediate adsorbent on S0 for charge transfer, as it is proposed in the model shown in Figure 5a. The SOM acts over the interfacial RSS, permitting the Fe3+ diffusion, while the overall SOM+IOM activity modifies the bacterial density, the biofilm thickness, and the surficial hydrophobicity; all these phenomena occur within the first 24 h of interaction. (1) In SOM cultures exposed to MCE*-Sn2−, the biofilm/mineral interface has mainly hydrophilic compounds, like exopolysaccharides that are essential for the initial attachment of cells on the surface [24]; (2) The behavior of SOM and SOM+IOM biofilms on the MCE*-S0 surface seems to be controlled by hydrophobic residues (organic and inorganic); the hydrophobic and less reactive S8 enhances the bacterial attachment via hydrophobic interactions; (3) Only in SOM+IOM assays, a thinner (ca. 37 mm) biofilm–mineral interface shifts from hydrophobic to hydrophilic in character when S0 was completely activated to linear RSS as Sn2−, by the Fe3+ regenerated by IOM (Figure 5a). Hence, we would like to emphasize that the hydrophobic character of the interface “determines the free energy of the adhesion process” [16]. All these mechanisms occur by (i) allowing SOM colonization and (ii) by IOM affecting SOM and setting up a more accessible hydrophilic surface to induce corrosion pittings.
Currently, there is limited research on electron transfer between Fe3+ and RSS. According to Rohwerder et al. [25] and Yin et al. [26], the activation of S0 from cyclic to linear RSS proceeds via a nucleophilic attack of glutathione (GSH) and sulfonate (-SH) groups found in the outer-membrane protein of SOM. We hypothesize that Fe ions also favor such activation of the linear structures (Figure 5a), as the results of this and other works suggested, as well as the Hard–Soft Acid Base Theory studies on solid sulfur allotropes and sulfur oxidation [15,26,27,28,29,30,31,32,33]. This hypothesis should be proved and it is the subject of our future work.
The described effects due to the initial Sn2− or S0 and the presence of IOM, occurred just during the first 24 h. Afterwards, an attachment–detachment–attachment cycle is expected, which Echeverría-Vega and Demergasso [16] demonstrated was regulated by a feedback control. The presented results have an industrial interest, since the addition of S0 increases the Cu bioleaching rate and produces an acidity [34,35] that modifies the interfacial pH [36].

5. Conclusions

This study on charge and mass transfer in the biofilm–mineral interface demonstrates that RSS and chalcopyrite biooxidation by A. thiooxidans (SOM) and Leptospirillum sp. (IOM) initiates in the early stages of the interaction (1 to 24 h), and it is controlled by (1) the diffusion and adsorption of ions into EPS and (2) the transfer of ions and electrons from the mineral interface to the solution.
At the studied early times, the SOM modified the reactive properties of surficial sulfurs and favored an acidic dissolution, which shifted into a ferric dissolution when IOM was presented. Leptospirillum sp. enhances the chalcopyrite dissolution and allows surpassing the charge–transfer barrier (reactivity) between the mineral interface and ferric ions. In such context, the observed changes of hydrophobicity on the different interfaces are associated with the activity and transfer of ions and electrons.
Bacteria attachment is due to self-organization by a particular bioelectrochemical evolution on the interface: Changes in the mixed potential are triggered from the beginning of the bacteria–chalcopyrite interaction (1 h), when the biofilm is not constituted; the bacteria–chalcopyrite interaction depends on the surficial characteristics that pivoted the bacterial attachment to the mineral. As the chalcopyrite dissolution progresses, a surficial biofilm is formed and dynamically reconfigured: On the hydrophilic MCE*-Sn2− a less extended bacterial attachment was observed, compared with that on MCE*-S0, where the SOM+IOM presence shifts the surface from hydrophobic to hydrophilic as a response of the electrochemical changes while the chalcopyrite is biooxidized.
This work represents an antecedent for future studies in biochemistry and molecular biology, such as to reconfigure the proposed model of colonization and biooxidation of chalcopyrite in its early stages (Figure 5).

Supplementary Materials

The following are available online at www.mdpi.com/2075-163X/7/9/156/s1, Figure S1: Voltammograms in positive (a) and negative (b) potential sweep of pristine MCE (dotted line), and electrooxidized EMC at 695 mV, MCE*-Sn2− (gray line), and at 915 mV, MCE*-S0 (black line), in ATCC-125 medium pH 2. Scan rate: 20 mV/s with stirring; the potential scan was initiated at the OCP. Figure S2: Certain characteristics of the media as electrolyte (after 1, 12 and 24 h of the exposure of MCE*-Sn2− (blue) and MCE*-S0 (purple) to SOM or SOM+IOM media (abiotic controls; doted lines) and cultures (biotic; columns): pH (a); ORP (b), soluble Fe3+/Fe2+ (c), and biomass of non-attached bacteria (d). Data: Average values (n = 3) and standard deviation (error bars). *: Values significantly different from both, controls and surficial RSS (-Sn2− or -S0).

Acknowledgments

Financial support for this work comes from the Mexican Council of Science and Technology, CONACyT (Project CB-2012-01-177646). The first Author also thanks to CONACyT for Doctoral scholarship awarded (Grant 224211). The authors thank Erasmo Mata-Martínez for mineral section preparation and to Aurora Robledo Cabrera for the Raman technical assistance, respectively. We also thank LINAN-IPICyT, for providing laboratory support.

Author Contributions

J. Viridiana García-Meza and Irene López-Cázares conceived the experiments. Irene López-Cázares performed the experiments and O. Araceli Patrón-Soberano performed the microscopic analyses; all authors analyzed the data and prepared and approved the manuscript.

Conflicts of Interest

The authors declare no conflict of interest.

Appendix A

Mineral coupons of 1.0 cm2 were coated with Cu via electrolytic deposit using a CuSO4 solution, to improve the current distribution; a Cu wire was added with a silver solder to enhance the electrical contact of the MCE. Finally, the electrode was imbibed in epoxy resin and the exposed MCE surface was polished with a water sandpaper until it reached a mirror-like surface condition. The MCE were maintained in desiccators under anaerobic conditions until their use.
The potentiostatic modification was conducted with an EPSILON BASi 2.10.73 potentiostat at 25 °C, in a typical electrochemical, three-electrodes device; the MCE was used as working electrode, the reference electrode was a saturated sulfate electrode, Hg/Hg2SO4 (0.615 V vs. SHE, the standard hydrogen electrode), and a graphite rod (Alfa Aesar, 99.9995% purity) was used as counter-electrode. These MCE* were then achieved by application of anodic pulse (Ean, 3600 s); ATCC-125 culture at pH 2.0 was the electrolyte, hence emerging S0 and Sn2− compounds (reduced sulfur- species, RSS), as a function of the applied Ean, from 0.36 to 1.015 V vs. SHE.
The Raman spectra were recorded with a triple subtractive monochromator (T64000 Jobin Yvon spectrometer, Japan) equipped with a confocal microscope, Olympus BH2-UMA (λ = 514 nm). At least 10 spectra were recorded for each MCE* surface. Calibration was done using a Si wafer, which showed a single peak at 521 cm−1. The noise/signal ratio was better than 100.
After the CV and Raman analysis of the MCE, anodic Ean of 695 mV and 915 mV were chosen to electrogenerated two different RSS, since at these Ean was observed minor electrooxidation and low activation current (anodic peak a1 at the open circuit potential, OCP; Figure S1a,b). Raman peaks for these MCE* indicate the predominance of Sn2− and heptagonal sulfur S7 for Ean ≤ 695 mV; such electrode was referred as MCE*-Sn2−. Octagonal sulfur S8 was detected at Ean ≥ 915 mV, for MCE*-S0. The reactivity jact and of the MCE*-Sn2− was significantly lower than of the MCE*-S0 (Figure S1c,d); thus, more energy is necessary to (bio)oxidize the MCE*-S0 than for MCE*-Sn2− surface.

References

  1. Crundwell, F.K. The semiconductor mechanism of dissolution and the pseudo-passivation of chalcopyrite. Can. Metall. Q. 2015, 54, 279–288. [Google Scholar] [CrossRef]
  2. Crundwell, F.K. The dissolution and leaching of minerals: Mechanisms, myths and misunderstandings. Hydrometallurgy 2013, 139, 132–148. [Google Scholar] [CrossRef]
  3. Bevilaqua, D.; Acciari, H.A.; Benedetti, A.V.; Garcia, O., Jr. Electrochemical techniques used to study bacterial-metal sulfides interactions in acidic environments. In Microbial Processing of Metal Sulfides; Donati, E.R., Sand, W., Eds.; Springer: Dordrecht, The Netherlands, 2007; pp. 59–76. ISBN 978-1-4020-5588-1. [Google Scholar]
  4. García-Meza, J.V.; Fernández, J.; Lara, R.; González, I. Changes in biofilm structure during the colonization of chalcopyrite by Acidithiobacillus thiooxidans. Appl. Microbiol. Biotechnol. 2013, 97, 6065–6075. [Google Scholar] [CrossRef] [PubMed]
  5. Florian, B.; Noël, N.; Thyssen, C.; Felschau, I.; Sand, W. Some quantitative data on bacterial attachment to pyrite. Miner. Eng. 2011, 24, 1132–1138. [Google Scholar] [CrossRef]
  6. Dopson, M.; Halinen, A.K.; Rahunen, N.; Ozkaya, B.; Sahinkaya, E.; Kaksonen, A.H.; Lindström, E.B.; Puhakka, J.A. Mineral and iron oxidation at low temperatures by pure and mixed cultures of acidophilic microorganisms. Biotechnol. Bioengineer. 2007, 97, 1205–1215. [Google Scholar] [CrossRef]
  7. He, H.; Jin, G.; Wang, H.; Huang, X.; Chen, Z.; Sun, D.; Tang, Y. Annealed NaV3O8 nanowires with good cycling stability as a novel cathode for Na-ion batteries. J. Mater. Chem. A 2014, 2, 3563–3570. [Google Scholar] [CrossRef]
  8. Jin, Y.; Chen, M.; Jin, Q.; Zhao, J. On-line detection of Cu(II) in bioleaching system by anodic stripping differential pulse voltammetry. Trans. Nonferrous Met. Soc. China 2014, 24, 582–587. [Google Scholar] [CrossRef]
  9. Greenspan, P.; Fowler, S.D. Spectrofluorometric studies of the lipid probe, nile red. J. Lipid Res. 1985, 26, 781–789. [Google Scholar] [PubMed]
  10. Mycroft, J.R.; Bancroft, G.M.; McIntyre, N.S.; Lorimer, J.W.; Hill, I.R. Detection of sulphur and polysulphides on electrochemically oxidized pyrite surfaces by X-ray photoelectron spectroscopy and Raman spectroscopy. J. Electroanal. Chem. 1990, 292, 139–152. [Google Scholar] [CrossRef]
  11. Sasaki, K.; Nakamuta, Y.; Hirajima, T.; Tuovinen, O.H. Raman characterization of secondary minerals formed during chalcopyrite leaching with Acidithiobacillus ferrooxidans. Hydrometallurgy 2009, 95, 153–158. [Google Scholar] [CrossRef]
  12. Fowler, T.A.; Holmes, P.R.; Crundwell, F.K. The mechanism of the dissolution of pyrite in the presence of Thiobacillus ferrooxidans. Appl. Environ. Microbiol. 1999, 65, 2987–2993. [Google Scholar] [CrossRef]
  13. Holmes, P.R.; Crundwell, F.K. Polysulfides do not cause passivation: Results from the dissolution of pyrite and implications for other sulfide minerals. Hydrometallurgy 2013, 139, 101–110. [Google Scholar] [CrossRef]
  14. Meyer, B. Elemental sulfur. Chem. Rev. 1976, 76, 367–387. [Google Scholar] [CrossRef]
  15. Peng, A.; Xia, J.; Liu, H.; Nie, Z.; Yang, Y.; Zhu, W. Differential utilization of cyclic, orthorhombic α- and chain-like polymeric μ-sulfur by Acidithiobacillus ferrooxidans. Trans. Nonferrous Met. Soc. China 2014, 24, 1562–1570. [Google Scholar] [CrossRef]
  16. Echeverría-Vega, A.; Demergasso, C. Copper resistance, motility and the mineral dissolution behavior were assessed as novel factors involved in bacterial adhesion in bioleaching. Hydrometallurgy 2015, 157, 107–115. [Google Scholar] [CrossRef]
  17. Demergasso, C.; Galleguillos, F.; Soto, P.; Serón, M.; Iturriaga, V. Microbial succession during a heap bioleaching cycle of low grade cupper sulfides: Does this knowledge mean a real impute for industrial process design and control? Hydrometallurgy 2010, 104, 382–390. [Google Scholar] [CrossRef]
  18. Noël, N.; Florian, B.; Sand, W. AFM & EFM study on attachment of acidophilic leaching organisms. Hydrometallurgy 2010, 104, 370–375. [Google Scholar] [CrossRef]
  19. Sand, W.; Gehrke, T. Extracellular polymeric substances mediate bioleaching/biocorrosion via interfacial processes involving iron(III) ions and acidophilic bacteria. Res. Microbiol. 2006, 157, 49–56. [Google Scholar] [CrossRef] [PubMed]
  20. Gómez, E.; Ballester, A.; Blázquez, M.L.; González, F. Silver-catalysed bioleaching of a chalcopyrite concentrate with mixed cultures of moderately thermophilic microorganisms. Hydrometallurgy 1999, 51, 37–46. [Google Scholar] [CrossRef]
  21. Muñoz, J.A.; Dreisinger, D.B.; Cooper, W.C.; Young, S.K. Silver-catalyzed bioleaching of low-grade copper ores. Part II: Stirred tank tests. Hydrometallurgy 2007, 88, 19–34. [Google Scholar] [CrossRef]
  22. Ghahremaninezhad, A.; Asselin, E.; Dixon, D.G. Electrochemical evaluation of the surface of chalcopyrite during dissolution in sulfuric acid solution. Electrochim. Acta 2010, 55, 5041–5056. [Google Scholar] [CrossRef]
  23. Bevilaqua, D.; Acciari, H.A.; Arena, F.A.; Benedetti, A.V.; Fugivara, C.S.; Tremiliosi-Filho, G.; Garcia, O., Jr. Utilization of electrochemical impedance spectroscopy for monitoring bornite (Cu5FeS4) oxidation by Acidithiobacillus ferrooxidans. Miner. Eng. 2009, 22, 254–262. [Google Scholar] [CrossRef]
  24. Rohwerder, T.; Sand, W. Mechanisms and biochemical fundamentals of bacterial metal sulfide oxidation. In Microbial Processing of Metal Sulfides; Donati, E.R., Sand, W., Eds.; Springer: Dordrecht, The Netherlands, 2007; pp. 35–58. ISBN 978-1-4020-5588-1. [Google Scholar]
  25. Rohwerder, T.; Gehrke, T.; Kinzler, K.; Sand, W. Bioleaching review part A. Appl. Microbiol. Biotechnol. 2003, 63, 239–248. [Google Scholar] [CrossRef]
  26. Yin, H.; Zhang, X.; Li, X.; He, Z.; Liang, Y.; Guo, X.; Hu, Q.; Xiao, Y.; Cong, J.; Ma, L.; et al. Whole-genome sequencing reveals novel insights into sulfur oxidation in the extremophile Acidithiobacillus thiooxidans. BMC Microbiol. 2014, 14, 179. [Google Scholar] [CrossRef] [PubMed]
  27. Pearson, R.G. Hard and soft acids and bases. J. Am. Chem. Soc. 1963, 85, 3533–3539. [Google Scholar] [CrossRef]
  28. Rohwerder, T.; Sand, W. The sulfane sulfur of persulfides is the actual substrate of the sulfur-oxidizing enzymes from Acidithiobacillus and Acidiphilium spp. Microbiology 2003, 149, 1699–1709. [Google Scholar] [CrossRef] [PubMed]
  29. Steudel, R. Inorganic polysulfides Sn2− and radical anions Sn. Top. Curr. Chem. 2003, 231, 127–152. [Google Scholar] [CrossRef]
  30. Anwar, A.; Mecklenburg, S.; Jacob, C. Polysulfides as biologically active ingredients of garlic. Org. Biomol. Chem. 2007, 5, 1505–1518. [Google Scholar] [CrossRef]
  31. Deponte, M. Glutathione catalysis and the reaction mechanisms of glutathione-dependent enzymes. Biochim. Biophys. Acta 2013, 1830, 3217–3266. [Google Scholar] [CrossRef] [PubMed]
  32. Urich, T.; Gomes, C.M.; Kletzin, A.; Frazão, C. X-ray structure of a self-compartmentalizing sulfur cycle metalloenzyme. Science 2006, 311, 996–1000. [Google Scholar] [CrossRef] [PubMed]
  33. Blight, K.R.; Candy, R.M.; Ralph, D.E. The preferential oxidation of orthorhombic sulfur during batch culture. Hydrometallurgy 2009, 99, 100–104. [Google Scholar] [CrossRef]
  34. Tuovinen, O.H.; Särkijärvi, S.; Peuraniemi, E.; Junnikkala, S.; Puhakka, J.A.; Kaksonen, A.H. Acid leaching of Cu and Zn from a Smelter slag with a bacterial consortium. Adv. Mater. Res. 2015, 1130, 660–663. [Google Scholar] [CrossRef]
  35. Kaksonen, A.H.; Särkijärvi, S.; Peuraniemi, E.; Junnikkala, S.; Puhakka, J.A.; Tuovinen, O.H. Metal biorecovery in acid solutions from a copper smelter slag. Hydrometallurgy 2017, 168, 135–140. [Google Scholar] [CrossRef]
  36. Crundwell, F.K. How do bacteria interact with minerals? Hydrometallurgy 2003, 71, 75–81. [Google Scholar] [CrossRef]
Figure 1. Changes the interfacial charge transfer or Q (a), and resistance to noise, Rn (b) in massive chalcopyrite electrodes (MCE)*-Sn2− (blue) and MCE*-S0 (purple) surfaces after biooxidation assays with sulfur-oxidizing microorganism (SOM) (left) and SOM+ iron-oxidizing microorganisms (IOM) (right) at the assayed times (0 h or initial condition, 1, 12 and 24 h). Data: Average values (n = 3) and standard deviation (error bars). *: Values significantly different (p < 0.05) for both, control and surficial RSS (Sn2− or S0).
Minerals 07 00156 g001
Figure 2. Identified Raman transitions peaks in terms of main surficial reduced sulfur species (RSS) on MCE*-Sn2− interacting with SOM (a) and on MCE-S0 with SOM and SOM+IOM (b,c) after the assayed times: 1 (blue), 12 (red) and 24 h (green). Abiotic controls (d).
Minerals 07 00156 g002
Figure 3. Environmental scanning electron microscopy (ESEM) and confocal laser scanning microscopy (CLSM) images of the MCE*-Sn2− with SOM (a,b) and (a’,b’), and of the MCE*-S0 with SOM (c,d) and (c’,d’) and SOM+IOM (e,f) and (e’,f’) after 1 and 24 h. Epifluorescence (CLSM) of hydrophilic compounds as exopolysaccharides is shown in green, and that of hydrophobic compounds is shown in red.
Minerals 07 00156 g003
Figure 4. Nyquist diagram for MCE*-S0 in presence of SOM (triangle) and SOM+IOM (circle) after the assayed times: 1 (blue), 12 (red) and 24 h (green). The equivalent circuit is also presented. Rsol: Resistance of the solution (electrolyte); Clayer and Rlayer: Effective capacitance activity and resistance on the MCE*-S0/biofilm interface, respectively; Cdl and Rct: Charge redistribution and resistance on the interface, respectively; W: Warburg impedance.
Minerals 07 00156 g004
Figure 5. Proposed model of S0 (bio)oxidation by A. thiooxidans alone or with the IOM, Leptospirillum sp. (a) (i) Cyclic S0 behaves as a hard base; thus, the presence of H+, is not sufficient to favor a reaction affinity. (ii) Although the deprotonated glutathione (due to the acid medium) GS- acts as a soft and nucleophilic base and may form GS-SnH, it has been reported that Kcat for this reaction is very low. (iii) GS-SnH is transported to the SOM periplasm via the outer membrane protein (OMP). The GSH catalyst is regenerated. In the presence of IOM, S0 as a hard-base shows affinity for the produced Fe3+ that is also a polarizing agent. Thus, Fe3+ may induce a S0-Fe3+ complex formation and/or (iv–vi) charge delocalization, until it rises to a linear Sn2− that interacts with the GS to form GS-SnH, available for SOM, as already mentioned (iii). Agglomerated reduced sulfur species (RSS) (b) and thin and spongy layer (c) after SOM and SOM+IOM biooxidation of MCE*, respectively [15,29,30,32,33].
Minerals 07 00156 g005
Table 1. Electrochemical impedance spectroscopy (EIS) parameters after adjusting the equivalent circuits for biotic assays of SOM or SOM+IOM interaction with MCE*-S0 and their corresponding abiotic control. Data: Average (n = 3) ± standard deviation.
AssayTime (h)Rsol (Ω/cm2)Rlayer (Ω/cm2)Clayer (1 × 10⁻⁶)Rct (Ω/cm2)Cdl (1 × 10⁻⁶)Z(ω) or W (kΩ/cm2s0.5)
SOM (control)120 ± 0.8 (12.3 ± 5.2)480 ± 13 (650 ± 0.7)5.14 (0.002)12,453 ± 30,992 (9445 ± 637)6200 (4.6)1.6 ± 0.03 (0.7 ± 0.01)
1220 ± 0.9 (9.3 ± 0.3)195 ± 16 (18.5 ± 2.4)2.1 (1.63)3110 ± 75 (1298 ± 20)0.93 (1.7)2.0 ± 0.01 (5.2 ± 0.02)
2417.0 ± 0.5 (22.7 ± 1.3)3607 ± 120 (650 ± 5)18.4 (27)4930 ± 361 (12,930 ± 457)160 (39,000)0.7 (5.3 ± 0.15)
SOM+IOM (control)120 ± 0.8 (5.2 ± 1.3)2114 ± 62 (12 ± 2.39)11.8 (0.1)6830 ± 1628 (7307 ± 131)22,000 (0.13)2.0 ± 0.03 (1.6 ± 0.01)
1216.1 ± 0.3 (18.4 ± 1.5)141 ± 3.3 (396 ± 6)2.8 (1.04)701 ± 3 (9942 ± 102)0.19 (0.2)7.0 ± 0.01 (1.2)
2415.3 ± 0.4 (37.2 ± 0.2)758 ± 46 (286 ± 25)28.4 (10.6)1815 ± 205 (6368 ± 1000)830 (0.5)3.5 ± 0.01 (0.3)
Table 2. Diffusivity values (D) for soluble H+, Fe2+ and Fe3+ (Equation (1)) of assays with MCE*-S0 subjected to SOM or SOM+IOM activity and their corresponding abiotic control. Data: Average (n = 3) ± standard deviation.
Time (h)SOMIOM+SOM
1122411224
DH+ mm2/s (control)0.006 (0.001)0.004 (0.05)0.01 (0.04)0.003 ± 0.001 (0.001)0.34 (0.002)0.34 (0)
DFe2+ mm2/s (control)0 (0)0 (0)0 (0)0.001 (0)0.016 (0)0.007 (0)
DFe3+ mm2/s (control)0 (0)0 (0)0 (0)0.37 ± 0.15 (0.51 ± 0.004)6.20 (0.3)1.5 ± 0.002 (0.008)

