Flotation Behavior of Different Colored Fluorites Using Sodium Oleate as a Collector


1
School of Resources and Environmental Engineering, Wuhan University of Technology, Wuhan 430070, China
2
Hubei Key Laboratory of Mineral Resources Processing & Environment, Wuhan 430070, China
*
Author to whom correspondence should be addressed.
Minerals 2017, 7(9), 159; https://doi.org/10.3390/min7090159
Submission received: 28 July 2017
/
Revised: 24 August 2017
/
Accepted: 29 August 2017
/
Published: 1 September 2017
(This article belongs to the Special Issue Flotation Chemistry)
Abstract
:Using sodium oleate (NaOL) as a collector, the flotation characteristics of natural colorless fluorite (CF), green fluorite (GF), and purple fluorite (PF) were investigated through micro-flotation tests, collector adsorption measurements, and surface tension measurement. The micro-flotation results indicated that CF had a much better flotation response than both GF and PF, and had higher floatation recovery. The results demonstrated a considerable discrepancy in the interfacial properties between colorless and colored fluorite, even though all the samples were obtained from the same deposit, holding a similar high purity of CaF2. The adsorption capacity of CF, GF, and PF for NaOL was 2.27, 4.18, and 8.21 × 10⁻⁶ mol/g under neutral conditions, respectively. Fourier transform infrared (FT-IR) measurements revealed that the carboxyl groups of NaOL reacted with Ca sites on the surface of fluorites by chemical adsorption. From the zeta potential analyses, PF exhibited a lower positive potential than CF and GF, mainly due to its surface carbonation. In the presence of NaOL, the surface potential of fluorites changed from positive to negative because the NaOL collector had been adsorbed onto the mineral surface and changed their surface potential, which was consistent with the flotation results at different pH values. We found that the floatability of the fluorite samples was influenced by their surface roughness, measured by an atomic force microscope (AFM) and scanning electron microscope (SEM). PF can be floated with adding more reagent dosage than CF and GF to compensate for its higher surface roughness.
1. Introduction
Fluorite (CaF2) is by far the most important fluorine-bearing mineral phase in the Earth’s crust. It is mostly used for manufacturing glass, cement, fillers, and hydrofluoric acid, and as a flux in steel-making in various industries [1,2,3]. In order to obtain high grade fluorite raw materials (CaF2 ≥ 97%), froth flotation has been the most commonly used beneficiation process for fluorite ores, employing fatty acid collectors. Different mechanisms of fatty acid collector adsorption on the mineral surface, including physisorption, chemisorption, surface precipitation, and chemisorptions, followed by surface precipitation and chemisorption, and then followed by the formation of hydrophobic aggregates, have been reported in previous studies [4,5,6,7]. In recent years, a new flotation scheme, involving the mixing of collectors and novel depressants for fluorite beneficiation from other gangue minerals, was reported and achieved satisfactory results [2,8,9].
Natural pure fluorite is colorless and transparent, but in general, natural fluorite exhibits various colors such as yellow, green, pink, blue, purple, and sometimes black, due to different color centers or impurities. The cause of coloration of fluorite has been found to be due to rare-earth ions replacing the Ca ions in the fluorite crystal structure during mineralization, which results in energy adsorption and the production of color [10,11]. In addition to the rare-earth elements, natural fluorite crystals containing oxygen impurities, calcium colloids, as well as lattice defects of crystal, can also be colored under various conditions [10,12,13]. However, no unique theory exists for explaining the coloration of fluorite due to its complicated chemical or structural composition, even for the same color-centered fluorite from different areas. On the other hand, some of fluorite crystals with appropriate color centers or impurities have shown very good optical and spectral features. The applications of colored fluorites for optical components [14] and dosimetric thermoluminescence material [15] have received significant attention due to their high ultraviolet (UV) transparency and sensitivity. The influence of different colors on optical and spectral features of fluorite has been studied, while only a few studies have focused on the surface properties of different colors of fluorite [16,17]. These surface properties play a significant role in floatability, wettability, and hydrophobicity of mineral particles during mineral processing.
This paper focuses on the difference in floatability of fluorite of different colors using NaOL as a collector. Firstly, the common pure green fluorite and purple fluorite from the same fluorite deposit were selected as the object of study and compared to colorless fluorite. Floatability of different colored fluorites was comparatively studied through micro-flotation tests, reagent adsorption measurement, and surface tension measurement. The adsorption behaviors of NaOL on the surface of fluorites were further characterized by zeta potential measurement, FT-IR measurements, and micro-topography analyses.
2. Materials and Methods
2.1. Materials and Reagents
The pure natural colorless, green, and purple fluorite samples were obtained from the same Fluorite Deposit in Inner Mongolia, China. The hand-picked high-grade fluorite samples were first crushed with a hammer, then ground in laboratory porcelain, and screened to three different size fractions (74–100 μm, 45–74 μm, and 0–45 μm) with stainless steel screens. The different sized fractions were filtered, vacuum-dried, and stored in glass bottles for use in flotation tests and measurements. X-ray diffraction (XRD) analysis of the three samples showed that they were all of high purity (Figure 1). The size distribution and specific surface area (SSA) of the fine fluorite particles (0–45 μm) were measured using a BT-9300S laser particle analyzer (Dandong Bettersize Scientific Ltd., Dandong, China) and the results are presented in Table 1, which indicates all three fluorite particles exhibit a similar size distribution and SSA.
Chemically pure sodium oleate from Sinopharm Chemical Regent Co., Ltd. (Shanghai, China) was used as the collector. Analytical grade sodium hydroxide and hydrochloric acid were used for pH control. The water used in all these tests was deionized water, of which the resistivity is 18.25 MΩ∙cm.
2.2. Methods
2.2.1. Micro-Flotation Tests
The micro-flotation tests were carried out in a laboratory XFG-35 flotation apparatus (Rock Crush & Grand Equipment Manufacture Co., Ltd., Wuhan, China) with an effective volume of 120 mL at room temperature (25 °C). For each test, prepared mineral particles (10.0 g) were placed into a plexiglass cell, and then filled with 100 mL deionized water. 1 mol/L HCl or NaOH solution was added to adjust the pH of the pulp. After adding the desired amount of collector reagents, the suspension was continuously stirred at 1600 rpm for 2 min. The flotation test duration was 5 min. The froth was scraped manually by using a plastic blade. The obtained froth products and tailings were filtered, dried, and weighed to calculate the flotation recovery of fluorite sample under various flotation conditions.
2.2.2. Measurement of Collector Adsorption Capacity
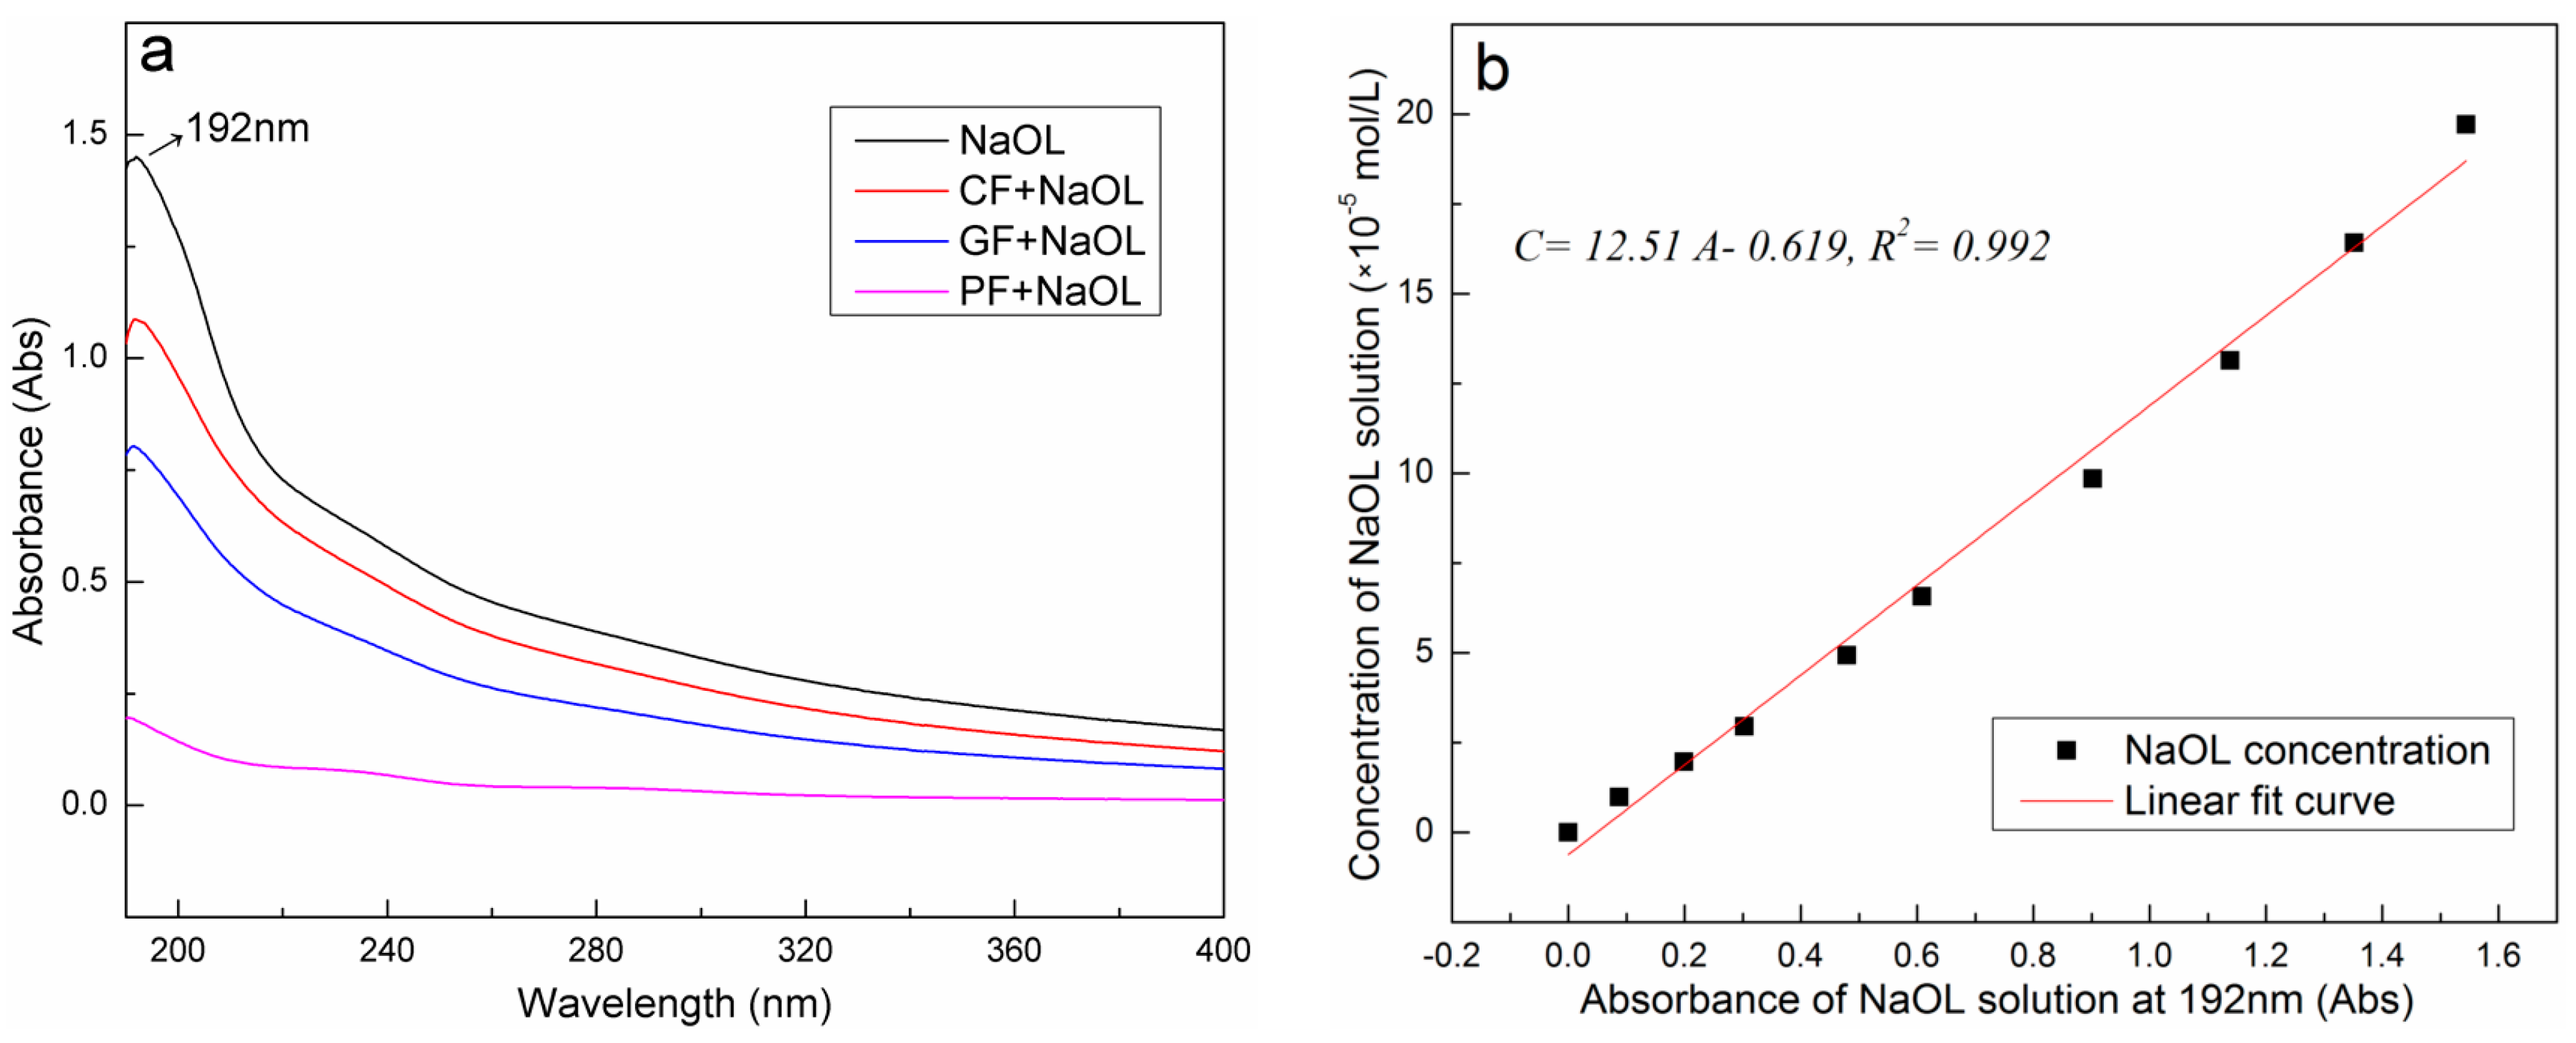
Desired concentration and dosage of collector reagents and mineral samples were taken into a quartz conical flask with a specific pH value, and agitated for 40 min at room temperature (25 °C). The solid phase was separated from the solution using a H2050R-1 high-speed centrifuge (CENCE Instruments Co., Ltd., Hunan, China). Then, the supernatant of the solution was used to measure the residual NaOL concentration by A-360 UV-Vis spectrophotometer (AOE Instruments Co., Ltd., Shanghai, China) at a wavelength of 192 nm (Figure 2a). The concentration of the residual NaOL was determined using a linear regression equation () obtained by plotting a calibration curve for the collector concentration over a range of concentrations based on the Beer–Lambert law (Figure 2b).
The adsorption capacity of collector was calculated by the following equation:
where Γ is the adsorption capacity (mol/g) of the collector adsorbed on the mineral surface, C0 and Ce are the concentrations (mol/L) of the initial collector solution and the collector-equilibrated solution, respectively. V is the volume (L) of the solution and m is the mass (g) of the mineral sample.
2.2.3. FT-IR Measurements
Fourier transform infrared (FT-IR) spectra were recorded on a Nicolet 6700 spectrometer (Thermo Fisher Scientific Inc., Waltham, MA, USA) at room temperature (25 °C) in the range of 4000–400 cm−1. Prior to the test, the samples were ground to a particle size of less than 5 μm in an agate mortar before being conditioned with collectors. The spectra of the solids were taken with KBr pellets.
2.2.4. Surface Tension Measurement
The surface tension of the NaOL solution with different concentrations was performed by the Wilhelmy plate method, using the K100MK2 tensiometer (Krűss GmbH, Hamburg, Germany). The desired amount of NaOL solution with a specific pH value was added into the sample pool, and the measurement was performed automatically as the plate came into contact with the solution surface.
2.2.5. Zeta Potential Measurements
Zeta potential measurements were carried out by a Zeta Nano ZS90 zeta potential analyzer (Malvern Instruments Ltd., Worcestershire, UK). A suspension containing 0.1% mineral particles, ground to 5 μm in an agate mortar, was prepared in 1 mM KCl solution and conditioned by magnetic stirring for 5 min with or without collector under various pH values. After allowing the solution to settle for 10 min, the supernatant of the dilute fine particle suspension was removed for zeta potential characterization. Each sample was measured three times and the average values were reported.
2.2.6. Micro-Topography Studies
The pure fluorite crystals were cut to the required size and polished with velvet cloth, applying diamond and alumina paste using Automated Polishers (GPM-3000P, Shanghai, China). Firstly, the fluorite crystals were pre-polished using a polishing cloth process with different norms of 9 μm, 5 μm, 3 μm, 2 μm, and 1 μm. Then the alumina paste was used to further polish the crystals from 0.5 μm to 0.02 μm with the help of a velvet cloth. Every polishing procedure was executed for more than 5 min, and all three fluorite crystals were polished under the exact same conditions. After polishing, the samples were thoroughly washed with deionized water. The atomic force microscope (AFM) images of the polished fluorite crystals were collected by using a MultiMode 8 AFM (Bruker Corporation, Karlsruhe, Germany) with peak force tapping-mode. The surface roughness of the fluorite crystals was calculated by the embedded analysis program of the equipment.
In addition to the fluorite crystal samples, the morphologies of the fluorite particle samples with a size of 0–45 μm, which were used in flotation experiments, were characterized simultaneously using a S4800 scanning electron microscope (Hitachi Ltd., Tokyo, Japan) with an accelerating voltage of 20 kV. Before characterization, well-dispersed particle samples were freeze-dried and then coated with a thin layer of gold.
3. Results and Discussion
3.1. Micro-Flotation of Fluorites
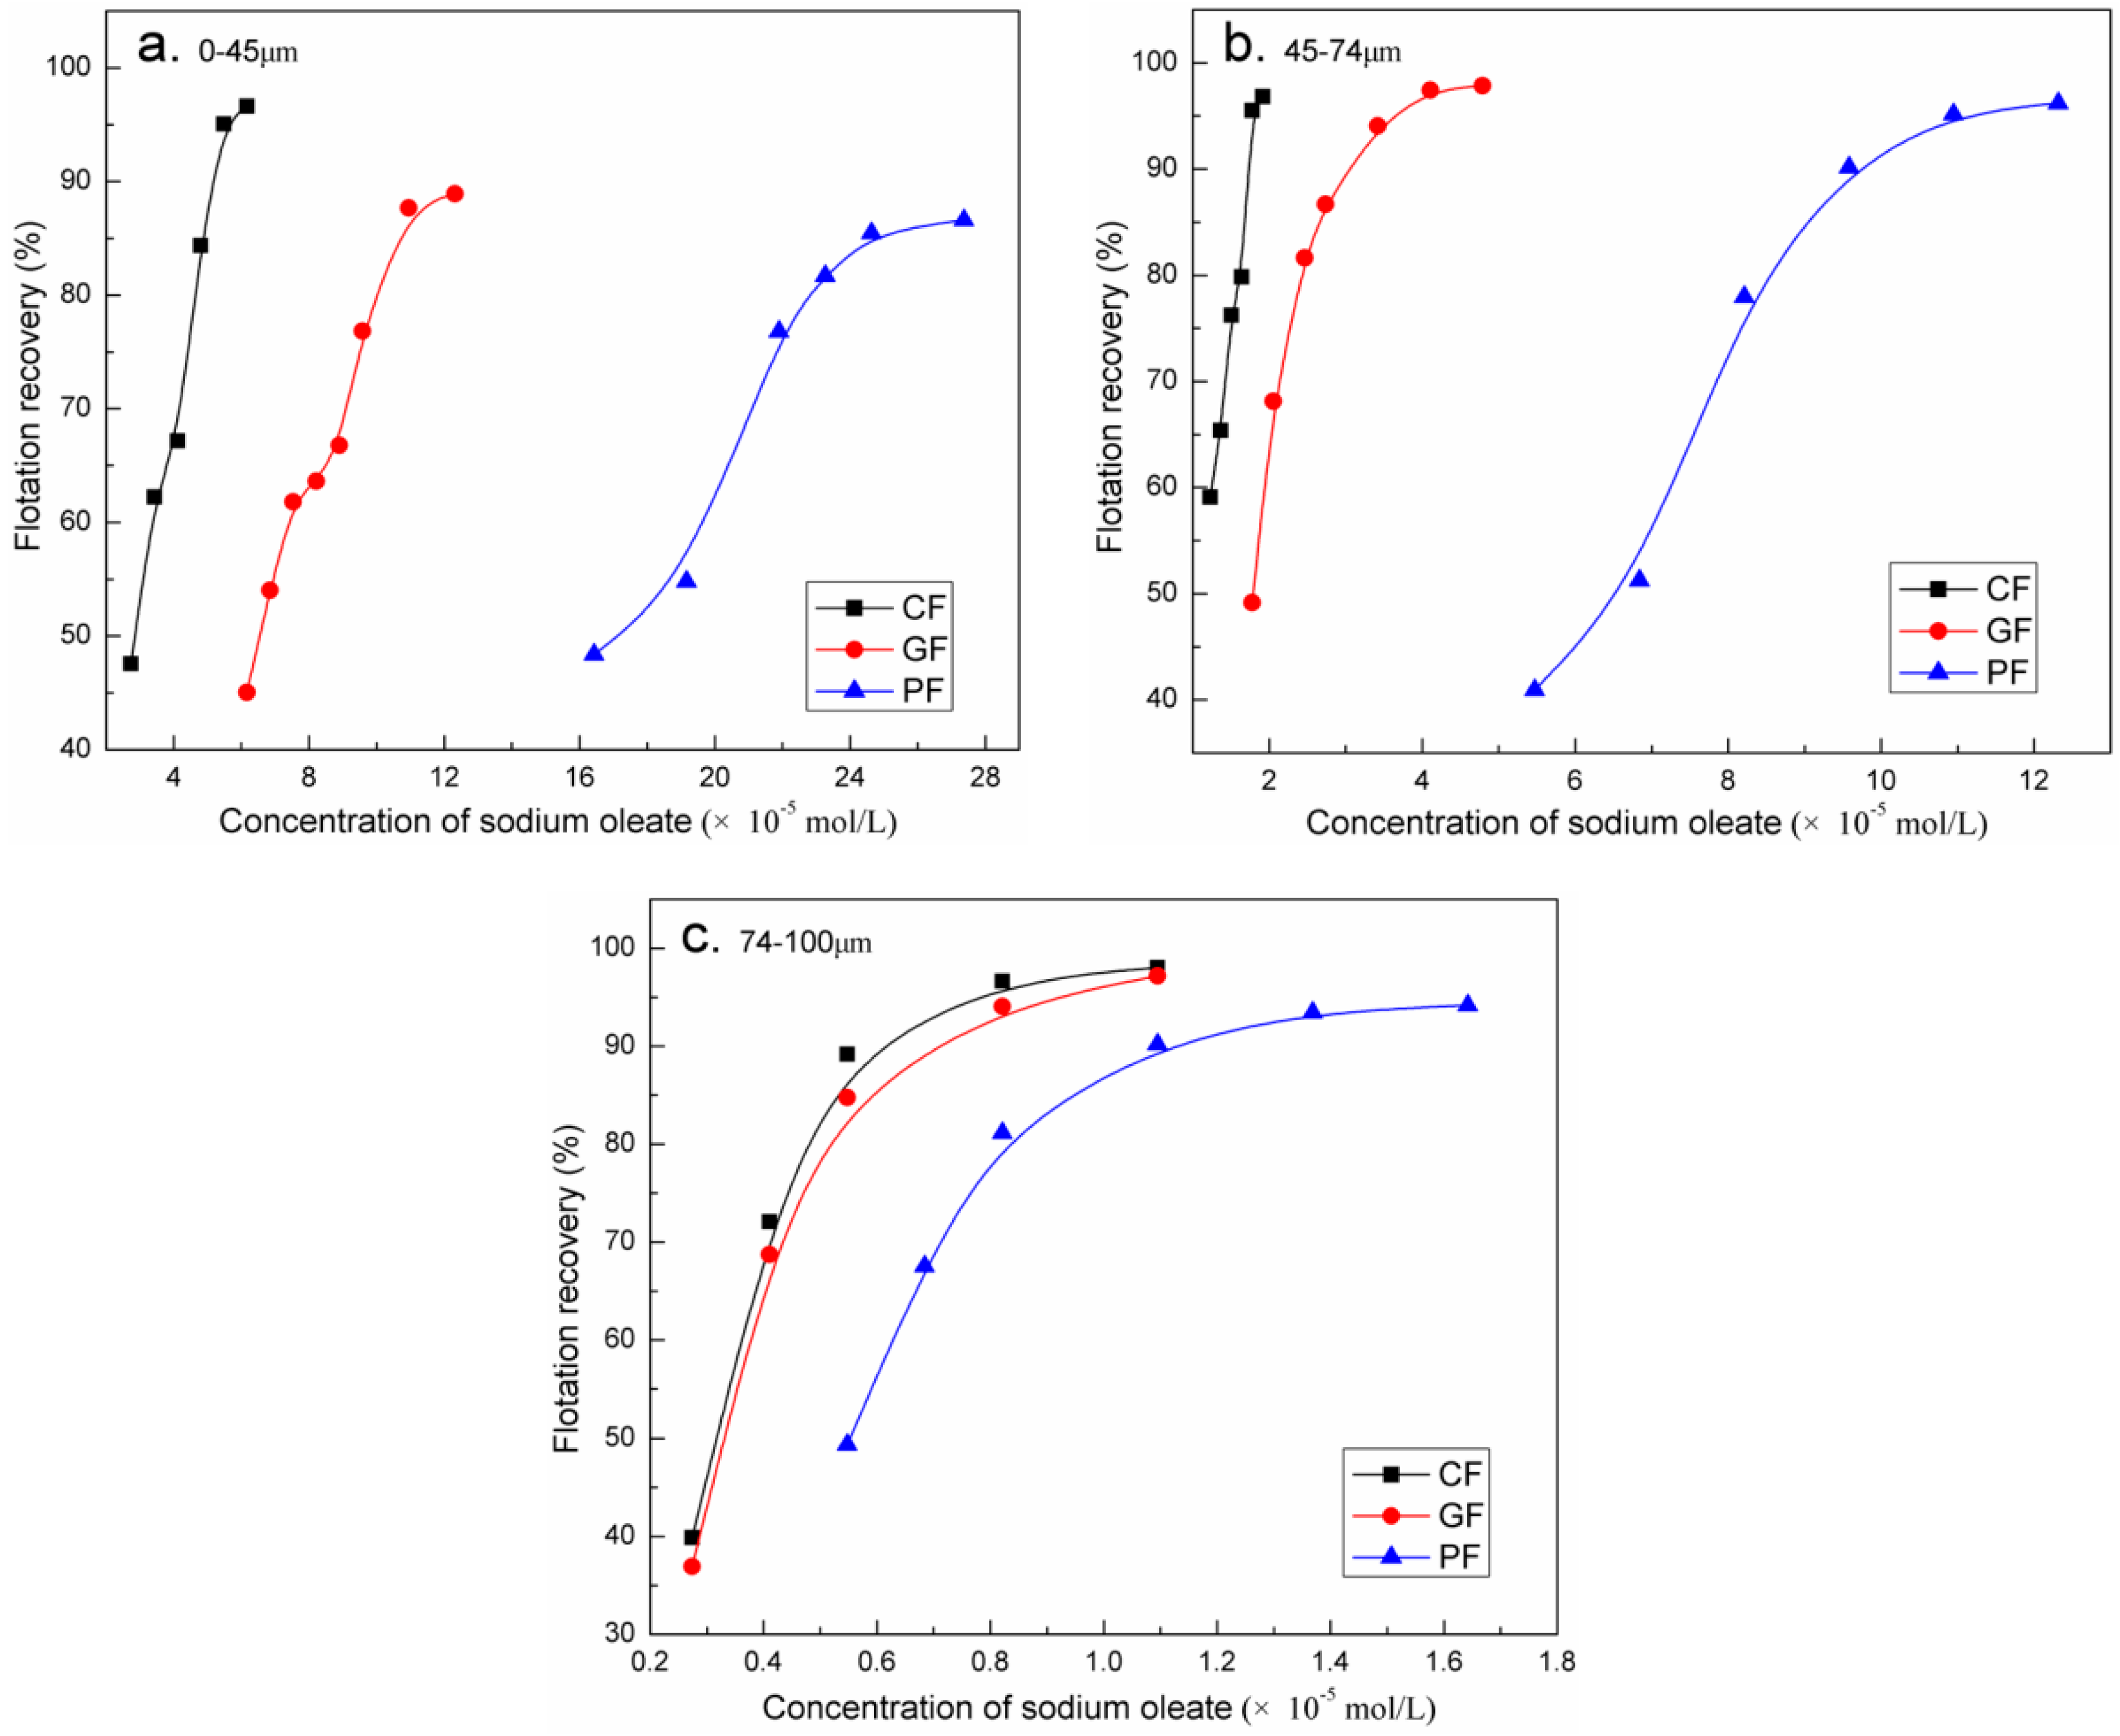
Micro-flotation tests were conducted to investigate the flotation behavior of fluorites of different colors by using NaOL as a collector. Figure 3 reveals the flotation recovery of different colored fluorites with three particle size fractions (74–100 μm, 45–74 μm, and 0–45 μm) as a function of NaOL dosage under neutral solutions. As shown in Figure 3, the general trend in flotation recovery of the three fluorites was similar for different size fractions with increasing NaOL dosages. The recovery of CF increased rapidly and achieved a high recovery rate of about 96%, even at low NaOL concentration, while the recoveries of GF and PF were low, especially for PF. The flotation experiments showed that CF had a much better flotation response with NaOL collectors than GF and PF. The flotation recovery gap was more prominent when the size fraction of fluorites decreased from 74–100 μm to 0–45 μm. The different flotation behaviors of the three colored fluorites could be attributed to the variation in surface properties of fluorite, even though all of them had a high CaF2 purity confirmed by XRD analyses.
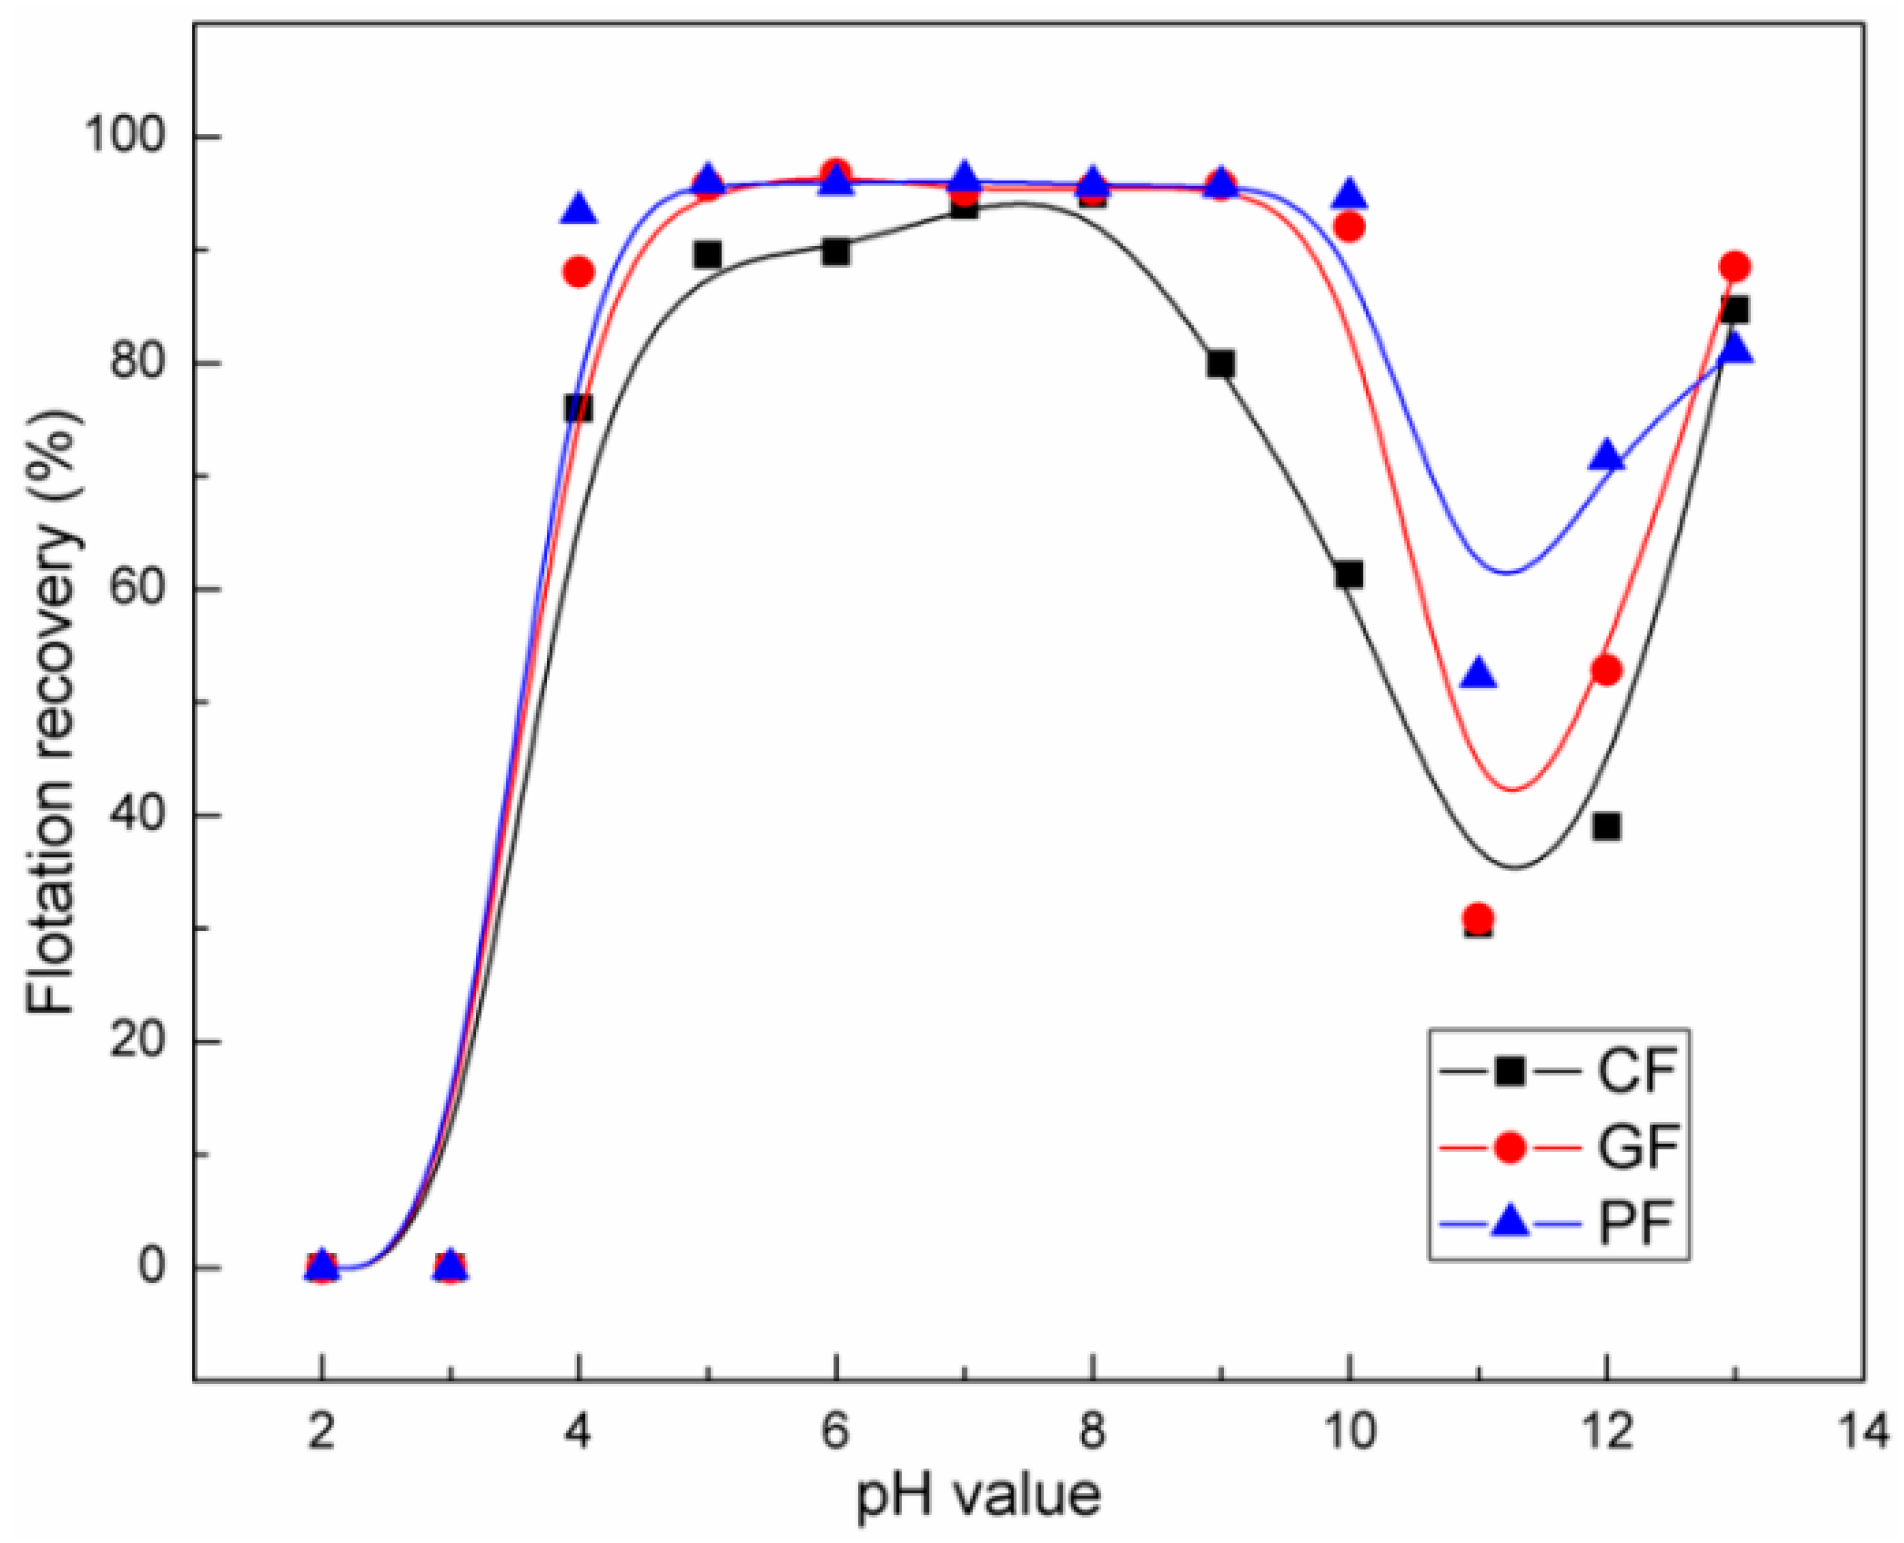
The effects of pulp pH value on flotation recovery of CF, GF, and PF were investigated at their optimal NaOL dosages of 1.78, 3.42, and 10.95 × 10⁻⁵ mol/L, respectively. The medium size fraction (45–74 μm) fluorite sample was used in the flotation tests and the results are given in Figure 4. As shown in Figure 4, the flotation recovery of GF and PF was obviously kept almost constant at a high level in the pH range of four to ten, and the recovery of CF reached a maximum at a pH of eight. The flotation recovery of the three fluorites decreased promptly when the pulp pH value was below four or greater than ten, which means the acidic and strong alkaline conditions are both adverse to the flotation of fluorite. An unexpected result as found when the flotation recovery no longer continued to decline, but began to increase as the pH value exceeded 11, which could be explained by the surface tension in the following section.
3.2. Adsorption Behavior of NaOL on Fluorite
The adsorption of the collector on the mineral surface plays a significant role in mineral wettability, which determines the flotation behavior of the mineral in a solution system. In contrast with micro-flotation tests, the adsorption capacity of NaOL on CF, GF, and PF was calculated and the results are plotted in Figure 5. The adsorption capacity of fluorites for NaOL was constant at a pH value of four to nine, and then decreased as the solution became strongly acidic or alkaline, which was consistent with the micro-flotation results. Notably, the absorption capacity of fluorites did not increase as the pH exceeded 11, which demonstrated that the high flotation recovery of fluorite in a strong alkaline solution (pH ≥ 11) was not due to the collector adsorption on the mineral surface. In addition, the NaOL adsorption capacity of PF was always much higher than GF and CF (Figure 2a), which showed less recovery at low collector concentration in micro-flotation tests. We concluded that the flotation recovery of mineral depends on not only the collector adsorption capacity on mineral surface, but also on the collector coverage rate on the mineral surface, which is influenced by the surface properties of the mineral, such as surface roughness. The adsorption capacity of CF, GF, and PF for NaOL was 2.27, 4.18, and 8.21 × 10⁻⁶ mol/g at pH of seven, respectively.
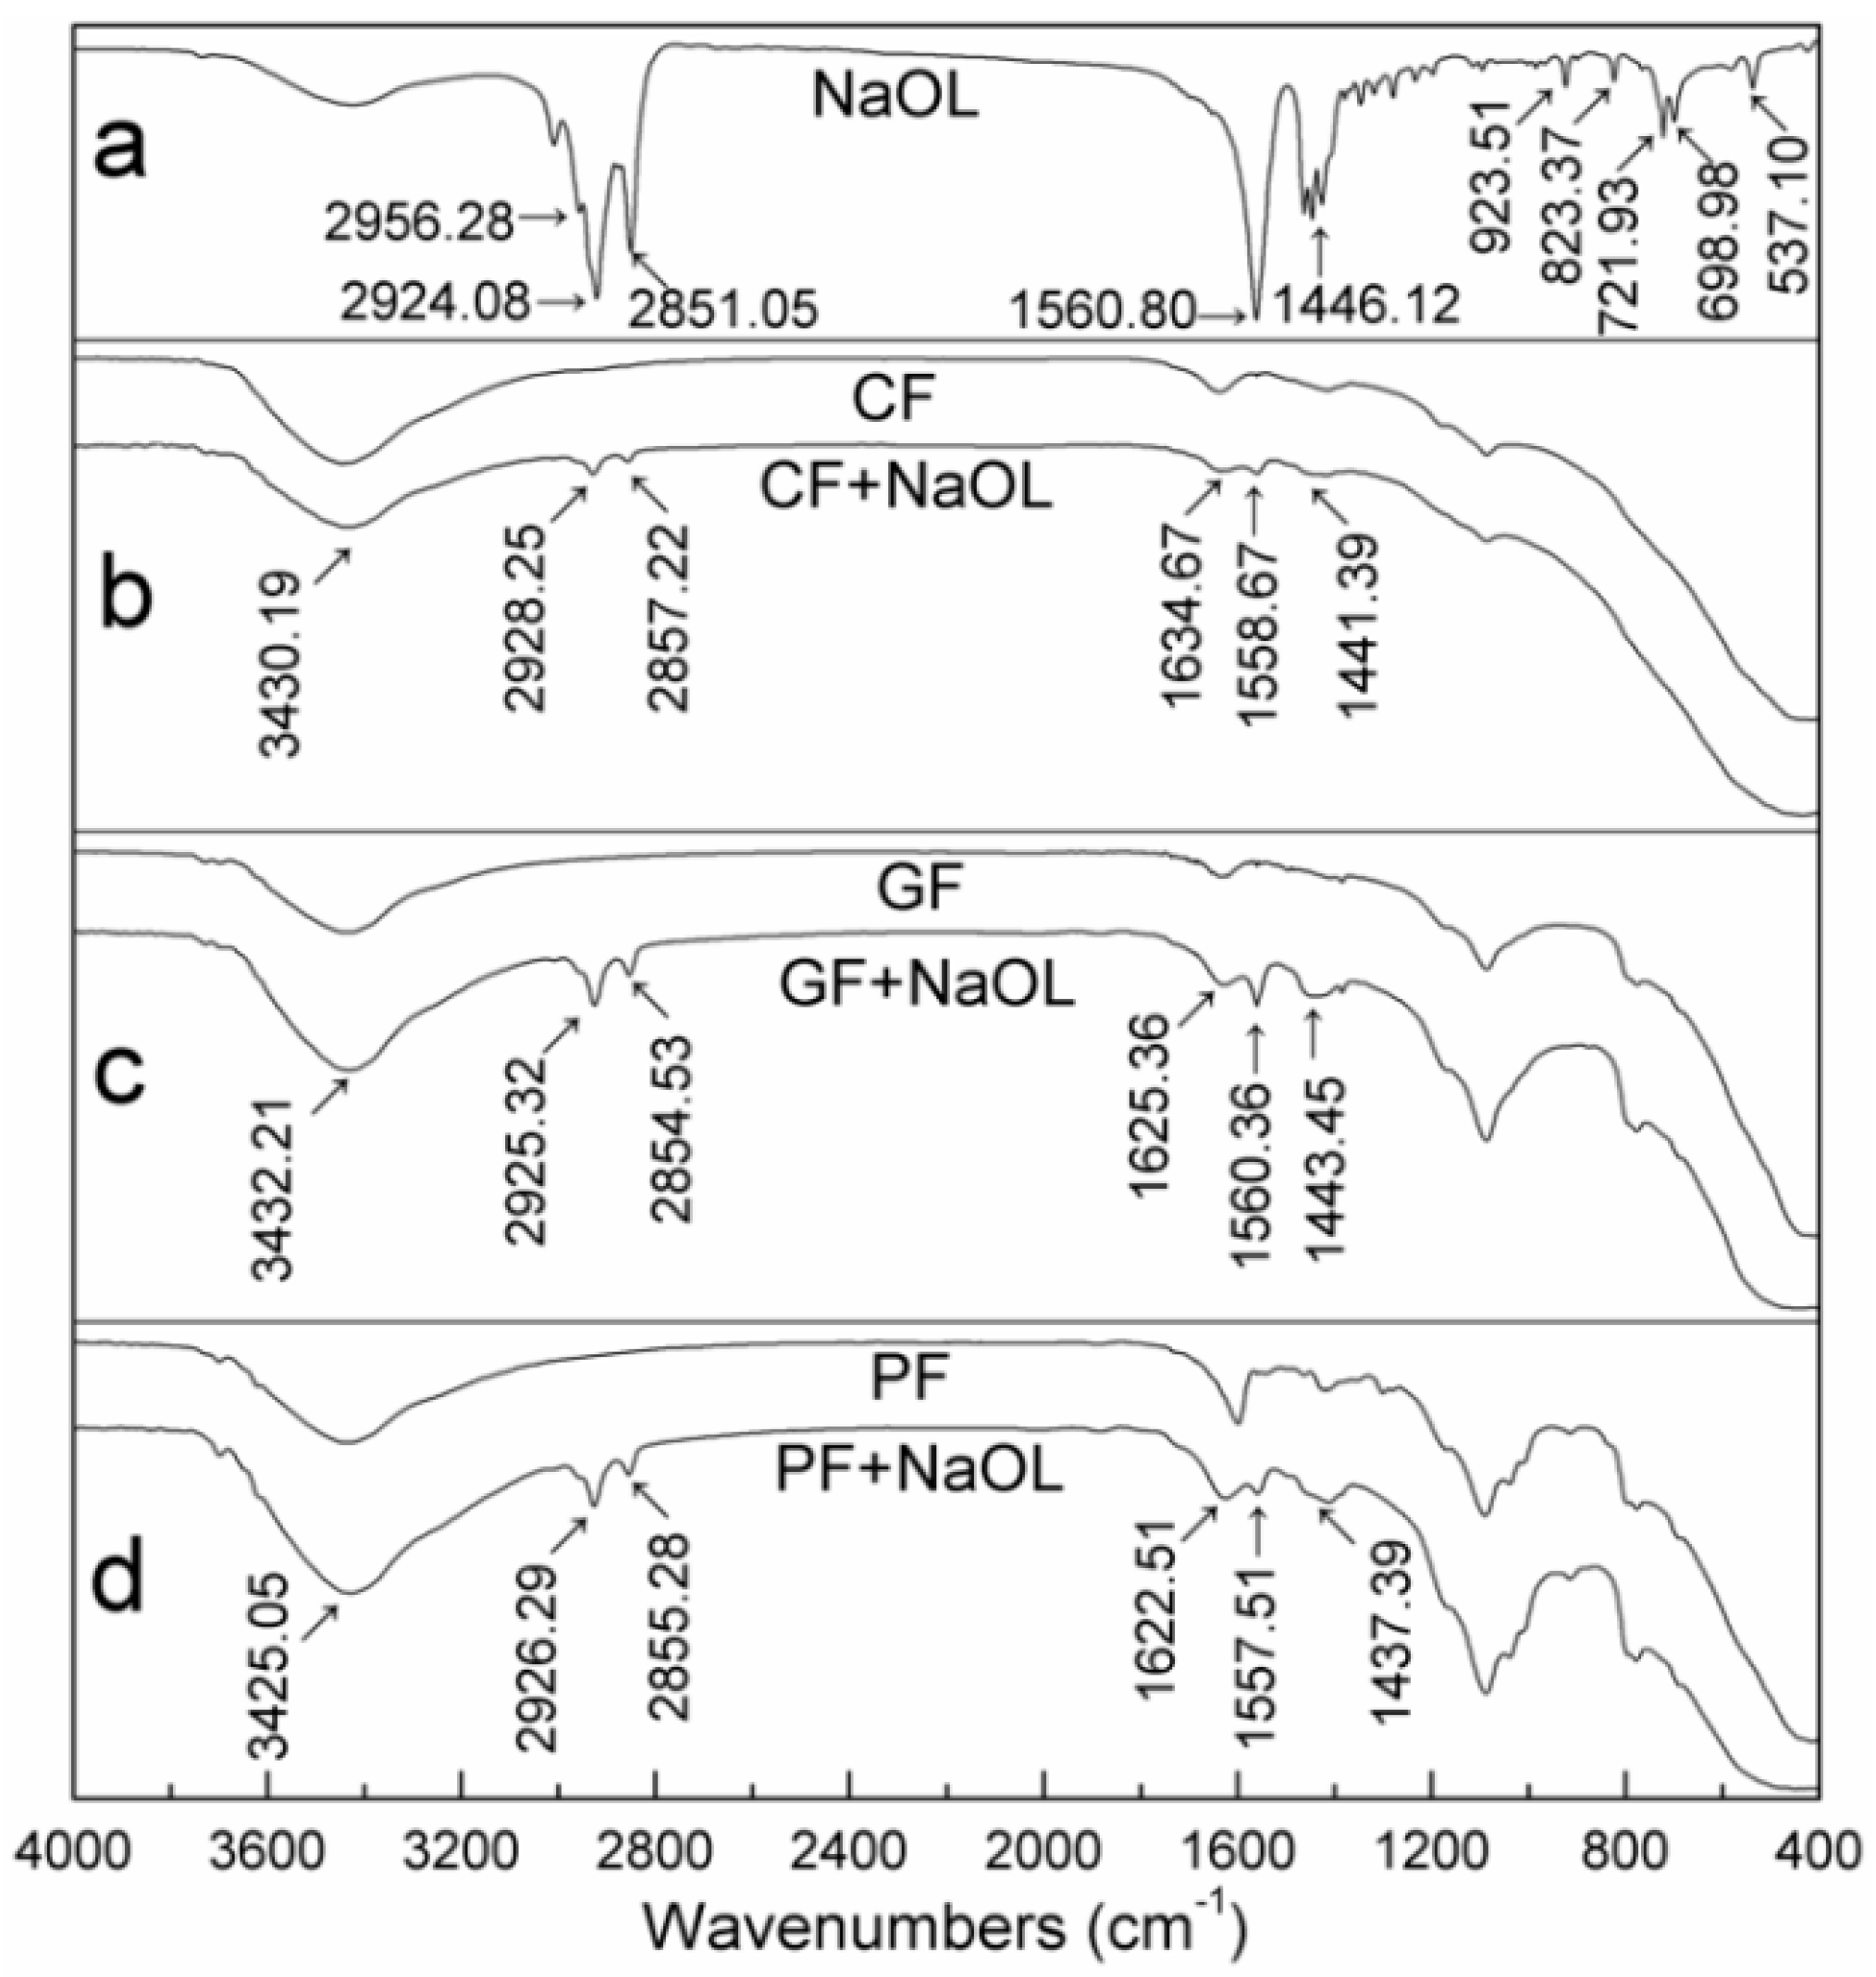
To further investigate the adsorption behavior of NaOL on the three fluorites, the infrared spectra of fluorites, before and after treatment with NaOL, were measured. The results are shown in Figure 6. The absorption band around 2956 cm−1 in Figure 6a is related to the asymmetric stretching vibration of –CH3 in NaOL, and the peaks around 2924 and 2851 cm−1 were attributed to –CH2 asymmetric and symmetric stretching frequencies [18]. The FT-IR spectrum of NaOL exhibited two strong bands at 1446 and 1561 cm−1, which were attributed to the asymmetric and symmetric stretching vibrations of the –C=O in the carboxyl of NaOL. Compared to the untreated fluorites, several obvious adsorption bands corresponding to the –C=O (1561 and 1446 cm−1) and –CH2 (2924 and 2851 cm−1) stretching vibrations were all observed in the spectra of CF, GF, and PF treated by NaOL, which is in agreement with the data obtained by Mielczarski et al. [19,20]. In contrast with bulk NaOL, the stretching frequencies were observed to shift toward higher values for –CH2 vibrations and lower values for –C=O vibrations. The chemisorption of NaOL on the fluorites surface is clearly attributed to the Ca sites [20,21].
3.3. Measurement of NaOL Solution Surface Tension
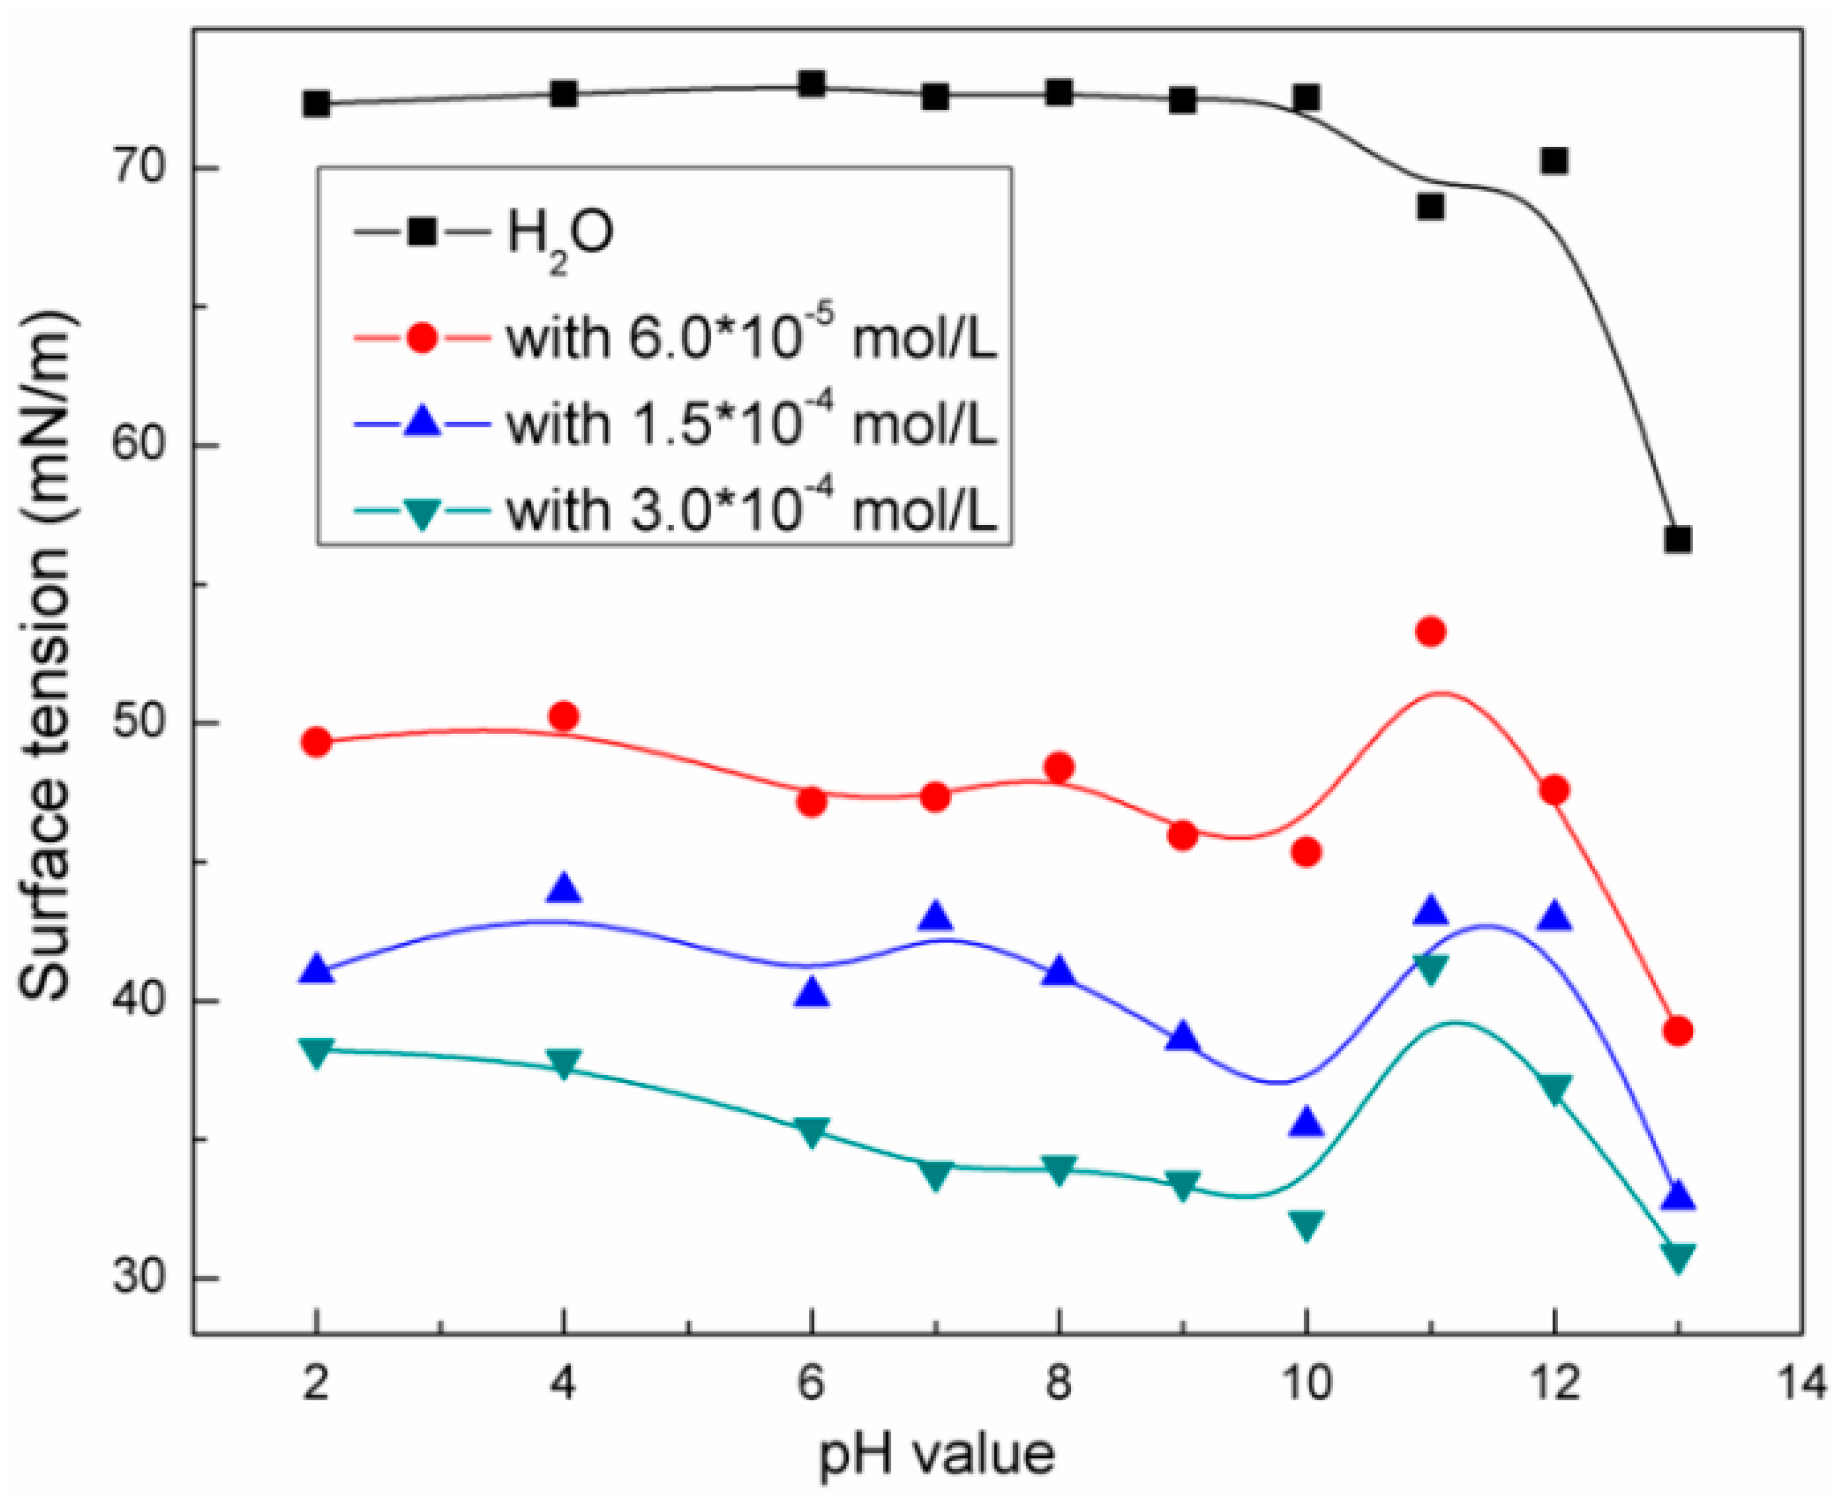
The hydrophilic and hydrophobic properties of solid surface are important factors affecting the wetting film stability during the flotation process. The properties of a liquid, such as surface tension, are of equal importance because flotation is a complex process involving all three phases of liquid, gas, and solid. Surfactants can reduce the surface tension of water and make it easier to form bubbles, which are necessary for separation by flotation. The surface tension of NaOL solution, at different concentrations as a function of pH, was measured. The surface tension of NaOL solution decreased with an increase in NaOL concentration under different pH solutions, and reached a minimum in the slightly alkaline pH range (Figure 7). Yu et al. [22] also found the same for oleic acid solutions. The surface tension of deionized water at different pH conditions was measured for comparison and we found that the surface tension of water decreased from 73.02 nN/m to 56.62 nN/m as the solution pH exceeded 11. Combined with the flotation tests, high flotation recovery of fluorites occurred with low adsorption capacity for NaOL when the solution pH exceeded 11. We concluded that the high recovery of fluorite is mainly due to the decline of water surface tension at high pH, facilitating the formation of bubbles as surfactants with the addition of NaOL, which floats the fluorite samples in a mechanical entrapment method.
3.4. Zeta Potential Measurement Results
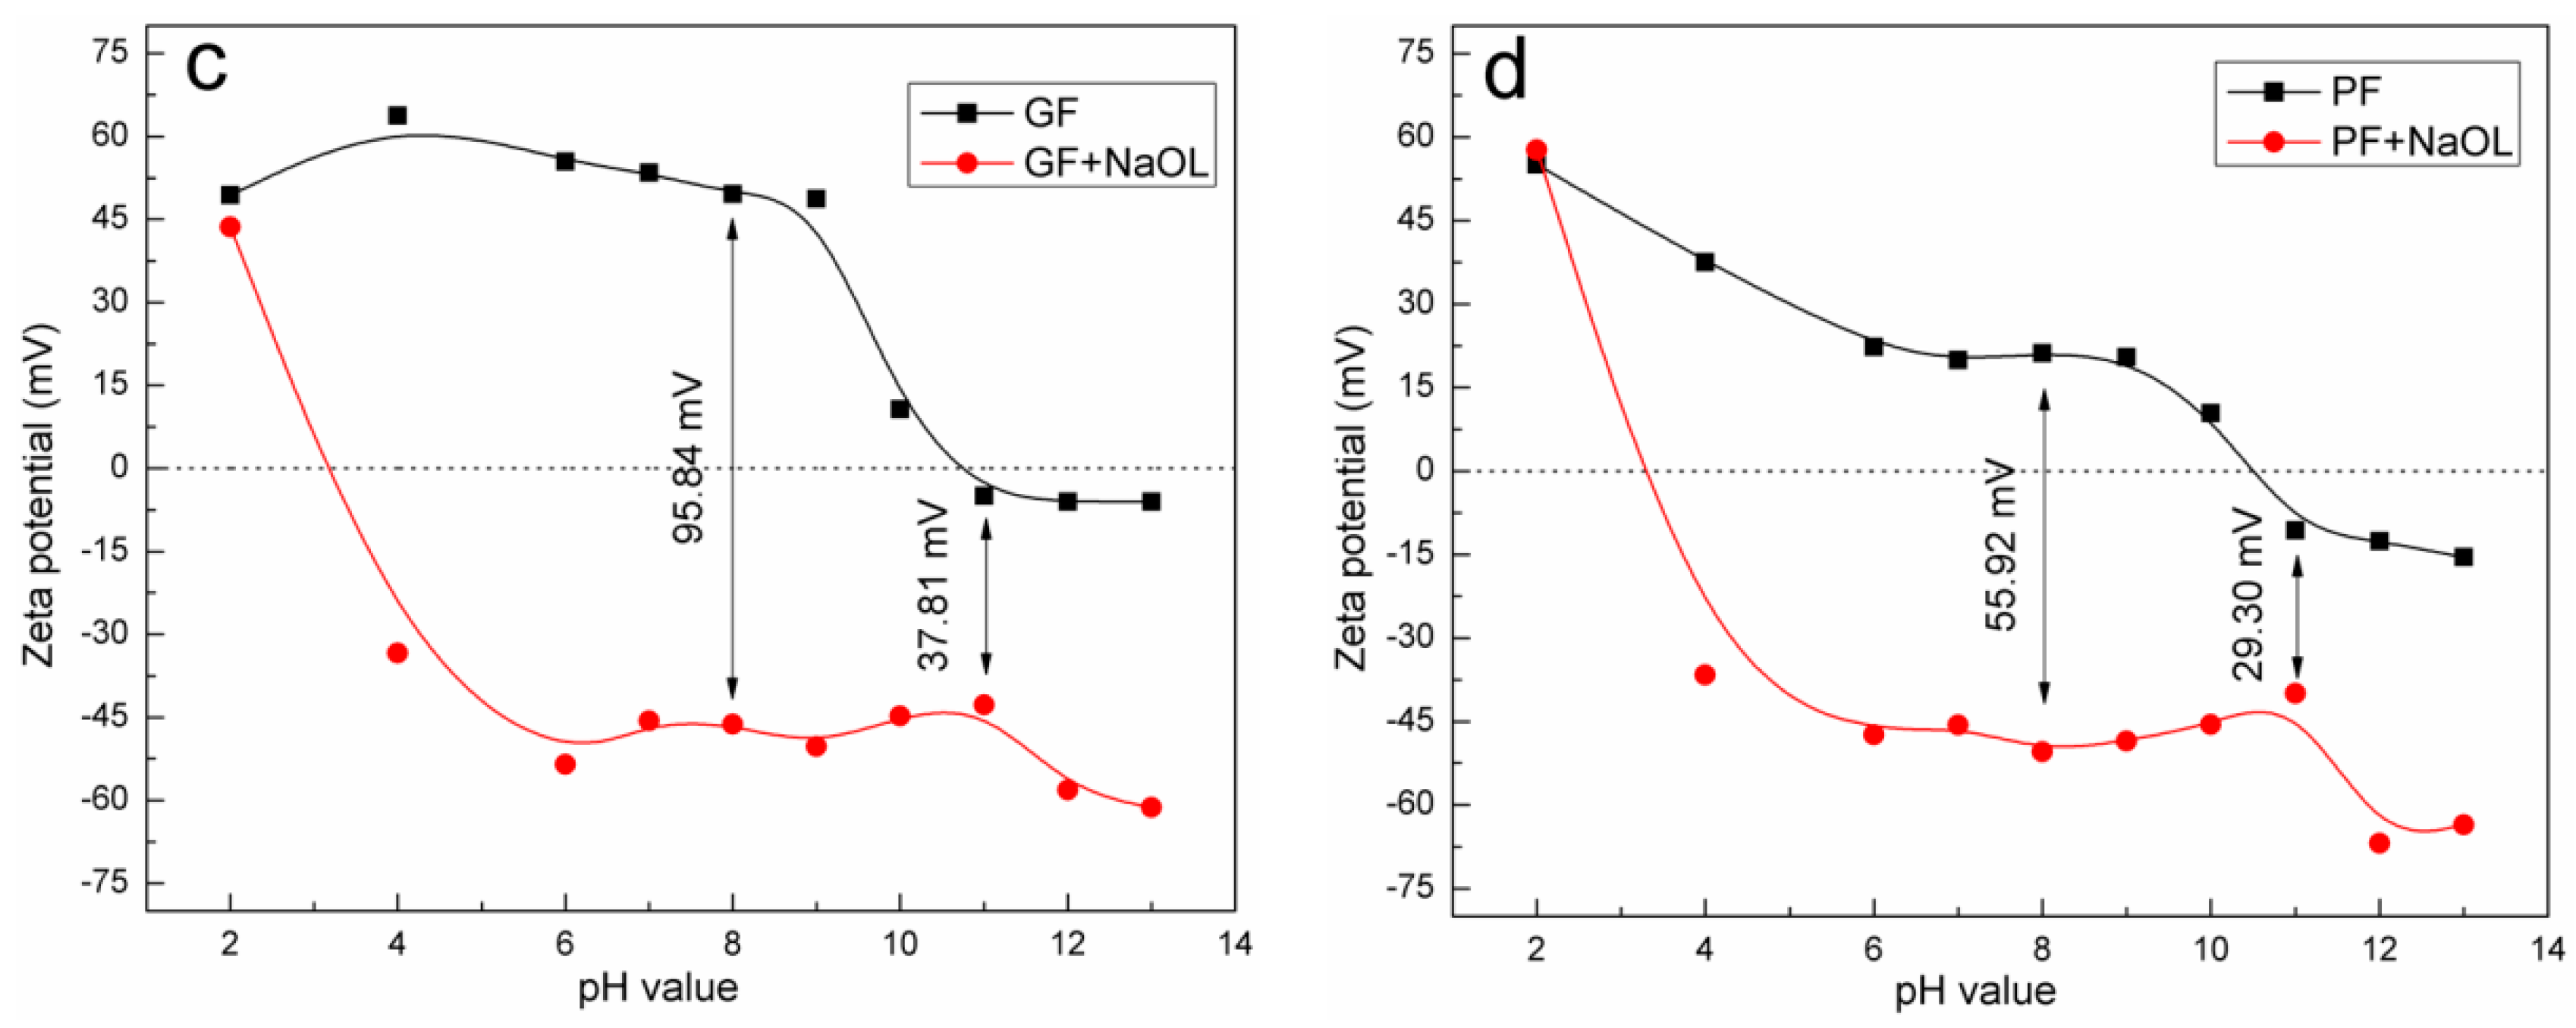
The electrokinetic characteristics of the mineral/water interface are important for understanding both interfacial characteristics and flotation phenomena To determine the surface properties of the three colored fluorites and further understand their adsorption mechanism for NaOL, the zeta potentials of the fluorites, both in absence and presence of NaOL as a function of solution pH, were measured and the results are illustrated in Figure 8. The results indicated that the zeta potentials of fluorites were pH-dependent. The iso-electric points (IEPs) of the fluorites in aqueous solution were at the pH values of 10.80, 10.75, and 10.50 for CF, GF, and PF, respectively. CF and GF took on a high positive zeta potential around 55–65 mV and remained fairly constant when the solution pH was below 8. PF exhibited very low, although positive, zeta potential of about 20 mV for pH values of six to nine. Previous studies verified that the decline of the zeta potential of fluorite with increasing pH could be attributed to increasing surface carbonation, gradually changing the surface from that of fluorite to that of calcite [23,24,25]. Hence, the lower positive zeta potential of PF in a weak acid condition may be due to its surface carbonation, further reducing its floatability compared to CF and GF.
After the adsorption of NaOL, the zeta potentials and IEPs of fluorites shifted to a distinctly more acidic value. The most likely reason for this was that the anionic NaOL was adsorbed on the positively charged fluorite surface by electrostatic attraction at pH < IEP. The inclination of anionic NaOL was to be adsorbed onto the fluorite surface by chemisorption at pH > IEP, where the fluorite surface exhibited a negative charge. Additionally, the anionic NaOL has been inferred as not being adsorbed on the negatively charged mineral by physical adsorption [26].
3.5. Surface Topographic Analyses
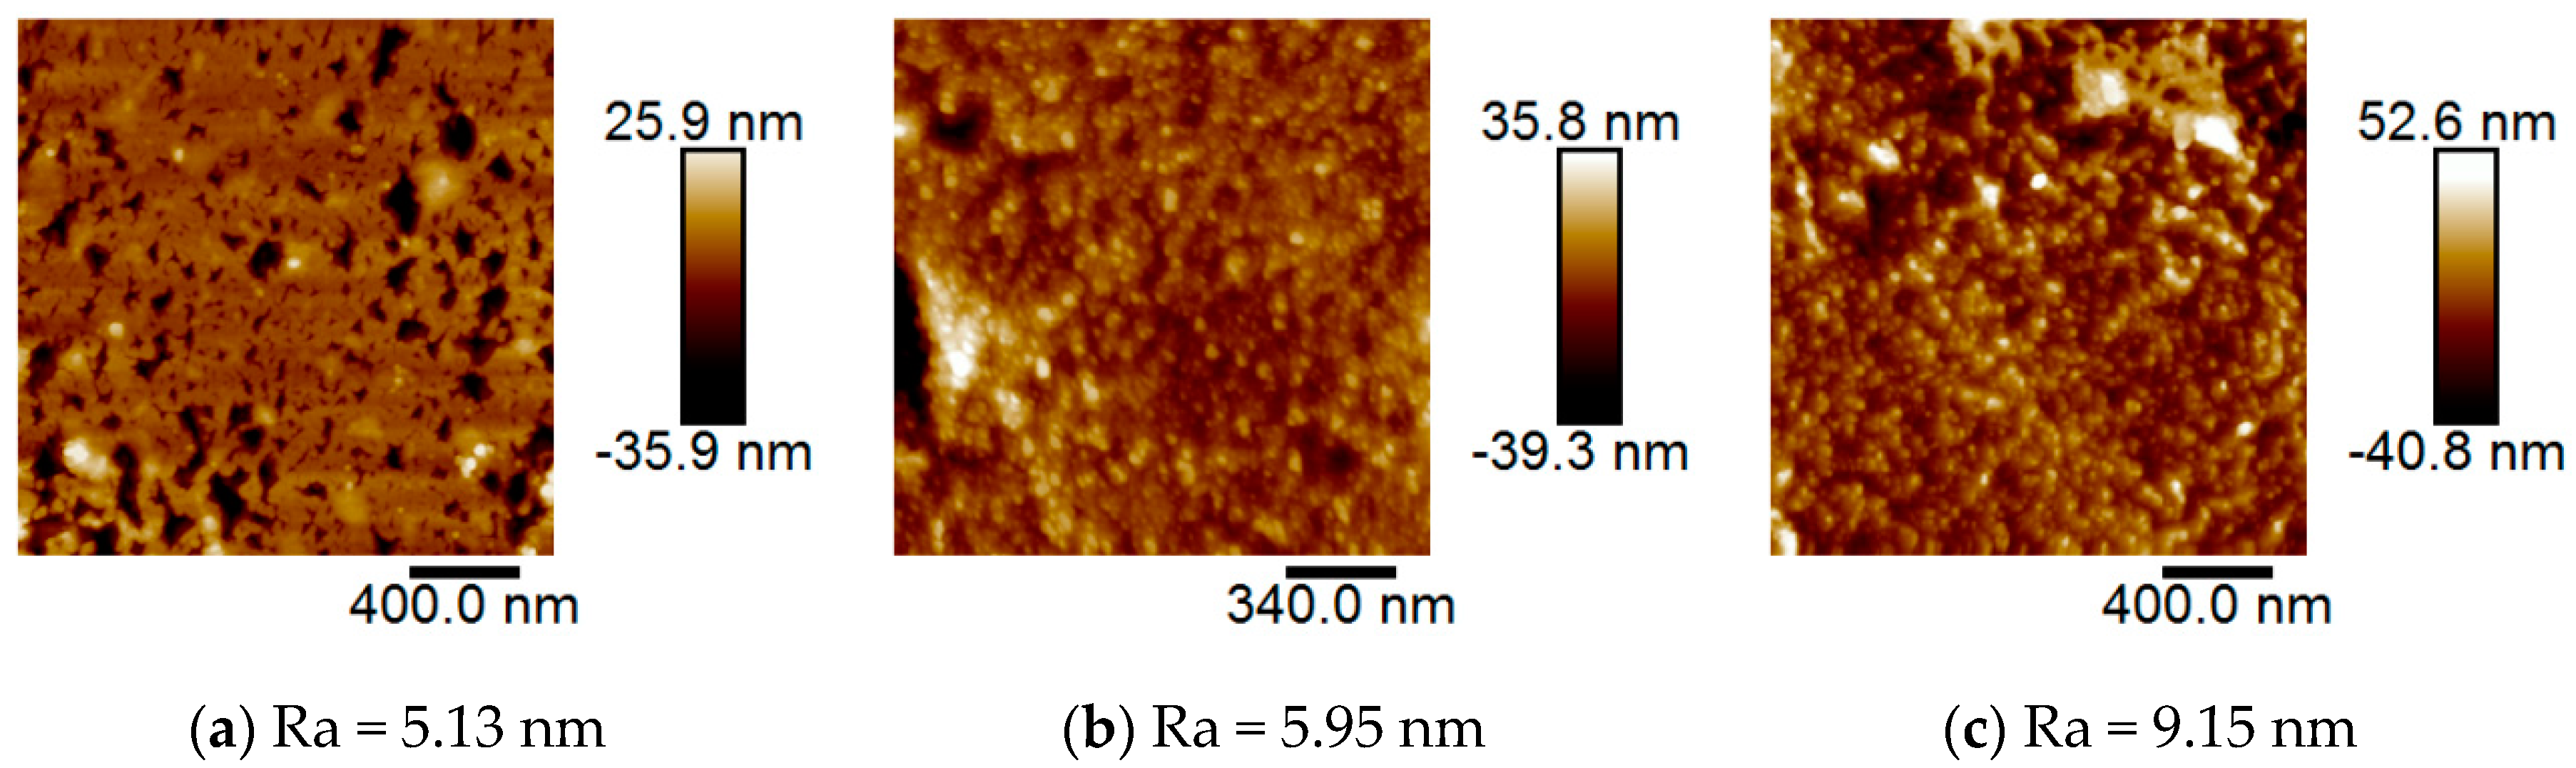
The surface microstructure of fluorite crystals was measured using atomic force microscope (AFM) in tapping mode, which was reported to be reliable for examining the microscopic morphology of the mineral surface under ambient conditions [27]. Figure 9 shows the representative AFM images of 2.0 × 2.0 μm2 of the different colored fluorite crystal surfaces under the same pretreatment, and the related average surface roughness was simultaneously given by statistical calculation for a large number of AFM images. The surface morphology of three colorless and colored fluorite crystals was completely different from the AFM images. The average surface roughness of CF, GF, and PF was 5.13 nm, 5.95 nm, and 9.15 nm, respectively. The surface roughness influences the surface properties of mineral particles, such as floatability, wettability, and hydrophobicity. Xia et al. [28] found that the natural wettability of both natural and gold coated coal surfaces is directly affected by its surface roughness. Zawala et al. [29] found that larger roughness and irregularities of the fluorite surface can shorten the time of the liquid/gas/solid three-phase contact formation by colliding bubbles. In our investigation, we concluded that the rough fluorite surface (PF) could provide more active sites for NaOL adsorption than the smooth fluorite surface (CF), which agrees with the results obtained for NaOL adsorption on the fluorite surface. On the other hand, in considering the zeta potential results where PF exhibited a lower positive zeta potential than CF and GF mainly due to its surface carbonation [25], an internal relationship would exist between the surface roughness and the surface carbonation of fluorites.
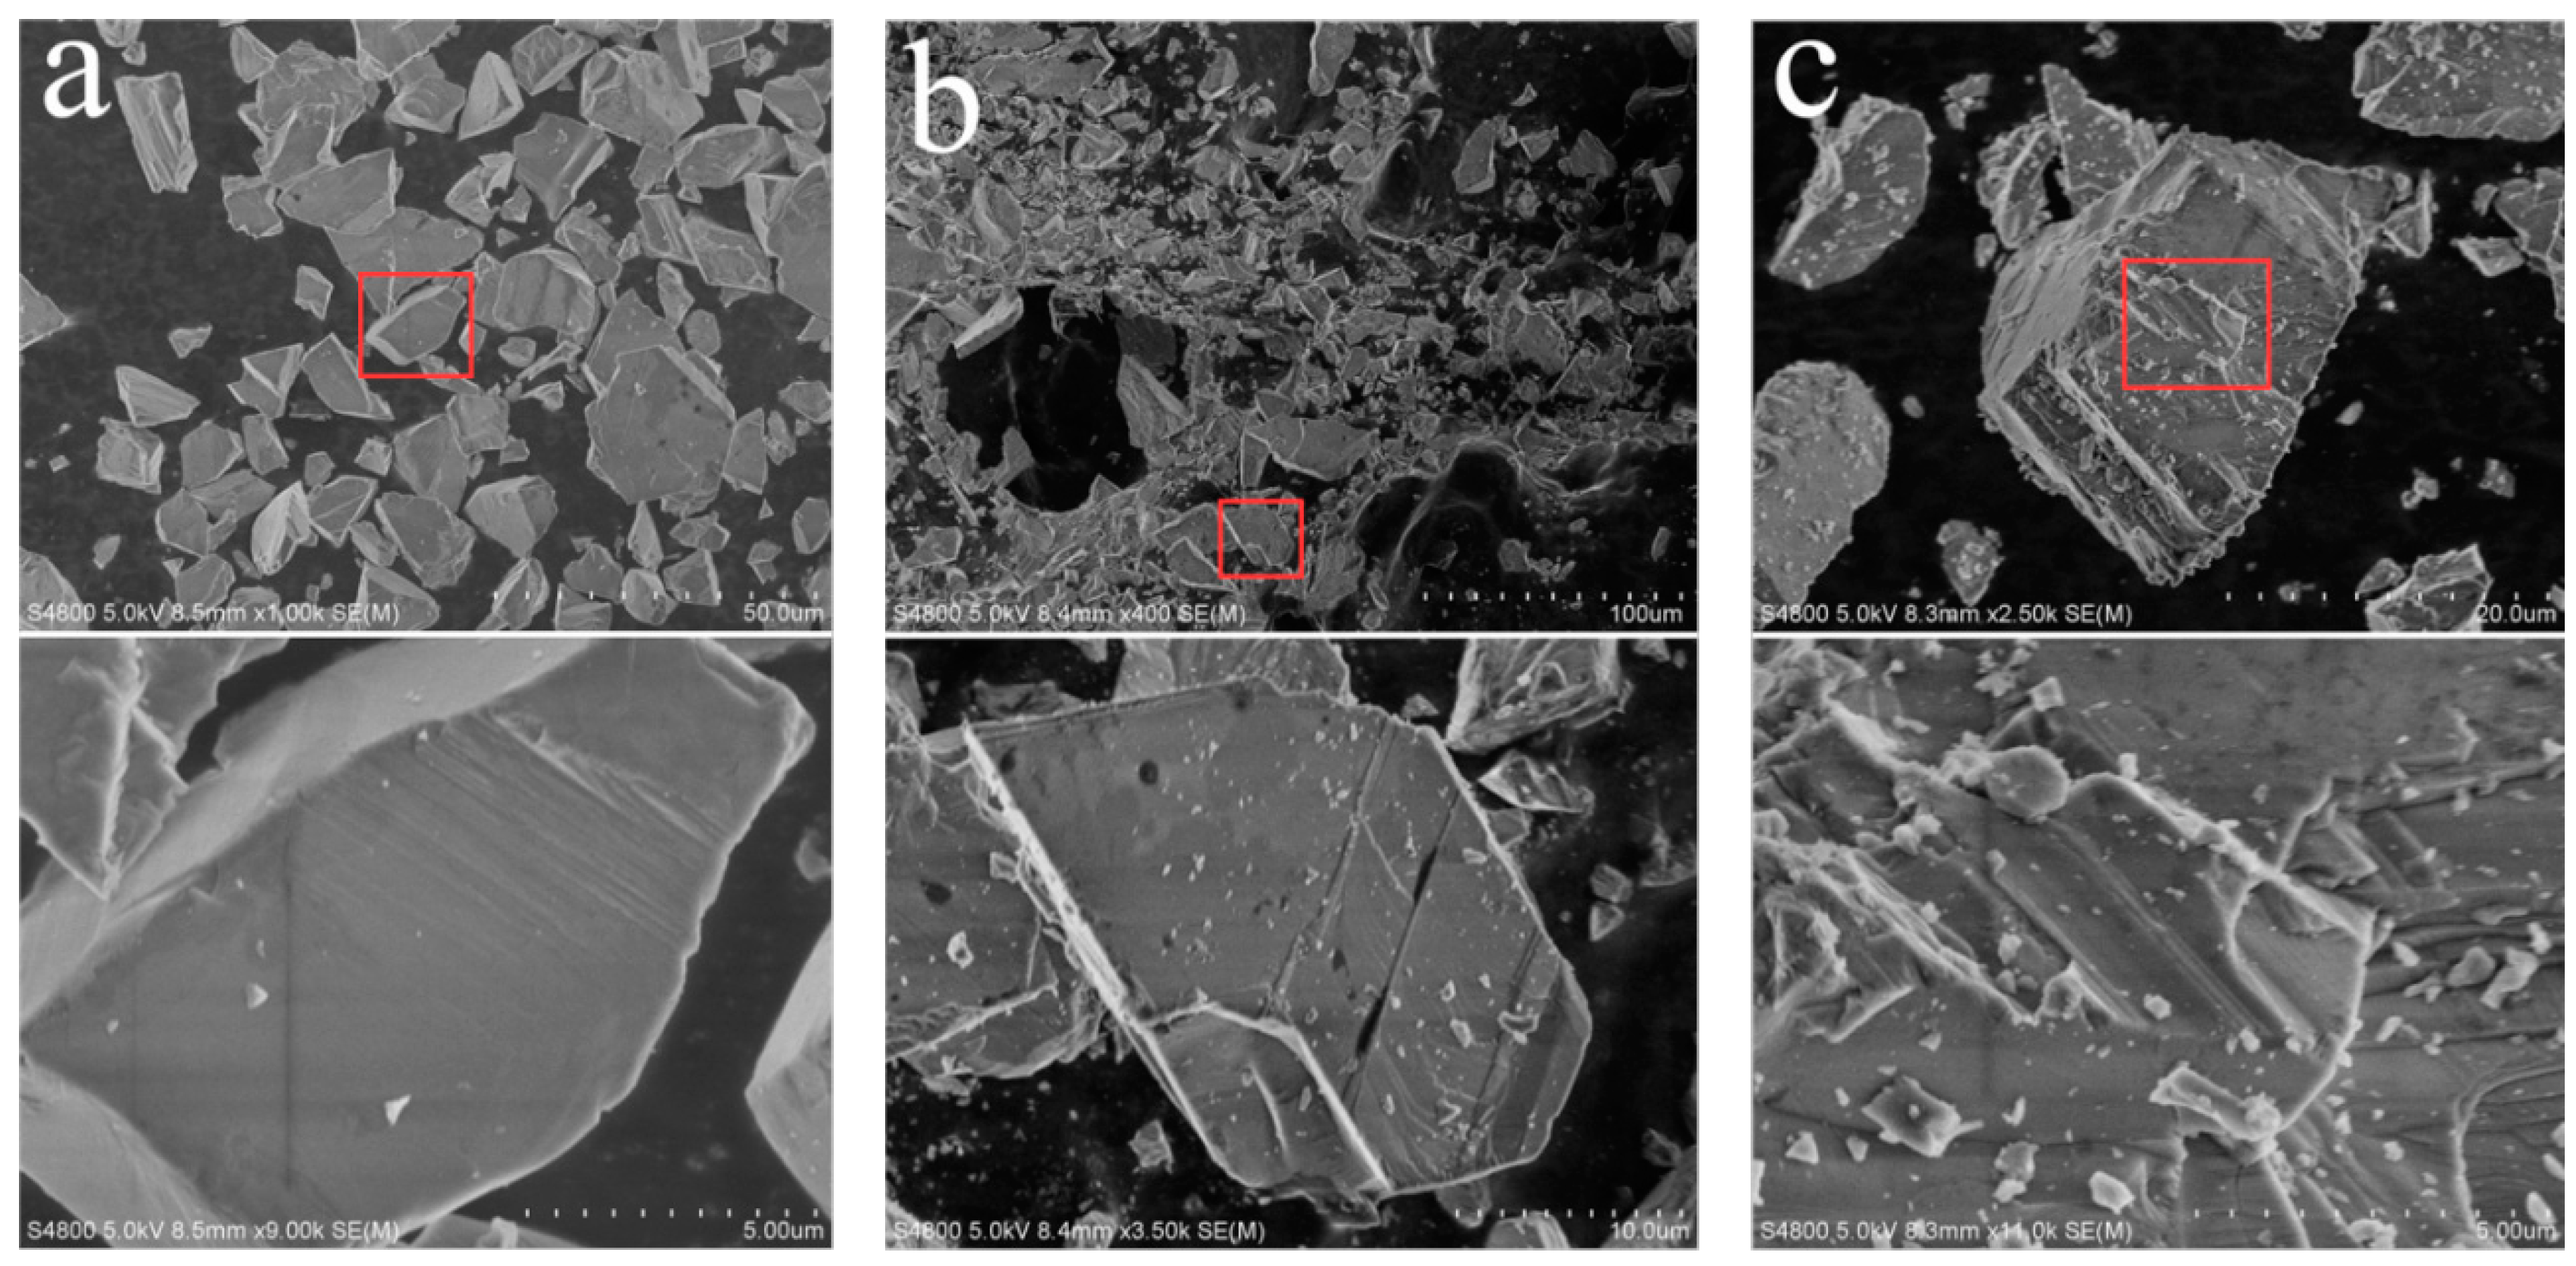
AFM analysis was based on the fluorite crystal block samples, which might not fully reflect the characteristics of the particle samples that were used in flotation experiment. Therefore, the topographies of the particle samples with 0–45 μm diameters were analyzed by SEM, and the images are shown in Figure 10. The three fluorite particle samples exhibited different surface appearances. The surface of CF was smooth and clear without tiny particles attached to the surface. GF had a rougher surface than CF, with slight fine particles on the surface. PF was completely different; the surface was rugged and uneven and many fine particles were seen sticking to the surface. The surface roughness of the three fluorite particle samples was consistent with the block samples measured by AFM, which was also consistent with the floatability of the fluorite samples.
4. Conclusions
The flotation behaviors of three natural colorless and colored fluorites were investigated and the colorless fluorite (CF) was found to have a much better flotation response with NaOL collectors than green fluorite (GF) and purple fluorite (PF), even though PF had a higher adsorption capacity for NaOL than the others. FT-IR measurements revealed chemisorption of the NaOL collector occurred with the Ca sites on the surface of the fluorites. Zeta potential measurements demonstrated that PF exhibited lower positive zeta potential than CF and GF at pH < IEP, mainly due to its surface carbonation, which could depress the response to NaOL. We concluded that the collector coverage rate on mineral surface plays a significant role in the floatability of mineral particles, which is directly influenced by the mineral’s surface roughness. A rough fluorite surface (PF) provides more active sites for NaOL adsorption than a smooth surface, which was confirmed by AFM and SEM measurements. The findings in this work reveal the discrepancy of floatability existing between colorless and colored fluorite, which should be an area a focus during mineral processing, especially for the flotation separation of different colored fluorites.
Surface roughness has been confirmed as one of the important factors in determining the floatability of minerals in this study. However, further work is still needed to investigate the internal relationship between the different colored fluorites and their surface properties, such as the effects of trace or rare earth elements and lattice imperfections of different colored fluorites on their surface properties.
Acknowledgments
The authors acknowledge the financial supports of this study from the National Natural Science Foundation (51504173) of China and the Fundamental Research Funds for the Central Universities (WUT: 2016IVA048).
Author Contributions
R.Z. and Z.R. conceived and designed the experiments; R.Z. performed the experiments; R.Z. and Z.R. analyzed the data; H.G. and Y.Q. contributed reagents/materials/analysis tools; R.Z. wrote the paper.
Conflicts of Interest
The authors declare no conflict of interest.
References
- Garand, A.; Mucci, A. The solubility of fluorite as a function of ionic strength and solution composition at 25 °C and 1 atm total pressure. Mar. Chem. 2004, 91, 27–35. [Google Scholar] [CrossRef]
- Zhang, Y.; Song, S. Beneficiation of fluorite by flotation in a new chemical scheme. Miner. Eng. 2003, 16, 597–600. [Google Scholar] [CrossRef]
- Akgün, A.; Teğin, İ.; Ziyadanoğullari, R. Enrichment of molybdenum and fluorite by flotation of fluorite ore containing molybdenum. J. Miner. Mater. Charact. Eng. 2006, 5, 103–117. [Google Scholar] [CrossRef]
- Hanna, H.S.; Somasundaran, P. Flotation of salt-type minerals. In Flotation: A. M. Gaudin Memorial Volume; Fuerstenau, M.C., Ed.; AIME: New York, NY, USA, 1976; pp. 197–272. [Google Scholar]
- Finkelstein, N.P. Review of interactions in flotation of sparingly soluble calcium minerals with anionic collectors. Trans. Inst. Min. Metall. 1989, 98, 157–177. [Google Scholar]
- Somasundaran, P.; Healy, T.W.; Fuerstenau, D.W. Surfactant adsorption at the solid-liquid interface-dependence of mechanism on chain length. J. Phys. Chem. 1964, 68, 3562–3566. [Google Scholar] [CrossRef]
- Chennakesavulu, K.; Raju, G.B.; Prabhakar, S.; Nair, C.M.; Murthy, K.V.G.K. Adsorption of oleate on fluorite surface as revealed by atomic force microscopy. Int. J. Miner. Process. 2009, 90, 101–104. [Google Scholar] [CrossRef]
- Gao, Z.; Bai, D.; Sun, W.; Cao, X.; Hu, Y. Selective flotation of scheelite from calcite and fluorite using a collector mixture. Miner. Eng. 2015, 72, 23–26. [Google Scholar] [CrossRef]
- Ren, Z.; Yu, F.; Gao, H.; Chen, Z.; Peng, Y.; Liu, L. Selective separation of fluorite, barite and calcite with valonea extract and sodium fluosilicate as depressants. Minerals 2017, 7, 24. [Google Scholar] [CrossRef]
- Singh, R.K. EPR study of yellow and colourless fluorite from carbonatite rocks of Ambadongar, Gujarat. J. Geol. Soc. India 2011, 77, 381–384. [Google Scholar] [CrossRef]
- Bill, H.; Calas, G. Color centers, associated rare-earth ions and the origin of coloration in natural fluorites. Phys. Chem. Miner. 1978, 3, 117–131. [Google Scholar] [CrossRef]
- Gu, H.; Ma, D.; Chen, W.; Zhu, R.; Li, Y.; Li, Y. Electrolytic coloration and spectral properties of natural fluorite crystals containing oxygen impurities. Spectrochim. Acta. A 2011, 82, 327–331. [Google Scholar] [CrossRef] [PubMed]
- Braithwaite, R.S.W. The cause of the colour of Blue John and other purple fluorites. Miner. Mag. 1973, 39, 401–411. [Google Scholar] [CrossRef]
- Engelhardt, J.B.; Dabringhaus, H.; Wandelt, K. Atomic force microscopy study of the CaF2(111) surface: From cleavage via island to evaporation topographies. Surf. Sci. 2000, 448, 187–200. [Google Scholar] [CrossRef]
- Ferreira, F.A.F., Jr.; Yoshimura, E.M.; Umisedo, N.K.; Nascimento, R.P.D. Correlation of optically and thermally stimulated luminescence of natural fluorite pellets. Radiat. Meas. 2014, 71, 254–257. [Google Scholar] [CrossRef]
- Zawala, J.; Drzymala, J.; Malysa, K. Natural hydrophobicity and flotation of fluorite. Physicochem. Probl. Miner. 2007, 41, 5–11. [Google Scholar]
- Bakakin, V.V. Questions on relation of minerals structure and their flotation properties. J. Struct. Chem. 1960, 1, 89–97. [Google Scholar] [CrossRef]
- Wang, L.; Sun, W.; Hu, Y.; Xu, L. Adsorption mechanism of mixed anionic/cationic collectors in muscovite-quartz flotation system. Miner. Eng. 2014, 64, 44–50. [Google Scholar] [CrossRef]
- Mielczarski, E.; Donato, P.D.; Mielczarski, J.A.; Cases, J.M.; Barres, O.; Bouquet, E. Solution chemistry in adsorption layer formation of oleate on fluorite. J. Colloid. Interf. Sci. 2000, 226, 269–276. [Google Scholar] [CrossRef]
- Mielczarski, J.A.; Mielczarski, A.E.; Cases, J.M. Dynamics of fluorite-oleate interactions. Langmuir 1999, 15, 500–508. [Google Scholar] [CrossRef]
- Mielczarski, E.; Mielczarski, J.A.; Cases, J.M.; Bai, B.; Pradip. Influence of solution conditions and mineral surface structure on the formation of oleate adsorption layers on fluorite. Colloid. Surf. A 2002, 205, 73–84. [Google Scholar] [CrossRef]
- Yu, F.; Wang, Y.; Zhang, L.; Zhu, G. Role of oleic acid ionic-molecular complexes in the flotation of spodumene. Miner. Eng. 2015, 71, 7–12. [Google Scholar] [CrossRef]
- Miller, J.D.; Hiskey, J.B. Electrokinetic behavior of fluorite as influenced by surface carbonation. J. Colloid. Interf. Sci. 1972, 41, 567–573. [Google Scholar] [CrossRef]
- Honig, E.P.; Hengst, J.H.T. Points of zero charge of inorganic precipitates. J. Colloid. Interf. Sci. 1969, 29, 510–520. [Google Scholar] [CrossRef]
- Miller, J.D.; Fa, K.; Calara, J.V.; Paruchuri, V.K. The surface charge of fluorite in the absence of surface carbonation. Colloid. Surf. A 2004, 238, 91–97. [Google Scholar] [CrossRef]
- Chernyshova, I.V.; Ponnurangam, S.; Somasundaran, P. Adsorption of fatty acids on iron (hydr) oxides from aqueous solutions. Langmuir 2011, 27, 10007–10018. [Google Scholar] [CrossRef] [PubMed]
- Khalfaoui, N.; Görlich, M.; Müller, C.; Schleberger, M.; Lebius, H. Latent tracks in CaF2 studied with atomic force microscopy in air and in vacuum. Nucl. Instrum. Methods B 2006, 245, 246–249. [Google Scholar] [CrossRef]
- Xia, W.; Ni, C.; Xie, G. The influence of surface roughness on wettability of natural/gold-coated ultra-low ash coal particles. Powder Technol. 2016, 288, 286–290. [Google Scholar] [CrossRef]
- Zawala, J.; Drzymala, J.; Malysa, K. An investigation into the mechanism of the three-phase contact formation at fluorite surface by colliding bubble. Int. J. Miner. Process. 2008, 88, 72–79. [Google Scholar] [CrossRef]
Figure 1.
X-ray diffraction (XRD) patterns of colorless fluorite (CF), green fluorite (GF), and purple fluorite (PF).
Figure 1.
X-ray diffraction (XRD) patterns of colorless fluorite (CF), green fluorite (GF), and purple fluorite (PF).

Figure 2.
(a) UV-Vis absorption spectrum of the NaOL solution before and after adsorption on fluorites; (b) the linear fit curve of absorbance and concentration of the NaOL solution.
Figure 2.
(a) UV-Vis absorption spectrum of the NaOL solution before and after adsorption on fluorites; (b) the linear fit curve of absorbance and concentration of the NaOL solution.

Figure 3.
Flotation recovery of different colored fluorites as a function of NaOL dosage under neutral solutions: (a) 0–45 μm, (b) 45–74 μm, and (c) 74–100 μm.
Figure 3.
Flotation recovery of different colored fluorites as a function of NaOL dosage under neutral solutions: (a) 0–45 μm, (b) 45–74 μm, and (c) 74–100 μm.

Figure 4.
Flotation recovery of different colored fluorites at their optimal NaOL dosage as a function of pH.
Figure 4.
Flotation recovery of different colored fluorites at their optimal NaOL dosage as a function of pH.

Figure 5.
Adsorption capacity of NaOL on the fluorite surface as a function of pH.
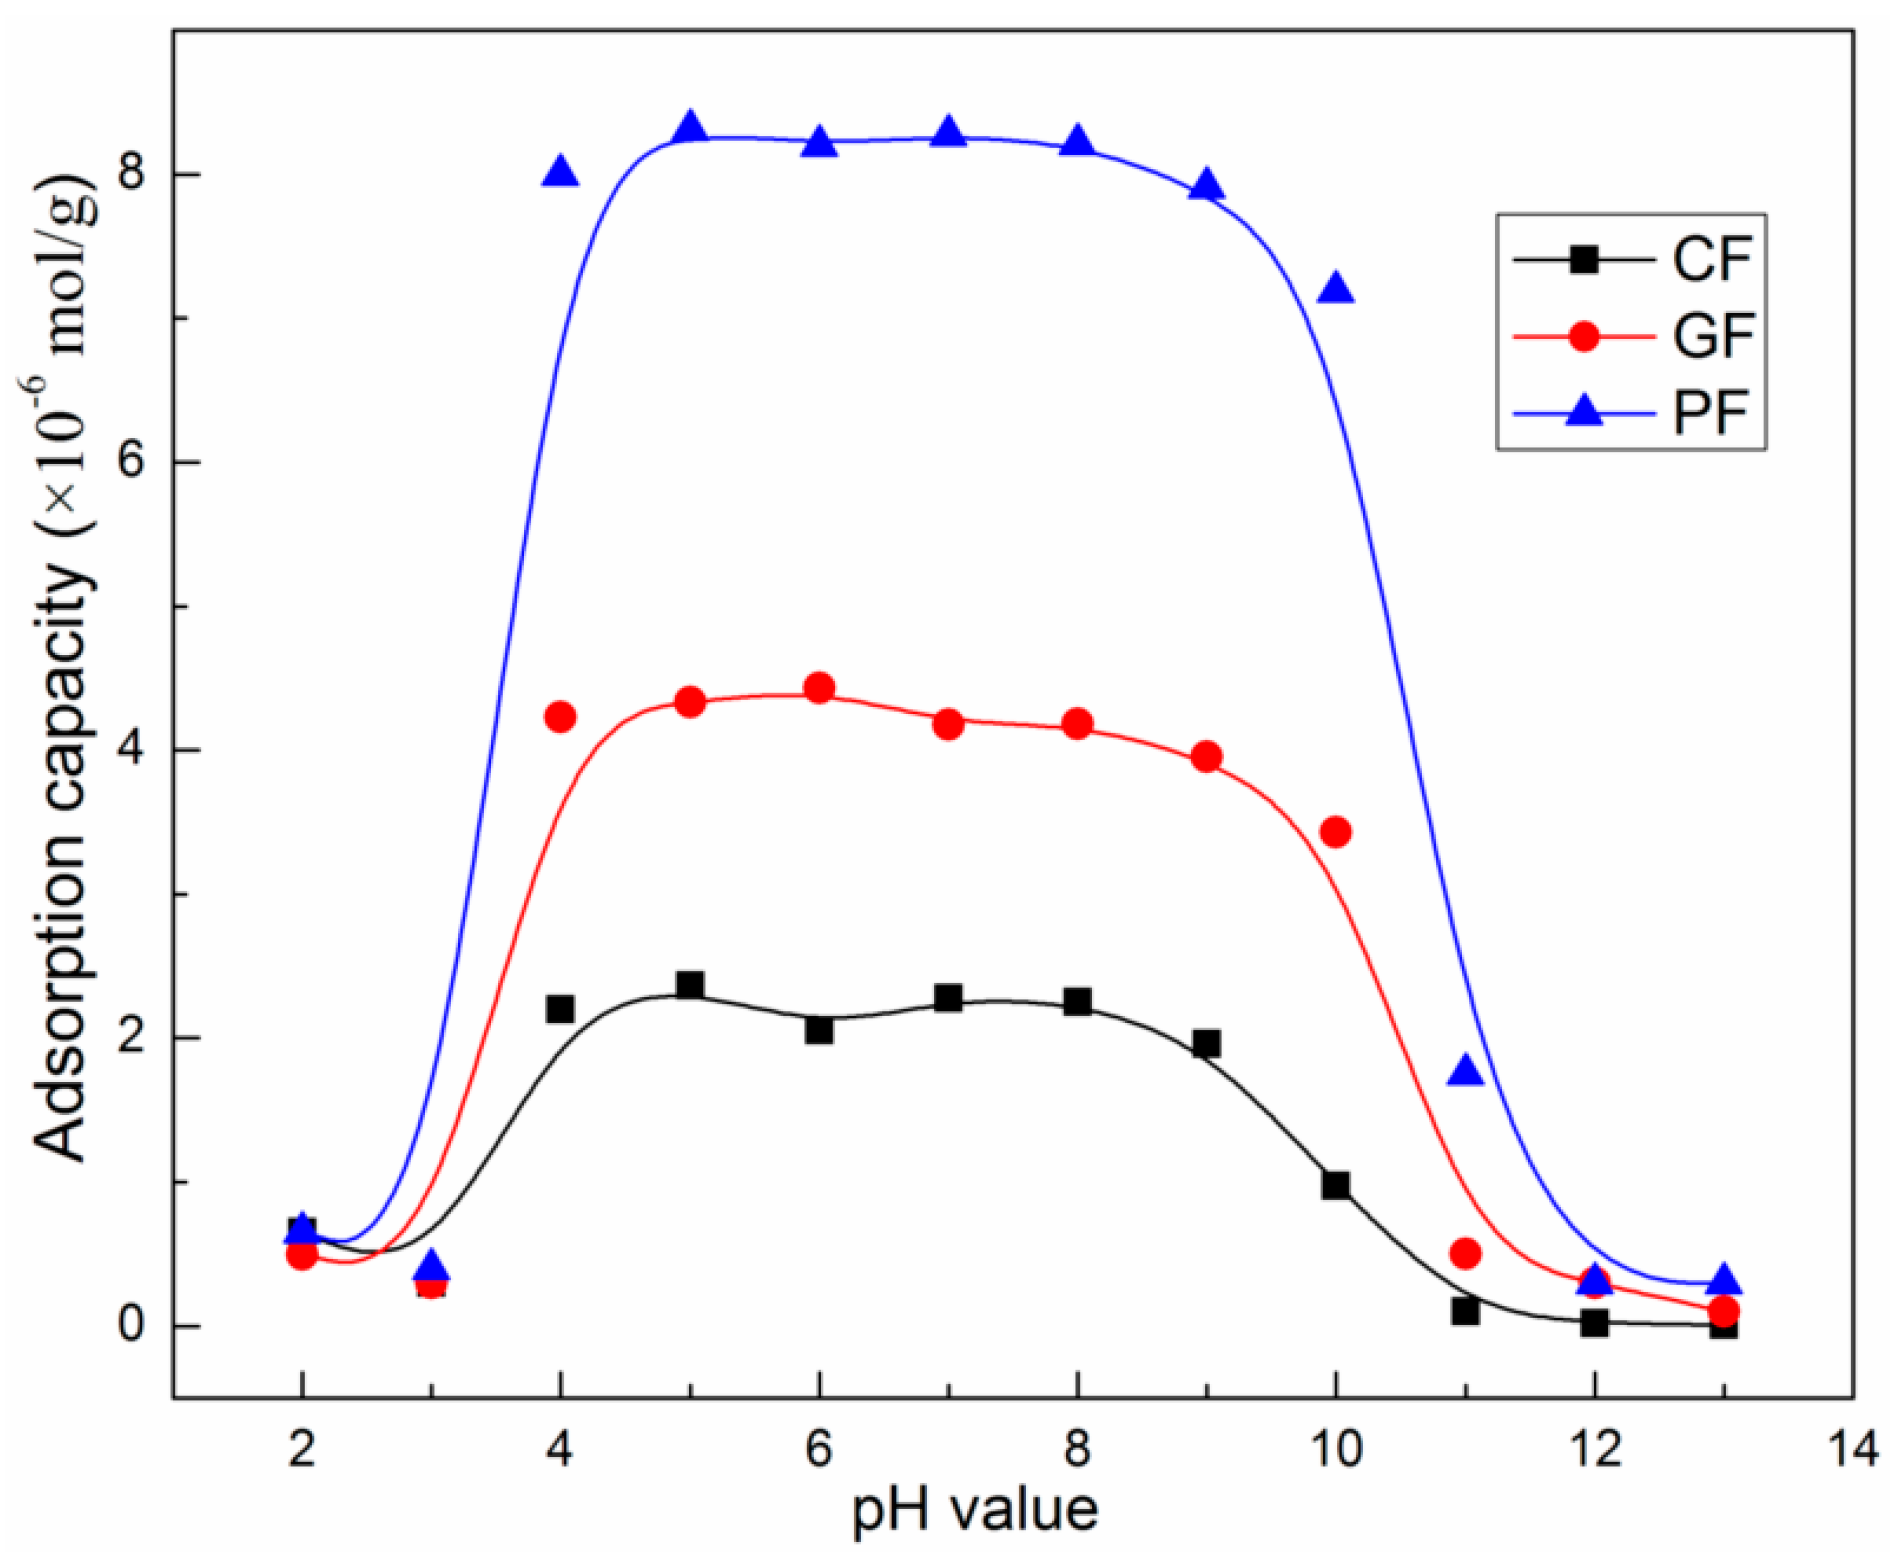
Figure 6.
Fourier transform infrared (FT-IR) spectra of different colored fluorites before and after adsorption of NaOL in a neutral solution.
Figure 6.
Fourier transform infrared (FT-IR) spectra of different colored fluorites before and after adsorption of NaOL in a neutral solution.

Figure 7.
Surface tension of water and NaOL solution with different concentrations as a function of pH.
Figure 7.
Surface tension of water and NaOL solution with different concentrations as a function of pH.

Figure 8.
Zeta potentials of fluorites (a) in the absence of NaOL; and (b) CF; (c) GF; and (d) PF in the presence of NaOL, as a function of solution pH.
Figure 8.
Zeta potentials of fluorites (a) in the absence of NaOL; and (b) CF; (c) GF; and (d) PF in the presence of NaOL, as a function of solution pH.
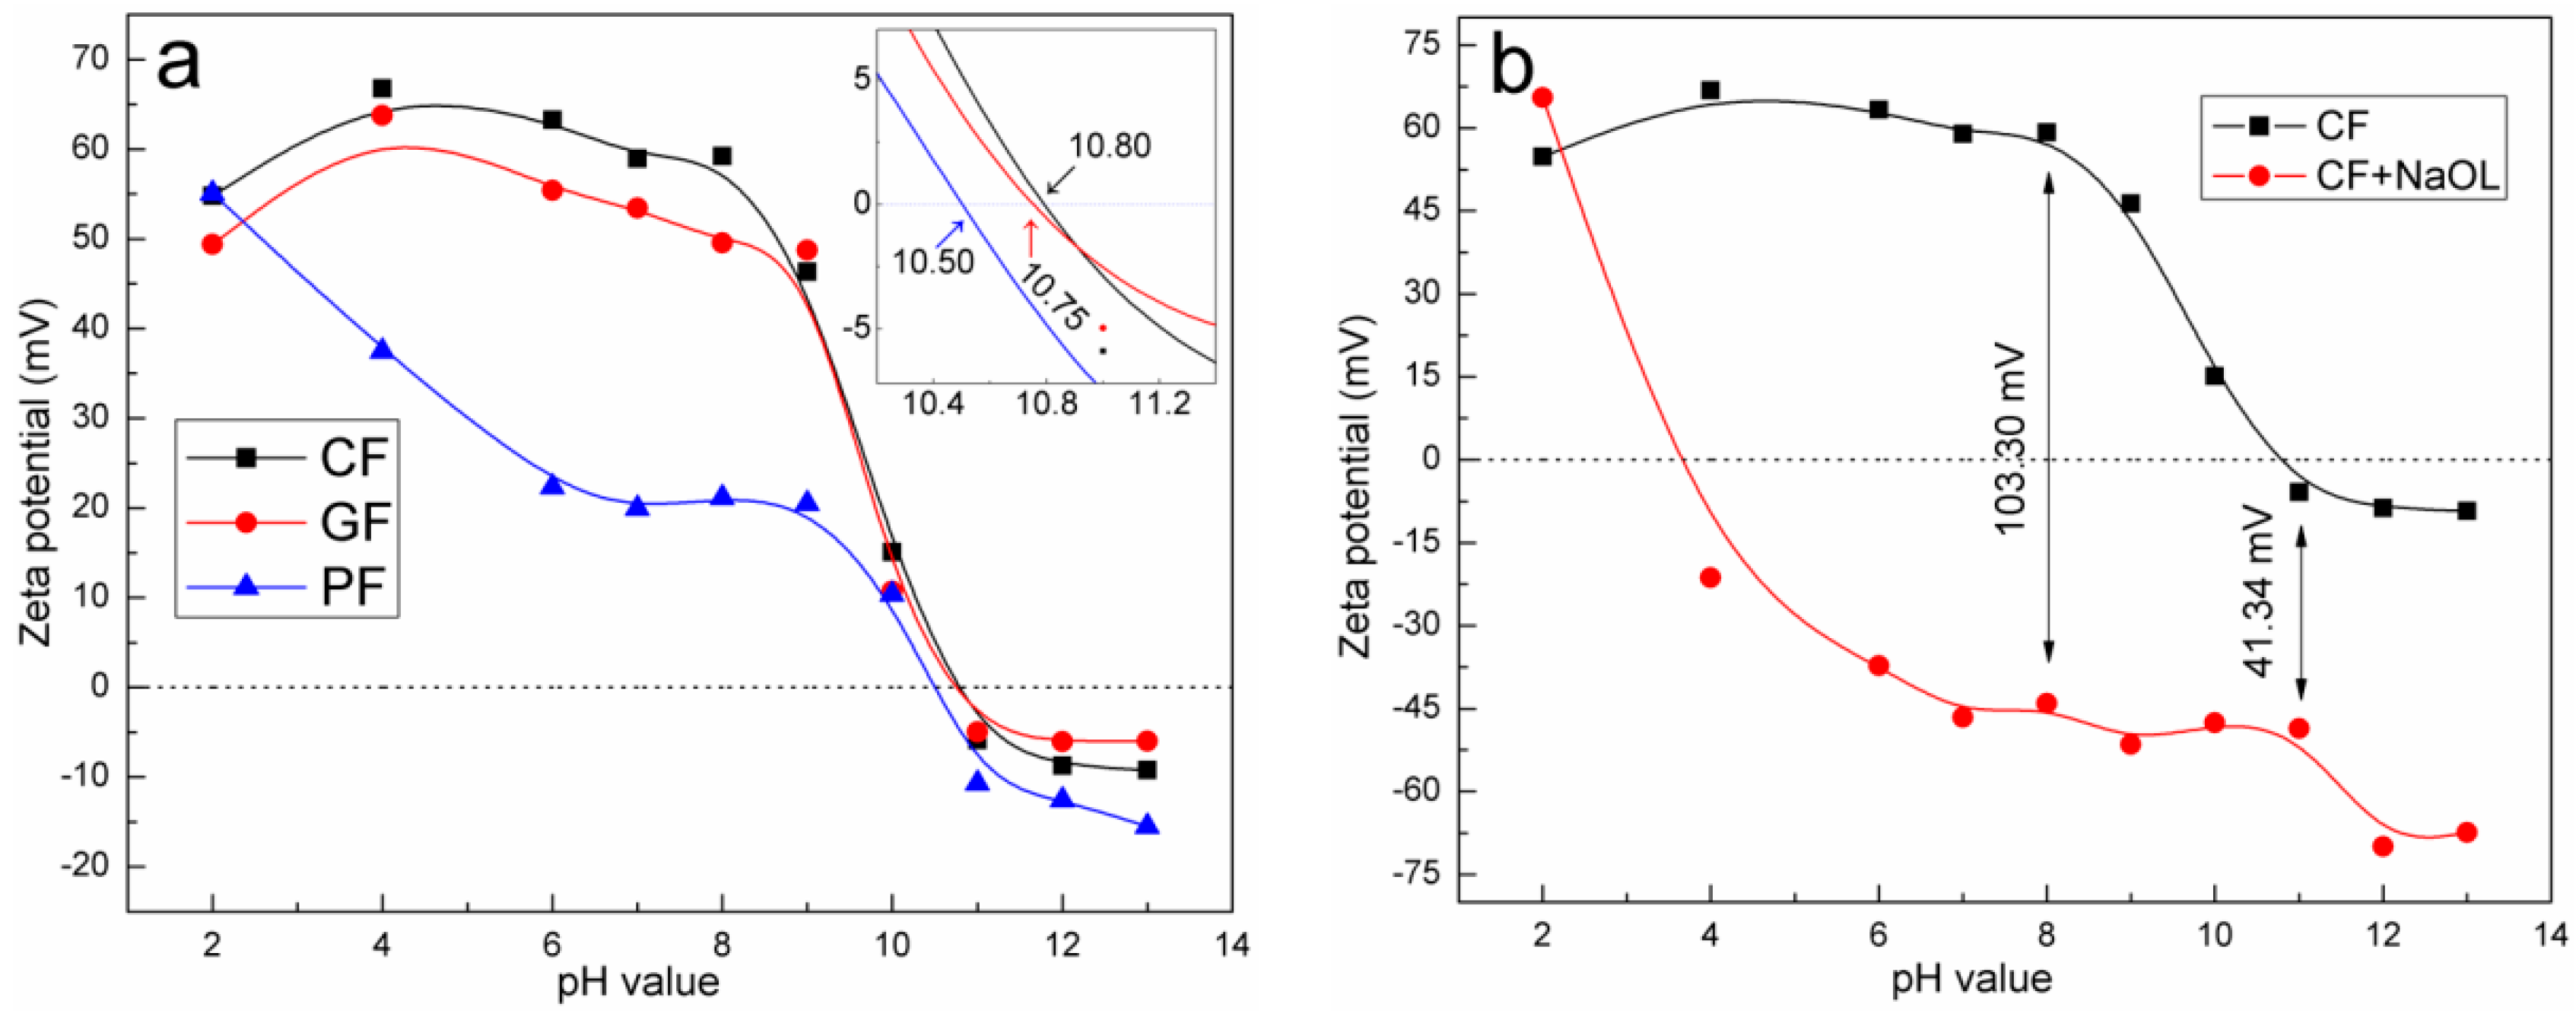

Figure 9.
Two-dimensional atomic force microscope (AFM) images of three colored fluorite crystals: (a) CF; (b) GF; and (c) PF.
Figure 9.
Two-dimensional atomic force microscope (AFM) images of three colored fluorite crystals: (a) CF; (b) GF; and (c) PF.

Figure 10.
Scanning electron microscope (SEM) images of fluorite particle samples: (a) CF; (b) GF; and (c) PF.
Figure 10.
Scanning electron microscope (SEM) images of fluorite particle samples: (a) CF; (b) GF; and (c) PF.

Table 1.
Particle size analysis and specific surface area of fine fluorites with different colors.
| Size Distribution and SSA | Fluorite Sample | ||
|---|---|---|---|
| CF | GF | PF | |
| D50 (μm) | 23.95 | 24.40 | 21.86 |
| D90 (μm) | 58.77 | 59.33 | 58.95 |
| SSA (m2/g) | 0.3908 | 0.3953 | 0.4149 |
© 2017 by the authors. Licensee MDPI, Basel, Switzerland. This article is an open access article distributed under the terms and conditions of the Creative Commons Attribution (CC BY) license (http://creativecommons.org/licenses/by/4.0/).
Share and Cite
MDPI and ACS Style
Zheng, R.; Ren, Z.; Gao, H.; Qian, Y. Flotation Behavior of Different Colored Fluorites Using Sodium Oleate as a Collector. Minerals 2017, 7, 159. https://doi.org/10.3390/min7090159
AMA Style
Zheng R, Ren Z, Gao H, Qian Y. Flotation Behavior of Different Colored Fluorites Using Sodium Oleate as a Collector. Minerals. 2017; 7(9):159. https://doi.org/10.3390/min7090159
Chicago/Turabian StyleZheng, Renji, Zijie Ren, Huimin Gao, and Yupeng Qian. 2017. "Flotation Behavior of Different Colored Fluorites Using Sodium Oleate as a Collector" Minerals 7, no. 9: 159. https://doi.org/10.3390/min7090159
Note that from the first issue of 2016, this journal uses article numbers instead of page numbers. See further details here.