Impact of Coalbed Incidence Angle on Methane Enrichment Zone in Longwall Gob
by

Shengyong Hu
1,2,3, 
Ao Zhang
1,
Guorui Feng
1,3,*,
Shuwen Guan
1,
Xiangqian Guo
4,
Chao Li
4 and
Guang Xu
5 1
College of Mining Engineering, Taiyuan University of Technology, Taiyuan 030024, China
2
State Key Laboratory of Coal Resources and Safe Mining, China University of Mining and Technology, Xuzhou 221008, China
3
Green Mining Engineering Technology Research Center of Shanxi Province, Taiyuan 030024, China
4
State Key Laboratory of Coal and CBM Co-mining, Jincheng 048000, China
5
Western Australian School of Mines, Curtin University, Kalgoorlie, WA 6430, Australia
*
Author to whom correspondence should be addressed.
Minerals 2017, 7(9), 166; https://doi.org/10.3390/min7090166
Submission received: 13 August 2017
/
Revised: 1 September 2017
/
Accepted: 4 September 2017
/
Published: 11 September 2017
(This article belongs to the Special Issue Selected Papers from the 6th International Symposium on Mining and Environmental Protection)
Abstract
:To control methane emissions in gob into longwall working faces, it is necessary to understand the distributions of methane enrichment zones (MEZ) around mined coal seams with different incidence angles. In this paper, FLAC3D software is used to calculate the three-dimensional stress distributions in MEZ in gobs with coalbed incidence angles ranging from 0° to 50°. The results show that MEZ consistently exhibit a “hexagon” shape, and rotate in a clockwise direction as the coalbed angle increases. The MEZ range above the mined seam is larger than that below the mined seam. As the coalbed angle increases, the MEZ range in the roof decreases, while the MEZ range in the floor increases. The MEZ height increases significantly as the coalbed angle increases. The MEZ widths in coal pillars of gobs increase slightly as the coalbed angle increases. The methane concentration increases exponentially as the height in the MEZ increases. The surface borehole bottoms located relatively higher in the MEZ can drain methane with a higher concentration and flow rate, as verified by a field test in the Pansan mine, China.
1. Introduction
In China, 90% of coal mines are underground mines and 51% of them are classified as gassy mines [1,2]. Longwall mining has been widely used in China, which maximizes coal production [3]. The total area of the produced gobs (collapsed roof strata areas) reaches 400 million square meters annually, and potentially contains a large amount of methane [4]. Longwall mining induces deformation, fracturing, and bedding plane separations above and below the mined seam [5]. Methane can be emitted from both the mined coalbed and the zones around the roof and floor of the coalbed [6]. Fracturing in gob provides highly connected paths into the work environment during mining for the released methane, which may generate unsafe conditions for the workface [7,8]. Surface vertical boreholes and cross-measure boreholes are the most common methods used to control the gob methane before it flows into the workface [9]. Methane drained from gobs may contain 30%–95% methane, determined by the borehole locations in gobs [10]. The drainage efficiency of boreholes is determined directly by the distribution of fractured zones in gobs [11].
Great efforts have been made to study the fractured zone distributions associated with longwall gob. Flügge [12] proposed a prism-shaped emission zone in the overburden and the underburden. Singh and Yadav [13] proposed the fractured zone profile resulting from longwall mining. Palchik [14] estimated the fracture zone height considering the methane emission changes. Miao et al. [15] studied the heights of water-conducting fractured zones in rock strata. Guo et al. [16] presented an annular fractured zone for the methane migration. Majdi et al. [3] studied the development mechanism of the destressed zone height including the caved zone and the fractured zone. Gao et al. [17] found a pear-shaped region around the mined seam using the Universal Distinct Element Code (UDEC) Trigon approach. Qu et al. [18] proposed a conceptual model of fractured gas-interflow zone in longwall overburden. Saghafi and Pinetown [6] proposed a method to obtain the depth of the methane emission zone in the underburden of a coal seam. Wang et al. [19] studied the fracture distribution in the disturbed overburden of gob. All of these studies mainly studied the fractured zone distributions around horizontally mined seams. However, in these studies almost all the coal seams are assumed to be inclined at certain fixed angles, and the impact of coalbed incidence angle on the fractured zone distribution in longwall gob has not yet been studied in detail. In fact, coalbed incidence angles will affect significantly the methane drainage effects of surface vertical boreholes.
This paper uses FLAC3D software to investigate the stress distributions of mined coalbeds at 0°–50° incidence angles. Based on the stress distributions, the MEZ in longwall gobs are divided and analyzed in detail for gob methane control.
2. Numerical Modeling
In this paper, FLAC3D software is adopted to study how the MEZ are affected by coalbed incidence angles. FLAC3D is important software adopted to conduct rock stress calculations. It has been widely used in mining engineering [20,21,22,23]. The rock mass can be assumed to be an elastic plastic material, and the elastic-plastic model and the strain-softening model are used for the rock mass in this study [24,25]. The relationship between cohesion, dilation angle, friction angle and tensile strength proposed by Corthésy and Leite [26] is used in this paper. When the strain-softening model is used, some characteristic parameters become apparent, as shown in Table 1. The other required initial rock mass parameters are shown in Table 2. To avoid the rock mass property influence on simulation results, the roof and the floor mechanical properties are usually set at the same values [25,27].
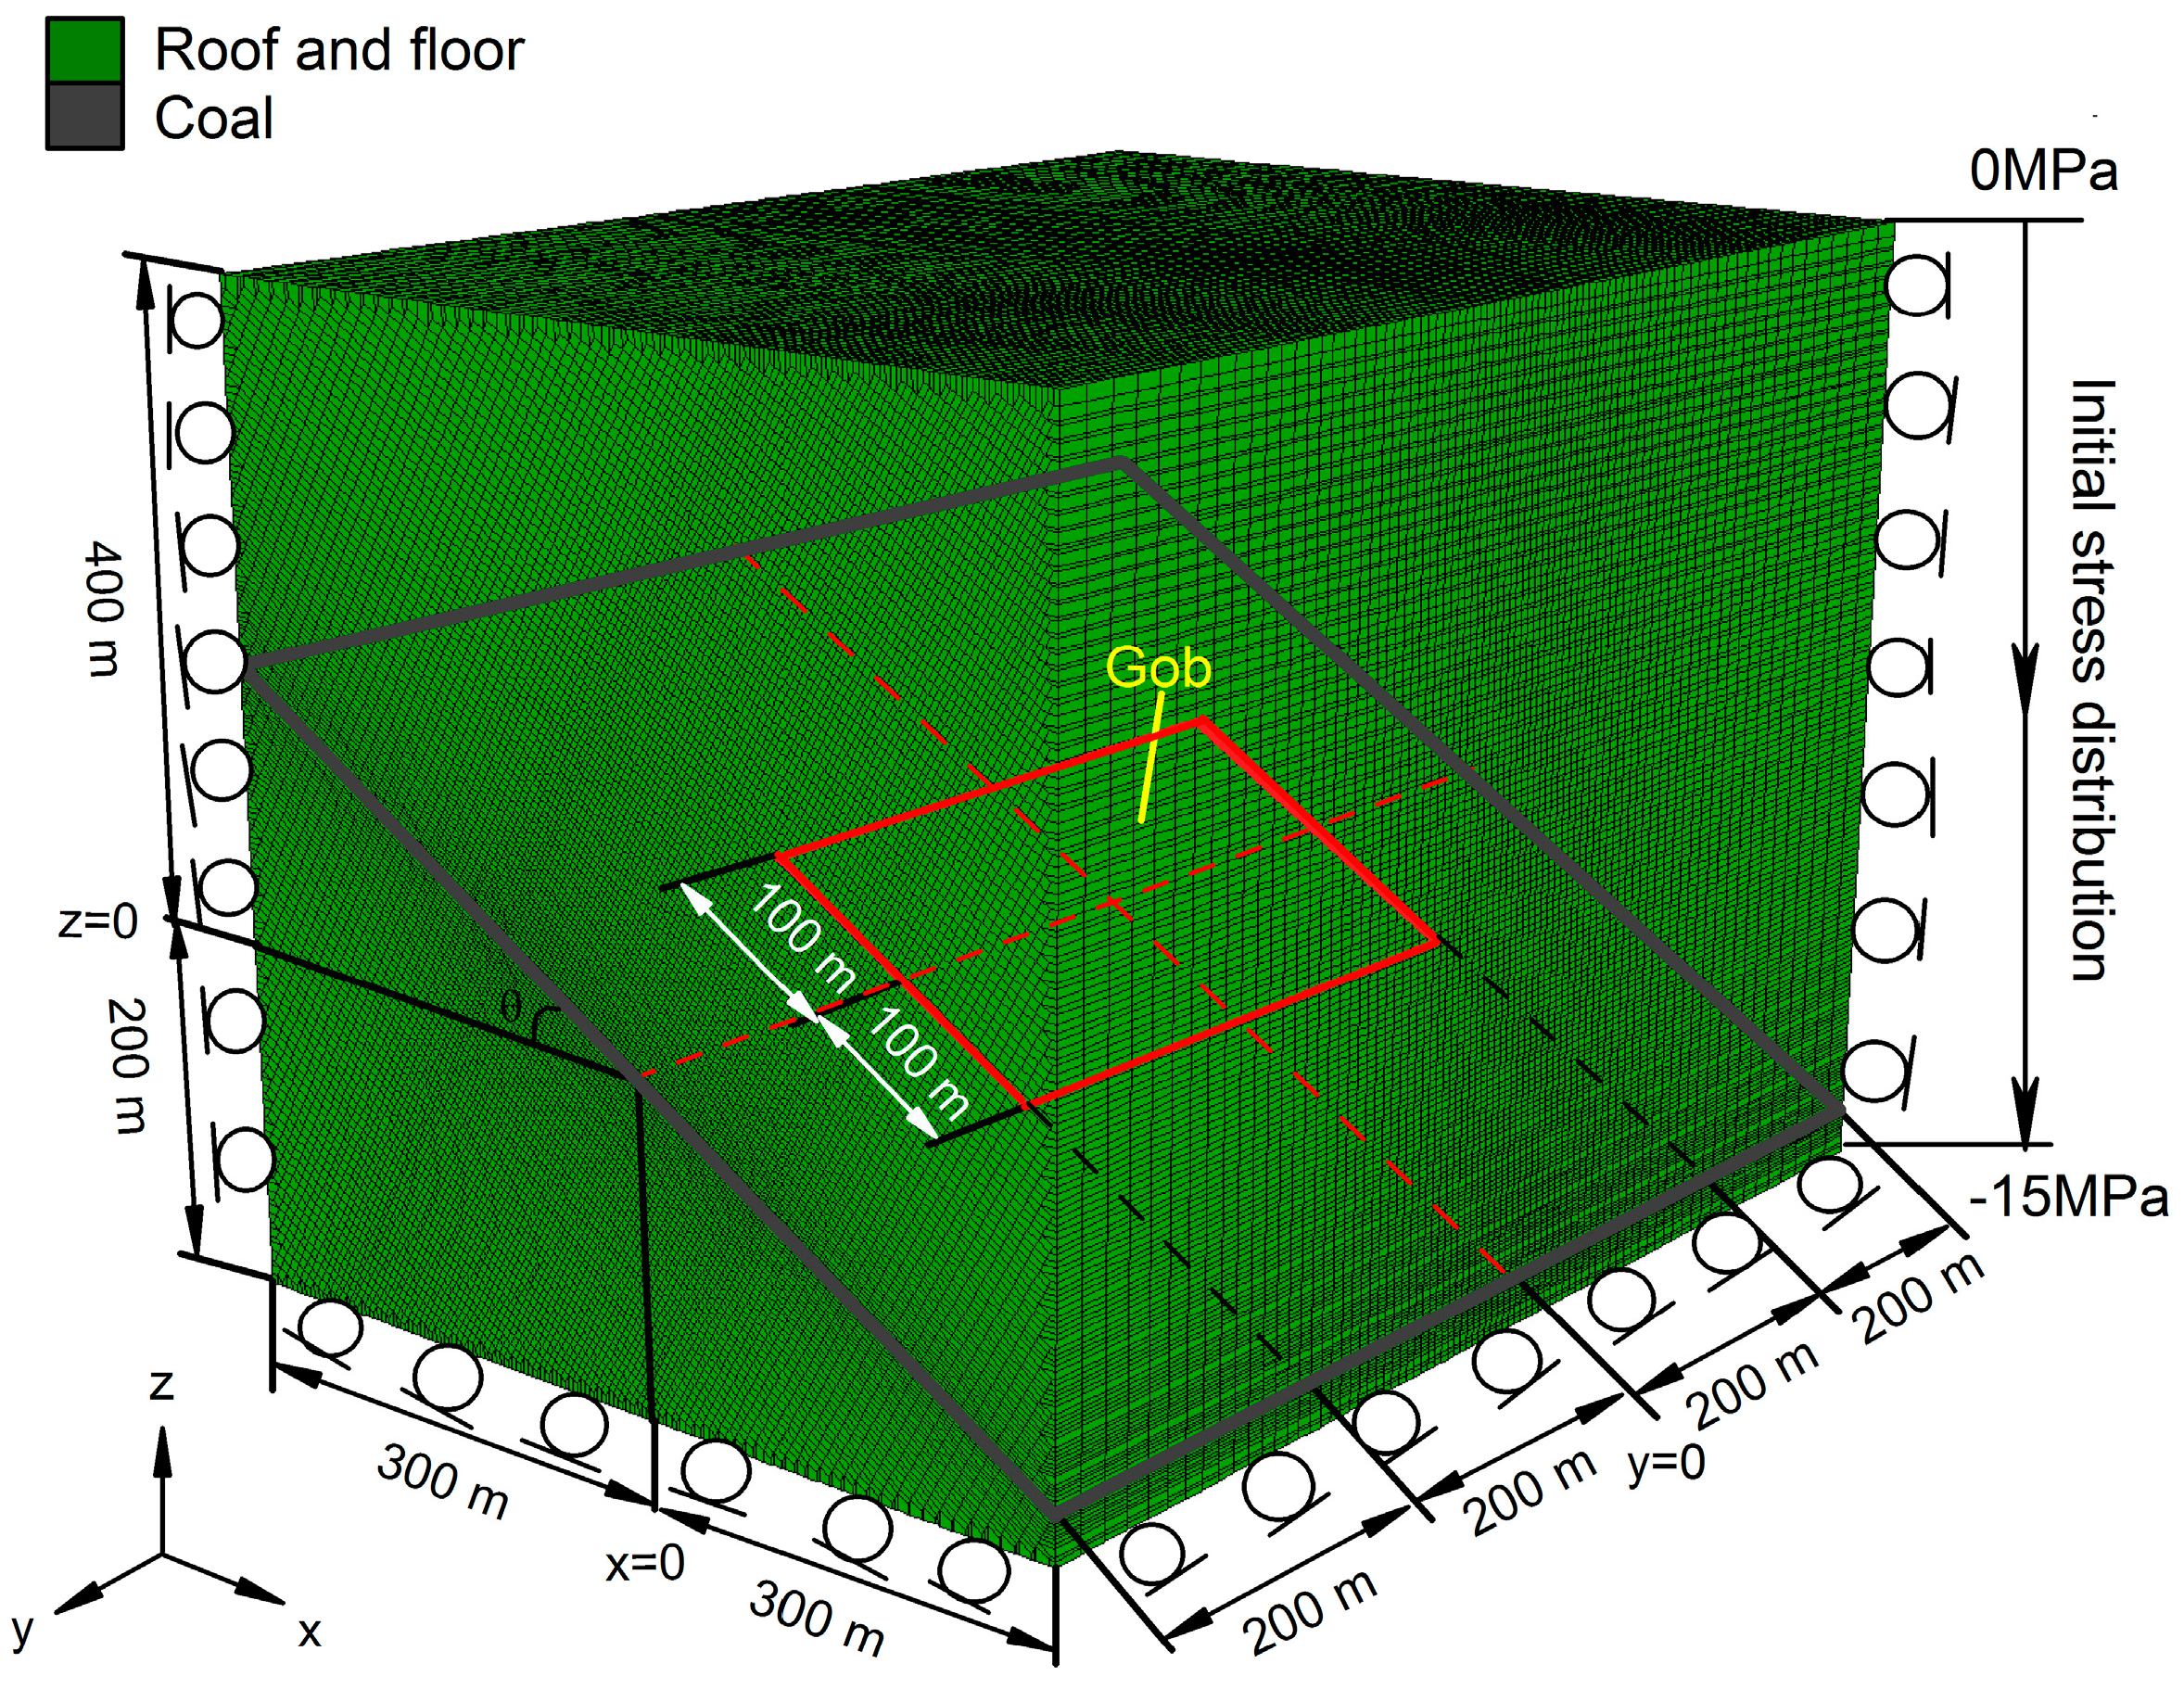
In this study, six models are developed to include different coalbed incidence angles, 0°, 10°, 20°, 30°, 40°, and 50°. Figure 1 shows the 3D model mesh grids, size and boundary. All the models are 600 m in the x-direction, 800 m in the y-direction, and 600 m in the z-direction. Rolling boundaries are imposed on the lateral and bottom boundaries to restrict the horizontal and vertical displacements of the models. The upper boundaries of the models are free. The initial stresses are 0 MPa at the top of the models and 15 MPa at the bottom, which are calculated by the acceleration of rock mass gravity. The length, width and height of the mined seam are 400, 200, and 3 m, respectively. To ensure the simulation results are comparable, the central positions of all the gobs are at the 400 m depth below the model top. The nodes and units of the models for different coalbed incidence angles are shown in Table 3.
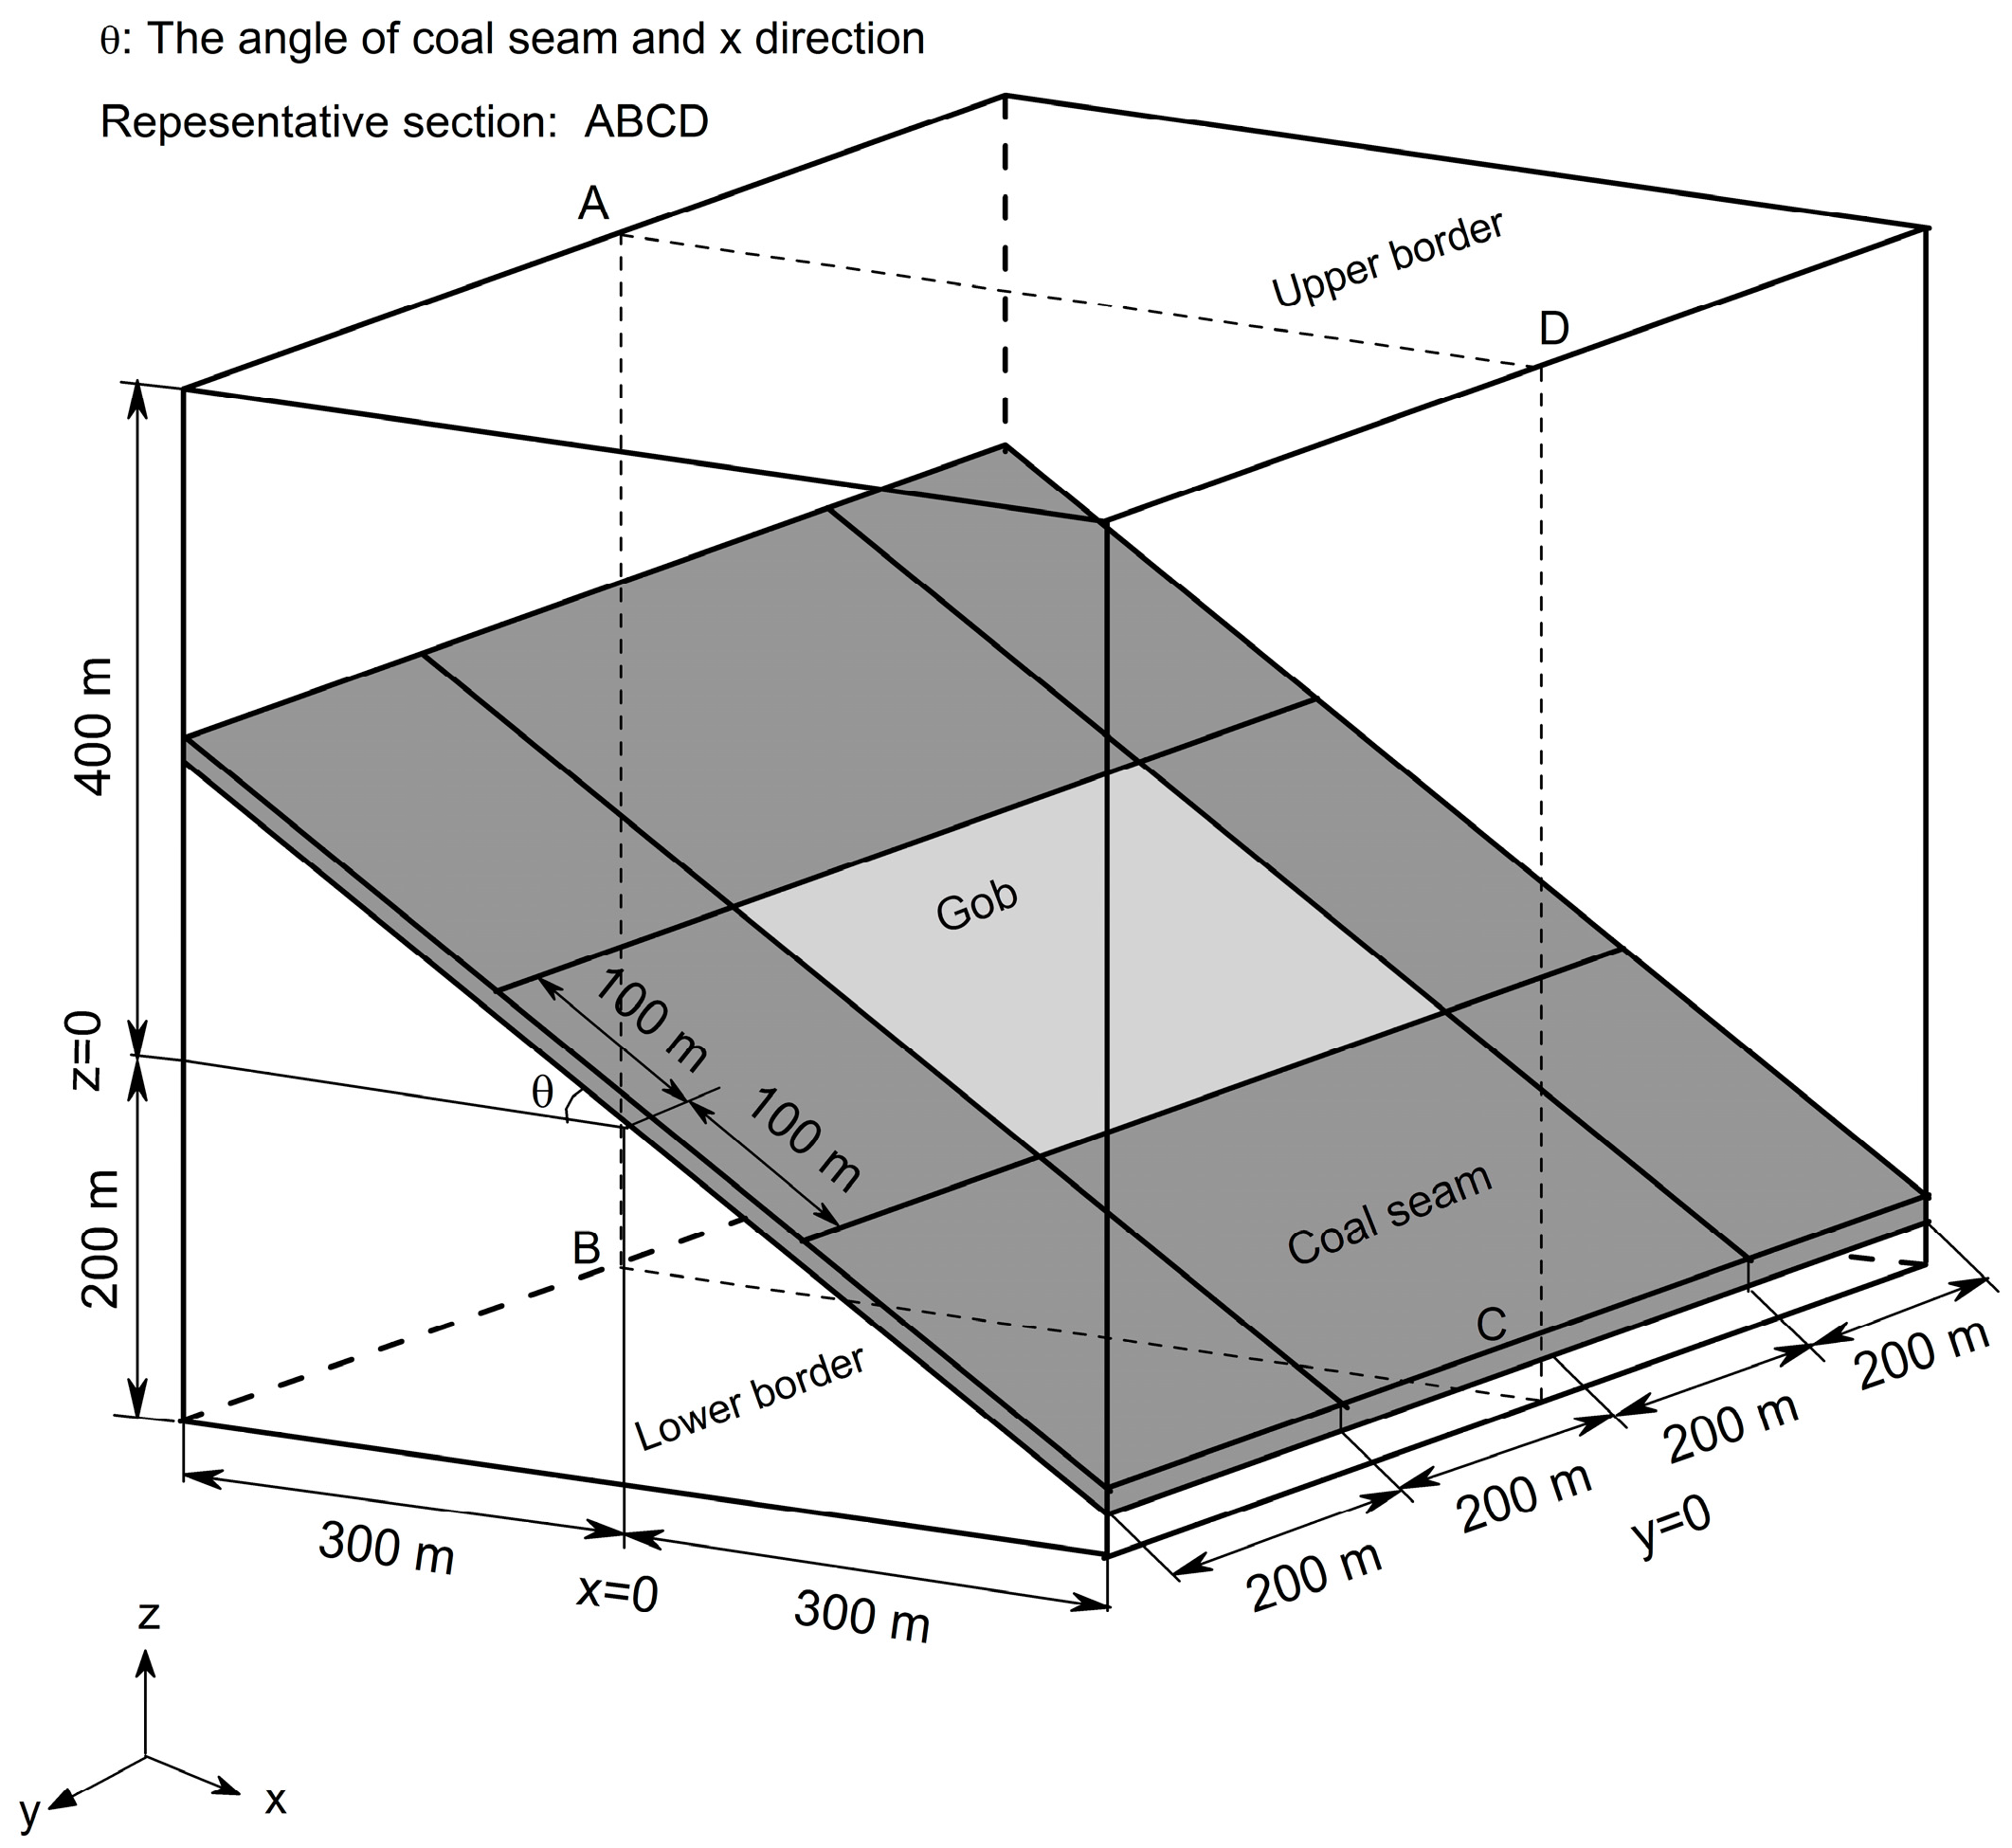
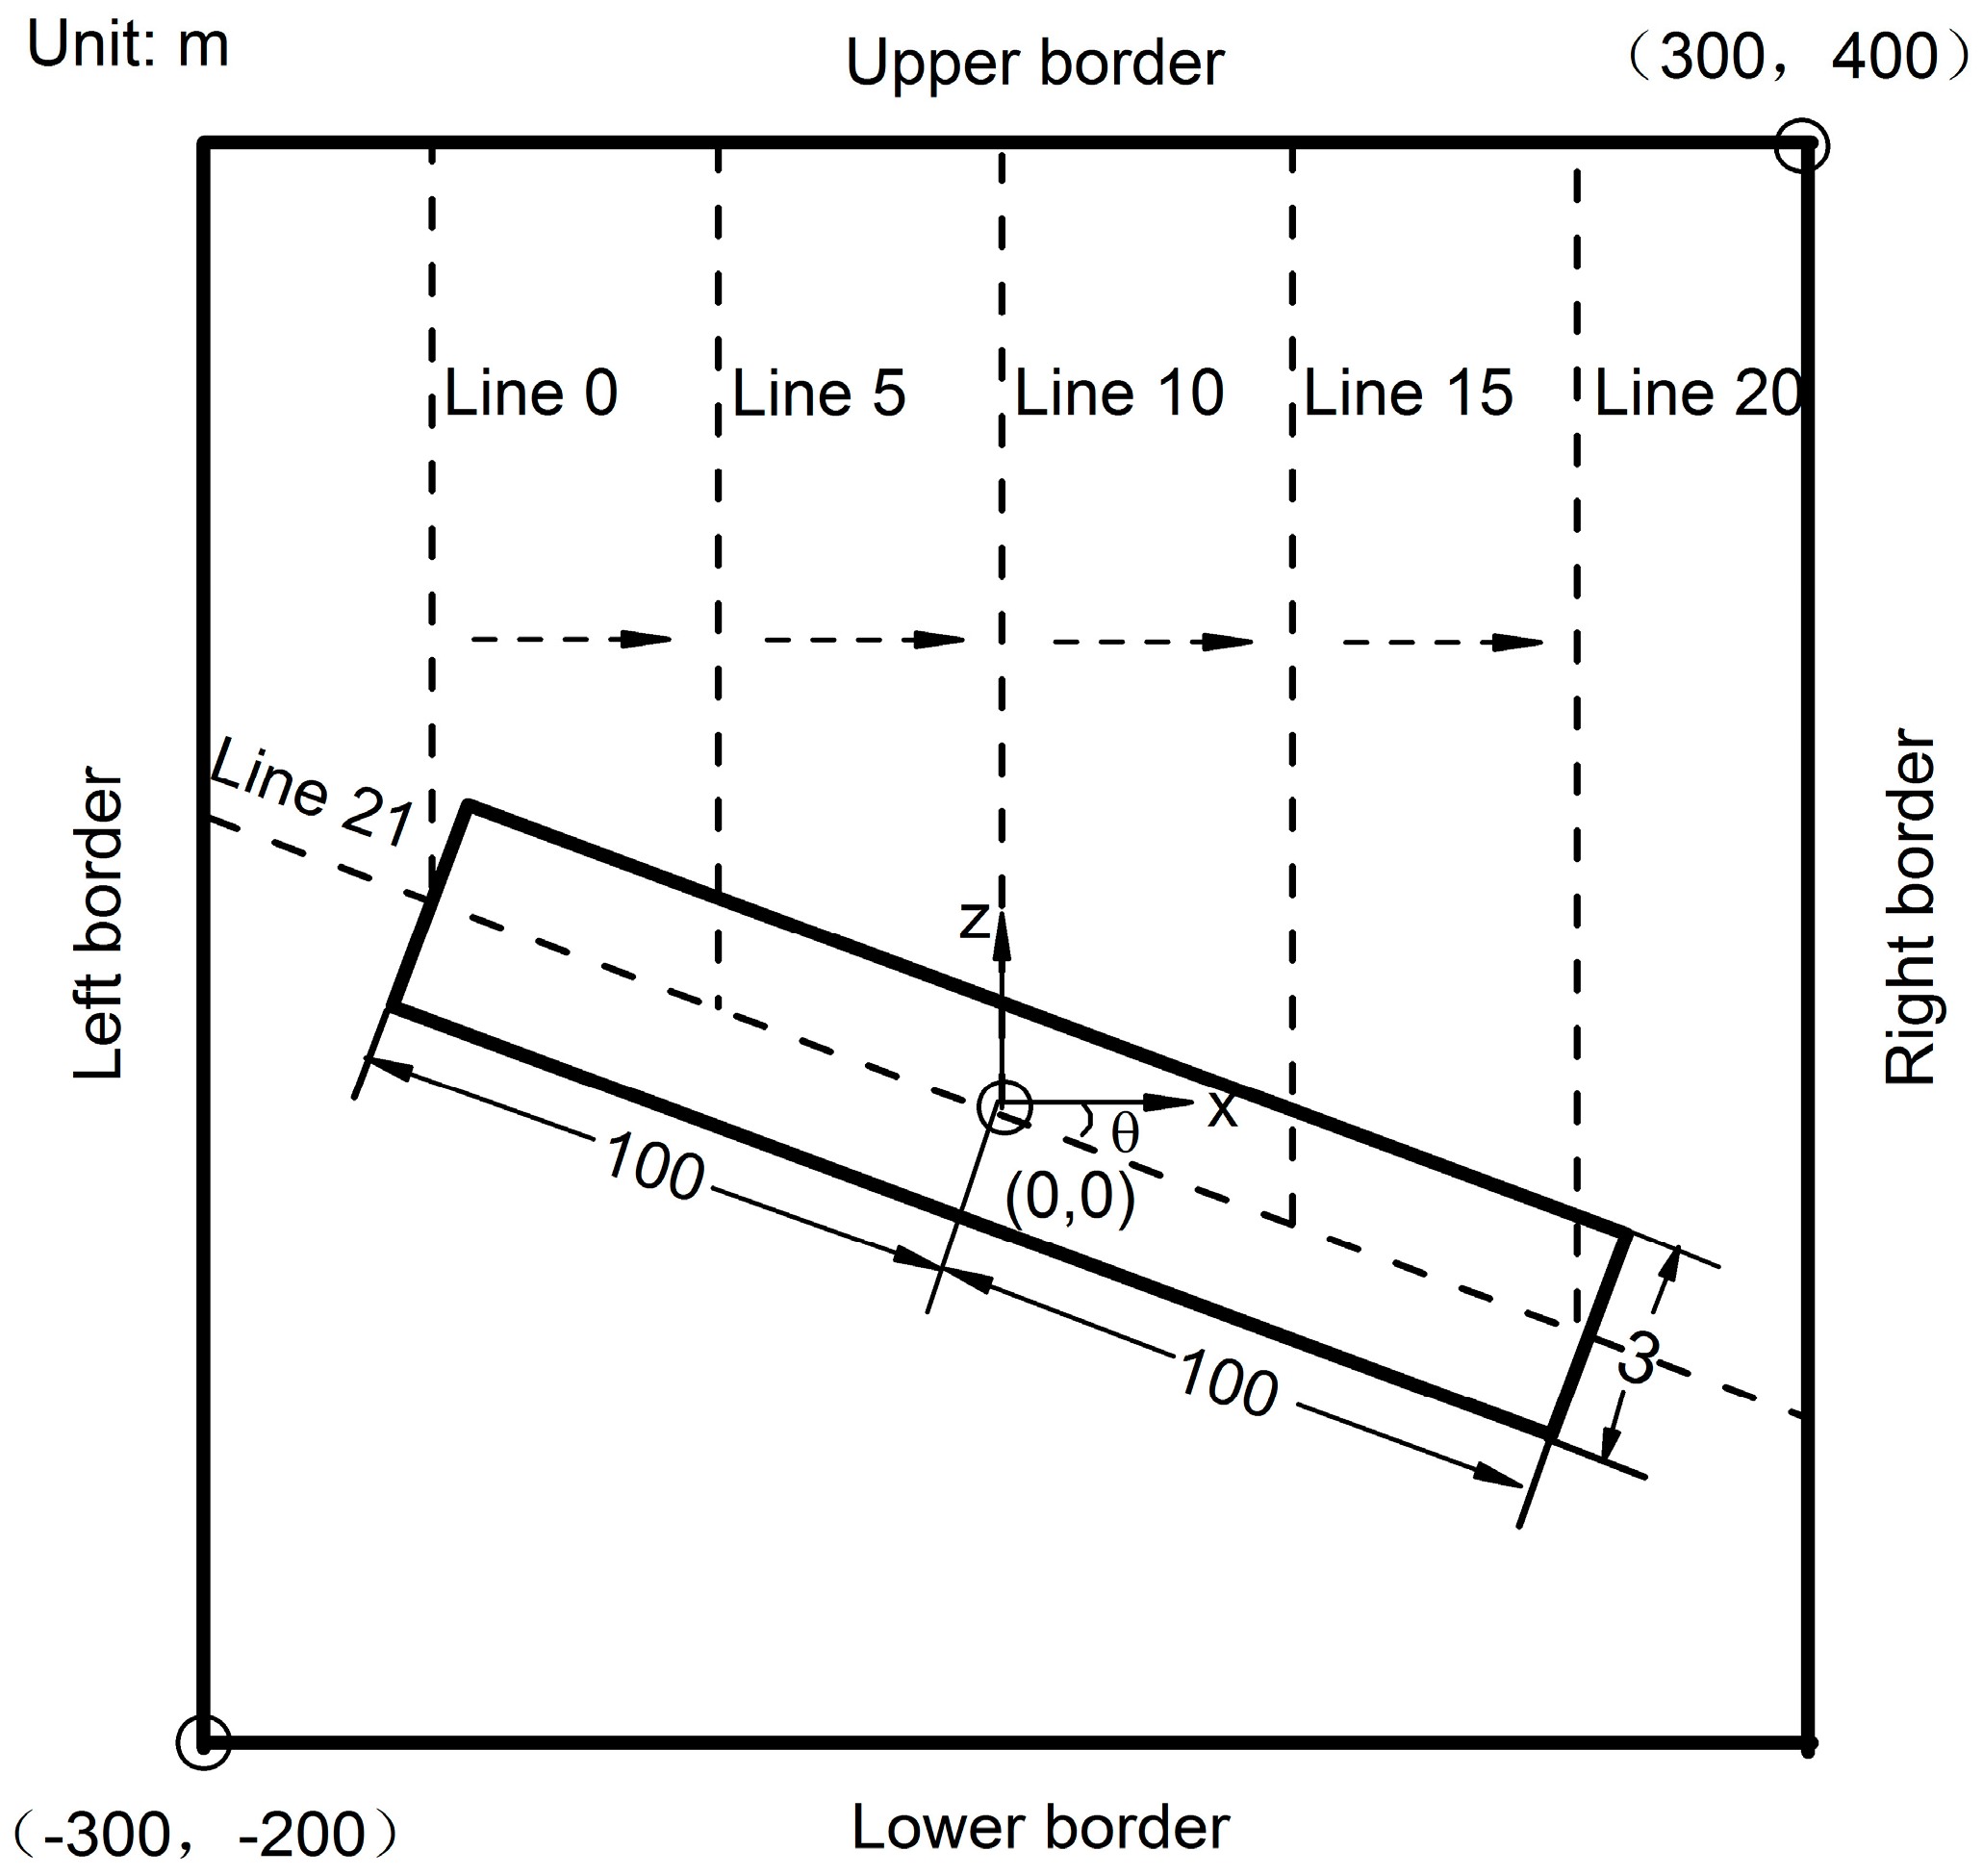
In this paper, sections ABCD of every model are chosen as representative profiles to study the stress and MEZ distributions of mined coalbeds as shown in Figure 2. Figure 3 shows the arrangement of observation lines in each profile ABCD. From Figure 3, it can be seen that there are 21 vertical observation lines from Line 0 to Line 20 in the profiles ABCD, and they are equidistant. Line 21 is arranged along the coalbed-inclined direction and at the middle of the coalbed. Line 10 is at the central position of coalbeds whose abscissa is x = 0 m. Line 0 and Line 20 are at the gob edges and intersect with Line 21.
3. Results and Discussion
3.1. Stress Distribution
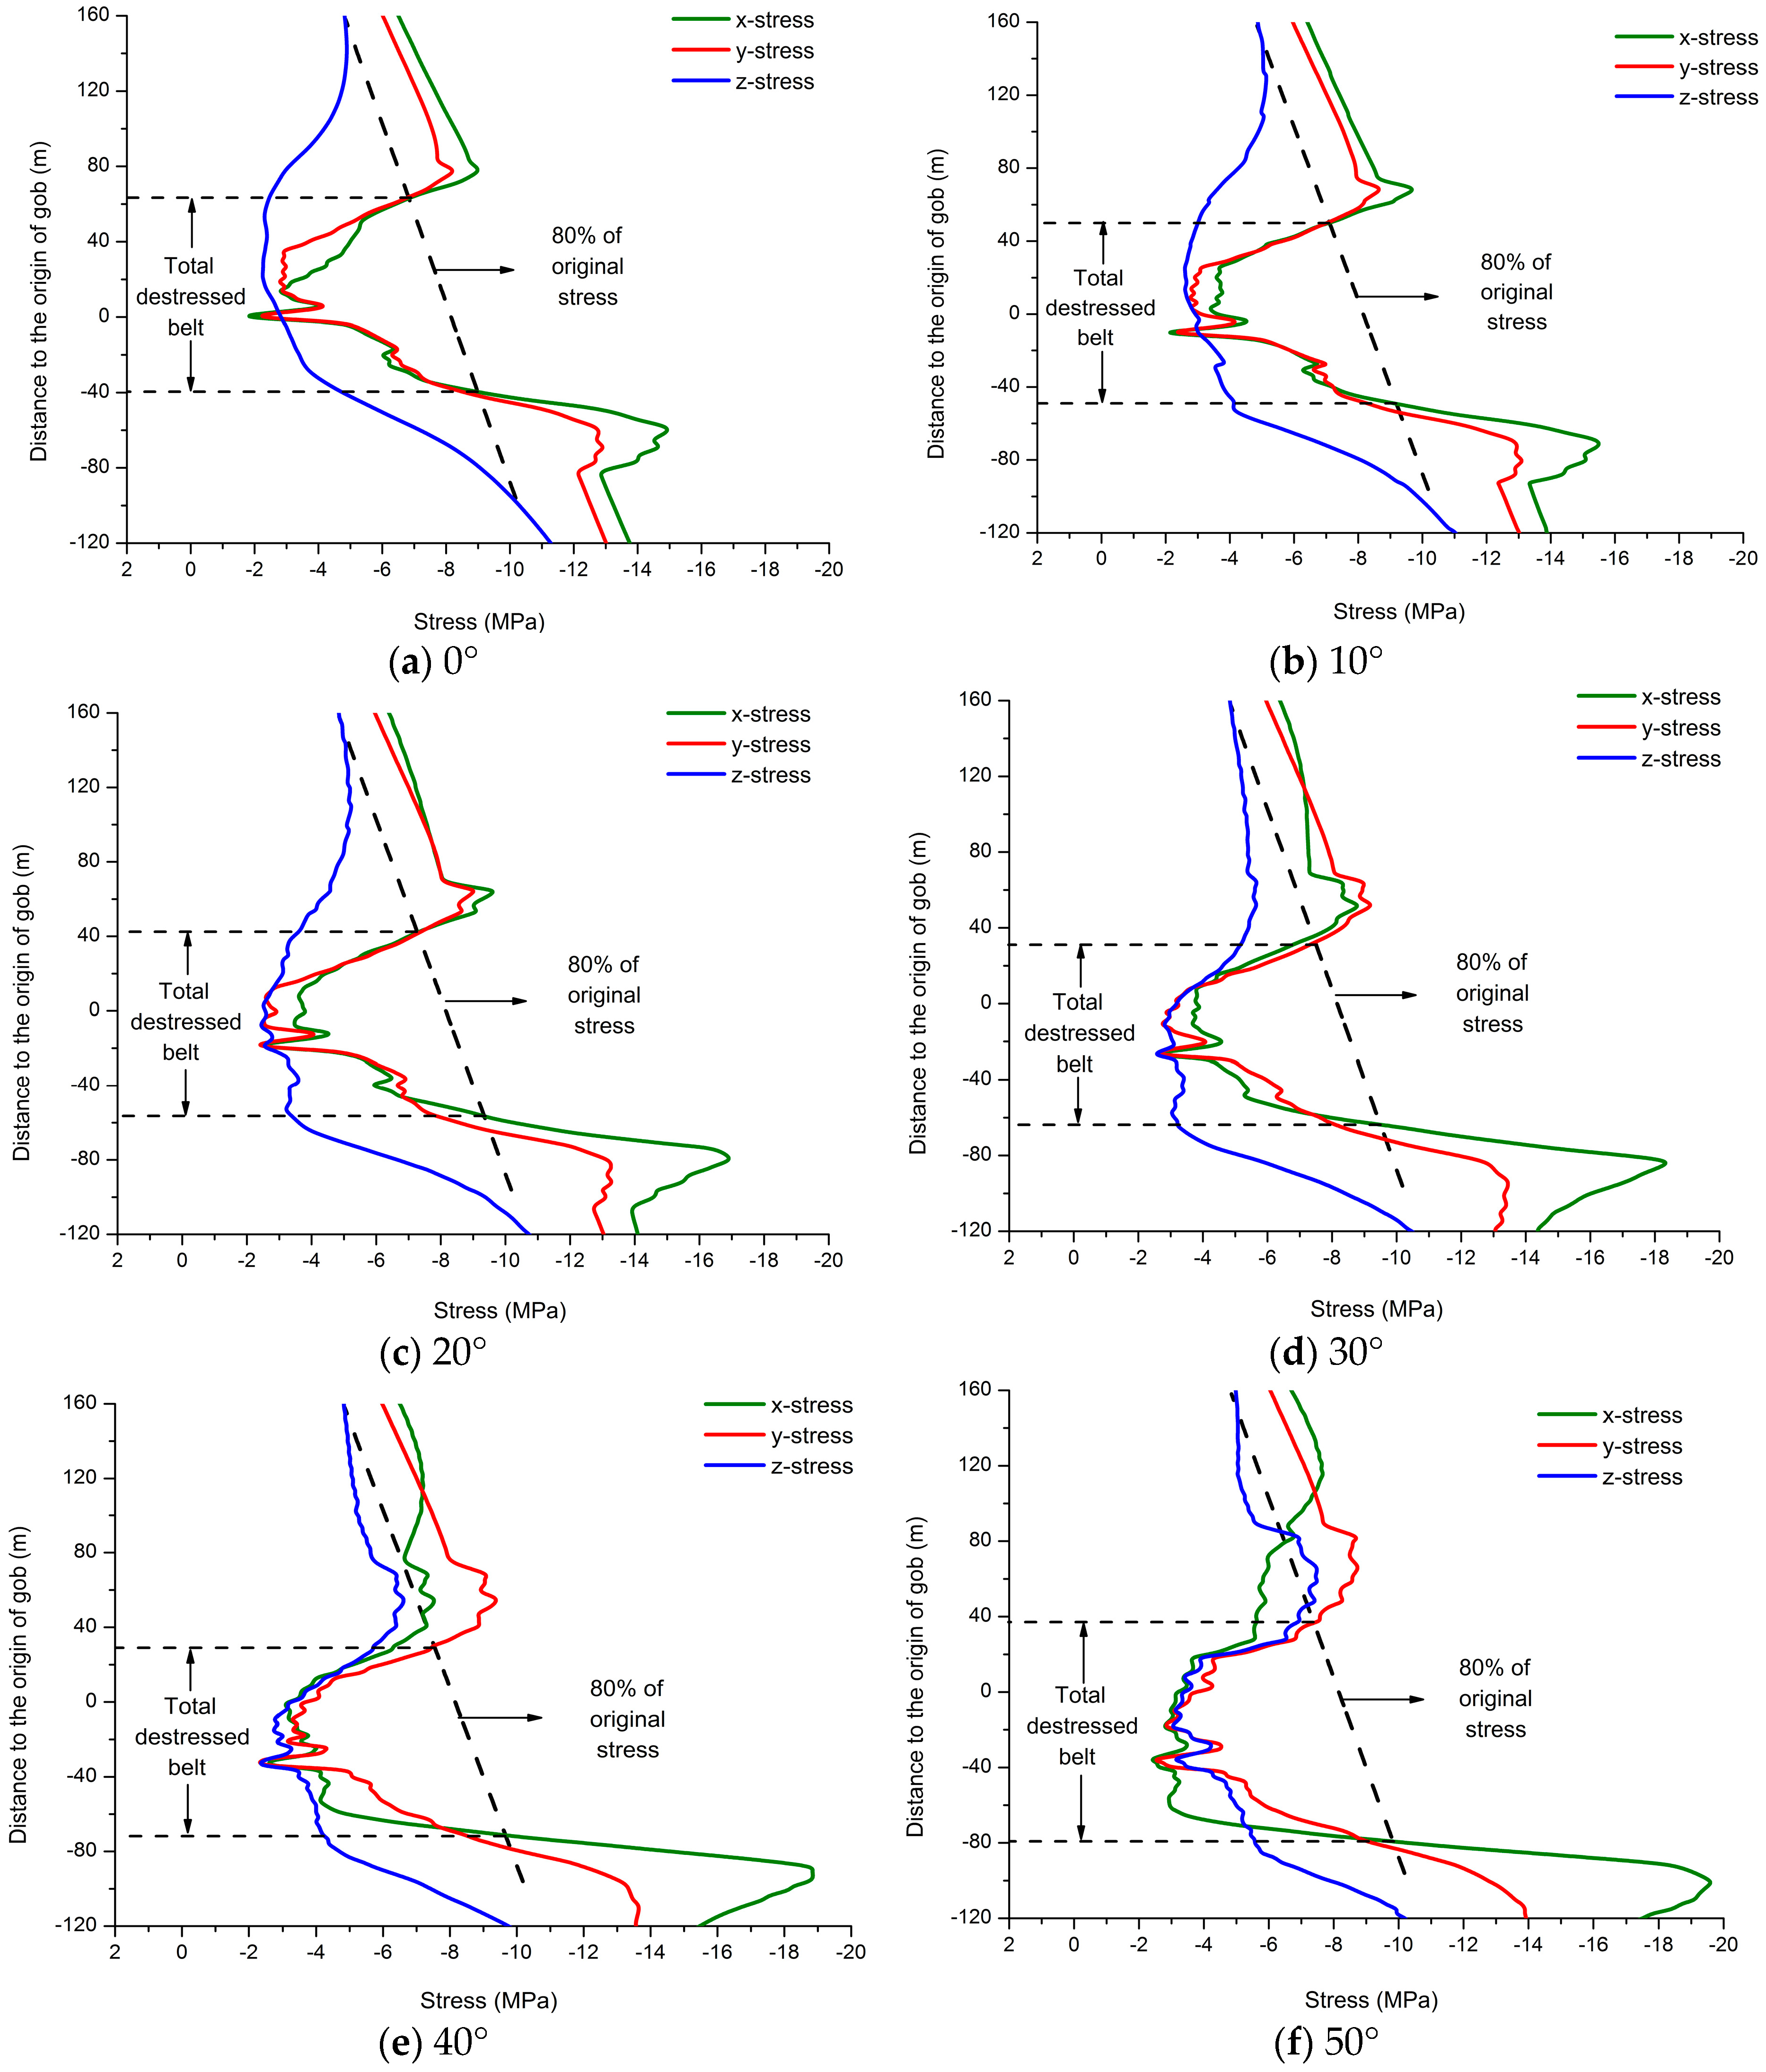
Figure 4 shows the three-dimensional stress distributions along Line 15 with different coalbed incidence angles. The stress distributions along other vertical observation lines are similar to those along Line 15. The positive values in the ordinate indicate they are above the origin of the mined seams, and negative values indicate they are below the origin of the mined seams. The negative values in abscissa refer to the compressive stress. The x-stress, y-stress and z-stress are the stresses in the x direction, y direction, and z direction, respectively. As shown in Figure 4, all the stress distributions are generally similar for different coalbed incidence angles. With the increase of vertical distance from the mined seam center, the three-dimensional stresses also increase gradually. However, when the three-dimensional stresses are more than 80% of the original stress, z-stress tends to be stable, whereas x-stress and y-stress continue to increase until they are close to the in-situ stress. The stresses in all directions decrease significantly closer to the gob. In addition, the results from Line 15 show that at higher incidence angles the x, y and z stresses match more closely while at lower incidence angles the z stresses are generally less negative than x and y.
When x, y and z stresses in an area are all lower than 80% of the original stress, the area can be called the total decreased belt [25]. Several experiments have shown that the rock mass permeabilities, where stresses are lower than original stresses, are 2–4 orders of magnitude higher than that of the original rock masses [28,29,30,31]. When the rock mass stress is lower than the original stress, the rock mass permeability increases sharply as the stress decreases [31]. Therefore, in the total decreased belt, cracks are fully developed and form a fracture network. The permeability in the total decreased belt is high enough that the methane flows freely in all directions [25]. Figure 4 shows that the upper and lower bounds of the total decreased belt are determined by the distributions of y-stress and x-stress respectively.
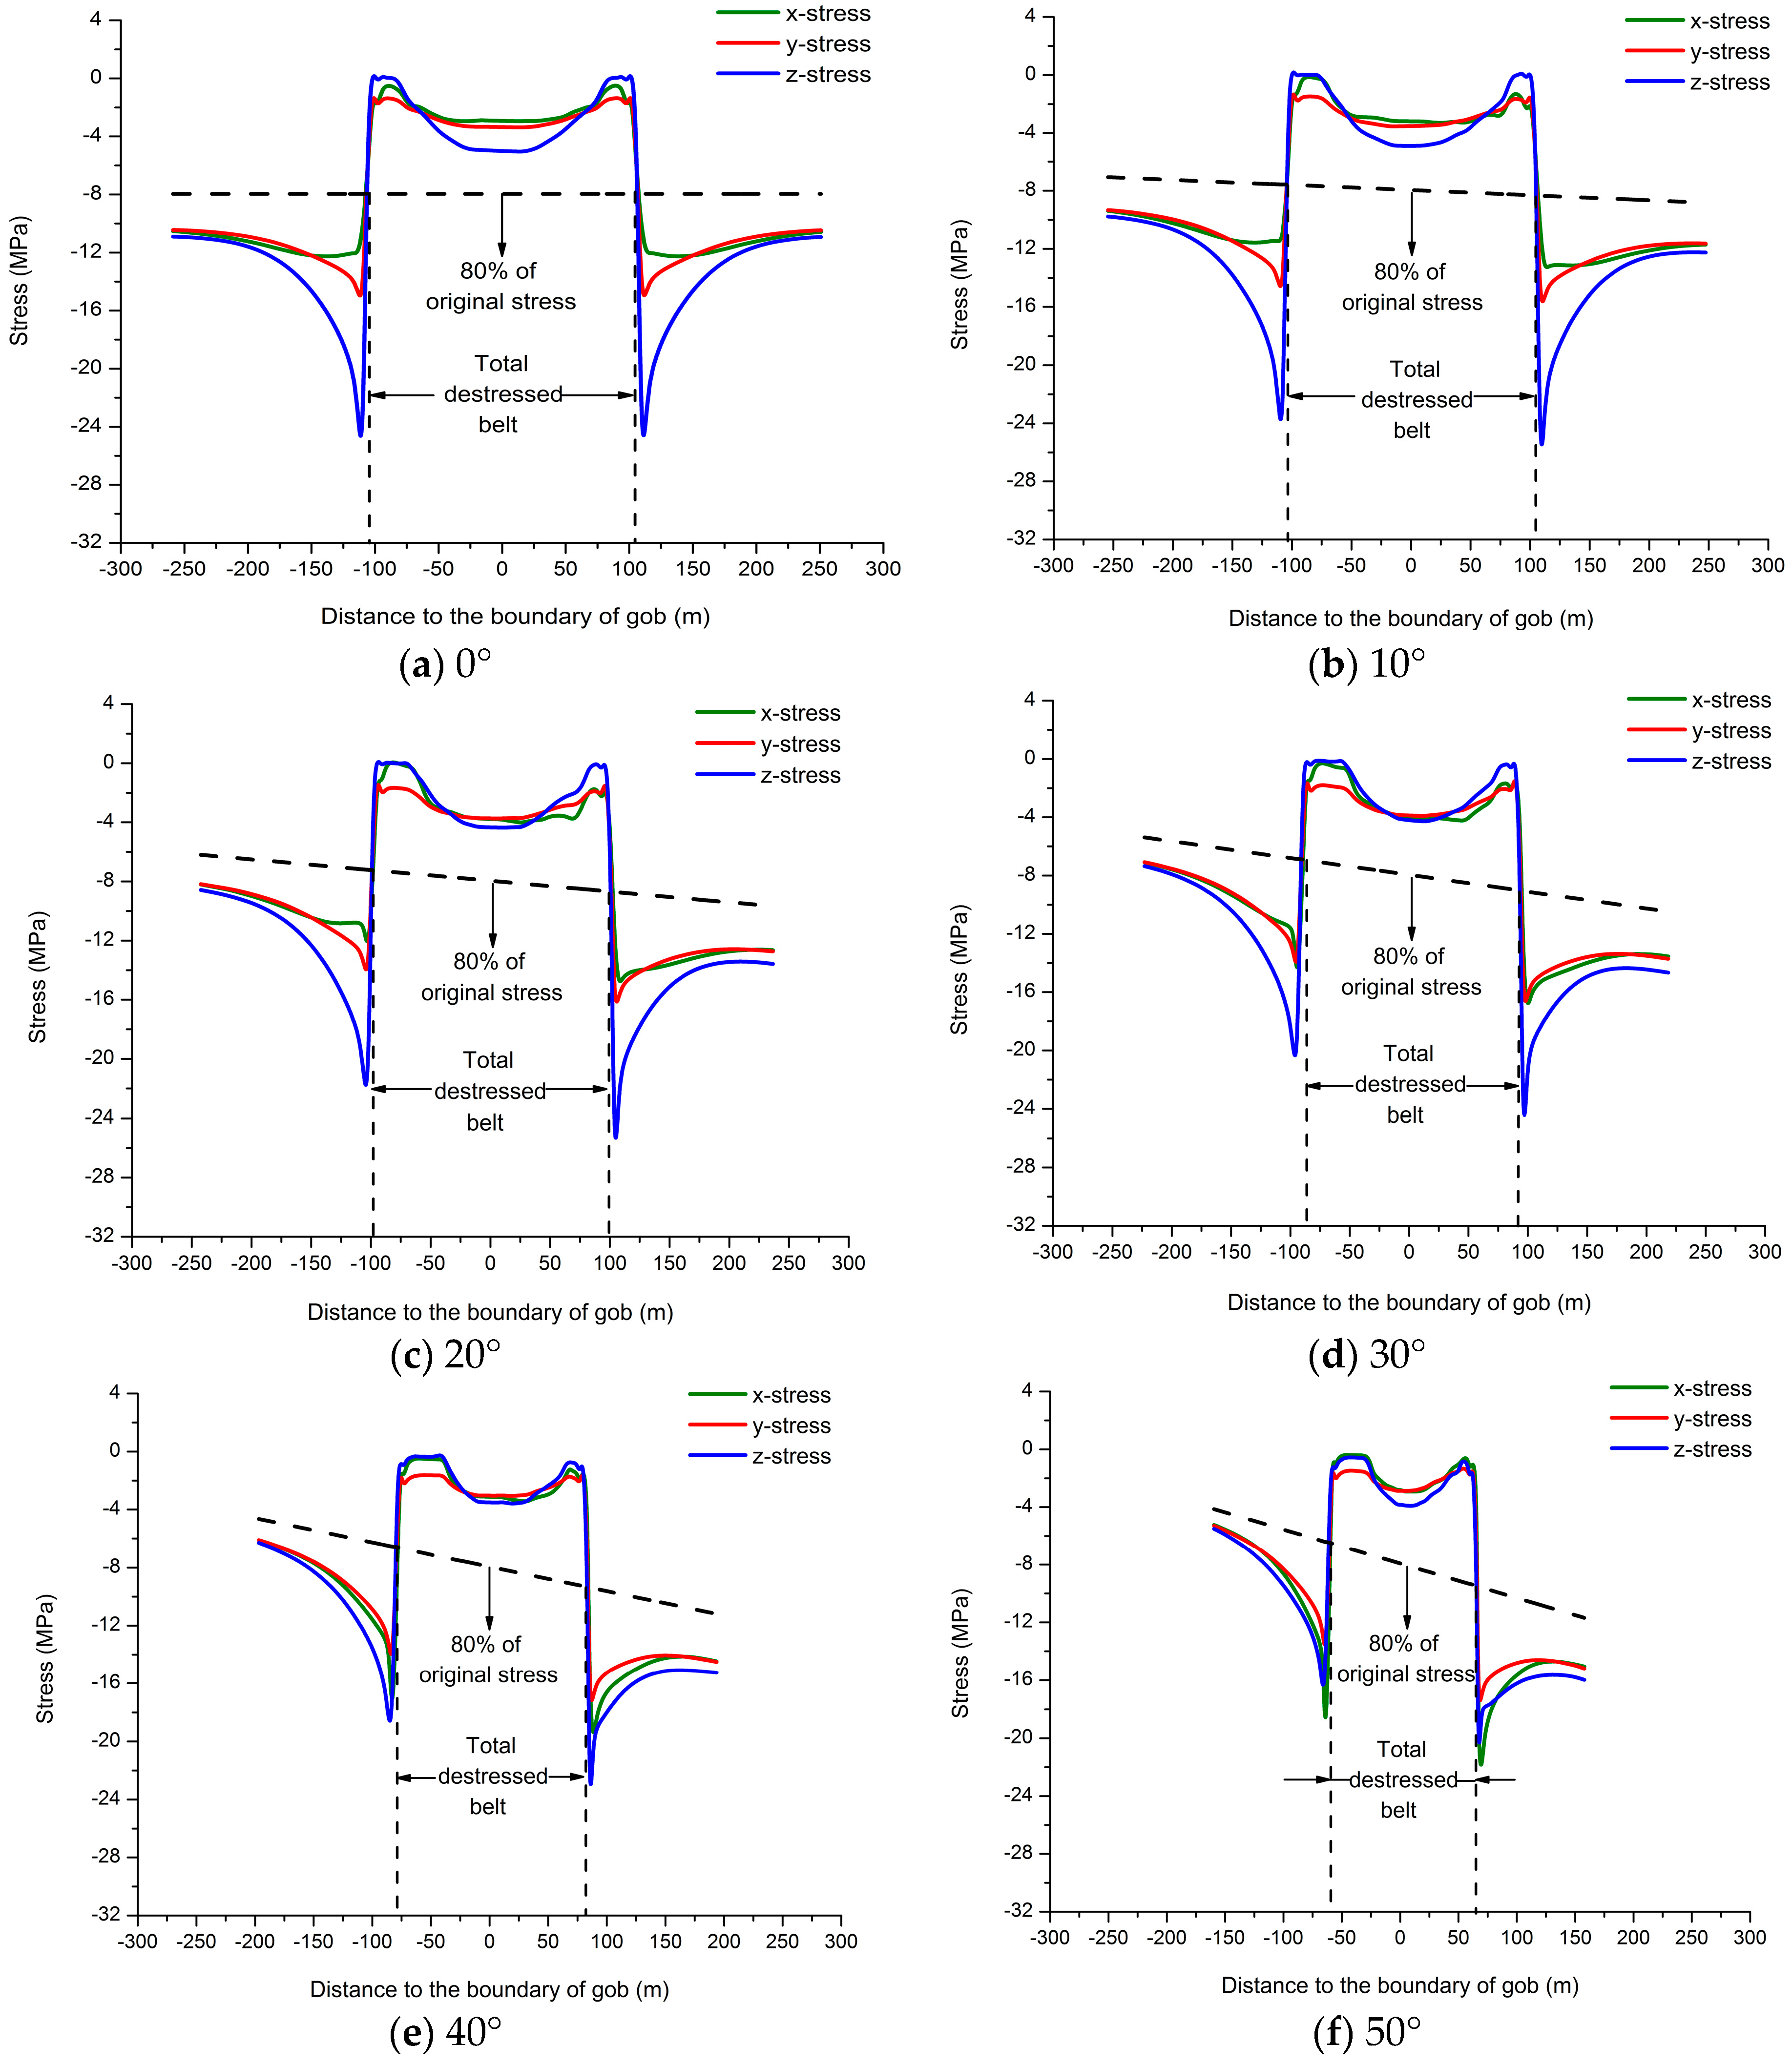
The three-dimensional stresses along Line 21, with different coalbed incidence angles, are shown in Figure 5. As shown in Figure 5, the three-dimensional stresses in gobs are all lower than 80% of the original stresses, and increase slowly around the middle of gobs, which is probably a result of the gobs being gradually filled with caved-in rocks. As the distance away from the gob sides increases, the three-dimensional stresses increase quickly to a peak value and then decrease to the original stresses. The stresses change intensely with the increase of coalbed incidence angles. The widths of total decreased belts become smaller as coalbed incidence angles increase.
3.2. MEZ Division
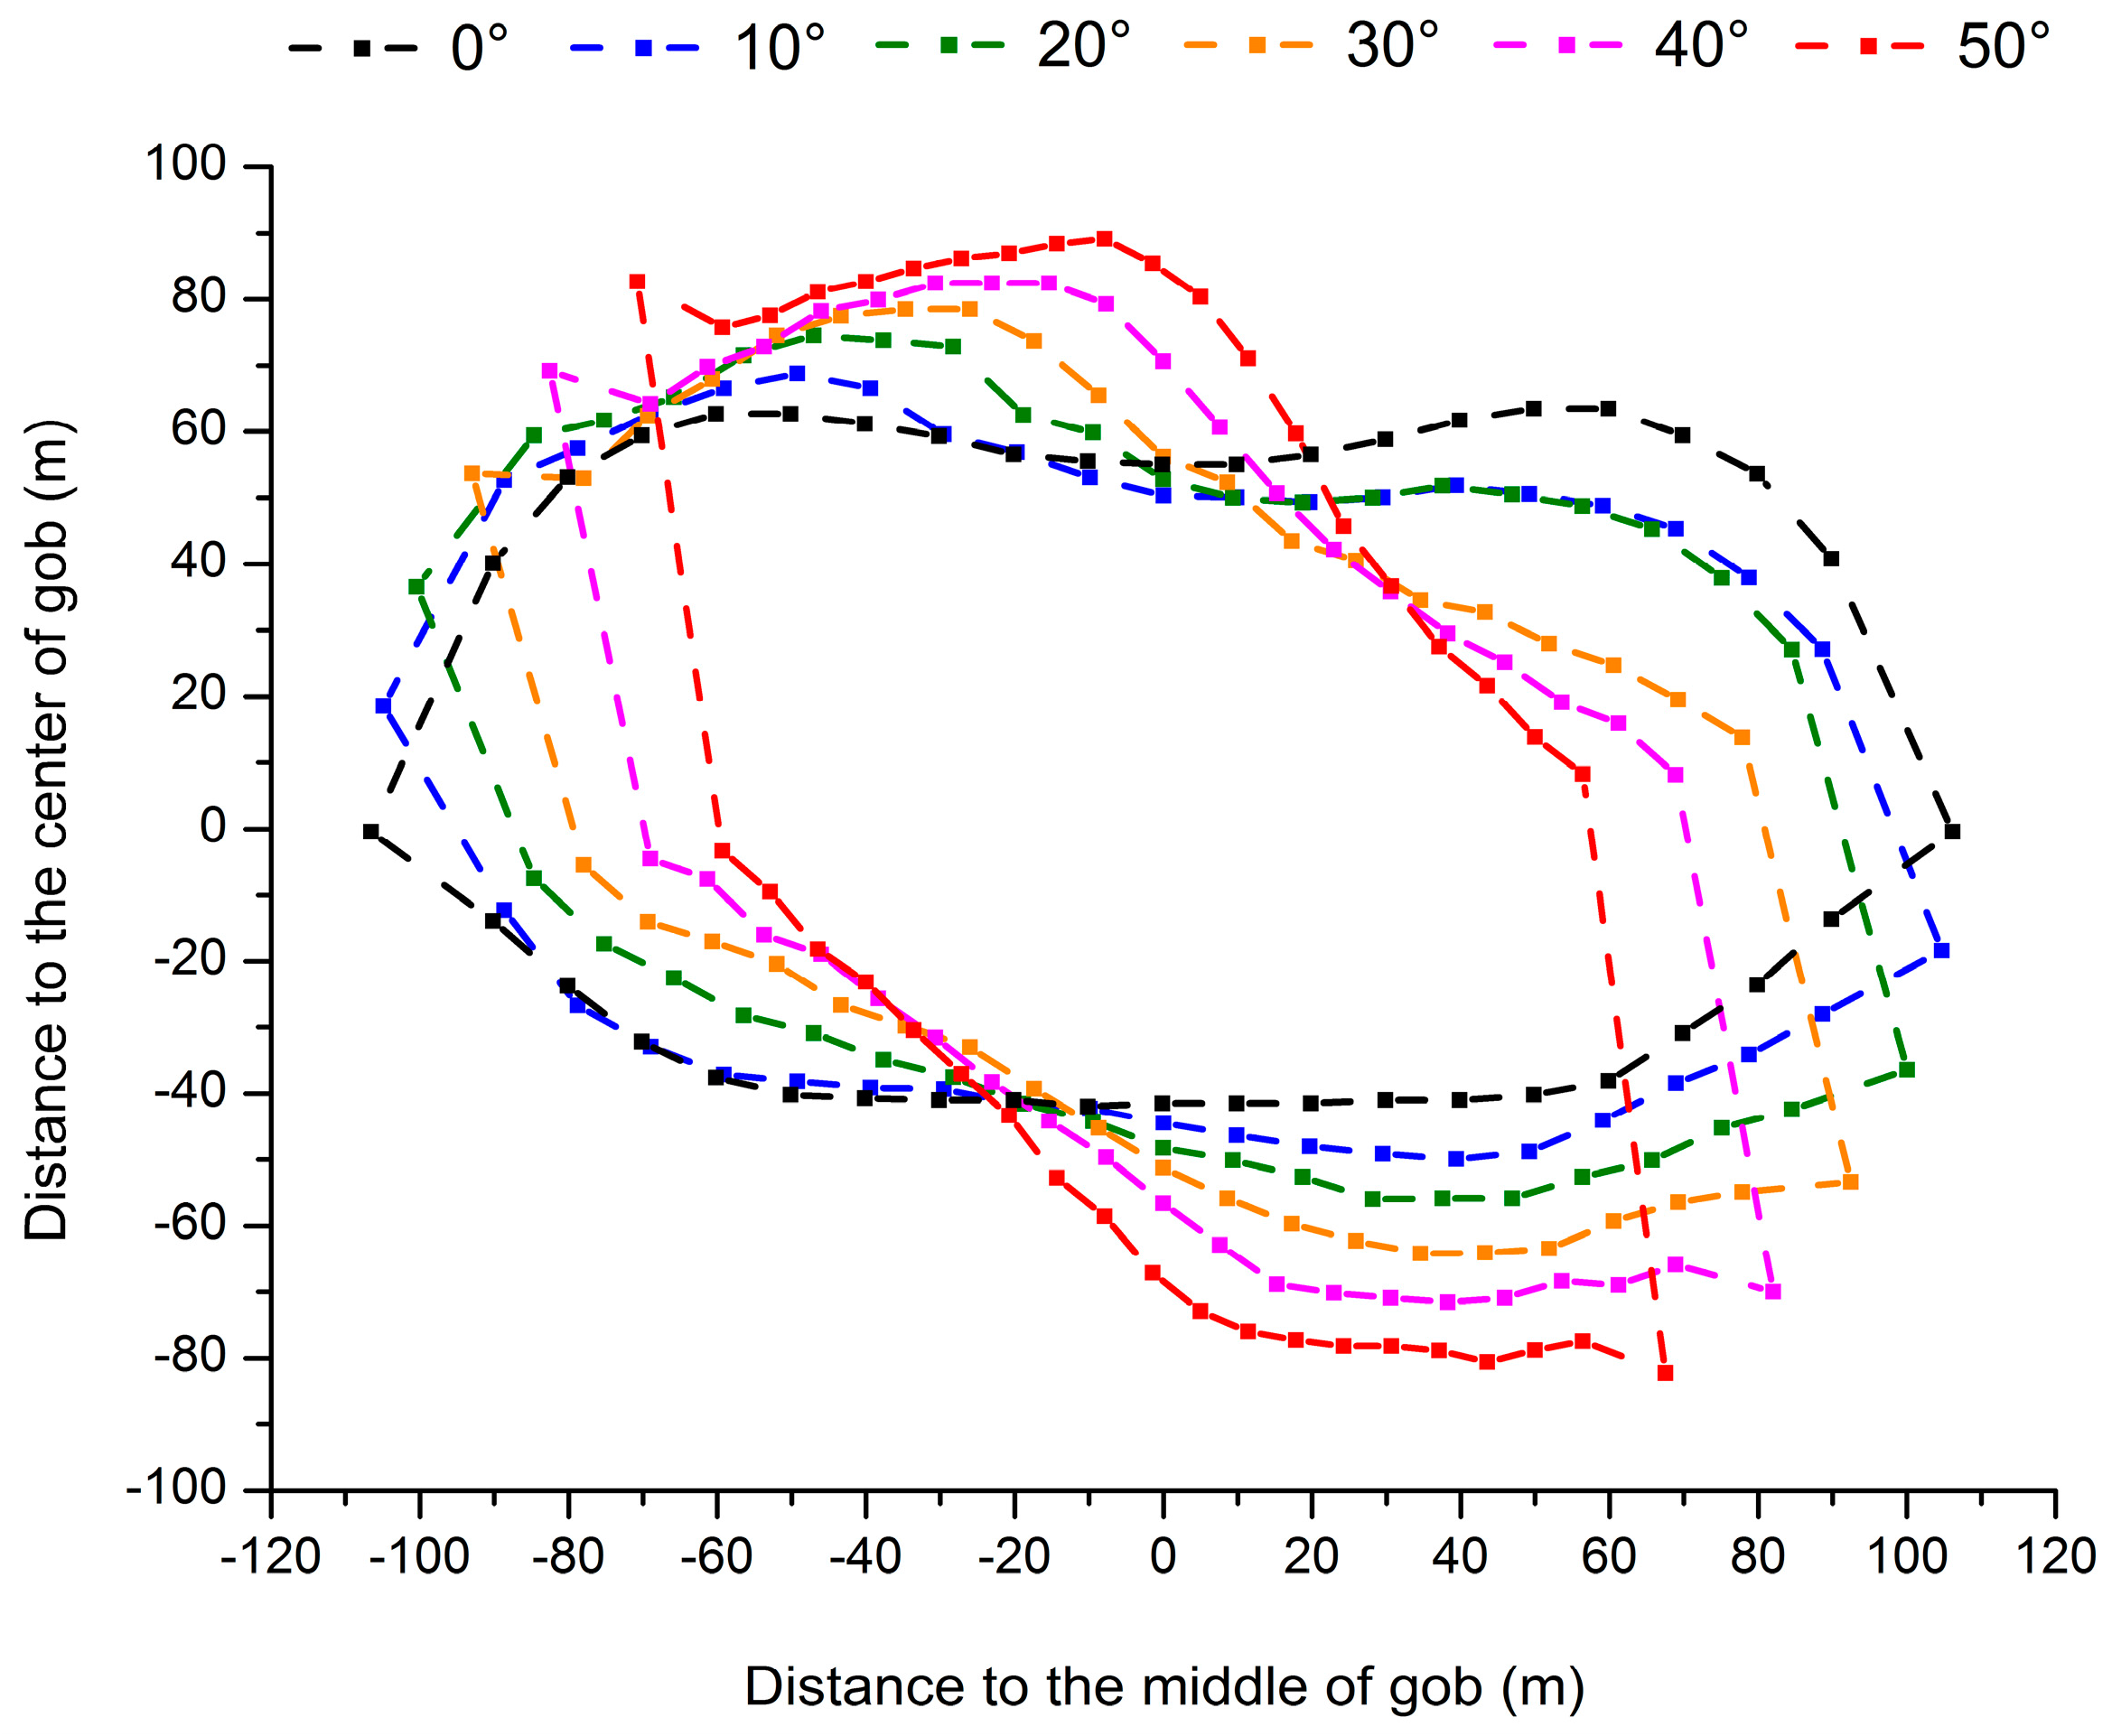
The three-dimensional stresses along other observation lines are extracted. The corresponding boundary points of total destressed belts along those observation lines could be obtained as in Figure 4 and Figure 5. The locations of all the boundary points of total destressed belts from Line 0 to Line 21 could be extracted in turn. The MEZ boundaries of gobs with different coalbed incidence angles can be formed by combining all those boundary points of total destressed belts along each observation line, shown in Figure 6. All the MEZ around mined coalbeds with different incidence angles consistently exhibit a “hexagon” shape, and rotate in a clockwise direction as the coalbed incidence angle increases. In the MEZ, stresses along every direction are sufficiently low to produce good methane flow.
The six vertices of the “hexagon”-shaped MEZ are marked as follows: A, B, C, D, E and F. B is the highest point of the MEZ, E is the lowest point, A is the leftmost point, and D is the rightmost point. Figure 7 shows the vertical distances from B, C, E and F of the MEZ to the middle incidence line of mined coal seam at different angles. As shown in Figure 7, the vertical distances from E and F to the middle incidence line gradually increase as the incidence angle of the coal seam increases, and F increases more quickly. The vertical distances from B and C to the middle incidence line gradually decrease as the coalbed angle increases, and C decreases more rapidly. The vertical distances from B and C to the middle incidence line of coal seam are greater than those from E and F to the middle incidence line of the coal seam. The vertical distances from B, C, E and F to the middle incidence line of coal seam and the coal seam angle show a good linear relationship, and the slope is between 0.05 and 0.30, indicating that the coal seam angle slightly affects the overall distribution range of the MEZ.
Figure 8 shows the vertical distances from B, C, E, and F to the middle horizontal line of coal seam at different angles. As shown in Figure 8, the vertical distances from B and E to the middle horizontal line of coal seam gradually increase as the coal seam angle increases, and E increases faster. The vertical distances from C and F to the middle horizontal line of coal seam gradually decrease as the coal seam angle increases, and C decreases faster. The vertical distances from B, C, E, and F to the middle horizontal line of coal seam change linearly as the coal seam angle increases, and the slope is between 0.5 and 1.1, showing that the effect of coalbed angle on the MEZ distribution range along the z-direction is significant. The vertical distance between B and E of the MEZ is called the MEZ height. Figure 9 shows the relationship between the MEZ height and the coal seam angle. As shown in Figure 9, the MEZ height increases linearly as the coal seam angle increases.
The distances from A and D to the mined coalbed edges are the MEZ widths in the upper coal pillar and the lower pillar, respectively. Figure 10 shows the relationship between the MEZ width in coal pillars and the coal seam angle. As shown in Figure 10, the MEZ widths in upper and lower coal pillars increase linearly as the coal seam angle increases, but the MEZ width in lower pillar increases faster. However, the slopes of the two lines in Figure 10 are minimal, between 0.02 and 0.04, indicating that the coalbed angle affects the distribution range of the MEZ in coal pillars only slightly.
There are two gases, methane and air, in the MEZ. The air comes from the ventilation introduced during the mining. As for the diffusion movement of the two-component mixed gases, the diffusion flux is expressed as follows [4,32]:
where JD represents the diffusion flux per unit area, (g/(m2s)); D represents the diffusion coefficient of the component of methane and air; H represents the MEZ height, (m); represents the methane density, (kg/m3), represents the air density, (kg/m3), and represents the mixed gas density, (kg/m3); is the methane molecular weight, is the air molecular weight; P is the partial pressure of methane, (MPa); R is the gas constant, (J/(mol·K)); and T is the thermodynamic temperature, (K).
Since the methane content in the mixed gases in the MEZ of gobs is lower, the partial pressure of methane in the mixed gases is relatively low. Therefore, the in the MEZ is assumed to be constant, and and are assumed to be approximately equal [4,32]. Meanwhile, the temperature in the MEZ is also assumed to be constant in this paper. Equation (1) can be described as:
where is constant.
When the diffusion of mixed gases in the MEZ reaches a steady state, the diffusion flux is assumed to be 0, and Equation (2) can be written as:
where, is the undetermined coefficient.
Since < 0 and > , > 0, Equation (3) is a monotonic increasing exponential function, indicating that the methane concentration increases exponentially as the height in the MEZ increases. In order to extract high-concentration methane from gobs, the bottoms of boreholes for gob methane drainage should be located in relatively higher positions in the MEZ. The effect of the coal seam angle on the MEZ height should also be considered. The larger the coal seam angle, the higher the location of the borehole bottoms.
4. Field Application
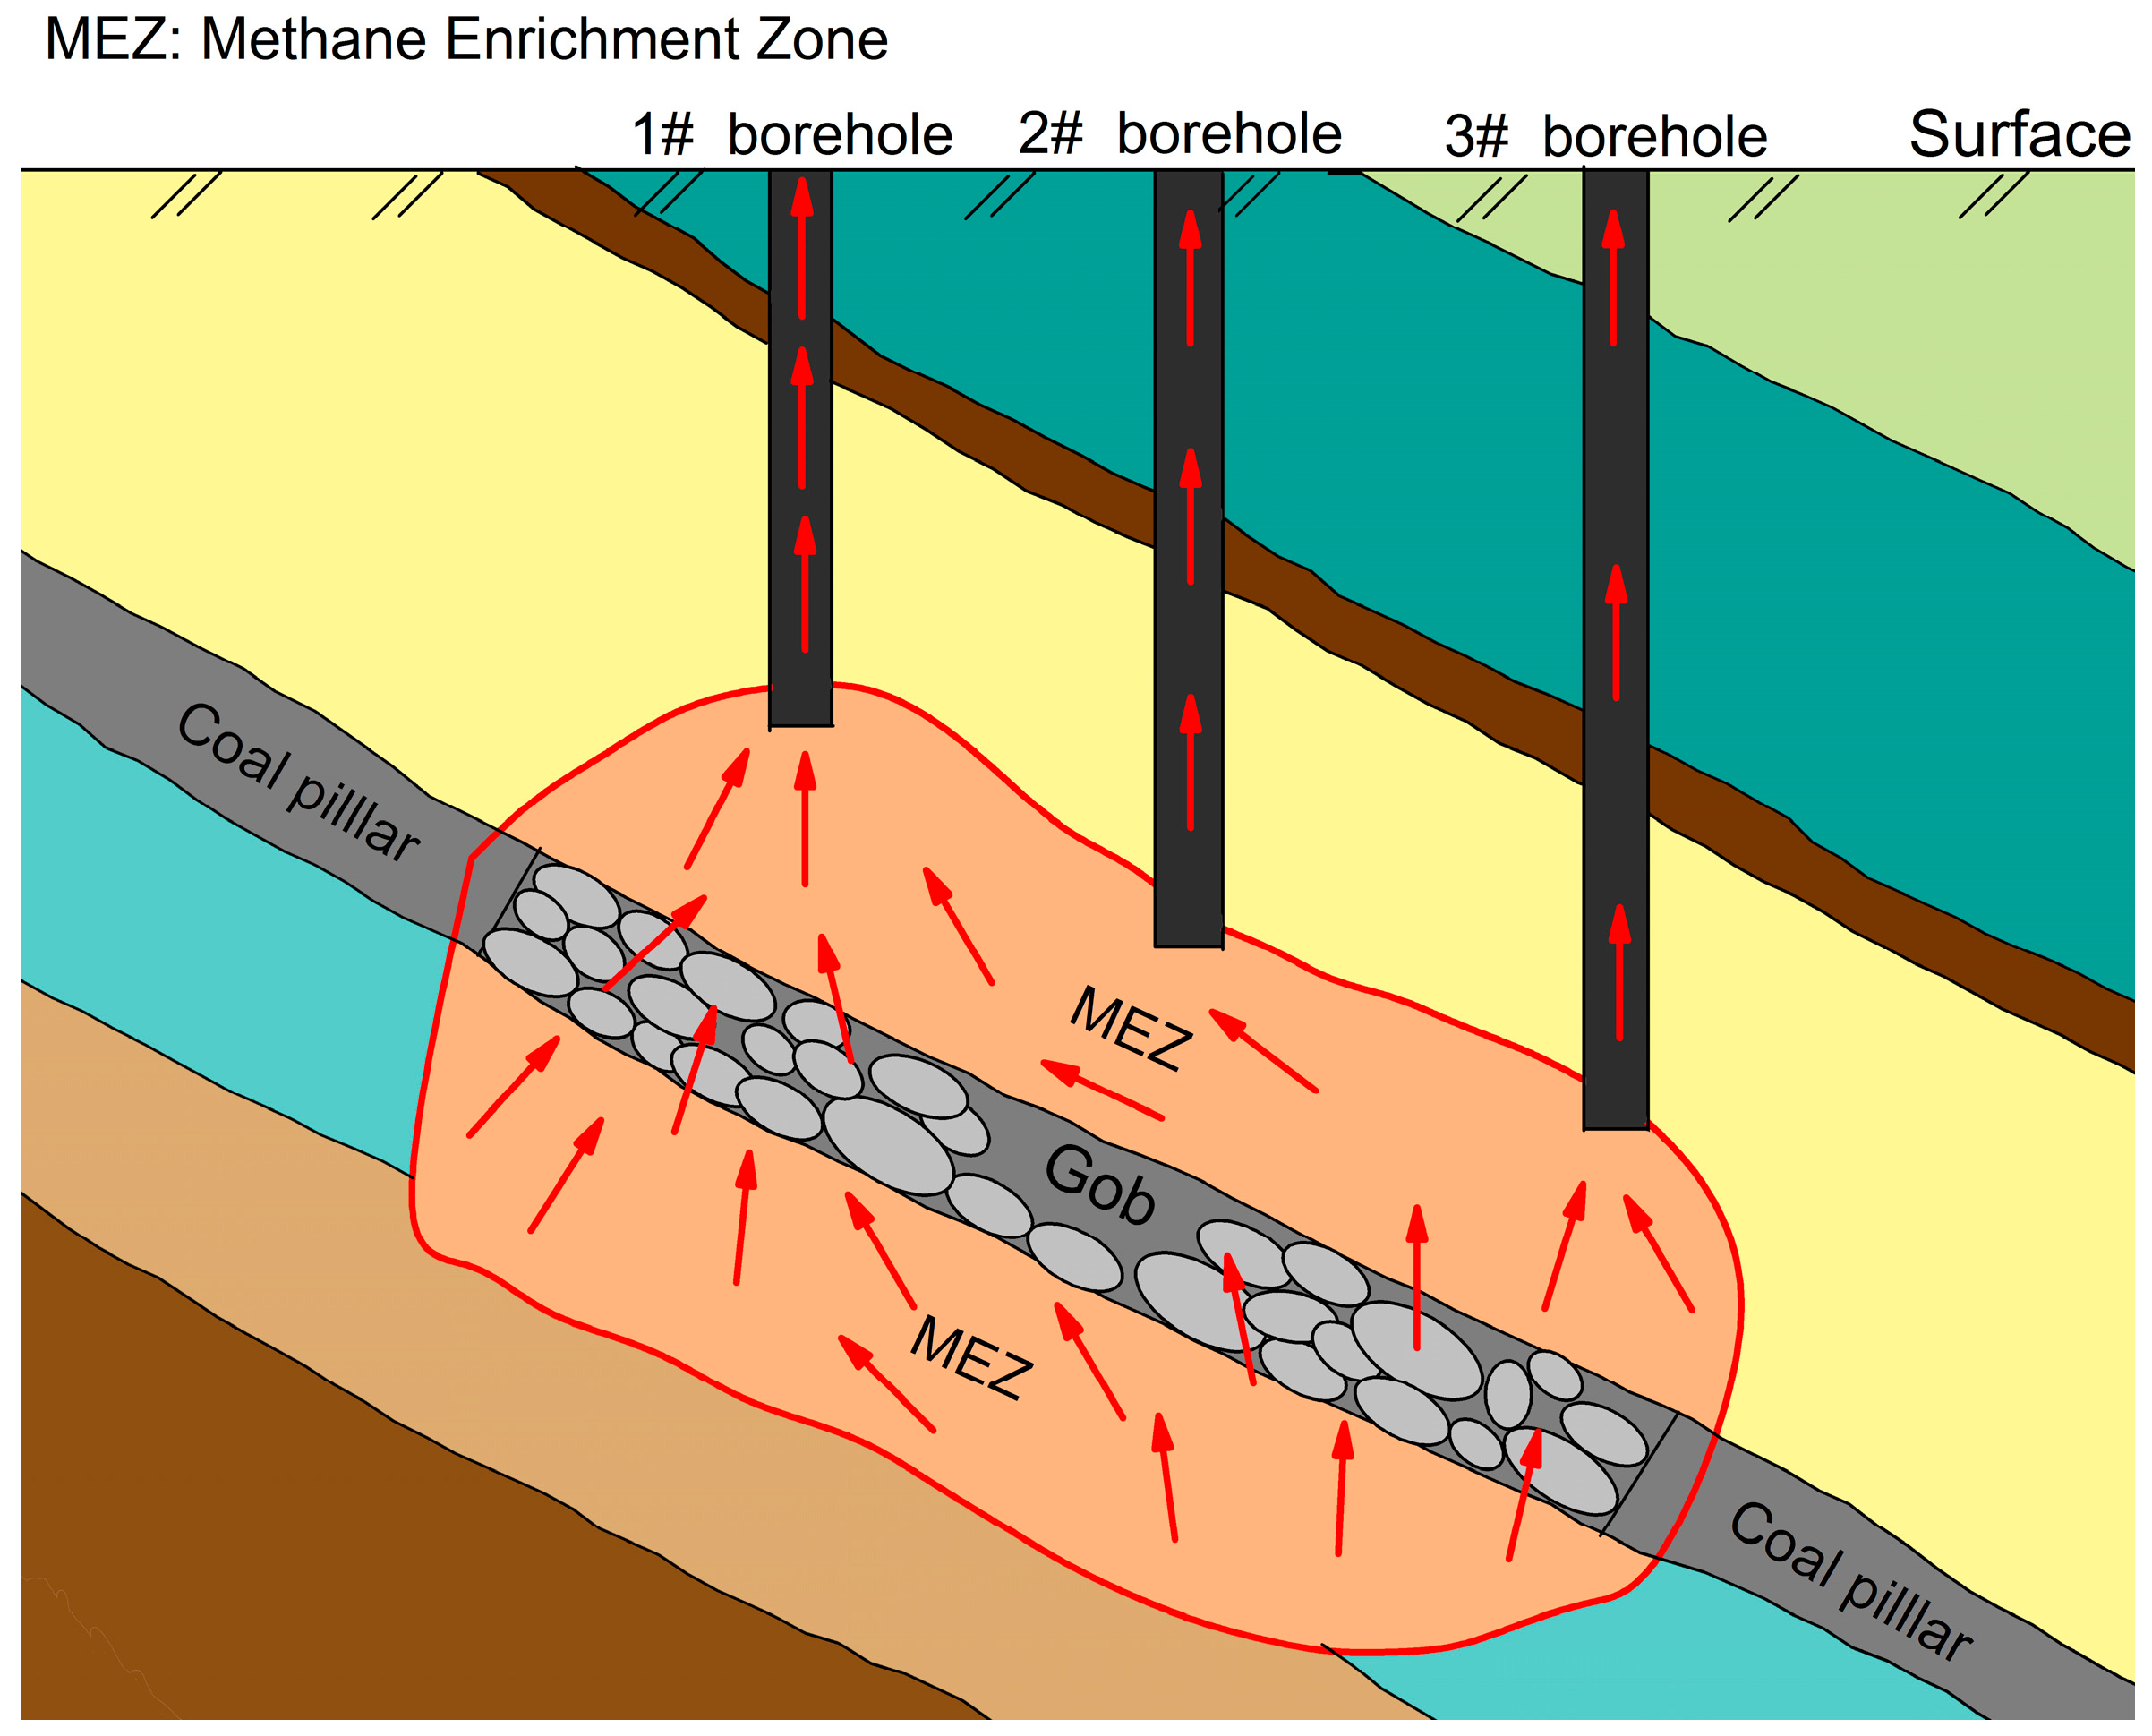
Surface vertical boreholes are usually used to drain the gob methane, and their bottoms are required to enter the MEZ in gobs [7]. There are no completely horizontal coal seams for any of the coal mines. Table 4 shows the common borehole locations. As shown in Table 4, boreholes are traditionally located near the return airflow roadway (RAR), the intake airflow roadway (IAR), or the mined coalbed center (MCC) of the mining workface. The elevation of the RAR is relatively higher than that of the IAR and the MCC. For a coal seam, the depth of the borehole bottom in the MEZ will directly affect the drainage performance of boreholes. Different borehole locations will result in different depths of borehole bottoms as shown in Figure 11. From Figure 11, it can be seen that the borehole bottom close to the RAR is higher than that close to the IAR and the MCC. Yuan et al. [33] conducted a field test for the comparison of methane drainage performance for different borehole locations in Pansan mine, located in Anhui Province, China.
The mine currently produces 3 million tons of raw coal annually. A simplified geological setting of the Pansan mine [33] is shown in Figure 12. As shown in Figure 12, the target seams for economic production are the 13-1#, and 11-2# with an average dip angle of 7°. Their average thicknesses are 3.94 m and 2 m, respectively, and their methane contents are 10.0 m3/t and 10.8 m3/t, respectively. Coal seams 12# and 11-1# also occur in the mine, 70 m above and 3.7 m below the 11-2# coal seam respectively. The field test site is workface 17171(1) which belongs to coal seam 11-2#. The coal seam is longwall mined. Figure 13 shows the layout of workface 17171(1) in the Pansan mine. The length and width of the workface are 760 m and 220 m, respectively. Two surface boreholes are set at different positions of the workface as shown in Figure 12 and Figure 13. Boreholes 1# and 2# are close to the RAR and the IAR, respectively. They are 70 m and 50 m away from the RAR and the IAR in the horizontal direction, respectively. The distance between 1# borehole and 2# borehole is 200 m. The bottoms of the two boreholes all enter into the 11-2# coal seam.
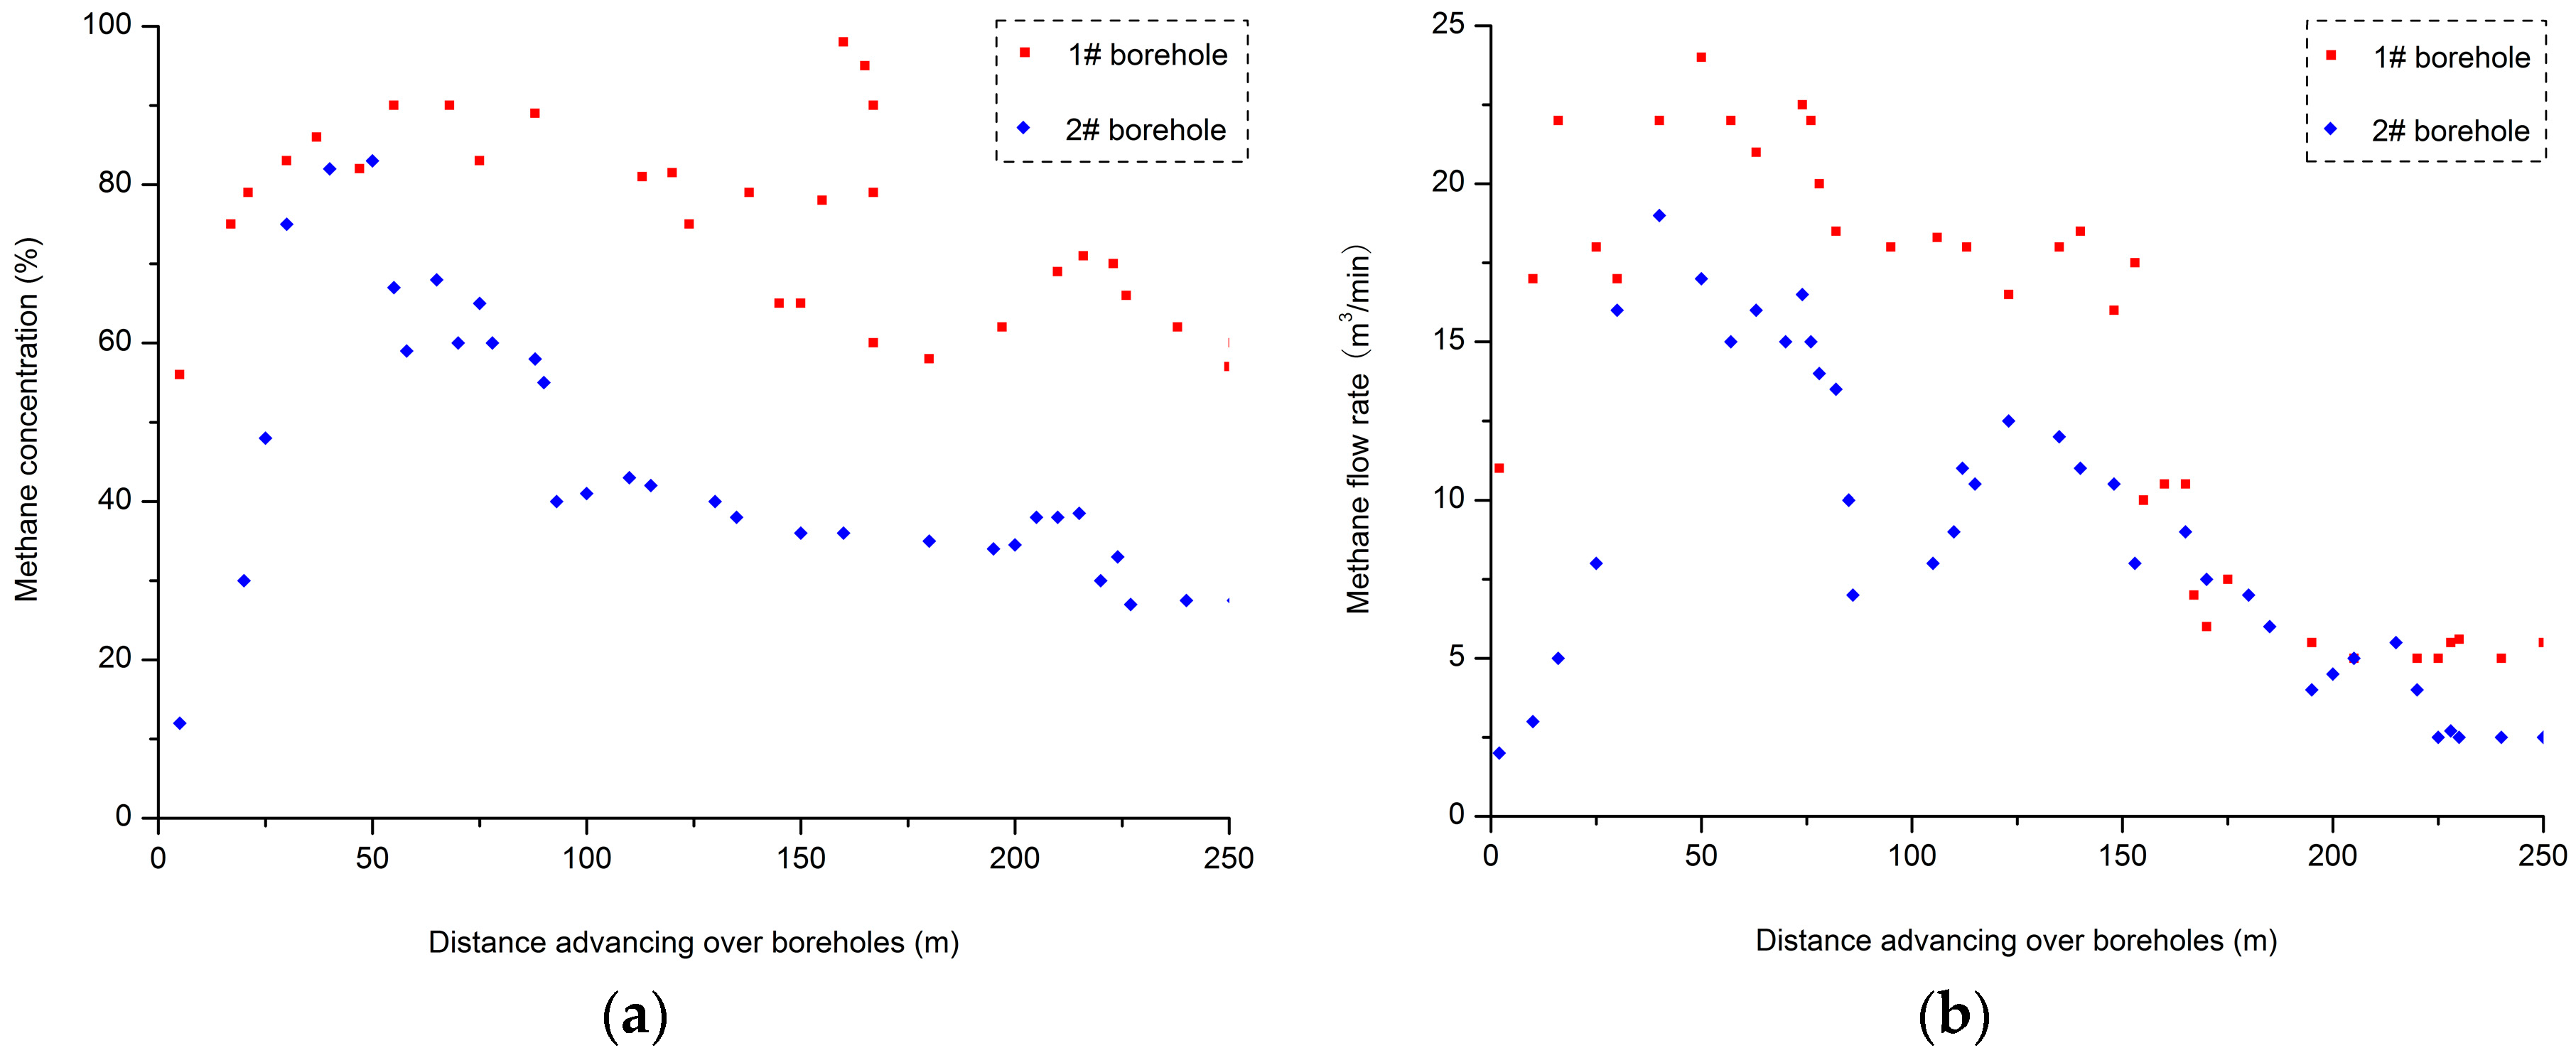
The methane concentration and flow rate of 1# borehole and 2# borehole after the workface advancing over the boreholes are shown in Figure 14. As shown in Figure 14, the methane concentration and methane flow rate of 1# borehole are obviously higher than that of 2# borehole. The average methane concentration and methane flow rate of 1# borehole are 75.4% and 12.7 m3/min, respectively, while the average methane concentration and methane flow rate of 2# borehole are just 43.0% and 9.5 m3/min, respectively. The average dip angle of 11-2# coal seam is just 7°, resulting in that the bottom of 1# borehole is slightly higher than that of the 2# borehole.
The results of field testing in Figure 14 prove that the higher the MEZ is, the higher the methane concentration will be. The slight height difference between the two boreholes has led to sharp contrast in methane drainage quality. If the coalbed incidence angle is larger, the height difference of the boreholes will be greater. This indicates that the methane concentration will be greater when the borehole bottom is set at a higher height in the MEZ, or when the coalbed incidence angle is greater. Therefore, the borehole bottom should consider the MEZ distribution and coalbed incidence angle synthetically in order to achieve the best methane extraction results.
5. Conclusions
The following main conclusions can be made based on this study:
- (1)
- The MEZ around mined coalbeds with incidence angles ranging from 0° to 50° consistently exhibit a “hexagon” shape, and rotate in a clockwise direction as the coalbed angle increases. Three-dimensional stresses in the MEZ are low enough to make good flow channels for methane to flow freely.
- (2)
- The MEZ range above the mined seam is larger than that below the mined seam for different coalbed angles. The effect of coal seam angle on the MEZ distribution range is minimal. As the coal seam angle increases, the MEZ range in the roof decreases, whereas the MEZ range in the floor increases. The MEZ widths in the upper and lower coal pillars of gobs increase as the coalbed angle increases, and the MEZ width in lower pillar increases faster.
- (3)
- The coalbed angle has a significant impact on the MEZ height. The MEZ height increases as the coal seam angle increases. As the MEZ height increases, the methane concentration of the corresponding height increases exponentially. A field test conducted in the Pansan mine in China confirms this. The results indicate that a higher methane concentration and flow rate can be achieved by arranging a surface vertical borehole at a relatively higher position in the MEZ.
Acknowledgments
This research was supported by the National Science Fund for Excellent Young Scholars (No. 51422404), the National Natural Science Foundation of China (51504160, 51574172), the Key Scientific and Technological Coal Projects of Shanxi Province (MQ2014-12), the Coalbed Methane Joint Research Foundation of Shanxi Province (2015012008), the Province the Program for the Innovative Talents of Higher Learning Institutions of Shanxi and the Team Foundation of Taiyuan University of Technology (No. 2014TD001), and the Natural Science Foundation of Shanxi (201701D221233). This work was also supported by Independent Research Projects of State Key Laboratory of Coal Resources and Safe Mining, CUMT (14KF03).
Author Contributions
S.H. and G.F. conceived and designed the experiments; A.Z. performed the experiments; A.Z. and S.G. analyzed the data; X.G. and C.L. contributed analysis tools; G.X. polished the language; S.H. wrote the paper.
Conflicts of Interest
The authors declare no conflict of interest.
References
- Yuan, L. Theory and practice of integrated pillar-less coal production and methane extraction in multi-seam of low permeability. Eng. Sci. 2009, 11, 72–80. [Google Scholar]
- Wang, L.; Cheng, Y.P. Drainage and utilization of Chinese coal mine methane with a coal-methane co-exploitation model: Analysis and projections. Resour. Policy 2012, 37, 315–321. [Google Scholar] [CrossRef]
- Majdi, A.; Hassani, F.P.; Nasiri, M.Y. Prediction of the height of destressed zone above the mined panel roof in longwall coal mining. Int. J. Coal Geol. 2012, 98, 62–72. [Google Scholar] [CrossRef]
- Hu, S.Y.; Li, Z.; Feng, G.R.; Xu, G.; Xia, T.Q.; Jiang, H.N.; Zhang, Y.T.; Cheng, J.W.; Gao, Q.; Wang, Z.; et al. Changes on methane concentration after CO2 injection in a longwall gob: A case study. J. Nat. Gas Sci. Eng. 2016, 29, 550–558. [Google Scholar] [CrossRef]
- Karacan, C.Ö. Analysis of gob gas venthole production performances for strata gas control in longwall mining. Int. J. Rock Mech. Min. Sci. 2015, 79, 9–18. [Google Scholar] [CrossRef]
- Saghafi, A.; Pinetown, K.L. A new method to determine the depth of the de-stressed gas-emitting zone in the underburden of a longwall coal mine. Int. J. Coal Geol. 2015, 152, 156–164. [Google Scholar] [CrossRef]
- Karacan, C.Ö. Forecasting gob gas venthole production performances using intelligent computing methods for optimum methane control in longwall coal mines. Int. J. Coal Geol. 2009, 79, 131–144. [Google Scholar] [CrossRef]
- Zhai, C.; Xiang, X.W.; Zou, Q.L.; Yu, X.; Xu, Y.M. Influence factors analysis of a flexible gel sealing material for coal-bed methane drainage boreholes. Environ. Earth Sci. 2016, 75, 151. [Google Scholar] [CrossRef]
- Qu, Q.D.; Guo, H.; Loney, M. Analysis of longwall goaf gas drainage trials with surface directional boreholes. Int. J. Coal Geol. 2016, 156, 59–73. [Google Scholar] [CrossRef]
- Karacan, C.Ö.; Ruiz, F.A.; Cotè, M.; Phipps, S. Coal mine methane: A review of capture and utilization practices with benefits to mining safety and to greenhouse gas reduction. Int. J. Coal Geol. 2011, 86, 121–156. [Google Scholar] [CrossRef]
- Qin, Z.Y.; Yuan, L.; Guo, H.; Qu, Q.D. Investigation of longwall goaf gas flows and borehole drainage performance by CFD simulation. Int. J. Coal Geol. 2015, 150–151, 51–63. [Google Scholar] [CrossRef]
- Flügge, G. Die anwendung der trogtheorie auf den raum der zusatzausgasung. Glückauf Forsch. 1971, 32, 122–129. [Google Scholar]
- Singh, R.P.; Yadav, R.N. Prediction of subsidence due to coal mining in Raniganj coalfield, West Bengal, India. Eng. Geol. 1995, 39, 103–111. [Google Scholar] [CrossRef]
- Palchik, V. Localization of mining-induced horizontal fractures along rock layer interfaces in overburden: Field measurements and prediction. Environ. Geol. 2005, 48, 68–80. [Google Scholar] [CrossRef]
- Miao, X.X.; Cui, X.M.; Wang, J.A.; Xu, J.L. The height of fractured water-conducting zone in undermined rock strata. Eng. Geol. 2011, 120, 32–39. [Google Scholar] [CrossRef]
- Guo, H.; Yuan, L.; Shen, B.; Qu, Q.; Xue, J. Mining-induced strata stress changes, fractures and gas flow dynamics in multi-seam longwall mining. Int. J. Rock Mech. Min. Sci. 2012, 54, 129–139. [Google Scholar] [CrossRef]
- Gao, F.Q.; Stead, D.; Coggan, J. Evaluation of coal longwall caving characteristics using an innovative UDEC Trigon approach. Comput. Geotech. 2014, 55, 448–460. [Google Scholar] [CrossRef] [Green Version]
- Qu, Q.D.; Xu, J.L.; Wu, R.L.; Qin, W.; Hu, G.Z. Three-zone characterization of coupled strata and gas behaviour in multi-seam mining. Int. J. Rock Mech. Min. Sci. 2015, 78, 91–98. [Google Scholar]
- Wang, S.F.; Li, X.B.; Wang, D.M. Void fraction distribution in overburden disturbed by longwall mining of coal. Environ. Earth Sci. 2016, 75, 151. [Google Scholar] [CrossRef]
- Jing, L. A review of techniques advances and outstanding issues in numerical modeling for rock mechanics and rock engineering. Int. J. Rock Mech. Min. Sci. 2003, 40, 283–353. [Google Scholar] [CrossRef]
- Yasitli, N.E.; Unver, B. 3D numerical modeling of longwall mining with top-coal caving. Int. J. Rock Mech. Min. Sci. 2005, 42, 219–235. [Google Scholar] [CrossRef]
- Whittles, D.N.; Lowndes, I.S.; Kingman, S.W.; Yates, C.; Jobling, S. Influence of geotechnical factors on gas flow experienced in a UK longwall coal mine panel. Int. J. Rock Mech. Min. Sci. 2006, 43, 369–387. [Google Scholar] [CrossRef]
- Chen, J.H.; Wang, T.; Zhou, Y.; Zhu, Y.L.; Wang, X.X. Failure modes of the surface venthole casing during longwall coal extraction: A case study. Int. J. Coal Geol. 2012, 90–91, 135–148. [Google Scholar] [CrossRef]
- Yang, W.; Lin, B.Q.; Qu, Y.A.; Zhao, S.; Zhai, C.; Jia, L.L.; Zhao, W.Q. Mechanism of strata deformation under protective seam and its application for relieved methane control. Int. J. Coal Geol. 2011, 85, 300–306. [Google Scholar] [CrossRef]
- Yang, W.; Lin, B.Q.; Yan, Q.; Zhai, C. Stress redistribution of longwall mining stope and gas control of multi-layer coal seams. Int. J. Rock Mech. Min. Sci. 2014, 72, 8–15. [Google Scholar] [CrossRef]
- Corthésy, R.; Leite, M.H. A strain-softening numerical model of core discing and damage. Int. J. Rock Mech. Min. Sci. 2008, 45, 329–350. [Google Scholar] [CrossRef]
- Yang, W.; Lin, B.Q.; Zhai, C.; Li, X.Z.; An, S. How in situ stresses and the driving cycle footage affect the gas outburst risk of driving coal mine roadway. Tunn. Undergr. Space Technol. 2012, 31, 139–148. [Google Scholar] [CrossRef]
- Wang, J.-A.; Park, H.D. Fluid permeability of sedimentary rocks in a complete stress-strain process. Eng. Geol. 2002, 63, 291–300. [Google Scholar] [CrossRef]
- Yang, T.H.; Liu, J.; Zhu, W.C.; Elsworth, D.; Tham, L.G.; Tang, C.A. A coupled flow-stress-damage model for groundwater outbursts from an underlying aquifer into mining excavations. Rock Mech. Rock Eng. 2007, 44, 87–97. [Google Scholar] [CrossRef]
- Wang, S.G.; Elsworth, D.; Liu, J.S. Permeability evolution during progressive deformation of intact coal and implications for instability in underground coal seams. Rock Mech. Rock Eng. 2013, 58, 34–45. [Google Scholar] [CrossRef]
- Hu, S.Y.; Zhou, F.B.; Liu, Y.K.; Xia, T.Q. Effective Stress and Permeability Redistributions Induced by Successive Roadway and Borehole Excavations. Rock Mech. Rock Eng. 2015, 48, 319–332. [Google Scholar] [CrossRef]
- Li, S.G.; Lin, H.F.; Zhao, P.X.; Xiao, P.; Pan, H.Y. Dynamic evolution of mining fissure elliptic paraboloid zone and extraction coal and gas. J. China Coal Soc. 2014, 39, 1455–1462. [Google Scholar]
- Yuan, L.; Guo, H.; Li, P.; Liang, Y.P.; Liao, B.C. Theory and technology of goaf gas drainage with large diameter surface boreholes. J. China Coal Soc. 2013, 38, 1–8. [Google Scholar]
- Liang, Y.P. Practice of methane drainage by surface well drilling in Huainan mining area. J. Min. Saf. Eng. 2007, 24, 409–413. [Google Scholar]
- Liu, Y.K.; Zhou, F.B.; Liu, L.; Liu, C.; Hu, S.Y. An experimental and numerical investigation on the deformation of overlying coal seams above double-seam extraction for controlling coal mine methane emissions. Int. J. Coal Geol. 2011, 87, 139–149. [Google Scholar]
Figure 1.
3D model mesh grids, size and boundary.

Figure 2.
Representative profiles of the model.

Figure 3.
Layout of observation lines in representative profiles.

Figure 4.
Three-dimensional stress distributions along Line 15 with different incidence angles.

Figure 5.
Three-dimensional stresses along Line 21 with different incidence angles.

Figure 6.
MEZ boundaries of gobs with different coalbed incidence angles.

Figure 7.
Vertical distances from B, C, E and F of the MEZ to the middle incidence line of mined seam at different angles.
Figure 7.
Vertical distances from B, C, E and F of the MEZ to the middle incidence line of mined seam at different angles.
Figure 8.
Vertical distances from B, C, E and F to the middle horizontal line of coal seam at different angles.
Figure 8.
Vertical distances from B, C, E and F to the middle horizontal line of coal seam at different angles.
Figure 9.
Relationship between the MEZ height and the coalbed angle.
Figure 10.
Relationship between the MEZ width in coal pillars and the coal seam angle.
Figure 11.
Schematic of typical borehole locations.

Figure 12.
Simplified geological setting of Pansan mine.
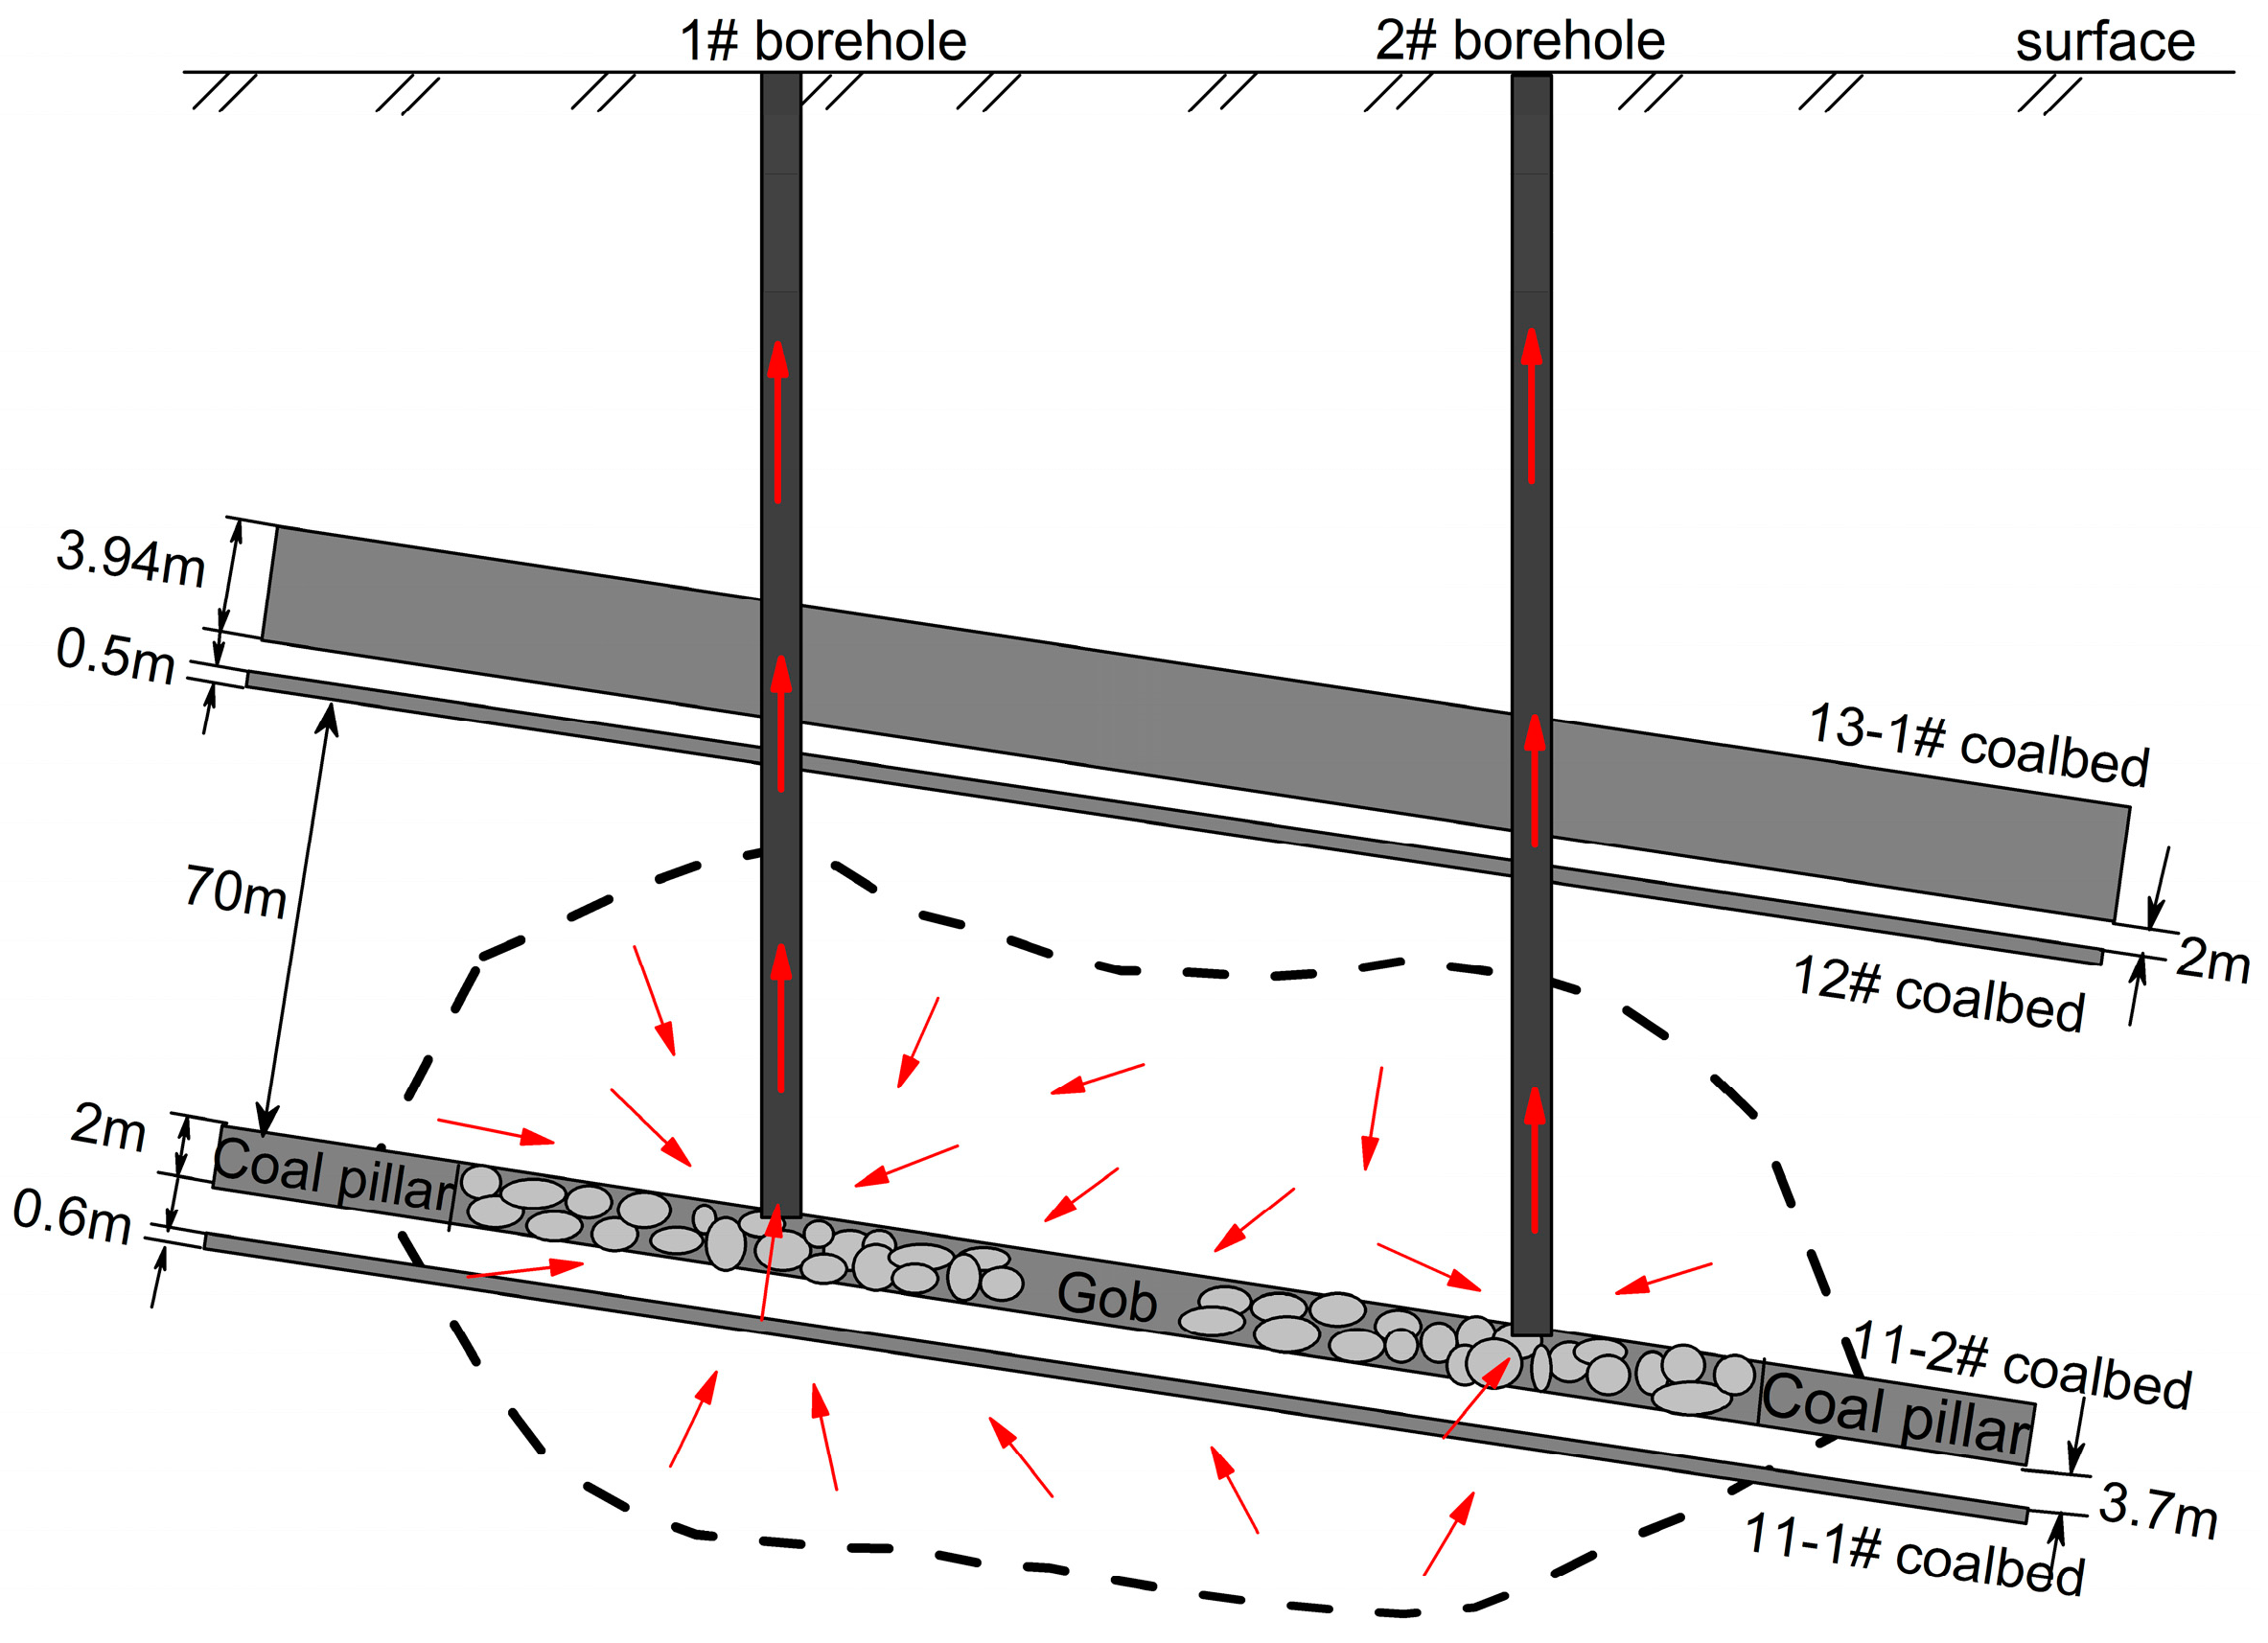
Figure 13.
Layout of 17171(1) workface in Pansan mine.
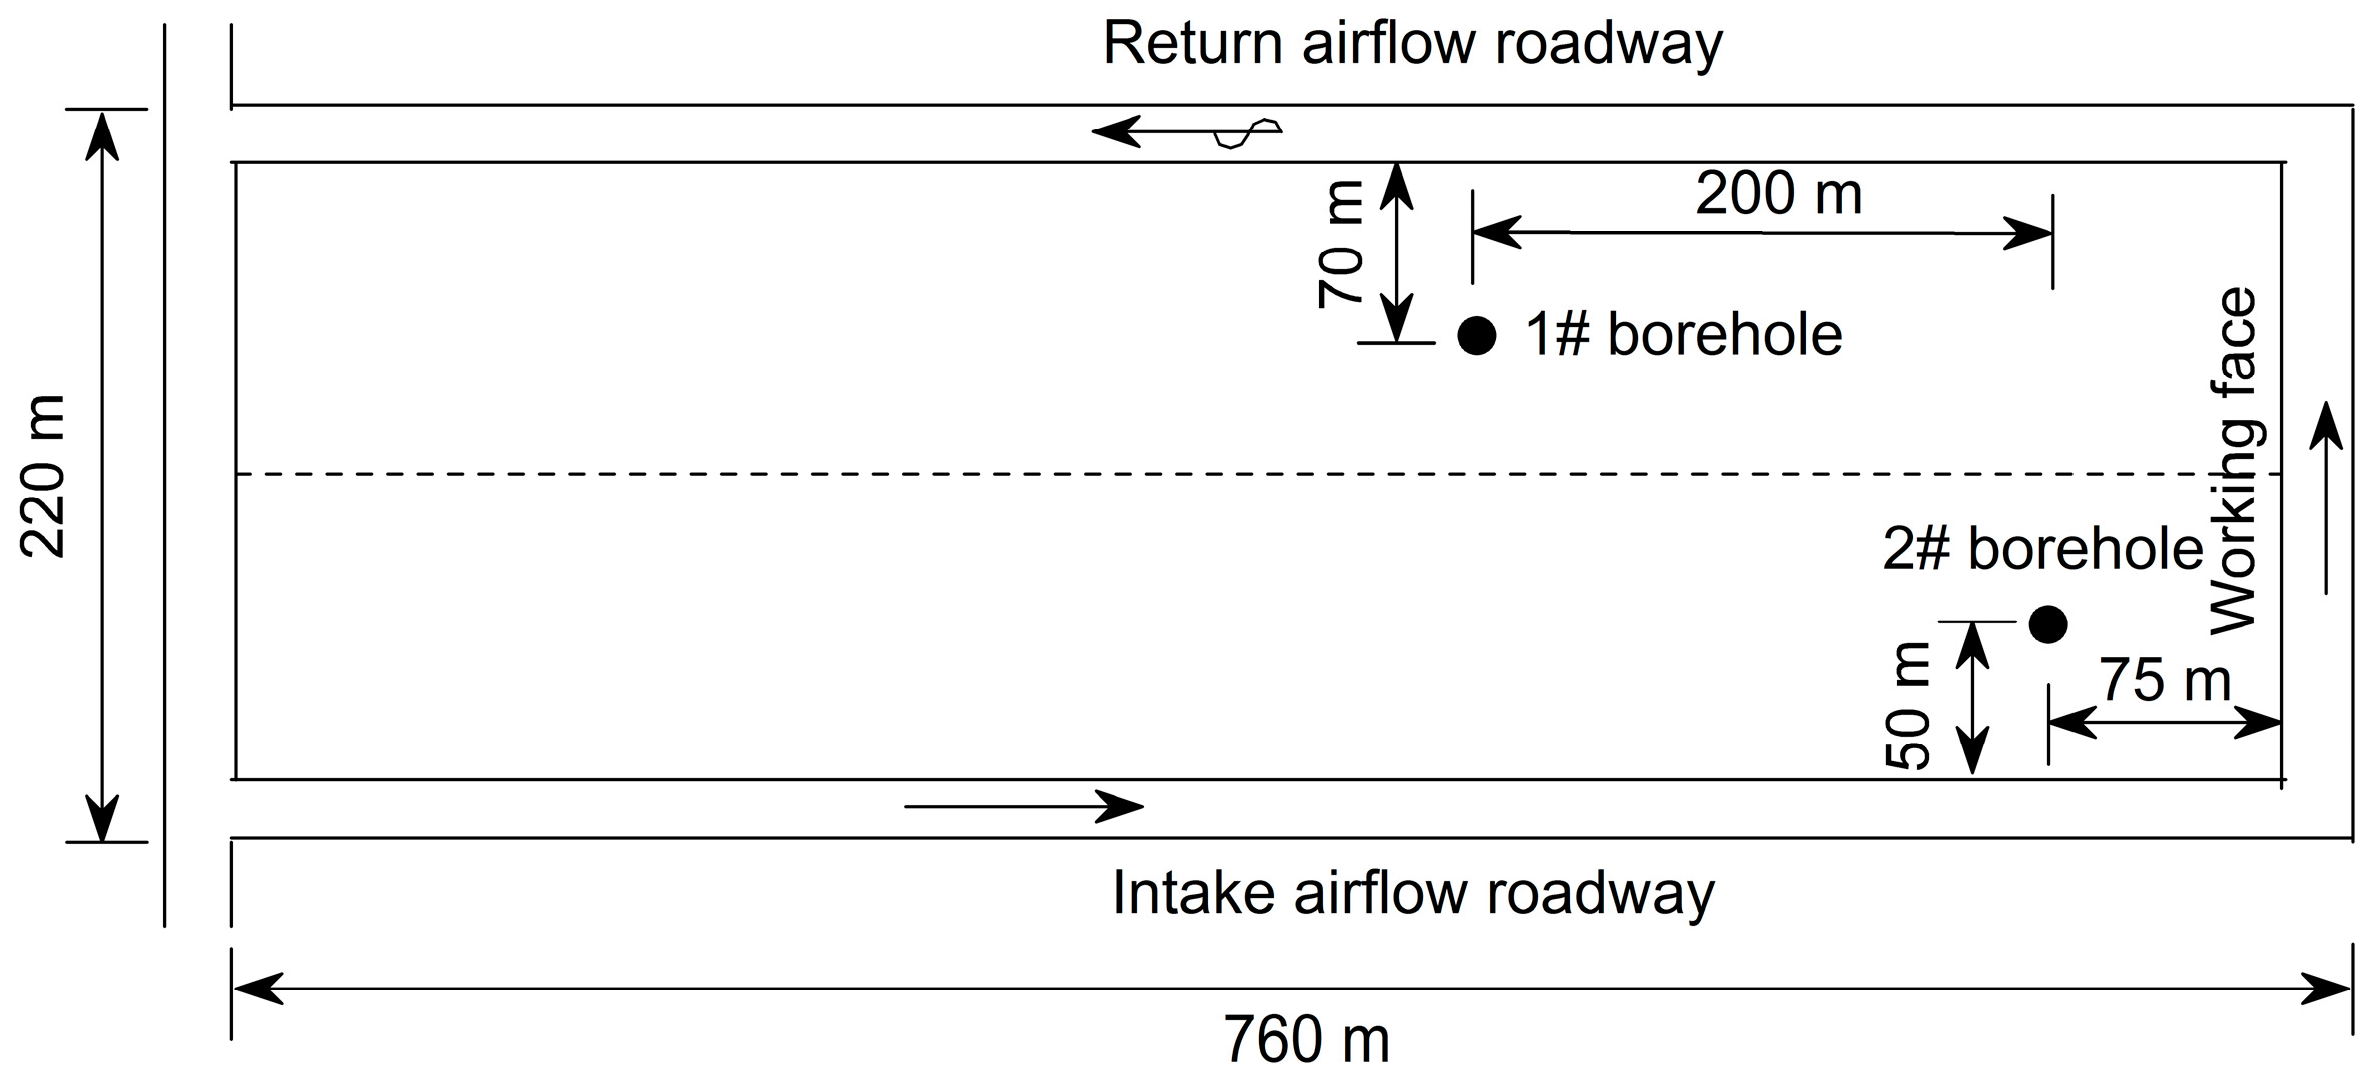
Figure 14.
Methane concentration and flow rate of boreholes after the workface advancing over the boreholes [33]. (a) Methane concentration; (b) Methane flow rate.
Figure 14.
Methane concentration and flow rate of boreholes after the workface advancing over the boreholes [33]. (a) Methane concentration; (b) Methane flow rate.


Table 1.
Relationship between plastic strain and strength of rock masses.
| Plastic Shear Strain | 0 | 0.01 | 0.05 | 0.1 | 0.5 | 1 | |
| Coal | Cohesion (MPa) | 1.5 | 1.3 | 1.1 | 0.8 | 0.7 | 0.7 |
| Friction angle (°) | 25.0 | 22.0 | 20.0 | 17.0 | 14.0 | 14.0 | |
| Tensile strength (MPa) | 1.5 | 1.3 | 1.1 | 0.8 | 0.7 | 0.7 | |
| Dilation angle (°) | 16.0 | 13.0 | 10.0 | 8.0 | 7.0 | 7.0 | |
| Roof and floor | Cohesion (MPa) | 3.8 | 2.6 | 2.2 | 1.9 | 1.8 | 1.8 |
| Friction angle (°) | 35.0 | 31.0 | 28.0 | 25.0 | 22.0 | 22.0 | |
| Tensile strength (MPa) | 4.0 | 2.6 | 2.2 | 1.9 | 1.8 | 1.8 | |
| Dilation angle (°) | 16.0 | 13.0 | 10.0 | 8.0 | 7.0 | 7.0 | |
Table 2.
Other required initial properties of rock masses.
| Lithology | Density (kg/m3) | Bulk Modulus (GPa) | Shear Modulus (GPa) |
|---|---|---|---|
| Coal | 1450 | 3.0 | 1.0 |
| Roof and floor | 2700 | 14.4 | 9.0 |
Table 3.
Model nodes and units of different coalbed incidence angles.
| Angle (°) | Node | Unit |
|---|---|---|
| 0 | 1,315,440 | 1,278,800 |
| 10 | 1,331,883 | 1,293,040 |
| 20 | 1,351,647 | 1,311,120 |
| 30 | 1,369,224 | 1,327,520 |
| 40 | 1,371,330 | 1,329,520 |
| 50 | 1,355,049 | 1,313,440 |
© 2017 by the authors. Licensee MDPI, Basel, Switzerland. This article is an open access article distributed under the terms and conditions of the Creative Commons Attribution (CC BY) license (http://creativecommons.org/licenses/by/4.0/).
Share and Cite
MDPI and ACS Style
Hu, S.; Zhang, A.; Feng, G.; Guan, S.; Guo, X.; Li, C.; Xu, G. Impact of Coalbed Incidence Angle on Methane Enrichment Zone in Longwall Gob. Minerals 2017, 7, 166. https://doi.org/10.3390/min7090166
AMA Style
Hu S, Zhang A, Feng G, Guan S, Guo X, Li C, Xu G. Impact of Coalbed Incidence Angle on Methane Enrichment Zone in Longwall Gob. Minerals. 2017; 7(9):166. https://doi.org/10.3390/min7090166
Chicago/Turabian StyleHu, Shengyong, Ao Zhang, Guorui Feng, Shuwen Guan, Xiangqian Guo, Chao Li, and Guang Xu. 2017. "Impact of Coalbed Incidence Angle on Methane Enrichment Zone in Longwall Gob" Minerals 7, no. 9: 166. https://doi.org/10.3390/min7090166
Note that from the first issue of 2016, this journal uses article numbers instead of page numbers. See further details here.