Article

Geochronology of Hydrothermal Processes Leading to the Formation of the Au–U Mineralization at the Rompas Prospect, Peräpohja Belt, Northern Finland: Application of Paired U–Pb Dating of Uraninite and Re–Os Dating of Molybdenite to the Identification of Multiple Hydrothermal Events in a Metamorphic Terrane

1
Geological Survey of Finland, FI-02151 Espoo, Finland
2
AIRIE Program, Colorado State University, Fort Collins, CO 80523-1482, USA
3
Centre for Earth Evolution and Dynamics (CEED), University of Oslo, 0315 Oslo, Norway
4
Mawson Oy—Finland, Ahjotie 7, 96320 Rovaniemi, Finland
*
Author to whom correspondence should be addressed.
Minerals 2017, 7(9), 171; https://doi.org/10.3390/min7090171
Submission received: 8 August 2017 / Revised: 9 September 2017 / Accepted: 11 September 2017 / Published: 15 September 2017
(This article belongs to the Special Issue Geochemistry and Mineralogy of Hydrothermal Metallic Mineral Deposits)

Abstract

:
The Peräpohja belt comprises a greenschist to amphibolite facies; multiply-folded supracrustal sequence of quartzites; mafic volcanics; carbonate rocks; black shales; mica schists and greywackes deposited from ca. 2.44 Ga to 1.92 Ga; during protracted rifting of the Archaean basement. Metamorphism and multiple folding of the basin fill occurred during the Svecofennian orogeny (1.92–1.80 Ga). The Rompas Au–U mineralization is hosted within deformed and metamorphosed calcsilicate veins in mafic volcanics. Textural evidence suggests that deposition and periods of uraninite re-mobilization were followed by localized hydrocarbon-bearing fluid flow which produced pyrobitumen crusts around grains of uraninite. Gold precipitated during the latest hydrothermal event at around 1.75 Ga. In situ U–Pb dating of uraninite by laser ablation inductively coupled mass spectroscopy (LA-ICP-MS), and Re–Os dating of molybdenite, indicate that primary hydrothermal uranium mineralization forms two age clusters; about 2.03–2.01 and 1.95–1.94 Ga. Resetting of the U–Pb system and precipitation of new generations of uraninite are associated with major deformation and metamorphic stages of the Svecofennian orogeny at 1.91–1.89 Ga, 1.85 Ga, and 1.80 Ga. Gold deposition was synchronous with the emplacement of the 1.75–1.78 Ga late/post-orogenic granitoids. The gold-producing hydrothermal event is also recorded by Re–Os dating of molybdenite from the gold-bearing Mg-metasomatized metasedimentary and metavolcanic units at the Palokas prospect; a few kilometres from Rompas. Results of this study confirm that some domains in the structure of uraninite may preserve the original crystallization age, despite an overprinting amphibolite facies metamorphic and other hydrothermal events. The study supports the utility of in situ U–Pb dating of uraninite and the ability of Re–Os dating to assist in sorting out different hydrothermal events in areas with complex tectonic; magmatic and metamorphic histories.

1. Introduction

Uraninite is theoretically an ideal mineral for U–Pb radiometric dating, as it incorporates very little or no structural lead at the time of crystallization and thus, the lead found in ancient uraninite consists of overwhelmingly radiogenic 207Pb, 206Pb, and 208Pb isotopes, the decay product of radioactive isotopes of uranium (235U and 238U) and thorium (232Th), respectively. However, radiogenic (and common) lead is incompatible in the structure of uraninite and easily mobilized during post-crystallization fluid/mineral interactions [1,2]. Alteration-recrystallization may also locally reorganize the uranium budget, and thus, uraninite may be subject to isotopic disturbance, resetting the radiometric clock in some domains of the uraninite crystals. This peculiarity of uraninite complicates or may even exclude direct determination of the crystallization age, but, on the other hand, also opens the opportunity to evaluate the timing of processes leading to modification of the primary mineralization. This latter is especially interesting in Precambrian terranes where uraninite-bearing ores frequently show mineralogical–textural evidences for overprinting by metamorphism, deformation and/or fluid exchange [3,4,5].
Our previous studies on the Rompas Au–U deposit [6] in the Paleoproterozoic Peräpohja belt, northern Finland (Figure 1) showed that accumulation of gold was superimposed on a pre-existing uraninite-bearing hydrothermal vein system during the late/post-orogenic stages of the Svecofennian orogeny (1.92–1.80 Ga). In this paper, we investigate how major stages in the Svecofennian tectonic evolution in the Peräpohja belt are reflected in the U–Pb ages of uraninite from the polygenetic Au–U deposit at Rompas. In order to constrain U–Pb ages obtained from different generations of uraninite, we also performed Re–Os dating on molybdenite occurring as an accessory mineral related to hydrothermal mineralization in the Rompas area and the adjacent Palokas system (Figure 2). Re–Os dating of molybdenite is a particularly robust tool for dating hydrothermal processes because (1) compared to other sulphide minerals, molybdenite is unusually rich in Re, (2) the Os content of molybdenite on crystallization is extremely low, and (3) the Re–Os clock in molybdenite remains intact, even when the mineral is deformed or subjected to granulite facies metamorphic conditions [7,8,9,10]. For the geological interpretation of our U–Pb and Re–Os age data, we also used U–Pb ages for rock forming zircon and Nd–Sm ages for rock forming garnet published in [11], and considered the recently established model for the tectonic evolution of the Peräpohja belt [12,13].
Due to the sensitivity of uraninite to lead and uranium loss or uranium gain during post-crystallization fluid/mineral interactions, U–Pb dating of bulk samples usually gives discordant and mixed ages. However, results of numerous micron-scale studies on crystal- and isotope-chemistry of altered uraninite indicate that the U(–Th)–Pb radiometric clock may remain intact in some domains of the crystal structure, whereas other domains are reset [1,2,14]. Thus, in situ analytical methods with high spatial resolution are potentially able to distinguish unaltered or less altered domains from altered and/or reset domains in uraninite crystals. Determination of the chemical composition of uraninite by electron microprobe analyses and calculation of “chemical U–Th–Pb ages” from the data obtained from each approx. 5 μm3 volume domain assumes that all measured lead in uraninite is radiogenic lead and all of the data are “quasi concordant” [15]. Another analytical approach with higher precision is the application of ion microprobe (secondary ion mass spectroscopy—SIMS) or laser ablation inductively coupled mass spectroscopy (LA-ICP-MS) for measuring isotopic ratios of U and Pb extracted from a few tens of μm3 sputtered or ablated volume of uraninite. The latter method permits evaluation of lead or uranium loss/gain, consideration of the possible presence of common lead, and calculation of more precise ages, depending on the concordance of U–Pb isotope ratios. All of the in situ analytical techniques have the advantage of direct dating from a polished thin section of ore/rock specimen, thereby taking the textural-paragenetic properties of uraninite into consideration in the interpretation of the U–Pb age data. In this study, LA-ICP-MS was used, and we compare the results of U–Pb dating by LA-ICP-MS with U–Th–Pb chemical ages calculated from electron microprobe analyses of uraninite grains [6] in the same set of thin sections.

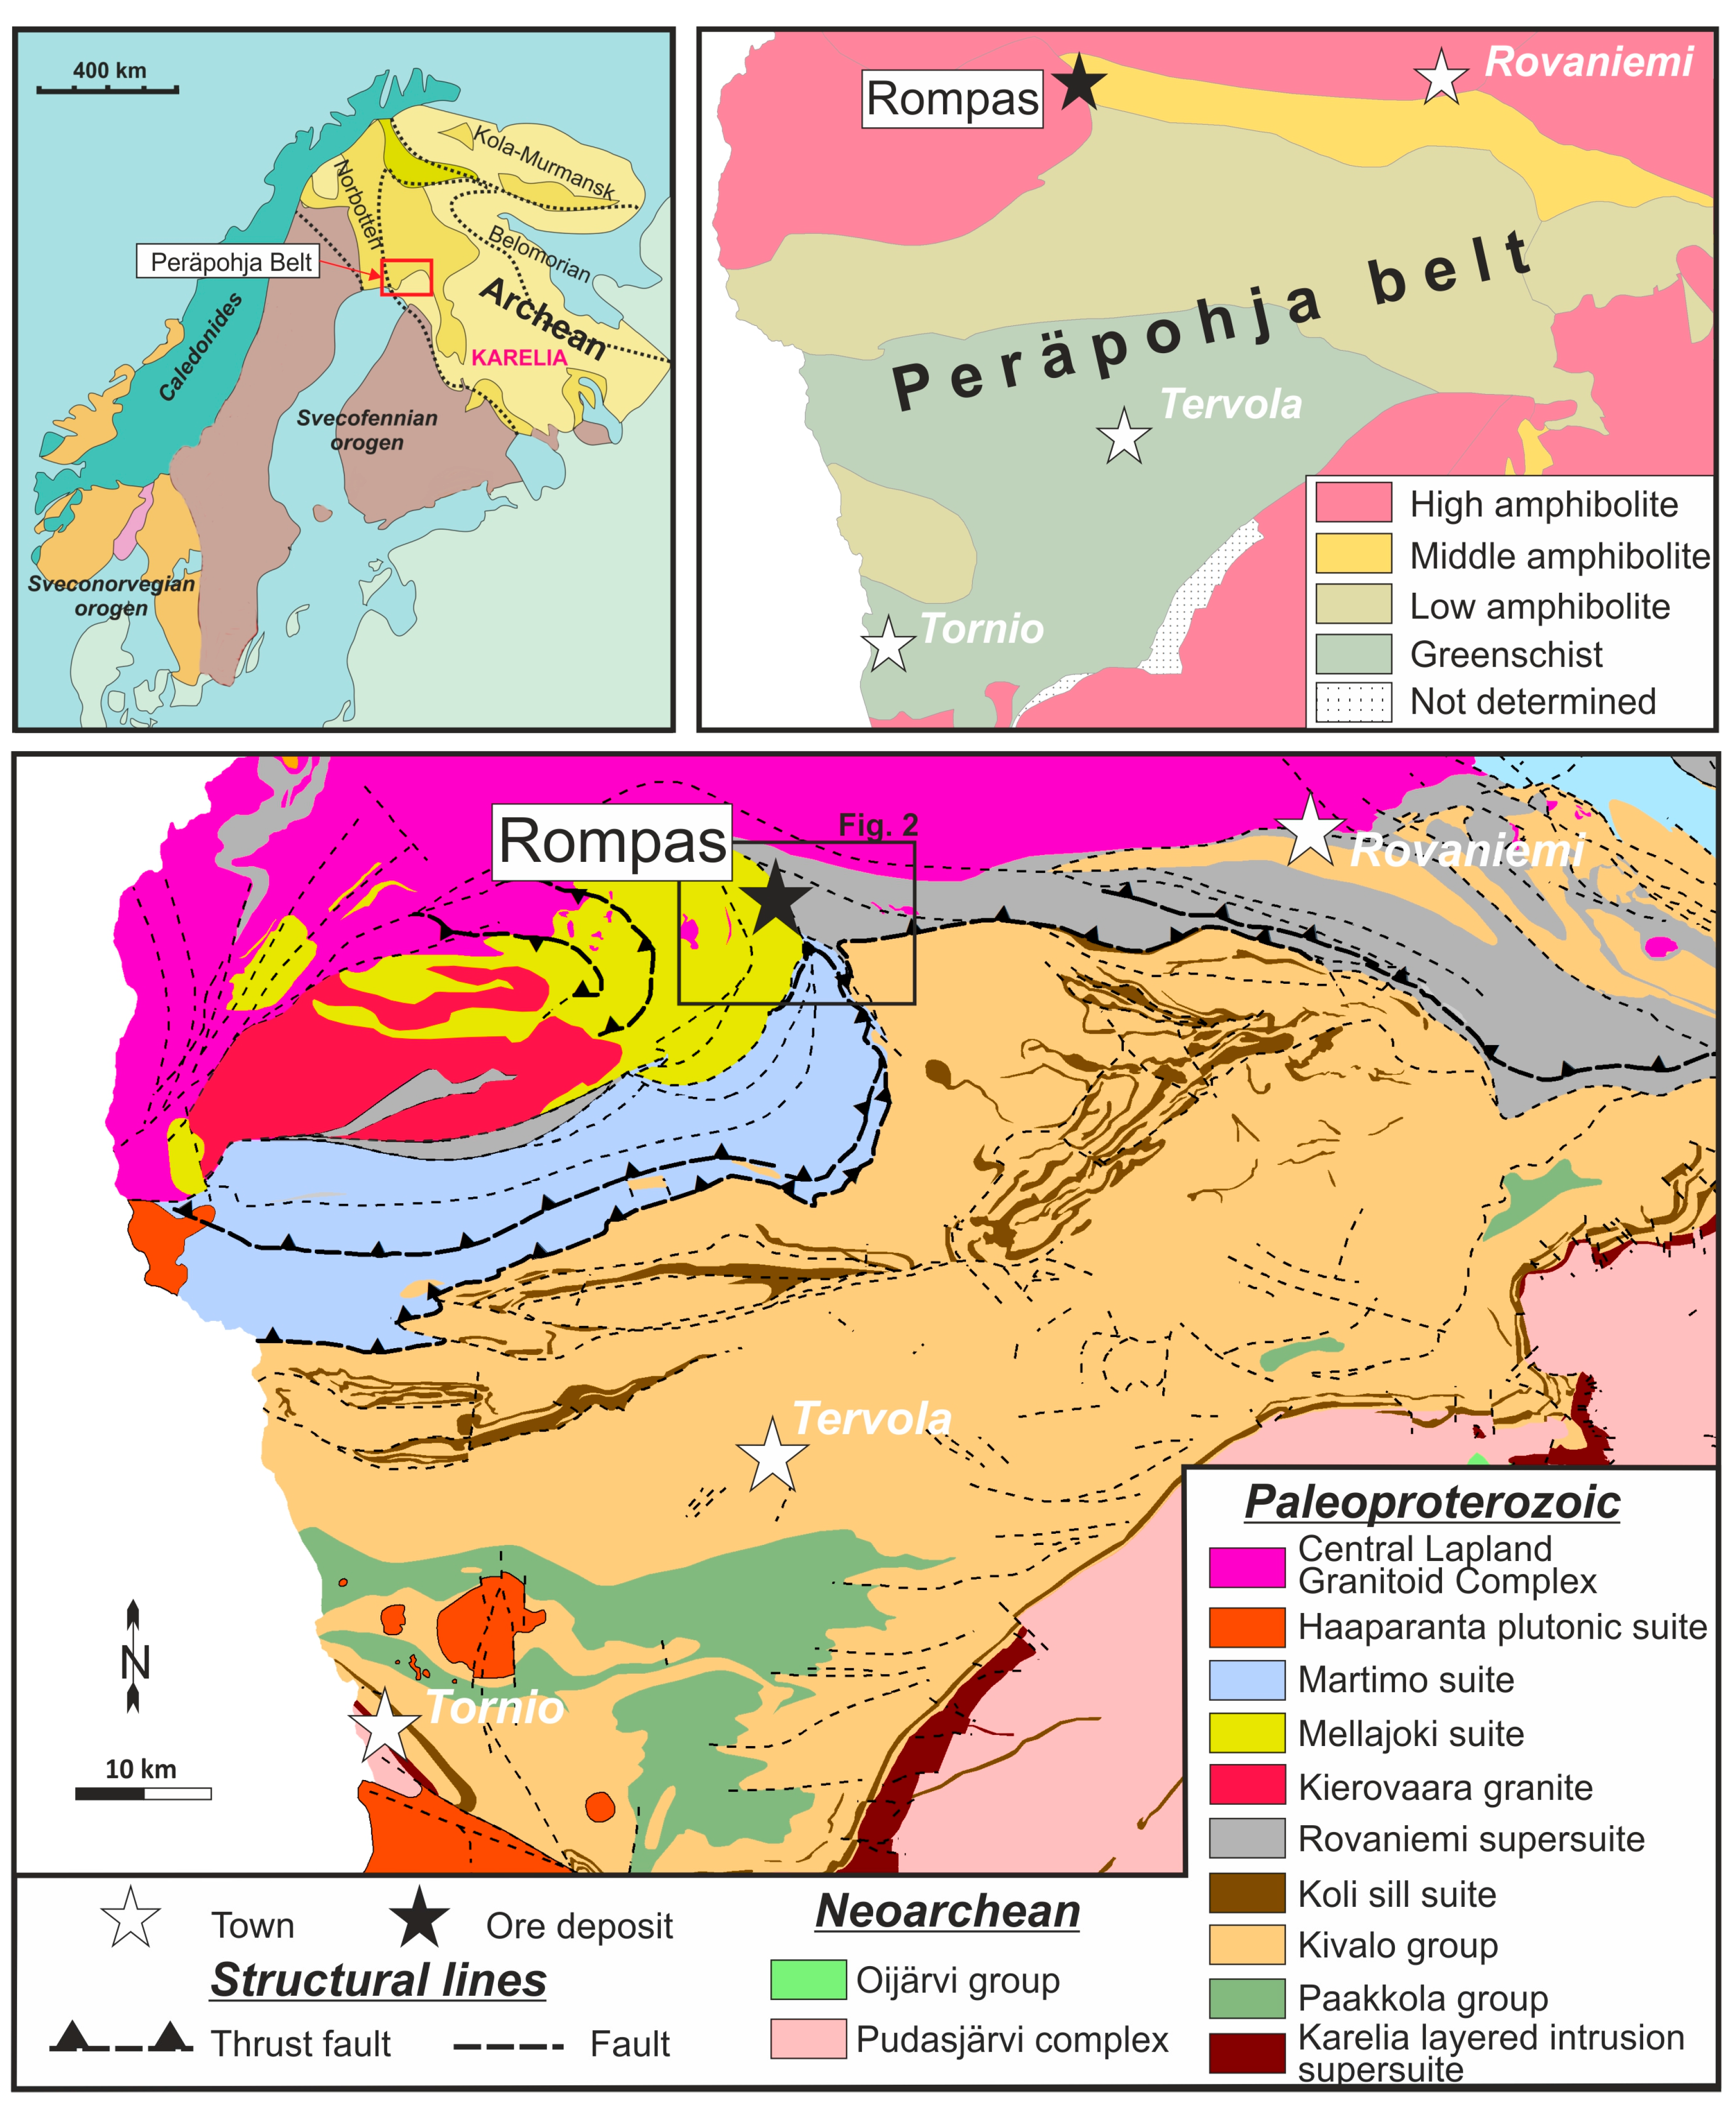
2. Regional Geology and Tectonic Evolution of the Peräpohja Belt

The Peräpohja belt is a remnant of a Paleoproterozoic basin formed by the repeated rifting of the Archaean Karelian basement of the Fennoscandian shield between 2.44 and 1.92 Ga, and was subsequently deformed and metamorphosed during the 1.92–1.80 Ga Svecofennian orogeny (Figure 1). In the present setting, the Peräpohja belt is bound by the Archaean Pudasjärvi Complex on the Southeast, the Central Lapland Granitoid Complex on the north, and the Pajala shear zone on the west. The latter structure is considered as the multiply re-activated manifestation of the boundary zone between the Karelian and Norrbotten Archean basement domains [12].
The formation of the Peräpohja belt commenced by the rifting-related emplacement of sill-like mafic–ultramafic layered intrusions (Karelian layered intrusion supersuite; Figure 1) at around 2.44 Ga [16,17]. The sedimentary and volcanic sequences forming the basin fill were deposited both in continental and marine environments and are divided into two major groups, the Kivalo and Paakkola Groups [18,19]. The 3–4 km thick Kivalo group includes all the supracrustal units which were deposited between 2.4 and 2.06 Ga. The lowermost sedimentary units of the Kivalo group were deposited on a low gradient platform and consist of conglomerates, orthoquartzites, arkosites and shallow water stromatolitic carbonates preserving the Jatuli–Lomagundi carbon isotope “excursion” [20]. These rocks are intercalated with mafic lava flows and tuffs and intruded by 2.22 Ga (gabbro-wehrlite association) and 2.14 Ga mafic sills and dikes (Koli sill suite) [21,22]. The 1–2 km thick Paakkola group consists of pillow basalts and felsic dikes (2.05 Ga) [22], mafic and felsic tuffs, graphitic-sulphidic mica schist and black shales. The formations included in the Martimo and Rovaniemi suites/supersuites are part of the Paakkola group and their distinction on Figure 1 is according to [12] who considered these units as lithodemic in nature. Results of U–Pb dating of detrital zircons suggests that the maximum age of the youngest mica schist rocks in the Martimo suite is 1.91 Ga (sample A2167 on Figure 2) [11]. Cross cutting relationships with the plutonic rocks of the Haaparanta suite (Figure 1) indicate a 1.88 Ga minimum age for these rocks. The Mellajoki suite consisting of quartzites, mica schists, and quartz–feldspar gneisses, is also lithodemic and correlation of its formations with other Peräpohja belt units is not yet fully resolved [19]. The formations of the Mellajoki Suite are intruded by the ~2.0 Ga Kierovaara granite (Figure 1).
The Svecofennian tectonic evolution of the Peräpohja belt has recently been summarized in [12,13], based on detailed structural mapping in selected areas and revision of available geochronological data for rock-forming minerals. Accordingly, the onset of the first collision stages (e.g., collision between Karelia and Kola, as well as between Norrbotten and Karelia; Figure 1) is probably reflected by a weakly constrained metamorphic event in the Rovaniemi Supersuite between ca. 1.92 and 1.90 Ga and it is also manifested by east-vergent thrusting (D1), and recumbent folding of the Martimo and Mellajoki suite units in the Peräpohja belt. The D2 deformation developed due to the northerly oriented push by the Archaean Karelian domain, and is characterized by development of E–W oriented, tight to open folds and faulting, as well as the emplacement of 1.88 Ga Haaparanta suite plutons. Reference [13] also suggested the occurrence of an additional deformation event (D3, NE-directed thrusting–shortening) prior to the establishment of the peak metamorphic conditions at 1.86–1.85 Ga. This latter metamorphic event is documented not only in the Peräpohja belt, but also in the areas west to the Pajala shear zone [23]. The D4 NW–SE shortening–folding and superimposed extension between 1.83 and 1.80 Ga was recognized in the NE part of the Peräpohja belt, and also appears to affect the 1.85 Ga migmatites in the southern boundary zone of the Central Lapland Granitoid Complex. Emplacement of syn- to late-orogenic granites of the Central Lapland Granite Complex took place between 1.84 and 1.80 Ga (Figure 1) [24]. The last deformation event (D5, from WSW–ENE to E–W oriented crustal shortening) affected the entire Peräpohja belt and it is associated with the widespread 1.79–1.77 Ga tectonothermal event in the northern part of the Fennoscandian shield, and probably indicates the final collision of the Norrbotten and other Svecofennian microcontinents to the south with the Karelian domain and also the final collision of Amazonia and Norrbotten along the western boundary of Norrbotten (Figure 1). Near the Rompas property, this event also generated emplacement of tourmaline granite intrusions and dikes [11,25].
The metamorphic grade of the Peräpohja Schist Belt ranges from middle to upper greenschist facies in the south to amphibolite facies in the north (Figure 1). Occurrences of migmatites and leucogranitic intrusions, as well as undeformed tourmaline-bearing pegmatitic granites characterize the southern boundary zone of the Central Lapland Granite Complex (Figure 1 and Figure 2) [24,26].

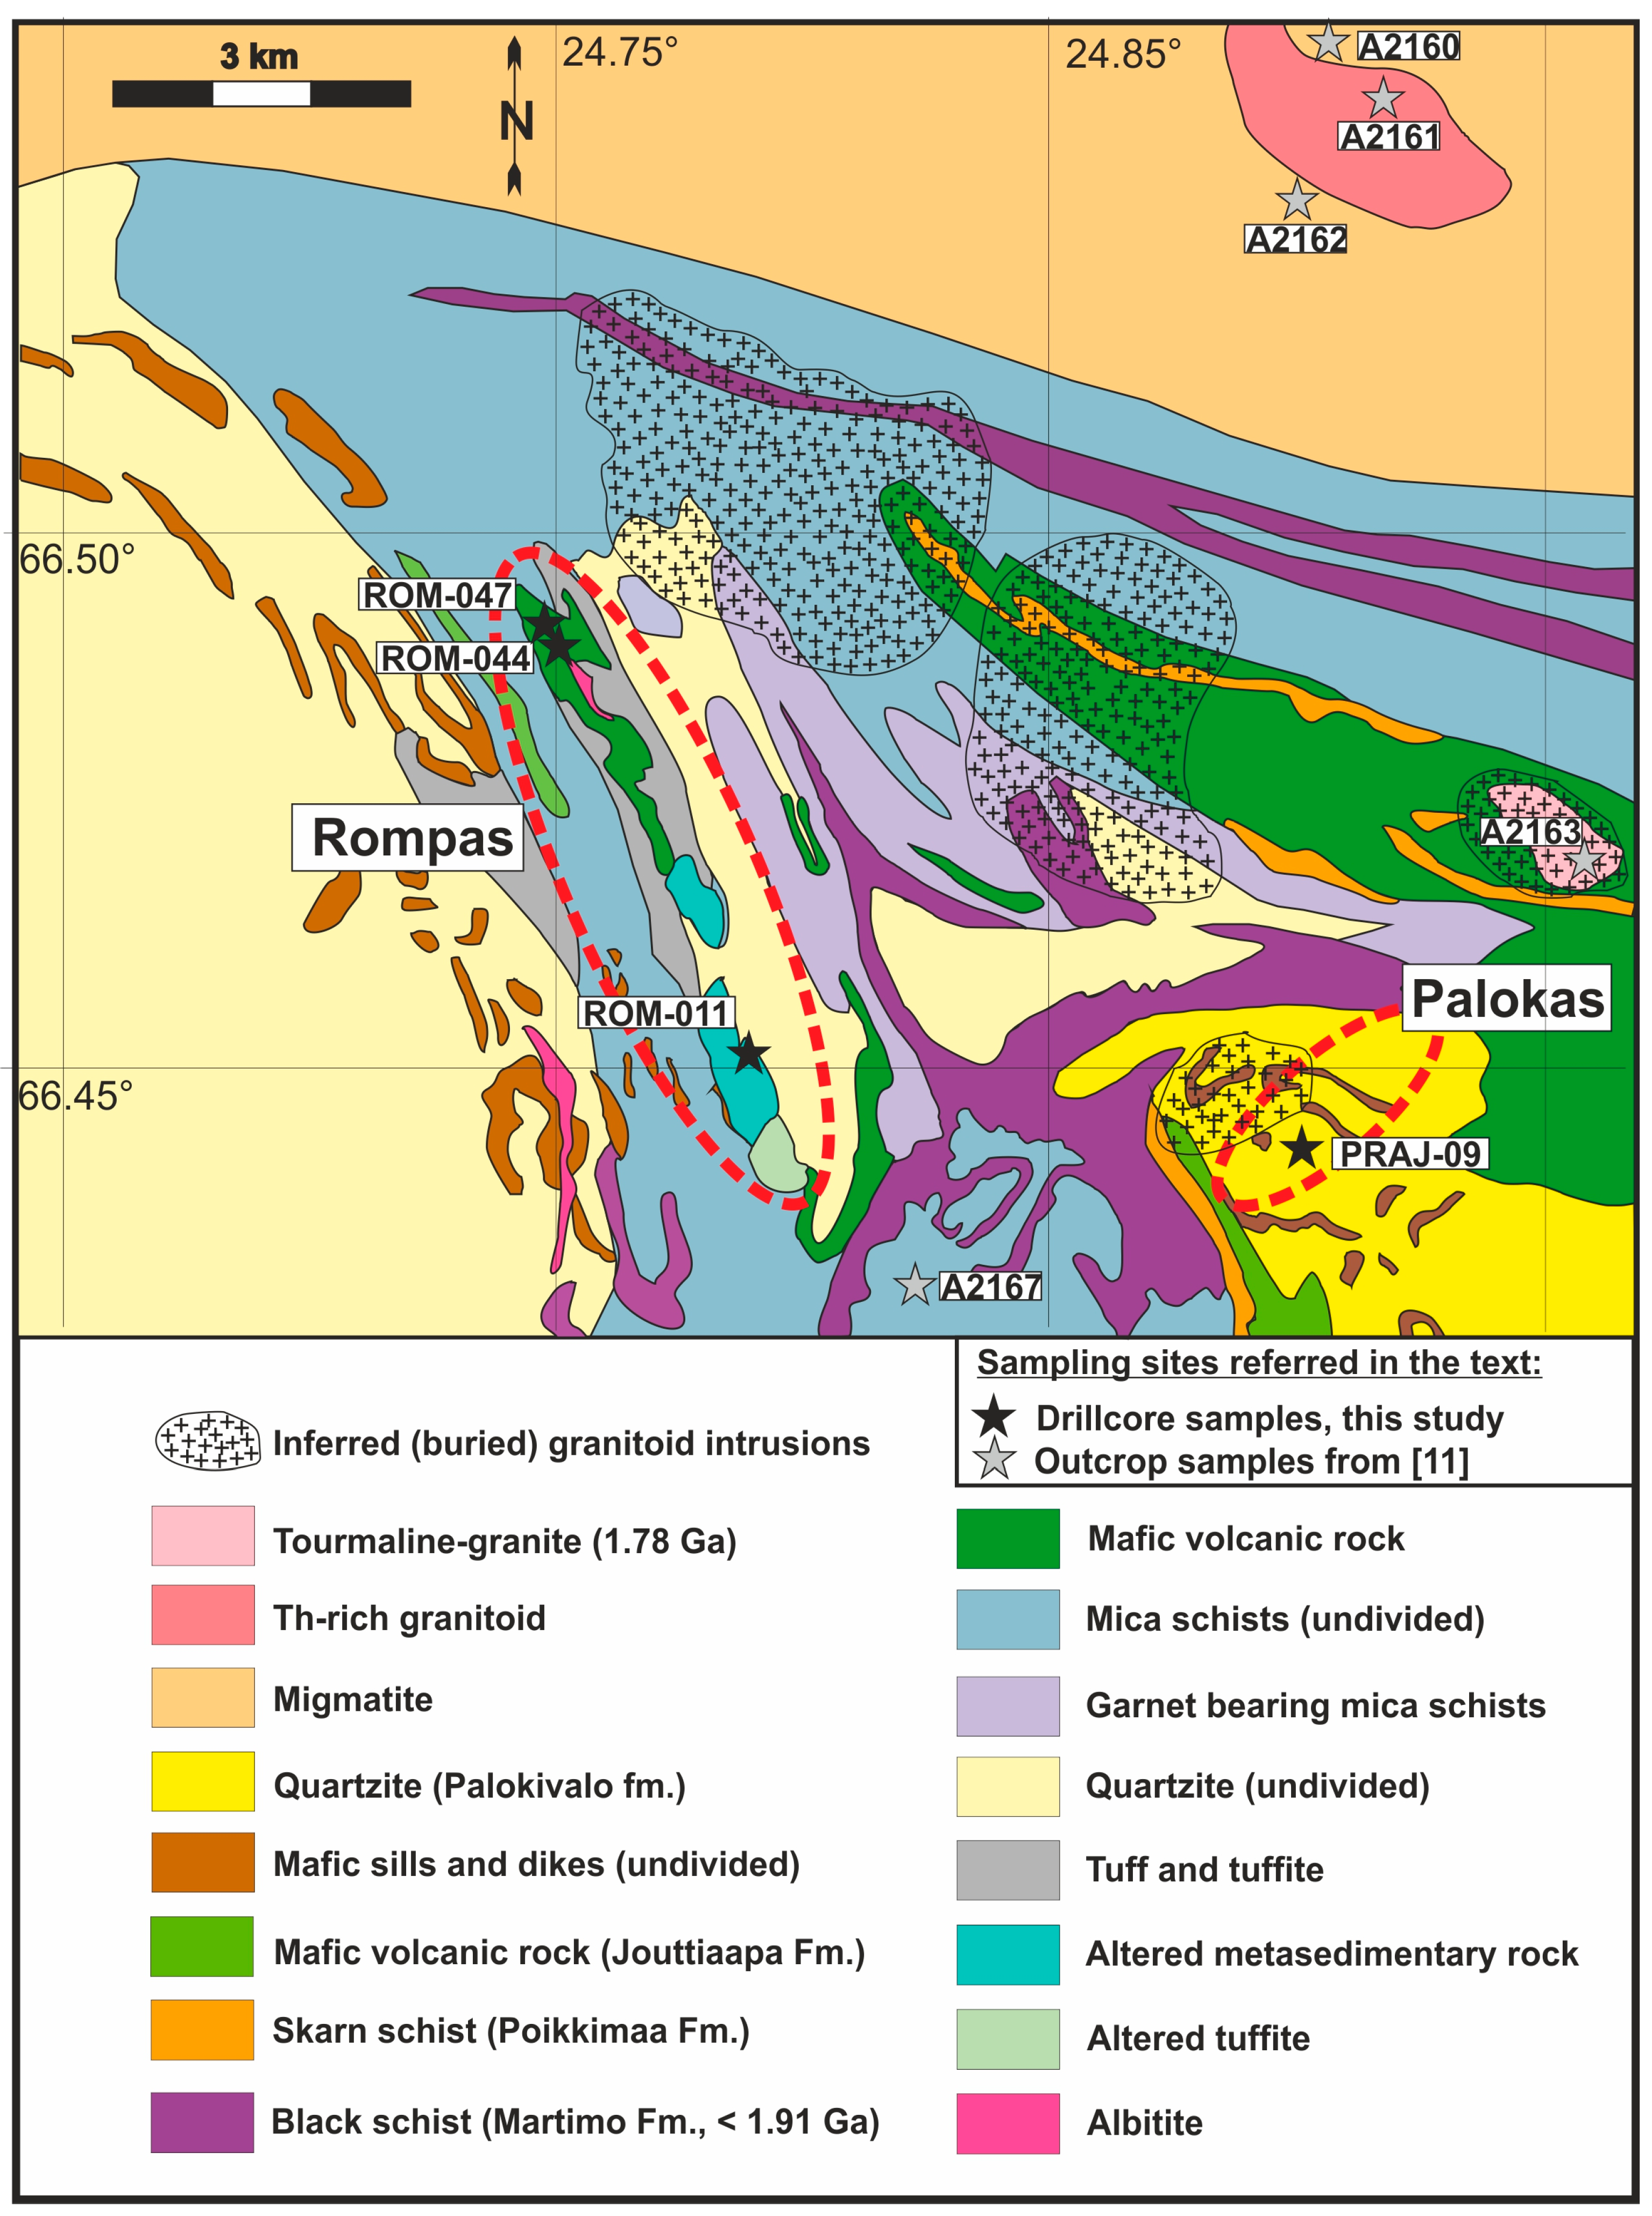
3. Local Geology and Hydrothermal Mineralization at the Rompas and Palokas Prospects

The Rompas and Palokas prospects are in the northern part of the Peräpohja belt, a few kilometers south of the faulted boundary of the migmatized zone of the Central Lapland Granitoid Complex and the non-migmatitic units of the Perapohjä belt (Figure 1 and Figure 2). The occurrence of free visible gold around the Rompas property was discovered by the Areva NC in 2008. Since 2010, Mawson Resources Ltd. has also extended the exploration for gold into the Palokas area east of Rompas (Figure 2) and some other adjacent areas, based on the occurrences of gold and pathfinder element (e.g., Bi, Te, As) anomalies in samples from outcrops and till. Results of recent drilling in the Palokas area have also proven that the bedrock units under the till cover contain hydrothermally altered zones with significant gold enrichments [27].
The Rompas prospect area is dominated by an approximately 6 km long, few tens of meters high, northwest trending ridge consisting of discontinuous outcrops of amphibolite facies metabasalt, dolomite-bearing metasedimentary units, and strongly altered carbonate–albite rocks (Figure 2) [28]. A till-covered, presumably tectonic contact between the metabasalt and a sequence of black schist and mafic metavolcanic rocks within arkosic and aluminous metasediments (all presented as an undivided mica schist unit on Figure 2) forms the western boundary of the mineralization. East of the mineralized metabasalt, unmineralized quartzite and dolomitic rocks crops out. The Au–U mineralization is hosted by tightly folded, boudinaged calcsilicate (diopside–horblende–cummingtonite–anthophyllite–tremolite–actinolite–quartz–carbonate) veins with biotite- and albite-rich alteration selvages in mafic volcanic rocks—similar veins in the metasedimentary units bounding the metavolcanic rocks are barren. Distribution of gold in the up to 30 cm thick veins is very irregular, and is characterized by highly localized occurrences of very high grade (>10,000 g/t Au) pockets. The highest-grade pods are located in sub-linear dolomite bodies that plunge steeply. Distribution of uranium in the calcsilicate veins is more regular, and most of the uranium-bearing zones do not contain elevated concentrations of gold. According to the results of our previous studies [6], the most common chemical ages for uraninite suggest a 1.95–1.90 Ga minimum age for the deposition of the primary hydrothermal uranium mineralization. The original mineral assemblage of the primary uranium-bearing vein consists of uraninite, dolomite, quartz, albite, with minor amounts of pyrrhotite, pyrite, pentlandite, chalcopyrite, galena, molybdenite, and titanite. Ductile deformation and re-crystallisation of the uraninite-bearing quartz–dolomite veins into calcsilicate mineral assemblages was followed by brittle fracturing and a hydrocarbon-bearing fluid flow event with radiolytic polymerization of hydrocarbons around grains of uraninite. Native gold, together with highly radiogenic galena (up to 3423 and 1992 206Pb/204Pb and 207Pb/204Pb, respectively), altaite (up to 1116 and 283 206Pb/204Pb and 207Pb/204Pb, respectively), Pb-bearing maldonite (up to 3339 and 489 206Pb/204Pb and 207Pb/204Pb, respectively), as well as hunchunite, nickeline with rare cobaltite, pyrite, pyrrhotite, chalcopyrite, molybdenite, and Bi-telluride minerals, precipitated during a subsequent hydrothermal event in the fractures of uraninite and in the cracks and on the surfaces of uraninite–pyrobitumen nodules (Pb isotope ratios are from [6]). Re-mobilization and re-deposition of uranium by these late hydrothermal events produced secondary uraninite grains with chemical ages between 1.85 and 1.65 Ga, whereas calculated model ages for radiogenic lead-bearing minerals associated with native gold indicate 1.70–1.75 Ga for deposition of gold. Mean random reflectance data for pyrobitumen suggest a 270–340 °C maximum temperature of gold deposition. Results of multiple sulphur isotope analyses of organic material, pyrite- and acid-volatile-bound sulphur also discriminated fluids related to the gold mineralizing event in comparison to the gold-absent hydrothermal mineral assemblages.
The gold mineralization at the Palokas prospect has a disseminated-replacement, subordinately stockwork style with no obvious associated calcsilicate veining [27]. Another significant difference comparing to Rompas is that uranium is not as enriched in the mineralized zones, and occurs as anomalies with 10–100 ppm concentrations only. The gold mineralization is hosted by Ca-depleted, Mg- and Fe-rich, anthophyllite and cordierite-bearing, tourmalinized and sulphidized bands up to several metres thick within albitized calcsilicate rocks and amphibolite [25]. Locally, chlorite–talc alteration and quartz–sulphide–tourmaline veining is also present in the Fe–Mg-metasomatized zones. Pyrrhotite is the most abundant sulphide in the mineralized bands. Other ore minerals include cobaltian pentlandite, galena, chalcopyrite, molybdenite, Se-rich tetradymite, native bismuth, and other Bi–Te phases. These accessories, together with native gold, appear to be relatively late in the mineralization, as they occur in fractures of silicate minerals.
Current exploration results [27,29] indicate that the Palokas style gold mineralization also occurs in several other zones between the Rompas and Palokas properties, and further to the northwest and east of Palokas. These areas are marked by gold, bismuth, and tellurium anomalies, which appear to be spatially related to outcropping tourmaline-bearing granitoids and locations of buried felsic intrusions inferred from the results of geophysical surveying (Figure 2). The identical range of boron isotope data for tourmaline from the 1.78 Ga granites (from −4‰ to 0‰, δ11B) and tourmaline from the metasomatized rocks at Palokas [25] also suggests that there is not only spatial, but also genetic relationships between the post-orogenic granitoids (1.76–1.79 Ga, samples A2160 to A20163 on Figure 2) [11] and accumulation of gold in the area. This is also indicated by the lead isotope model age of galena and altaite associated with the late fracture-filling native gold at Rompas [6]. The range of boron isotope values (e.g., δ11B data between −2‰ and +0.5‰; Molnár, unpublished data) for the occasionally occurring tourmaline at Rompas also appear to point towards to the common origin of gold mineralization in the various parts of the Rompas–Palokas area.

4. Materials and Methods
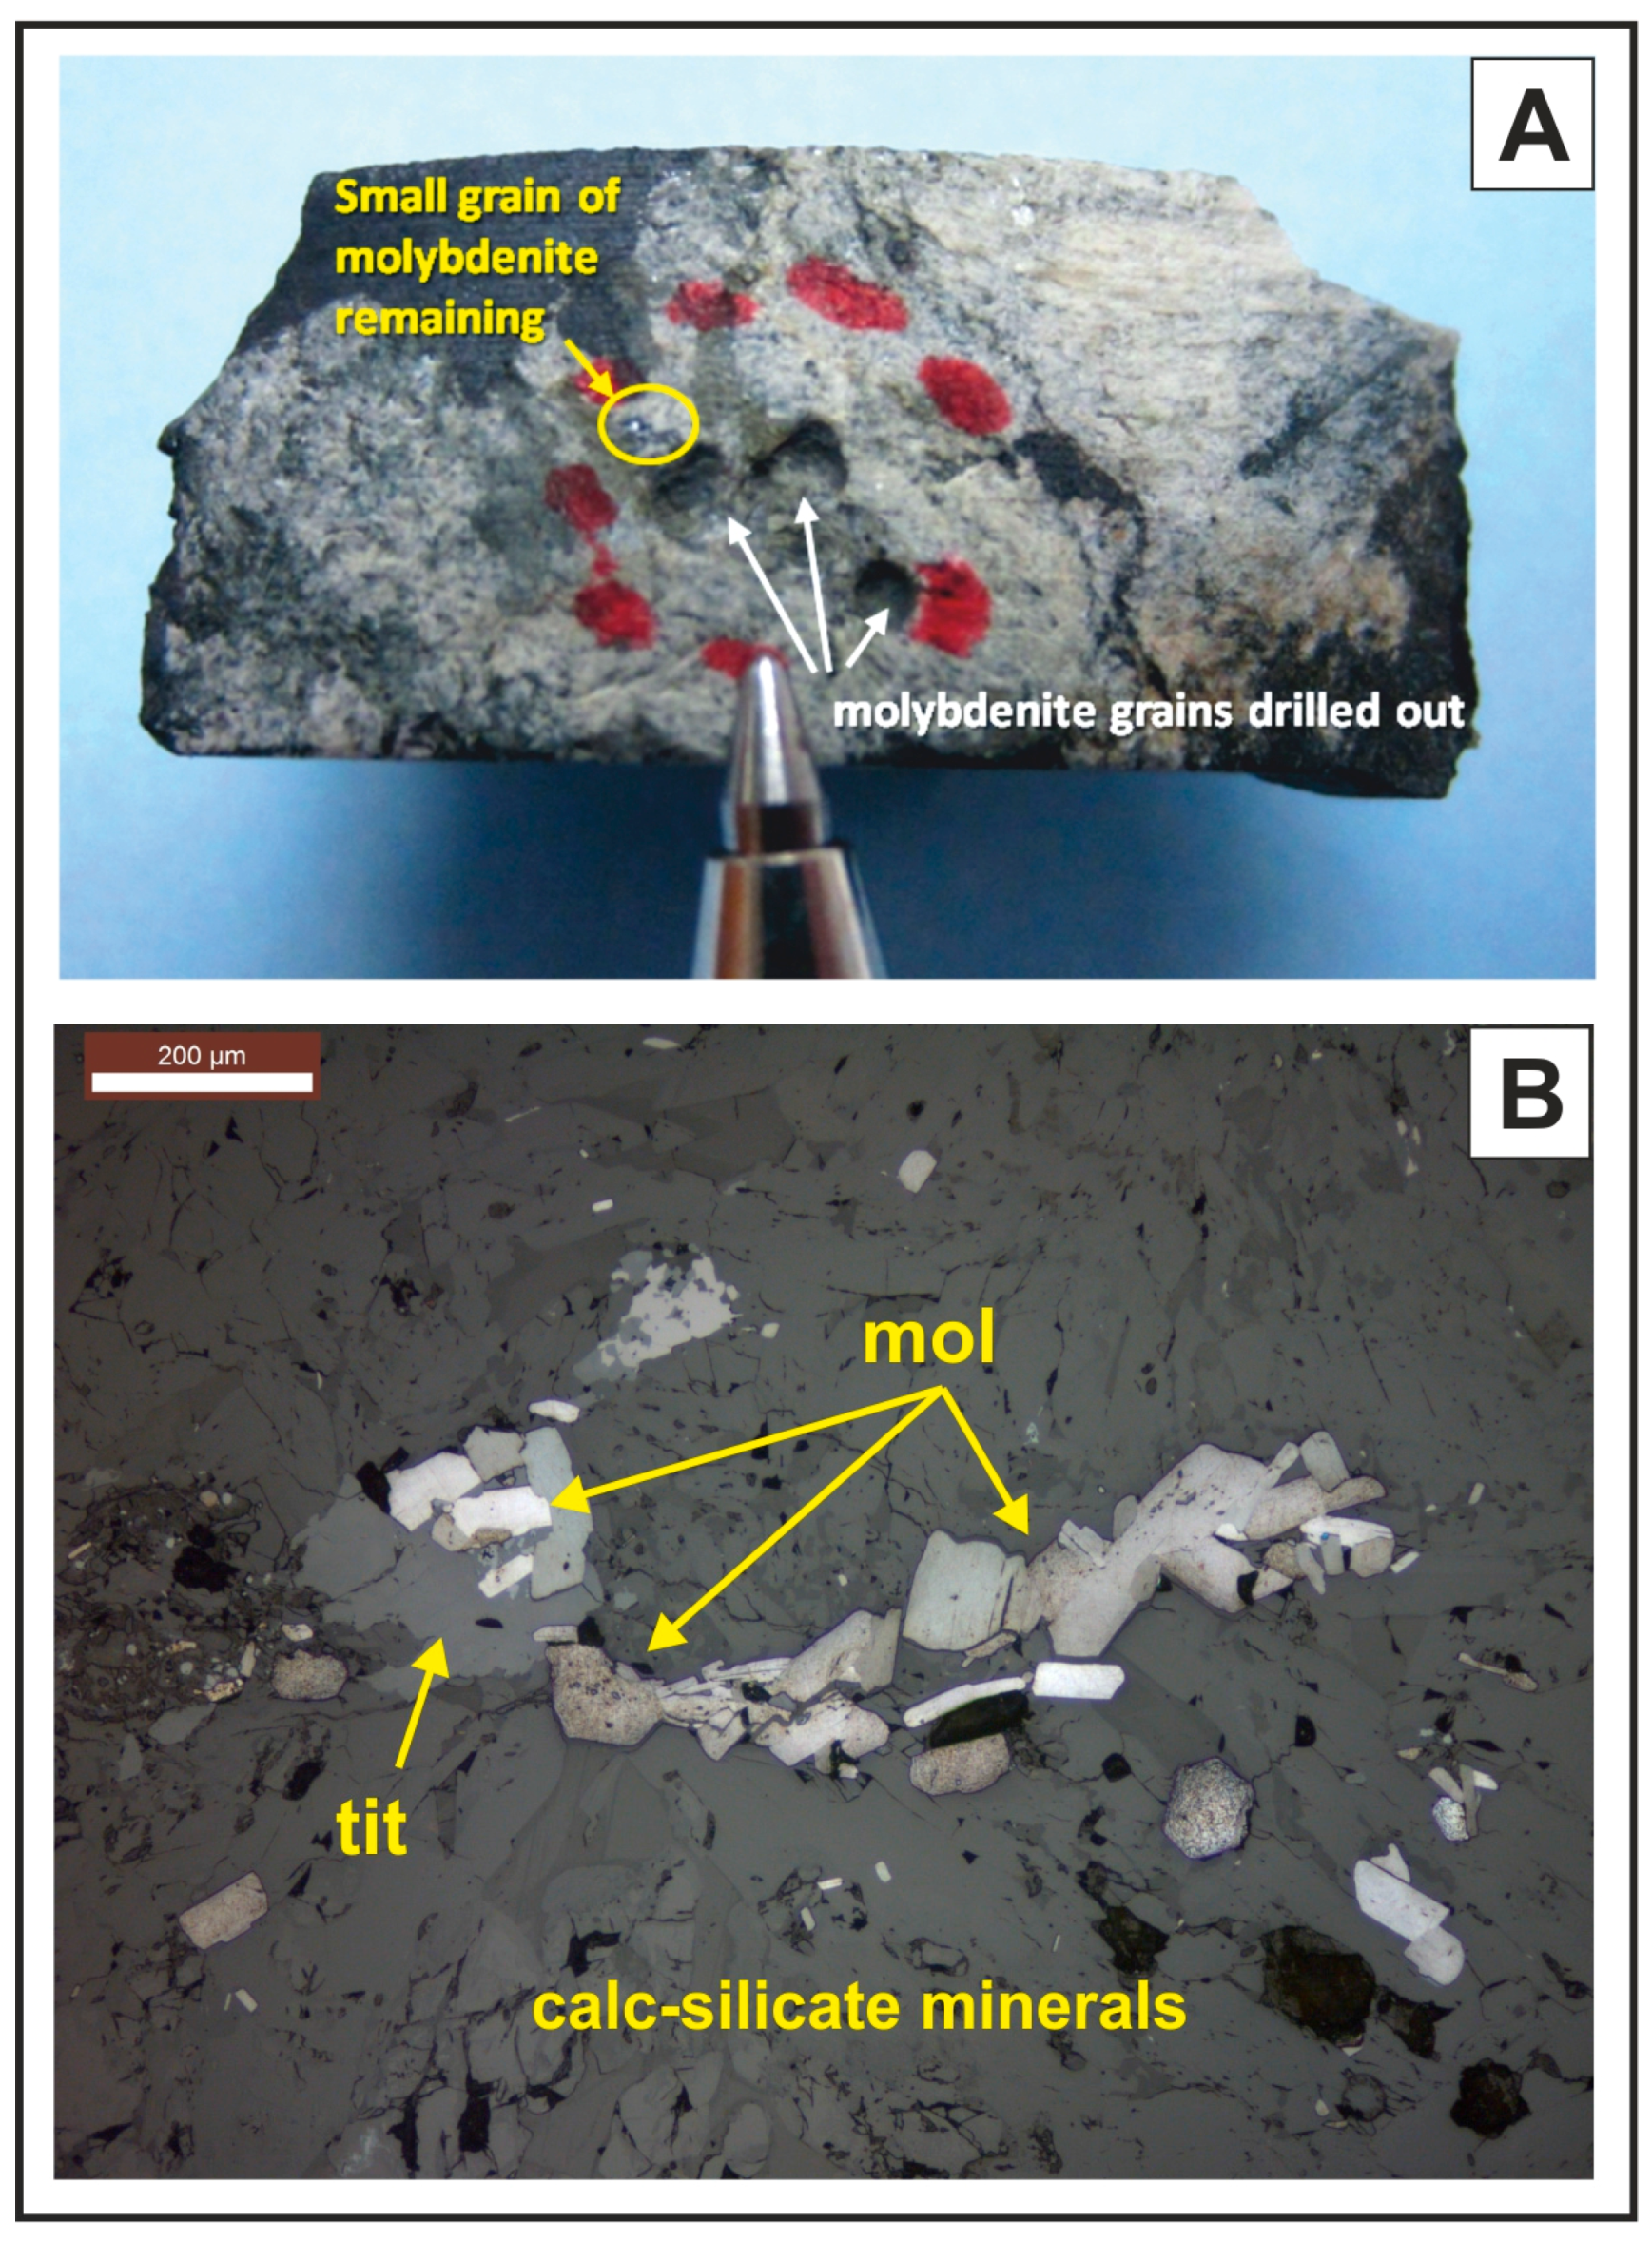
4.1. Sampling

For in situ U–Pb dating by LA-ICP-MS method, five uraninite-bearing calcsilicate vein samples were selected from the Rompas area. Three samples from the ROM-0011 drill hole (#24041365, 7.65–7.70 m; #24041367, 12.30–12.57 m; #24041374, 115.0–115.06 m), as well as one sample (#104793) from an outcrop next to the site of the ROM 0047 drill hole. All samples represent uraninite from zones with high grade gold mineralization. One sample was selected from a gold-barren intercept in the ROM-00044 drill hole (#23041346, 10.97–11.20 m). Two molybdenite-bearing samples from gold-absent calcsilicate veins intercepted in the ROM-0044 drill hole (#23041346, 10.97–11.20 m and #23041251, 24.0–24.15 m) at Rompas, and one molybdenite-bearing sample from the PRAJ-0009 (#239295, 6.96–7.05 m; Figure 2) at Palokas were collected for Re–Os dating.

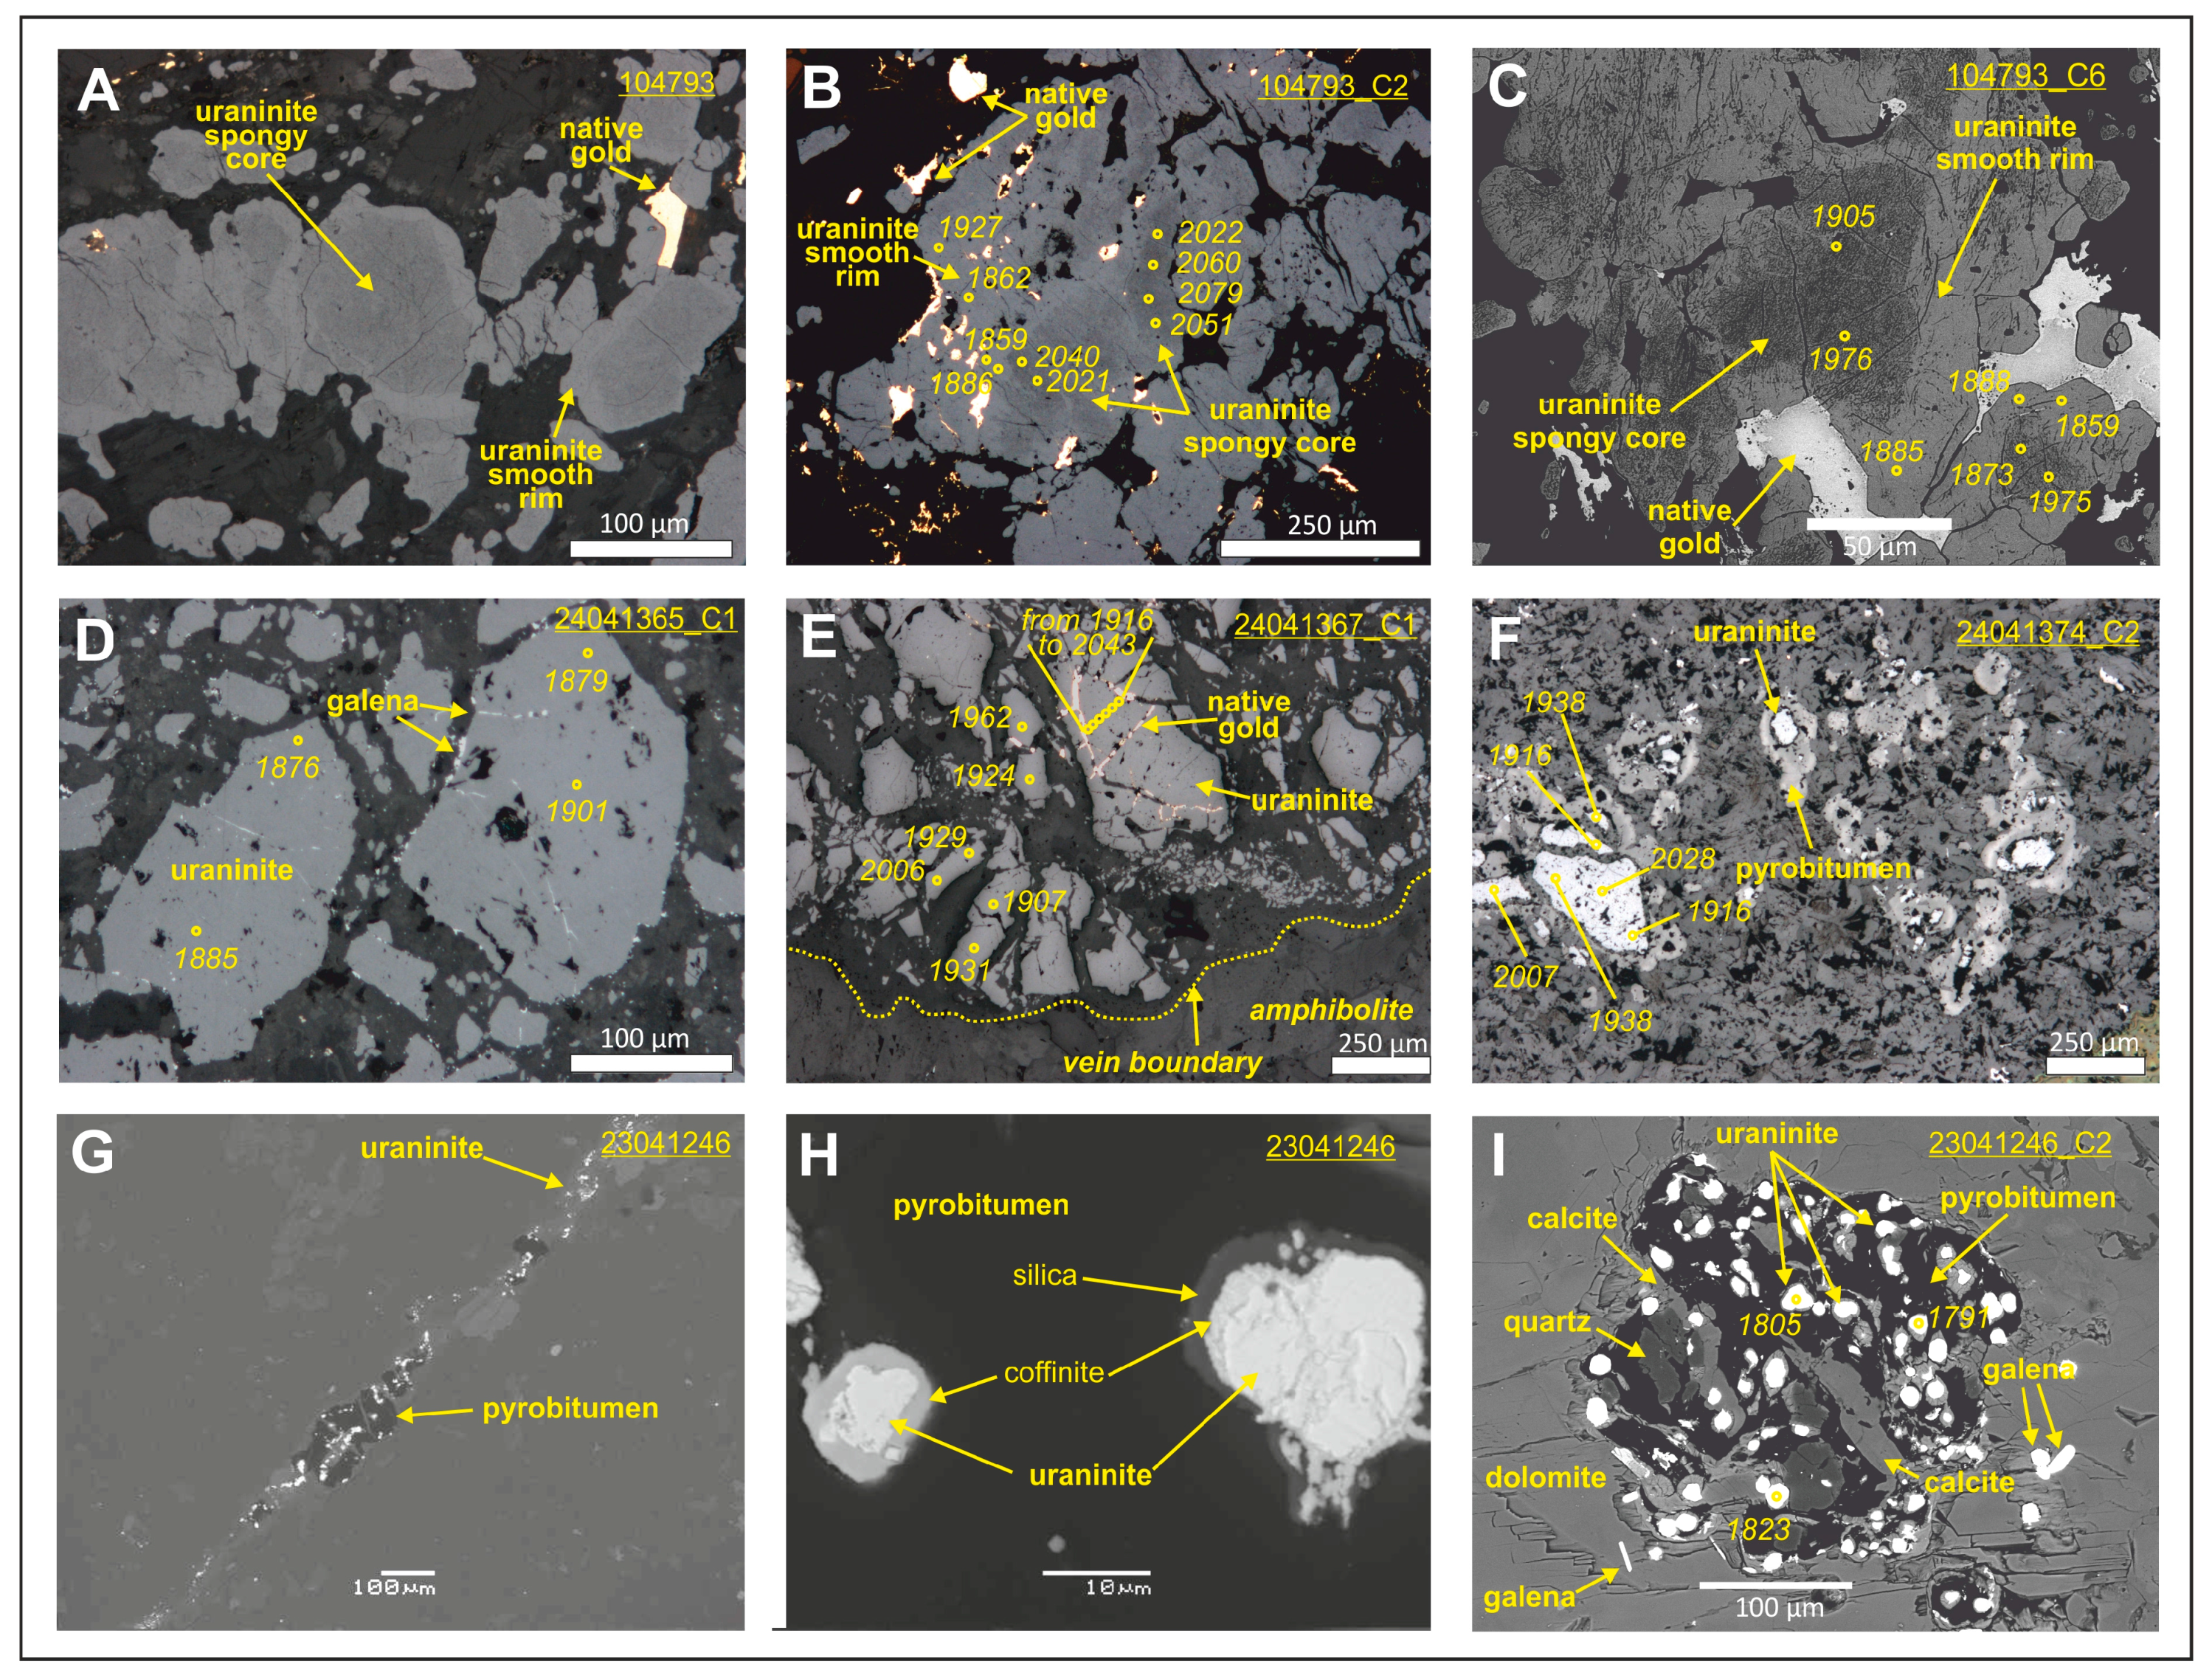
4.2. Mineralogical and Textural Observations

Mineralogical–textural observations and selections of mineral grains for U–Pb and Re–Os dating were performed in polished thin sections by means of transmitted and reflected light polarizing microscopes and back-scattered electron imaging in high resolution field-emission scanning electron microscopes (JEOL JSM 7100F, Geological Survey of Finland, Espoo, Finland). Electron microprobe analyses on randomly selected, homogenous spots in uraninite grains were completed by a Cameca SX 50 type instrument equipped with wavelength-dispersive detectors. Details of analytical conditions and calculation procedure of U–Th–Pb chemical ages are presented in [6], and results of analyses together with the calculated chemical ages can be found in the Electronic Supplement Table S1 in [6].

4.3. U–Pb Dating of Uraninite

Uraninite grains for U–Pb dating were selected from polished thin sections first by reflected microscope and in detail on back-scattered electron images (BSE) of the selected areas. U–Pb dating analyses were performed using a Nu Plasma AttoM single collector ICP-MS at the Geological Survey of Finland in Espoo connected to a Photon Machine Excite laser ablation system. Samples were ablated in He gas (gas flows = 0.4 and 0.1 L/min) within a HelEx ablation cell [30]. The He aerosol was mixed with Ar (gas flow = 0.9 L/min) prior to entry into the plasma. The gas mixture was optimized daily for maximum sensitivity. Ablation conditions used were: 5 μm beam diameter, 5 Hz pulse frequency, and 1.1 J/cm2 beam energy density. A single spot U–Pb measurement included a short pre-ablation, a 15 s pause for this material to be swept from the instrument, 15 s of on-mass background measurement, followed by 30 s of ablation. 235U was calculated from the signal at mass 238 using a natural 238U/235U = 137.88. Mass number 204 was used as a monitor for common 204Pb and mass 202 was monitored for Hg levels prior to and during ablation. In our ICP-MS system, 204Hg almost exclusively originates from the He supply giving a background count rate on mass 204 of 150–200 cps (counts per seconds), which has been stable over the last several years. The contribution of 204Hg from the plasma was eliminated by the on-mass background measurement. Age related common lead [31] correction was used when the analysis showed baseline subtracted common lead contents significantly above the detection limit (i.e., >50 cps). Typical 30 s averaged count rates (cps) for 238U, 207Pb, and 206Pb for the analyses reported here were 1.5–2.5 × 10⁸, 0.9–1.3 × 10⁷, and 9–11 × 107, respectively. At these count rates, all isotopes were measured with the detector in attenuated mode.
Calibration standards for uraninite include in-house uraninites U4 (1774 ± 5 Ma measured by ID-TIMS) and U3 (435 ± 5 Ma measured by ID-TIMS) which were run at the beginning and end of each analytical session, and at regular intervals during sessions. Reference material U3 gave an age of 435 ± 22 Ma (n = 20) over the period of the run session. Raw data were corrected for background, laser induced elemental fractionation, mass discrimination, and drift in ion counter gains, and reduced to U–Pb isotope ratios by calibration to data for the reference U4 uraninite using the program Glitter [32]. Further data reduction including common lead correction and error propagation was performed using in house excel spreadsheets. Errors are propagated by quadratic addition of within-run errors (2 standard errors), the reproducibility of the U4 standard during the analytical session (2 standard deviations) and the overall error on the certification of the U4 standard. To minimize the effects of laser-induced elemental fractionation, the depth-to-diameter ratio of the ablation pit was kept low, and isotopically homogeneous segments of the time-resolved traces were calibrated against the corresponding time interval for each mass in the U4 uraninite. Spots giving isotopically heterogeneous time resolved traces, presumably due to the involvement invisible mineral inclusions in the ablated parts of uraninite, were excluded from data processing and not listed in the Supplementary Table S1. Plotting of the U–Pb isotopic data and age calculations were performed using the Isoplot/Ex 3 program [33]. All ages were calculated with 2σ errors and without decay constants errors. Datapoint error ellipses in the figures are at the 2σ level. Concordia regressions presented on the figures correspond to “Model II fit”. Concentrations of U, Th, and Pb (total) on the unknowns were calculated from average blank subtracted mean counts rates for each element measured on the U4 standard. Grain to grain concentration variations in the U4 standard limits the quality of these concentration data to ±20%.

4.4. Re–Os Dating of Molybdenite

For Re–Os dating, samples with visible molybdenite were extracted as a powder from the host rock using a diamond-tipped, slow speed drill bit, and the aid of a binocular microscope. Complete removal of the molybdenite grains ensures closed system Re–Os systematics [34] and reliable ages. Any non-molybdenite powder (e.g., silicates) in the separate does not contribute to the Re and Os budget. Re–Os dating of molybdenite samples, where small-scale molybdenite is observed in thin sections, but cannot be readily seen with the binocular microscope, requires matching up thin section billets with thin section observations, and performing “blind” drilling on the billet to “capture” molybdenite grains.
Carefully weighed powder is combined with an isotopically distinct 185Re–188Os–190Os “double spike” and inverse aqua regia in a borosilicate ampoule (Carius tube), which is sealed and heated at 250 °C for 12 h. Oxidation of molybdenite and its equilibration with spike rhenium and osmium ensures accurate concentration data independent of analytical yield. Osmium is separated from the solution by solvent extraction into chloroform followed by back-extraction into hydrobromic acid (HBr). Subsequent micro-distillation provides a high purity Os split. Rhenium is extracted from the remaining inverse aqua regia solution by anion exchange chromatography. Purified Re and Os are loaded on outgassed Pt filaments for mass spectrometry. Isotopic ratios of Re and Os are measured on a Triton thermal ionization mass spectrometer (TIMS) at the AIRIE Program, Colorado State University. Barium activators enhance ion yield resulting in Re intensities that can be measured by Faraday cup, whereas Os intensities may be measured either by peak-hopping (secondary electron multiplier) or simultaneous Faraday cup collection, depending on signal strength. Both Re and Os are analyzed as oxides with ratios corrected for oxygen isotopic systematics. The isotope dilution equation utilizing sample weight, spike weight, measured ratios, background “blank” information, and spike calibration data provides rhenium, radiogenic 187Os, and common Os concentrations, which are used to determine a molybdenite age. Errors for each variable are fully propagated and reflected in the uncertainty reported for Re–Os ages.
Common Os was measured and the levels are near zero. Re and Os blanks are in the low picogram to femtogram range, and are irrelevant to the samples in this study, which have high Re and 187Os concentrations (ppm and ppm–ppb range, respectively).

5. Results

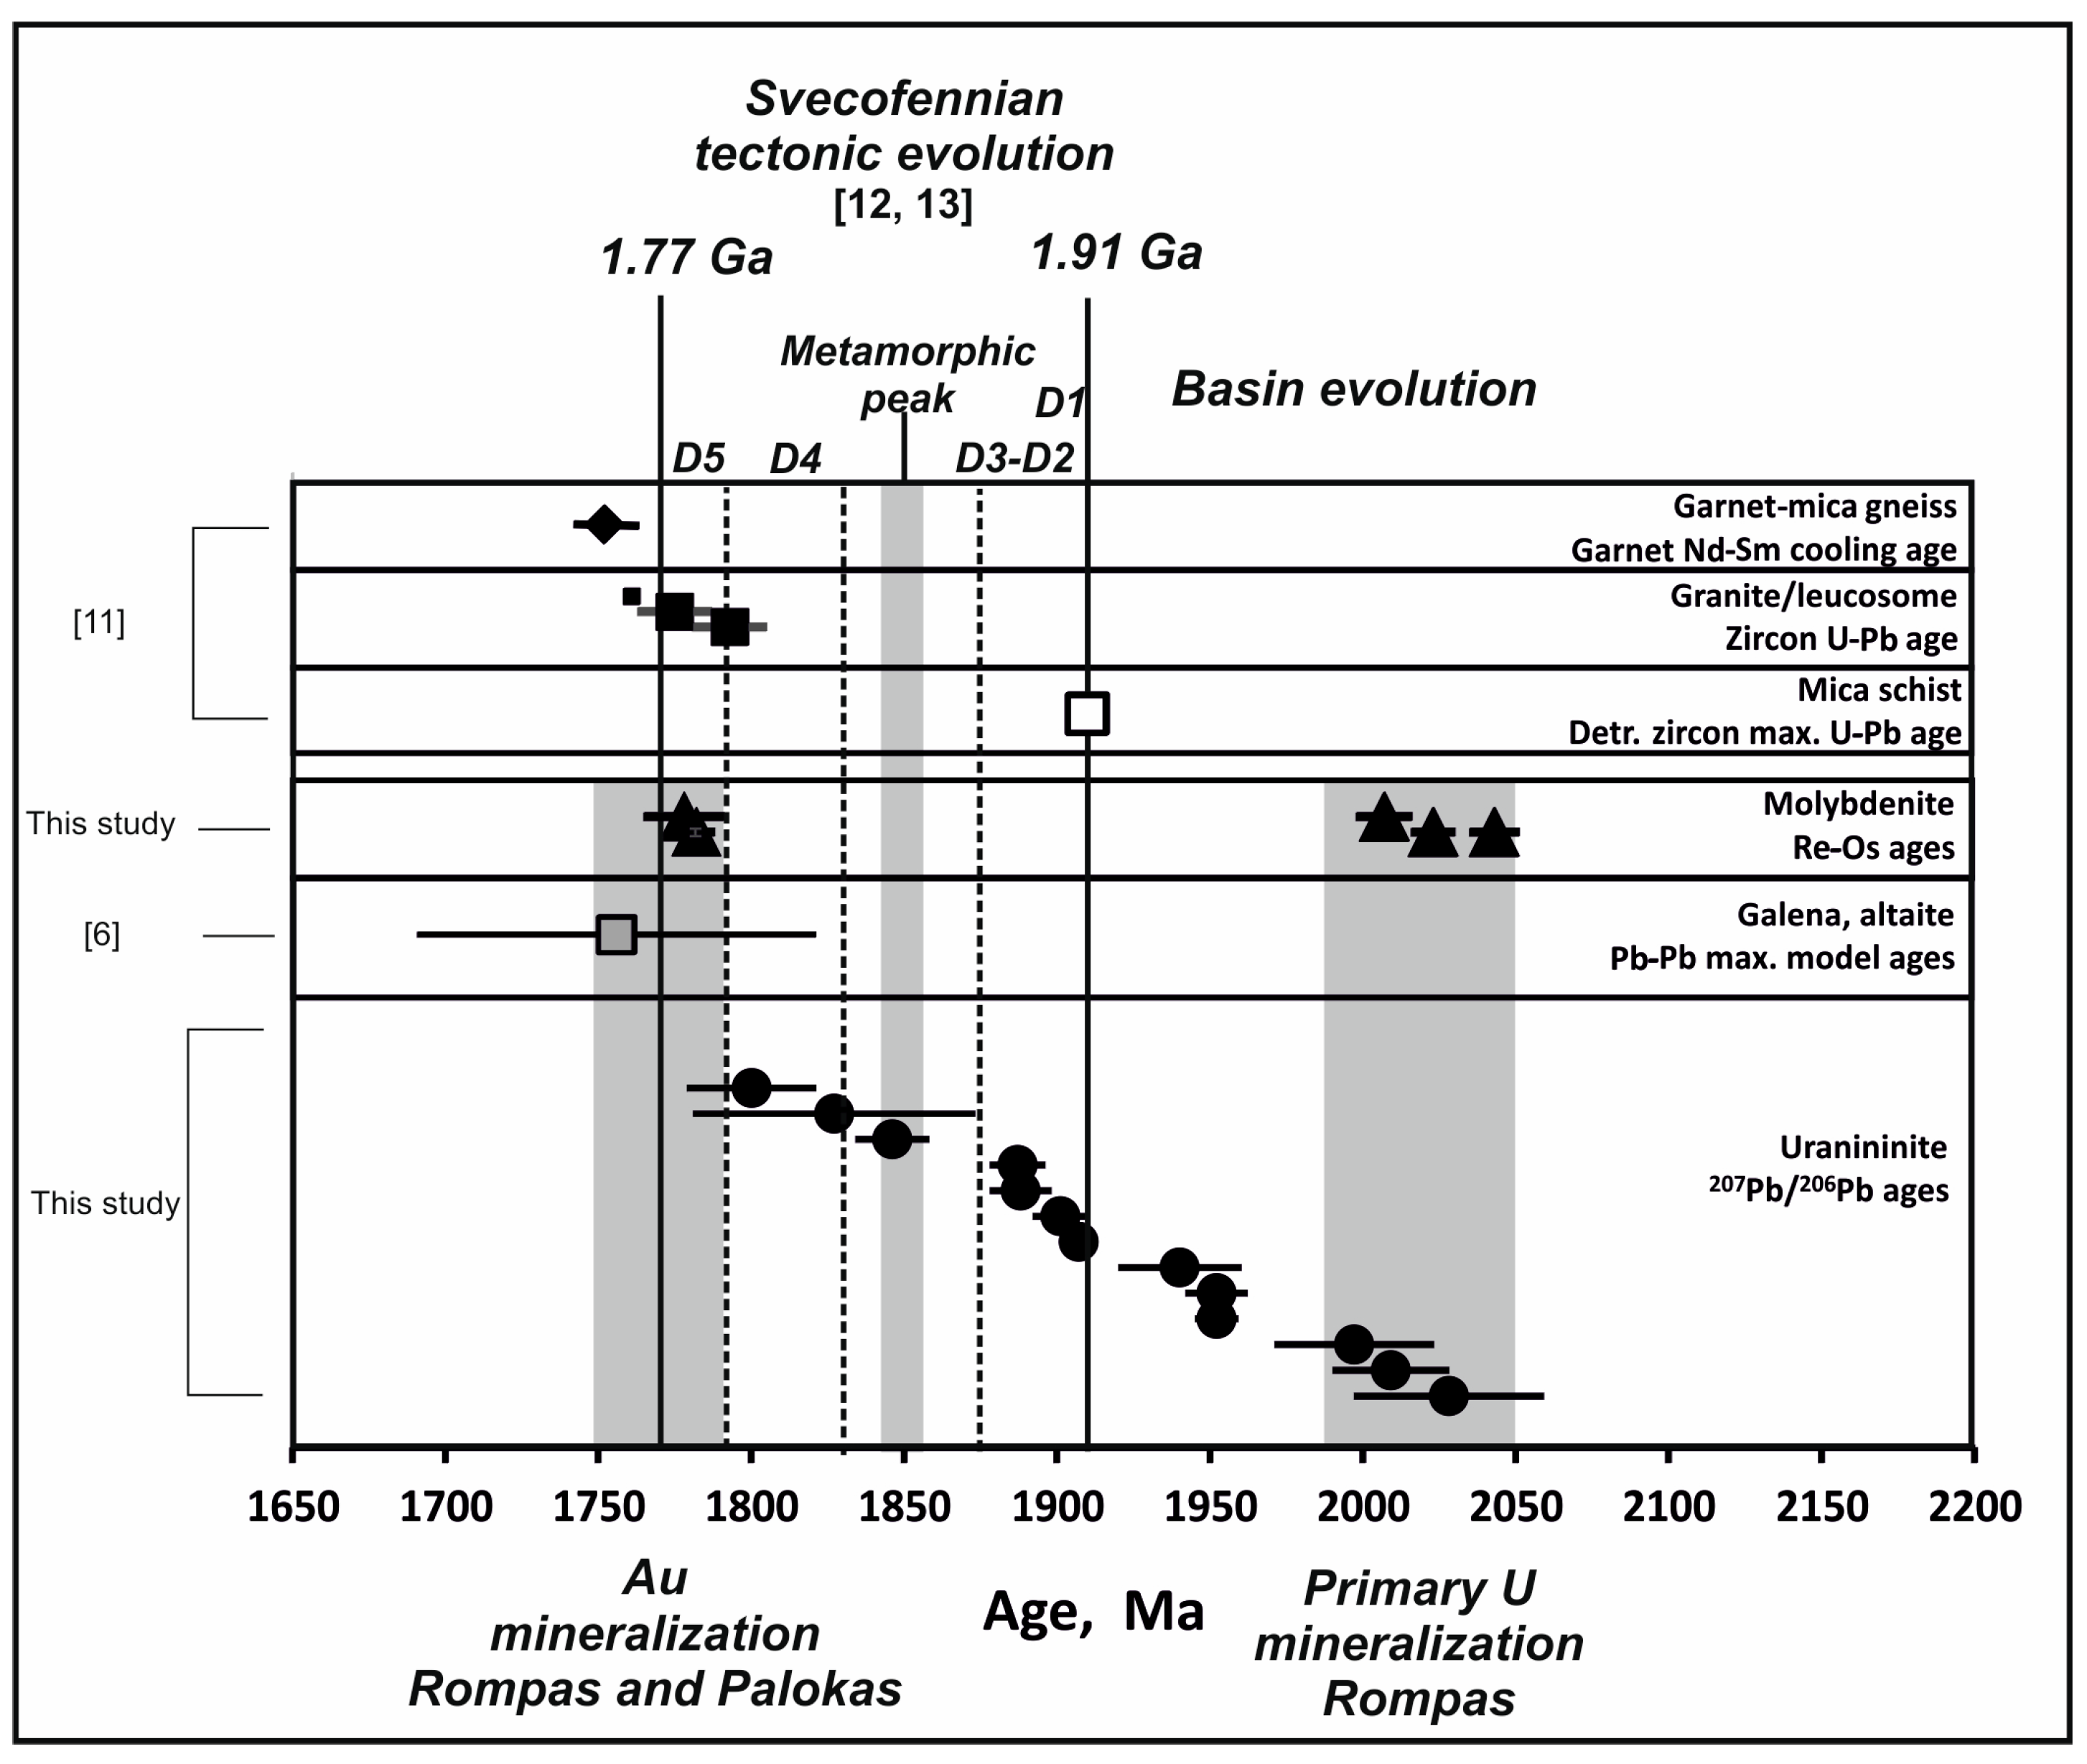
5.1. Uraninite at Rompas: Textural Types and U–Pb Ages

The uraninite-bearing samples can be classified into three distinct types according to the morphological–textural characteristics of uraninite grains. Type 1 and Type 2 uraninites are coarse grained and occur in folded calcsilicate veins, whereas type 3 uraninite is fine grained and confined to late pyrobitumen-bearing fractures cutting calcsilicate veins and the host metabasalt. Type 1 and Type 2 uraninite also show intense alteration, fracturing, or brecciation, and in the samples from high grade gold mineralization, fractures of uraninite contain highly radiogenic lead minerals, together with native gold and associated sulphides and arsenides [6].

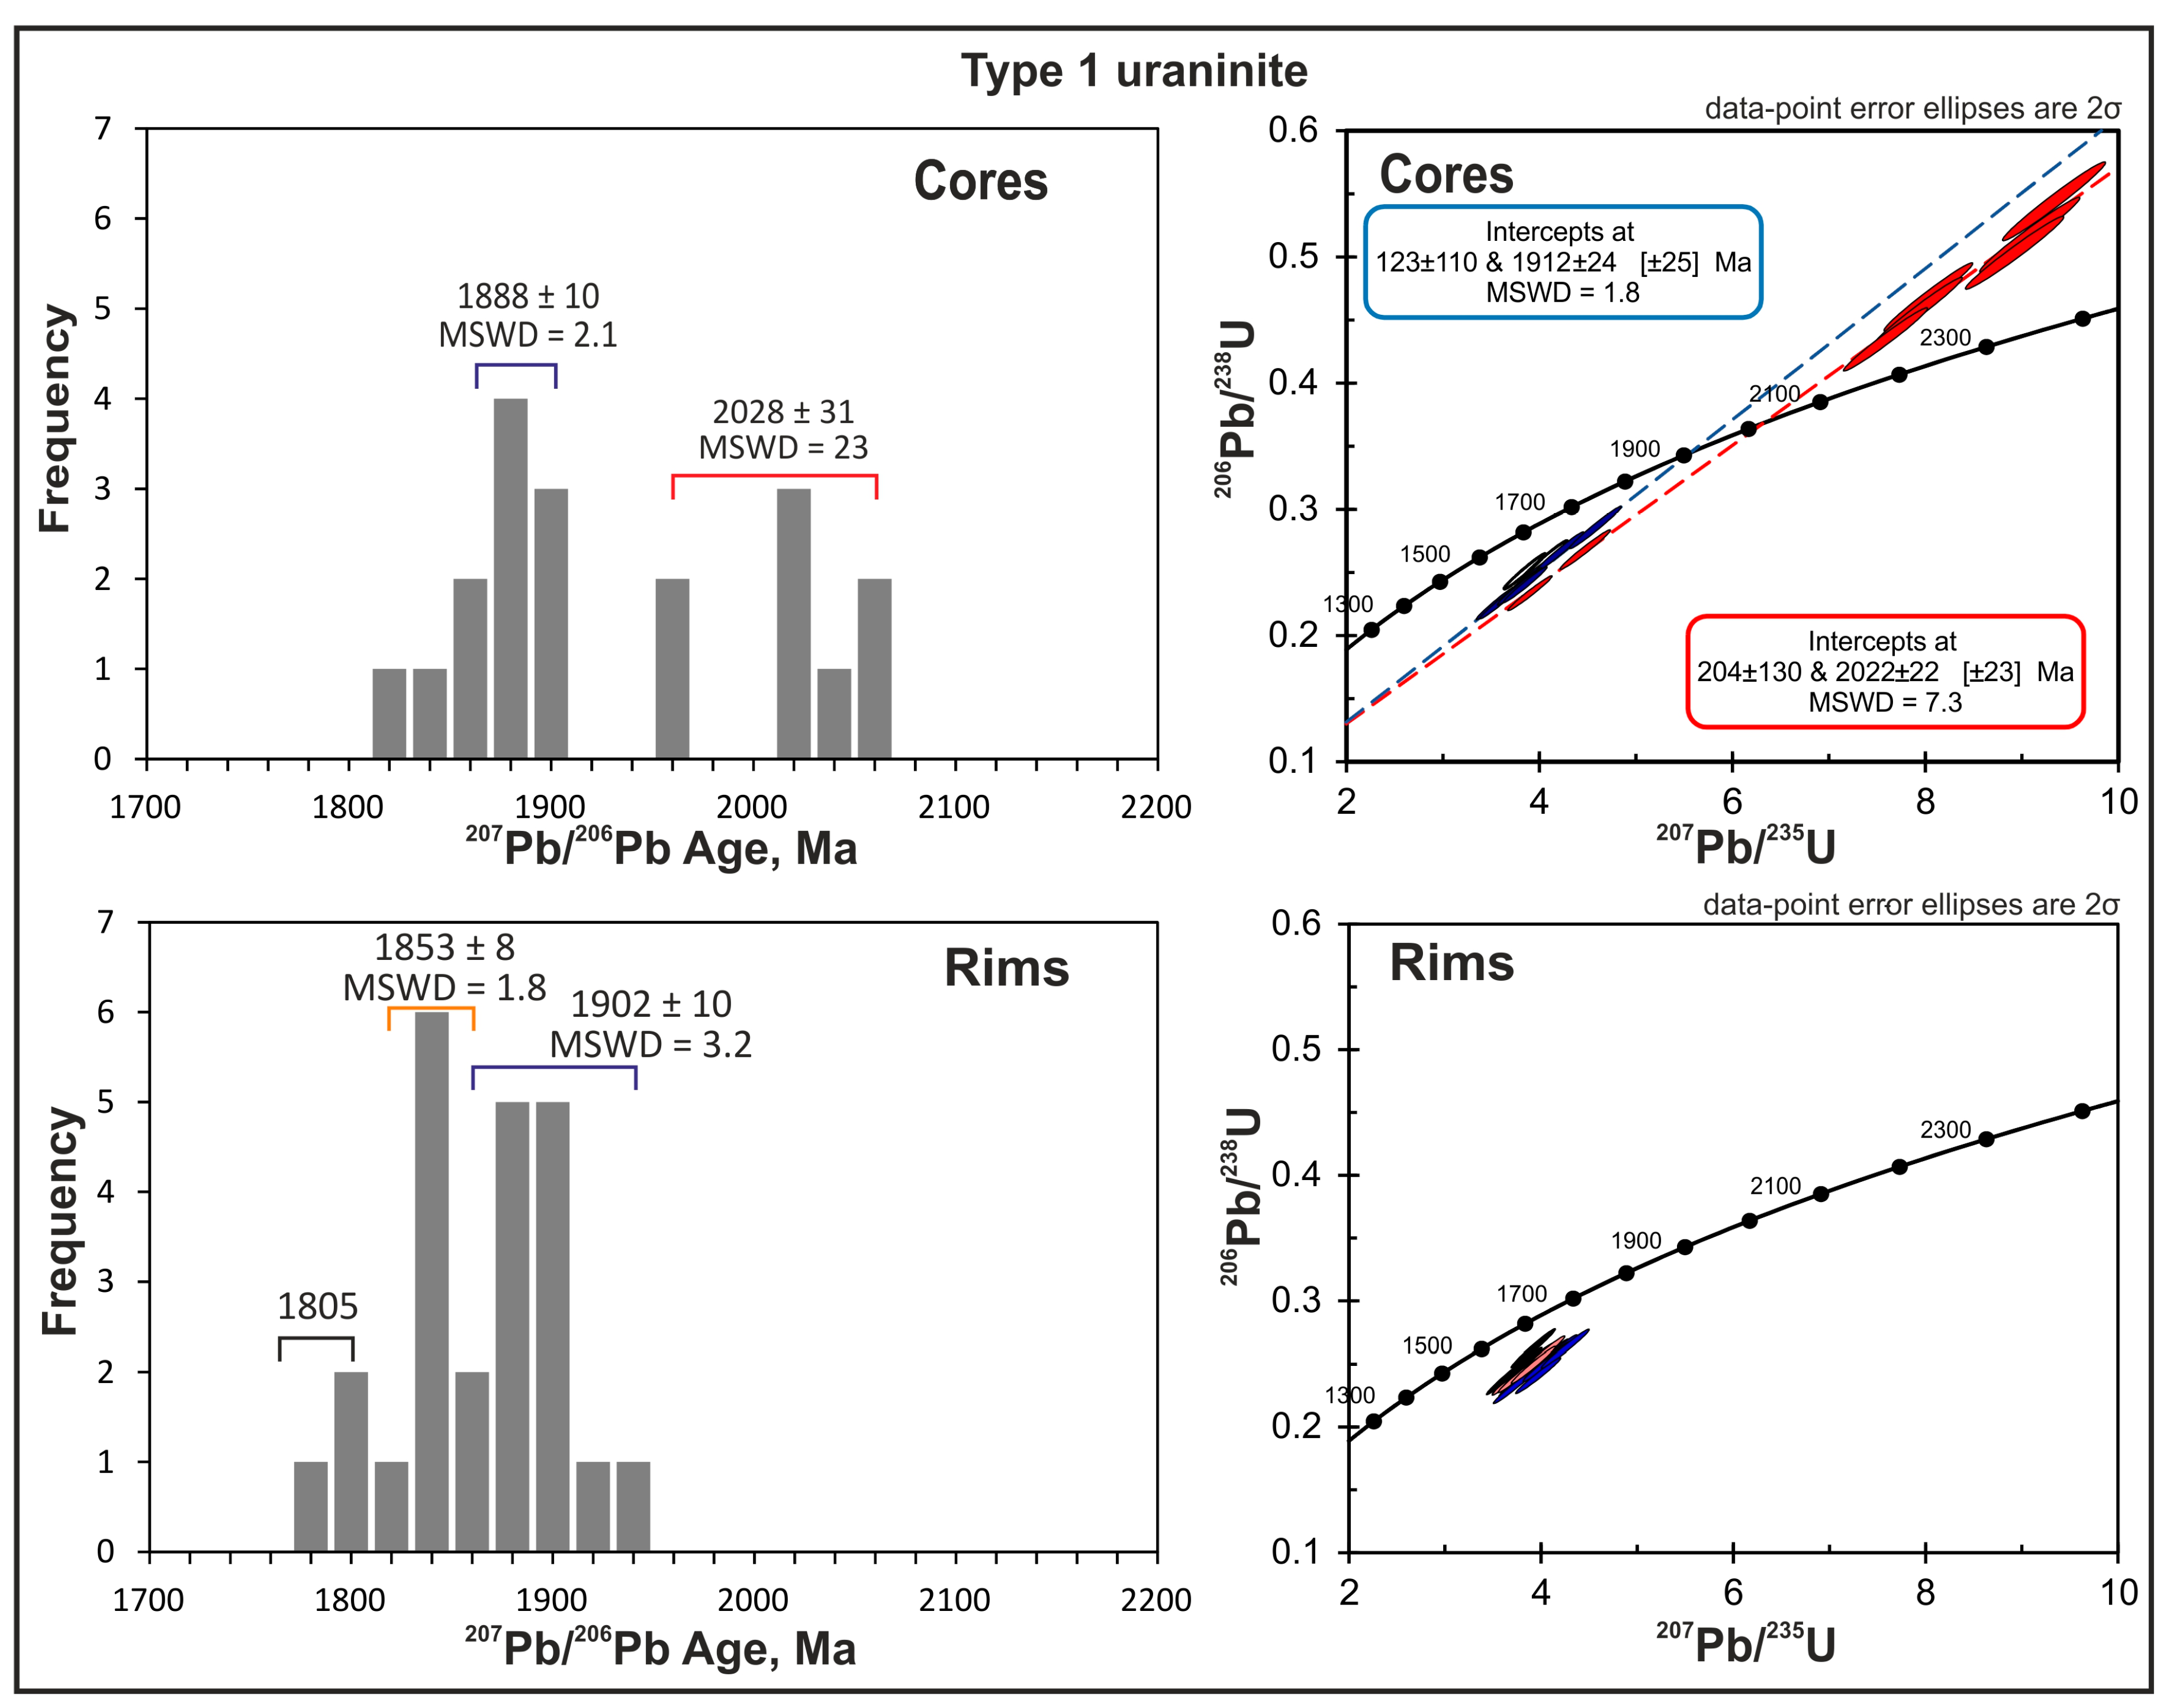
5.1.1. Type 1 Uraninite

Type 1 uraninite (sample #104793) forms variably sized (from mm to cm range) subhedral–anhedral, round and fractured grains, with internal zoning clearly visible in reflected light polarizing microscope. In the cores of the grains, the texture of uraninite is mottled–spongy and the outline of these internal zones is rather diffuse (Figure 3A–C). The rims of the grains appear to be more compact/homogeneous, although in some places it is formed from polycrystalline masses of smaller, apparently fresh uraninite grains. Both cores and rims of grains are cut by fractures which are filled by calcite and native gold and associated ore minerals. The zoned grains of uraninite are surrounded by pyroxene, amphibole and Fe–dolomite-bearing matrix of the calcsilicate veins, and these minerals replace the composite uraninite grains. Intercrystalline spaces between the silicates and fractures cutting silicates also contain the native gold-bearing mineral paragenesis in the vicinity of uraninite grains. Pyroxene and amphibole crystals are overgrown and partially replaced by tremolite–actinolite and chlorite.
LA-ICP-MS U–Pb analyses were completed on 43 spots of Type 1 uraninite (Supplementary Table S1). Both in the cores and rims, the common lead content is around 0.01% and results of analyses show most typically 70%–80% concordance on Wetherill concordia plots (Figure 4). Reversely discordant (120%–140%) data also occur in the mottled cores (Supplementary Table S1; Figure 4). Uraninite in these analytical spots is depleted in uranium indicating that the alteration in the cores mobilized not only lead but also uranium. In the cores, the U–Pb data define two distinct discordia with upper intercept ages at 2022 ± 22 Ma (MSWD = 7.3, n = 8) and 1912 ± 24 Ma (MSWD = 1.8, n = 8), with exclusion of data for three spots with anomalously low or high 207Pb/206Pb ratios), whereas the lower intercept ages are at 204 ± 130 Ma and 123 ± 110 Ma, respectively (Table 1). The upper intercept ages and the weighted average 207Pb/206Pb ages (2028 ± 31 Ma, MSWD = 23 and 1888 ± 10 Ma, MSWD = 2.1, respectively Table 1) are within error. It is not possible to regress an un-anchored discordia for the data from the rims of uraninite grains (Figure 4). However, these data can be classified into two populations according to the 207Pb/206Pb ratios (Table 1, Figure 4), and the error weighted average 207Pb/206Pb ages are 1902 ± 10 Ma (MSWD = 3.0, n = 12) and 1853 ± 8 Ma (MSWD = 1.8, n = 9) for those populations. Thus, results of these analyses indicate that in spite of the strong alteration in the cores of Type 1 grains, some domains preserved an old age, whereas the U–Pb clock was re-set at around 1.9 Ga in other domains. Additionally, domains with identical ages to the younger core ages also occur in the more homogeneous rims, while other domains in the rims indicate an alteration event at 1.80 Ga.

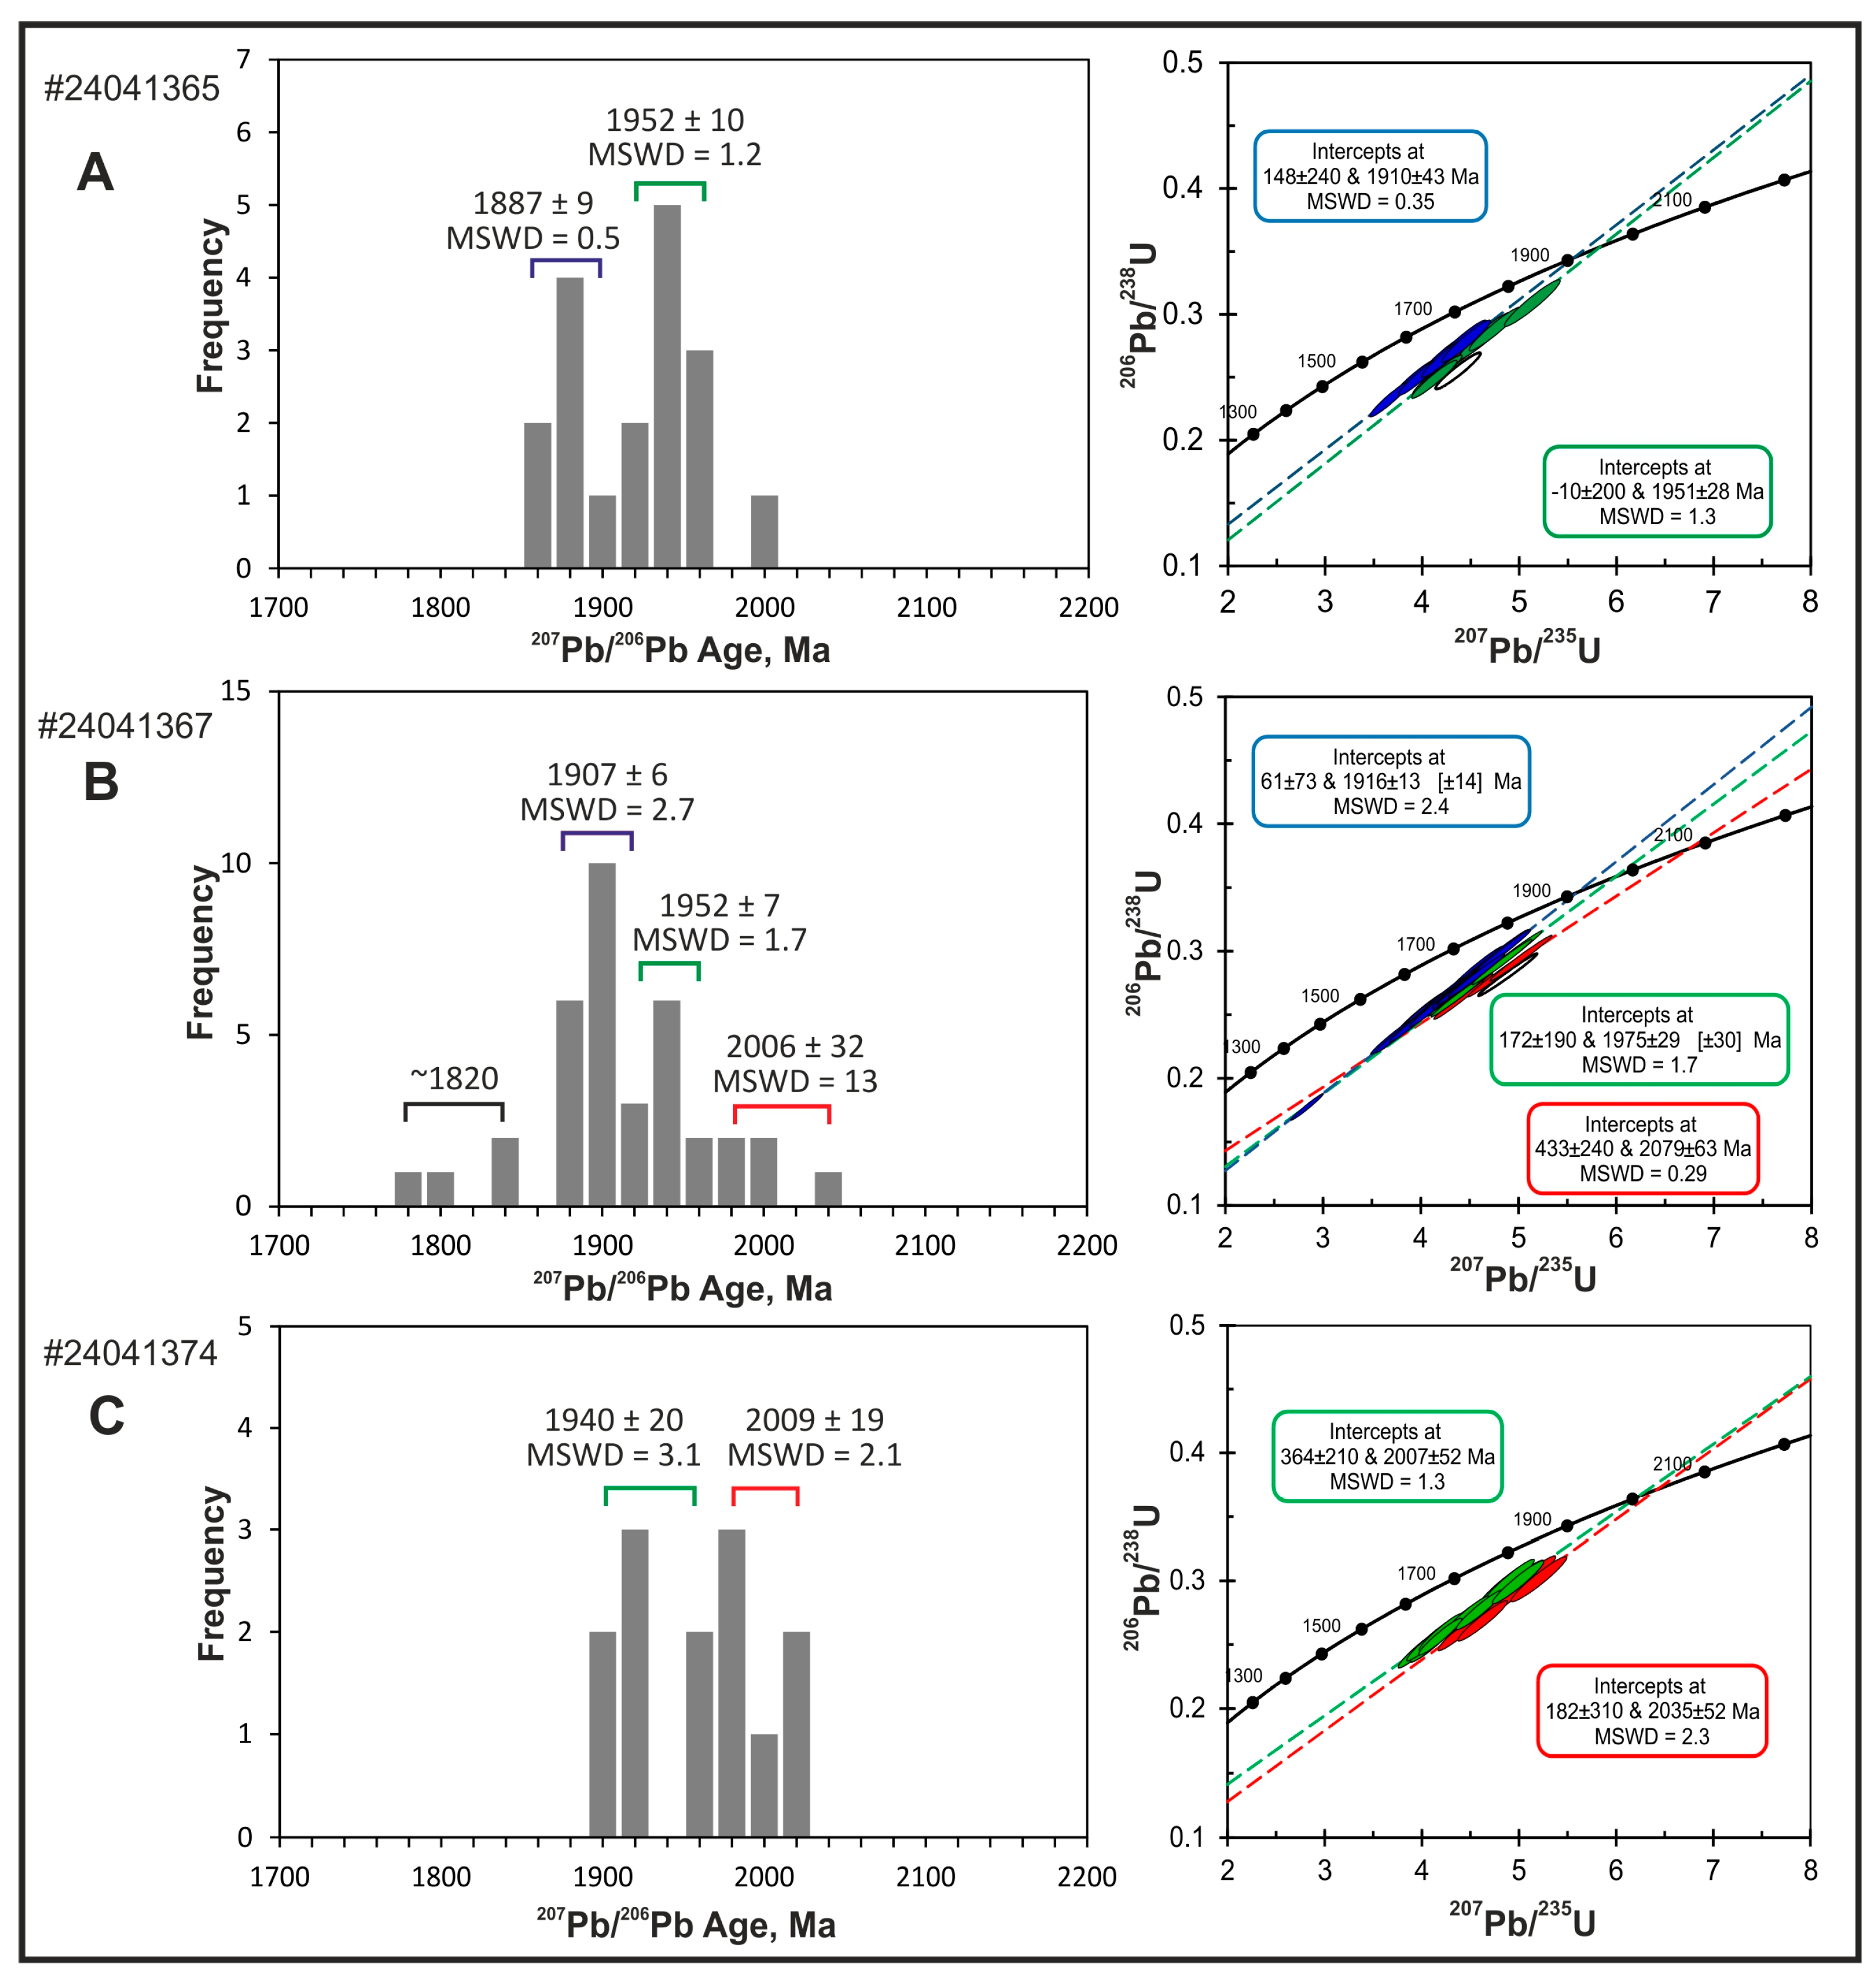
5.1.2. Type 2 Uraninite

Grains of Type 2 uraninite are angular, strongly fractured, and brecciated fragments with variable sizes in the millimeter–centimeter range within folded–boudinaged calcsilicate veins (sample #24041365—ROM-0011, 7.65–7.70 m, #24041367—ROM-0011, 12.30–12.57 m, #24041374—ROM-0011, 115.0–115.06 m; Figure 3D,E). This type of uraninite does not show observable core-rim zoning. In samples 24041367 and 24041374, many uraninite fragments or assemblages of fragments are coated by pyrobitumen (Figure 3F). Some fractures in uraninite and in the calc–silicate matrix or pyrobitumen crust around the uraninite grains contain native gold, radiogenic Pb minerals and other ore minerals of the native gold related mineral assemblage (Figure 3D,E). Other fractures in uraninite are not continued into the matrix and they are filled by radiogenic galena only. Radiogenic galena grains also occur as fine disseminations of inclusions in some grains. The matrix of the veins consists of carbonates, quartz, pyroxene, amphiboles, biotite. Tremolite–actinolite and chlorite partially replaces the Fe–Mg silicates.
The deformed veins with Type 2 uraninite form boudins in the host metabasalt, and this is in contrast with the brecciated-fragmented appearance of uraninite. Uraninite is a rather rigid mineral compared to pyroxenes, amphiboles, and carbonates (e.g., the elastic bulk modulus for uraninite is 209 GPa, which is approx. two times higher than it is for the chain silicates and carbonates [35]) therefore, it is plausible to assume that the difference between the ductile nature of vein deformation and brittle fragmentation of uraninite within the veins can be related to the more competent behavior of uraninite.
Seventy-two spot analyses on Type 2 uraninite fragments with and without pyrobitumen crust and native gold-bearing fractures were completed. In all of the samples analyzed, the obtained U–Pb data are slightly discordant (around 80% concordance—Supplementary Table S1 and Figure 5) and the 207Pb/206Pb ages show polymodal distribution with similar modes. In samples #24041374 and #24041367, the oldest 207Pb/206Pb age populations are at around 2.01 Ga (Figure 5B,C). The error weighted average 207Pb/206Pb ages for these data populations are 2009 ± 19 Ma (MSWD = 2.1, n = 6) and 2006 ± 32 Ma (MSWD = 5.4, n = 5). Remarkably, these data are within error of the oldest average 207Pb/206Pb age from the cores of Type 1 uraninite (e.g., 2028 ± 31 Ma; see above). The upper intercept of the discordia curves fitted to the U–Pb data of these populations are 2035 ± 52 Ma (MSWD = 2.3) and 2079 ± 63 Ma (MSWD = 0.3) and the lower intercepts are around 200 and 400 Ma. In all samples, the 207Pb/206Pb ages for grains of Type 2 uraninite also show a distinct population at 1.95 Ga and the error weighted average 207Pb/206Pb ages for this population are within error in the different samples: e.g., 1940 ± 20 Ma (MSWD = 3.1; n = 7) in sample #24041374, 1952 ± 7 Ma (MSWD = 1.7; n = 9) in sample #24041367, and 1952 ± 10 Ma (MSWD = 1.2; n = 10) in sample #24041365. The upper intercept U–Pb ages are within error of the average 207Pb/206Pb ages and the lower intercepts are between −10 and 364 Ma (Figure 5).
In samples #24041367 and 24041365, a third population of 207Pb/206Pb ages is characterized with an error weighted average at 1907 ± 6 Ma (MSWD = 2.7, n = 18) and 1887 ± 9 Ma (MSWD = 0.5, n = 7). This age population is also present in the rims of the zoned Type 1 uraninite (e.g., 1888 ± 10 Ma; Figure 4). In sample 24041367, a few 207Pb/206Pb data indicate a re-setting event about 1820 Ma.

5.1.3. Type 3 Uraninite

Occurrences of Type 3 uraninite are confined to late fractures that cross-cut calcsilicate veins and the foliation of the host metabasalt (Figure 3G). In these thin (0.1–1 mm range), calcite-filled fractures, small (10–100 micrometers range) round uraninite grains occur both within and outside of pyrobitumen nodules, and are ubiquitously associated with titanite. Some of the round grains have thin coffinite or silica–carbonate crusts which corrode the uraninite cores (Figure 3H); this feature also suggests that accumulation of pyrobitumen by radiolytic polymerization of hydrocarbons occurred after the precipitation and alteration of this type of uraninite [6].
U–Pb dating of Type 3 uraninite grains was performed in the sample #23041346 (ROM-0044 10.97–11.20 m; Figure 2). Due to the small sizes of uraninite grains, just nine analyses were performed. Data are concordant and slightly concordant and define a discordia with 1819 ± 37 Ma (MSWD = 3.7) upper and 222 ± 310 Ma lower intercepts, respectively (Figure 6). The error weighted average of the 207Pb/206Pb data is 1800 ± 21 Ma (MSWD = 4.6).

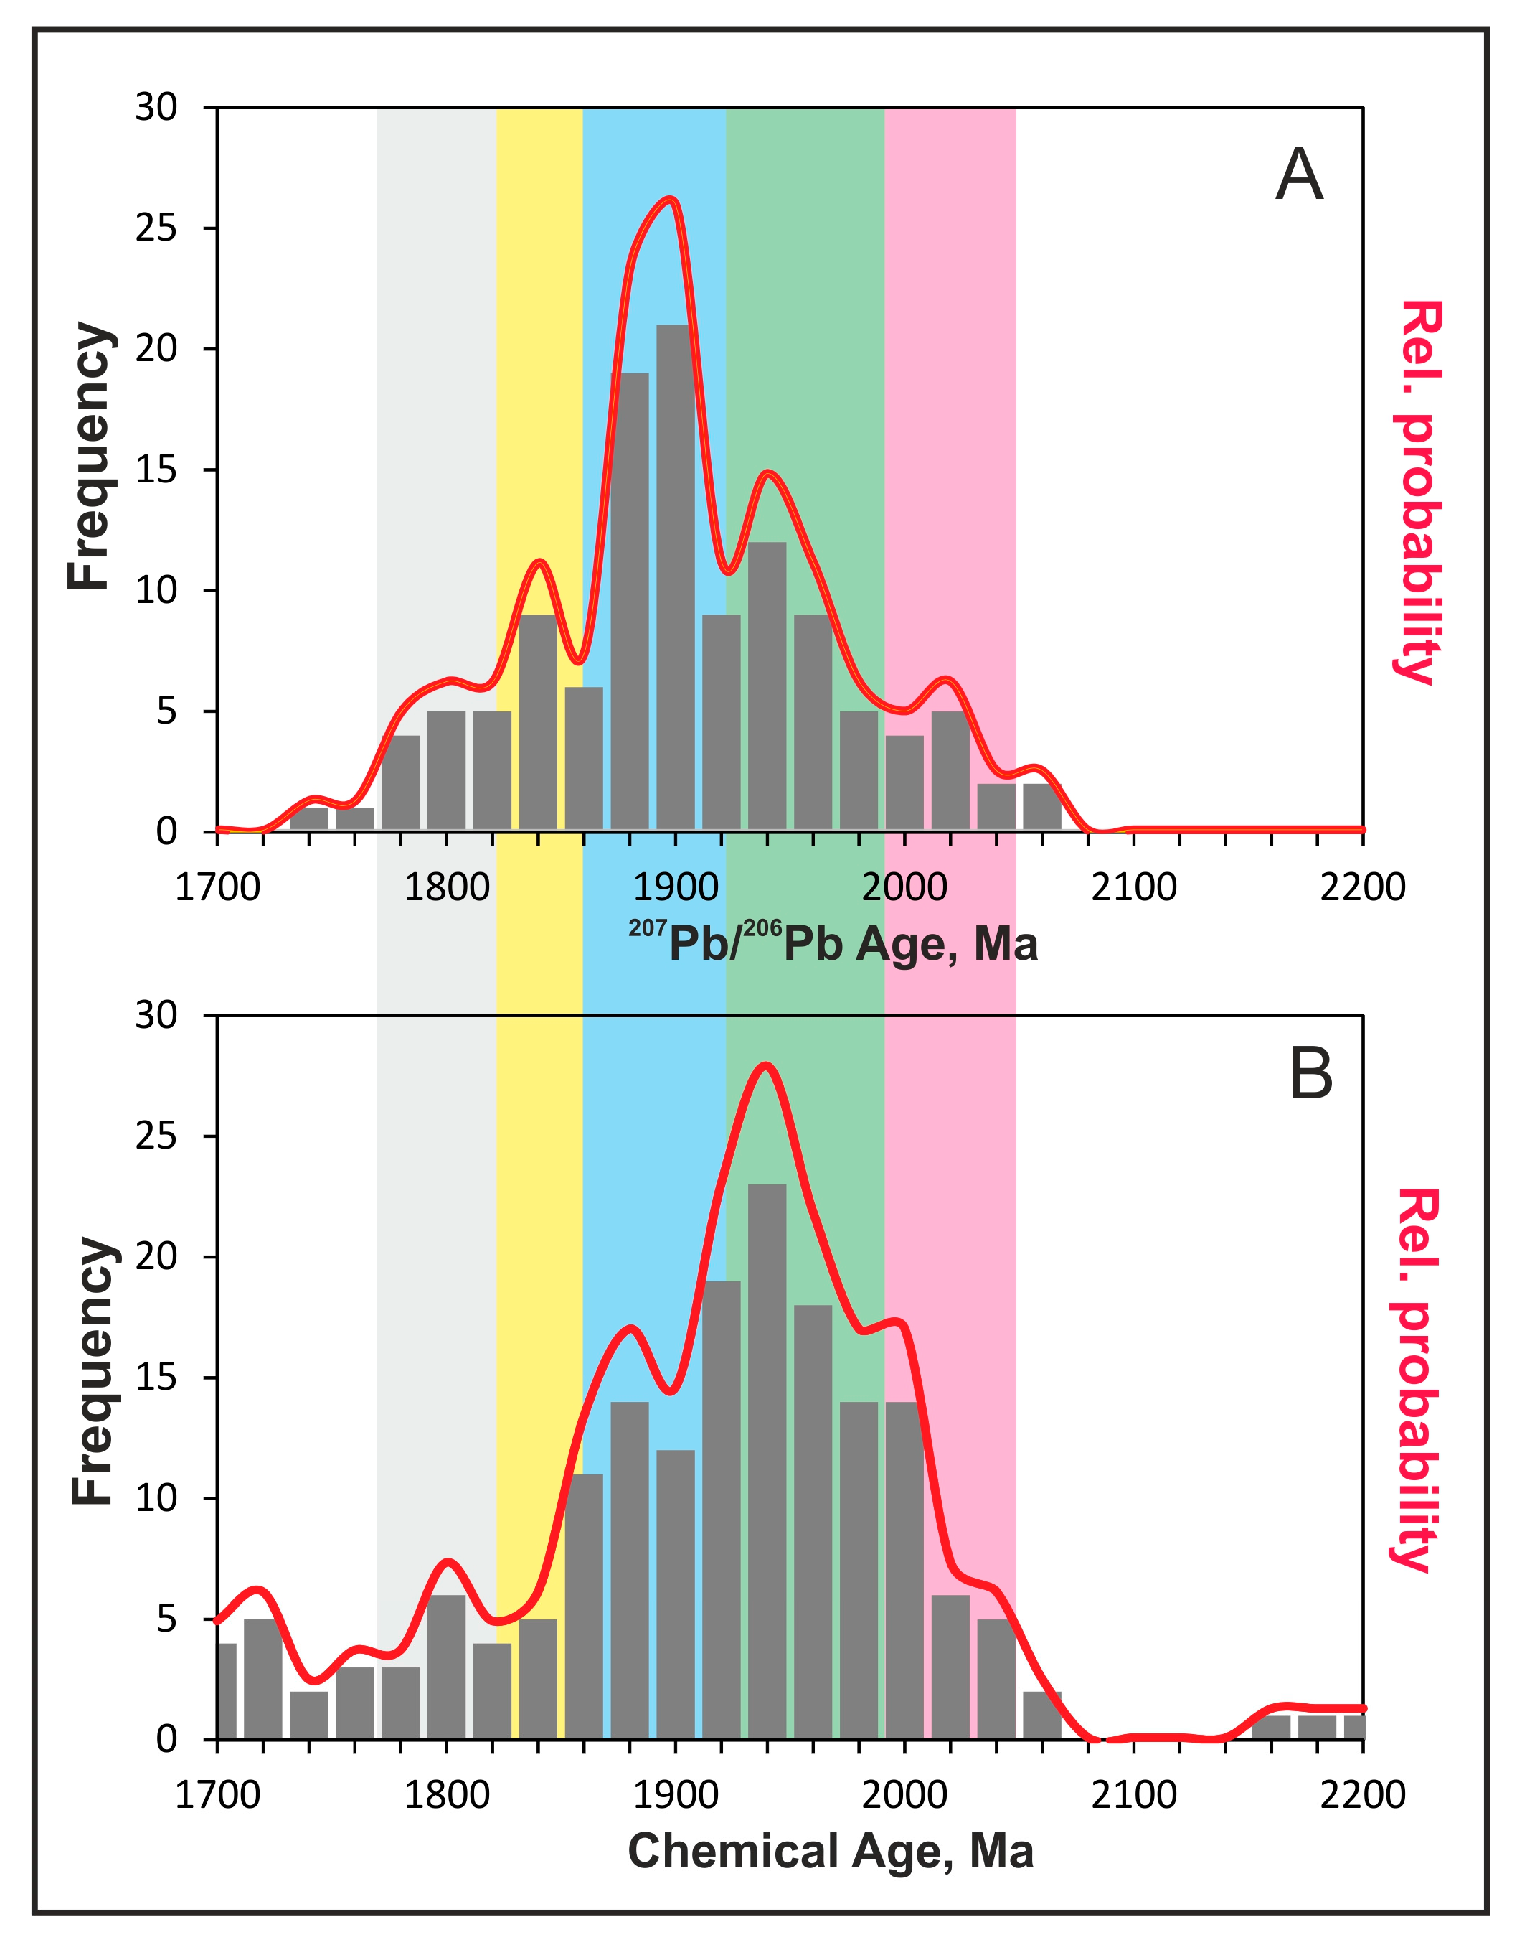
5.2. Uraninite Chemical Ages at Rompas

Chemical (U–Th–Pb) ages for grains from the Rompas prospect have been determined by electron microprobe analyses during our previous studies [6]. The frequency distribution/relative probability of chemical ages from the sample set of the current LA-ICP-MS U–Pb dating and its comparison to the frequency distribution/relative probability of the 207Pb/206Pb ages for the same set of samples (apart of the sample #23041374; no electron microprobe data were collected from this sample) are shown on Figure 7. Frequency intervals (25 Ma) were applied to construction of these figures, because the individual chemical and LA-ICP-MS U–Pb data usually have, errors between 10 and 20 Ma.
The frequency distribution/relative probability of chemical ages shows remarkably similar modes to the distribution/probability of 207Pb/206Pb ages, although the intensities of the peaks are different. The most common chemical and 207Pb/206Pb ages are distributed between 1.86 and 2.0 Ga, with the most profound maxima at 1.88 and 1.94 Ga. Older (around 2.025–2.05 Ga) and younger (around 1.8 Ga) populations of 207Pb/206Pb ages are less frequent but these age-modes are also rather distinct to the distribution diagram of the chemical ages.

5.3. Re–Os Ages for Molybdenite from Rompas and Palokas

At Palokas, molybdenite is an accessory mineral in the gold-bearing, sulphide-rich metasomatized zones with quartz–tourmaline veins [25]. For Palokas, a sample was collected for Re–Os dating from the PRAJ-009 drill hole (Figure 2). The sample contains small visible flakes of molybdenite in quartz veins (Figure 8A). At Rompas, molybdenite was analyzed from two samples from the ROM-044 drill hole (Figure 2). In these samples, molybdenite is an accessory mineral in calcsilicate veins. It occurs as a few flakes, a few tens of microns in size with some flakes forming aggregates. Molybdenite is randomly distributed in these veins, and occurs in association with uraninite or in uraninite-free areas of the veins. For the latter occurrence, molybdenite is often intergrown with titanite and rutile (Figure 8B).
Normalized to 100% Re, the samples from Palokas have higher rhenium than Rompas (Table 2). Results of two analyses of molybdenite from the PRAJ-009 sample (Palokas area) provide ages of 1778 ± 13 Ma and 1782 ± 6 Ma, in agreement within their 2-sigma analytical uncertainty (Table 2). In contrast with these results, from two samples in the same drill hole (ROM-0044) in the Rompas area yield three similar ages, but ages that do not overlap within their 2-sigma analytical uncertainty (2007 ± 9 Ma, 2023 ± 7 Ma, and 2043 ± 8 Ma). Importantly, there is no common Os measured in any of these samples, so the calculated ages are not dependent on the assumption of an initial 187Os/188Os ratio (we use an initial Os ratio of 0.2 in our calculations). Since the diluents are calc–silicate minerals (with orders of magnitude less Re and Os than molybdenite), dilution does not impact the age results. We attribute the variation in ages to small perturbation in the Re and Os budgets at the scale of our sampling. This could reflect minor disturbance of the Re–Os systematics at the scale of geologic sampling.

6. Discussion

Occurrences of texturally distinct types of uraninite, local presence of late pyrobitumen coatings on uraninite, as well as occurrence of gold mineralization in late fractures of uraninite and pyrobitumen indicate that the hydrothermal vein-hosted primary uranium mineralization was overprinted by several hydrothermal events at Rompas (Figure 9). This is also reflected by the results of in situ U–Pb dating of uraninite grains presented in this paper. However, the major question is whether the several populations of U–Pb and chemical age data from uraninite actually match with ages of hydrothermal/recrystallization processes, or whether they are instead geologically meaningless (e.g., data simply reflect mixed ages from structural domains of uraninite with intact, variably disturbed or re-set U–Pb systematics).
The calculated upper intercept concordia ages and 207Pb/206Pb ages for uraninite are within error in most samples (Table 1). In the following discussion, we prefer to use the 207Pb/206Pb ages, because the regressions on discordant U–Pb data are highly influenced by the degree of discordance and relative variations in lead and/or uranium loss between different analytical spots/domains (e.g., see data for the rims of Type 1 uraninite; Figure 4). The applied in-situ analytical technique allows interpretation of data according to the textural setting of the analytical points, and results of the Re–Os dating of molybdenite provide some cornerstones for the overall timing of hydrothermal processes. The recently refined tectonic evolution model for the Peräpohja belt [12,13] forms the background for checking the geological meaning of the age data obtained from uraninite and molybdenite.
The Re–Os ages for molybdenite from the uraninite-bearing calcsilicate veins at Rompas are between 2007 ± 9 and 2043 ± 8 Ma (Table 2). There is no ready explanation for the imperfect agreement in ages from the same calc–silicate occurrence over a 13 m interval in a single drill hole (ROM-0044, see Table 2). Further, the inability to replicate an occurrence within 2-sigma uncertainty (two mineral separates) at the same depth in ROM-0044 (2023 ± 7 and 2043 ± 8 Ma, Table 2) is also puzzling, although the ages are similar. The molybdenite is fine-grained (Figure 8); however, such fine-grained samples are generally favorable for dating compared to coarse-grained molybdenite “books and sheets” where 187Re–187Os (parent-daughter) decoupling was discovered [34]. Our powdered separates ranged from 11 to 35 milligrams. Arguments for a minimum sample size have been advocated [36], but it has also been shown that even sub-mm molybdenite samples can be dated, provided the “rock container” surrounding the molybdenite is suitable [37]. Therefore, other considerations and explanations are necessary, including the associated host material for the molybdenite.
Organic material occurring in the molybdenite-bearing veins is not a sink for Re, relative to the sulphide mineral MoS2. A much more plausible scenario is uptake of unwanted radiogenic 187Os by organic material resulting in loss of radiogenic Os in the molybdenite [38]. There are two reasons that this is an unlikely explanation: (1) loss of radiogenic Os would make the molybdenite ages younger, not older, and (2) the Os (187Os) budget in molybdenite is so large that a small loss would not substantially affect the age [34]. Other minerals, such as uraninite and titanite—closely associated with molybdenite in the calcsilicate veins at Rompas (Figure 8B)—are not known to utilize Re and Os in their structure, and calc–silicate assemblages also have no place to accommodate the highly siderophile and chalcophile elements, Re and Os. Oxidation can cause loss of both Re and Os [39], but there is no visible evidence in the samples, at any scale, for oxidation. Another possibility is molybdenite overgrowths [40], but these are rare [34]. We cannot exclude this possibility, though our SEM observations did not reveal textural or chemical heterogeneity in molybdenite.
Nevertheless, we see the Re–Os ages as a clear signal of a 2050–2000 Ma event associated with the onset of uraninite deposition. The oldest populations of 207Pb/206Pb ages obtained from the cores of zoned Type I uraninite grains and from some areas of the fragmented Type II uraninite have an identical range than the Re–Os ages for molybdenite samples from the ROM-0044 drill hole (Table 1 and Table 2). This agreement between the Re–Os and U–Pb data suggests that the primary uraninite-bearing veins with accessory molybdenite were formed at around 2.03–2.01 Ga at Rompas (Table 1). The origin of hydrothermal fluid flow is not known, but considering the pre-Svecofennian rift-related tectonic setting of the Peräpohja belt, it could be connected to mobilization of basin fluids.
The 207Pb/206Pb ages for uraninite are distributed between 1750 and 2075 Ma (Figure 7A) and the frequency distribution/relative probability of data show several peaks. If these data were representing domains which have been partially re-set, or mixed ages from partially or complete re-set and intact domains, then it would be expected that the frequency distribution of data is rather even without well expressed polymodal character. Moreover, the peaks on the frequency distribution/relative probability diagram of chemical ages, which were determined on randomly selected spots in the same set of samples, are largely coincident with the maxima of frequency distribution of 207Pb/206Pb ages (Figure 7). In addition, the peaks on the frequency distribution diagrams for the 207Pb/206Pb ages outline the same age intervals in different samples of Type 2 uraninite or in different growth zones of Type 1 uraninite (Table 1; Figure 3 and Figure 4). These observations suggest that the populations of 207Pb/206Pb ages for uraninite largely represent structural domains which were undisturbed, newly grown or completely re-set during the tectonic evolution of the Peräpohja belt.
Re-setting of the U–Pb system in uraninite can be related to lead loss by diffusion and recrystallization by self-annealing or fluid/mineral interaction. Calculations in [41] showed that the diffusion coefficients of lead in uraninite and titanite are comparable, thus significant Pb loss by diffusion requires approx. 600–700 °C temperature conditions. Peak metamorphism during the Svecofennian orogeny reached mid-amphibolite facies in the northern part of the Peräpohja belt (Figure 1) at around 1.85 Ga [13], thus, theoretically, it may have had caused significant or even complete lead loss by diffusion in uraninite grains at Rompas. However, many domains even in the relatively fine-grained varieties of Type 1 and Type 2 uraninite preserved older ages, thus, diffusion driven lead loss due to the thermal effect of the Svecofennian metamorphism was probably not significant. Self-annealing of radiation damage operates on the nano-scale in the crystal structure of uraninite [41,42], thus, re-distribution of lead in the structure of uraninite by that process is probably eliminated by the analysis of much larger, micron-scale volumes using electron microprobe or LA-ICP-MS techniques (like in the case of the Re–Os dating of molybdenite, where the decoupling of parent and daughter isotopes in the crystal structure requires analysis of properly homogenized fine powders of whole grains [8,34]). The texture controlled systematics of 207Pb/206Pb ages in Type 1 and Type 3 uraninite points towards the importance of fluid-driven re-crystallization in lead loss, and in formation of new generations of uraninite in certain episodes of hydrothermal fluid flow affecting the Rompas-Palokas area.
The core-rim systematics of age data for the Type 1 uraninite and populations of 207Pb/206Pb ages for Type 2 uraninite indicate precipitation of new generations of uraninite, as well as re-setting of the U–Pb system in older uraninite grains at 1.95–1.94 Ga, 1.91–1.89 Ga, 1.85 Ga, and 1.80 Ga (Figure 9). Type 3 uraninite show the youngest; 1.80 Ga ages only. Considering the model for the tectonic evolution of the Peräpohja belt proposed by [12,13], the uranium mineralization event at around 1.95 Ga took place during the Paleoproterozoic basin stage because this age is older than the maximum 1.91 Ga age of the Martimo suite sedimentary rocks (Figure 2 and Figure 9). During the extensional stages of basin evolution, re-activation of fracture systems with multiple flux of basin fluids is a rather common feature: this is exemplified by the hydrothermal uranium deposits in the McArthur River Basin in Australia [3] or in the Athabasca basin in Canada [1]. The 1.91–1.89 Ga time period corresponds to the first series of deformations (D1–D3) during the onset of the Svecofennian orogeny in the Peräpohja belt, followed by establishment of peak metamorphic conditions at around 1.85 Ga. The emplacement of late Svecofennian synkinematic granitoids (Central Lapland Granitoid Complex) between 1.85–1.80 Ga (D4) was followed by the emplacement of late- and post-Svecofennian granitoids between 1.80–1.75 Ga [11] in conjunction with the latest (D5) deformation events affecting the Peräpohja belt. This later time interval includes deposition of gold at the Rompas and Palokas areas. The 1.78 Ga age of gold mineralization at Palokas is constrained by the results Re–Os dating of molybdenite from the PRAJ009 drill hole (Table 2), because molybdenite is closely associated with native gold in this area [25]. The youngest, Type 3 uraninite with 1.80 Ga 207Pb/206Pb age, was deposited prior to the localized accumulation of gold in the Rompas area, because native gold precipitated after formation of pyrobitumen crusts around the uraninite grains, including the youngest Type 3 uraninite. This is also supported by the ~1.75 Ga model ages for radiogenic galena and altaite associated with gold in the late fractures [6].
The lower intercept concordia ages (Table 1) also indicate lead and possible uranium loss at around 100–400 Ma. Similar ranges of lower intercept concordia ages has also widely been recognized in studies targeting U–Pb dating of zircon from various rocks in the Peräpohja belt [22] or in other areas of the Finnish Lapland [42,43] and Sweden [44]. The Phanerozoic lead loss in uranium-bearing minerals is attributed to low temperature hydrothermal leaching under the thick sedimentary cover of the Caledonian orogenic foreland [44], and the occurrence of largely similar ca. 75%–85% concordance of data from different types of uraninite can also be connected to this process.
The most comprehensive geochronolgical studies on uraninite-bearing ore deposits have been completed in the Athabasca Basin and adjacent areas in Canada [1,4,45,46], as well as in the McArthur and Mt. Isa basins in Australia [3,47,48,49]. Results of these studies also demonstrated that age populations obtained by dating of uraninite usually match well with the timing of overprinting tectonic and magmatic processes.

7. Conclusions

In situ U–Pb dating of uraninite by LA-ICP-MS, and Re–Os dating of molybdenite from the Au–U mineralization at the Rompas prospect, and Au mineralization at Palokas, show that ore deposition in these areas of the Peräpohja Belt can be related to multiple, independent hydrothermal events. Primary uranium enrichment in hydrothermal veins took place during the late stages of Paleoproterozoic basin evolution at ~2.03–2.01 Ga and ~1.95 Ga. Gold deposition at both localities took place synchronously with post-Svecofennian granite magmatism at around 1.78–1.75 Ga. Comparison of the results from U–Pb dating of uraninite with the geochronologically constrained tectonic evolution of the Peräpohja belt suggests that the observed 207Pb/206Pb age populations between 1.9 and 1.8 Ga in uraninite are geologically meaningful, and can be related to major Svecofennian deformation and metamorphic events. The lower intercept concordia ages for uraninite agree with a regionally recognized Phanerozoic lead loss in uranium-bearing minerals in northern Finland, and across Scandinavia. This feature can be attributed to the effect of low temperature fluid circulation in the Svecofennian bedrock beneath sediments of post-Caledonian foreland basins.
This study also found good match between the frequency distribution/relative probability maxima of 207Pb/206Pb ages and chemical ages for uraninite from the Rompas property, suggesting that the size of uraninite domains with disturbed U–Pb system are larger than a few μm3, and individual analytical spots mostly represent domains which were completely re-set at different/independent stages of fluid/mineral interaction. Our observations also confirm that some domains in the structure of uraninite may preserve the original crystallization age, despite overprinting amphibolite facies metamorphic and other hydrothermal events which are capable of mobilizing lead and/or uranium from the crystal structure. The results of this study show the applicability of in situ U–Pb dating of uraninite using micro-analytical techniques for recognition of major stages of fluid flow and ore-forming events in a study area with a complex tectonic, magmatic and metamorphic evolution.

Supplementary Materials

The following are available online at www.mdpi.com/2075-163X/7/9/171/s1. Table S1: Results of U-Pb age dating of uraninite by LA-ICP-MS.

Acknowledgments

This work was supported by the project No. 281670 “Mineral Systems and Mineral Prospectivity in Lapland—MinSysPro” co-funded by the Academy of Finland and Geological Survey of Finland. Raimo Lahtinen and Hannu Huhma at the Geological Survey of Finland are thanked for discussions on the results of this study and comments on the interpretation of data. Constructive comments from three anonymous reviewers which supported to clarify some details of our work are also highly appreciated.

Author Contributions

Ferenc Molnár and Nick D. J. Cook conceived and designed the experiments Hugh O’Brien and Holly Stein performed the experiments; Ferenc Molnár, Hugh O’Brien and Holly Stein analyzed the data; Ferenc Molnár, Hugh O’Brien, Holly Stein and Nick D. J. Cook wrote the paper.

Conflicts of Interest

The authors declare no conflict of interest. The founding sponsors had no role in the design of the study; in the collection, analyses, or interpretation of data; in the writing of the manuscript, and in the decision to publish the results.

References

  1. Kotzer, T.G.; Kyser, T.K. O, U, and Pb isotopic and chemical variations in uraninite: Implications for determining the temporal and fluid history of ancient terrains. Am. Mineral. 1993, 78, 1262–1274. [Google Scholar]
  2. Alexandre, P.; Kyser, T.K. Effects of cationic substitutions and alteration in uraninite and implications for the dating of uranium deposits. Can. Mineral. 2005, 43, 1005–1017. [Google Scholar] [CrossRef]
  3. Polito, P.A.; Kyser, K.; Marlatt, J.; Alexandre, P.; Bajwah, Z.; Drever, G. Significance of alteration assemblages for the origin and evolution of the Proterozoic Nabarlek unconformity-related Uranium Deposit, Northern Territory, Australia. Econ. Geol. 2004, 99, 113–139. [Google Scholar]
  4. Dieng, S.; Kyser, K.; Godin, L. Tectonic history of the North American shield recorded in uranium deposits in the Beaverlodge area, northern Saskatchewan, Canada. Precambrian Res. 2013, 224, 316–340. [Google Scholar] [CrossRef]
  5. Fuchs, S.; Williams-Jones, A.E.; Jackson, S.E.; Przybylowicz, W.J. Metal distribution in pyrobitumen in the Carbon Leader Reef, Witwatersrand Supergroup, South Africa: Evidence for liquid hydrocarbon ore fluids. Chem. Geol. 2016, 426, 45–59. [Google Scholar] [CrossRef]
  6. Molnár, F.; Oduro, H.; Cook, N.D.J.; Pohjolainen, E.; Takács, Á.; O’Brien, H.; Pakkanen, L.; Johanson, B.; Wirth, R. Association of gold with uraninite and pyrobitumen in the metavolcanic rock hosted hydrothermal Au-U mineralisation at Rompas, Peräpohja Schist Belt, northern Finland. Mineral. Depos. 2016, 51, 681–702. [Google Scholar] [CrossRef]
  7. Stein, H.J.; Markey, R.J.; Morgan, J.W.; Du, A.; Sun, Y. Highly precise and accurate Re-Os ages for molybdenite from the east Qinling molybdenum belt, Shaanxi Province, China. Econ. Geol. 1997, 92, 827–835. [Google Scholar] [CrossRef]
  8. Stein, H.J.; Markey, R.J.; Morgan, J.W.; Hannah, J.L.; Scherstén, A. The remarkable Re-Os chronometer in molybdenite: How and why it works. Terra Nova 2001, 13, 479–486. [Google Scholar] [CrossRef]
  9. Raith, J.G.; Stein, H.J. Re-Os dating and sulfur isotope composition of molybdenite from tungsten deposits in western Namaqualand, South Africa: Implications for ore genesis and the timing of metamorphism. Mineral. Depos. 2000, 35, 741–753. [Google Scholar]
  10. Bingen, B.; Stein, H. Molybdenite Re-Os dating of biotite dehydration melting in the Rogaland high-temperature granulites, S Norway. Earth Planet. Sci. Lett. 2003, 208, 181–195. [Google Scholar] [CrossRef]
  11. Ranta, J.-P.; Lauri, L.S.; Hanski, E.; Huhma, H.; Lahaye, Y.; Vanhanen, E. U–Pb and Sm–Nd isotopic constraints on the evolution of the Paleoproterozoic Peräpohja Belt, northern Finland. Precambrian Res. 2015, 266, 246–259. [Google Scholar] [CrossRef]
  12. Lahtinen, R.; Huhma, H.; Lahaye, Y.; Jonsson, E.; Manninen, T.; Lauri, L.; Bergman, S.; Hellström, F.; Niiranen, T.; Nironen, M. New geochronological and Sm–Nd constraints across the Pajala shear zone of northern Fennoscandia: Reactivation of a Paleoproterozoic suture. Precambrian Res. 2015, 256, 102–119. [Google Scholar] [CrossRef]
  13. Lahtinen, R.; Sayab, M.; Karell, F. Near-orthogonal deformation successions in the poly-deformed Paleoproterozoic Martimo belt: Implications for the tectonic evolution of Northern Fennoscandia. Precambrian Res. 2015, 270, 22–38. [Google Scholar] [CrossRef]
  14. Förster, H.-J.; Rhede, D.; Stein, H.J.; Romer, R.L.; Tischendorf, G. Paired uraninite and molybdenite dating of the Königshain granite: Implications for the onset of late-Variscan magmatism in the Lausitz Block. Int. J. Earth Sci. 2012, 101, 57–67. [Google Scholar] [CrossRef]
  15. Bowles, J.F. Age dating of individual grains of uraninite in rocks from electron microprobe analyses. Chem. Geol. 1990, 83, 47–53. [Google Scholar] [CrossRef]
  16. Kouvo, O.; Tilton, G. Mineral ages from the Finnish Precambrian. J. Geol. 1996, 74, 421–442. [Google Scholar] [CrossRef]
  17. Huhma, H.; Cliff, R.; Perttunen, V.; Sakko, M. Sm-Nd and Pb isotopic study of mafic rocks associated with early Proterozoic schist belt in northern Finland. Contrib. Mineral. Petrol. 1990, 104, 369–379. [Google Scholar] [CrossRef]
  18. Perttunen, V. On the Proterozoic stratigraphy and exogenic evolution of the Peräpohja area, Finland. Geol. Surv. Finl. Bull. 1985, 331, 131–141. [Google Scholar]
  19. Perttunen, V.; Hanski, E. Pre-Quaternary Rocks of the Koivu and Törmäsjärvi Map-Sheet Areas, Explanation to the Geological Map of Finland 1:100,000, Pre-Quaternary Rocks, Sheets 3631 and 2633; Geological Survey of Finland: Espoo, Finland, 2003; p. 88, (In Finnish with English Summary).
  20. Karhu, J.A. Paleoproterozoic Evolution of the Carbon Isotope Ratios of Sedimentary Carbonates in the Fennoscandian Shield; Geological Survey of Finland: Espoo, Finland, 1993; p. 87.
  21. Hanski, E. History of stratigraphic research in northern Finland. Geol. Surv. Finl. Spec. Pap. 2001, 33, 15–43. [Google Scholar]
  22. Perttunen, V.; Vaasjoki, M. U-Pb geochronology of the Peräpohja Schist Belt, northwestern Finland. Geol. Surv. Finl. Spec. Paper 2001, 33, 45–84. [Google Scholar]
  23. Bergman, S.; Billström, K.; Persson, P.-O.; Skiöld, T.; Evins, P. U–Pb age evidence for repeated Palaeoproterozoic metamorphism and deformation near the Pajala shear zone in the northern Fennoscandian shield. GFF 2006, 128, 7–20. [Google Scholar] [CrossRef]
  24. Niironen, M. Proterozoic orogenic granitoid rocks. In Precambrian Bedrock of Finland—Key to the Evolution of the Fennoscandian Shield, 1st ed.; Lehtinen, M., Nurmi, P., Eds.; Elsevier: Amsterdam, The Netherlands, 2005; pp. 443–480. [Google Scholar]
  25. Ranta, J.P.; Hanski, E.; Cook, N.; Lahaye, Y. Source of boron in the Palokas gold deposit, northern Finland: Evidence from boron isotopes and major element composition of tourmaline. Mineral. Depos. 2017, 52, 733–746. [Google Scholar] [CrossRef]
  26. Perttunen, V.; Hanski, E.; Väänänen, J.; Eilu, P.; Lappalainen, M. Rovaniemin kartta-alueen Kallioperä. Geological Map of Finland 1:100,000. Explanation to the maps of Pre-Quaternary rocks, sheet 3612. Geol. Surv. Finl. 1996, 33, 1–42. [Google Scholar]
  27. Hudson, M. Progress Report on the Geology, Mineralization and Exploration Activities on the Rompas-Rajapalot Gold-Uranium Project, Peräpohja Schist Belt. 2013. Available online: http://mawsonresources.com/assets/docs/reports/2013-08_ni43-101-rompas.pdf (accessed on 18 September 2013).
  28. Vanhanen, E.; Cook, N.D.J.; Hudson, M.R.; Dahlenborg, L.; Ranta, J.P.; Havela, T.; Kinnunen, J.; Molnár, F.; Prave, A.R.; Oliver, N.H.S. Rompas prospect, Peräpohja Schist Belt, Northern Finland. In Mineral Deposits of Finland; Maier, W.D., O’Brien, H., Eds.; Elsevier: Amsterdam, The Netherlands, 2015; pp. 467–484. [Google Scholar]
  29. Mawson Resources. Mawson to Drill 1000 Base of Till Holes at the Rajapalot Gold Project in Finland. 2016. Available online: http://mawsonresources.com/news/news-releases/2016/mawson-to-drill-1000-base-of-till-holes-at-the-rajapalot-gold-project-in-finland (accessed on 8 March 2017).
  30. Müller, W.; Shelley, M.; Miller, P.; Broude, S. Initial performance metrics of a new custom-designed ArF excimer LA-ICPMS system coupled to a two-volume laser-ablation cell. J. Anal. At. Spectrom. 2009, 24, 209–214. [Google Scholar] [CrossRef] [Green Version]
  31. Stacey, J.S.; Kramers, J.D. Approximation of terrestrial lead isotope evolution by a two-stage model. Earth Planet. Sci. Lett. 1975, 26, 207–221. [Google Scholar] [CrossRef]
  32. Van Achterbergh, E.; Ryan, C.; Jackson, S.; Griffin, W. Data reduction software for LA-ICP-MS. In Laser-Ablation ICPMS in the Earth Sciences; Sylvester, P., Ed.; Principles and Applications, Mineralogical Association of Canada Short Course Series; Mineralogical Association of Canada: St. John, NL, Canada, 2001; pp. 239–243. [Google Scholar]
  33. Ludwig, K.R. User’s manual for Isoplot/Ex, Version 3.00. A geochronological toolkit for Microsoft Excel. Berkeley Geochronol. Center Spec. Publ. 2003, 4, 76. [Google Scholar]
  34. Stein, H.; Scherstén, A.; Hannah, J.; Markey, R. Sub-grain scale decoupling of Re and 187Os and assessment of laser ablation ICP-MS spot dating in molybdenite. Geochim. Cosmochim. Acta 2003, 67, 3673–3686. [Google Scholar] [CrossRef]
  35. Bass, D.J. Elasticity of minerals, glasses, and melts. In Mineral Physics and Crystallography: A Handbook of Physical Constants; Ahrens, T.J., Ed.; American Geophysical Union: Washington, DC, USA, 1995; Volume 2, pp. 5–63. [Google Scholar]
  36. Selby, D.; Creaser, R.A. Macroscale NTIMS and microscale LA-MC-ICP-MS Re-Os isotopic analysis of molybdenite: Testing spatial restrictions for reliable Re-Os age determinations, and implications for the decoupling of Re and Os within molybdenite. Geochim. Cosmochim. Acta 2004, 68, 3897–3908. [Google Scholar] [CrossRef]
  37. Stein, H.J. Low-rhenium molybdenite by metamorphism in northern Sweden: Recognition, genesis, and global implications. Lithos 2006, 87, 300–327. [Google Scholar] [CrossRef]
  38. Selby, D.; Creaser, R.A. Re–Os geochronology of organic rich sediments: An evaluation of organic matter analysis methods. Chem. Geol. 2003, 200, 225–240. [Google Scholar] [CrossRef]
  39. McCandless, T.E.; Ruiz, J.; Campbell, A.R. Rhenium behavior in molybdenite in hypogene and near-surface environments: Implications for Re-Os geochronometry. Geochim. Cosmochim. Acta 1993, 97, 889–905. [Google Scholar] [CrossRef]
  40. Aleinikoff, J.N.; Creaser, R.A.; Lowers, H.A.; Magee, C.W., Jr.; Grauch, R. Multiple age components in individual molybdenite grains. Chem. Geol. 2012, 300, 55–60. [Google Scholar] [CrossRef]
  41. Evins, L.Z.; Jensen, K.A.; Ewing, R.C. Uraninite recrystallization and Pb loss in the Oklo and Bangombé natural fission reactors, Gabon. Geochim. Cosmochim. Acta 2005, 69, 1589–1606. [Google Scholar] [CrossRef]
  42. Rastas, P.; Huhma, H.; Hanski, E.; Lehtonen, M.I.; Paakkola, J.; Mänttäri, I.; Härkönen, I. U-Pb isotopic studies on the Kittilä greenstone area, central Lapland, Finland. In Radiometric Age Determinations from Finnish Lapland and Their Bearing on the Timing of Precambrian Volcano-Sedimentary Sequences; Vaasjoki, M., Ed.; Geological Survey of Finland: Espoo, Finland, 2001; Volume 33, pp. 95–141. [Google Scholar]
  43. Räsänen, J.; Huhma, H. U-Pb dating in the Sodankylä schist area of the Central Lapland Greenstone Belt. In Radiometric Age Determinations from Finnish Lapland and Their Bearing on the Timing of Precambrian Volcano-Sedimentary Sequences; Vaasjoki, M., Ed.; Geological Survey of Finland: Espoo, Finland, 2001; Volume 33, pp. 153–188. [Google Scholar]
  44. Larson, S.Å.; Tullborg, E.L. Why Baltic Shield zircons yield late Paleozoic, lower-intercept ages on U–Pb Concordia. Geology 1998, 26, 919–922. [Google Scholar] [CrossRef]
  45. Alexandre, P.; Kyser, K.; Jiricka, D.; Witt, G. Formation and evolution of the centennial unconformity related uranium deposit in the South-Central Athabasca Basin, Canada. Econ. Geol. 2012, 107, 385–400. [Google Scholar] [CrossRef]
  46. Mercadier, J.; Annesley, I.R.; McKechnie, C.L.; Bogdan, T.S.; Creighton, S. Magmatic and metamorphic uraninite mineralization in the western margin of the Trans-Hudson orogen (Saskatchewan, Canada): A uranium source for unconformity-related uranium deposits? Econ. Geol. 2013, 108, 1037–1065. [Google Scholar] [CrossRef]
  47. Polito, P.A.; Kyser, K.; Thomas, D.; Marlatt, J.; Drever, G. Re-evaluation of the petrogenesis of the Proterozoic Jabiluka unconformity-related uranium deposit, Northern Territory, Australia. Mineral. Depos. 2005, 40, 257–288. [Google Scholar] [CrossRef]
  48. Chipley, D.; Polito, P.A.; Kyser, K. Measurement of U–Pb ages of uraninite and davidite by laser ablation-HR-ICP-MS. Am. Mineral. 2007, 92, 1925–1935. [Google Scholar] [CrossRef]
  49. Skirrow, R.G.; Mercadier, J.; Armstrong, R.; Kuske, T.; Deloule, E. The Ranger uranium deposit, northern Australia: Timing constraints, regional and ore-related alteration, and genetic implications for unconformity-related mineralization. Ore Geol. Rev. 2016, 76, 463–503. [Google Scholar] [CrossRef]
Figure 1. Regional geology and metamorphic zoning in the Peräpohja belt and location of the Rompas Au–U deposit. Simplified base map and metamorphic map from the DigiKP Finland geographic information system GIS database of Geological Survey of Finland as of July 2017.
Minerals 07 00171 g001
Figure 2. Local geology at the Rompas and Palokas properties and location of samples used in this study and previous geochronological studies. Modified after [6] using new interpretations by Mawson Resources.
Minerals 07 00171 g002
Figure 3. Reflected light photomicrographs (AF) and SEM-BSE images (GI) showing textural varieties of uraninite and locations of some U–Pb analytical spots with ages (Ma). (A) Type 1 uraninite with spongy mottled cores and smooth rims and native gold between uraninite grains; (B) Type 1 uraninite with native gold in the fractures of the smooth rim of the uraninite crystal and location of U–Pb spot analyses. Note the significant differences between the 207Pb/206Pb ages in the spongy mottled cores and smooth rims. (C) Type 1 uraninite with native gold in the fracture and surface of the smooth rims of crystals and locations of U–Pb spot analyses. (D) Type 2 uraninite grains in carbonate matrix and galena in the fractures of uraninite grains. Galena has high radiogenic Pb isotope content [6]. (E) Type 2 uraninite grains with galena and native gold in fractures. (F) Type 3 uraninite grains encompassed by pyrobitumen. (G) Late fracture with Type 3 uraninite and pyrobitumen. (H) High resolution SEM-BSE photograph taken on Type 3 uraninite grains encompassed by pyrobitumen. Note the altered rims consisting of coffinite and silica on uraninite grains. (I) Type 3 uraninite grains in a pyrobitumen nodule.
Minerals 07 00171 g003
Figure 4. Frequency distribution diagrams for 207Pb/206Pb ages and Wetherill concordia diagrams for the cores and rims of Type 1 uraninite. Black ellipses on the Wetherill diagrams mark data which were excluded from the regression of discordia lines.
Minerals 07 00171 g004
Figure 5. Frequency distribution diagrams for 207Pb/206Pb ages and Wetherill concordia diagrams for Type 2 uraninite in different samples. Black ellipses on the Wetherill diagrams mark data which were excluded from the regression of discordia lines.
Minerals 07 00171 g005
Figure 6. Frequency distribution diagrams for 207Pb/206Pb ages and Wetherill concordia diagrams for Type 3 uraninite (sample #24041346).
Minerals 07 00171 g006
Figure 7. Frequency distribution/relative probability diagrams for 207Pb/206Pb ages (A) and chemical ages (B) of uraninite for the samples in this study. Chemical ages shown on this figure are from the same set of samples which were used for in situ U–Pb age dating of uraninite by LA-ICP-MS, and can be found in the electronic Supplement Table S1 in [6]. Thirty-two chemical age datapoints (not shown on this figure) are widely scattered, with low frequencies between 1700 and 400 million years, reflecting the effect of the Phanerozoic lead loss identified in the dataset of the U–Pb age dating.
Minerals 07 00171 g007
Figure 8. Molybdenite samples from the Palokas (A) and Rompas (B) properties. Molybdenite flakes (mol) on the photograph “B” show different shades of grey because of the strong bireflectance under incident polarized light in the microscope.
Minerals 07 00171 g008
Figure 9. Comparison of results of U–Pb dating of uraninite (207Pb/206Pb ages) and Re–Os dating of molybdenite with data from other geochronological studies completed near the Rompas and Palokas prospects, and comparison of these data with the ages for the major tectonic stages of the Svecofennian orogeny.
Minerals 07 00171 g009
Table 1. Summary of the results of the U–Pb dating of uraninite from the Rompas prospect.
Sample No., Locality, CharacteristicsTextural Type of UraniniteNo. of Spots207Pb/206PbLower Intercept Concordia Age ± 2σ Ma Upper Intercept Concordia Age ± 2σ MaMSWDAverage 207Pb/206Pb Age ± 2σ MaMSWD
#104793 outcrop sample high grade goldType 1, zoned uraninite grains mottled-spongy cores80.1213–0.1286204 ± 1302022 ± 227.32028 ± 3123
80.1113–0.1174123 ± 1101912 ± 241.81888 ± 102.1
Type 1, zoned uraninite grains, homogeneous/smooth rims120.1153–0.1199---1902 ± 103.2
90.1125–0.1145---1853 ± 81.8
30.1090–0.1112---~1805-
#24041365 ROM-0011 7.65–7.70 m high grade gold, no pyrobitumenType 2, breccia fragments100.1185–0.1210-10 ± 2001951 ± 281.31952 ± 101.2
70.1148–0.1164148 ± 2401910 ± 430.41887 ± 90.5
#24041367 ROM-0011 12.30–12.57 m high grade gold, pyrobitumenType 2, breccia fragments 50.1216–0.1238433 ± 2402079 ± 630.32006 ± 3213
90.1187–0.1204172 ± 1901975 ± 291.71952 ± 71.7
180.1153–0.118261 ± 731916 ± 132.41907 ± 62.7
40.1094–01133---1827 ± 4613
#24041374 ROM-0011 115.0–115.06 m high grade gold, pyrobitumenType 2, breccia fragments 60.1224–0.1253182 ± 3102035 ± 522.32009 ± 192.1
70.1179–0.1212364 ± 2102007 ± 521.31940 ± 203.1
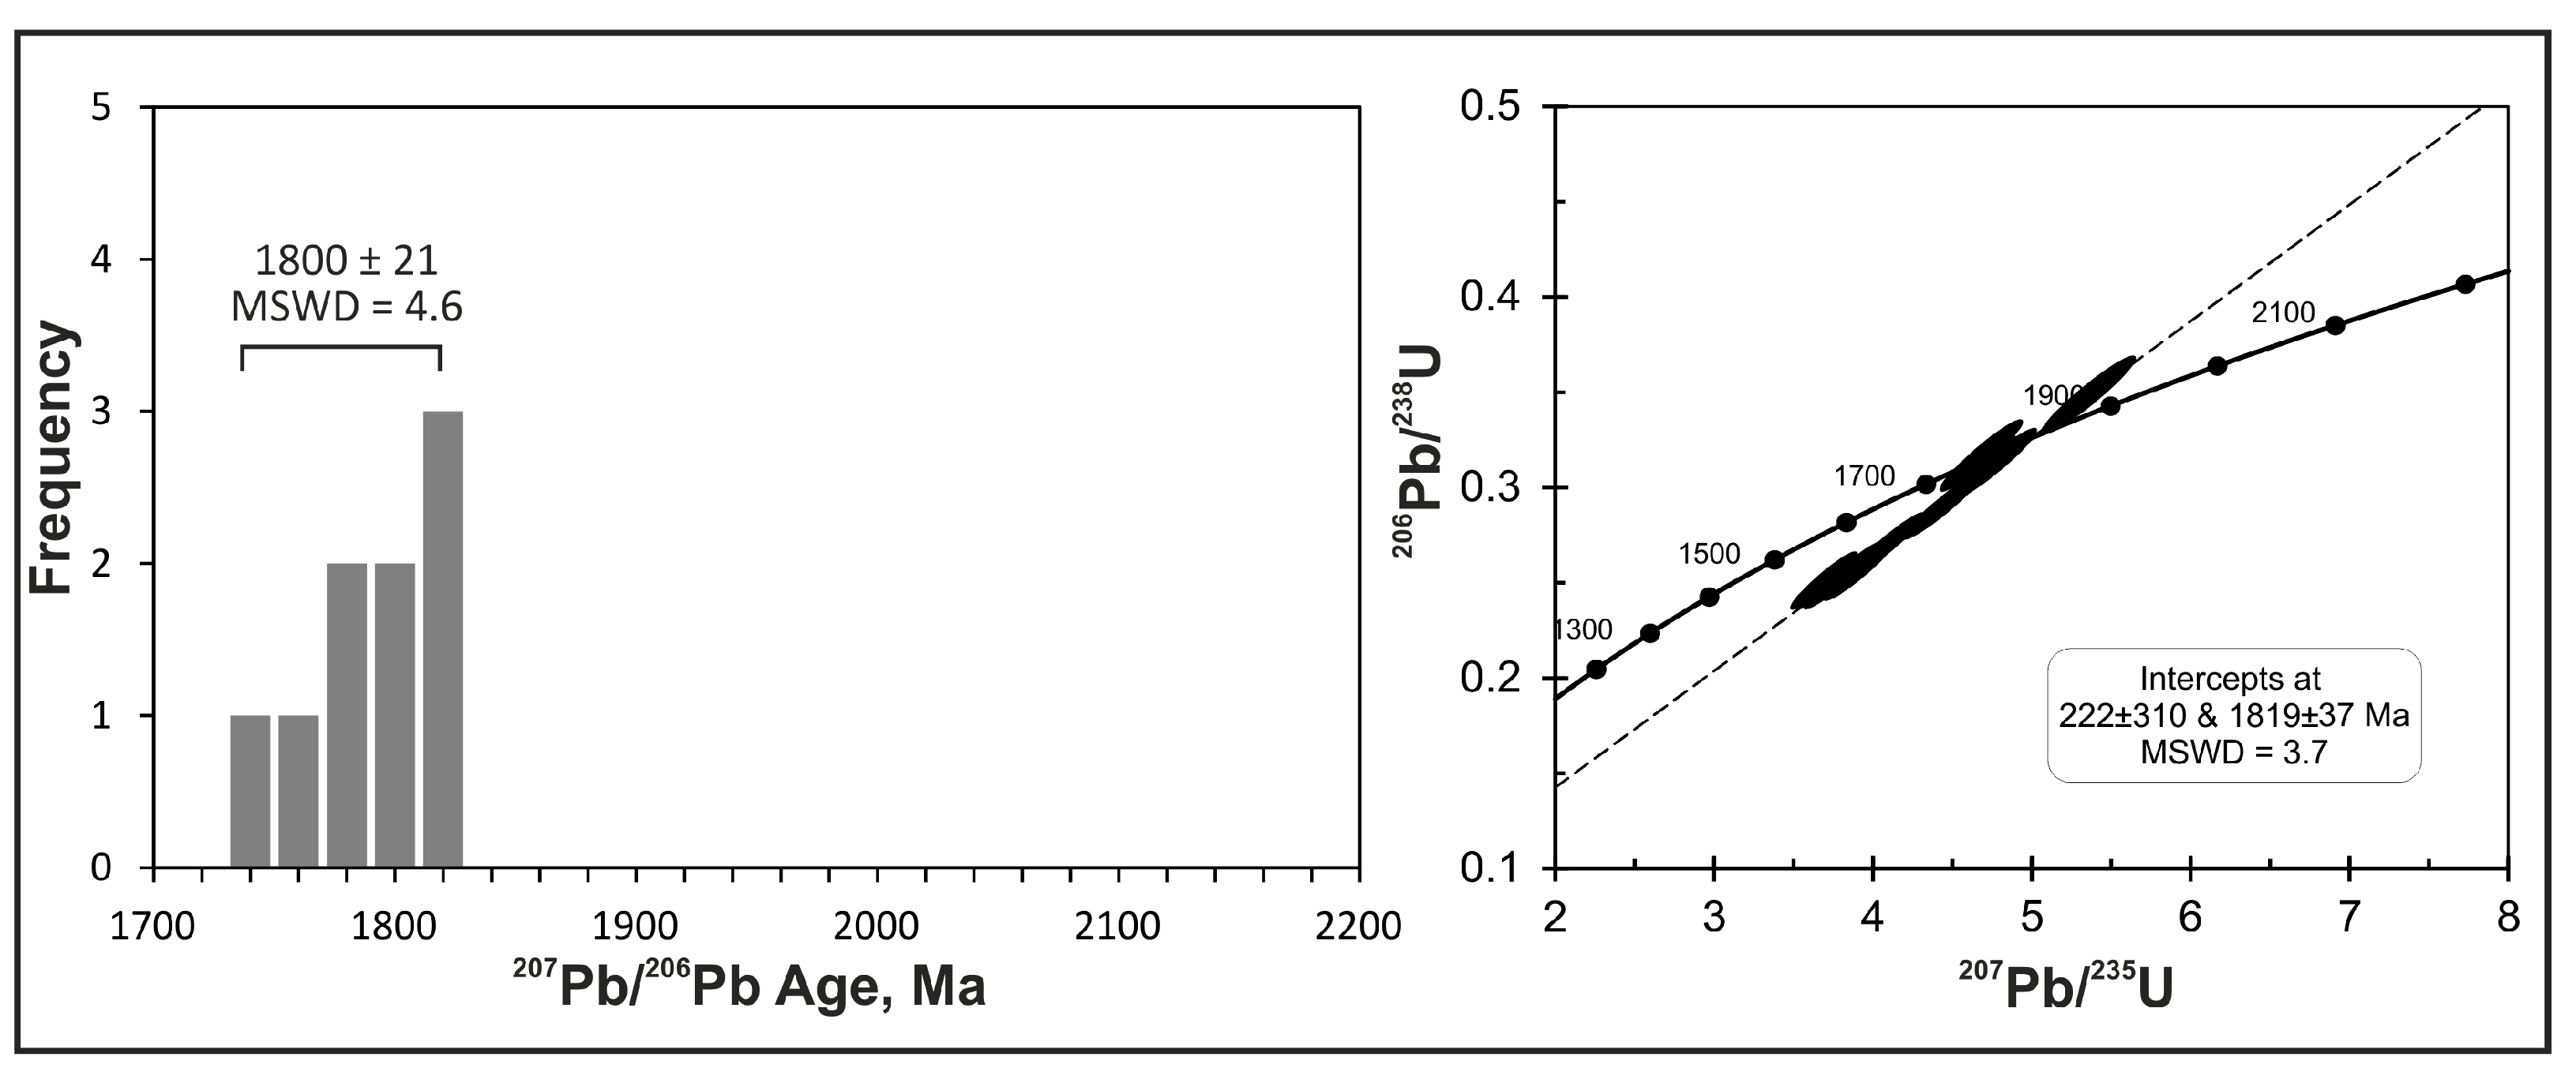
#23041346 ROM-0044 10.97–11.20 m no gold, pyrobitumenType 3, round grains 90.1072–0.1114222 ± 3101819 ± 373.71800 ± 214.6
Table 2. Re–Os data (TIMS) for molybdenite samples from the Rompas and Palokas prospects.
AIRIE Run #Sample Core and Depth, Identification NumberVisual Estimate of Molybdenite in SeparateRe (ppm)Re Error (ppm)187Os (ppb)187Os Error (ppb)Age (Ma)Error (Ma)Sample Weight (mg)
Palokas
MD-1429PRAJ0009, 6.96 m, #23929180%302.81.95722.04.617781335.3
MD-1439PRAJ0009, 6.96 m, #239291, (b, same)80%320.830.376076.94.91782614.4
Rompas
MD-1435ROM-0044, 10.97–11.20 m, #2304134630%70.650.131537.61.22043815.7
MD-1613ROM-0044, 10.97–11.20 m, #23041346 (b, new)60%109.600.172361.91.82023716.9
MD-1434ROM-0044, 24.0–24.16 m, #230413513 crystals, <0.1 mm, guided by SEM photos1.5810.00533.8030.0272007911.3
Re-Os isotopic data acquired by Carius tube dissolution and sample-spike equilibration with a mixed Re-double Os spike; concentration data and age uncertainties all at 2-sigma; Re and Os isotopic ratios measured by negative thermal ionization mass spectrometry (NTIMS), AIRIE Program, Colorado State University; reported ages used assumed initial Os ratio = 0.2; Ages reported include decay constant uncertainty (lambda) for 187Re; they can be compared directly with U-Pb ages; For all samples, common Os was measured at <1 ppt, insignificant to the age calculation; Os data reported are corrected for instrumental mass fractionation; Run MD-1429 underspiked for Re; corrected in run MD-1439 using same mineral separate (b, same); agreement is very good at the 2-sigma level of uncertainty; Run MD-1435 was rerun using a new mineral separates in MD-1613 (b, new); agreement is outside of 2-sigma analyti cal error suggesting geologic variability; Runs MD-1429, MD-1434, MD-1435, MD-1439, Re blank = 3.184 ± 0.039 pg, Os blank = 0.174 ± 0.012 pg with 187Os/188Os = 0.313 ± 0.017; For run MD-1613, Re blank = 0.557 ± 0.017 pg, Os blank = 0.122 ± 0.005 pg with 187Os/188Os = 0.550 ± 0.009.

