Article

CO2 Absorption and Magnesium Carbonate Precipitation in MgCl2–NH3–NH4Cl Solutions: Implications for Carbon Capture and Storage

1
School of Earth Sciences and Engineering, Nanjing University, Nanjing 210046, China
2
Department of Earth Sciences, University of Southern California, Los Angeles, CA 90089, USA
3
Department of Chemistry, The George Washington University, Washington, DC 20052, USA
*
Author to whom correspondence should be addressed.
Minerals 2017, 7(9), 172; https://doi.org/10.3390/min7090172
Submission received: 23 August 2017 / Revised: 5 September 2017 / Accepted: 11 September 2017 / Published: 19 September 2017
(This article belongs to the Special Issue Carbon Capture and Storage via Mineral Carbonation)

Abstract

:
CO2 absorption and carbonate precipitation are the two core processes controlling the reaction rate and path of CO2 mineral sequestration. Whereas previous studies have focused on testing reactive crystallization and precipitation kinetics, much less attention has been paid to absorption, the key process determining the removal efficiency of CO2. In this study, adopting a novel wetted wall column reactor, we systematically explore the rates and mechanisms of carbon transformation from CO2 gas to carbonates in MgCl2–NH3–NH4Cl solutions. We find that reactive diffusion in liquid film of the wetted wall column is the rate-limiting step of CO2 absorption when proceeding chiefly through interactions between CO2(aq) and NH3(aq). We further quantified the reaction kinetic constant of the CO2–NH3 reaction. Our results indicate that higher initial concentration of NH4Cl ( 2   mol · L 1 ) leads to the precipitation of roguinite [ ( NH 4 ) 2 Mg ( CO 3 ) 2 · 4 H 2 O ], while nesquehonite appears to be the dominant Mg-carbonate without NH4Cl addition. We also noticed dypingite formation via phase transformation in hot water. This study provides new insight into the reaction kinetics of CO2 mineral carbonation that indicates the potential of this technique for future application to industrial-scale CO2 sequestration.

1. Introduction

1.1. CO2 Mineral Sequestration

Among the currently recognized strategies for Carbon Capture and Storage (CCS), sequestering atmospheric CO2 in mineral forms, as first introduced by Seifritz [1], is the only known approach to permanent CO2 storage. Mineral carbon sequestration mainly uses naturally abundant material resources like Mg-silicates [2,3] to react with atmospheric CO2 to form carbonate minerals. Compared to other options (e.g., storing CO2 in geological reservoirs like bedrock), mineral carbon sequestration has two major advantages: nearly unlimited raw material supplement, and relatively longer-term storage (>1 Myr, over geological timescales) [4]. However, at the Earth’s surface conditions, the rate of the silicate-CO2 reaction, or carbonation, is quite low (~10−10 to 10−17 mol · m 2 · s 1 ) [5]. To accelerate the reaction rate, several strategies have been tested, including increasing the ambient temperature and CO2 pressure, enhancing the reactive surface areas of silicates [6,7,8], and removing the passivating layer on minerals [2,3,9,10]. Although those procedures show promise, they are often energy-intensive, making the carbonation process expensive and less practical [11].
The last decades have seen significant advances in the development of techniques aiming at economic and energy-efficient mineral carbon sequestration. Many groups have made efforts to accelerate silicate-CO2 reaction rates. Notably, a pH-swing reaction path, which separated divalent ion leaching and carbonation process, was developed and proven to effectively enhance the mineral dissolution rate and optimize carbonate precipitation [12,13]. Extensive studies have focused on the mineral dissolution process. Among the many materials tested, magnesium-rich materials are thought to be good candidates for carbonation due to their natural abundance [14] and relatively higher unit mass binding efficiency (e.g., as compared to calcium). For example, physical activation (grinding [15,16,17] or heating [18,19]), chemical leaching (acid [20,21,22], recyclable ammonium salt [23,24] or non-acidic ionic solutions [25]), bioleaching [26,27] were applied to Mg rich minerals to dissolve and concentrate Mg. However, the other CO2 absorption and carbonate precipitation steps have been less explored. Only a few studies have focused on testing the reactive absorption and precipitation using materials extracted from natural minerals. Soluble barium salt was used to absorb CO2 via reactive crystallization [28,29,30], but was limited by the low natural abundance and toxicity. Ca(OH)2 was also a possible absorbent [31,32], but Ca(OH)2 solid is usually produced from CaCO3 with CO2 as a byproduct, negating its sequestering function. Reactive absorption of CO2 in alkaline MgCl2 solutions [33] or Mg(OH)2 slurries successfully precipitated nesquehonite (MgCO3·3H2O), a common mineral, at Earth’s surface conditions [34,35]. Yet, the reaction kinetics of CO2 absorption and carbonate precipitation in Mg solutions remains insufficiently understood. Specifically, few studies have investigated the CO2 mass transfer processes on the gas-liquid interface, or how precipitated minerals vary under elevated ammonium nitrogen concentrations apart from temperature, duration, and Mg/Ca ratio [36,37,38].
To fill the knowledge gap, we systematically investigated the reaction kinetics and mass transfer process in CO2–MgCl2–NH3–NH4Cl solutions, as a case study to understand CO2 absorption and precipitation in Mg solutions. Our work combined theoretical modeling of solution chemistry and laboratory experiments. We carefully designed and optimized the solution recipes via geochemical modeling. We built a novel wetted wall column device and conducted a series of controlled experiments of CO2 absorption and precipitation. We calculated reaction kinetic parameters and discussed the potential controlling factors. We studied how the precipitation products change under different conditions, and developed original methods to obtain industrially useful Mg carbonates. Our work contributes to a better understanding of the CO2 absorption and precipitation processes in industrially practical systems (e.g., CO2–Mg solutions), and provides valuable information for the design of absorption devices and optimizing absorbent composition.

1.2. Chemistry and Kinetics of the CO2–MgCl2–NH3–NH4Cl System

A brief introduction to the aqueous phase reactions after gaseous CO2 diffusing into the solution, together with the associated kinetic equations, is given below. After entering the aqueous phase, CO2 reacts with water, hydroxide ions, and ammonia simultaneously [39,40,41]. This process can be expressed by the following chemical reactions:
CO 2 ( aq )   +   H 2 O HCO 3   +   H +
CO 2 ( aq ) +   OH   HCO 3
CO 2 ( aq )   +   2 NH 3 ( aq ) NH 2 COO   +   NH 4 +
Equation (1) combines the hydration of CO2 with rapid dissociation to HCO 3 and H + , and its reaction rate can be written as:
r CO 2 H 2 O   =   k H 2 O ' C CO 2
where r CO 2 H 2 O is the rate of reactions between CO2 and water, k H 2 O ' is the rate constant, and C CO 2 represent the concentration of CO2. The temperature (T, in Kelvin) dependence of rate constant ( k H 2 O , in s 1 ) has been determined previously [42] as:
log ( k H 2 O ' )   =   329.850     110.541 log ( T )     ( 17,265.4 / T )
Under experimental conditions (T = 298.15 K), k H 2 O ' is 0.026 s 1 . Similarly, the reaction rate constant of Equation (2), given in m 3 · mol 1 · s 1 , is
log ( k OH )   =   10.635     ( 2895 / T )
which is 8.41 m 3 · mol 1 · s 1 at 298.15 K [42].
For the reaction (Equation (3)) between CO 2 ( aq ) and NH 3 ( aq ) , a multi-step zwitterion mechanism is often used [40]: A CO2 molecule reacts with an ammonia molecule to form a zwitterion, then gets deprotonated by bases (e.g., NH3, OH, and H2O) in solution to form carbamate. For the carbamate, a hydrolytic reaction may occur to convert carbamate to bicarbonate. The detailed reaction paths of Equation (3) are:
CO 2 ( aq ) +   NH 3 k 2 / k 1   N H 3 COO
N H 3 COO   +   Base   k b   NH 2 COO   +   BaseH +
NH 2 COO   +   H 2 O     NH 3   +   HCO 3 .
Combining Equations (3) and (7)–(9), the rate expression for Equation (3) can be obtained as:
r CO 2 NH 3   =   C CO 2 C NH 3 ( 1 k 2 )   +   ( k 1 k 2 ) ( 1 b k b C B ) ,
where b represents any base in the solution and C B is their concentrations.   k 2 and k 1 are the forward and backward rate constant of Equation (7), respectively. In this case, a base can be a water molecule, hydroxide ions, or ammonia. Replacing the base using the specific molecules, Equation (10) can be rewritten as:
r CO 2 NH 3   =   C CO 2 C NH 3 ( 1 k 2 )   +   ( k 1 k 2 ) ( 1 k b , H 2 O C H 2 O   +   k b ,   OH k OH   +   k b , NH 3 C NH 3 )
Note that in this work, ammonia is introduced as a base to bind hydrogen ions and buffer pH change.
NH 3   +   H +     NH 4 +
The bicarbonate resultant from Equations (1), (2), and (9) transforms into carbonate and carbonic acid through
HCO 3     CO 3 2   +   H +
HCO 3   +   H +     H 2 CO 3
When Mg 2 + is present, various forms of magnesium carbonates can precipitate from saturated solution [43,44,45]. The anhydrous form of Mg-carbonate, magnesite ( MgCO 3 ), is usually difficult to precipitate under ambient conditions, but relatively easier under elevated CO2 pressure and temperature (>90 °C), likely caused by the high hydration energy of Mg2+ ions in aqueous solution [46]. A highly hydrated Mg-carbonate, lansfordite ( MgCO 3 · 5 H 2 O ), appears near the freezing point of water (4~9 °C). Other hydrated Mg-carbonates, such as nesquehonite ( MgCO 3 · 3 H 2 O ), hydromagnesite ( Mg 5 ( CO 3 ) 4 ( OH ) 2 · 4 H 2 O ), and dypingite ( Mg 5 ( CO 3 ) 4 ( OH ) 2 · 5 H 2 O ), can form within wider ranges of temperature and pressure. Nesquehonite is a common magnesium carbonate precipitated under experimental conditions at room temperature and CO2 pressure due to its kinetic advancement [47]. However, the natural occurrence of nesquehonite in large deposition is rather rare compared with other magnesium carbonates, such as hydromagnesite [48], magnesite [49,50], etc. Fresh nesquehonite can be seen under low temperature in a natural environment (e.g., [51,52,53]). Although it is not abundant, field and experimental evidence shows that nesquehonite could act as a precursor of more abundant hydromagnesite or magnesite [43,50,54], and dypingite is a transitory phase during this transformation [36,55]. Temperature, fluid pH, and CO2 partial pressure are important parameters of phase transformation [55,56]. A generalized reaction equation representing the precipitation of these Mg-carbonates can be written as:
( x   +   y ) Mg 2 +   +   x CO 3 2   +   2 y OH   +   z H 2 O   x MgCO 3 · y Mg ( OH ) 2 · z H 2 O ( s ) .
In solutions with more complex compositions, magnesium can form a crystalline double carbonate with the alkali metals in the form of R 2 CO 3 · MgCO 3 · 4 H 2 O , where R represents K + , Rb + , Cs + , and NH 4 + .

2. Materials and Methods

2.1. Reagents

We chose magnesium chloride hexahydrate (MgCl2·6H2O) as the magnesium source material, and ammonia as the base to adjust the solution pH. Analytical graded aqueous NH3 solution (28 wt %, produced by Nanjing Chemical Reagent Co., Ltd., Nanjing, China), was used to adjust the solution pH. Distilled deionized water produced by a High-techTM ultra-pure water system (resistivity >18.0 M Ω · cm ) was used to wash any precipitated solid product and to dissolve analytical graded MgCl2 · 6H2O and NH4Cl solids (produced by Nanjing Chemical Reagent Co., Ltd.) to make the desired solutions. Diluted HCl (0.1 mol · L 1 ) solution was also used to clean the liquid system after each run. The CO2-N2 mixture with a specified CO2 concentration was made by mixing pure (>99.99%) CO2 and N2 from gas cylinders, with their proportions regulated by flow rate controllers.

2.2. Absorption Experiments

To investigate CO2 absorption and Mg-carbonate precipitation kinetics in detail, we adopted a wetted wall column device that was originally designed for gas-liquid reaction, and updated the device to make it suitable for the study of triple phase reaction kinetics (Figure 1). A detailed description and the testing results of the device are reported in Zhu et al. (2016) [57]. We briefly introduce the key components and functions here. The core of the column (Figure 1a) was made of a hollow stainless tube, allowing homogeneous distribution of liquid film on its outer surface, forming a uniform gas-liquid contact layer with a film thickness of 0.29 mm and a total area ( a ) of 3364 mm2. The mole amount of CO2 aborted within a certain time interval (~1 s) was calculated by measuring the difference of CO2 flux between gas inlet ( n i i n ) and outlet ( n i o u t ) based on the ideal gas law ( P V   =   n R T ). A crystallizer was attached to the wetted wall column, allowing precipitation of solids and solution sampling, while solution pH was kept constant by a proportional integral (PI) control sequence managing NH3 addition. The pH in both the wetted wall column and the crystallizer was kept constant by circulating the solution through two peristaltic pumps (E in Figure 1b).
A normal experimental run starts with purging the reaction chamber with N2 and rinsing the liquid tubing using deionized water and the reaction solution. Subsequently, the peristaltic pumps were started up after filling the glass reactor with 660 mL of the reaction solution. Formation of homogenous liquid film was confirmed by a visual check. Next, the reaction chamber was bypassed and CO2 was introduced into the gas line. The volumetric fraction of CO2 was determined by a non-dispersive infrared (NDIR) gas analyzer (15.0% for all experiments). Once the solution reached set temperature, the CO2–N2 mixture was fed into the reaction chamber, and the pH control sequence was launched. Real-time experimental status was monitored and recorded, including all parameters of interests such as room temperature, solution pH, solution temperature, base adding rate, solution transmittance, reaction chamber temperature, and the CO2 volumetric fraction at the gas outlet. An individual experiment runs end when the solution transmittance reaches a stable reading. Afterwards, diluted hydrochloric acid was used to wash the entire liquid line and the reaction chamber, to eliminate potential crystal seed contamination. Solution samples from experiments C, E, F, and G (Table 1) were collected and filtered at certain time intervals (20–30 min). The filtrate was acidized immediately to avoid nitrogen loss due to vaporization. Total ammonium nitrogen was measured using the distillation and titration method. The total carbon (TC, in mole) absorbed into the solution was calculated using the equation below:
TC ( t )   =   0 i = t ( n i i n n i o u t )
where t is the sampling time, and n i i n and n i o u t represent the amount of CO2 absorbed (mol) during the time interval (~1 s) in and out of the wetted wall column, respectively. Thus, the experimental absorption rate ( φ CO 2 ) is defined as
φ CO 2   =   TC ( t 2 )     TC ( t 1 ) ( t 2     t 1 ) a
Note that for experiments H and I, a uniform liquid film is difficult to maintain, thus the CO2 absorption rate data of these experiments are unavailable. A pre-established CO2 absorption baseline, which uses NaOH solution (pH = 9.00, 25 °C, experiment X) as the absorbent [57], was adopted to run parallel experiments for comparison to the previous experiments run in NH3 solutions, for the purpose of revealing the role of NH3 in absorption.

2.3. Mg-Carbonate Precipitation and Phase Transformation Experiments

The solid products produced after each absorption experiment were filtered and air-dried, followed by X-ray powder diffraction (XRD) characterization (Rigaku, DMX-IIIA, Tokyo, Japan). Mg concentration in the solution sample from experiment C was analyzed by an inductively coupled plasma atomic emission spectrometer (ICP-AES, Thermo Scientific, iCAP 6000, Waltham, MA, USA). The amount of Mg precipitated was then calculated by subtracting the remaining Mg in solution from the total initial Mg in system. If the precipitated Mg-carbonate was nesquehonite, the amount of carbon (mol) removed from the solution was determined as equivalent to the amount of precipitated Mg, and the dissolved inorganic carbon (DIC) was calculated by subtracting the precipitated carbon from the TC absorbed. The obtained data were then used to estimate the saturation state of nesquehonite.
If non-nesquehonite Mg-carbonate was precipitated (e.g., roguinite in this study), solid phase transformation experiments were then conducted to obtain nesquehonite or more stable basic magnesium carbonate hydrate due to their diverse industrial applications. Specifically, 5 g of air-dried solid product from experiment I (Table 1) were placed in a 100 mL flask and further washed using 50 mL distilled deionized water. The slurry was then set in a water bath and stirred for 1 h under various temperature settings (20 °C, 50 °C, and 80 °C). After washing, the mixture was filtered and characterized using XRD.

2.4. Theoretical Modeling of Solution Chemistry

Our previous studies concerning nesquehonite nucleation [58,59] demonstrated the importance of precise control of solution chemistry in avoiding Mg(OH)2 precipitation (e.g., brucite). In the present work, we constrained solution chemistry based upon the results of equilibrium modeling. Assuming fast ionic reactions, sauturation index (SI, the logarithm of saturation degree ( Ω   =   IAP / K s p ) to the base 10, where IAP and K s p represent the ionic activity product and solubility product respectively) of both nesquehonite and brucite under various total carbon and ammonium nitrogen concentration were calculated using the PHREEQC program (a computer program for aqueous geochemical calculations). pH was allowed to drift, while Mg concentration was set at 0.10 mol · L 1 during modeling. Such equilibrium treatment of bulk solution chemistry would introduce ~8% uncertainty according to our previous test [57]. To avoid the formation of brucite, a common co-product at high pH, and to form pure nesquehonite, the solution should be supersaturated with respect to nesquehonite and unsaturated to brucite. During CO2 absorption, ammonia was added to adjust pH, because the solution pH was also a key factor determining precipitated minerals and would decrease with the accumulation of carbon species. As shown in Figure 2 (shaded area), once the concentrations of ammonia and carbon are carefully controlled at any given Mg concentration, pure nesquehonite can be obtained with no precipitation of brucite. Such a state can be maintained throughout the whole process of CO2 absorption and Mg-carbonate precipitation. For reference, Table 2 shows the equilibrium constants of several reactions and their sources. For the other Mg-carbonate, roguinite, thermodynamic data are unavailable.

3. Results

In this section, we report our results from the experiments of CO2 absorption under various initial Mg concentrations and pH values, and of Mg-carbonate precipitation under different ammonium concentrations.

3.1. CO2 Absorption under Changing Mg Initial Concentration

Figure 3a shows how the total carbon absorbed (TC) evolves over time under variable initial Mg concentrations from 0.00 to 0.20 mol · L 1 . The overall trends of TC evolution with time are similar despite the varying Mg concentrations. The averaged initial absorption rate (for the first two minutes of absorption, Figure 3b) of those experiments is 8.38(74) × 10−4 mol · m 2 · s 1 , close to that of NaOH absorption baseline (experiment X, 7.70 × 10⁻⁴ mol · m 2 · s 1 ). The instantaneous CO2 absorption rate increases over time in the NH3 system but not in the NaOH system. The averaged final absorption rate (in a span of four hours) between experiment A–E is 1.28(4) × 10−3 mol · m 2 · s 1 , which is almost double that of experiment X (also 7.70 × 10⁻⁴ mol · m 2 · s 1 ). The increased CO2 absorption rates over time indicate kinetic accelerations of the CO2–NH3–MgCl2 system. The normalized deviations in both initial and final absorption rates over experiments A–E, 8.8% and 3.5%, respectively, are insignificant, suggesting that changing initial Mg concentration has a limited effect on the CO2 absorption. The initial Mg concentration does seem to affect the timing of nesquehonite’s first occurrence. As shown in Table 1, no Mg-carbonate appears when Mg concentration is zero, and a higher initial Mg concentration shortens the time lag of nesquehonite precipitation (from 3.6 h at 0.05 mol · L 1 to 2.2 h at 0.2 mol · L 1 ). Another interesting observation is that experiments A–E all have similar, smooth, and continuous TC-time curves, suggesting that precipitation does not seem to lead to abrupt change in the absorption process.

3.2. CO2 Absorption under Changing Solution pH

Figure 4a shows the TC-time curves for experiments C, E, F and G under the same initial Mg concentration ( C M g 0 = 0.10 mol · L 1 ) but different pH values (from 8.76 to 9.74). Different from Figure 3a, the TC-time curves in Figure 4a separate from each other more significantly, pointing to a stronger pH effect on CO2 absorption kinetics.
Although these experiments share similar initial CO2 absorption rates (averaged over the first two minutes ~8(1) × 10−4 mol · m 2 · s 1 , Figure 4b), those with higher pH lead to a faster four hour-averaged absorption rate (0.97 to 3.76 × 10⁻³ mol · m 2 · s 1 ). The delay for nesquehonite precipitation also shortens with increasing pH, from 3.1 h at pH 8.76 to 1.2 h at pH 9.74 (Table 1).

3.3. Mg-Carbonate Precipitated under Changing Ammonium Concentration and Its Purification

In solutions without initial NH4Cl addition (experiments A–G), nesquehonite is the main precipitate, as revealed by XRD (Figure 5 and Table 1). However, with higher initial NH4Cl concentration (>2 mol · L 1 ), roguinite starts to form (Figure 5a). Pure roguinite appeared when initial NH4Cl reached 6.7 mol L1, but transformed to nesquehonite at 20–50 °C (Figure 5b) and dypingite at 80 °C when washing at such a temperature.

4. Discussion

In this section, we first simulate the temporal evolution of solution components under constant pH conditions to detail solution chemistry. We next build a model to link solution chemistry to CO2 absorption rate, and use the model to discuss the CO2 absorption kinetics quantitatively. Finally, we discuss Mg-carbonate precipitation kinetics and the mineral forms of the products.

4.1. Modeling of Solution Chemistry and Temporal Evolution

To characterize the dynamic nature of the reaction, the temporal evolution of primary and secondary species during experiments is simulated using the PHREEQC program. Several parameters are imported: (1) DIC concentration values, which are calculated by subtracting precipitated carbon from TC before passed to PHREEQC program. Since Mg/C ratio in nesquehonite structure is 1:1, precipitated carbon can be calculated through subtracting measured Mg concentrations from initio Mg concentration; (2) Concentrations of Cl, which are set to double the initial Mg concentration; (3) Measured Mg concentrations in solution; (4) Measured pH values; (5) With the knowledge of DIC, Mg, and Cl concentrations and pH, the concentration of total ammonium nitrogen (TN) can be calculated through charge balance. Finally, solution speciation equations are solved automatically by PHREEQC.
Figure 6 shows the modeled temporal evolution curves of the solution species, with pH maintained at 9.00 and the initial Mg concentration set as 0.10 mol · L 1 , a scenario where nesquehonite appears (experiment C). Before precipitation, the major cation in the solution is Mg 2 + , followed by NH 4 + (the dominant contributor to the total ammonium nitrogen) (Figure 6b,c). The main carbon species is HCO 3 followed by MgCO 3 0 , MgHCO 3 + , and CO 3 2 . The main anion is Cl . Nesquehonite reaches saturation rapidly, but its precipitation does not occur until ~2.5 h after the beginning of the reaction (Figure 6d). Although the modeled results also suggest that the solution became oversaturated rapidly after absorption, such a long time for the appearance of crystal indicates slow nucleation. Upon precipitation, the Mg 2 + concentration in the solution decreases rapidly, together with HCO 3 , MgCO 3 0 and CO 3 2 , and NH 4 + becomes the dominant cation. At this stage, addition of ammonia is required to neutralize the H + produced by the removal of CO 3 2 (Equation (13)), to maintain the pH. As the precipitation continues, the concentrations of HCO 3 and CO 3 2 gradually recover but not the Mg-related species (Figure 6a,b). Throughout the whole course of the experiments, brucite remains undersaturated (Figure 6d), indicating a successful control of the solution composition. Based on the discussion above, the overall reaction in solution for experiments A–G appears to be:
NH 3   +   Mg 2 +   +   HCO 3   +   3 H 2 O     NH 4 +   +   MgCO 3 · 3 H 2 O

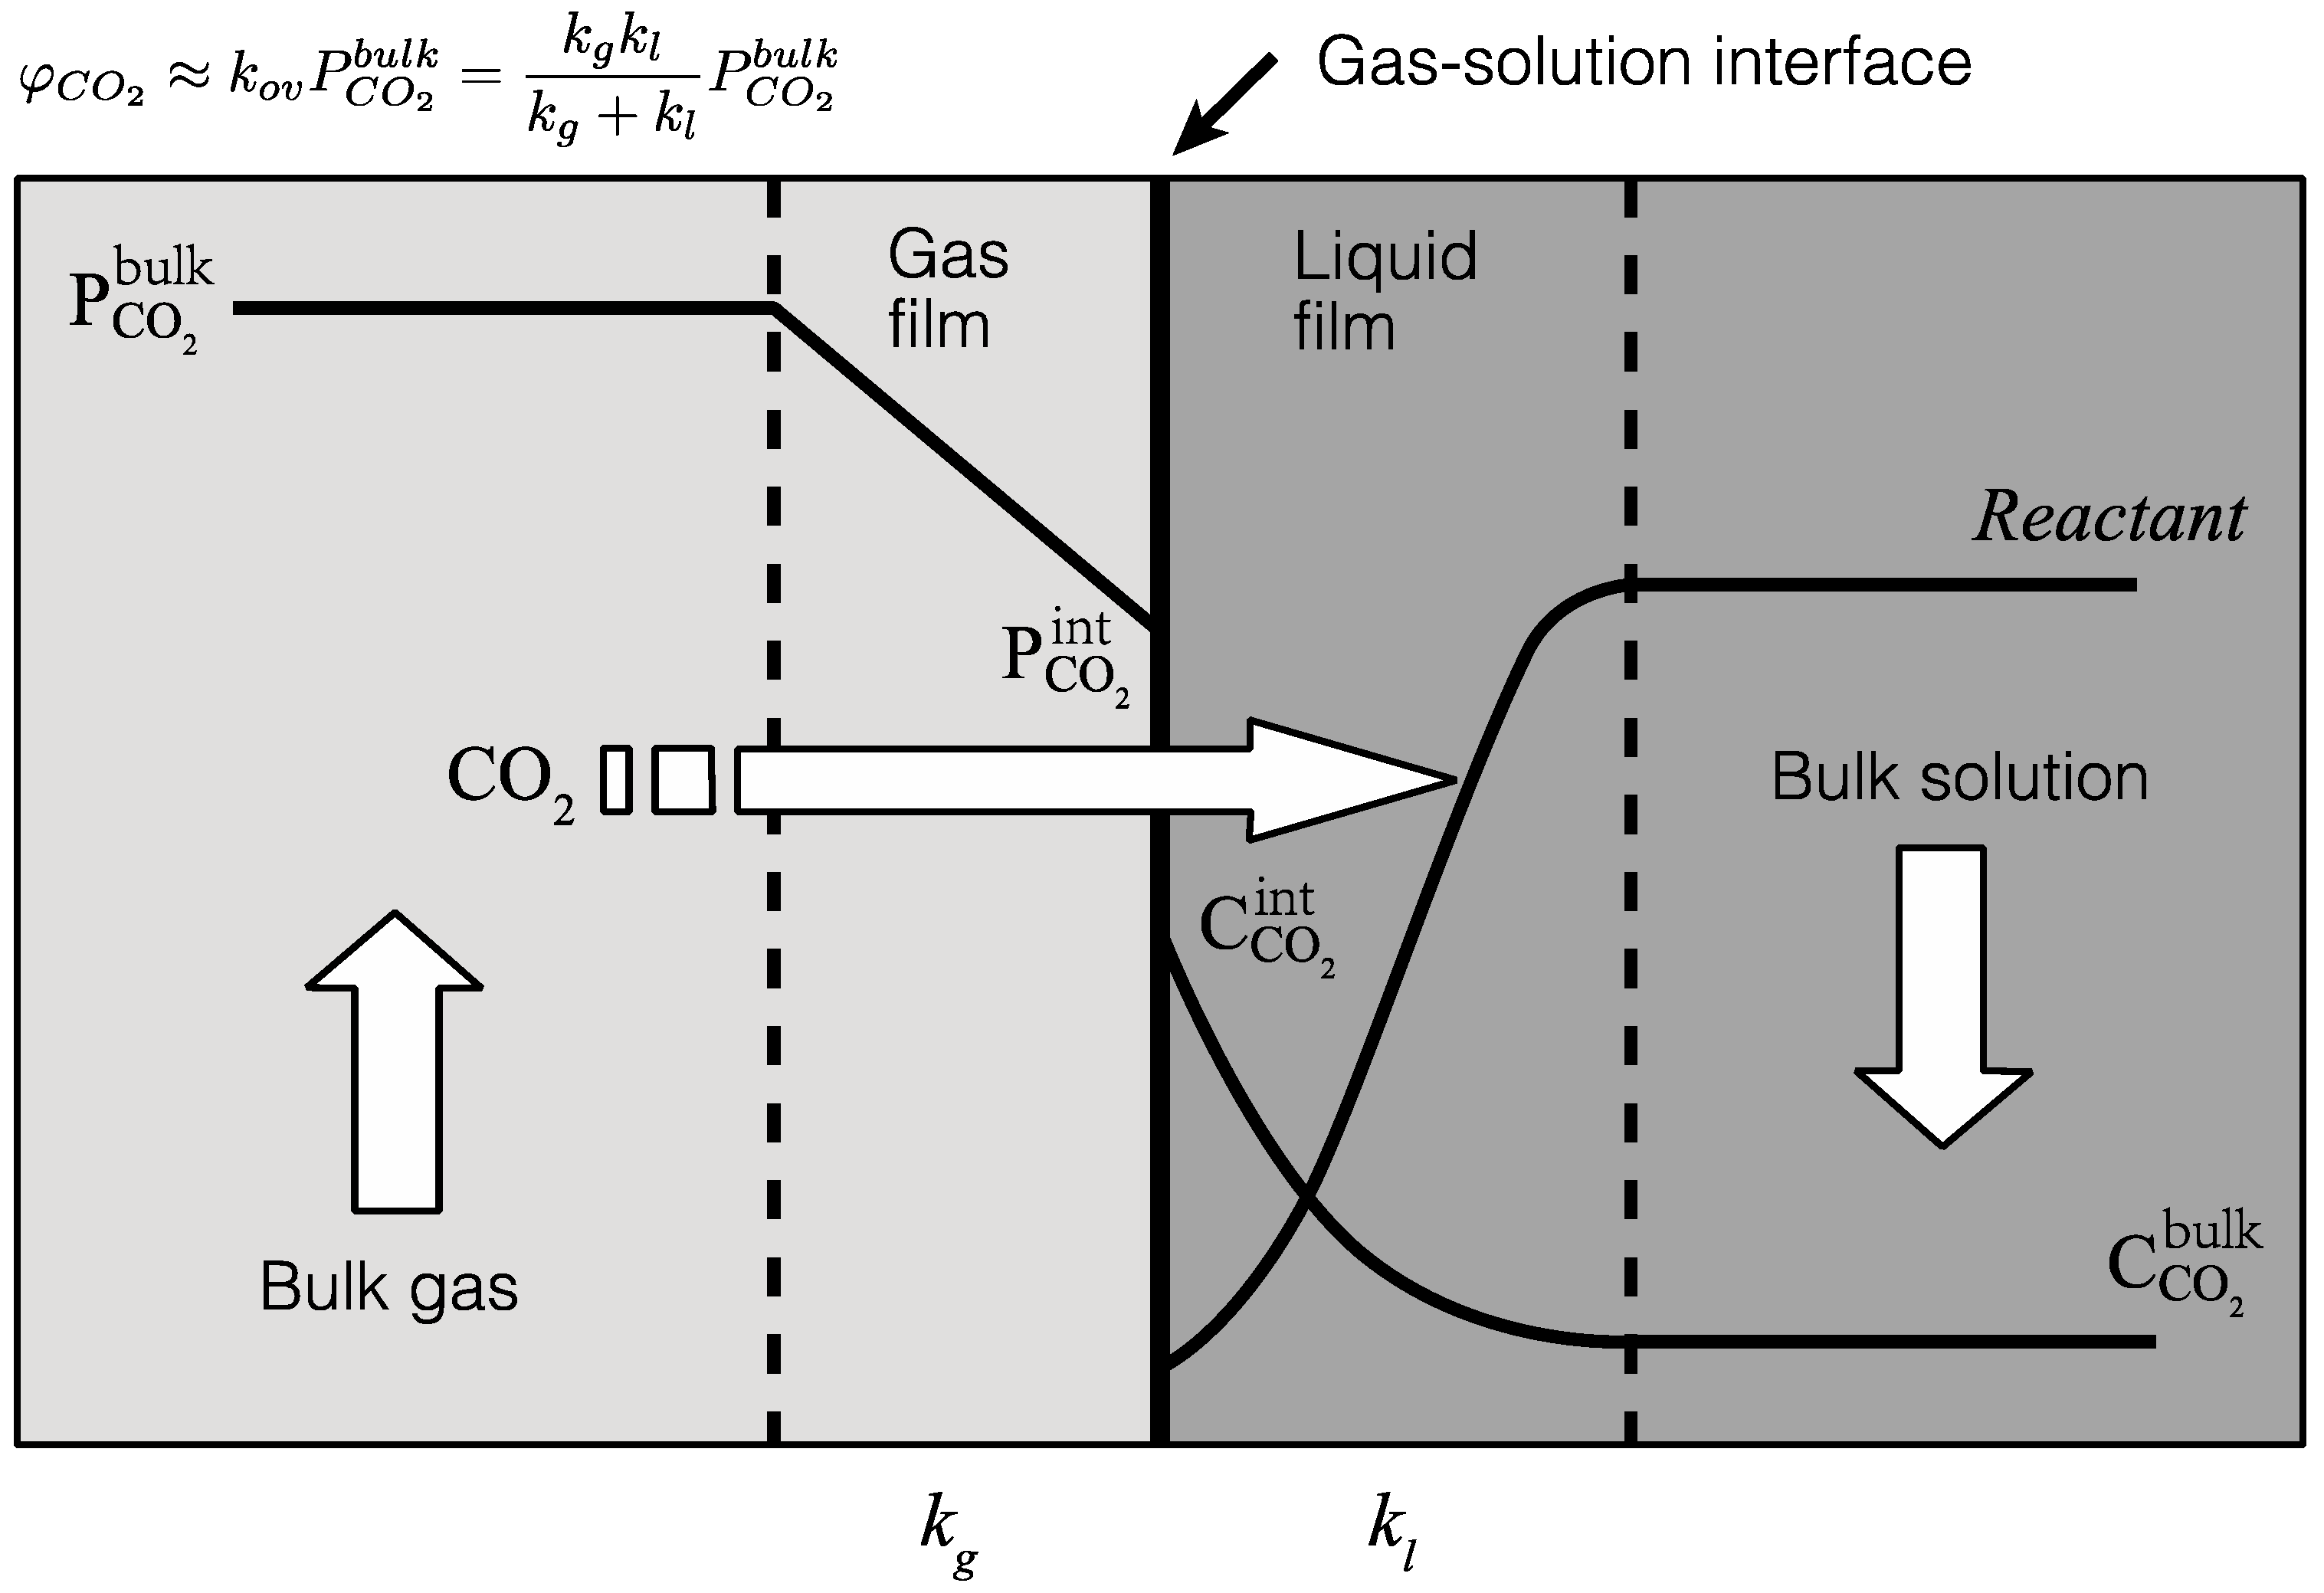
4.2. Gas-Solution Interface Kinetics

4.2.1. Reaction Kinetics between CO2 and NH3

To characterize the reaction kinetics at the gas-solution interface, here we consider the physical and chemical processes of CO2 mass transfer from gas phase to solution. After transporting CO2 into solution, three reactions can promote the transformation of molecular CO2(aq) to HCO 3 (Equations (1)–(3)). Since the concentration of water is a constant, and the solution pH is fixed, the reaction rates of Equations (1) and (2) should be constant, i.e., CO2 absorption rate should be stable in a pH-controlled NaOH solution (experiment X, Figure 3a and Figure 4a). In contrast, CO2 absorption rates in NH3 solutions exhibit an increasing trend even with a fixed solution pH. The enhanced CO2 absorption rates in NaOH versus NH3 solutions can be explained by the promotion of reaction kinetics, as shown by Equation (3), likely as the result of an increasing concentration of NH3(aq) (Figure 6c).
The reaction mechanism of Equation (3) discussed in Section 1.2 yielded a complex kinetic expression (Equation (11)), with up to five rate constants. To reduce the computational complexity, the reaction is simplified to a second-order reaction. Consequently, Equation (11) is simplified to:
r CO 2 NH 3   =   k app C CO 2 C NH 3 ,
where k app is the apparent kinetic constant of Equation (3).
To link the CO2 absorption rate to reaction kinetics, a “two-film” model is adopted to describe the mass transfer process. Figure 7 illustrates the concept of this model. In essence, the diffusion film on the gas side and the solution side determine the efficiency of mass transfer. In this framework, the rate of CO2 absorption ( φ CO 2 ) can be written as:
φ CO 2   =   k ov Δ P CO 2 k ov P CO 2 bulk
and
1 k o v   =   1 k g   +   1 k l ,
where Δ P CO 2 is the pressure gradient of CO2 from bulk gas phase to bulk solution, and k o v is the overall mass transfer coefficient. k o v consisted of a gas-side ( k g ) and solution-side ( k l ) mass transfer coefficient, and their reciprocal forms represent mass transfer resistance at the gas side and solution side, respectively (Equation (21)). The magnitude of k g is determined by fluid properties of the gas phase, which has been calibrated by previous studies [57]. In the two-film model, an enhancement factor (E) is used to describe the mass transfer accelerated by a chemical reaction on the solution side (i.e., the solution-side mass transfer coefficient with reactions ( k l ) versus physical mass transfer coefficient with no chemical reaction ( k l 0 )). Methods to calculate k l 0 can be found elsewhere [40]. Table 3 lists the experimental results of the enhancement factor ( E e x p ) at different sampling times. To link reaction kinetics to E, two additional parameters, the Hatta modulus ( M H 2 ) and an enhancement factor for an infinitely fast reaction ( E i ), are introduced below:
M H 2   =   k t o t a l D CO 2 , L ( k l 0 ) 2
k t o t a l   =   k H 2 O C H 2 O   +   k OH C OH   +   k a p p C NH 3
E i   =   1   +   D NH 3 , L C NH 3 H CO 2 D CO 2 , L P CO 2 i n t ,
where D CO 2 , L is the diffusion coefficient of CO2 in the liquid phase, D NH 3 , L and C NH 3 are the diffusion coefficient and the bulk concentration of ammonia in the liquid phase, respectively, and P CO 2 i n t is the partial pressure of CO2 in the liquid phase at the gas-liquid interface. Although, D CO 2 , L and D NH 3 , L are inversely proportional to solution viscosity (i.e., the Stokes–Einstein equation), which is a function of solution composition and temperature. The diffusion coefficient of CO2 and NH3 in water at 25 °C is used as approximation of diffusion in NH3–MgCl2 solutions due to the limited concentration effect on viscosity [70]. To calculate the theoretical enhancement factor ( E c a l ), we refer to an explicit approximate expression [71]:
E c a l   =   M H 2 2 ( E i 1 )   +   M H 4 4 ( E i 1 ) 2   +   E i M H 2 E i 1   +   1 .
Since Equations (22)–(25) only contain one variable k a p p , one can fit E c a l to E e x p by tuning this parameter. Fitting results show that E e x p can be reproduced satisfactorily using the models built above (Figure 8), but notable deviations exist when E e x p is larger than 4. Table 4 shows the fitted k a p p value together with the values compiled from other studies. The k a p p value obtained in this work is similar to but slightly higher than in earlier studies conducted at relatively low NH3 concentrations [62,72]. Concerning the deviations in Figure 8a, it should be noted that we assume a constant k a p p in the fitting; in reality, however, k a p p may vary when conditions change. Specifically, due to accelerated deprotonating (Equation (8)), the overall rate constant between CO2 and NH3 (Equation (11)) is expected to correlate positively with the NH3 concentration. Thus, k a p p should increase with NH3 concentration. Such dependency is also shown by the observation of greater k a p p under higher NH3 concentrations in previous work [40,73] (Table 4).
Knowing k a p p ’s dependence on NH3 concentration, we now refine the calculation of the theoretical enhancement factor ( E c a l ) by assuming a linear relationship between C NH 3 and k a p p   ( m 3 · mol 1 · s 1 ) :
k a p p   =   1.022   C NH 3   +   0.414 .
The intercept and slope of Equation (26) are obtained through fitting E c a l to E e x p With this correction, the fit between E e x p and E c a l is significantly improved (with a smaller sum of squared errors, or SSE), especially when E e x p > 4 (Figure 8). Notably, the linear form of Equation (26) is similar to the rate constant expression of Equation (3) developed within a “termolecular mechanism” frame, where the initial product is not zwitterions but a loosely bounded termolecular complex involving CO2, ammonia, and base molecules [73,74,75].

4.2.2. Factors Controlling CO2 Absorption

In the two-film model, the mass transfer coefficients on the gas side ( k g ) and the solution side ( k l ) are important factors controlling the CO2 absorption rate under a fixed pressure gradient. Since the gas phase fluid dynamic parameters directly determine k g , the gas phase fluid conditions are kept the same ( k g   =   2.23 × 10 6   mol · m 2 · Pa 1 · s 1 ) between all absorption experiments. The much higher k g values, as compared to experimental k l values ( 0.45 3.19 × 10 7   mol · m 2 · Pa 1 · s 1 , Table 3), indicate that the mass transfer in solution side is the slow step for CO2 absorption in the wetted-column device. Thus, an absorption device designed with high k l values (e.g., bubble tank) should be able to promote CO2 mass transfer through MgCl2–NH3–NH4Cl solutions.
As discussed in Section 4.2.1, three reactions (Equations (1)–(3)) are contributing to CO2 mass transfer on the solution side. Figure 9a shows the individual rate constant of these reactions in a pseudo first-order form (i.e., k x C x = k H 2 O C H 2 O = k H 2 O ' for H 2 O ; k x C x = k OH C OH for OH ; k x C x = k app C NH 3 for NH3). The rate constant of Equation (1) is fixed at 0.026   s 1 for experiments C, E, F, and G as we set the temperature and water concentration to be constant. Similarly, the rate constant of Equation (2) for any specific experiment is constant, but shows a positive correlation with solution pH among the different experiments (from 0.064 s 1 of experiment E, to 0.615 s 1 of G). The rate constant of OH is ~3–30 times larger than H2O. The rate constant of NH3(aq) is highest, up to 431 s 1 (Figure 9a), thus the CO2–NH3 reaction should be the dominant reaction among reactions (1)–(3). As discussed in Section 4.2.1, the reaction rate between CO2(aq) and NH3(aq) increases with NH3(aq) concentration through enhanced reaction rate and greater apparent rate constant k a p p (Equations (19) and (26), Figure 9b). Thus, higher NH3(aq) concentration would facilitate CO2 mass transfer on the solution side, either through increasing the total ammonium nitrogen concentration (e.g., adding ammonium salts) or raising the pH.
Although the effect of temperature is not investigated in this work, its effect on CO2 absorption is expected to be positive (i.e., higher temperature, faster CO2 absorption), as shown by previous studies (e.g., [40,73]).

4.3. Mg-carbonate Precipitation and Phase Transformation

4.3.1. Nesquehonite Precipitation Kinetics

Our results show that Mg-carbonate only precipitates as nesquehonite (Table 1) in the absence of NH4Cl. We further discuss the effect of nesquehonite precipitation on CO2 absorption.
The initial Mg concentration does not affect the CO2 absorption process (Figure 3) but impacts on carbonate precipitation (e.g., timing of nesquehonite’s first appearance). Figure 10 shows the amount of total absorbed carbon (as CO2) and precipitated carbon (as nesquehonite). Although CO2 transfers from gas phase to solution continuously, precipitation does not start until a certain time point (Figure 6d). At this stage, the solution quickly becomes supersaturated (relative to nesquehonite), overcomes the nucleation energy barrier, and starts precipitating carbonate. The initial precipitation rate of nesquehonite ( φ p ) is smaller compared to the CO2 absorption rate ( φ CO 2 ), making the absorbed CO2 accumulate in the solution as dissolved inorganic carbon (DIC) (Figure 10a,b). After initial precipitation, φ p increases rapidly and overwhelms φ CO 2 , efficiently converting DIC to nesquehonite. By default, no further Mg is added into the reactor. As a result, the solution gradually gets less saturated, and φ p becomes smaller than φ C O 2 again, leading to increasing DIC. The accumulation of DIC in the solution also reduces the CO2-carbonate conversion efficiency.
Based on the above highlighted observations, we suggest that the concentration of Mg in solution needs to be controlled for enhanced CO2-carbonate transformation efficiency. In industrial practices, timely input of concentrated-Mg solutions should be exercised to guarantee the condition of φ p >   φ CO 2 . Nucleation barrier is another concern during industrialization, as the relatively long induction time of nesquehonite (1.2–3.6 h, Section 3.1 and Section 3.2) indicates quite a high nucleation energy barrier. The addition of crystal seeds might help to overcome such an energy threshold.
Besides nucleation, nesquehonite precipitation experiments conducted in the literature under similar CO2 partial pressure by spraying gas into brucite slurry [34] exhibited a smaller precipitation rate (~0.01   mol · L 1 · h 1 , PCO2 = 0.1 atm) compared to this work (~0.04 mol · L 1 · h 1 , PCO2 = 0.15 atm), indicating the kinetic advancement of our process. On the other hand, brucite carbonation under elevated pressure (15 atm) resulted in a much higher precipitation rate (~0.66 mol · L 1 · h 1 ) [76]. Overall, due to quite different technical settings, we could only do a first-order comparison, but further studies are needed to normalize the effects of scales and other factors (e.g., CO2 pressure and gas-solution contact area) for a more meaningful comparison.

4.3.2. Phase Transformation of Less Stable to More Stable Carbonation Products

The chief Mg-carbonate precipitated under high TN conditions (>2 mol · L 1 ) is roguinite, which was formed by milling epsomite ( MgSO 4 · 7 H 2 O ) with NH 4 HCO 3 [77]. Roguinite is very unstable under ambient conditions and can lose all of the ammonium carbonate and most of the water, forming amorphous magnesium carbonate with a very high surface area (~500   m 2 · g 1 ) via thermal decomposition [78]. Our results show that roguinite can be transformed into nesquehonite at 50 °C and further converted to dypingite at 80 °C by washing with water. During phase transformation, the ammonium component is also removed from the solid, allowing for recycling for CO2 absorption.
Under low TN conditions (<2 mol · L 1 ), nesquehonite is the dominant Mg-carbonate precipitated besides roguinite. Nesquehonite is also unstable at ambient conditions and can gradually lose CO2, transforming to its basic form (e.g., dypingite and hydromagnesite) at temperatures above 50 °C [36,55] or even at room temperature [34,79]. Thus, once washed in hot water (>50 °C), both nesquehonite and roguinite can be transformed into basic magnesium carbonates.

4.4. Implications for Industrial Applications

Experimental data show that liquid-side mass transfer process is the rate-limiting step of CO2 absorption. Thus, to achieve more efficient CO2 scrubbing, reactors with a higher liquid-side mass transfer coefficient, k l 0 , are needed. Various kinds of reactors are available for the CO2 absorption depending on how the gas is in contact with the solution/slurry [80]. For aqueous droplets falling in the gas phase, i.e., spray tower, the gas phase side has a lower mass transfer barrier due to stronger gas phase convection. Thus, a spray tower is suitable for fast reaction systems, e.g., SO2 absorption. On the other hand, for the liquid-side mass transfer limited CO2–MgCl2–NH3–NH4Cl system, letting the gas phase rise within the solution (i.e., bubbling) would guarantee a more effective liquid-side mass transfer process. Thus, a bubble tank is an ideal reactor and works better with agitation. Besides the economic advantages, a bubbled tank with agitation can handle solid precipitation without being clogged up, compared with staged tower reactors. In addition, similar to this study, parameters including NH3 concentration, Mg concentration, and pH can also be tuned to fulfill a CO2 emissions reduction target.
Phase transformation experiments show that an unstable form of nesquehonite or roguinite can be readily converted to stable basic-form Mg-carbonates (dypingite in this study), which are important industrial raw materials with diverse applications. Dypingite-like Mg-carbonates can serve as a flame-retardant or fire-retardant additive for polymers [81,82,83] or simply as backfill [84]. Hydromagnesite is also a promising material to replace CaO in calcium-based cement, which usually has a net release of CO2, as opposed to Mg-based cement, which could potentially absorb nearly as much CO2 during its service life as was emitted during its manufacture (carbon-neutral) [85].
Since the working medium used for CO2 absorption is Mg solution in this study, a broad range of Mg-rich minerals could act as a raw material. Thus, the theoretical sequestration ability is almost unlimited. However, considering the tremendous energy that goes into harvesting Mg from silicates [11], Mg-containing brines resulting from silicate weathering might be more promising. For example, the Qinghai Lake (water capacity 119.6 km3) in western China has an extremely high Mg concentration of 16   g · L 1 [86], which could sequestrate 3.5 Gt CO2 in total while producing 9.3 Gt hydromagnesite. In addition, a solid byproduct of potassium salt production named bischofite (MgCl2·6H2O ) is readily available for use. Notably, 320–480 Mt of bischofite are produced each year around Chaidam basin in China [87], equivalent to a CO2 sequestration potential of 70–104 Mt producing 186–276 Mt hydromagnesite.

5. Conclusions

This study systematically investigated the reaction kinetics of CO2 absorption and Mg-carbonate precipitation in MgCl2–NH3–NH4Cl solutions using a novel pH-controlled wetted-wall column device. The obtained results from and conclusions about the studied system are summarized as follows:
(1)
Careful design and theoretical modeling of solution chemistry led to the precipitation of high-purity nesquehonite in NH4Cl-free experiments.
(2)
The gas-side and liquid-side mass transfer coefficients were estimated through combining experimental data and a two-film mass transfer model. Notably, the CO2 mass transfer resistance on the liquid side was found to be greater than the gas side, suggesting that the liquid-side reaction is the major limiting step in the overall reaction and that a higher liquid-side mass transfer coefficient should promote CO2 absorption.
(3)
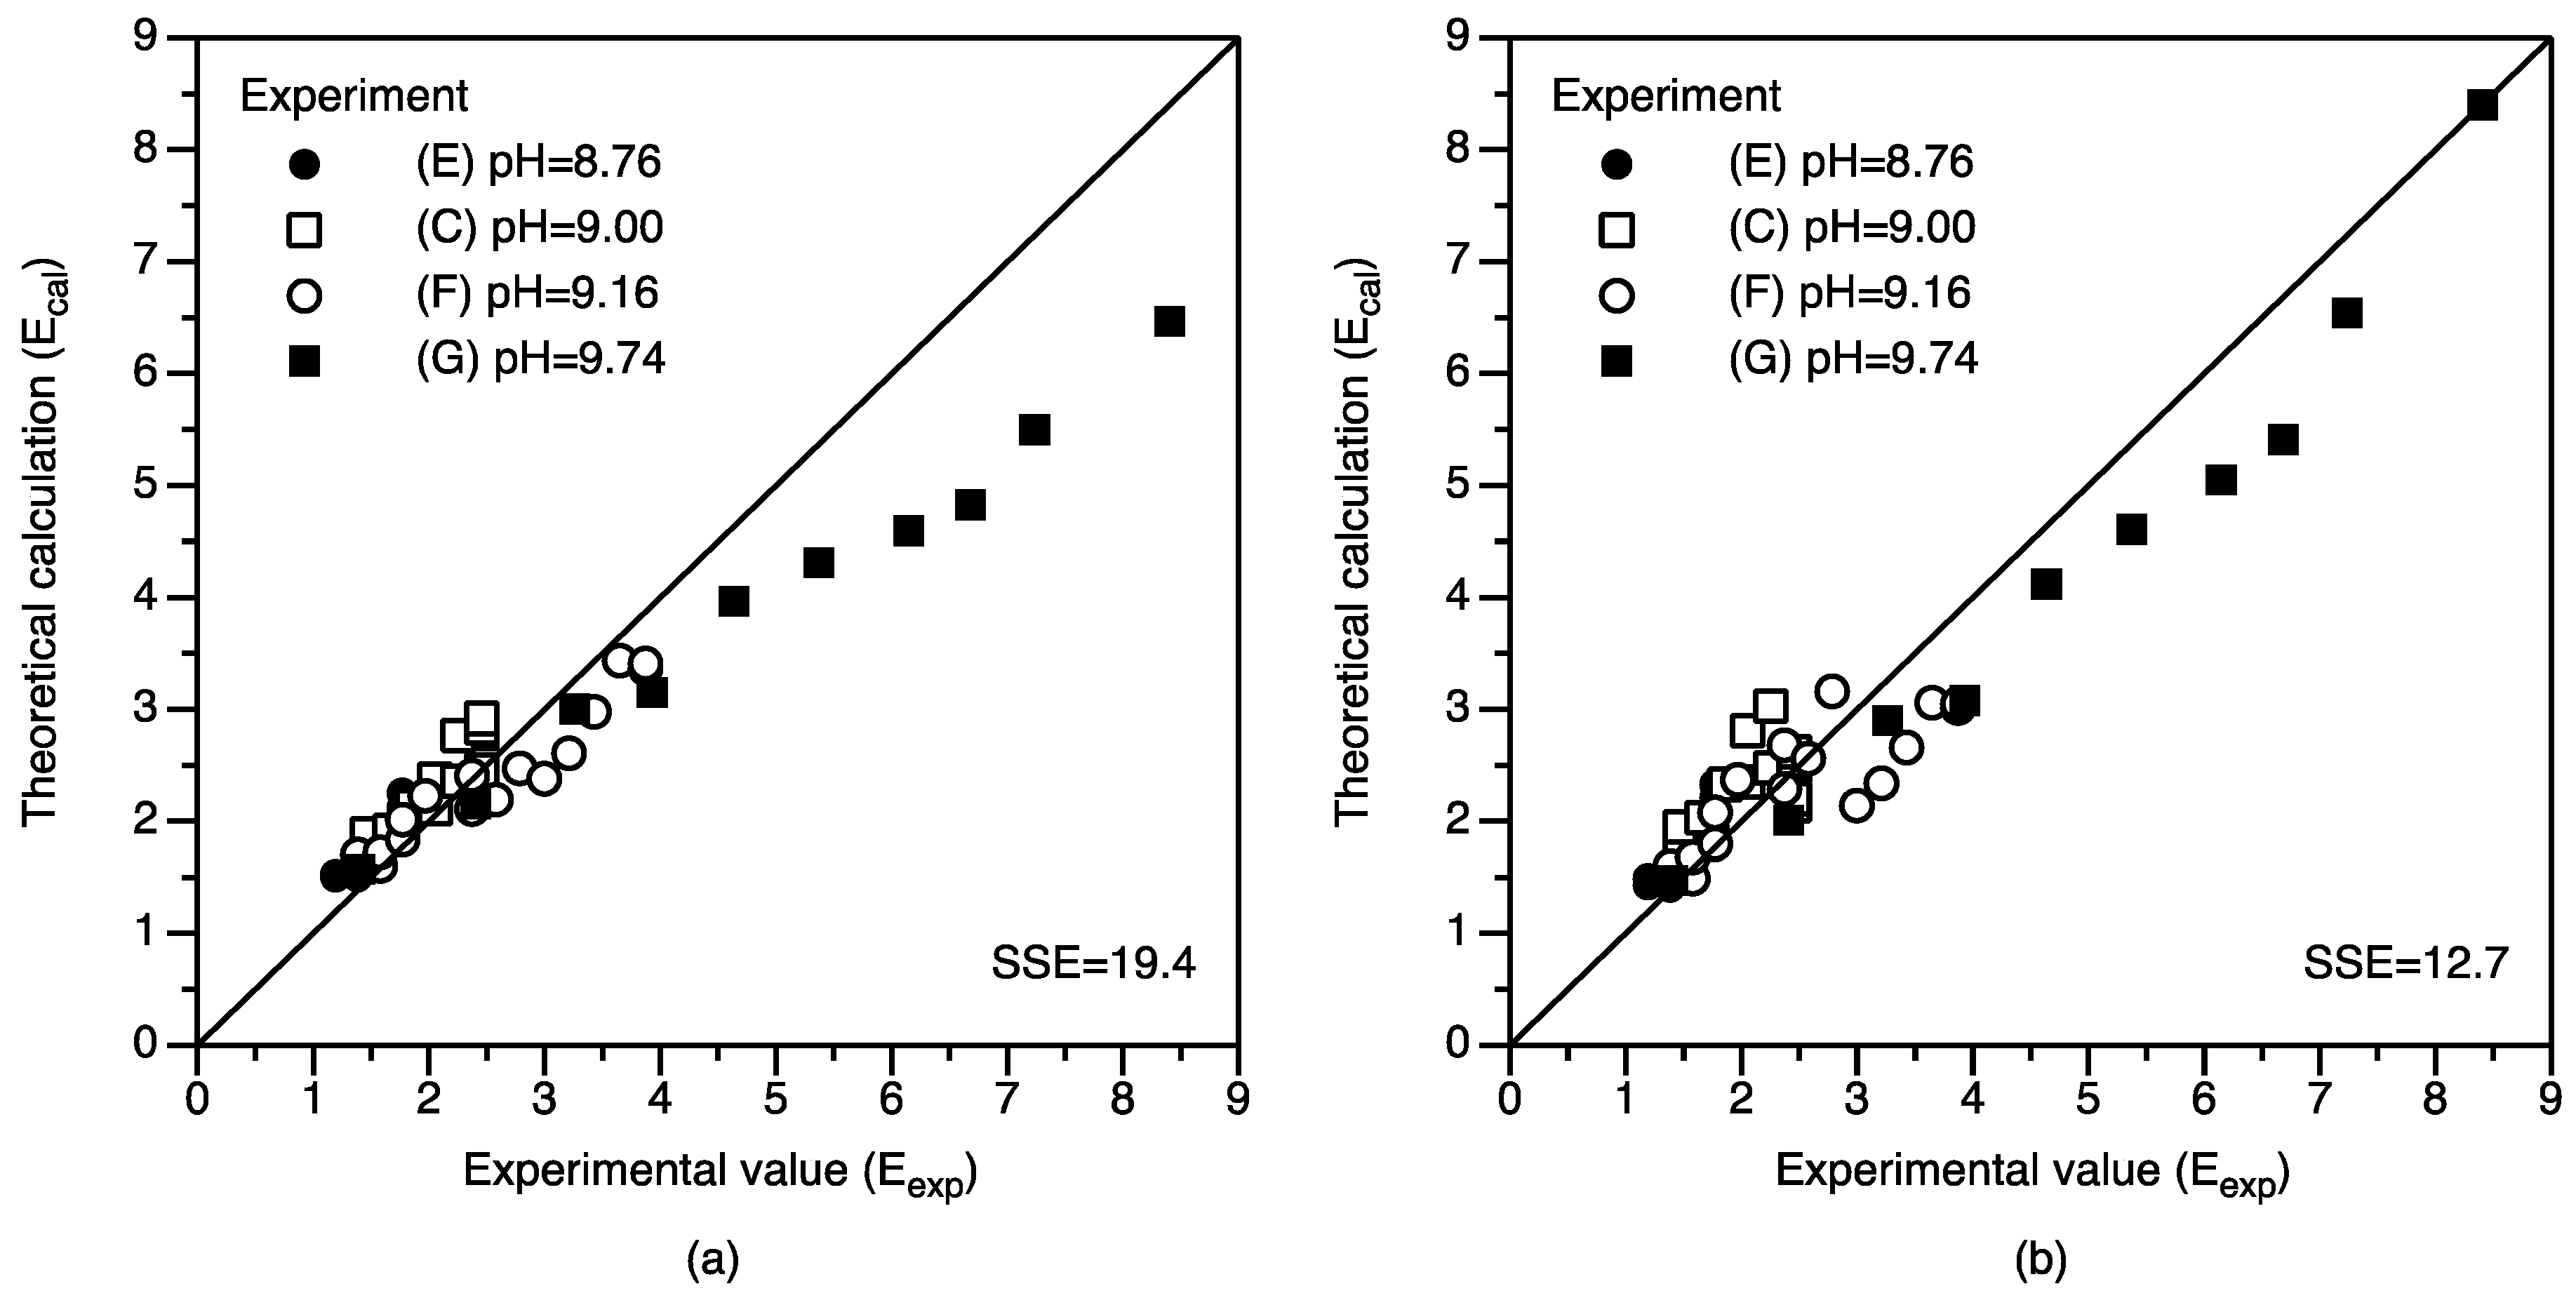
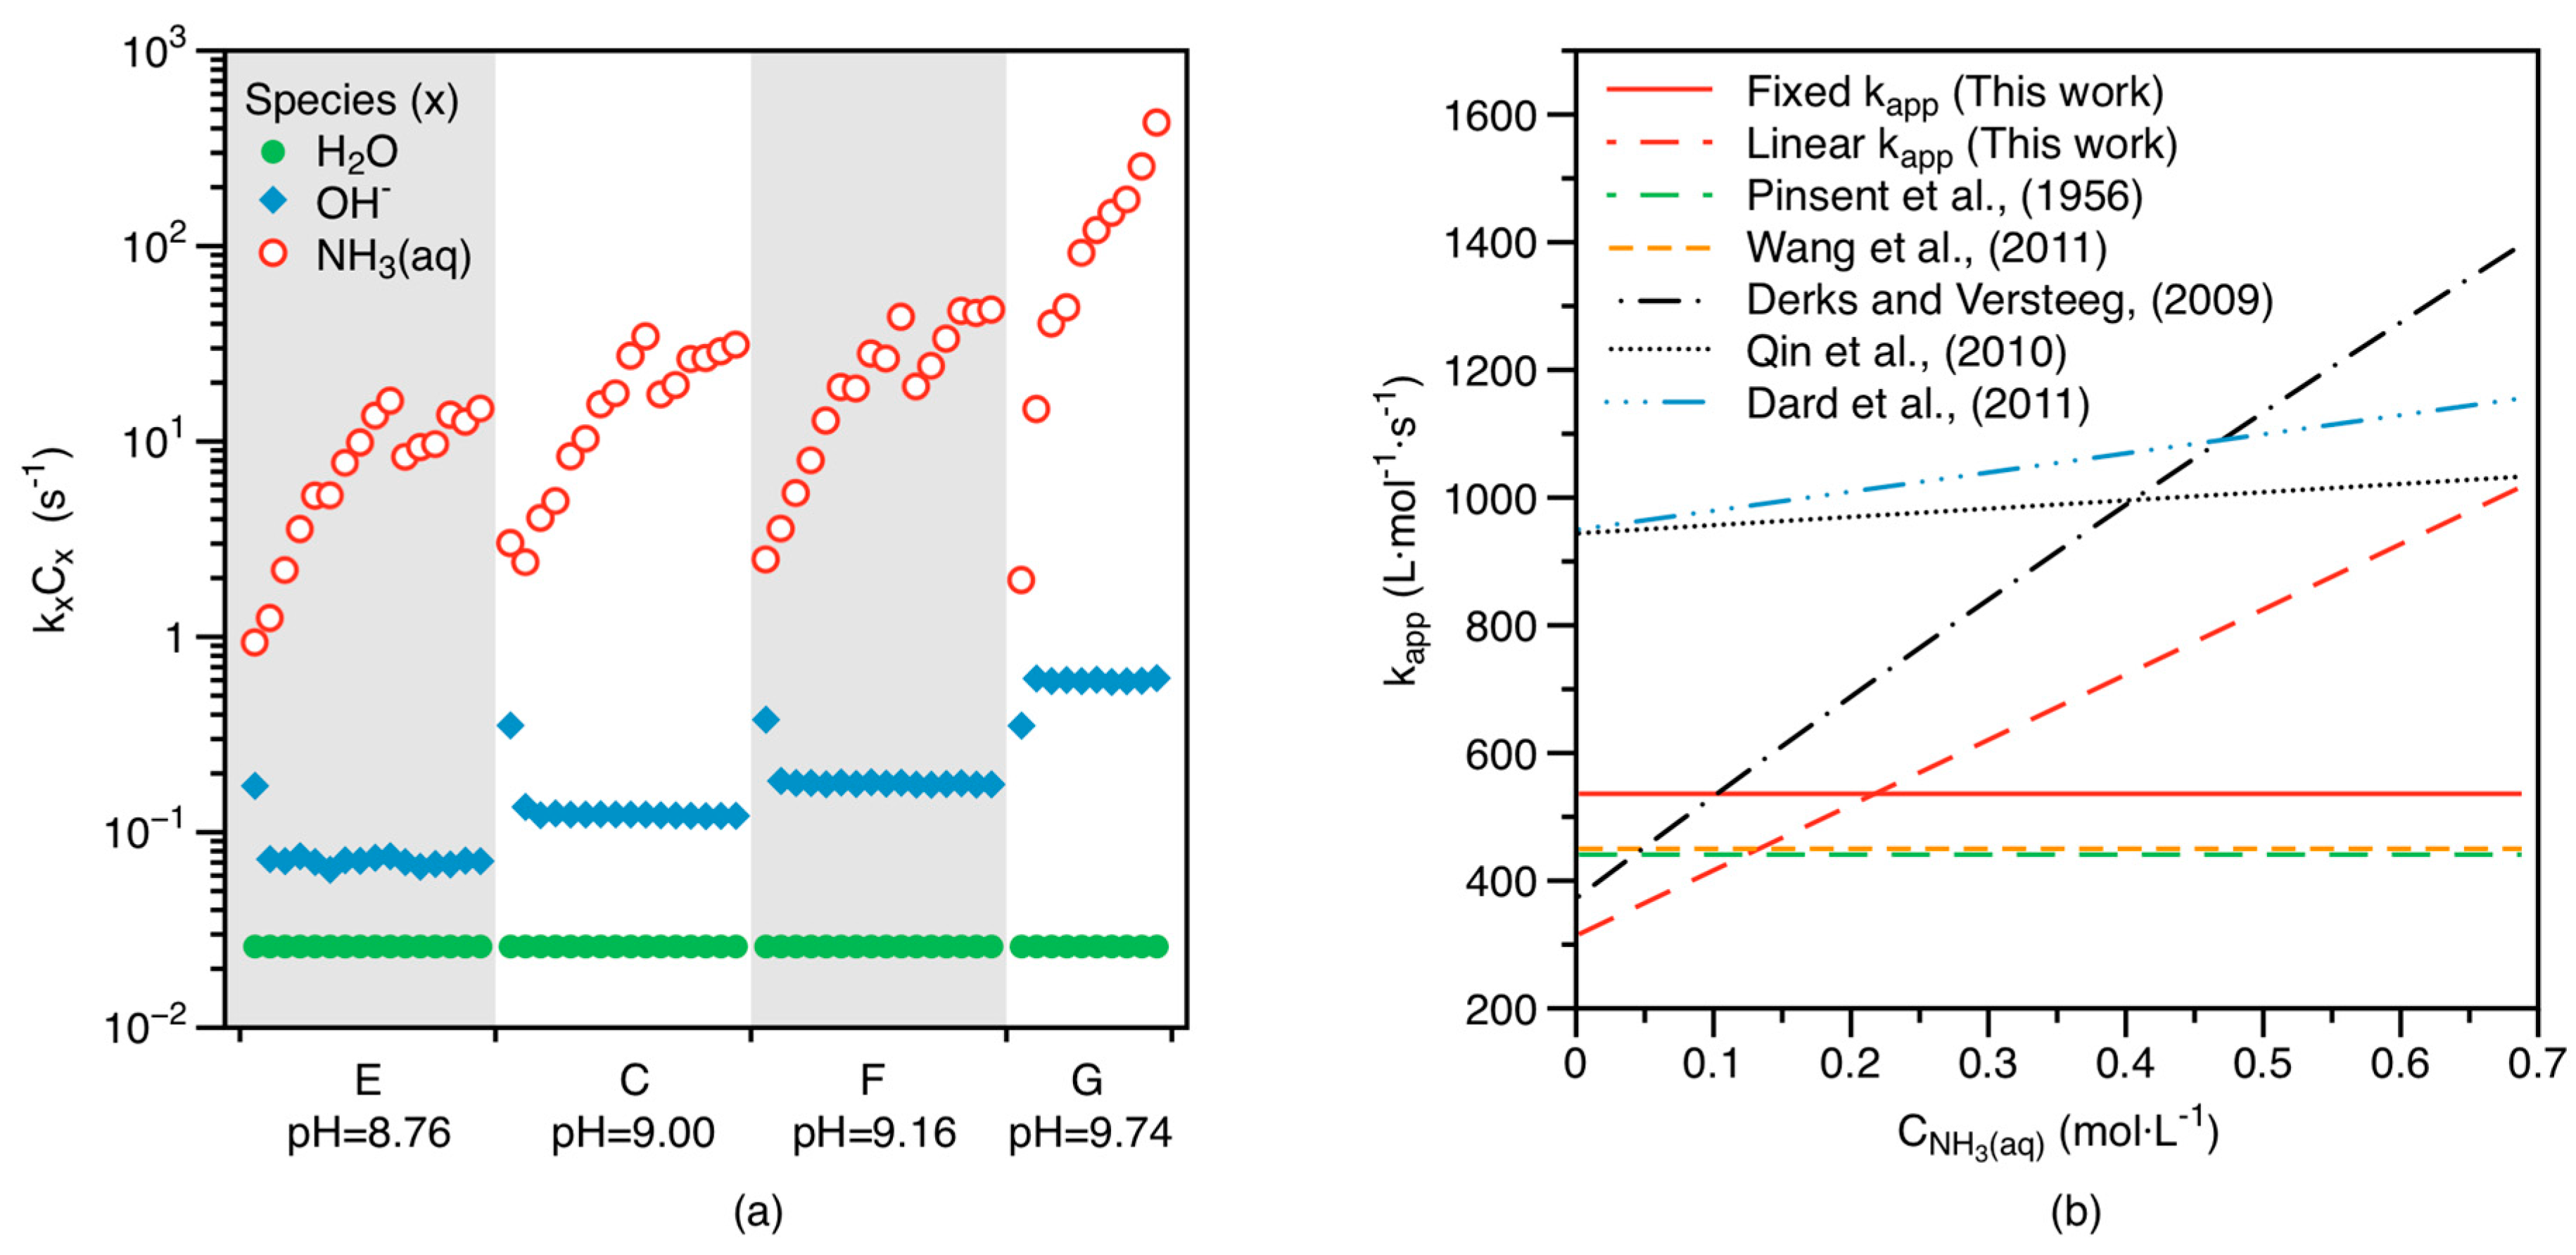
Interaction of CO2(aq) with NH3(aq) is a critical process controlling CO2 mass transfer from the gas to the solid phase. Based on the zwitterion mechanism, NH3(aq) concentration correlates closely with the apparent rate constant of the CO2–NH3(aq) reaction ( k a p p ), pointing to the importance of NH3 in the overall reaction. Together with the literature data, our results suggest that increasing temperature, pH, and NH3(aq) concentration would facilitate CO2 absorption.
(4)
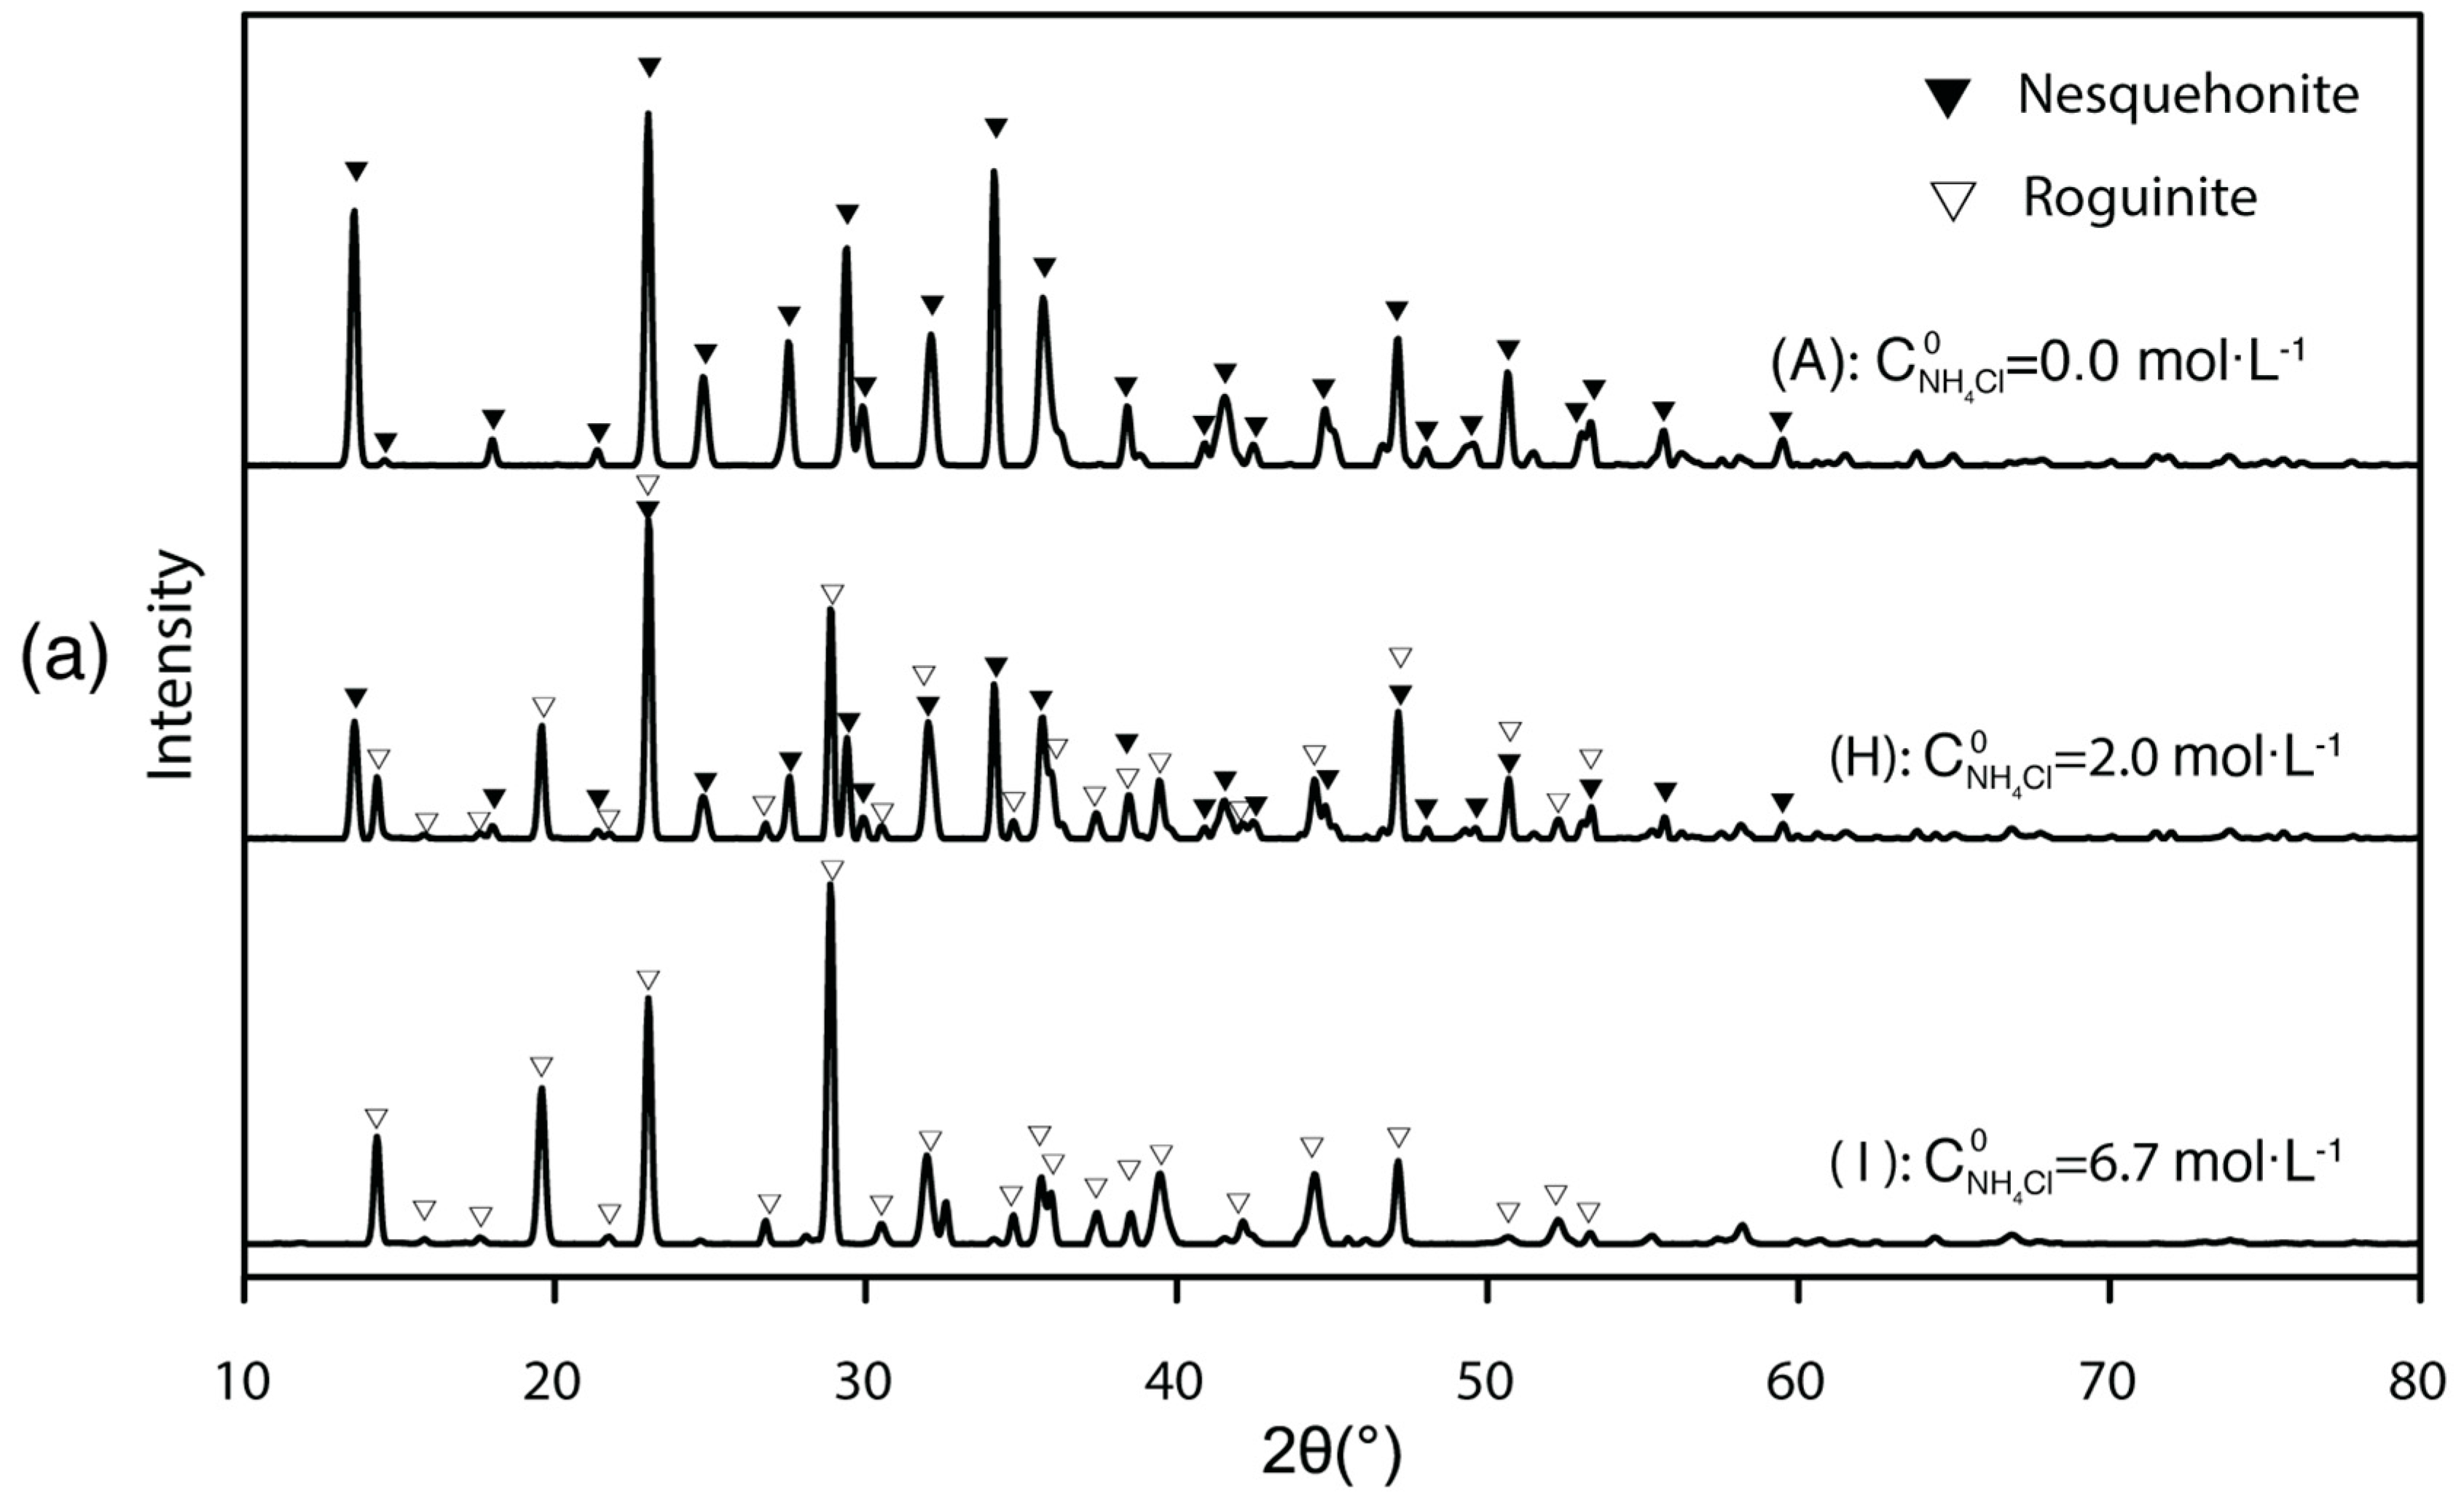
The solid products are sensitive to ambient conditions and treatments. If the initial ammonium nitrogen concentration is low ( C NH 4 Cl 0 < 2   mol · L 1 ), only nesquehonite would precipitate; if C NH 4 Cl 0 > 2   mol · L 1 , roguinite would appear. High pH value and high Mg concentration could help nesquehonite overcome the nucleation energy barrier and facilitate carbonation. Thus, besides adjusting pH, adding dissolved Mg is likely an effective way to enhance the precipitation rate of Mg-carbonate.
(5)
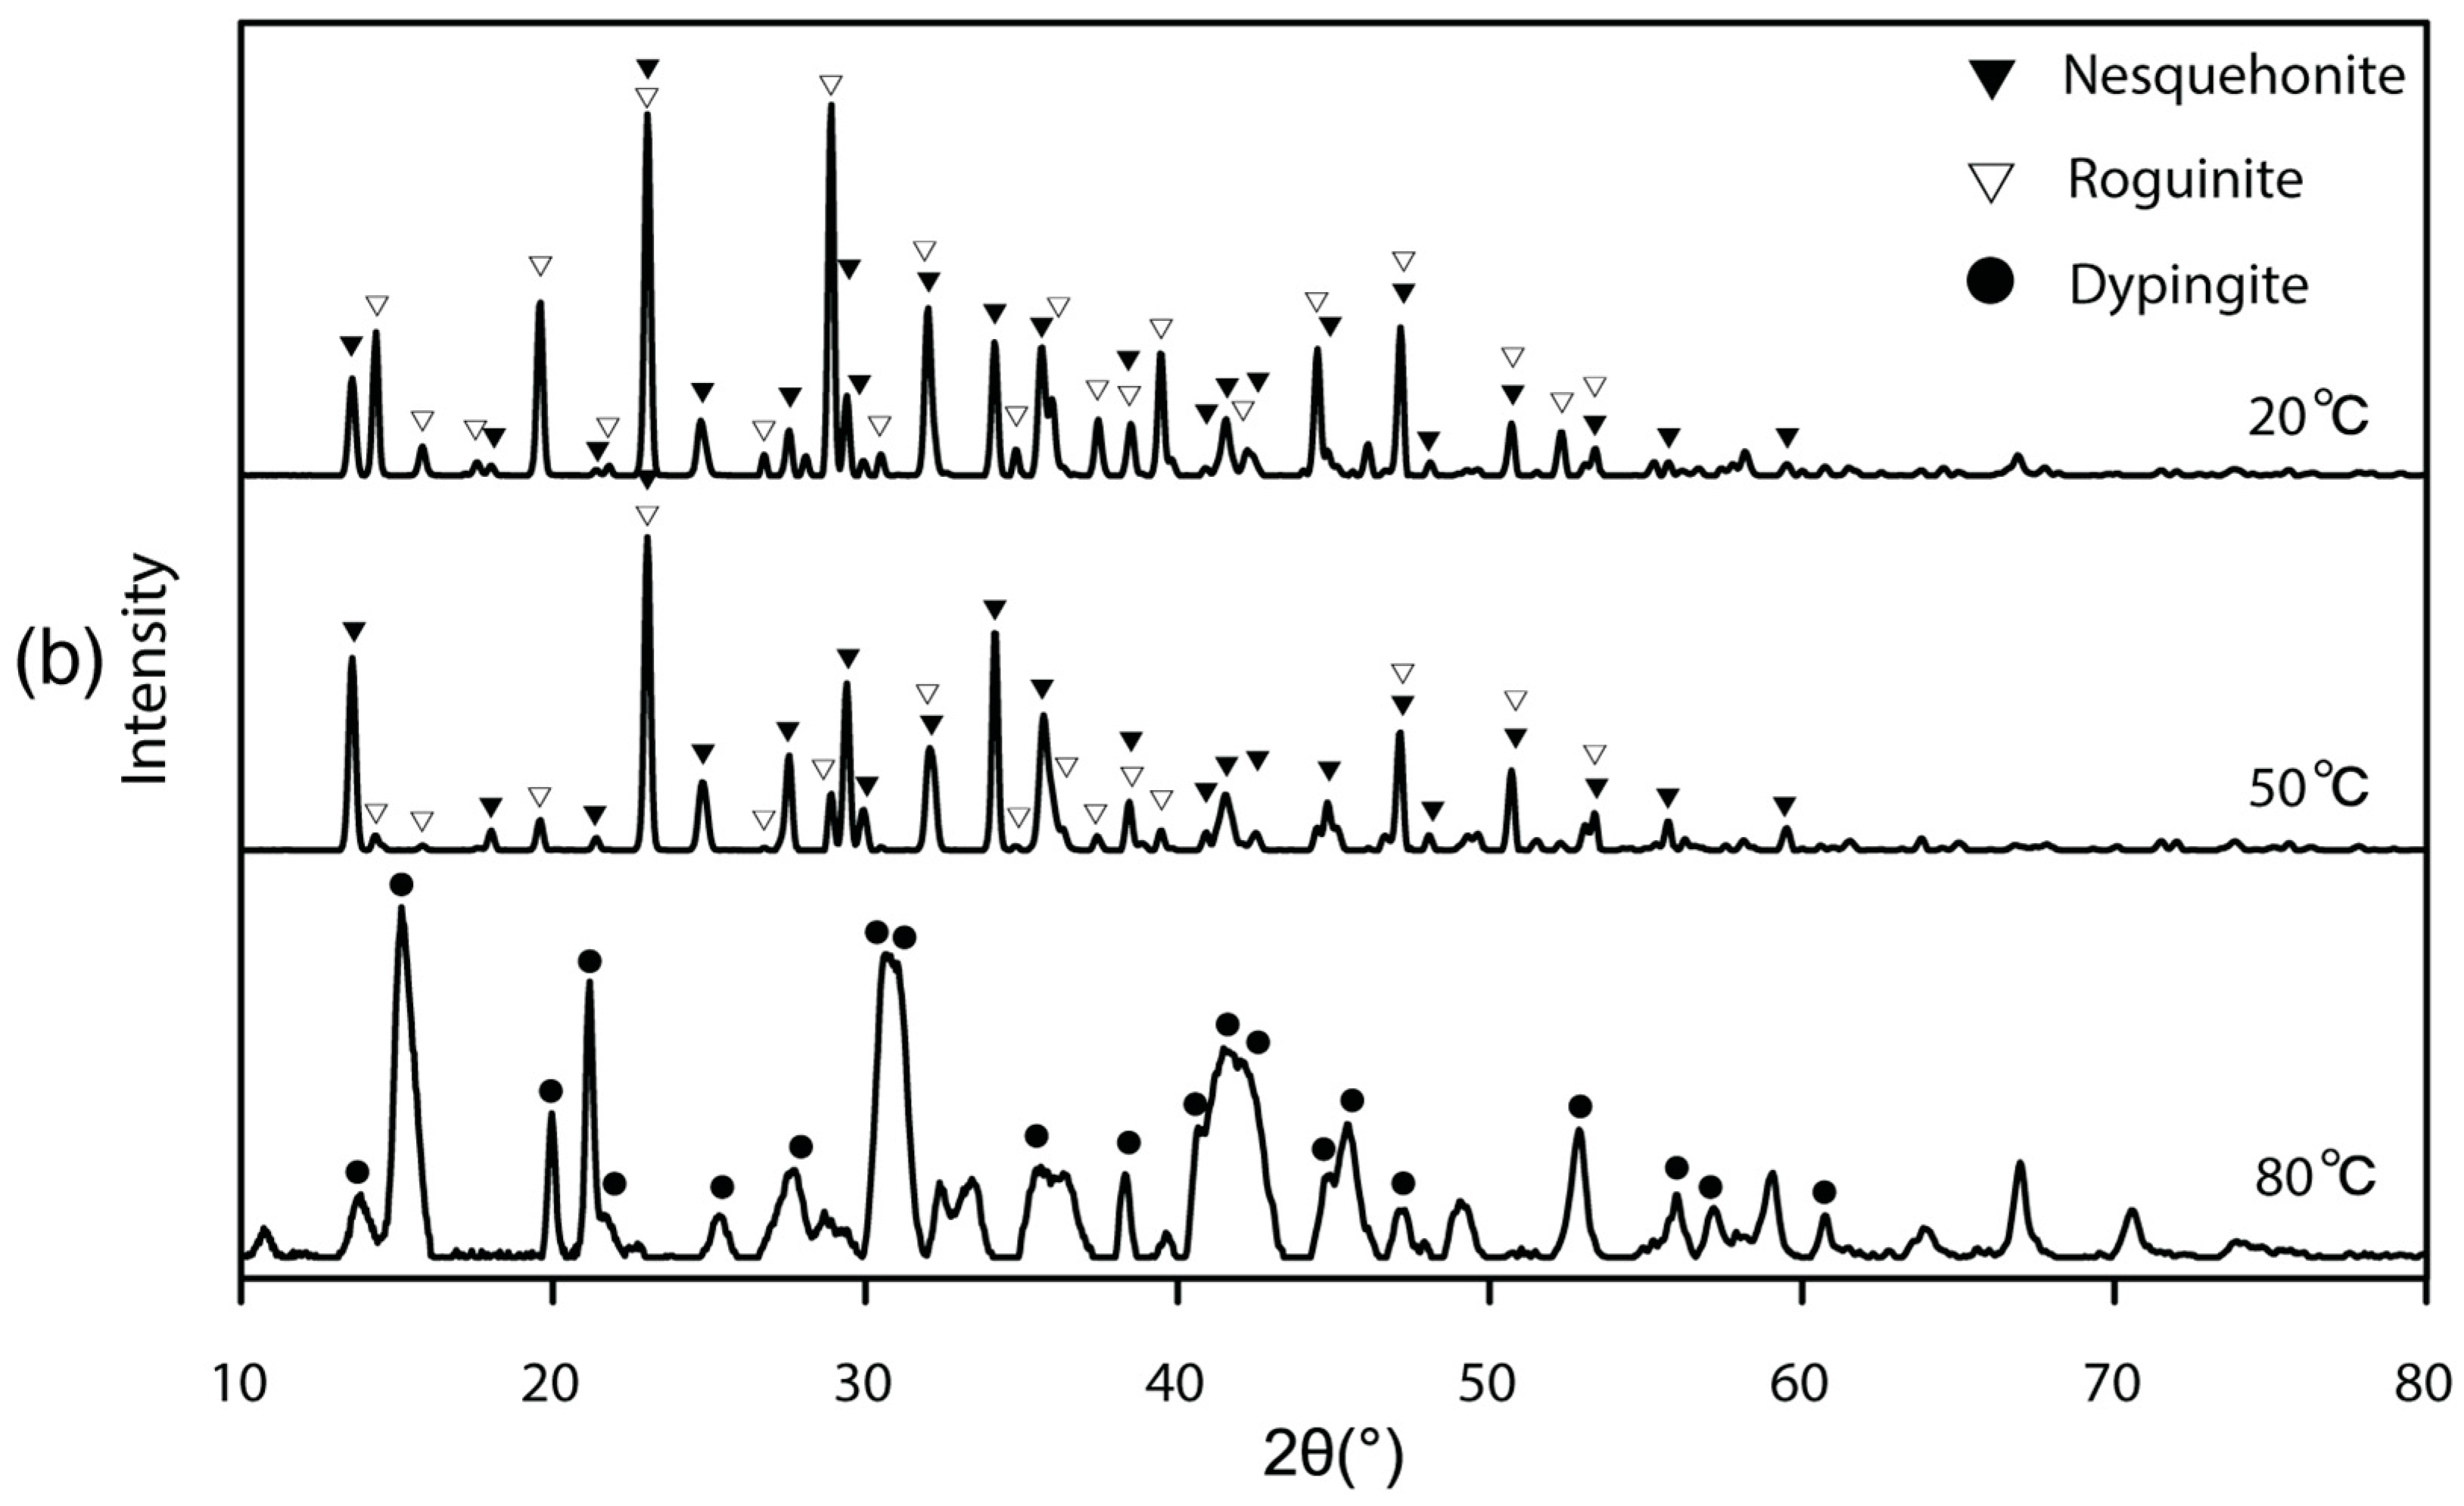
Industrially useful and more stable materials could be obtained with designed treatments of the solid products. Specifically, washing nesquehonite and roguinite in hot water (>50 °C) could convert those minerals to more basic forms of Mg-carbonate (e.g., dypingite).
Overall, our work provides a more comprehensive understanding of the kinetics of a carbonation reaction in the MgCl2–NH3–NH4Cl system, which would allow for the development of an applicable CO2-minimization routine. The studied factors and their associated behavior can directly guide the design and optimization of reaction systems aiming at more efficient CO2–Mg-carbonate conversion, and help with building facilities for capturing and sequestering atmospheric CO2 at the industrial scale.

Acknowledgments

The authors wish to thank the three anonymous reviewers for their constructive suggestions. This work was funded by the National Natural Science Foundation of China (Grant Nos. 41002014 and 41273075) to L.Z. and the Office of Basic Energy Science, U.S. DOE, through Grant No. DE-FG02-02ER15366 to H.T.

Author Contributions

C.Z. conceived and designed the experiments; C.Z., H.W., X.D., and S.A. performed the experiments; C.Z., H.W., X.D., and S.A. analyzed the data; L.Z. contributed reagents/materials/analysis tools; C.Z. wrote the paper; G.L., L.Z., and H.H.T. revised the paper.

Conflicts of Interest

The authors declare no conflict of interest. The founding sponsors had no role in the design of the study; in the collection, analyses, or interpretation of data; in the writing of the manuscript; or in the decision to publish the results.

References

  1. Seifritz, W. CO2 disposal by means of silicates. Nature 1990, 345, 486. [Google Scholar] [CrossRef]
  2. Park, A.-H.A.; Fan, L.-S. Mineral sequestration: Physically activated dissolution of serpentine and pH swing process. Chem. Eng. Sci. 2004, 59, 5241–5247. [Google Scholar] [CrossRef]
  3. Béarat, H.; McKelvy, M.J.; Chizmeshya, A.V.G.; Gormley, D.; Nunez, R.; Carpenter, R.W.; Squires, K.; Wolf, G.H. Carbon Sequestration via Aqueous Olivine Mineral Carbonation: Role of Passivating Layer Formation. Environ. Sci. Technol. 2006, 40, 4802–4808. [Google Scholar] [CrossRef] [PubMed]
  4. Intergovernmental Panel on Climate Change (IPCC). IPCC Special Report on Carbon Dioxide Capture and Storage; Cambridge University Press: Cambridge, UK, 2006; ISBN 978-0-521-68551-1. [Google Scholar]
  5. White, A.F.; Brantley, S.L. The effect of time on the weathering of silicate minerals: Why do weathering rates differ in the laboratory and field? Chem. Geol. 2003, 202, 479–506. [Google Scholar] [CrossRef]
  6. O’Connor, W.K.; Dahlin, D.C.; Nilsen, D.N.; Gerdemann, S.J.; Rush, G.E.; Penner, L.R.; Walters, R.P.; Turner, P.C. Continuing Studies on Direct Aqueous Mineral Carbonation of CO2 Sequestration; Albany Research Center: Albany, OR, USA, 2002.
  7. O’Connor, W.K.; Dahlin, D.C.; Rush, G.E.; Gedermann, S.J.; Penner, L.R.; Nilsen, D.N. Aqueous Mineral Carbonation; Albany Research Center: Albany, OR, USA, 2005.
  8. Rigopoulos, I.; Vasiliades, M.A.; Ioannou, I.; Efstathiou, A.M.; Godelitsas, A.; Kyratsi, T. Enhancing the rate of ex situ mineral carbonation in dunites via ball milling. Adv. Powder Technol. 2016, 27, 360–371. [Google Scholar] [CrossRef]
  9. Park, A.-H.A.; Jadhav, R.; Fan, L.-S. CO2 Mineral Sequestration: Chemically Enhanced Aqueous Carbonation of Serpentine. Can. J. Chem. Eng. 2003, 81, 885–890. [Google Scholar] [CrossRef]
  10. Andreani, M.; Luquot, L.; Gouze, P.; Godard, M.; Hoisé, E.; Gibert, B. Experimental Study of Carbon Sequestration Reactions Controlled by the Percolation of CO2-Rich Brine through Peridotites. Environ. Sci. Technol. 2009, 43, 1226–1231. [Google Scholar] [CrossRef] [PubMed]
  11. Huijgen, W.J.J.; Comans, R.N.J. Carbon Dioxide Sequestration by Mineral Carbonation: Literature Review; Energy Research Centre of the Netherlands ECN: Petten, The Netherlands, 2003. [Google Scholar]
  12. Azdarpour, A.; Asadullah, M.; Junin, R.; Manan, M.; Hamidi, H.; Daud, A.R.M. Carbon Dioxide Mineral Carbonation Through pH-swing Process: A Review. Energy Procedia 2014, 61, 2783–2786. [Google Scholar] [CrossRef]
  13. Azdarpour, A.; Asadullah, M.; Mohammadian, E.; Hamidi, H.; Junin, R.; Karaei, M.A. A review on carbon dioxide mineral carbonation through pH-swing process. Chem. Eng. J. 2015, 279, 615–630. [Google Scholar] [CrossRef]
  14. Rudnick, R.L.; Gao, S. Composition of the Continental Crust. Treatise Geochem. 2003, 3, 659. [Google Scholar] [CrossRef]
  15. Van Essendelft, D.T.; Schobert, H.H. Kinetics of the Acid Digestion of Serpentine with Concurrent Grinding. 1. Initial Investigations. Ind. Eng. Chem. Res. 2009, 48, 2556–2565. [Google Scholar] [CrossRef]
  16. Van Essendelft, D.T.; Schobert, H.H. Kinetics of the Acid Digestion of Serpentine with Concurrent Grinding. 2. Detailed Investigation and Model Development. Ind. Eng. Chem. Res. 2009, 48, 9892–9901. [Google Scholar] [CrossRef]
  17. Van Essendelft, D.T.; Schobert, H.H. Kinetics of the Acid Digestion of Serpentine with Concurrent Grinding. 3. Model Validation and Prediction. Ind. Eng. Chem. Res. 2010, 49, 1588–1590. [Google Scholar] [CrossRef]
  18. Hariharan, S.B.; Werner, M.; Zingaretti, D.; Baciocchi, R.; Mazzotti, M. Dissolution of Activated Serpentine for Direct Flue-Gas Mineralization. Energy Procedia 2013, 37, 5938–5944. [Google Scholar] [CrossRef]
  19. Farhang, F.; Rayson, M.; Brent, G.; Hodgins, T.; Stockenhuber, M.; Kennedy, E. Insights into the dissolution kinetics of thermally activated serpentine for CO2 sequestration. Chem. Eng. J. 2017, 330, 1174–1186. [Google Scholar] [CrossRef]
  20. Yoo, K.; Kim, B.-S.; Kim, M.-S.; Lee, J.; Jeong, J. Dissolution of Magnesium from Serpentine Mineral in Sulfuric Acid Solution. Mater. Trans. 2009, 50, 1225–1230. [Google Scholar] [CrossRef]
  21. Lacinska, A.M.; Styles, M.T.; Bateman, K.; Wagner, D.; Hall, M.R.; Gowing, C.; Brown, P.D. Acid-dissolution of antigorite, chrysotile and lizardite for ex situ carbon capture and storage by mineralisation. Chem. Geol. 2016, 437, 153–169. [Google Scholar] [CrossRef] [Green Version]
  22. Teir, S.; Kuusik, R.; Fogelholm, C.-J.; Zevenhoven, R. Production of magnesium carbonates from serpentinite for long-term storage of CO2. Int. J. Miner. Process. 2007, 85, 1–15. [Google Scholar] [CrossRef]
  23. Wang, X.; Maroto-Valer, M.M. Dissolution of serpentine using recyclable ammonium salts for CO2 mineral carbonation. Fuel 2011, 90, 1229–1237. [Google Scholar] [CrossRef]
  24. Zhu, C.; Zhao, L.; Gao, X.; Ji, J.; Chen, J. CO2 sequestration based study of reaction kinetics of brucite. Quat. Sci. 2011, 31, 438–446. (In Chinese) [Google Scholar] [CrossRef]
  25. Krevor, S.C.M.; Lackner, K.S. Enhancing serpentine dissolution kinetics for mineral carbon dioxide sequestration. Int. J. Greenh. Gas Control 2011, 5, 1073–1080. [Google Scholar] [CrossRef]
  26. Power, I.M.; Dipple, G.M.; Southam, G. Bioleaching of Ultramafic Tailings by Acidithiobacillus spp. for CO2 Sequestration. Environ. Sci. Technol. 2010, 44, 456–462. [Google Scholar] [CrossRef] [PubMed]
  27. Li, Z.; Xu, J.; Teng, H.H.; Liu, L.; Chen, J.; Chen, Y.; Zhao, L.; Ji, J. Bioleaching of Lizardite by Magnesium- and Nickel-Resistant Fungal Isolate from Serpentinite Soils—Implication for Carbon Capture and Storage. Geomicrobiol. J. 2015, 32, 181–192. [Google Scholar] [CrossRef]
  28. Chen, P.-C.; Kou, K.L.; Tai, H.K.; Jin, S.L.; Lye, C.L.; Lin, C.Y. Removal of carbon dioxide by reactive crystallization in a scrubber—Kinetics of barium carbonate crystals. J. Cryst. Growth 2002, 237, 2166–2171. [Google Scholar] [CrossRef]
  29. Chen, P.-C.; Chen, C.; Fun, M.; Liao, O.Y.; Jiang, J.; Wang, Y.; Chen, C. Mixing and Crystallization Kinetics in Gas-liquid Reactive Crystallization. Chem. Eng. Technol. 2004, 27, 519–528. [Google Scholar] [CrossRef]
  30. Chen, P.-C.; Shi, W.; Du, R.; Chen, V. Scrubbing of CO2 Greenhouse Gases, Accompanied by Precipitation in a Continuous Bubble-Column Scrubber. Ind. Eng. Chem. Res. 2008, 47, 6336–6343. [Google Scholar] [CrossRef]
  31. Kotaki, Y.; Tsuge, H. Reactive crystallization of calcium carbonate by gas-liquid and liquid-liquid reactions. Can. J. Chem. Eng. 1990, 68, 435–442. [Google Scholar] [CrossRef]
  32. Tamura, K.; Tsuge, H. Characteristics of multistage column crystallizer for gas–liquid reactive crystallization of calcium carbonate. Chem. Eng. Sci. 2006, 61, 5818–5826. [Google Scholar] [CrossRef]
  33. Ferrini, V.; De Vito, C.; Mignardi, S. Synthesis of nesquehonite by reaction of gaseous CO2 with Mg chloride solution: Its potential role in the sequestration of carbon dioxide. J. Hazard. Mater. 2009, 168, 832–837. [Google Scholar] [CrossRef] [PubMed]
  34. Harrison, A.L.; Power, I.M.; Dipple, G.M. Accelerated Carbonation of Brucite in Mine Tailings for Carbon Sequestration. Environ. Sci. Technol. 2013, 47, 126–134. [Google Scholar] [CrossRef] [PubMed]
  35. Han, B.; Qu, H.; Niemi, H.; Sha, Z.; Louhi-Kultanen, M. Mass Transfer and Kinetics Study of Heterogeneous Semi-Batch Precipitation of Magnesium Carbonate. Chem. Eng. Technol. 2014, 37, 1363–1368. [Google Scholar] [CrossRef]
  36. Hopkinson, L.; Rutt, K.; Cressey, G. The transformation of nesquehonite to hydromagnesite in the system CaO-MgO-H2O-CO2: An experimental spectroscopic study. J. Geol. 2008, 116, 387–400. [Google Scholar] [CrossRef] [Green Version]
  37. Ballirano, P.; De Vito, C.; Mignardi, S.; Ferrini, V. Phase transitions in the Mg-CO2-H2O system and the thermal decomposition of dypingite, Mg5(CO3)4(OH)2·5H2O: Implications for geosequestration of carbon dioxide. Chem. Geol. 2013, 340, 59–67. [Google Scholar] [CrossRef]
  38. Kristova, P.; Hopkinson, L.J.; Rutt, K.J.; Hunter, H.M.A.; Cressey, G. Carbonate mineral paragenesis and reaction kinetics in the system MgO-CaO-CO2-H2O in presence of chloride or nitrate ions at near surface ambient temperatures. Appl. Geochem. 2014, 50, 16–24. [Google Scholar] [CrossRef]
  39. Derks, P.W.J.; Versteeg, G.F. Kinetics of absorption of carbon dioxide in aqueous ammonia solutions. Energy Procedia 2009, 1, 1139–1146. [Google Scholar] [CrossRef]
  40. Darde, V.; Van Well, W.J.M.; Fosboel, P.L.; Stenby, E.H.; Thomsen, K. Experimental measurement and modeling of the rate of absorption of carbon dioxide by aqueous ammonia. Int. J. Greenh. Gas Control 2011, 5, 1149–1162. [Google Scholar] [CrossRef]
  41. Zeng, Q.; Guo, Y.; Niu, Z.; Lin, W. The absorption rate of CO2 by aqueous ammonia in a packed column. Fuel Process. Technol. 2013, 108, 76–81. [Google Scholar] [CrossRef]
  42. Pinsent, B.R.W.; Pearson, L.; Roughton, F.J.W. The kinetics of combination of carbon dioxide with hydroxide ions. Trans. Faraday Soc. 1956, 52, 1512–1520. [Google Scholar] [CrossRef]
  43. Hänchen, M.; Prigiobbe, V.; Baciocchi, R.; Mazzotti, M. Precipitation in the Mg-carbonate system—Effects of temperature and CO2 pressure. Chem. Eng. Sci. 2008, 63, 1012–1028. [Google Scholar] [CrossRef]
  44. Montes-Hernandez, G.; Renard, F.; Chiriac, R.; Findling, N.; Toche, F. Rapid Precipitation of Magnesite Microcrystals from Mg(OH)2-H2O-CO2 Slurry Enhanced by NaOH and a Heat-Aging Step (from ∼20 to 90 °C). Cryst. Growth Des. 2012, 12, 5233–5240. [Google Scholar] [CrossRef] [Green Version]
  45. Swanson, E.J.; Fricker, K.J.; Sun, M.; Park, A.-H.A. Directed precipitation of hydrated and anhydrous magnesium carbonates for carbon storage. Phys. Chem. Chem. Phys. 2014, 16, 23440–23450. [Google Scholar] [CrossRef] [PubMed]
  46. Sayles, F.L.; Fyfe, W.S. The crystallization of magnesite from aqueous solution. Geochim. Cosmochim. Acta 1973, 37, 87–99. [Google Scholar] [CrossRef]
  47. Königsberger, E.; Königsberger, L.-C.; Gamsjäger, H. Low-temperature thermodynamic model for the system Na2CO3-MgCO3-CaCO3-H2O. Geochim. Cosmochim. Acta 1999, 63, 3105–3119. [Google Scholar] [CrossRef]
  48. Braithwaite, C.J.R.; Zedef, V. Living hydromagnesite stromatolites from Turkey. Sediment. Geol. 1994, 92, 1–5. [Google Scholar] [CrossRef]
  49. Schroll, E. Genesis of magnesite deposits in the view of isotope geochemistry. Bol. Parana. Geocienc. 2002, 50, 59–68. [Google Scholar] [CrossRef]
  50. Parente, C.V.; Ronchi, L.H.; Sial, A.N.; Guillou, J.J.; Arthaud, M.H.; Fuzikawa, K.; Veríssimo, C.U.V. Geology and geochemistry of paleoproterozoic magnesite deposits (∼1.8Ga), State of Ceará, Northeastern Brazil. Carbonates Evaporites 2004, 19, 28–50. [Google Scholar] [CrossRef]
  51. Jull, A.J.T.; Cheng, S.; Gooding, J.L.; Velbel, M.A. Rapid growth of magnesium-carbonate weathering products in a stony meteorite from antarctica. Science 1988, 242, 417–419. [Google Scholar] [CrossRef] [PubMed]
  52. Power, I.M.; Wilson, S.A.; Thom, J.M.; Dipple, G.M.; Southam, G. Biologically induced mineralization of dypingite by cyanobacteria from an alkaline wetland near Atlin, British Columbia, Canada. Geochem. Trans. 2007, 8, 13. [Google Scholar] [CrossRef] [PubMed]
  53. Fischbeck, R.; Müller, G. Monohydrocalcite, hydromagnesite, nesquehonite, dolomite, aragonite, and calcite in speleothems of the Fränkische Schweiz, Western Germany. Contrib. Mineral. Petrol. 1971, 33, 87–92. [Google Scholar] [CrossRef]
  54. Davies, P.J.; Bubela, B. The Transformation of Nesquehonite to Hydromagnesite; Bureau of Mineral Resources, Geology and Geophysics; Bureau of Mineral Resources and Baas, Becking Geobiological Laboratory, Division of Mineralogy: Canberra, Australia, 1973; p. 31.
  55. Hopkinson, L.; Kristova, P.; Rutt, K.; Cressey, G. Phase transitions in the system MgO–CO2–H2O during CO2 degassing of Mg-bearing solutions. Geochim. Cosmochim. Acta 2012, 76, 1–13. [Google Scholar] [CrossRef]
  56. Zhang, Z.; Zheng, Y.; Ni, Y.; Liu, Z.; Chen, J.; Liang, X. Temperature- and pH-Dependent Morphology and FT−IR Analysis of Magnesium Carbonate Hydrates. J. Phys. Chem. B 2006, 110, 12969–12973. [Google Scholar] [CrossRef] [PubMed]
  57. Zhu, C.; Yao, X.; Zhao, L.; Teng, H.H. A composite reactor with wetted-wall column for mineral carbonation study in three-phase systems. Rev. Sci. Instrum. 2016, 87, 115115. [Google Scholar] [CrossRef] [PubMed]
  58. Zhao, L.; Zhu, C.; Ji, J.; Chen, J.; Teng, H.H. Thermodynamic and kinetic effect of organic solvent on the nucleation of nesquehonite. Geochim. Cosmochim. Acta 2013, 106, 192–202. [Google Scholar] [CrossRef]
  59. Zhu, C.; Wang, Z.; Zhao, L. The effect of solution chemistry on nucleation of nesquehonite. Am. J. Sci. 2016, 316, 1027–1053. [Google Scholar] [CrossRef]
  60. Schulz, K.G.; Riebesell, U.; Rost, B.; Thoms, S.; Zeebe, R.E. Determination of the rate constants for the carbon dioxide to bicarbonate inter-conversion in pH-buffered seawater systems. Mar. Chem. 2006, 100, 53–65. [Google Scholar] [CrossRef] [Green Version]
  61. Mani, F.; Peruzzini, M.; Stoppioni, P. CO2 absorption by aqueous NH3 solutions: Speciation of ammonium carbamate, bicarbonate and carbonate by a 13C NMR study. Green Chem. 2006, 8, 995. [Google Scholar] [CrossRef]
  62. Wang, X.; Conway, W.; Fernandes, D.; Lawrance, G.; Burns, R.; Puxty, G.; Maeder, M. Kinetics of the Reversible Reaction of CO2(aq) with Ammonia in Aqueous Solution. J. Phys. Chem. A 2011, 115, 6405–6412. [Google Scholar] [CrossRef] [PubMed]
  63. Clegg, S.L.; Whitfield, M. A chemical model of seawater including dissolved ammonia and the stoichiometric dissociation constant of ammonia in estuarine water and seawater from −2 to 40 °C. Geochim. Cosmochim. Acta 1995, 59, 2403–2421. [Google Scholar] [CrossRef]
  64. Earnshaw, A.; Greenwood, N. Chemistry of the Elements, Second Edition, 2nd ed.; Butterworth-Heinemann: Oxford, UK, 1997; ISBN 0-7506-3365-4. [Google Scholar]
  65. Hostetler, P.B. The degree of saturation of magnesium and calcium carbonate minerals in natural waters. Int. Assoc. Sci. Hydrol. Commun. Subterr. Waters Publ. 1964, 64, 34–49. [Google Scholar]
  66. Marion, G.M. Carbonate mineral solubility at low temperatures in the Na-K-Mg-Ca-H-Cl-SO4-OH-HCO3-CO3-CO2-H2O system. Geochim. Cosmochim. Acta 2001, 65, 1883–1896. [Google Scholar] [CrossRef]
  67. Blake, S.; Cuff, C. Preparation and Use of Cationic Halides, Sequestration of Carbon Dioxide 2007. Patent WO2007003013A1, 11 January 2007. [Google Scholar]
  68. Cheng, W.; Li, Z. Nucleation kinetics of nesquehonite (MgCO3·3H2O) in the MgCl2−Na2CO3 system. J. Cryst. Growth 2010, 312, 1563–1571. [Google Scholar] [CrossRef]
  69. Wang, D.; Li, Z. Gas–Liquid Reactive Crystallization Kinetics of Hydromagnesite in the MgCl2-CO2-NH3-H2O System: Its Potential in CO2 Sequestration. Ind. Eng. Chem. Res. 2012, 51, 16299–16310. [Google Scholar] [CrossRef]
  70. Haynes, W.M. CRC Handbook of Chemistry and Physics, 95th ed.; CRC press: Boca Raton, FL, USA, 2014. [Google Scholar]
  71. DeCoursey, W.J. Absorption with chemical reaction: Development of a new relation for the Danckwerts model. Chem. Eng. Sci. 1974, 29, 1867–1872. [Google Scholar] [CrossRef]
  72. Pinsent, B.R.W.; Pearson, L.; Roughton, F.J.W. The kinetics of combination of carbon dioxide with ammonia. Trans. Faraday Soc. 1956, 52, 1594–1598. [Google Scholar] [CrossRef]
  73. Qin, F.; Wang, S.; Hartono, A.; Svendsen, H.F.; Chen, C. Kinetics of CO2 absorption in aqueous ammonia solution. Int. J. Greenh. Gas Control 2010, 4, 729–738. [Google Scholar] [CrossRef]
  74. Crooks, J.E.; Donnellan, J.P. Kinetics and mechanism of the reaction between carbon dioxide and amines in aqueous solution. J. Chem. Soc. Perkin Trans. 2 1989, 0, 331–333. [Google Scholar] [CrossRef]
  75. Liu, J.; Wang, S.; Zhao, B.; Tong, H.; Chen, C. Absorption of carbon dioxide in aqueous ammonia. Energy Procedia 2009, 1, 933–940. [Google Scholar] [CrossRef]
  76. Zhao, L.; Sang, L.; Chen, J.; Ji, J.; Teng, H.H. Aqueous Carbonation of Natural Brucite: Relevance to CO2 Sequestration. Environ. Sci. Technol. 2010, 44, 406–411. [Google Scholar] [CrossRef] [PubMed]
  77. Highfield, J.; Lim, H.; Fagerlund, J.; Zevenhoven, R. Mechanochemical processing of serpentine with ammonium salts under ambient conditions for CO2 mineralization. RSC Adv. 2012, 2, 6542–6548. [Google Scholar] [CrossRef]
  78. Dell, R.M.; Weller, S.W. The thermal decomposition of nesquehonite MgCO3·3H2O and magnesium ammonium carbonate MgCO3·(NH4)2CO3·4H2O. Trans. Faraday Soc. 1959, 55, 2203–2220. [Google Scholar] [CrossRef]
  79. Power, I.M.; Harrison, A.L.; Dipple, G.M. Accelerating Mineral Carbonation Using Carbonic Anhydrase. Environ. Sci. Technol. 2016, 50, 2610–2618. [Google Scholar] [CrossRef] [PubMed]
  80. Levenspiel, O. Chemical Reaction Engineering, 3rd ed.; Wiley: New York, NY, USA, 1999; ISBN 0-471-25424-X. [Google Scholar]
  81. Hollingbery, L.A.; Hull, T.R. The fire retardant behaviour of huntite and hydromagnesite—A review. Polym. Degrad. Stab. 2010, 95, 2213–2225. [Google Scholar] [CrossRef]
  82. Hollingbery, L.A.; Hull, T.R. The fire retardant effects of huntite in natural mixtures with hydromagnesite. Polym. Degrad. Stab. 2012, 97, 504–512. [Google Scholar] [CrossRef]
  83. Hull, T.R.; Witkowski, A.; Hollingbery, L. Fire retardant action of mineral fillers. Polym. Degrad. Stab. 2011, 96, 1462–1469. [Google Scholar] [CrossRef]
  84. Glasser, F.P.; Jauffret, G.; Morrison, J.; Galvez-Martos, J.-L.; Patterson, N.; Imbabi, M.S.-E. Sequestering CO2 by Mineralization into Useful Nesquehonite-Based Products. Front. Energy Res. 2016, 4. [Google Scholar] [CrossRef]
  85. Walling, S.A.; Provis, J.L. Magnesia-Based Cements: A Journey of 150 Years, and Cements for the Future? Chem. Rev. 2016, 116, 4170–4204. [Google Scholar] [CrossRef] [PubMed]
  86. Jones, B.F.; Deocampo, D.M. Geochemistry of Saline Lakes. In Treatise on Geochemistry; Elsevier: Amsterdam, The Netherlands, 2003; pp. 393–424. ISBN 978-0-08-043751-4. [Google Scholar]
  87. Zhang, B. Development and Countermeasures of Magnesium Salt Industry in Salt Lakes of Qaidam Basin. Sea Lake Salt Chem. Ind. 2001, 17–21. (In Chinese) [Google Scholar] [CrossRef]
Figure 1. Schemes of the experimental setup for CO2 absorption and Mg-carbonate precipitation kinetic study: (a) Core of the modified wetted-wall column (part A), achieving gas absorption into solution through a measurable contact layer; (b) parts that constitute the whole experimental system (A: wetted-wall column; B: circulating water; C: damper; D: spectrophotometer; E: peristaltic pump; F: jacket reactor; G: pH electrode with temperature sensor; H: high-performance liquid chromatography (HPLC) pump; I: reactant tank; J: dehydration; K: three-way valve; L: gas analyzer; M: saturator; N: rotameter; O: needle valve; P: mass flow meter; Q: CO2 cylinder; R: N2 cylinder).
Minerals 07 00172 g001
Figure 2. Saturation index SI, logΩ of nesquehonite and brucite versus concentrations of TC and TN. The 3D surface graph on the left shows that with careful chosen of solution composition, nesquehonite can be kept oversaturated (SI > 0) while brucite can be kept undersaturated (SI < 0). The 2D lines on the right (slice 1 and slice 2) indicate the preferred solution chemistry (shaded area) to produce pure nesquehonite at constant TC (0.1 mol · L 1 , slice 1) or TN (0.4 mol · L 1 , slice 2). Mg concentration is set as 0.10 mol · L 1 , and temperature is 25 °C.
Minerals 07 00172 g002
Figure 3. CO2 absorption data of several experiments with various initial Mg concentration C M g 0 but same pH (9.00): (a) Amount of carbon absorbed against experiment duration; (b) CO2 absorption rate ( φ CO 2 ) at the beginning (averaged over the initial two minutes) and near the end (averaged over four hours, the full duration of the experiment).
Minerals 07 00172 g003
Figure 4. CO2 absorption data of several experiments with various solution pH but same C M g 0 (0.10 mol · L 1 ): (a) Amount of carbon absorbed against experiment duration; (b) CO2 absorption rate ( φ CO 2 ) at the beginning and near the end. Initial and final rates of the same experiment are placed side by side.
Minerals 07 00172 g004
Figure 5. X-ray diffraction patterns of solid samples: (a) Mg-carbonate precipitated under various initial NH4Cl concentrations; (b) Mg-carbonate separated after washing in water for 1 h at different temperatures.
Minerals 07 00172 g005aMinerals 07 00172 g005b
Figure 6. Temporal evolution of solution chemistry from experiment C: (a) Concentration of carbonic species; (b) concentration of magnesium species; (c) concentration of ammonium species; (d) SI of nesquehonite and brucite.
Minerals 07 00172 g006
Figure 7. A schematic diagram of CO2 mass transfer process from gas phase to solution. Gas and solution diffusion film are on both sides of the interface, respectively, limiting the CO2 absorption rate ( φ CO 2 ). In this work, the pressure gradient ( Δ P CO 2 ) is approximated to the bulk pressure ( P CO 2 b u l k ) due to neglectable CO2(aq) concentration ( C CO 2 b u l k , ~10−5 mol · L 1 ) in solution under experimental pH ranges.
Minerals 07 00172 g007
Figure 8. Experimental enhancement factor ( E e x p ) vs theoretical calculation ( E c a l ): (a) fixed k a p p ; (b) linear relationship with C NH 3 ( aq ) .
Minerals 07 00172 g008
Figure 9. Factors that affect CO2 reaction kinetics in the liquid side: (a) Rate contribution of H2O, OH and NH3(aq) to CO2 consumption in solution-side diffusive film. k x C x represents the pseudo first-order rate constant of species x to react with CO2. (b) Various dependency of k a p p on NH3(aq) concentration.
Minerals 07 00172 g009
Figure 10. Rate of CO2 absorption ( φ CO 2 ) and nesquehonite precipitation ( φ p ) in experiment C: (a) Temporal evolution of amount of CO2 absorbed and nesquehonite precipitated. The space between two lines is the amount of CO2 preserved in the solution as DIC. (b) Rate of absorption vs precipitation. CO2 is efficiently converted to nesquehonite when φ p > φ CO 2 .
Minerals 07 00172 g010
Table 1. Chemistry of starting solutions for CO2 absorption and Mg-carbonate precipitation experiments. Reaction temperature was kept at 25 °C.
IDBasepH 1 C M g 0 2 C N H 4 C l 0 DurationMg-Carbonate Phase 3tind 4
m o l · L 1 m o l · L 1 ss
ANH39.000.000.016,532N/A-
BNH39.000.050.022,728Nes12,792
CNH39.000.100.019,117Nes9302
DNH39.000.200.022,416Nes7899
ENH38.760.100.020,000Nes11,222
FNH39.160.100.018,380Nes8036
GNH39.740.100.018,839Nes4185
HNH39.200.202.028,800Nes + Rog-
INH39.630.206.719,740Rog-
XNaOH9.000.000.016,353N/A-
1 pH indicates the solution pH value maintained by the pH controller; 2 C Mg 0 and C NH 4 Cl 0 represent initial Mg and NH4Cl concentrations; 3 “Nes” and “Rog” represent nesquehonite and roguinite [ ( NH 4 ) 2 Mg ( CO 3 ) 2 · 4 H 2 O ] respectively; 4 tind represents the time lag of nesquehonite precipitation.
Table 2. Equilibrium constants of various ionic reactions in bulk solution at 25 °C and their sources.
EquationpK 1Source
(1)5.86[60]
(2)−8.03Calculated 2
(3)−3.29[61,62]
(12)−9.24[63]
(13)10.32[64]
(14)−6.37[64]
(15)−5.34[65,66,67,68,69] 3
1 pK is defined as –log(K); 2 Calculated from the equilibrium constants of Equation (1) and pure water (pKw = 14); 3 Average value of nesquehonite solubility product in the literature.
Table 3. Solution chemistry and CO2 absorption kinetics data for experiments C and E–G.
IDTimepHTN C N H 3 ( a q ) DIC C M g k o v k l E e x p E c a l
s m o l · L 1 × 10 7 m o l · m 2 · P a 1 · s 1
E4069.1460.0070.0020.0030.1030.510.521.381.50
22068.7710.0170.0030.0080.1020.440.451.191.50
40068.7610.0270.0040.0150.1020.440.451.191.53
58068.7860.0410.0070.0220.1010.580.601.571.60
76068.7550.0580.0090.0300.1010.580.601.571.68
94068.7150.0590.0090.0410.1050.580.601.571.64
11,2068.7630.0750.0120.0460.1020.580.601.571.72
12,4068.7600.0920.0150.0510.1020.580.601.571.81
13,6068.7760.1100.0180.0550.0990.650.671.771.90
14,8068.7840.1090.0180.0600.0990.650.671.771.87
16,0068.7530.1300.0200.0650.0980.650.671.771.95
17,2068.7310.1510.0230.0620.0890.650.671.772.01
18,4068.7470.1490.0230.0570.0780.650.671.771.98
19,6068.7460.2120.0330.0540.0680.650.671.772.25
20,8068.7660.1840.0300.0530.0620.650.671.772.13
22,0068.7650.2170.0350.0510.0560.650.671.772.25
C3169.4560.0150.0070.0030.1020.540.561.471.71
15169.0380.0200.0050.0090.1030.540.561.471.62
27168.9960.0330.0080.0130.1020.540.561.471.70
39169.0040.0390.0100.0230.1070.540.561.471.72
51168.9990.0590.0150.0260.1050.540.561.471.89
63168.9990.0680.0170.0320.1050.610.631.661.91
75169.0000.0980.0240.0380.1050.680.711.862.14
93168.9990.1070.0260.0490.1050.750.782.052.12
10,5168.9990.1490.0360.0520.1010.750.782.052.38
11,7169.0000.1560.0380.0490.0920.820.862.252.36
12,9168.9990.1690.0420.0400.0750.900.932.462.39
14,1169.0000.1860.0470.0350.0620.900.932.462.46
15,3169.0000.2540.0630.0360.0540.900.932.462.79
16,5168.9980.2550.0640.0370.0480.820.862.252.77
17,7169.0000.2730.0690.0390.0420.900.932.462.84
18,9169.0000.2970.0740.0430.0380.900.932.462.92
F2639.4850.0120.0060.0030.1020.580.601.581.60
14639.1720.0240.0080.0080.1020.510.531.391.70
26639.1610.0340.0110.0140.1020.580.601.581.72
38639.1610.0480.0160.0190.1020.650.671.771.84
50639.1550.0690.0220.0250.1020.650.671.772.02
62639.1640.0960.0310.0310.1010.720.751.972.23
74639.1550.0900.0290.0410.1040.870.902.372.11
86639.1640.1300.0420.0470.1020.870.902.372.41
98639.1570.1100.0350.0560.1020.940.982.582.19
11,0639.1620.1510.0480.0580.0961.011.062.782.47
12,2639.1540.1450.0460.0560.0841.081.143.002.38
13,4639.1550.1830.0590.0520.0691.161.223.212.61
14,6639.1600.2500.0800.0520.0601.231.303.432.98
15,8639.1650.3470.1110.0540.0501.301.393.653.43
17,0639.1580.3410.1080.0590.0441.381.473.873.37
18,2639.1580.3560.1120.0670.0391.381.473.873.41
G1799.4600.0090.0050.0020.0910.520.531.401.57
19799.7030.0520.0330.0100.0890.880.912.402.16
37799.6900.1300.0810.0260.0911.171.243.263.01
49799.6960.1520.0950.0350.0891.401.493.933.15
61799.6900.2600.1610.0430.0841.631.764.633.97
73799.7000.3150.1970.0420.0681.872.045.374.31
85799.6890.3700.2290.0450.0542.112.346.144.60
97799.6930.4170.2570.0550.0452.282.546.684.83
10,9799.6930.5570.3380.0670.0372.452.757.245.50
13,9799.6990.8150.4770.1100.0242.793.198.416.47
Table 4. Comparison of kinetic constants in the literature at 25 °C.
C N H 3 ( a q ) T k a p p 1 k 2 2Sources
m o l · L 1 °C m 3 · m o l 1 · s 1
0.027–0.190–400.44-[72]
0.002–0.01615–450.45-[62]
0.1–75–250.37–1.30 12.8 [39]
0.9–5.425–490.94–0.95 1.23 × 10 7 [73]
0.6–5.66–310.95–1.14 59.0 [40]
0.002–0.62250.32–0.95-This work
1 Apparent kinetic rate constant between CO2 and NH3(aq) within concentration range in this work ( C NH 3 ( aq ) =   0.002 0.62   mol · L 1 ); 2 Rate constant of zwitterion formation reaction (Equation (7)).

