Thermal Stability of Woolly Erionite-K and Considerations about the Heat-Induced Behaviour of the Erionite Group
by
 , , and
Paolo Ballirano
1,2,* ,
,
Alessandro Pacella
1,
Andrea Bloise
3,
Matteo Giordani
4 and
Michele Mattioli
4
1
Department of Earth Sciences, Sapienza University of Rome, Piazzale A. Moro 5, I-00185 Rome, Italy
2
Rectorial Laboratory Fibres and Inorganic Particulate, Sapienza University of Rome, Piazzale A. Moro 5, I-00185 Rome, Italy
3
Department of Biology, Ecology and Earth Sciences, University of Calabria, Via Pietro Bucci, I-87036 Rende, CS, Italy
4
Department of Pure and Applied Sciences, University of Urbino Carlo Bo, Piazza della Repubblica 13, I-61029 Urbino, PU, Italy
*
Author to whom correspondence should be addressed.
Minerals 2018, 8(1), 28; https://doi.org/10.3390/min8010028
Submission received: 30 December 2017
/
Revised: 15 January 2018
/
Accepted: 17 January 2018
/
Published: 19 January 2018
(This article belongs to the Special Issue Natural Zeolites)
Abstract
:The thermal behavior of a woolly erionite-K sample (Lander County, NV, USA), chemical formula (Ca2.03Na0.73K2.52Mg0.26)[Al8.22Si27.78O71.80]·35.94H2O, was investigated in the 303–1173 K thermal range by in situ X-ray powder diffraction. Present data suggest a general thermally-induced volume contraction whose magnitude increases as ratio becomes smaller. An inverse correlation between ratio and Tdehydr is observed because higher ratio values are associated to lower dehydration temperatures. A positive dependence exists between ratio and Tbreak. A higher Si content results in a greater thermal stability, in agreement with the general trend observed in zeolites. On the contrary, no correlation has been found between Tbreak and weighted ionic potential (Z/r)wt as suggested by reference data. Heating produces a general depletion of the Ca1, Ca2, Ca3, and K1 sites, which is counterbalanced by an increase of the K2 site scattering, even though the latter is not populated at RT. No “internal ion exchange” mechanism was apparently acting in the present sample differently from other erionite samples analysed in the past. At 303 K approximately 20 e− allocated at the OW H2O sites might be assigned to (extra-framework) EF cations. Such fraction increases due to their migration from the extra-framework cation sites following the same mechanism reported in reference data.
1. Introduction
Erionite (ERI) is a naturally-occurring zeolite, often characterized by fibrous morphology that pertains to the ABC-6 family [1]. In recent years, it has been the object of several papers aimed at investigating its health effects in humans as erionite has been classified as a Group-I carcinogen by the International Agency for Research on Cancer [2]. Relevantly, it has been recognized as responsible for the severe malignant mesothelioma (MM) epidemic occurring in the Cappadocia region, Turkey [3].
Erionite is hexagonal, space group P63/mmc [4] and may be described by the average formula K2(Na,Ca0.5)8[Al10Si26O72]·30H2O [5]. However, owing to its large chemical variability [6,7,8] erionite species were reclassified as erionite-K, -Na, and -Ca conforming to the most abundant extra-framework (EF) cation [5].
The aluminosilicate framework is made of columns of regularly-alternating cancrinite cages, and double 6-rings (D6R). The erionite cages are created by the linking at the same level, via single 6-rings, of cancrinite cages of adjacent columns [9,10]. The unit cell contains two cancrinite cages and two D6R superposed along 0, 0, z, and two erionite cavities whose axes run along 1/3, 2/3, z and 2/3, 1/3, z, respectively. The framework may be alternatively described by a hexagonal array of non-connected planar 6-rings, which are related by pure translations along a and b and are centred at (0,0) in the ab layer (A position). Subsequent layers are stacked along the z direction or at B position, shifted by +(2/3a + 1/3b) with respect to the first layer, or at C position shifted by −(2/3a + 1/3b) with respect to the first one, or at A position with no lateral shift with respect to the first layer. Erionite is characterized by the AABAAC stacking sequence. It is worth noting that even though 10 different sequences are theoretically possible for a period of six-layers, permitting the occurrence of both single- and double-rings [11,12], only four have been found to date in nature: AABAAC, erionite, AABBCC, chabazite [13], ABBACC, bellbergite [14], and ABABAC, liottite [15].
The erionite cage hosts EF cations and H2O, the formers being distributed among four cation sites, Ca1, Ca2, Ca3, and Mg, residing at or near the axis of the cavity [8,16,17]. Owing to short contacts, those sites are partly mutually excluding. A further EF cation site, labelled K2 and occupied by K, has often been observed in K-rich samples at the centre of the boat-shaped 8-member rings (8MR) forming the walls of the erionite cavity [8,17,18]. Each cancrinite cage hosts a potassium ion at the K1 site whereas D6R is empty. In the case of thermally treated samples, the so-called “internal ion exchange” mechanism has been observed [18], and EF cations located within the erionite cage drive the K ion from the K1 site, replacing it, during the dehydration process. The occurrence of such mechanism has been confirmed by in-situ X-ray powder diffraction (XRPD) experiments [19,20], carried out on samples of erionite-K and -Na from Rome, OR, USA. Differently from Bish and Carey [21], those experiments have shown the existence of significant differences regarding the thermal stability despite a similar weighted ionic potential (Z/r)wt and Si/Al ratio of the two samples that have been claimed to modulate such a property [22]. Erionite consistently shows a negative thermal expansion.
An investigation of the Fe(II) ion-exchange properties of erionite was recently performed on a woolly sample from Lander County, NV, USA [23]. The sample, firstly described by [24] and classified as erionite-K, is characterized by a crystal chemical formula (Ca2.03Na0.73K2.52Mg0.26)[Al8.22Si27.78O71.80]·35.94H2O. The corresponding ratio of 0.772 is significantly smaller than that of the two samples of erionite (0.796–0.807) investigated by Ballirano and Cametti [19] and Ballirano and Pacella [20] potentially representing a valuable complement for modelling the thermal behaviour of the group. Therefore, the present work investigates the thermally-induced structural modifications of the woolly sample from Lander County, NV, USA by in situ laboratory focusing-beam transmission X-ray powder diffraction data (XRPD), comparing its behaviour with that of reference data, the aim being to define possible correlations between thermal stability and chemical composition.
2. Materials and Methods
The woolly erionite-K sample was disaggregated with a needle and gently ground in an agate mortar. The resulting powder was loaded in a 0.7 mm diameter SiO2-glass capillary, open at both ends. The powder was packed between two flocks of high-temperature insulating wool (HTIW) lying at both ends of the capillary to avoid any unwanted movement of the powder during measurements and to allow H2O evacuation. The capillary was fixed to a 1.0 mm diameter Al2O3 tube using a high-purity alumina ceramic. Data were collected on a focusing-beam D8 Advance (Bruker AXS, Karlsruhe, Germany), operating in transmission mode and θ-θ geometry, which is fitted with a prototype of capillary heating chamber [25].
Non-ambient data were collected in the 6–145° 2θ angular range, step size 0.022° 2θ, 2 s of counting time, 303–1173 K thermal range, and temperature steps of 15 K. The sample was heated at a rate of 6 K min−1 adopting a re-equilibration time of 60 s before starting the measurement at each temperature. The temperature stability was of ±1 K. A magnified view of the full dataset is reported in Figure 1. Preliminary scrutiny of the data indicated the occurrence of traces of calcite and quartz. The cell parameters of the latter were used as additional check of the calibration of the thermocouple.
Rietveld refinements were carried out using TOPAS V.4.2 (Bruker AXS, Karlsruhe, Germany) [26]. Details about the refinement strategy may be found in Ballirano and Cametti [19], and Ballirano and Pacella [20]. Starting structural data were taken from Pacella et al. [23]. No restraints on bond distances and angles were imposed. Owing to the peculiar habit of the fibres, we applied the ellipsoid-model of [27] describing the diffraction-vector dependent broadening of diffraction maxima as successfully done by Cametti et al. [28] in the case of woolly erionite-Na from Durkee, OR, USA. The shape ellipsoid parameters bij were constrained as b11 = b22 = 2b12; b13 = b23 = 0, and the orientation of the ellipsoid has the principal radii ra ⊥ c and rc ‖ c.
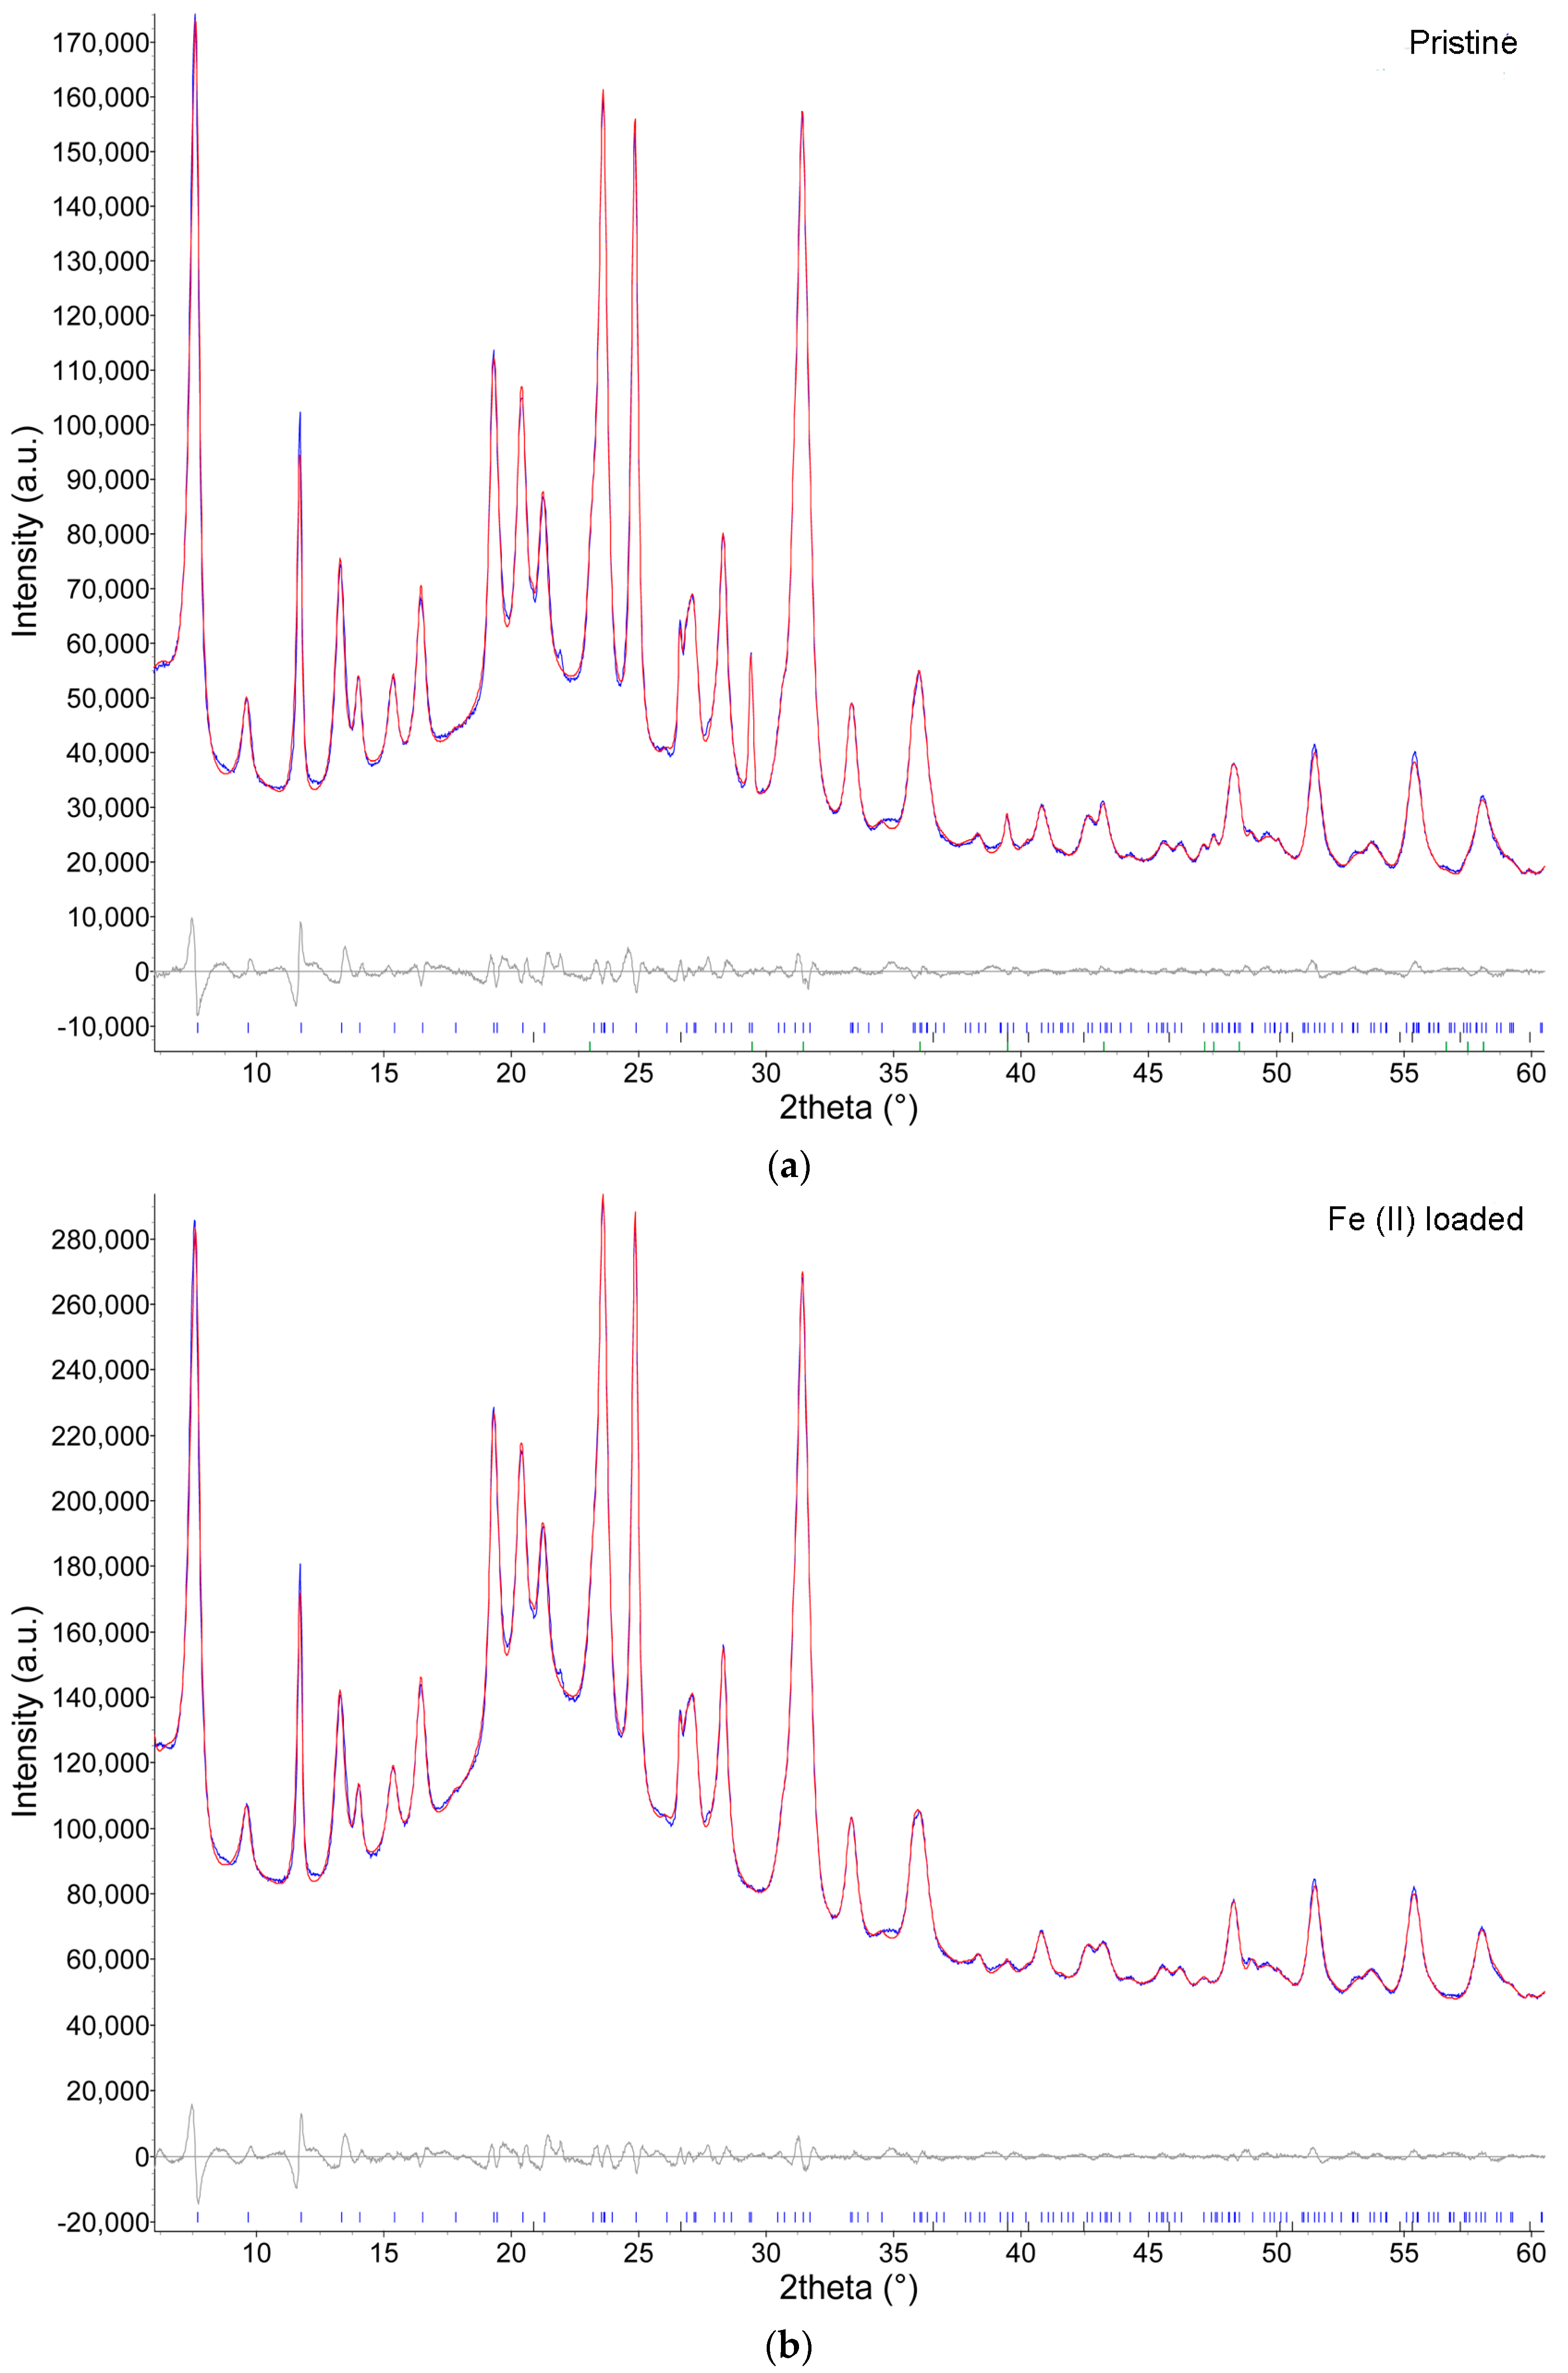
Examples of Rietveld plots of the data collected at 303 and 1098 K are shown in Figure 2, experimental details and miscellaneous data of the refinements are reported in Table 1. Structural data at each temperature are deposited at the journal site as .cif files.
Thermogravimetric and differential scanning calorimetry (TG/DSC) were performed in an alumina crucible under a constant aseptic air flow with a Netzsch STA 449 C Jupiter (Netzsch-Gerätebau GmbH, Selb, Germany) in 299–1273 K temperature range, and a heating rate of 10 K min−1. Instrumental precision was checked by repeated collections on a kaolinite reference sample (four collections) revealing good reproducibility (instrumental theoretical T precision of ±1.2 °C), DSC detection limit < 1 µW, and a theoretical weight sensitivity of 0.10 µg. Derivative thermogravimetry (DTG), onset and derivative differential scanning calorimetry (DDSC) were obtained using Netzsch Proteus thermal analysis software (Netzsch-Gerätebau GmbH, Selb, Germany). Samples were powdered by dry-grinding in an agate mortar, about 11.0 mg of each sample was used in all collections.
Analyses were repeated twice, using both the pristine sample and a fully hydrated one obtained within a climatic chamber (Binder MKF). A sample was placed within a climatic chamber for 12 h with a relative humidity (RH) of 98%. No differences were observed in both TG and DSC curves. TG, DTG, DSC, and DDSC curves are shown in Supplementary Figure S1.
3. Results and Discussion
3.1. Cell Parameters and Volume Dependence from Temperature
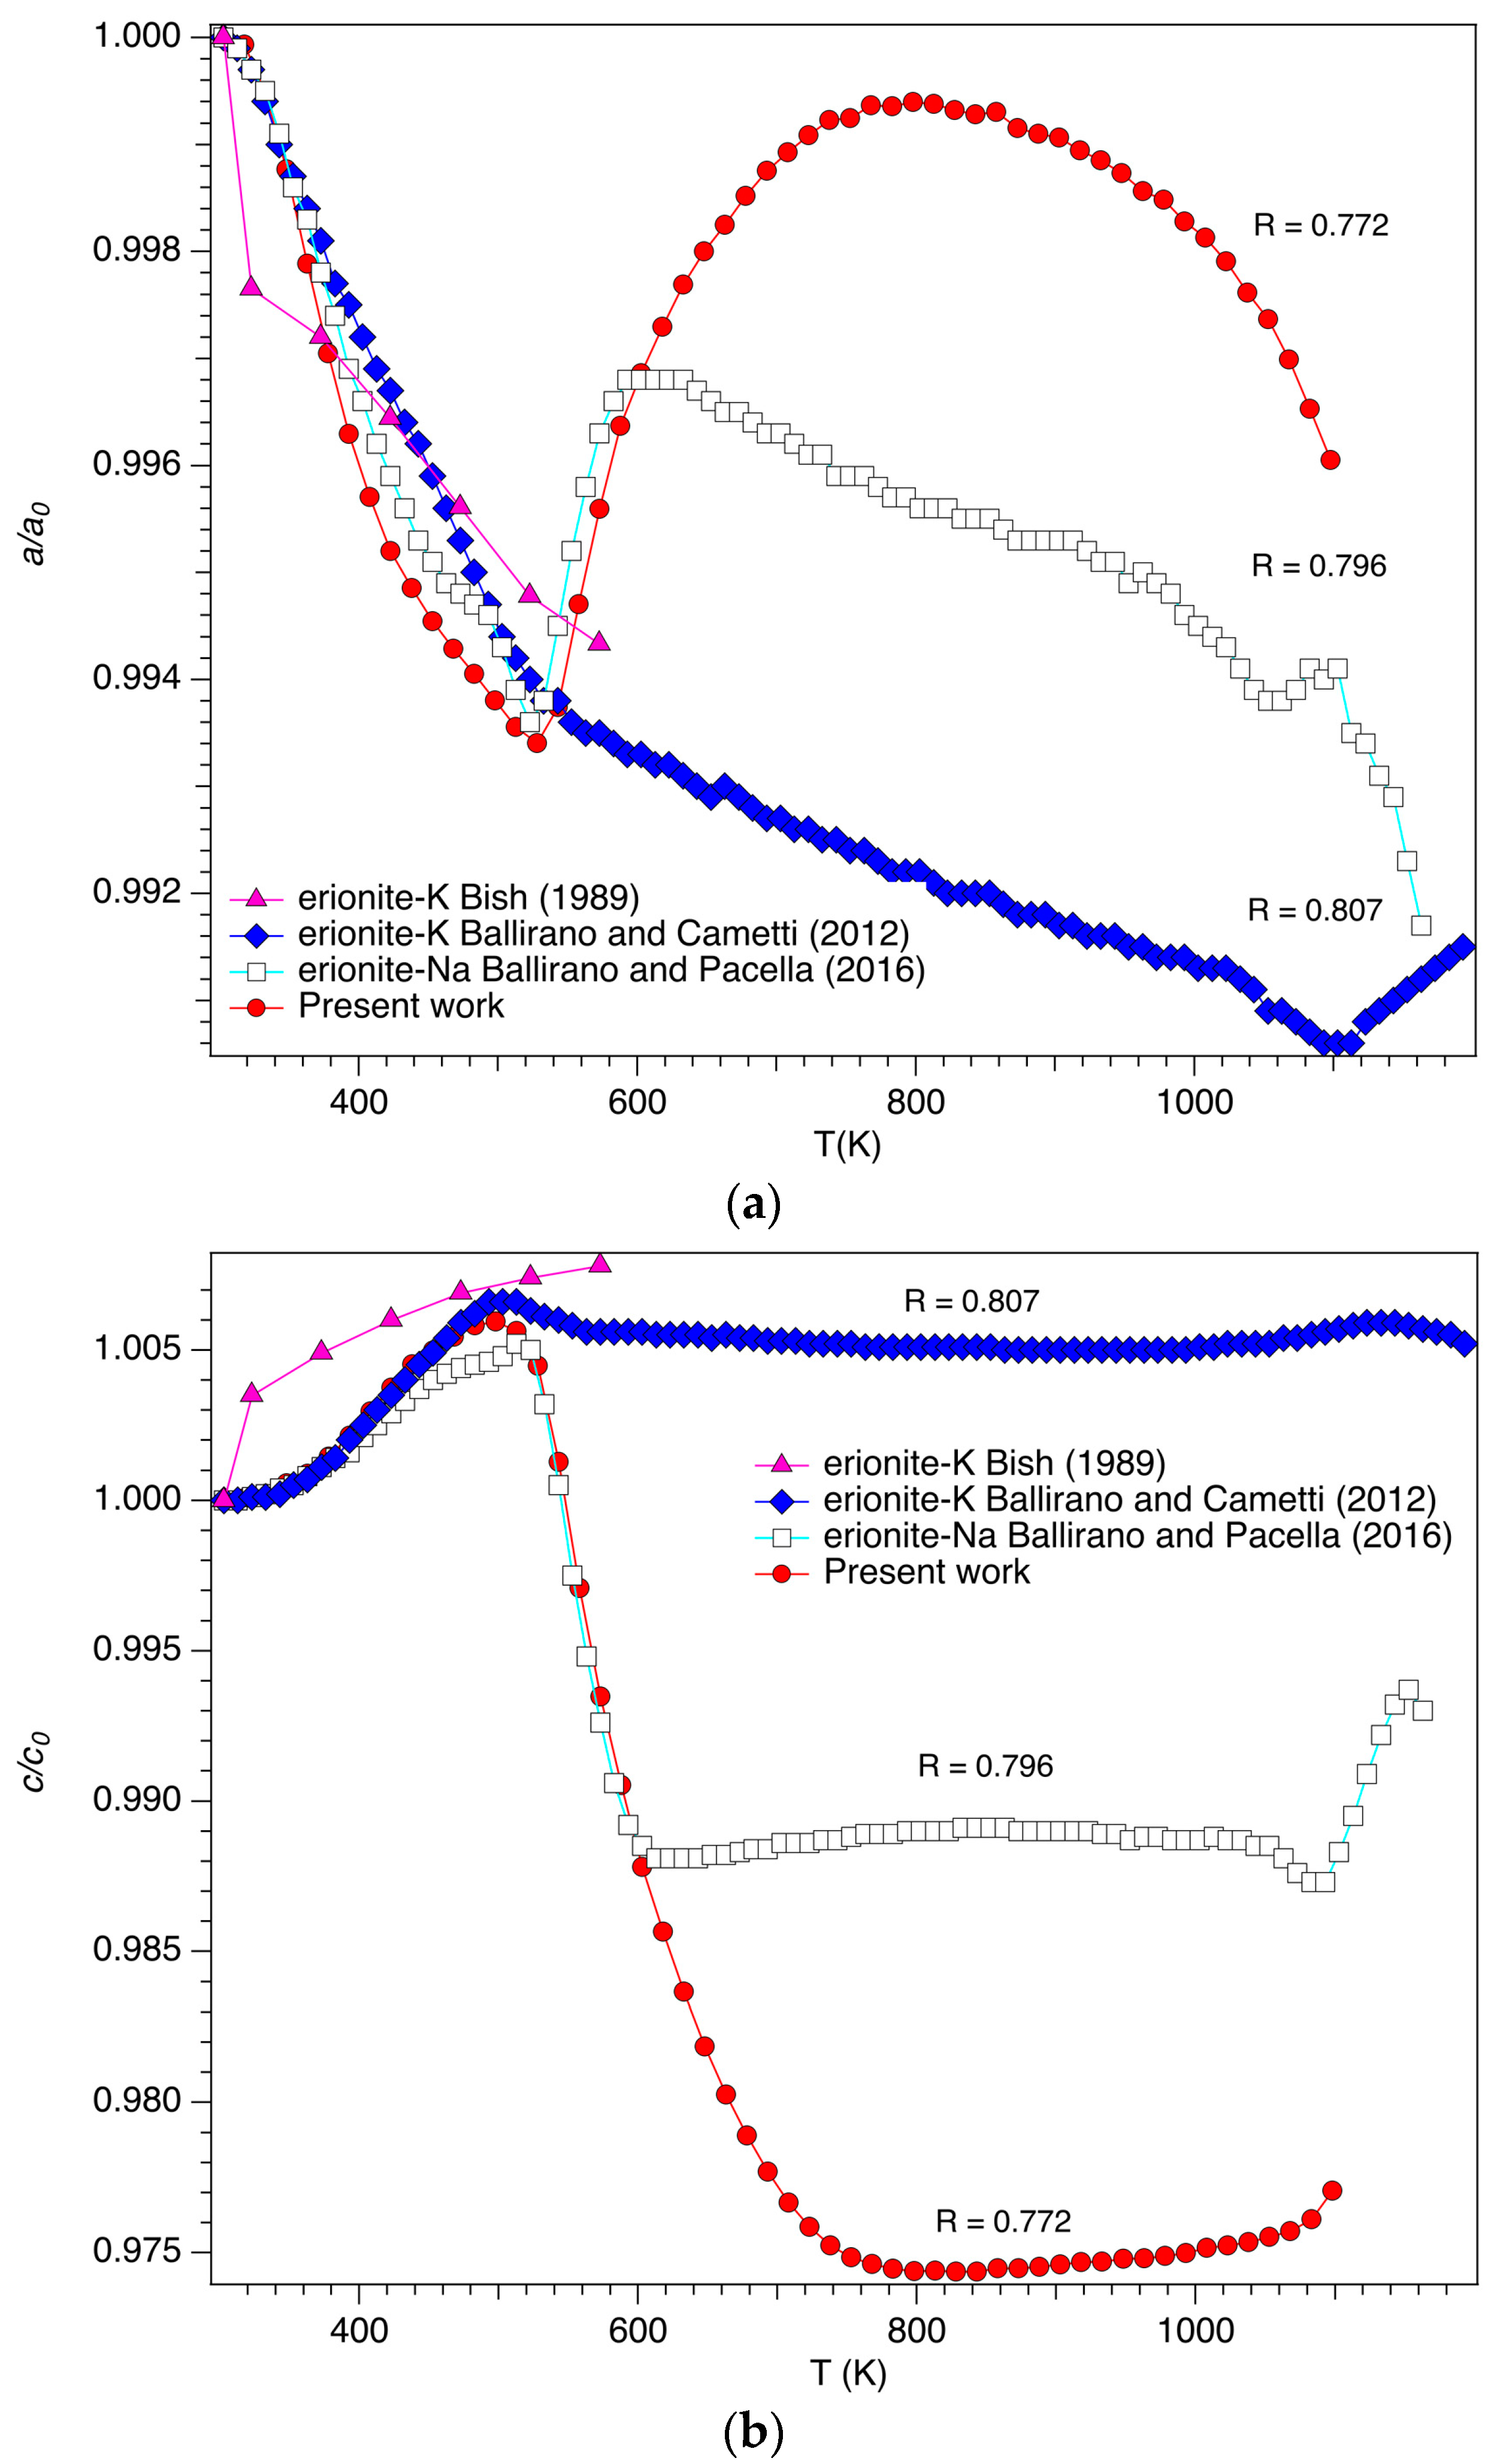
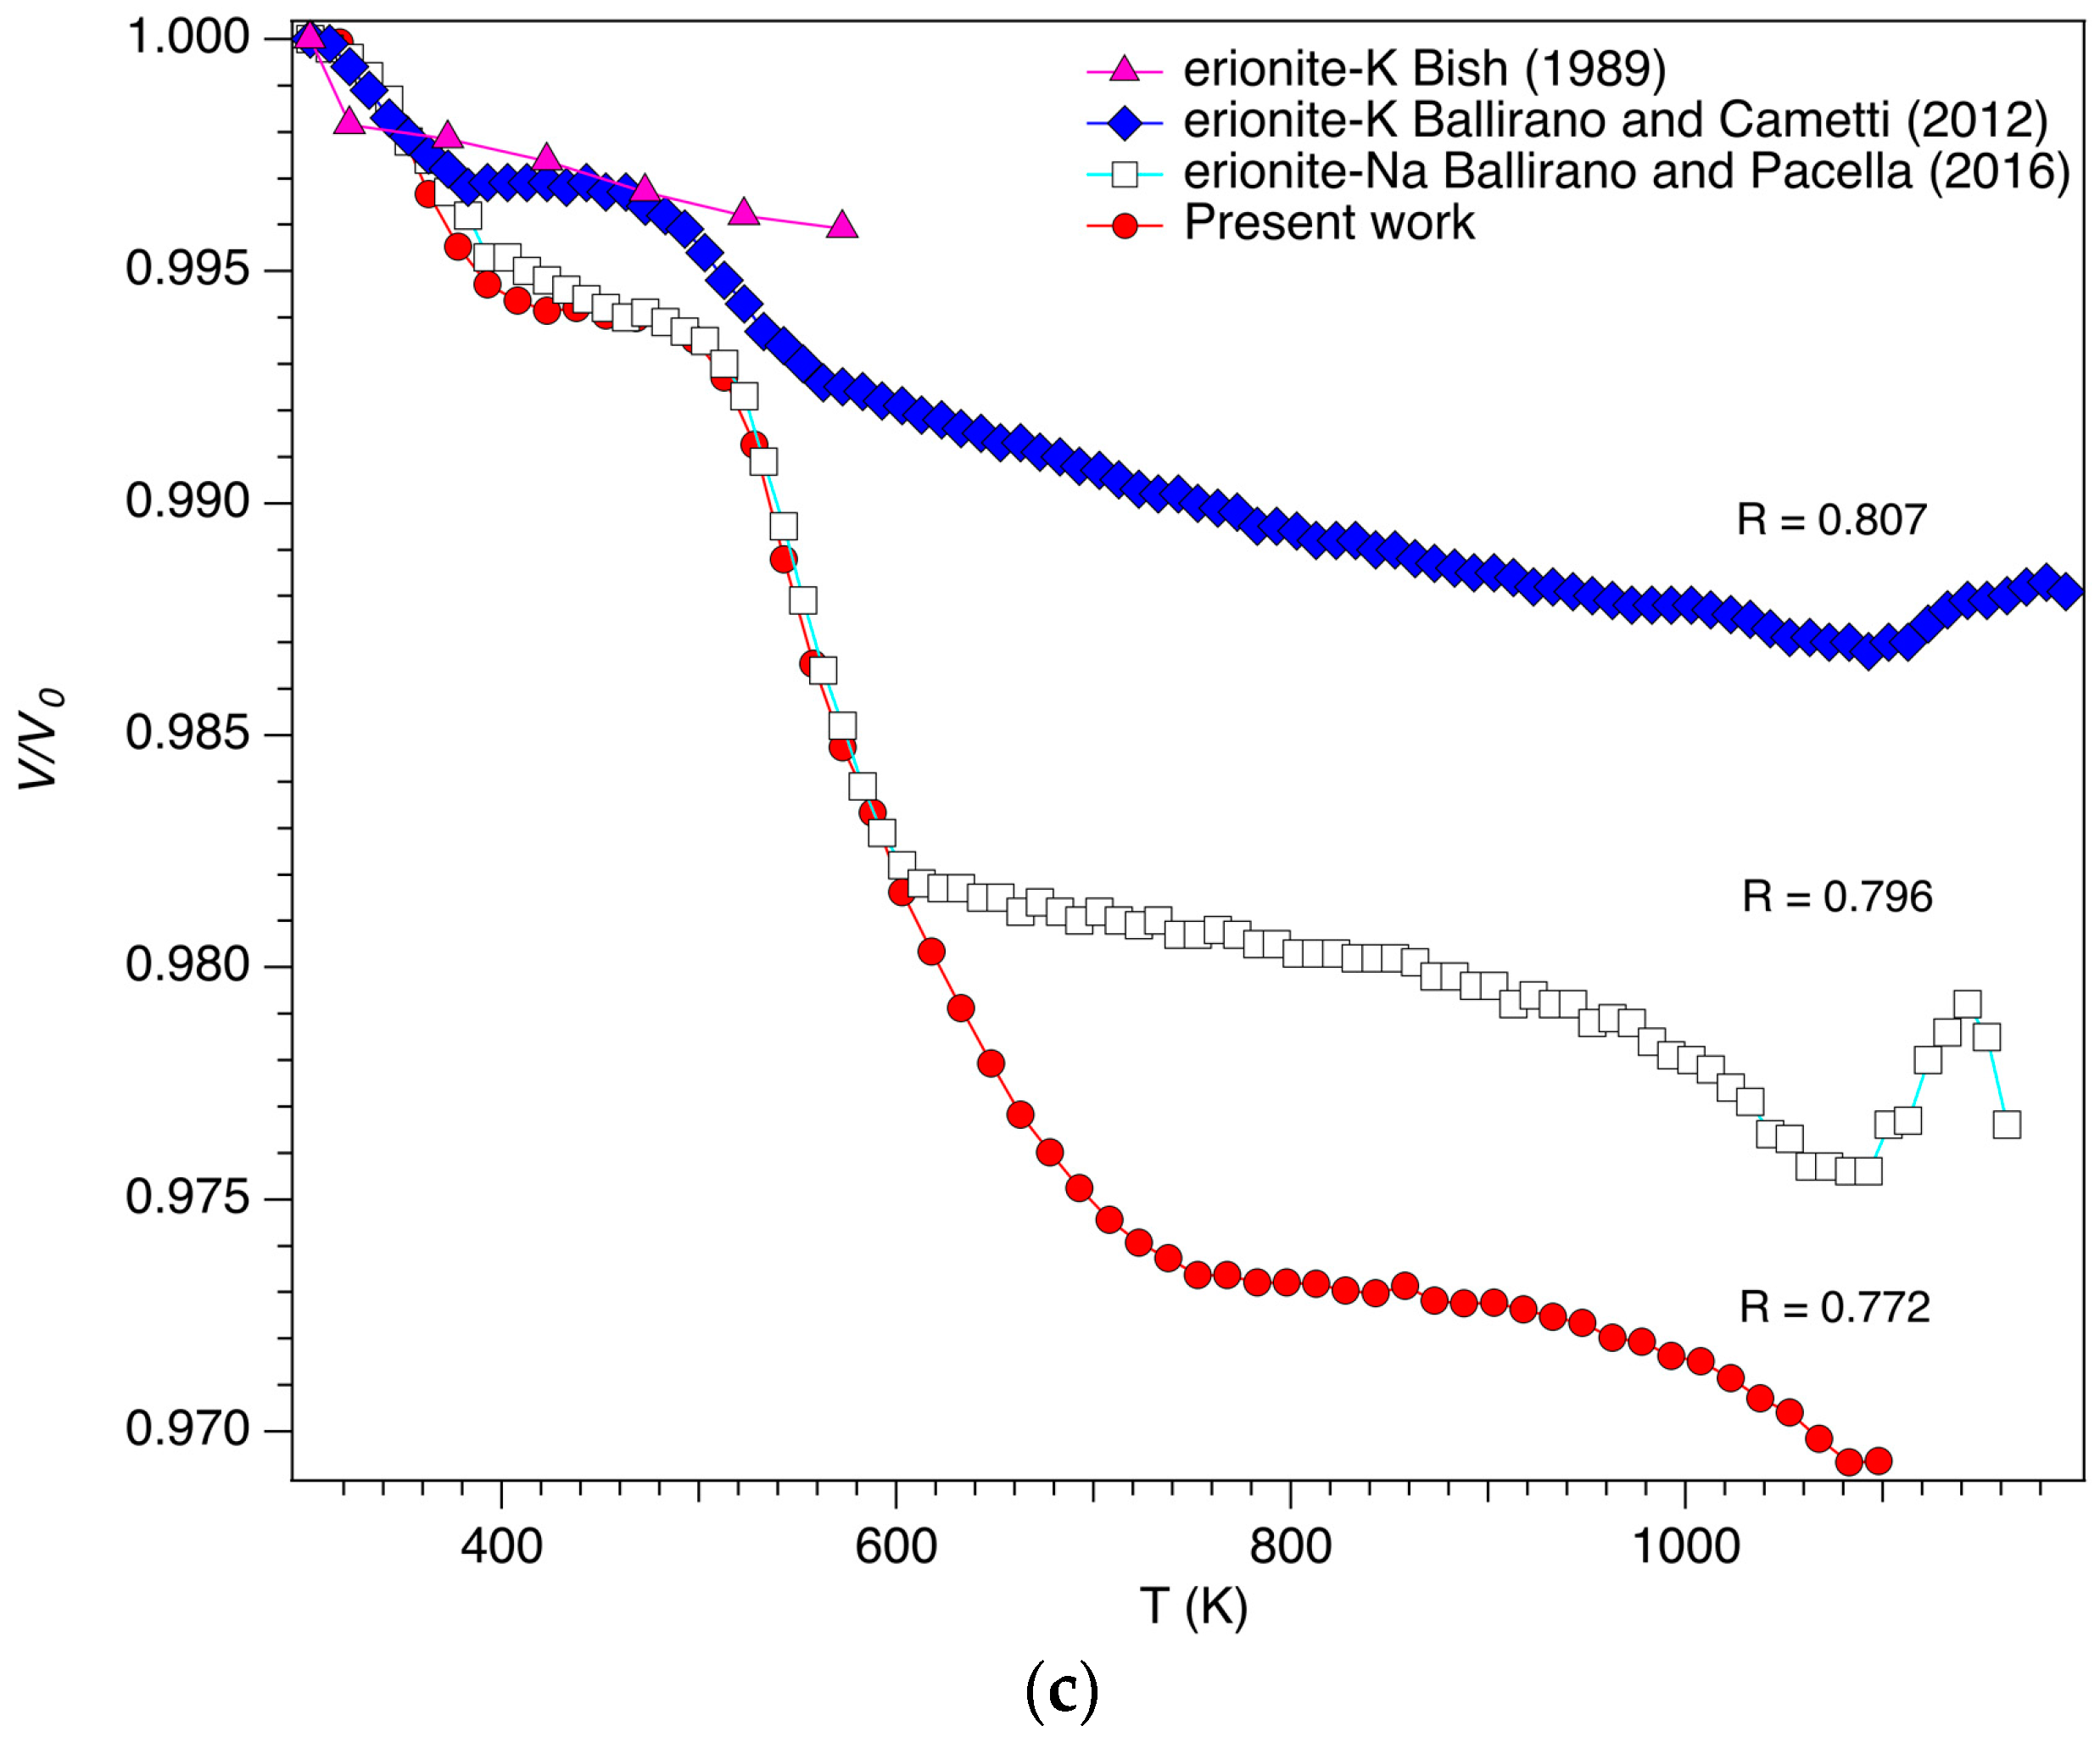
Cell parameters and volume at 303 K are consistent with those, measured at room temperature (RT: 298 K), reported by Pacella et al. [23] for a sample from the same locality. The structural breakdown, monitored from the increase of the background counterbalanced by a general intensity reduction of the Bragg reflections, starts at 1053 K (Tbreak) and is completed at 1158 K (Figure 1, Table 2). This value agrees with the onset at 1206 K of the DDSC endothermic peak observed at 1258 K (Supplementary Figure S1b) taking onto account of the different experimental conditions of the experiments as far as equilibrium is concerned. Those temperatures are higher than 1023 K, reported by Cruciani [22], for erionite-Ca but lower than those of the samples analysed by Ballirano and Cametti [19] and Ballirano and Pacella [20]. Table 2 clearly shows a positive dependence between the R ratio and Tbreak. A higher Si content imparts a higher thermal stability, in agreement with the general trend observed in zeolites [22]. Differently, no clear correlation has been observed between Tbreak and weighted ionic potential (Z/r)wt [22]. The dependence of cell parameters and volume from temperature is reported in Figure 3 under the form of relative expansion. The general trend may be described as a general volume contraction that increases as the ratio decreases. In the case of the present sample, the maximum contraction is observed at Tbreak and corresponds to ca. 3.2%. As previously reported [19,20] the detailed behaviour is much more complicated. In fact, the a-parameter contracts to a minimum value, which is reached at approximately 500 K and then increases back up to ca. 750 K before decreasing again. By comparing the present data with those of the erionite-Na [20] and -K [19] samples it is possible to observe a regular behaviour. In fact, as the ratio increases, the expansion of the a-parameter, following the discontinuity at ca. 500 K, reduces in magnitude and in the case of the erionite-K sample of Ballirano and Cametti [19] only a small deviation from the decreasing trend is observed. This behaviour may be explained by considering that the increased Si content renders the framework more rigid impeding the hysteresis of the expansion of the framework along the x-axis caused by the dehydration process and the corresponding EF cations sites rearrangement (see below). The dependence of the c-parameter of the erionite samples shows significant analogies with that of the a-parameter. In fact, following a moderate expansion (ca. 0.5%) up to ca. 500 K, the present sample, characterized by a relatively small ratio (0.772), significantly contracts along the z-axis (ca. 2.5%). A higher ratio reduces the contraction and in the case of the erionite-K sample of Ballirano and Cametti [19] having a ratio of 0.807, the c-parameter is unable to contracts significantly after the initial expansion owing to its higher Si content. Data of Bish [30] cannot, unfortunately, be included in the present discussion as they extend up to 573 K and where measured on an in vacuo dehydrated sample of erionite-K from Eastgate, NV, USA, to separate the dehydration-driven contraction from other thermally induced structural effects (Figure 3).
3.2. Structural Modifications: Framework
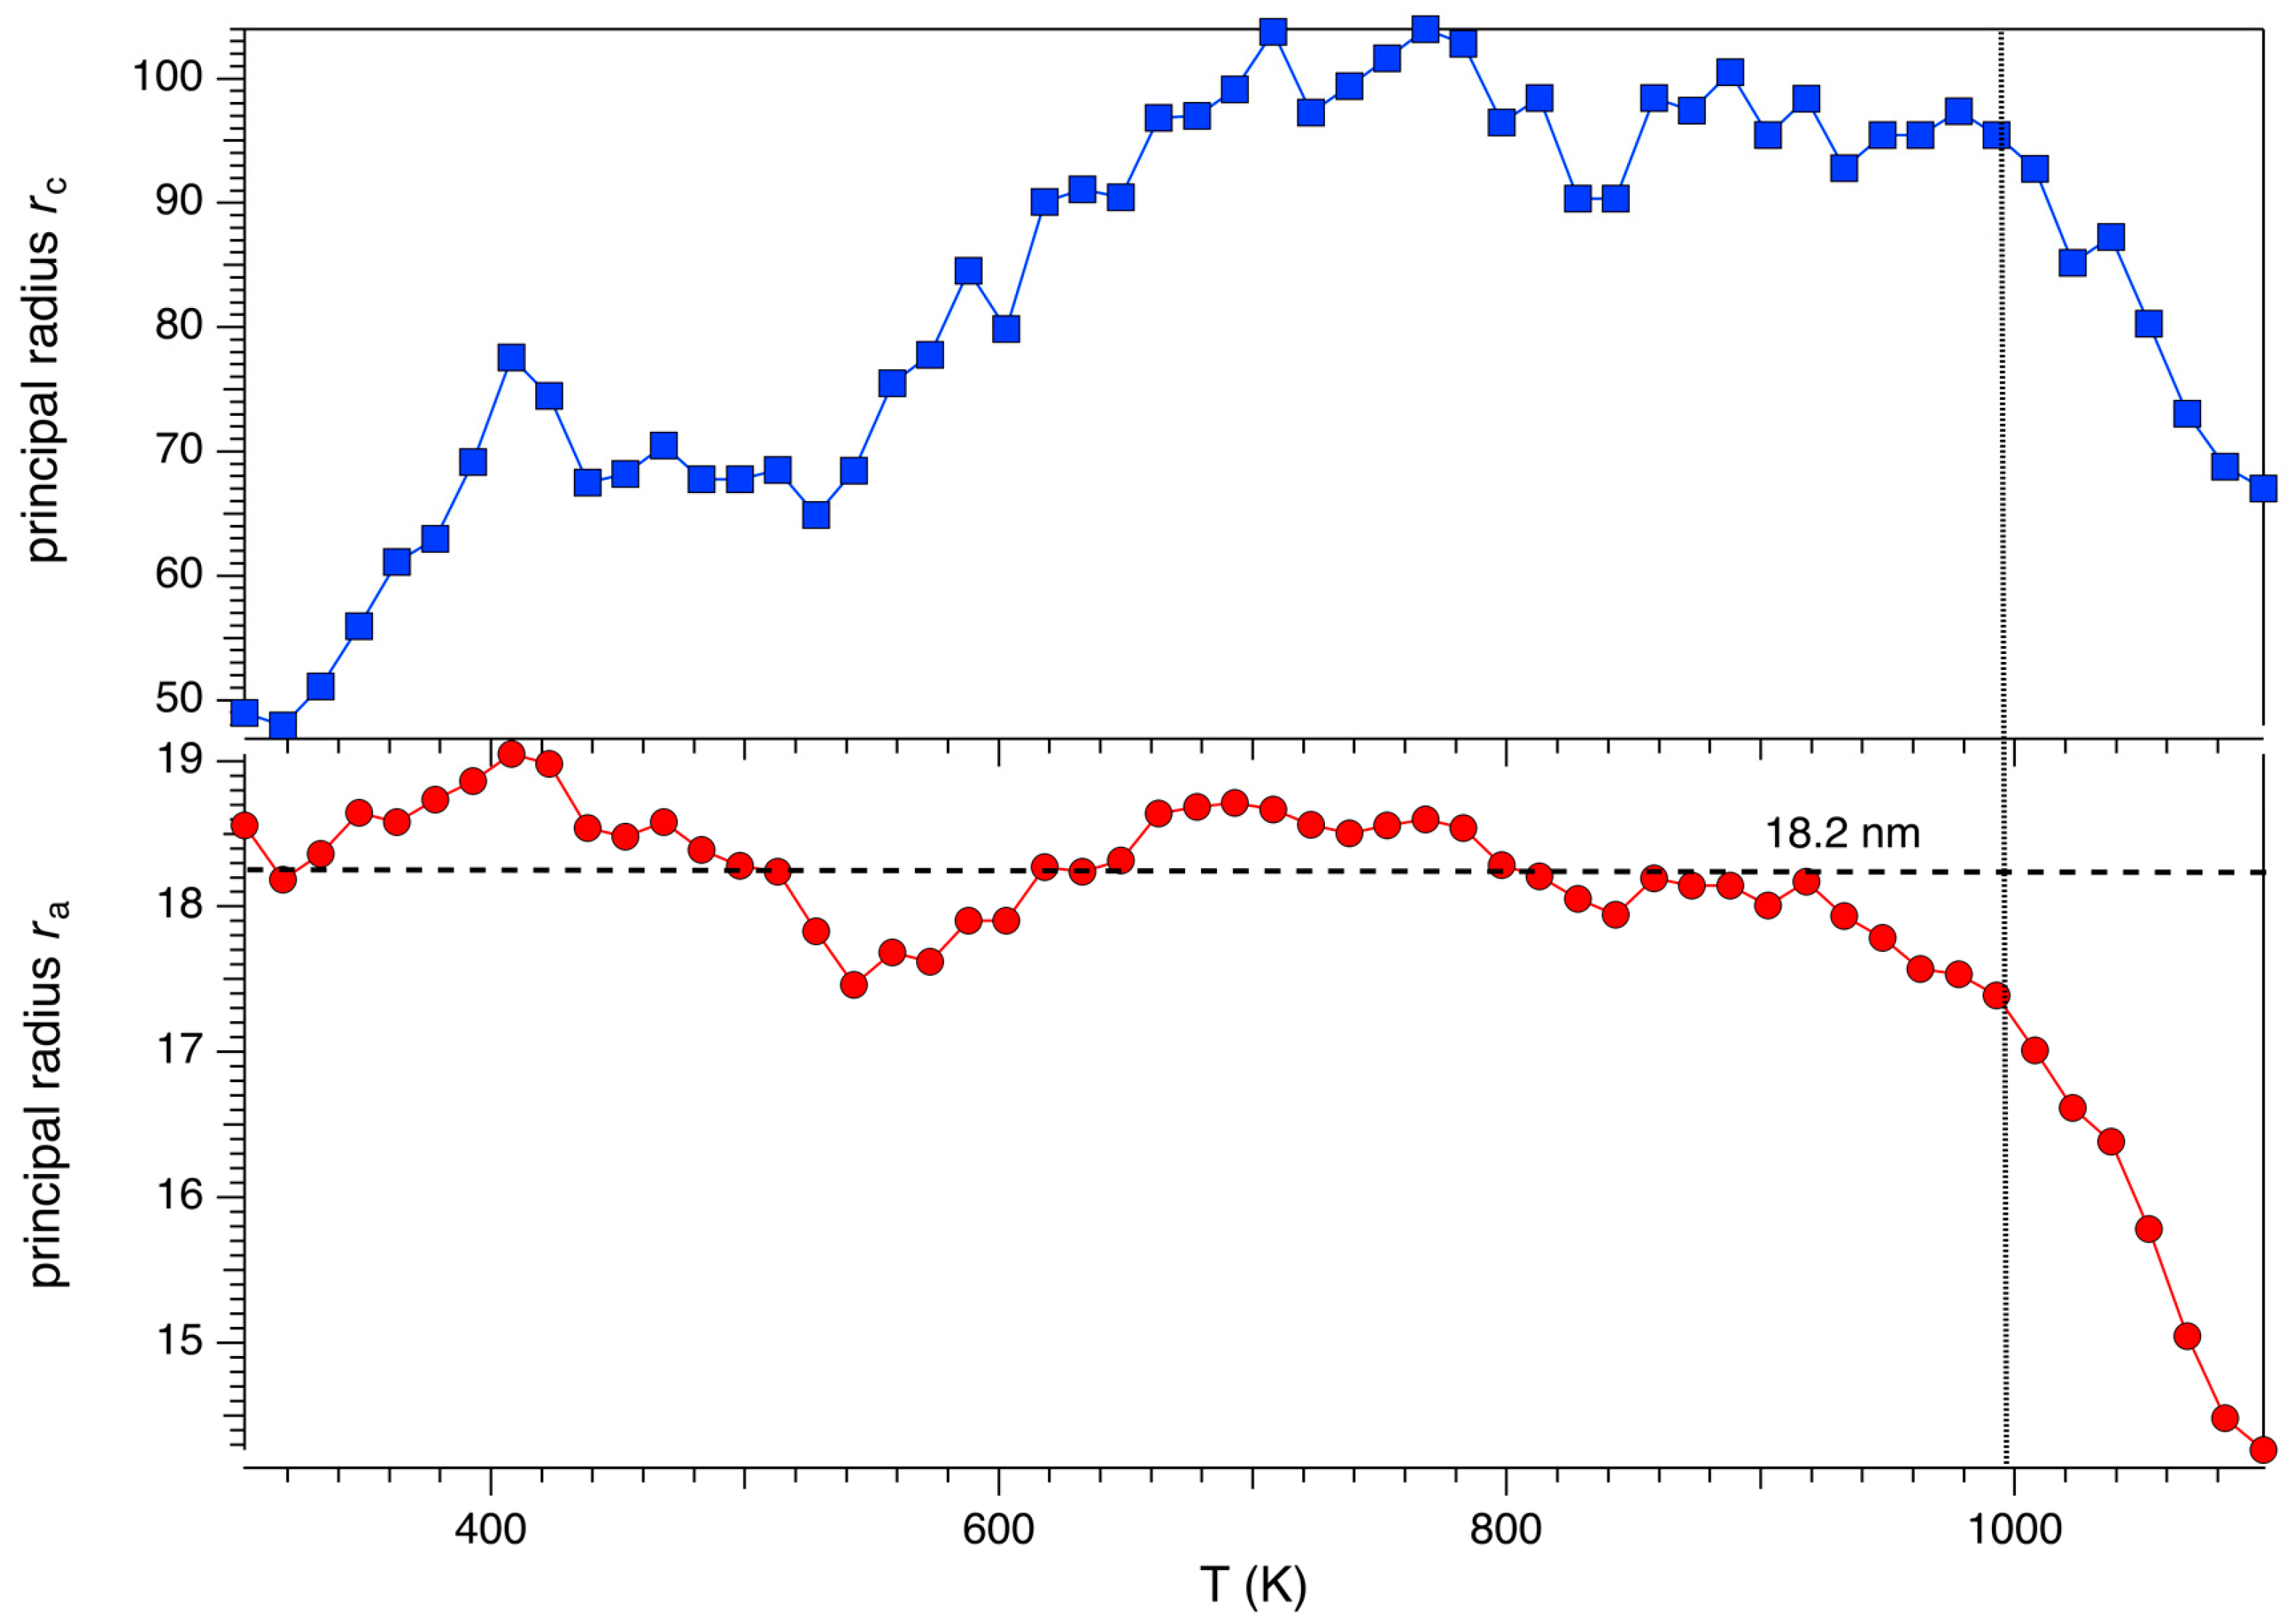
The <T1–O> and <T2–O> bond distances do not show a regular trend as a function of temperature (Supplementary Figure S2) but they are reasonably constant. A marked deviation from an otherwise regular behaviour is observed in the 438–643 K thermal range. It is worth noting that in this thermal range the dehydration process becomes more and more relevant and, in detail, at 438 K the OW10 H2O site starts to empty abruptly and at 643 K dehydration is completed (see below). It can be hypothesized a parasitic effect caused by an imperfect modelling of the EF cations/H2O population used in this thermal range, owing to fast kinetics possibly occurring during the collection of a single diffraction pattern. The same behaviour has been reported in the case of both erionite-K from Rome [19] and, in less pronounced way, of erionite-Na [20]. The <T1–O> and <T2–O> mean values, calculated over the whole thermal range, are of 1.630(6) and 1.637(8) Å, respectively (values between parenthesis refer to data dispersion). Those values are consistent with 1.628 and 1.646 Å reported at RT for a sample from the same locality by Pacella et al. [23]. The thermal dependence of microstrain ε0 [32] is shown as inset of Supplementary Figure S2. It was determined from evaluation of the integral widths i of the individual reflections (βi = 4ε0tanθ). The microstrain grows in a fairly regular way from ca. 0.20 to ca. 0.21 up to 538 K before an abrupt increase to 0.24. At higher temperatures, the value goes to plateau at ca. 0.25. This value persists up to ca. 850 K before reducing back to ca. 0.20 at Tbreak. The dependence of the isotropic displacement parameters of the T cations and of the oxygen atoms of the framework is reported in Supplementary Figure S3. They were treated independently. Evaluation of the evolution of the principal radii ra and rc of the ellipsoid describing the crystallite shape are shown in Figure 4. A mean value of ca. 18 nm has been calculated for ra throughout the investigated thermal range. This value is of the same order of magnitude of the diameter of a single fibril of woolly erionite-Na, observed from TEM images by Matassa et al. [33], that is characterized by a similar morphology. A reduction of ra is observed as Tbreak approaches. We may speculate that such reduction is caused by the progressive amorphization of the external layer of the fibrils as indicated by the increase of the background of the diffraction patterns (see above). In the case of rc, the value increases as temperature is raised and this phenomenon is coupled to an increase of the microstrain (see above). This trend may be justified by hypothesizing a progressive stretching of the curled fibrils resulting in a progressive increase of the coherency domain. Analogously to ra, a reduction is observed as Tbreak approaches caused by the progressive amorphization of the fibrils.
The evolution with temperature of the T–O–T angles is shown in Supplementary Figure S4. Trends are analogous to those observed in erionite-Na [20]. The most significant differences are a more pronounced maximum expansion of T2–O5–T2 and a more relevant contraction at high temperatures of T1–O2–T2 with respect to erionite-Na.
Analysis of the <T–O–T> variation as a function of temperature reveals a significant widening in correspondence of the dehydration process (Supplementary Figure S5).
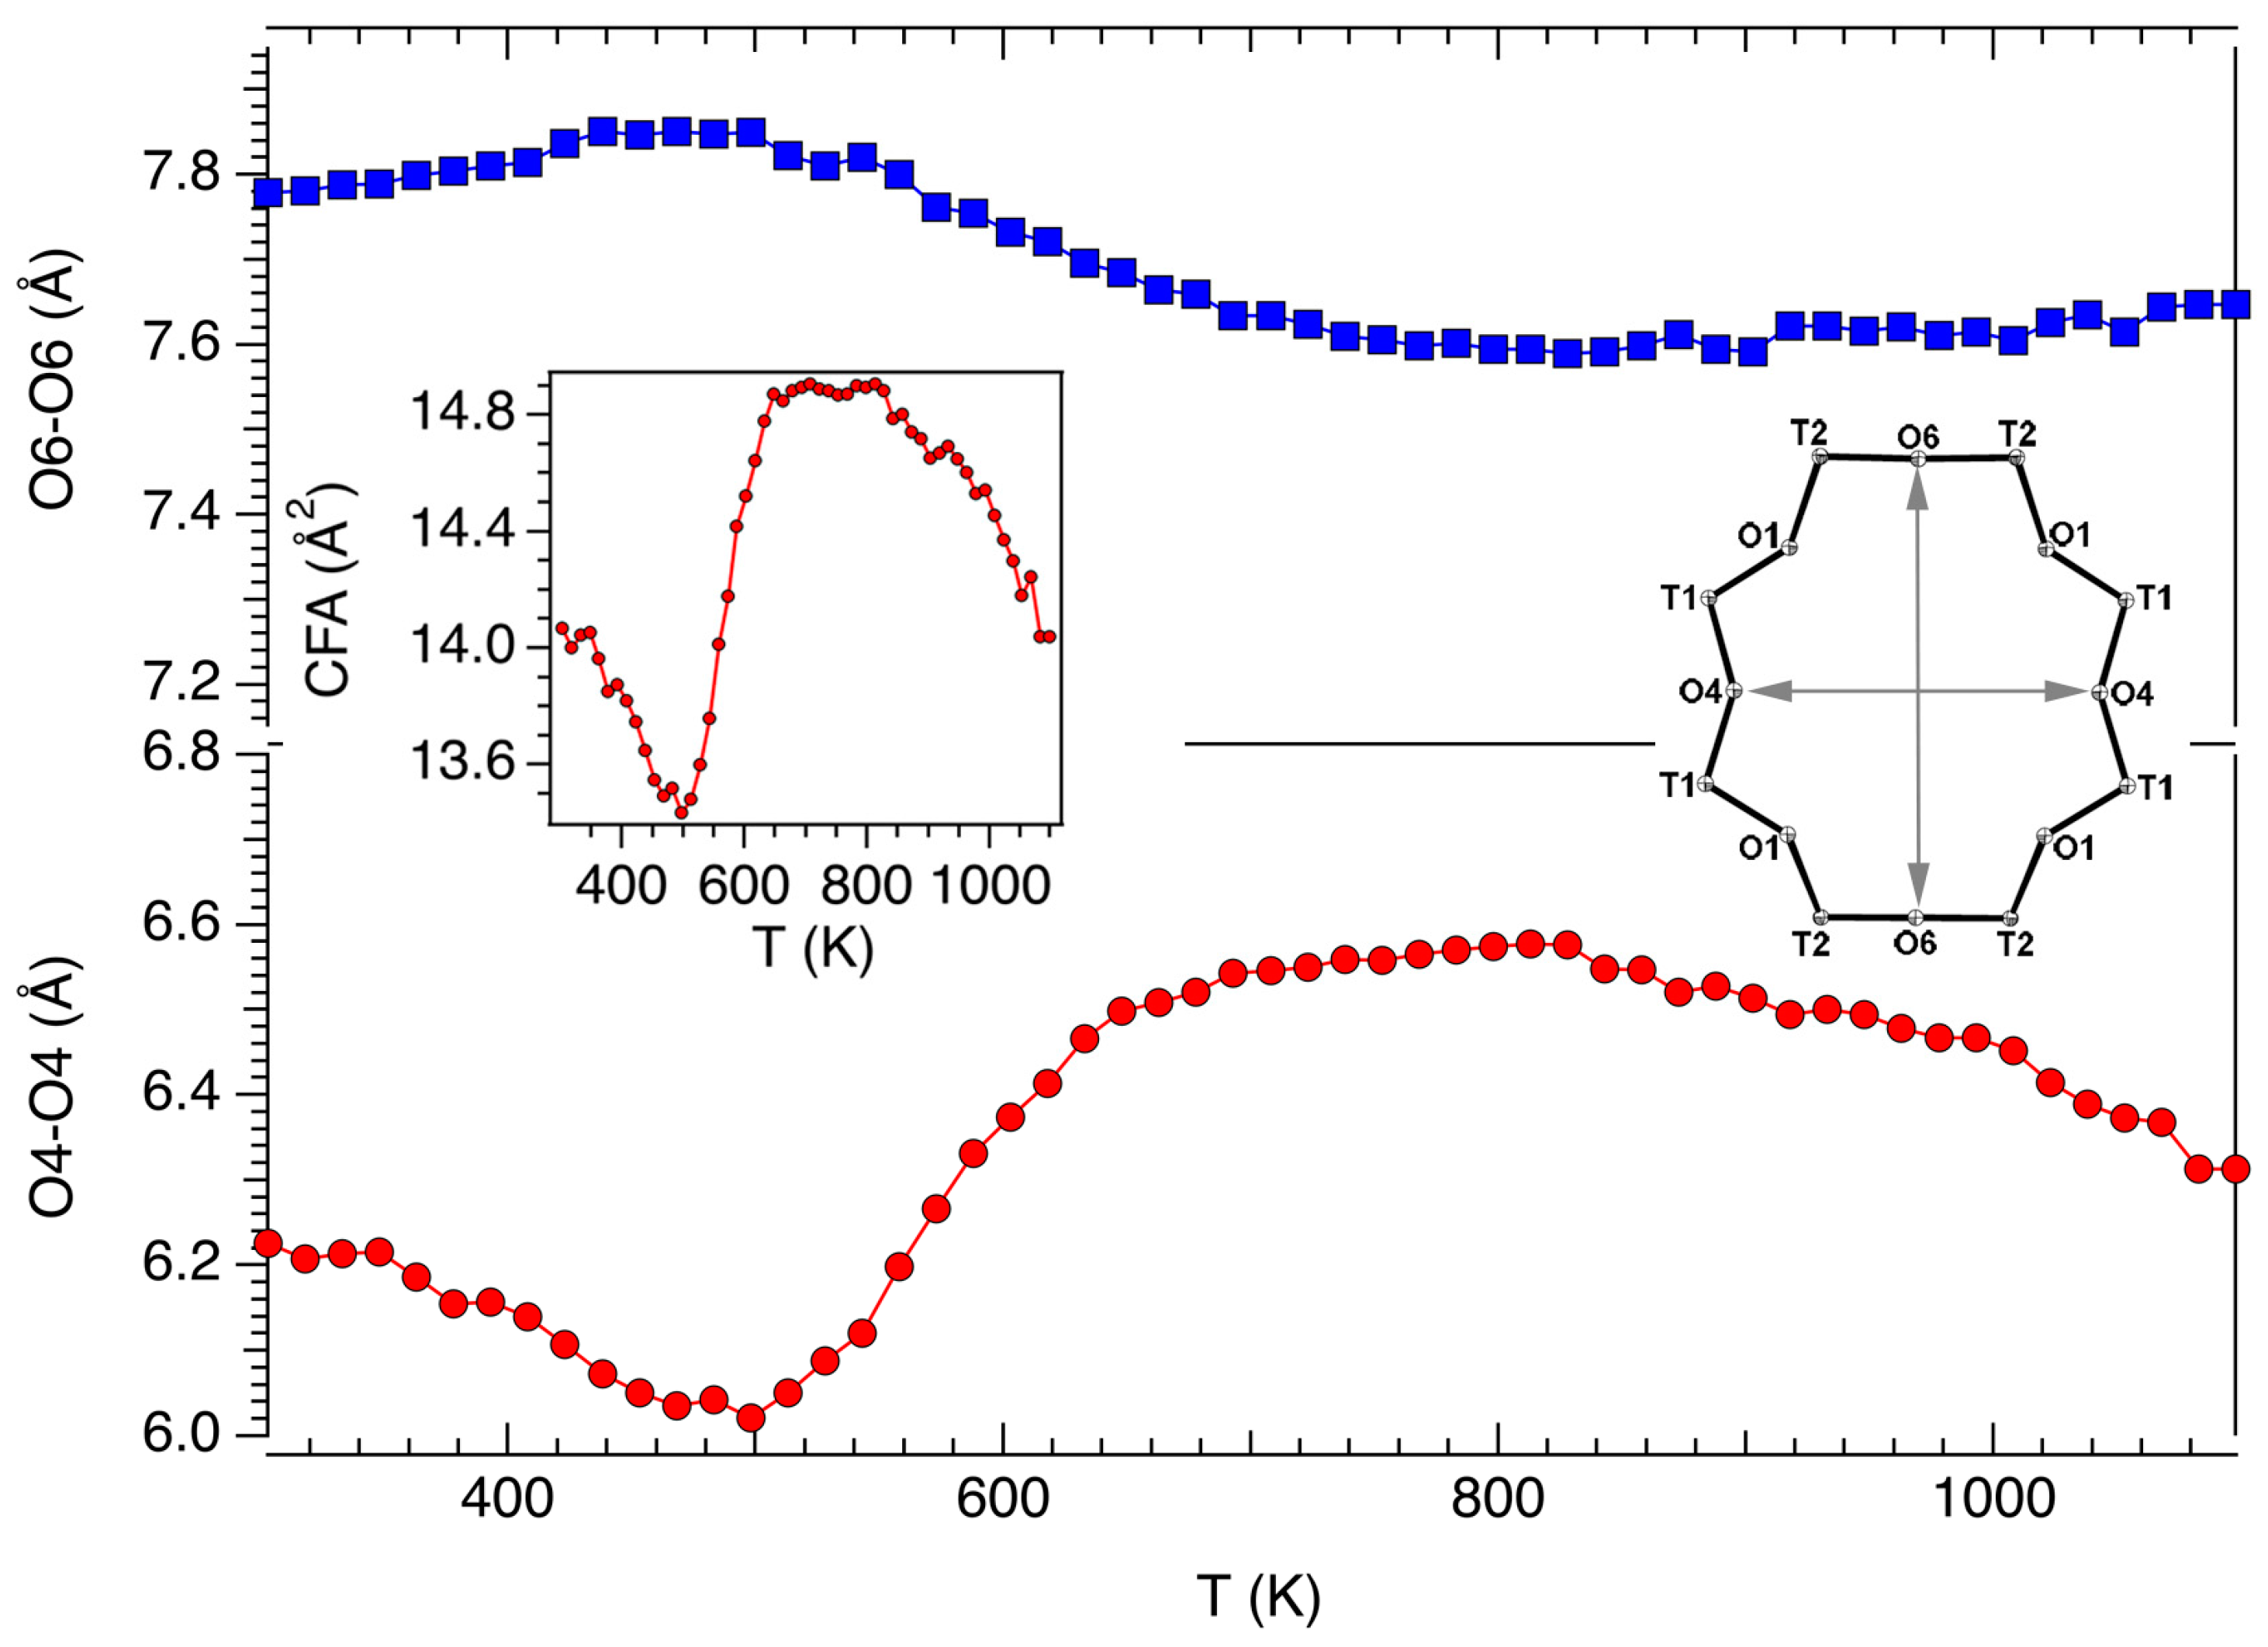
The dependence of the shape and dimensions of the various rings delimiting the walls of the cages has been also investigated. The modifications occurring in 8MR as a function of temperature were monitored from the evolution of the O4–O4 and O6–O6 distances (Figure 5). Moreover, the dependence from temperature of the crystallographic free area (CFA) (sensu Baerlocher et al. [34]) is shown as inset. Following Ballirano and Cametti [19] and Ballirano and Pacella [20], CFA has been calculated approximating the ring shape to an ellipse whose minor and major axes correspond to the minimum and maximum free diameter values (FDV), resulting by, respectively, the O4–O4 distance minus two times the oxygen radius (taken as 1.35 Å) and the O6–O6 distance minus two times the oxygen radius.
The shape of 8MR modifies following the same trend observed in erionite-Na except for a consistently higher CFA along the whole thermal range. It reaches a maximum value of ca. 14.8 Å2 at ca. 600 K compared to ca. 14.1 Å2 at the same temperature in the case of erionite-Na [20]. This is essentially the trend followed by the a-parameter as can be seen by comparison with Figure 3a and confirmed by the scrutiny of the relevant figures in Ballirano and Cametti [19] and Ballirano and Pacella [20]. Moreover, above 538 K the dependence of CFA from temperature strictly follows that of microstrain (inset of Supplementary Figure S2).
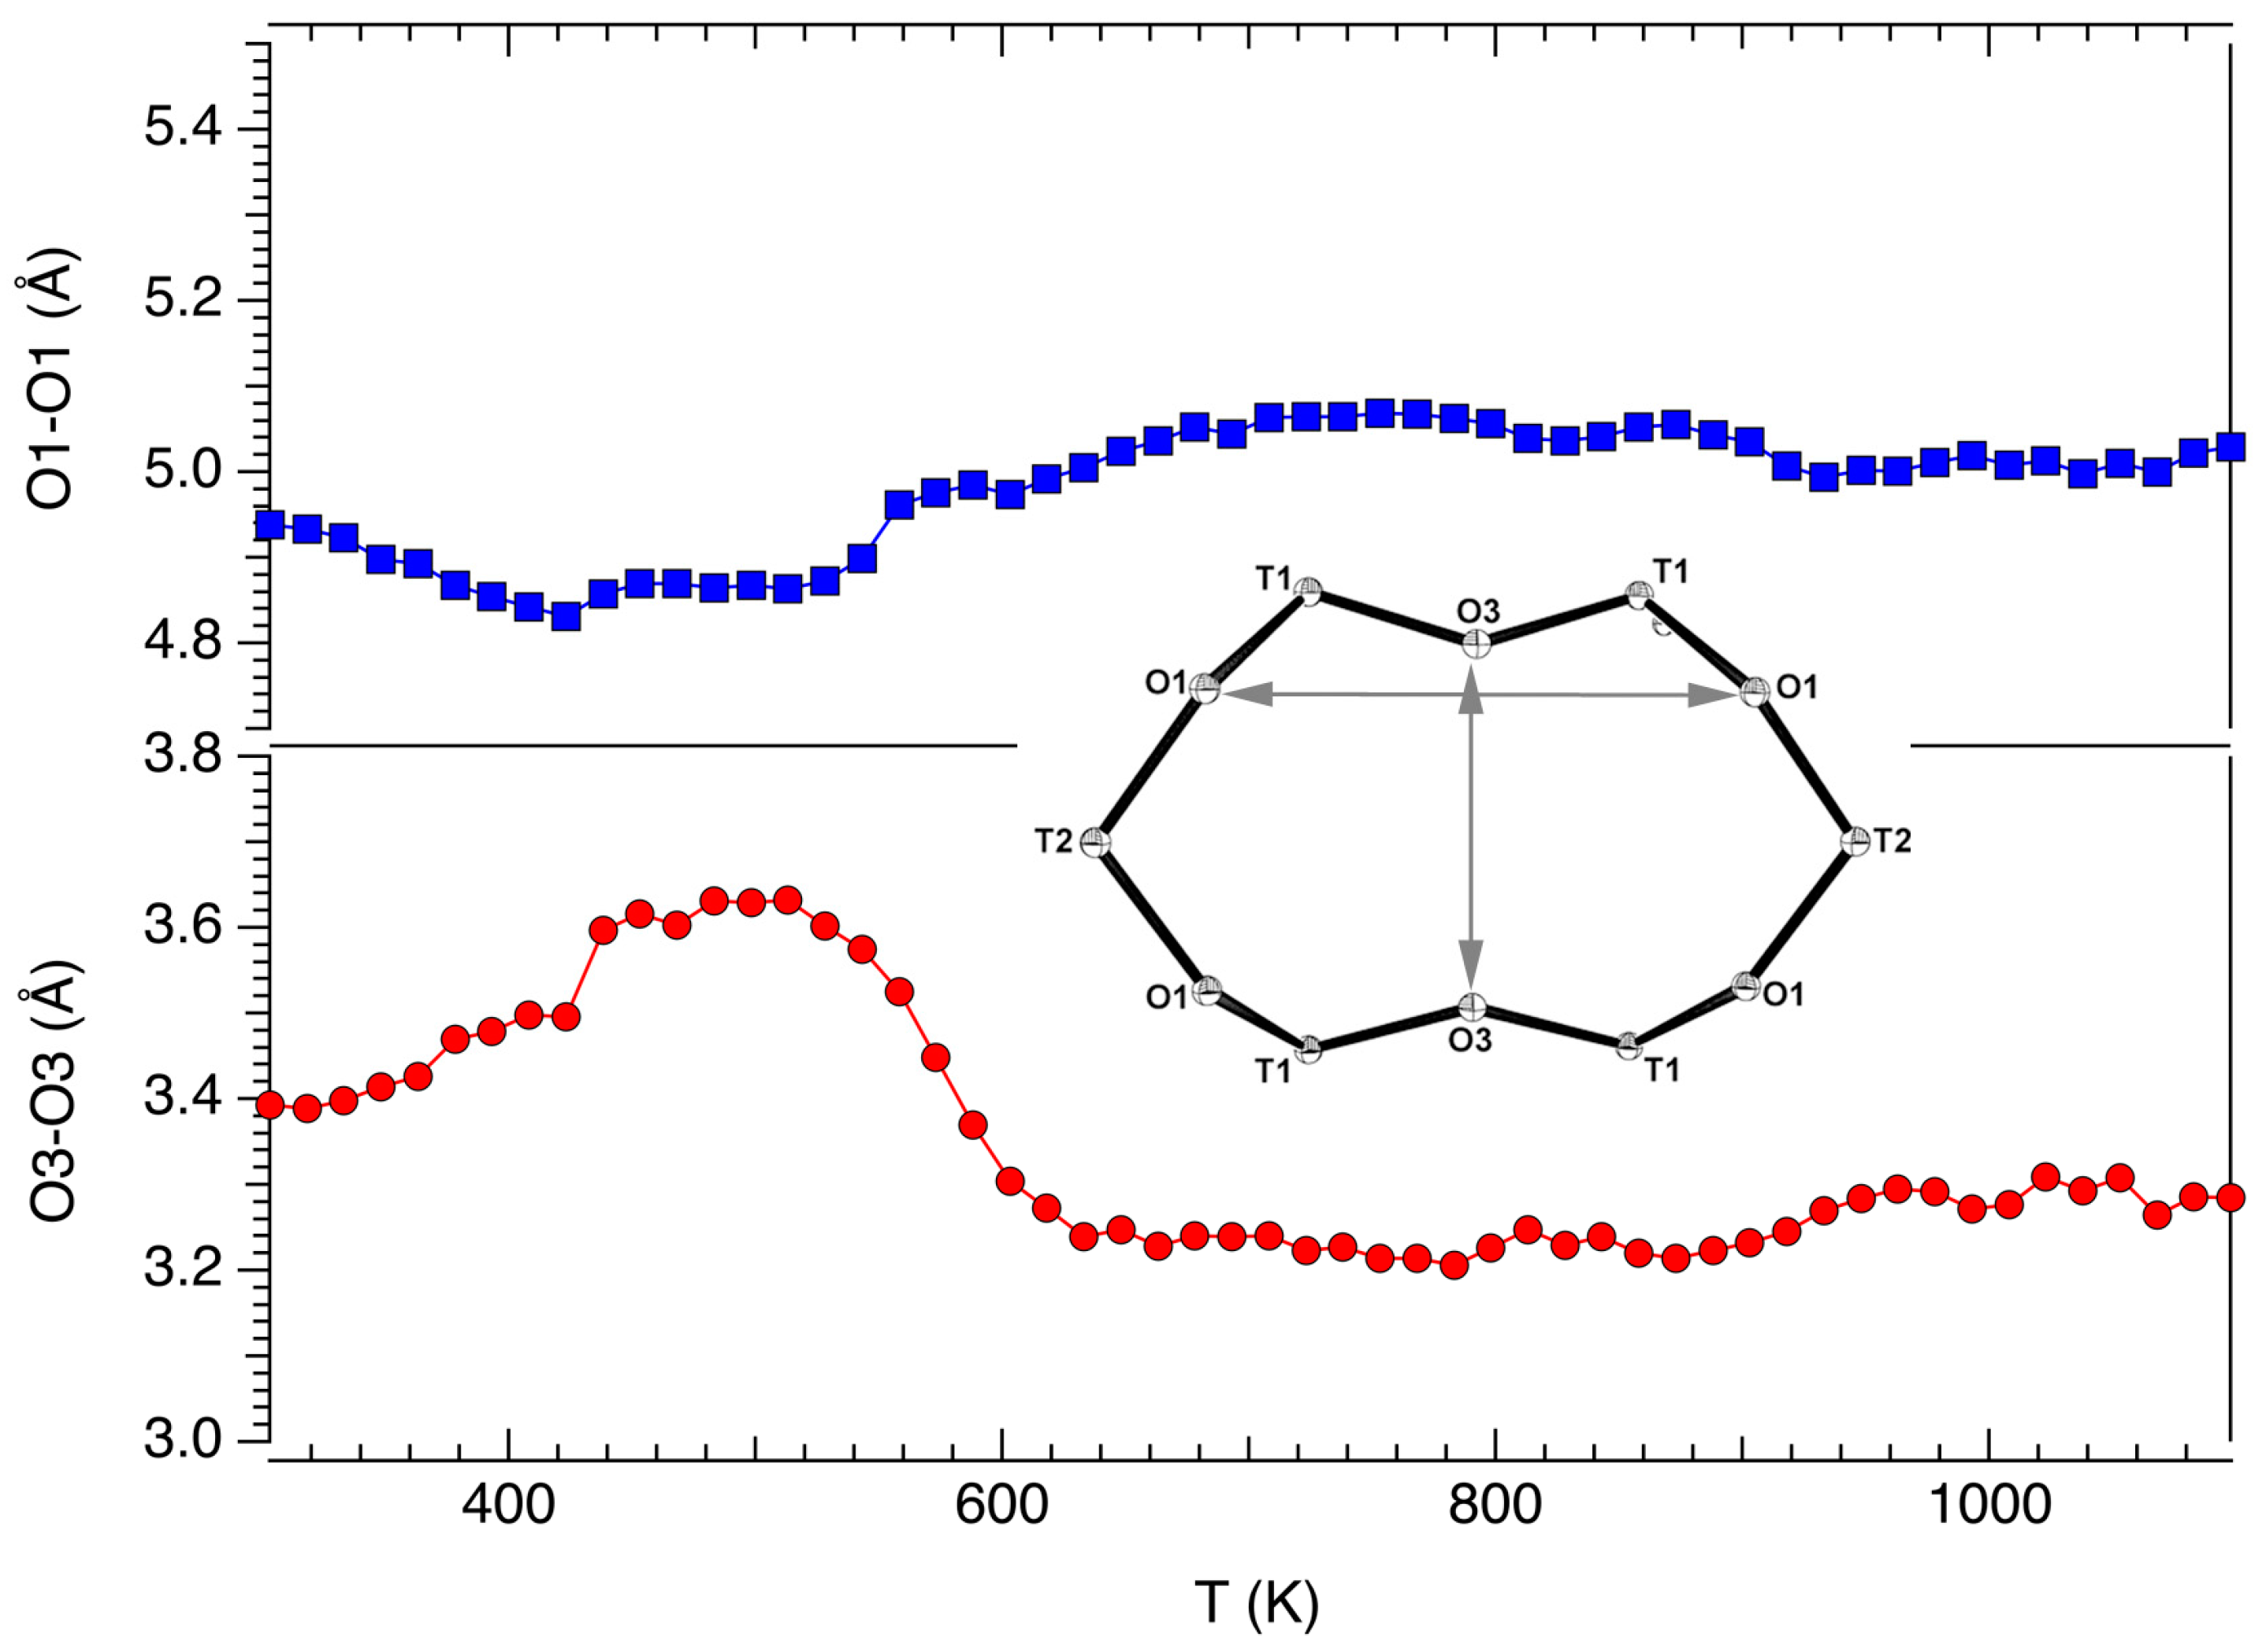
Figure 6 reports the dependence from temperature of the shape of the 6-member ring (6MR) that represents the only possible cation diffusion path between the two cages. Analogously to 8MR, the modification of the shape has been monitored following the evolution with temperature of the O1–O1 and O3–O3 bond distances. As it has been previously pointed out, despite the very small FDV, the effect of phonon modes on pore windows breathing [35,36] helps cation diffusion from the cancrinite cage, which has been experimentally demonstrated [37]. The dependence from temperature of O1–O1 and O3–O3 is like that observed in erionite-Na [20].
3.3. Structural Modifications: EF Cations and Water Molecules
The dependence from temperature of the site scattering (s.s.) of the EF cations is summarized graphically in Figure 7. Following the assignment of Pacella et al. [23] Mg and Na were allocated at Ca1, whereas Ca at both Ca2 and Ca3 sites. K has been found at K1 and partitioned (ca. 0.5 atoms per formula unit apfu) among OW sites normally occupied by H2O. No electron density was detected at K2. EF cations migrate toward different sites during the dehydration process as can be seen from the thermally driven modification of s.s. occurring at each site. The s.s. at Ca1 regularly reduces following an exponential decay law (R2 = 0.97) and at temperatures higher than 753 K the site becomes empty. Relevantly, electron density persists at the site at a temperature higher than that observed in the case of both erionite-K from Rome [19] and erionite-Na [20]. The s.s. at Ca2 decreases with a cubic law (R2 = 0.93) whereas s.s. at Ca3 reduces following an exponential decay law (R2 = 0.87). It is worth noting that starting at ca. 700 K s.s. at Ca3 becomes very small, of the order of 2 e-, and this value persists until structural breakdown. The s.s. at K1 is very constant throughout the analysed thermal range, and consistent with the full occupation by K ions, suggesting the absence of any “internal ion exchange” mechanism, differently from the samples investigated by Ballirano and Cametti [19] and Ballirano and Pacella [20]. However, owing to the possible onset of a Ca → K exchange mechanism [18], involving a difference of 1 e− only, we cannot rule out its partial occurrence. Differently, starting at 378 K electron density was detected at K2, which is empty at RT. The s.s. was found to increase steadily following a sigmoidal behaviour (R2 = 0.98) up to ca. 45 e− near Tbreak. Monitoring the evolution of the total s.s. of EF cation sites it is possible to notice, similarly to other high-temperature structure refinements of erionite samples, that it decreases from ca. 105 e− at 303 K to ca. 85 e− in the 400–500 K thermal range before rising to ca. 90 e− at higher temperatures. This behaviour has been previously interpreted as caused by a partial migration toward OW sites [20]. This hypothesis is supported by the observation that significant electron density persists at OW sites well above Tdehydr (see below) and that, as reported by Pacella et al. [23], at RT there is already some K distributed at/near H2O sites. It is worth noting that the minimum total s.s. of EF cation sites is attained in correspondence of the abrupt reduction to a minimum value of the CFA of 8MR (inset of Figure 5) mainly caused by the contraction of the O4–O4 distance. Moreover, it correlates with the expansion of the O3–O3 distance to the maximum value of ca. 3.6 Å (corresponding to a FDV of ca. 0.9 Å).
The evolution with temperature of the s.s. of the OW sites is shown in Figure 8. As can be seen, sites OW11, OW8 and OW10 become empty in the 500–640 K thermal range (Table 2) whereas significant s.s. persists up to Tbreak at OW7, OW9 and OW12. As it has been above discussed, this behaviour has been interpreted as arising from EF cations mobilization toward those sites. Following the same procedure detailed in Ballirano and Cametti [19] and Ballirano and Pacella [20] based on the invariance of the total s.s. of the EF cations at each temperature, we calculated the total s.s. attributable to H2O as a function of temperature (inset of Figure 8). According to such calculation, complete dehydration is attained at 658 K and following Table 2 an inverse correlation between ratio and Tdehydr seems apparent, as higher ratio values are associated to lower dehydration temperatures. This is caused by a more hydrophilic surface typical of the Si-rich terms. As a co-product of such analysis, ca. 20 e− allocated at 303 K at OW may be assigned to EF cations. This value is very similar to that calculated, from reference data, for the two samples from Rome, OR, USA of erionite-K (23 e−) and erionite-Na (18 e−).
Thermal analyses (Supplementary Figure S1) were carried out to support the structure refinements results. TG and DTG curves indicate differences with respect to the samples of erionite-K from Rome, OR, USA [19] and erionite-Na from Jersey, NV, USA [38]. In fact, in the present sample, two well-defined DTG peaks are observed at 354 and 516 K, whereas a sharp peak at ca. 330 K and a very broad one, having a maximum at ca. 375 K, is shown by the sample from Rome, OR, USA. Differently, the sample of erionite-Na shows a single strong peak centred at 372 K and a small one at 528 K.
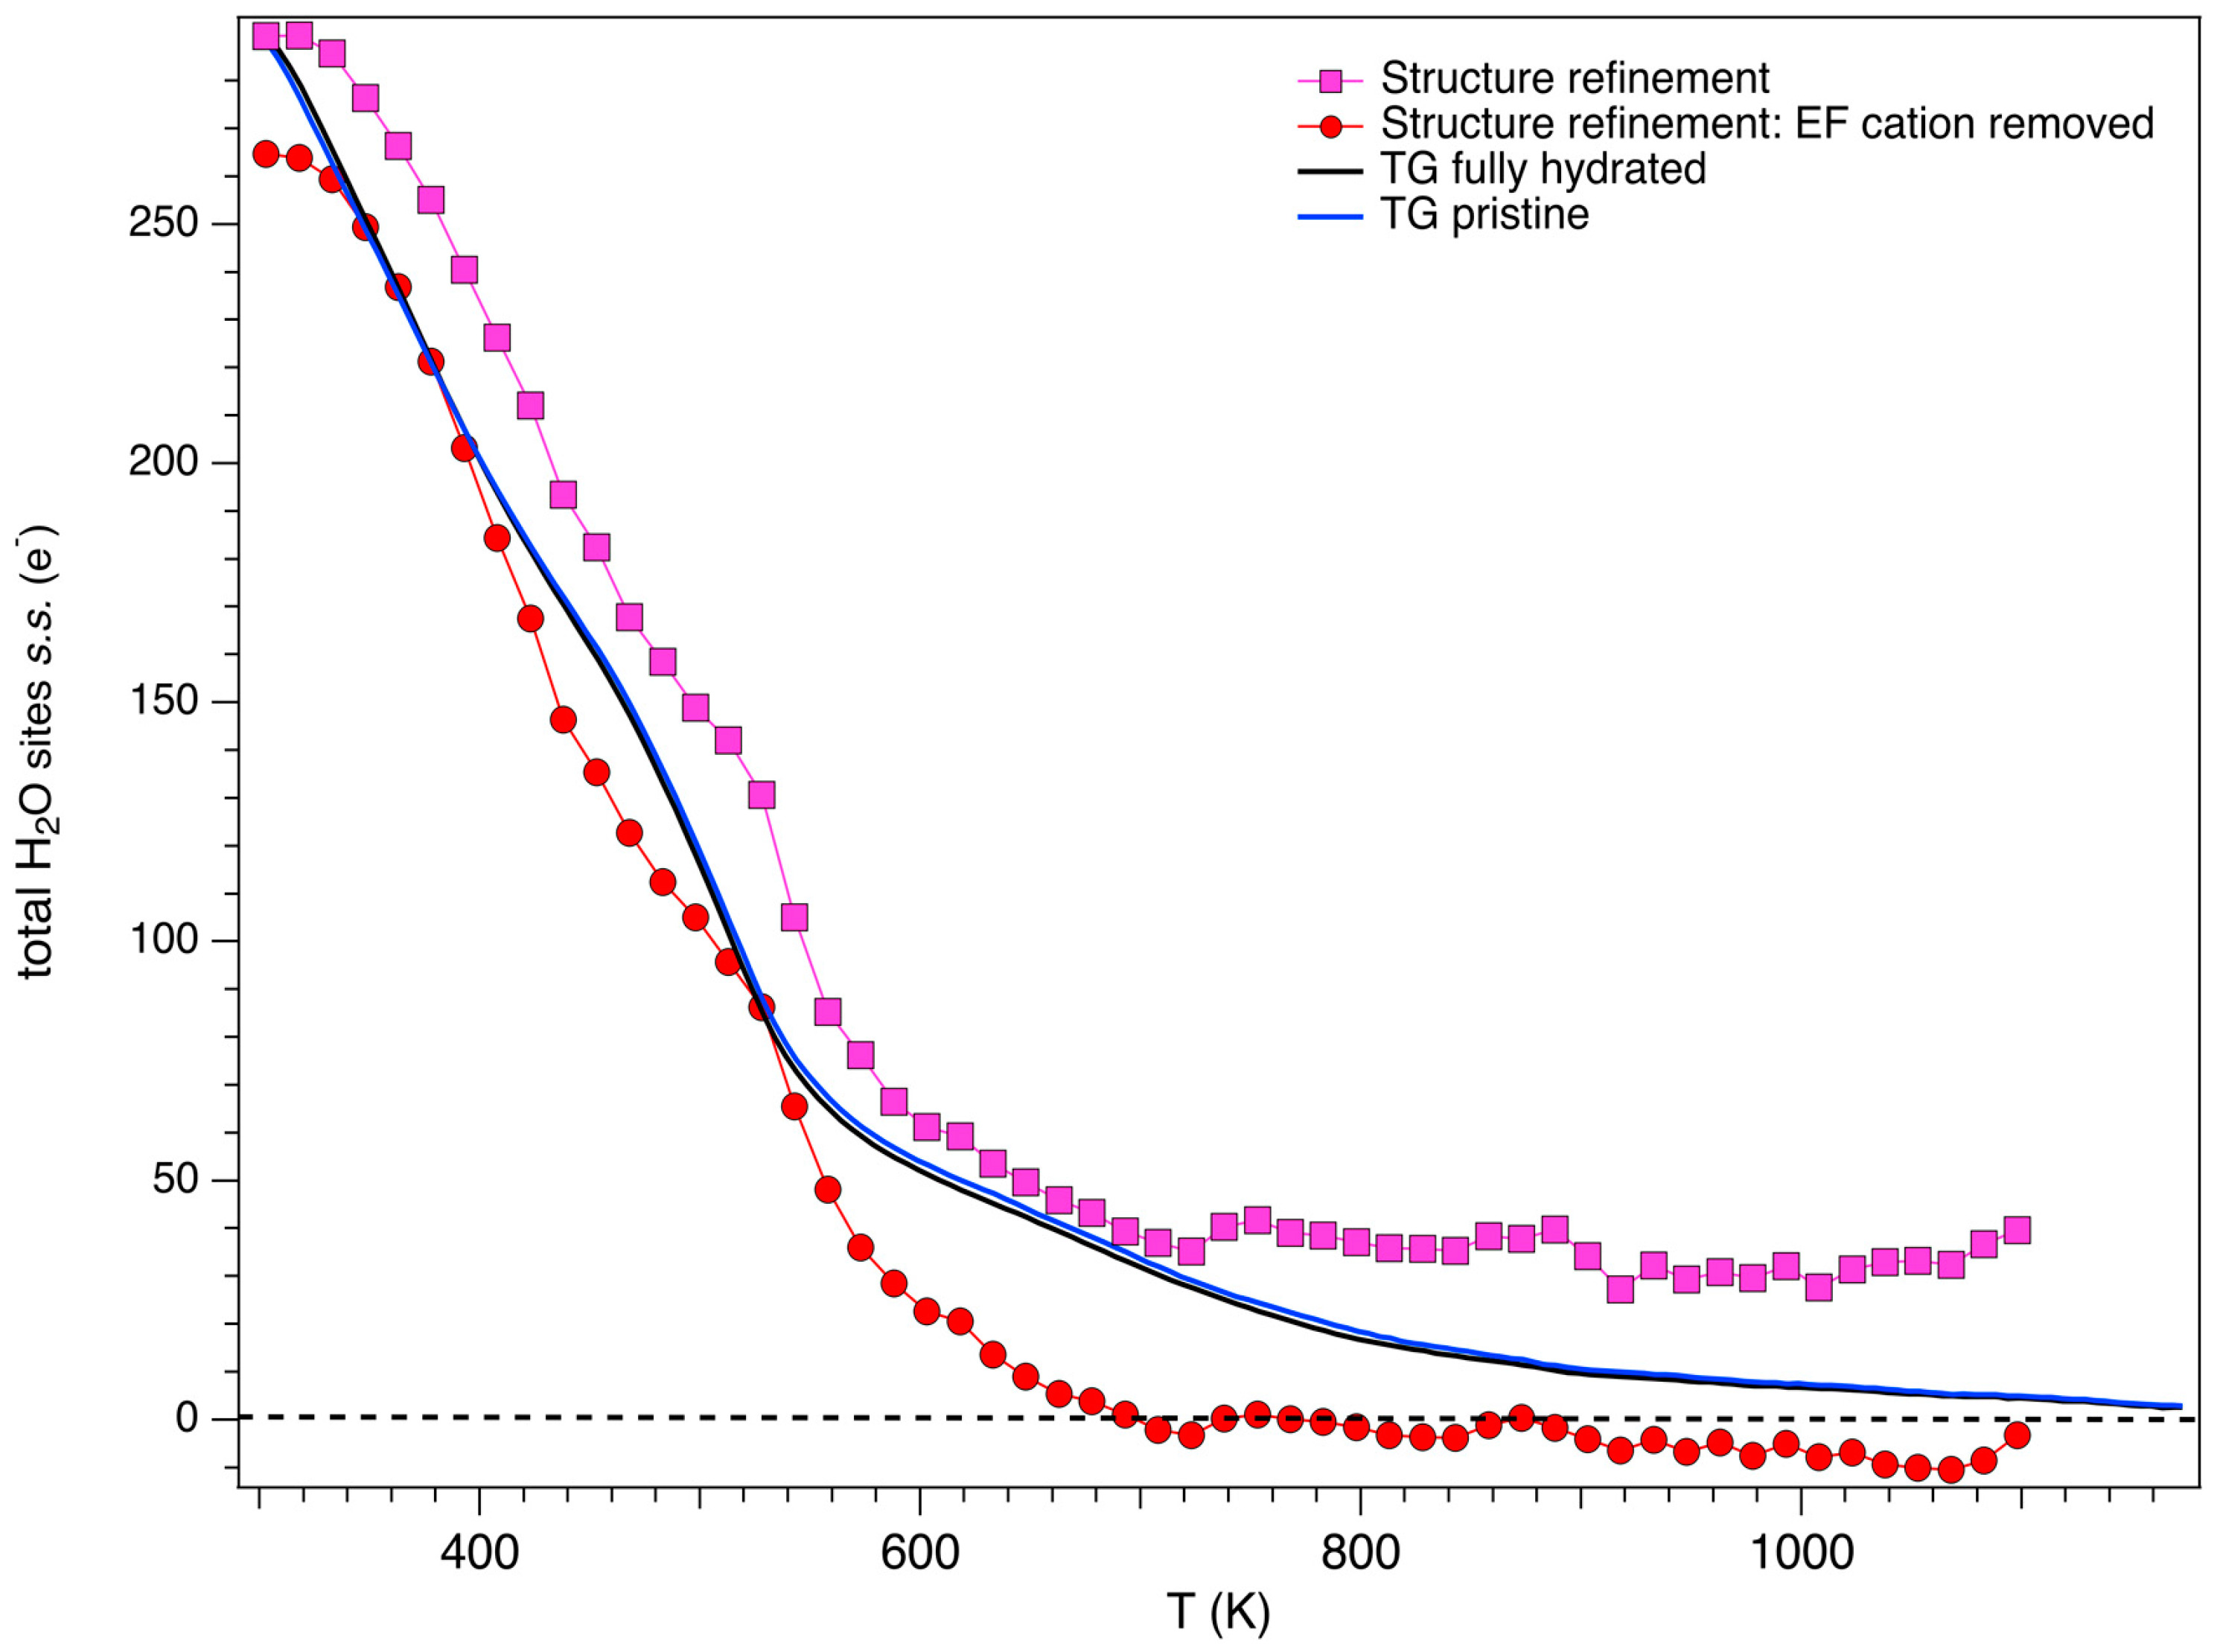
The first broad peak at 354 K is associated to a mass loss of ca. 11%. The second one, centred at 516 K and spreading over the 440–620 K thermal range, shows a shoulder at 484 K and accounts for an additional 11% mass loss. A further, albeit smaller, maximum loss rate is observed in the DTG curve at 670 K. The DDSC curve (Supplementary Figure S1b) shows a strong endothermic peak at 311 K and a shoulder at 366 K. Additional, three endothermic peaks are observed at 484, 540 and 707 K. The total mass loss of ca. 25% (Supplementary Figure S1a) is significantly higher than that reported in reference data for erionite samples [1,7,17,37] that ranges from ca. 16.0 % to ca. 21.3%. The anomaly can be only partly attributed to the presence in mixture of ca. 1.6 wt% of calcite producing the evolution of ca. 0.7% CO2 at T > 873 K. Nevertheless, Brunauer–Emmett–Teller (BET) analysis of woolly erionite-K indicates a very high external surface area of 47 m2/g (Pacella et al. [23]: total surface area of 245(5) m2/g), as compared, for example, to ca. 10 m2/g of fibrous erionite-Na (Pacella et al. [39]: total surface area of 325(5) m2/g). Moreover, woolly erionite-K has a significantly higher volume of mesopores of 0.125 cm3/g with respect to 0.021 cm3/g of fibrous erionite-Na. The mesoporosity arises from the peculiar self-assembly of woolly erionite consisting of bi-dimensional ribbons [33]. The large external surface, coupled to the absence of significant reduction of the s.s. at OW sites for T < 348 K, suggests the release of water, estimated to be ca. 3.5%, adhering to the external surface of the fibres and trapped within mesopores. Conversion of mass loss to s.s. of H2O is reported in Figure 9. Data are compared to the evolution with temperature of the sum of the total H2O s.s. at the OW sites as determined from the Rietveld refinements and with that corrected, taking into account the invariance of the EF cations sum. As can be seen, TG analysis shows a behaviour that is intermediate between raw and corrected data, suggesting that a fraction of the s.s. attributed to EF cations is in effect due to residual H2O that is required for providing a suitable coordination to Ca1 and Ca3 sites (see below) persisting at high temperatures.
The dependence from temperature of the z coordinate of Ca1, Ca2 and Ca3 EF cations sites is reported in Supplementary Figure S6. The Ca1 site migrates from z ca. 0.92 at 303 K to ca. 1.03 at 568 K and then moves back to ca. 0.97 before becoming empty at 753 K. The Ca2 site moves abruptly from z ca. 0.11 to ca. 0.22 in the 392–438 K thermal range and, at higher temperature, at a slower pace, toward the special position z = 1/4 that is reached at 648 K. This position corresponds approximately to the centre of the bases of the erionite cavity. The Ca3 site smoothly migrates toward the special position z = 3/4, corresponding to the centre of the cage, that is reached at 708 K, attaining the maximum possible spacing along the c-axis between the EF cations sites. This position is reached almost in correspondence of the complete dehydration of the sample. Analysis of the bonding network of the EF cations provides interesting additional information. At RT only Ca2 has oxygen atoms of the framework (O5) at bonding distance, whereas both Ca1 and Ca3 are linked exclusively to H2O. Therefore, temperature increase produces cations migration to obtain a favourable coordination by the oxygen atoms of the framework. Notably, Ca2 migrating toward the bases of the erionite cavity reaches six-fold coordination with 3 × O5 and 3 × O6 well suited for both Ca and Na cations (Supplementary Figure S7). It is important to point out that both O5 and O6 are exclusively bonded to T2, which is the framework site where Al is preferentially allocated. This distribution of framework cations leads to under-bonding at both oxygen sites that favours the attraction exerted at HT toward Ca2. Armbruster [40] reported a similar behaviour for clinoptilolite and heulandite.
As far as Ca1 and Ca3 are referred to, complete dehydration deprives both sites of any possible coordinating oxygen. Therefore, the residual small electron density (ca. 3 e−) detected at Ca3 at temperatures exceeding the Tdehydr of the sample may be justified invoking the persistence of traces of coordinating H2O.
At 378 K site K2 is 12-fold coordinated to both oxygen atoms of the framework (4 × O1 and 2 × O4) and H2O (2 × OW10 and 4 × OW8). In this case, however, the site lies in special position (1/2, 0, 0) and the realization of a suitable coordination, as temperature is raised, may be achieved via framework distortion (Supplementary Figure S8). It should be reminded that the almost simultaneous complete depletion of OW8 and OW10 was observed at ca. 620–630 K (Figure 9). This process finds correlation with the DTG peak at 670 K. The initial relatively slow increase of s.s. at K2 is coupled to the shortening of the K2–O4 bond distance that results in the contraction of the CFA of 8MR (Figure 5), whereas the strong elongation of K2–O4 from ca. 3.00 to ca. 3.25 Å, occurring in the relatively small ca. 500–640 K thermal range, is coupled to a significant increase of s.s. at K2 from ca. 8 to ca. 38 e−.
Following the same approach used by Ballirano and Cametti [19] and Ballirano and Pacella [20] the final set of structure refinements were carried out keeping fixed, except for OW7, the fractional coordinates of H2O to their value averaged over the analysed thermal range. The evolution of the x coordinate of OW7 is different from that reported Ballirano and Cametti [19] and Ballirano and Pacella [20] for erionite-K and-Na from Rome, OR, USA. In fact, in the present sample OW7 shows a limited displacement from the starting position a part for a minor approach to the erionite cavity walls in the 400–600 K thermal range in correspondence of the reduction of the CFA of 8MR.
4. Conclusions
The thermal stability of zeolites is of paramount importance since their technological properties are commonly exploited through their dehydrated/calcinated states. The complex of structural re-arrangements underlying dehydration varies from species to species, and, consequently, it is difficult to be predicted. In fact, despite the efforts no generalized model of the behaviour upon heating of zeolites has been derived so far. Several possible key-factors influencing both Tdehydr and Tbreak have been listed and analysed in detail (see for example Cruciani, [22]). However, uncertainties related to the chemical composition of the samples, owing to experimental difficulties, inhomogeneity of the non-ambient structural data, arising from both powder and single-crystal diffraction, different experimental condition (far from or near equilibrium), render the modelling of the response to heating of zeolites a very demanding task. Much more successful has been the modelling of the response to heating of zeolites sharing the same framework topology [see for example faujasite (FAU) and Linde Type A (LTA) zeolites: Table 1b of Cruciani [22]). Under such an aspect, the dehydration dynamics and the thermal stability of a sample of erionite-K, were analysed in the present paper with the aim of expanding the knowledge about the thermal behaviour of the erionite group. In fact, such sample is characterized by a higher Al content as compared to previously-analysed erionite samples as well as by an empty K2 site at RT. From comparison with reference data [19,20] it has been disclosed the existence of a well-defined dependence of the thermal induced variation of cell parameters and volume, as well as on Tdehydr and Tbreak from the ratio, following trends already observed in zeolites. However, the detailed behaviours are extremely complex. The EF cations content has been found to modulate some details of the cations mobility path as minor differences have been observed between samples with dissimilar chemistry, albeit the general behaviour seems to be common (i.e., depletion of Ca1 and Ca3 by migration of cations toward K2 and displacement of Ca2 near or at the centre of the bases of the erionite cavity). This result is of relevant interest, as pointed out by Ballirano and Pacella [20], within the frame of the hypothesis that the biological activity of erionite could depend, apart from surface interactions, also on bulk effects favoured by its cation exchange properties. In fact, segregation of exchanged Fe(II) at a specific crystallographic site [41] has been regarded as a prerequisite for the formation of potentially reactive oxygen species, possibly inducing DNA damage [42].
Supplementary Materials
The following are available online at www.mdpi.com/2075-163X/8/1/28/s1, Figure S1: (a) TG and DTG curves; and (b) DSC and DDSC curves of the woolly erionite-K, Figure S2: <T1–O> and <T2–O> bond distances as a function of temperature, Figure S3: Isotropic displacement parameters of the T cations and of the oxygen atoms of the framework as a function of temperature, Figure S4: Evolution with temperature of the T–O–T bridges, Figure S5: Evolution with temperature of <T–O–T> bond angle, Figure S6: Dependence from temperature of the z coordinate of the Ca1, Ca2, and Ca3 sites. Inset: Ortep-3 drawing of the location of the EF cation sites within the erionite cage, Figure S7: Dependence from temperature of bond distances between Ca2 and oxygen atoms of the framework, Figure S8: Dependence from temperature of bond distances between K2 and oxygen atoms of the framework.
Acknowledgments
The work has received financial support from Sapienza Università di Roma.
Author Contributions
P.B. conceived the research and conducted XRPD experiments, performed structure refinements, analysed the results, wrote and revised the manuscript; A.P. wrote and revised the manuscript; A.B. performed thermogravimetric and differential scanning calorimetry measurements, analysed the results, wrote and revised the manuscript; M.G. and M.M wrote and revised the manuscript.
Conflicts of Interest
The authors declare no conflict of interest.
References
- Gottardi, G.; Galli, E. Natural Zeolites; Springer: Heidelberg, Germany, 1985; 409p. [Google Scholar]
- IARC. IARC Monographs on the evaluation of the carcinogenic risk of chemicals to humans. Silica Some Silic. 1997, 42, 225–239. [Google Scholar]
- Carbone, M.; Baris, Y.I.; Bertino, P.; Brass, B.; Comertpay, S.; Dogan, A.U.; Gaudino, G.; Jube, S.; Kanodia, S.; Partridge, C.R.; et al. Erionite exposure in North Dakota and Turkish villages with mesothelioma. Proc. Natl. Acad. Sci. USA 2011, 108, 13618–13623. [Google Scholar] [CrossRef] [PubMed]
- Kawahara, A.; Curien, H. La structure crystalline de l’érionite. B. Soc. Fr. Mineral. Cr. 1969, 92, 250–256. [Google Scholar]
- Coombs, D.S.; Alberti, A.; Armbruster, T.; Artioli, G.; Colella, C.; Galli, E.; Grice, J.D.; Liebau, F.; Mandarino, J.A.; Minato, H.; et al. Recommended nomenclature for zeolite minerals; report of the Subcommittee on Zeolites of the International Mineralogical Association, Commission on New Minerals and Mineral Names. Can. Mineral. 1997, 35, 1571–1606. [Google Scholar] [CrossRef]
- Wise, W.S.; Tschernich, R.W. The chemical compositions and origin of the zeolites offretite, erionite, and levyne. Am. Mineral. 1976, 61, 853–863. [Google Scholar]
- Passaglia, E.; Artioli, G.; Gualtieri, A. Crystal chemistry of the zeolites erionite and offretite. Am. Mineral. 1998, 83, 577–589. [Google Scholar] [CrossRef]
- Gualtieri, A.; Artioli, G.; Passaglia, E.; Bigi, S.; Viani, A.; Hanson, J.C. Crystal structure-crystal chemistry relationships in the zeolites erionite and offretite. Am. Mineral. 1998, 83, 590–600. [Google Scholar] [CrossRef]
- Staples, L.W.; Gard, J.A. The fibrous zeolite erionite: Its occurrence, unit cell, and structure. Mineral. Mag. 1959, 32, 261–281. [Google Scholar] [CrossRef]
- Gard, J.A.; Tait, J.M. Refinement of the crystal structure of erionite. In Proceedings of the Third International Conference on Molecular Sieves; Uytterhoeven, J.B., Ed.; Leuven University Press: Leuven, Belgium, 1973; p. 94. [Google Scholar]
- Meier, W.M.; Groner, M. Zeolite structure type EAB: Crystal structure and mechanism for the topotactic transformation of the Na, TMA form. J. Solid State Chem. 1981, 37, 204–218. [Google Scholar] [CrossRef]
- Smith, J.V.; Bennett, J.M. Enumeration of 4-connected 3-dimensional nets and classification of framework silicates: The infinite set of ABC-6 nets; the Archimedean and 6-related nets. Am. Mineral. 1981, 66, 777–788. [Google Scholar]
- Smith, J.V.; Rinaldi, F.; Dent Glasser, L.S. Crystal structures with a chabazite framework. II. Hydrated Ca-chabazite at room temperature. Acta Cryst. 1963, 16, 45–53. [Google Scholar] [CrossRef]
- Rüdinger, B.; Tillmanns, E.; Hentschel, G. Bellbergite—A new mineral with the structure type EAB. Mineral. Petrol. 1993, 48, 147–152. [Google Scholar]
- Ballirano, P.; Merlino, S.; Bonaccorsi, E.; Maras, A. The crystal structure of liottite, a six-layer member of the cancrinite group. Can. Mineral. 1996, 34, 1021–1030. [Google Scholar]
- Alberti, A.; Martucci, A.; Galli, E.; Vezzalini, G. A reexamination of the crystal structure of erionite. Zeolites 1997, 19, 349–352. [Google Scholar] [CrossRef]
- Ballirano, P.; Andreozzi, G.B.; Dogan, M.; Dogan, A.U. Crystal structure and iron topochemistry of erionite-K from Rome, Oregon, U.S.A. Am. Mineral. 2009, 94, 1262–1270. [Google Scholar] [CrossRef]
- Schlenker, J.L.; Pluth, J.J.; Smith, J.V. Dehydrated natural erionite with stacking faults of the offretite type. Acta Crystallogr. 1977, B33, 3265–3268. [Google Scholar] [CrossRef]
- Ballirano, P.; Cametti, G. Dehydration dynamics and thermal stability of erionite-K: Experimental evidence of the “internal ionic exchange” mechanism. Microporous Mesoporous Mater. 2012, 163, 160–168. [Google Scholar] [CrossRef]
- Ballirano, P.; Pacella, A. Erionite-Na upon heating: Dehydration dynamics and exchangeable cations mobility. Sci. Rep. 2016, 6, 22786. [Google Scholar] [CrossRef] [PubMed]
- Bish, D.L.; Carey, J.W. Thermal properties of natural zeolites. In Natural Zeolites: Occurrence, Properties, Applications; Bish, D.L., Ming, D.W., Eds.; Mineralogical Society of America: Chantilly, VA, USA, 2001; Volume 45, pp. 403–452. [Google Scholar]
- Cruciani, G. Zeolites upon heating: Factors governing their thermal stability and structural changes. J. Phys. Chem. Solids 2006, 67, 1973–1994. [Google Scholar] [CrossRef]
- Pacella, A.; Cremisini, C.; Nardi, E.; Montereali, M.R.; Pettiti, I.; Giordani, M.; Mattioli, M.; Ballirano, P. Different erionite series species are able to fix iron into the structure: Implication for fibrous erionite toxicity. Minerals. accepted.
- Mattioli, M.; Giordani, M.; Dogan, M.; Cangiotti, M.; Avella, G.; Giorgi, R.; Dogan, A.U.; Ottaviani, M.F. Morpho-chemical characterization and surface properties of carcinogenic zeolite fibers. J. Hazard Mater. 2016, 306, 140–148. [Google Scholar] [CrossRef] [PubMed]
- Ballirano, P.; Melis, E. Thermal behaviour of β-anhydrite CaSO4 to 1,263 K. Phys. Chem. Miner. 2007, 12, 289–295. [Google Scholar] [CrossRef]
- Bruker AXS. Topas V.4.2: General Profile and Structure Analysis Software for Powder Diffraction Data; Bruker AXS: Karlsruhe, Germany, 2009. [Google Scholar]
- Katerinopoulou, A.; Balic-Zunic, T.; Lundegaard, L.F. Application of the ellipsoid modeling of the average shape of nanosized crystallites in powder diffraction. J. Appl. Crystallogr. 2012, 45, 22–27. [Google Scholar] [CrossRef]
- Cametti, G.; Pacella, A.; Mura, F.; Rossi, M.; Ballirano, P. New morphological, chemical, and structural data of woolly erionite-Na from Durkee, Oregon, U.S.A. Am. Mineral. 2013, 98, 2155–2163. [Google Scholar] [CrossRef]
- Young, R.A. Introduction to the Rietveld method. In The Rietveld Method; Young, R.A., Ed.; Oxford University Press: Oxford, UK, 1993; pp. 1–38. [Google Scholar]
- Bish, D.L. Determination of dehydration behaviour of zeolites using Rietveld refinement and high-temperature X-ray diffraction data. Geol. Soc. Am. Annu. Meet. Abstr. Programs 1989, 21, A73. [Google Scholar]
- Sheppard, R.A.; Gude, A.J., III. Chemical composition and physical properties of the related zeolites offretite and erionite. Am. Mineral. 1969, 54, 875–886. [Google Scholar]
- Ballirano, P.; Sadun, C. Thermal behavior of trehalose dihydrate (Th) and β-anhydrous trehalose (Tβ) by in-situ laboratory parallel-beam X-ray powder diffraction. Struct. Chem. 2009, 20, 815–823. [Google Scholar] [CrossRef]
- Matassa, R.; Famigliari, G.; Relucenti, M.; Battaglione, E.; Downing, C.; Pacella, A.; Cametti, G.; Ballirano, P. A Deep Look into Erionite Fibres: An Electron Microscopy Investigation of their Self-Assembly. Sci. Rep. 2015, 5, 16757. [Google Scholar] [CrossRef] [PubMed] [Green Version]
- Baerlocher, C.; McCusker, L.B.; Olson, D.H. Atlas of Zeolite Framework Types, 5th ed.; Elsevier: London, UK, 2001; p. 398. [Google Scholar]
- Hammonds, K.D.; Deng, H.; Heine, V.; Dove, M.T. How floppy modes give rise to adsorption sites in zeolites. Phys. Rev. Lett. 1997, 78, 3701–3704. [Google Scholar] [CrossRef]
- Hammonds, K.D.; Heine, V.; Dove, M.T. Rigid-unit modes and the quantitative determination of the flexibility possessed by zeolite frameworks. J. Phys. Chem. 1998, B102, 1759–1767. [Google Scholar] [CrossRef]
- Mon, J.; Deng, Y.; Flury, M.; Harsh, J.B. Cesium incorporation and diffusion in cancrinite, sodalite, zeolite and allophane. Microporous Mesoporous Mater. 2005, 86, 277–286. [Google Scholar] [CrossRef]
- Bloise, A.; Catalano, M.; Barrese, E.; Gualtieri, A.F.; Bursi Gandolfi, N.; Capella, S.; Belluso, E. TG/DSC study of the thermal behavior of hazardous mineral fibres. J. Therm. Anal. Calorim. 2016, 123, 2225–2239. [Google Scholar] [CrossRef]
- Pacella, A.; Cremisini, C.; Nardi, E.; Montereali, M.R.; Pettiti, I.; Ballirano, P. The mechanism of iron binding processes in erionite fibres. Sci. Rep. 2017, 7, 1319. [Google Scholar] [CrossRef] [PubMed]
- Armbruster, T. Dehydration mechanism of clinoptilolite and heulandite: Single-crystal X-ray study of Na-poor, Ca-, K-, Mg-rich clinoptiloite at 100 K. Am. Mineral. 1993, 78, 260–264. [Google Scholar]
- Ballirano, P.; Pacella, A.; Cremisini, C.; Nardi, E.; Fantauzzi, M.; Atzei, D.; Rossi, A.; Cametti, G. Fe (II) segregation at a specific crystallographic site of fibrous erionite: A first step toward the understanding of the mechanisms inducing its carcinogenicity. Microporous Mesoporous Mater. 2015, 211, 49–63. [Google Scholar] [CrossRef]
- Eborn, S.K.; Aust, A.E. Effect of iron acquisition on induction of DNA singlestrand breaks by erionite, a carcinogenic mineral fiber. Arch. Biochem. Biophys. 1995, 316, 507–514. [Google Scholar] [CrossRef] [PubMed]
Figure 1.
Magnified 3D view (6–80° 2θ) of the full dataset of the 303–1173 K heating run of woolly-erionite-K.
Figure 1.
Magnified 3D view (6–80° 2θ) of the full dataset of the 303–1173 K heating run of woolly-erionite-K.

Figure 2.
Magnified view (6–60° 2θ) of the fitted X-ray diffraction pattern obtained at (a) 303 K and (b) 1098 K. The lower curve represents the difference between observed and calculated profiles. Vertical marks refer to the position of calculated Bragg reflections of, from above to below: erionite, quartz, calcite, and nontronite.

Figure 3.
Relative expansion of (a) a-; (b) c-parameter and (c) volume of woolly erionite-K in the 303–1173 K thermal range. Data of Bish [30], Ballirano and Cametti [19] and Ballirano and Pacella [20] are reported for comparison purposes. The sample of erionite-K analyzed by Bish [30] had R = 0.785 [31] and was dehydrated in vacuo.


Figure 4.
Evolution with temperature of the principal radii ra and rc of the ellipsoid describing the crystallite shape.
Figure 4.
Evolution with temperature of the principal radii ra and rc of the ellipsoid describing the crystallite shape.

Figure 5.
Evolution of the shape of the 8MR as a function of temperature as defined by the O4–O4 and O6–O6 distances. Inset: dependence from temperature of the crystallographic free area (CFA) (sensu Baerlocher et al. [34]). The area has been calculated approximating the ring shape to an ellipse whose minor and major axes correspond to the minimum and maximum free diameter values (FDV), calculated as, respectively, the O4–O4 distance minus 2 times the oxygen radius (taken as 1.35 Å) and the O6–O6 distance minus 2 times the oxygen radius.

Figure 6.
The dependence from temperature of the shape of the six-membered ring (6MR) shared between neighboring cancrinite, and erionite cages.
Figure 6.
The dependence from temperature of the shape of the six-membered ring (6MR) shared between neighboring cancrinite, and erionite cages.

Figure 7.
Evolution with temperature of the site scattering of the cation sites. Inset: dependence from temperature of the total site scattering of EF cation sites.
Figure 7.
Evolution with temperature of the site scattering of the cation sites. Inset: dependence from temperature of the total site scattering of EF cation sites.

Figure 8.
Evolution with temperature of the site scattering of the OW H2O sites.

Figure 9.
Comparison between the dependence from temperature of the total s.s. of OW H2O sites before (pink squares) and after subtraction of the EF cations contribution (red circles: see text for explanation) and the s.s. calculated from TG analysis of both pristine and fully hydrated woolly erionite-K.


Table 1.
Crystal data, experimental setup, data collection, and statistical indicators of the Rietveld refinements. Chemical data taken from Pacella et al. [23]. Conventional disagreement indices as defined in Young [29].
| Chemical Formula | (Ca2.03Na0.73K2.52Mg0.26)[Al8.22Si27.78O71.80]·29.71H2O |
|---|---|
| R = Si/(Si + Al) | 0.772 |
| Space group | P63/mmc |
| Cell parameters at 303 K (Å) | a = 13.2505(5) |
| c = 15.0497(6) | |
| Cell volume at 303 K (Å3) | 2288.36(18) |
| Instrument | D8 Advance (Bruker AXS, Karlsruhe, Germany) |
| X-ray tube | Cu operating at 40 kV and 40 mA |
| Incident beam optics | 60 mm multilayer (Göbel) X-ray mirror |
| Sample mount | Rotating capillary (60 r/min) |
| Soller slits | 2 (2.3° incident beam; radial diffracted beam) |
| Divergence slit | 0.6 mm |
| Detector | PSD VÅNTEC-1 |
| Data range (°2θ) | 6–145 |
| Step size (°2θ) | 0.022 |
| Counting time (s) | 2 |
| wRp (%) | 2.19–3.06 |
| Rp (%) | 1.70–2.35 |
| RBragg (%) | 0.25–0.58 |
Table 2.
Temperature of dehydration (Tdehydr) and of structural breakdown (Tbreak) of erionite samples. (Z/r)wt refers to the weighted ionic potential as described in Cruciani [22].
Table 2.
Temperature of dehydration (Tdehydr) and of structural breakdown (Tbreak) of erionite samples. (Z/r)wt refers to the weighted ionic potential as described in Cruciani [22].
| Sample | Reference | R | (Z/r)wt | Tdehyd (K) | Tbreak (K) | |
|---|---|---|---|---|---|---|
| End | Start | End | ||||
| Erionite-K | Ballirano and Cametti [19] | 0.807 | 0.096 | 573 | 1113 | 1193 |
| Erionite-Na | Ballirano and Pacella [20] | 0.796 | 0.090 | 600 | 1063 | 1173 |
| Erionite-K(Ca) | Present work | 0.772 | 0.090 | 658 | 1053 | 1158 |
| Erionite-Ca(K) | Cruciani [22] | 0.75 | 0.10 | <673 | <1023 | |
© 2018 by the authors. Licensee MDPI, Basel, Switzerland. This article is an open access article distributed under the terms and conditions of the Creative Commons Attribution (CC BY) license (http://creativecommons.org/licenses/by/4.0/).
Share and Cite
MDPI and ACS Style
Ballirano, P.; Pacella, A.; Bloise, A.; Giordani, M.; Mattioli, M. Thermal Stability of Woolly Erionite-K and Considerations about the Heat-Induced Behaviour of the Erionite Group. Minerals 2018, 8, 28. https://doi.org/10.3390/min8010028
AMA Style
Ballirano P, Pacella A, Bloise A, Giordani M, Mattioli M. Thermal Stability of Woolly Erionite-K and Considerations about the Heat-Induced Behaviour of the Erionite Group. Minerals. 2018; 8(1):28. https://doi.org/10.3390/min8010028
Chicago/Turabian StyleBallirano, Paolo, Alessandro Pacella, Andrea Bloise, Matteo Giordani, and Michele Mattioli. 2018. "Thermal Stability of Woolly Erionite-K and Considerations about the Heat-Induced Behaviour of the Erionite Group" Minerals 8, no. 1: 28. https://doi.org/10.3390/min8010028
Note that from the first issue of 2016, this journal uses article numbers instead of page numbers. See further details here.