Comparative Analysis of the Strength Distribution for Irregular Particles of Carbonates, Shale, and Sandstone Ore


Department of Environmental Engineering and Mineral Processing, Faculty of Mining and Geoengineering, AGH University of Science and Technology, 30-059 Cracow, Poland
*
Author to whom correspondence should be addressed.
Minerals 2018, 8(2), 37; https://doi.org/10.3390/min8020037
Submission received: 23 November 2017
/
Revised: 16 January 2018
/
Accepted: 19 January 2018
/
Published: 24 January 2018
Abstract
:The article presents the results of investigations on three lithological types of Polish copper ore: sandstone ore, carbonate ore, and shale ore. According to X-ray diffraction analysis, sandstone samples can be classified as sandstone with dolomite binder and partly clay binder; shale—as dolomitic slate with a high proportion of clay with elevated organic matter content; while dolomite has a high organic content. Five particle-sized fractions (16–18 mm, 18–20 mm, 20–25 mm, 25–31.5 mm, and 31.5–45 mm) of each lithological type were prepared. A single-axis slow-compression test was performed on single particles to determine the value of the crushing force. The Weibull distribution was used to approximate the strength distribution models and cumulative strength distribution functions for each of the materials. The residual deviation and non-linear correlation coefficient were calculated in order to assess the fitting of the model function to empirical data. In addition, the impact of particle size on the strength of the raw material was separately investigated for the hard (dolomite and shale) and soft brittle material (sandstone).
1. Introduction
Copper ores processed in Poland are the mixtures of three lithological types: calcium and magnesium carbonates, marlite shales with various contents of clay, and sandstones with carbonate and clay binder. The technology of mineral processing for those ores involves operations of crushing and grinding, together with size classification on screens, as well as prior flotation—the main beneficiation processes in the Polish processing plant. Physical and mechanical parameters of each lithological type are various; what is effective is the operational effectiveness of each of the crushing and grinding processes.
The main idea of this paper is to determine the strength characteristics for three lithological types of the ore and to calculate models of strength distribution. These models can be helpful in the determination of the probability of material breakage for individual lithological types, as well as for their mixtures and, as a result, in the design and selection of a more effective comminution circuit for the given type of feed material. Models predicting the comminution effects for various mixtures of lithological types are especially useful for the reason that in operational practice the run-of-mine (ROM) material constitutes the mixture of sandstones, carbonates, and shales. For example, the Rudna mine extracts both sandstone and shale-carbonate ores, with the sandstone-shale-carbonate ratio: 70%-20%-10%. In the Polkowice processing plant, in turn, carbonate is the predominant ore type, with the content reaching up to 70%. It is also obvious that single particles with variable particle sizes have various crushing resistances, which significantly influence the value of the comminution degree for crushing and grinding products. The strength distribution models of individual lithological types, in relation to the size of their particles, were also determined; these constitute the major practical and scientific aims of this paper.
2. Materials and Methods
Three different lithological types of ores (sandstones, carbonates, and shales) were used in investigations. The samples for testing programme were taken from the ROM material, previously crushed in a hammer crusher. The sieve analysis, using square meshes of sizes 16 mm, 18 mm, 20 mm, 25 mm, 31.5 mm, and 45 mm, was carried out. The five particle size fraction was then obtained for the sizes 16–18 mm, 18–20 mm, 20–25 mm, 25–31.5 mm, and 31.5–45 mm. Three lithological types of copper ore (carbonate, sandstone, and shale ore) were manually divided within each particle size fraction (Figure 1).
2.1. Material Characteristic
Selected physical and mechanical characteristics of the materials were determined. The results are presented in Table 1, Table 2 and Table 3.
Sandstone was characterized as a conglomerate of quartz sand grains and binders. A mix of dolomitic, lime, gypsum, and partly clayey binders were identified in upper part of sandstone ore deposit, while the main part of sandstone layer was dominated by clayey binders. Table 1 shows an average petrographic composition of ore according to Banaszak and Banas [1], compared to the results obtained for the tested samples in the X-ray analysis.
The X-ray diffraction analysis for each lithological type was also performed in order to determine the content of individual minerals. Results of the analysis show that sandstone samples can be classified as dolomitic and partially clayey sandstone (mixed sandstone); shale—mainly as dolomitic shale with high proportion of clay with elevated organic matter content and carbonate—has a significantly high organic content. Average values of strength indicators presented in literature [1] and author’s research [2,3] were presented in Table 2.
The decision as to whether the material was classified as brittle (hard) or less brittle (soft) was made on the basis of values presented in Table 2. This data shows that dolomite can regarded as the hardest material, while the shale, as well as sandstone, can be classified as less brittle materials.
The next indicator under analysis was the Bond Work Index (Wi). This parameter characterizes resistance of the material to crushing and grinding. The Bond Work Index unit is the kilowatt-hour per tonne, and represents the specific energy required (in kWh/t) to reduce the material from theoretically infinite feed size to 100 μm [4]. The standard grindability Bond test was widely described in the literature [5,6,7,8]. Table 3 shows values of Wi for the individual lithological types of copper ore, determined in laboratories of AGH University of Science and Technology (AGH UST) and Institute of Building Materials in Krakow (IMMB), that were carried out in 2004. More recent results, performed by the authors, were also presented in the table.
By analyzing the results presented in the above table, it can be seen that individual values of Wi do not differ significantly. The highest difference can be noticed for the sandstone. It is convergent with operational practice, because sandstone ore shows more significant variability of this parameter compared to shales and carbonates. Results presented in Table 3 also indicate that the largest amount of the grinding energy is required for the sandstone particles breakage, which is also confirmed by operational practice. In the first stage of crushing process, liberation of sand particles, joined by soft clay binder, takes part. However, in the subsequent comminution stages mainly quartz particles are subject to breakage. This requires more energy, as they are combined by hard dolomitic binder.
2.2. Research Methodology
Mechanical crushing is a complex process, but the mechanism, in general, involves the breakage of individual particles through contact with other particles, with the grinding media, or with the solid walls of the crushing device. The machines for single-particle breakage involve four loading conditions: point-to-point loading, plane-to-plane loading, point-to-plane loading, and multi-point loading [9,10]. There are many different compression test systems that can be used to determine the strength of particles [11,12,13,14,15]. They can be measured, for example, by the breaking force applied through uniaxial compression to a particle, placed between two parallel platens of the testing device. In our case, individual particles were placed between two 230 mm × 230 mm steel plates in the most stable position (Figure 2) and were then slowly compressed at a constant rate, until the first fracture across the particle occurred. The value of the maximum crushing force (peak point A, Figure 3) for each particle was recorded.
Maximum crushing force (the peak force) defines the particles strength. The maximum load in compression test for carbonate samples was 28 kN, while the maximum crushing force for shales was 16 kN. The maximum peak point observed for sandstone equaled only 9 kN. Exemplary plot presenting relationship between force and displacement was presented in Figure 3. The exact data for displacement value was not provided in this case, because this parameter could not be registered with the required accuracy during the testing programme.
The compression tests for three lithological types in five particle-size fractions of 16–18 mm, 18–20 mm, 20–25 mm, 25–31.5 mm, 31.5–45 mm were performed. About 100 randomly selected particles from each particle size fraction were then subjected to breakage in order to collect sufficient data for further statistical analyses of the breakage strengths of selected materials. The tensile strength of each particle was calculated according to Formula (1) [16]:
where:
- F—value of the maximum crushing force, [kN]
- D—mean size of each particle size fraction (i.e., for the size fraction 25–31.5 mm the value D equals 0.02825 m), [m].
It is worth mentioning that for the reason the sandstone is regarded as a soft material, there was a problem in obtaining a significant amount of comminuted particles within the size fraction 31.5–45 mm. During a single compression test it was also difficult to notice the exact moments of particle cracking. For example, in the case of carbonate (hard rock), the moment of cracking of the particle was accompanied by a short sound (a bang) that was clearly heard, while in the case of sandstone particle this sound was almost nonexistent (the exception was the dolomitic sandstone particles). Carbonate and shale particles usually disintegrated themselves into some coarser and very fine particles, while sandstone was mainly breaking into very fine pieces. Greater particles have also easily disintegrated during sieve analysis. Figure 4 presents the final effect of the crushing force: breakage of sandstone, shale, and carbonate particles. The particles obtained from each single-breakage test were collected separately.
For every single particle under testing there was registered a value of crushing force F within the range that was different for each lithological type. Then, the material was divided into several narrow fractions (fraction number j), according to the value of crushing force (each lithological type separately). The obtained results were used for determination of average strength value and the distribution of strength for each lithological type. Average strength of the crushed particles in particular crushing force fractions (<σi>), together with average strength of the crushed particles in each of five size fractions (σsr), were also determined. Table 4 presents results of calculations performed for the carbonate in particle size fraction 31.5–45 mm as an example. Fifteen similar tables were obtained in total for all samples.
The pi value—a yield of the i-th class according to the force F—which is also the density function of strength distribution, was calculated from Formula (2):
where:
—sum of particle weight in the i-th class of crushing force,
—total sample mass, [g]. The M value in this case equals 5882.5 g. The j denotes the number of classes according to the crushing force F, from j = 1 to j = N, while n is the number of classes according to the size (from i = 1 to i = n). The cumulative yield of particles in individual size fractions according to crushing force was approximated to the Weibull’s distribution function [17]:
where:
- m—Weibull modulus,
- —average strength of the crushed particles in particular size fraction [MPa],
- —average strength of the crushed particles in particular crushing force fractions [MPa],
- c—constant, associated with the Weibull modulus from the Gamma function:
The parameters m and depend on the distribution of the size of cracks and they were calculated with using of the least squares method. The average strength of the crushed particles in each crushing force fraction was calculated as follow:
Compatibility of model with the empirical data was assessed with using the B index [18]:
where is a relative strength value calculated from the condition . The value is:
—average value .
For B = 1, there is a goodness of fit between the model and empirical data. If the index B > 0.95 compliance is very good.
The non-linear correlation coefficient was calculated according to formula:
in which:
calculated according to Formula (3).
—average value .
3. Results Analysis
Tensile strength of mineral particles is characterized by significant scatter of results. This variability is caused by various factors, i.e., type of crusher, crushing, and material strength properties, as well as particle shape and internal structure [19,20,21]. Consequently, the strength of mineral particles can be characterized by a certain distribution. This strength distribution is expressed by the Weibull distribution function, in which the parameters are the Weibull modulus and the average strength value in a particular size fractions [17,22,23,24]. For such a case the fitting of model distribution to empirical data is close to the ideal value (B = 1, = 1).
Figure 5 and Formula (10) present the cumulative distribution function of tensile strength for carbonate particles for five particle size fractions:
The curves show that model is well convergent with experimental data. The model fitting ratios are very high (B > 0.95, ). This method has practical importance, as it describes the distribution of the strength of irregular particles within the wide range of size fractions by using one model.
Figure 6 and Formula (11) present the cumulative distribution function of tensile strength of shale particles for five particle size fractions:
Figure 7 and Formula (12) present the cumulative distribution function of tensile strength of sandstone particles for five size fractions:
For this case it is worth noticing that empirical data of the 20–25 mm particle size fraction is the most outstanding. It has a reflection with the lowest value of B, but r value is very high, however. The obtained result for sandstone may indicate that for a less brittle material the strength model might not fit as well as in the case of hard rocks.
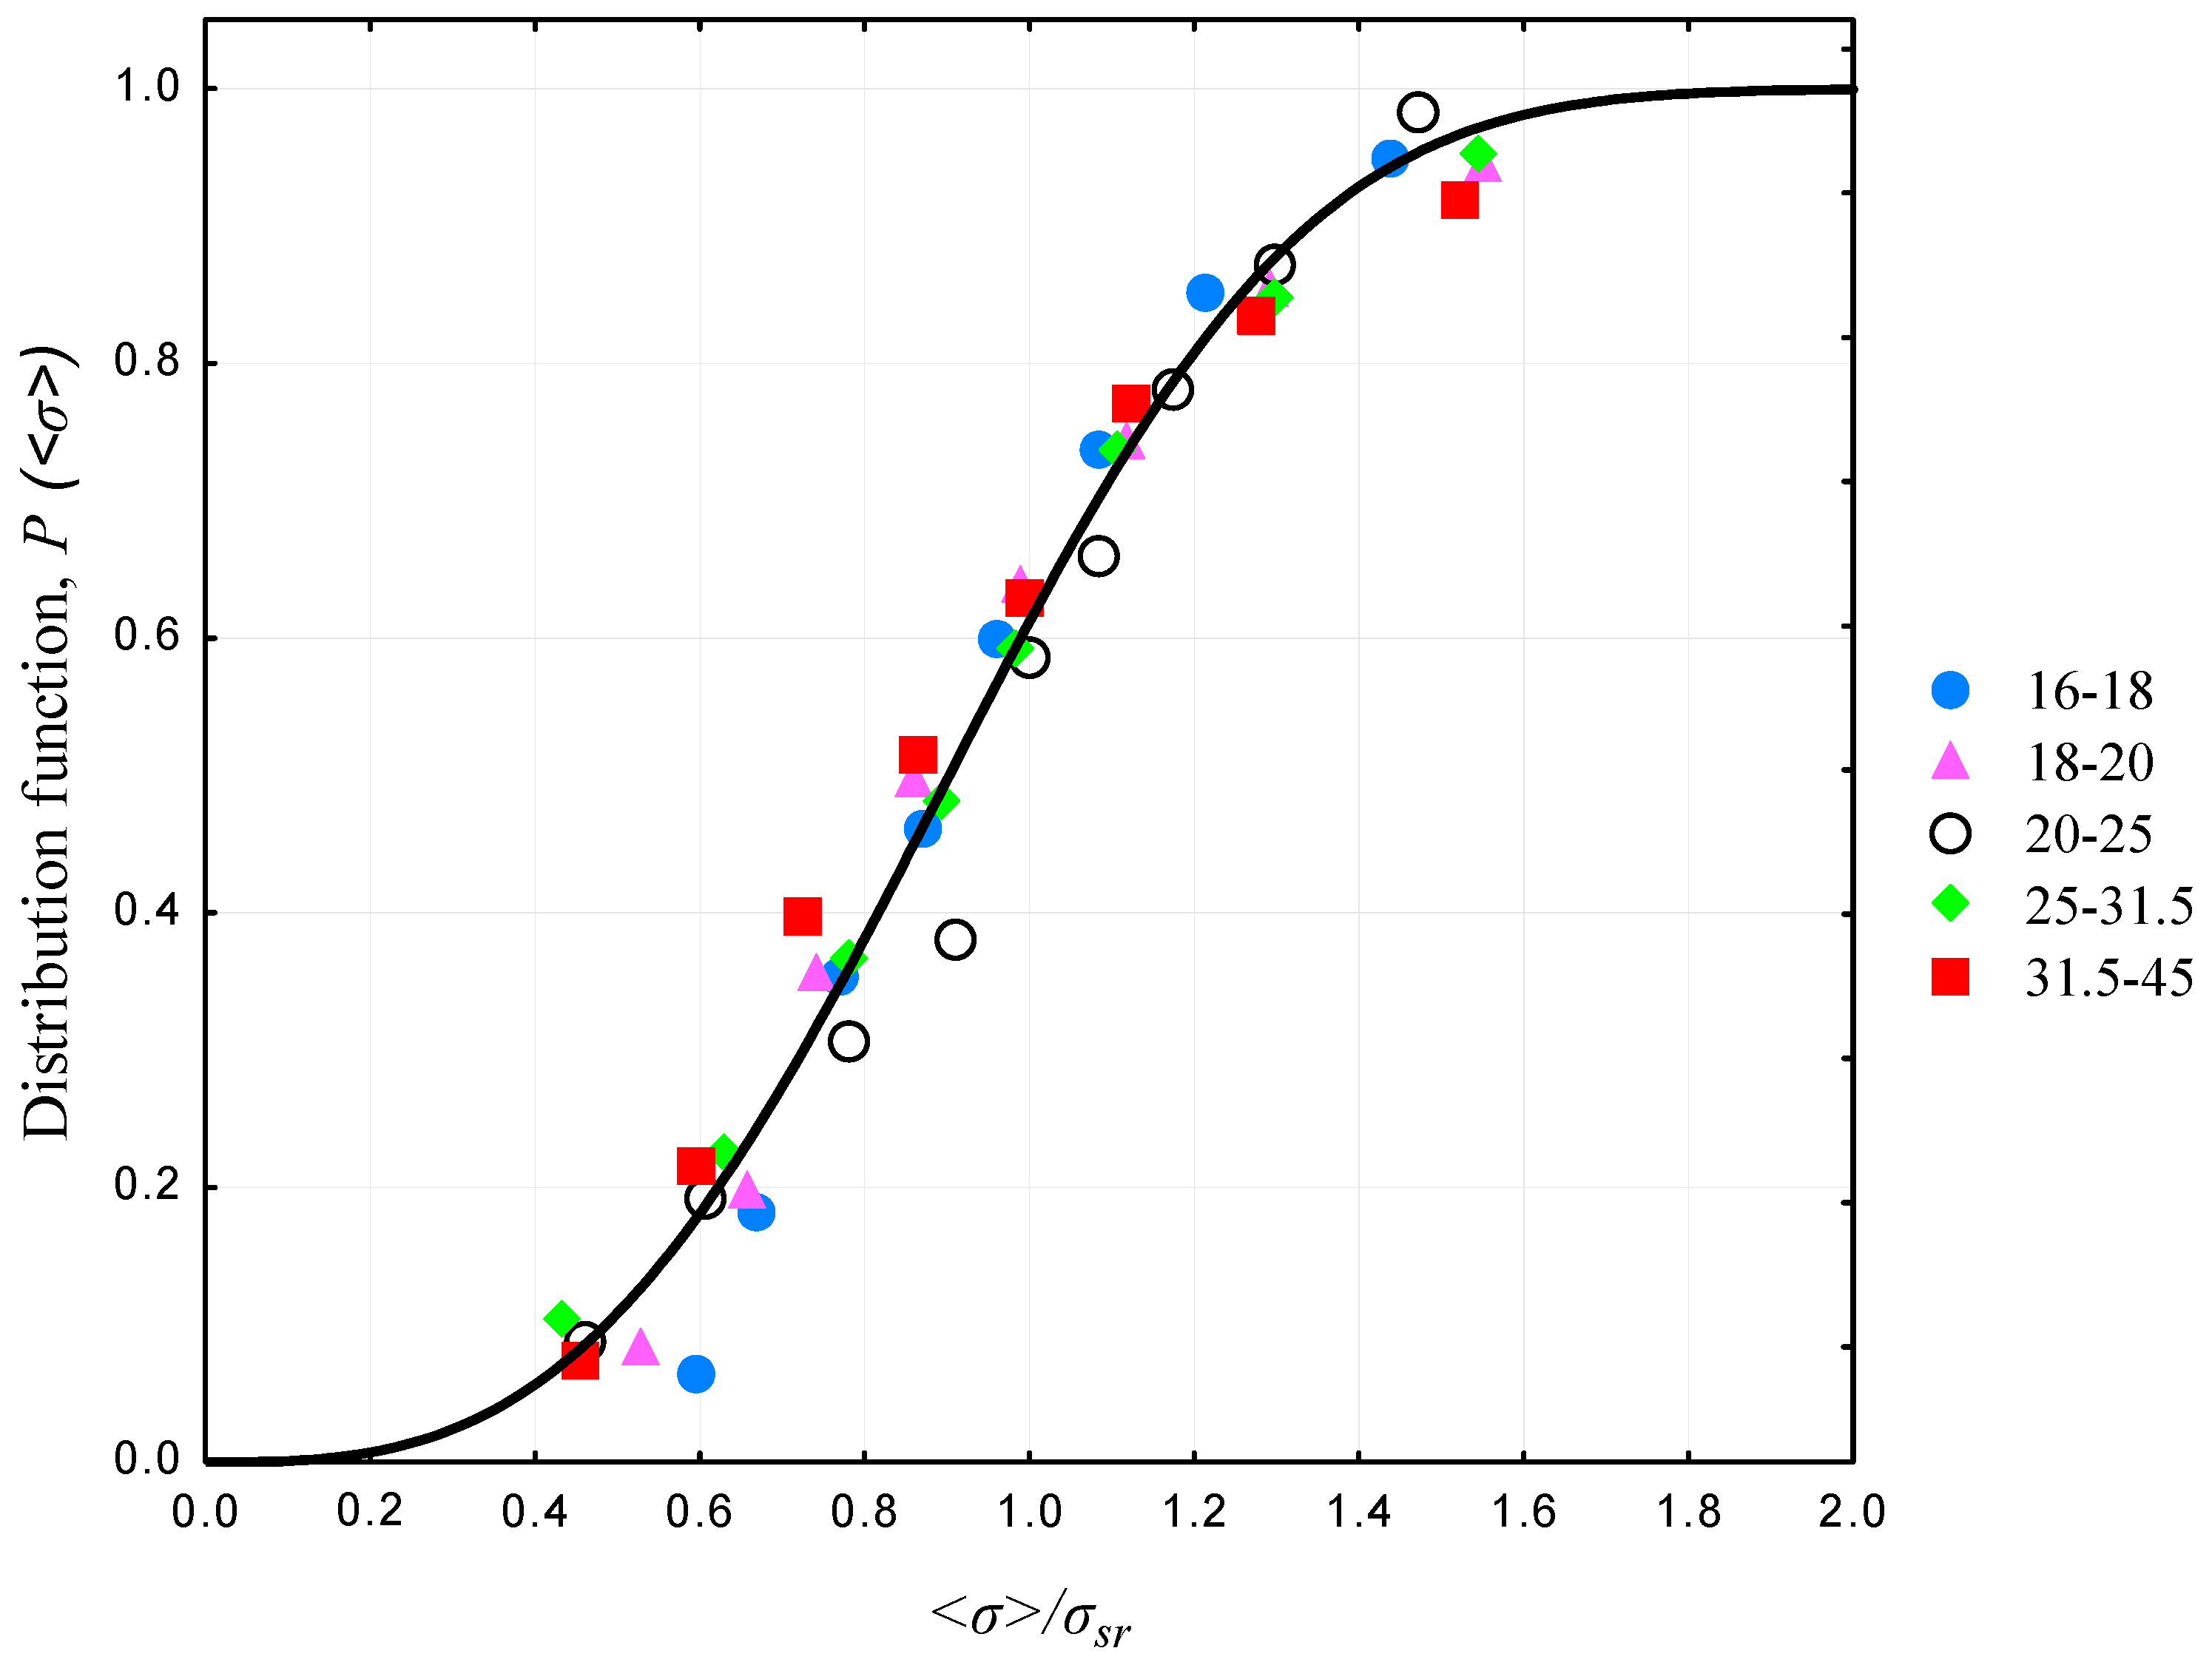
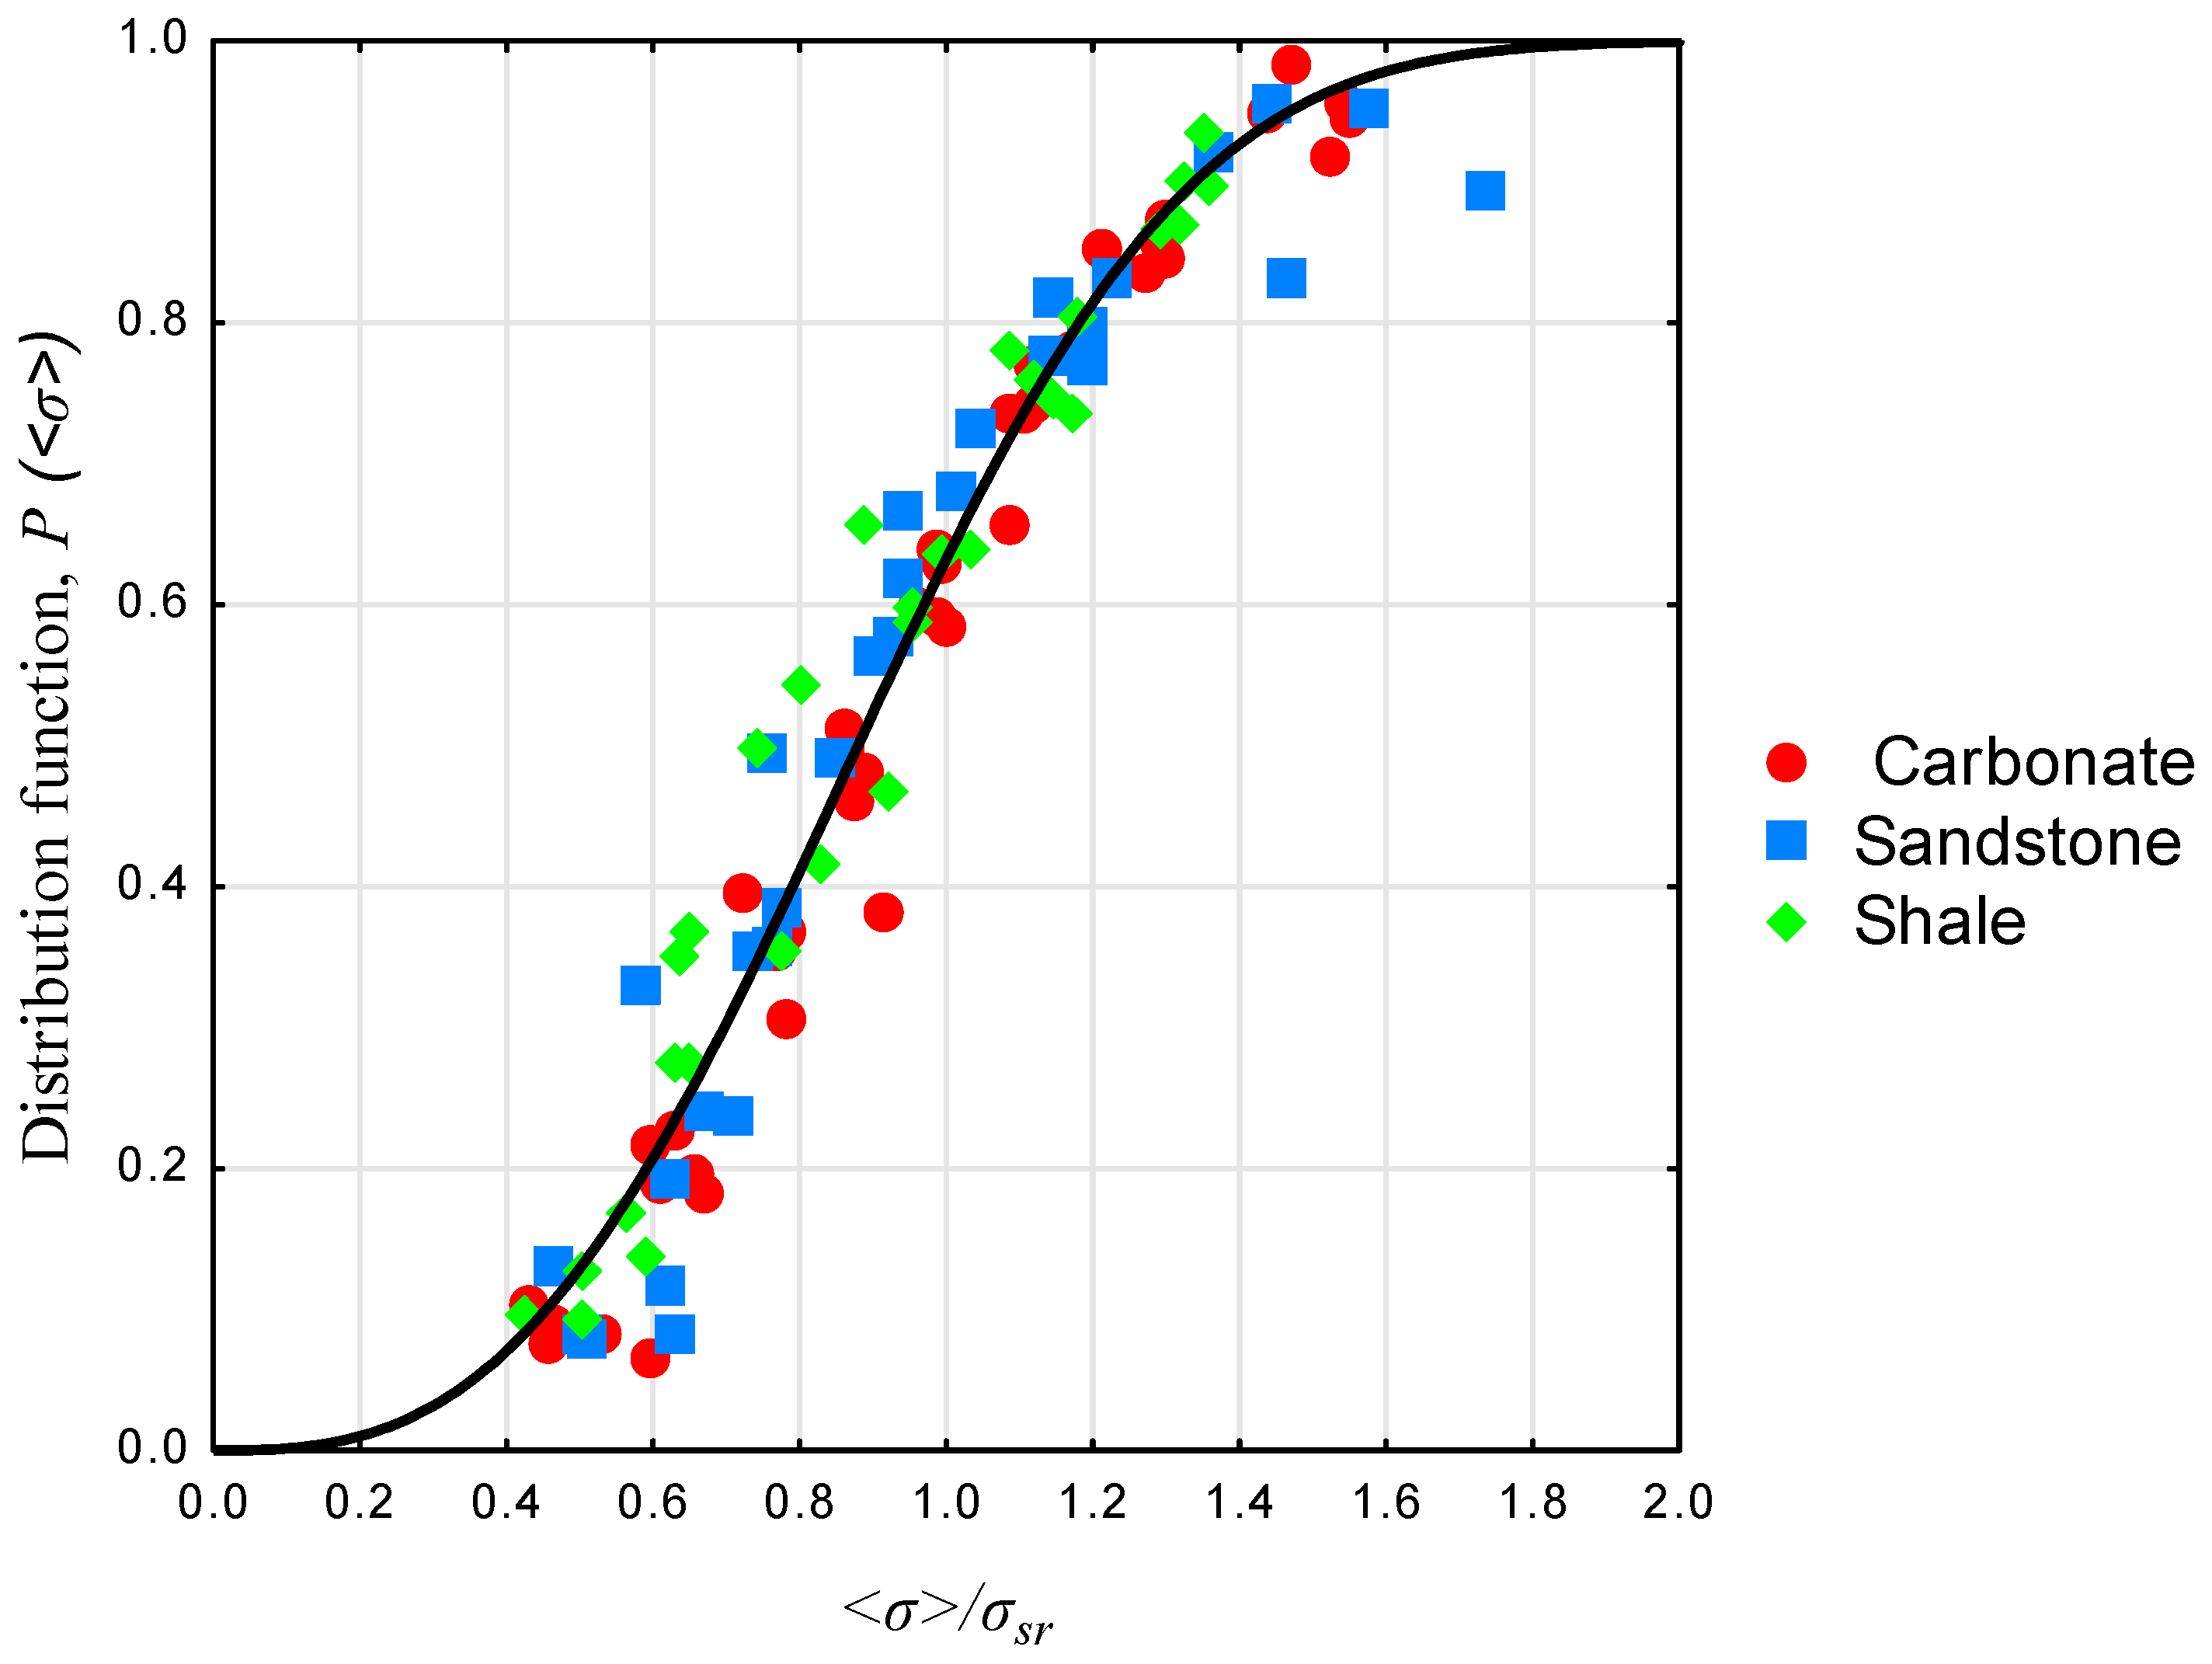
Figure 8 presents the cumulative distribution function of tensile strength of carbonate, shale, and sandstone particles for five size fractions. The model strength distribution for the five sizes of fractions of samples is:
Analyzing the strength distribution curves for carbonate, shale, and sandstone, and taking into account the model fitting indicators, it can be assumed that a general model fits the experimental data. Considering the fact that research was conducted on a set of irregular particles, it can be stated that Weibull’s distribution well approximates the strength distribution for irregular particles, both for hard and soft rock materials.
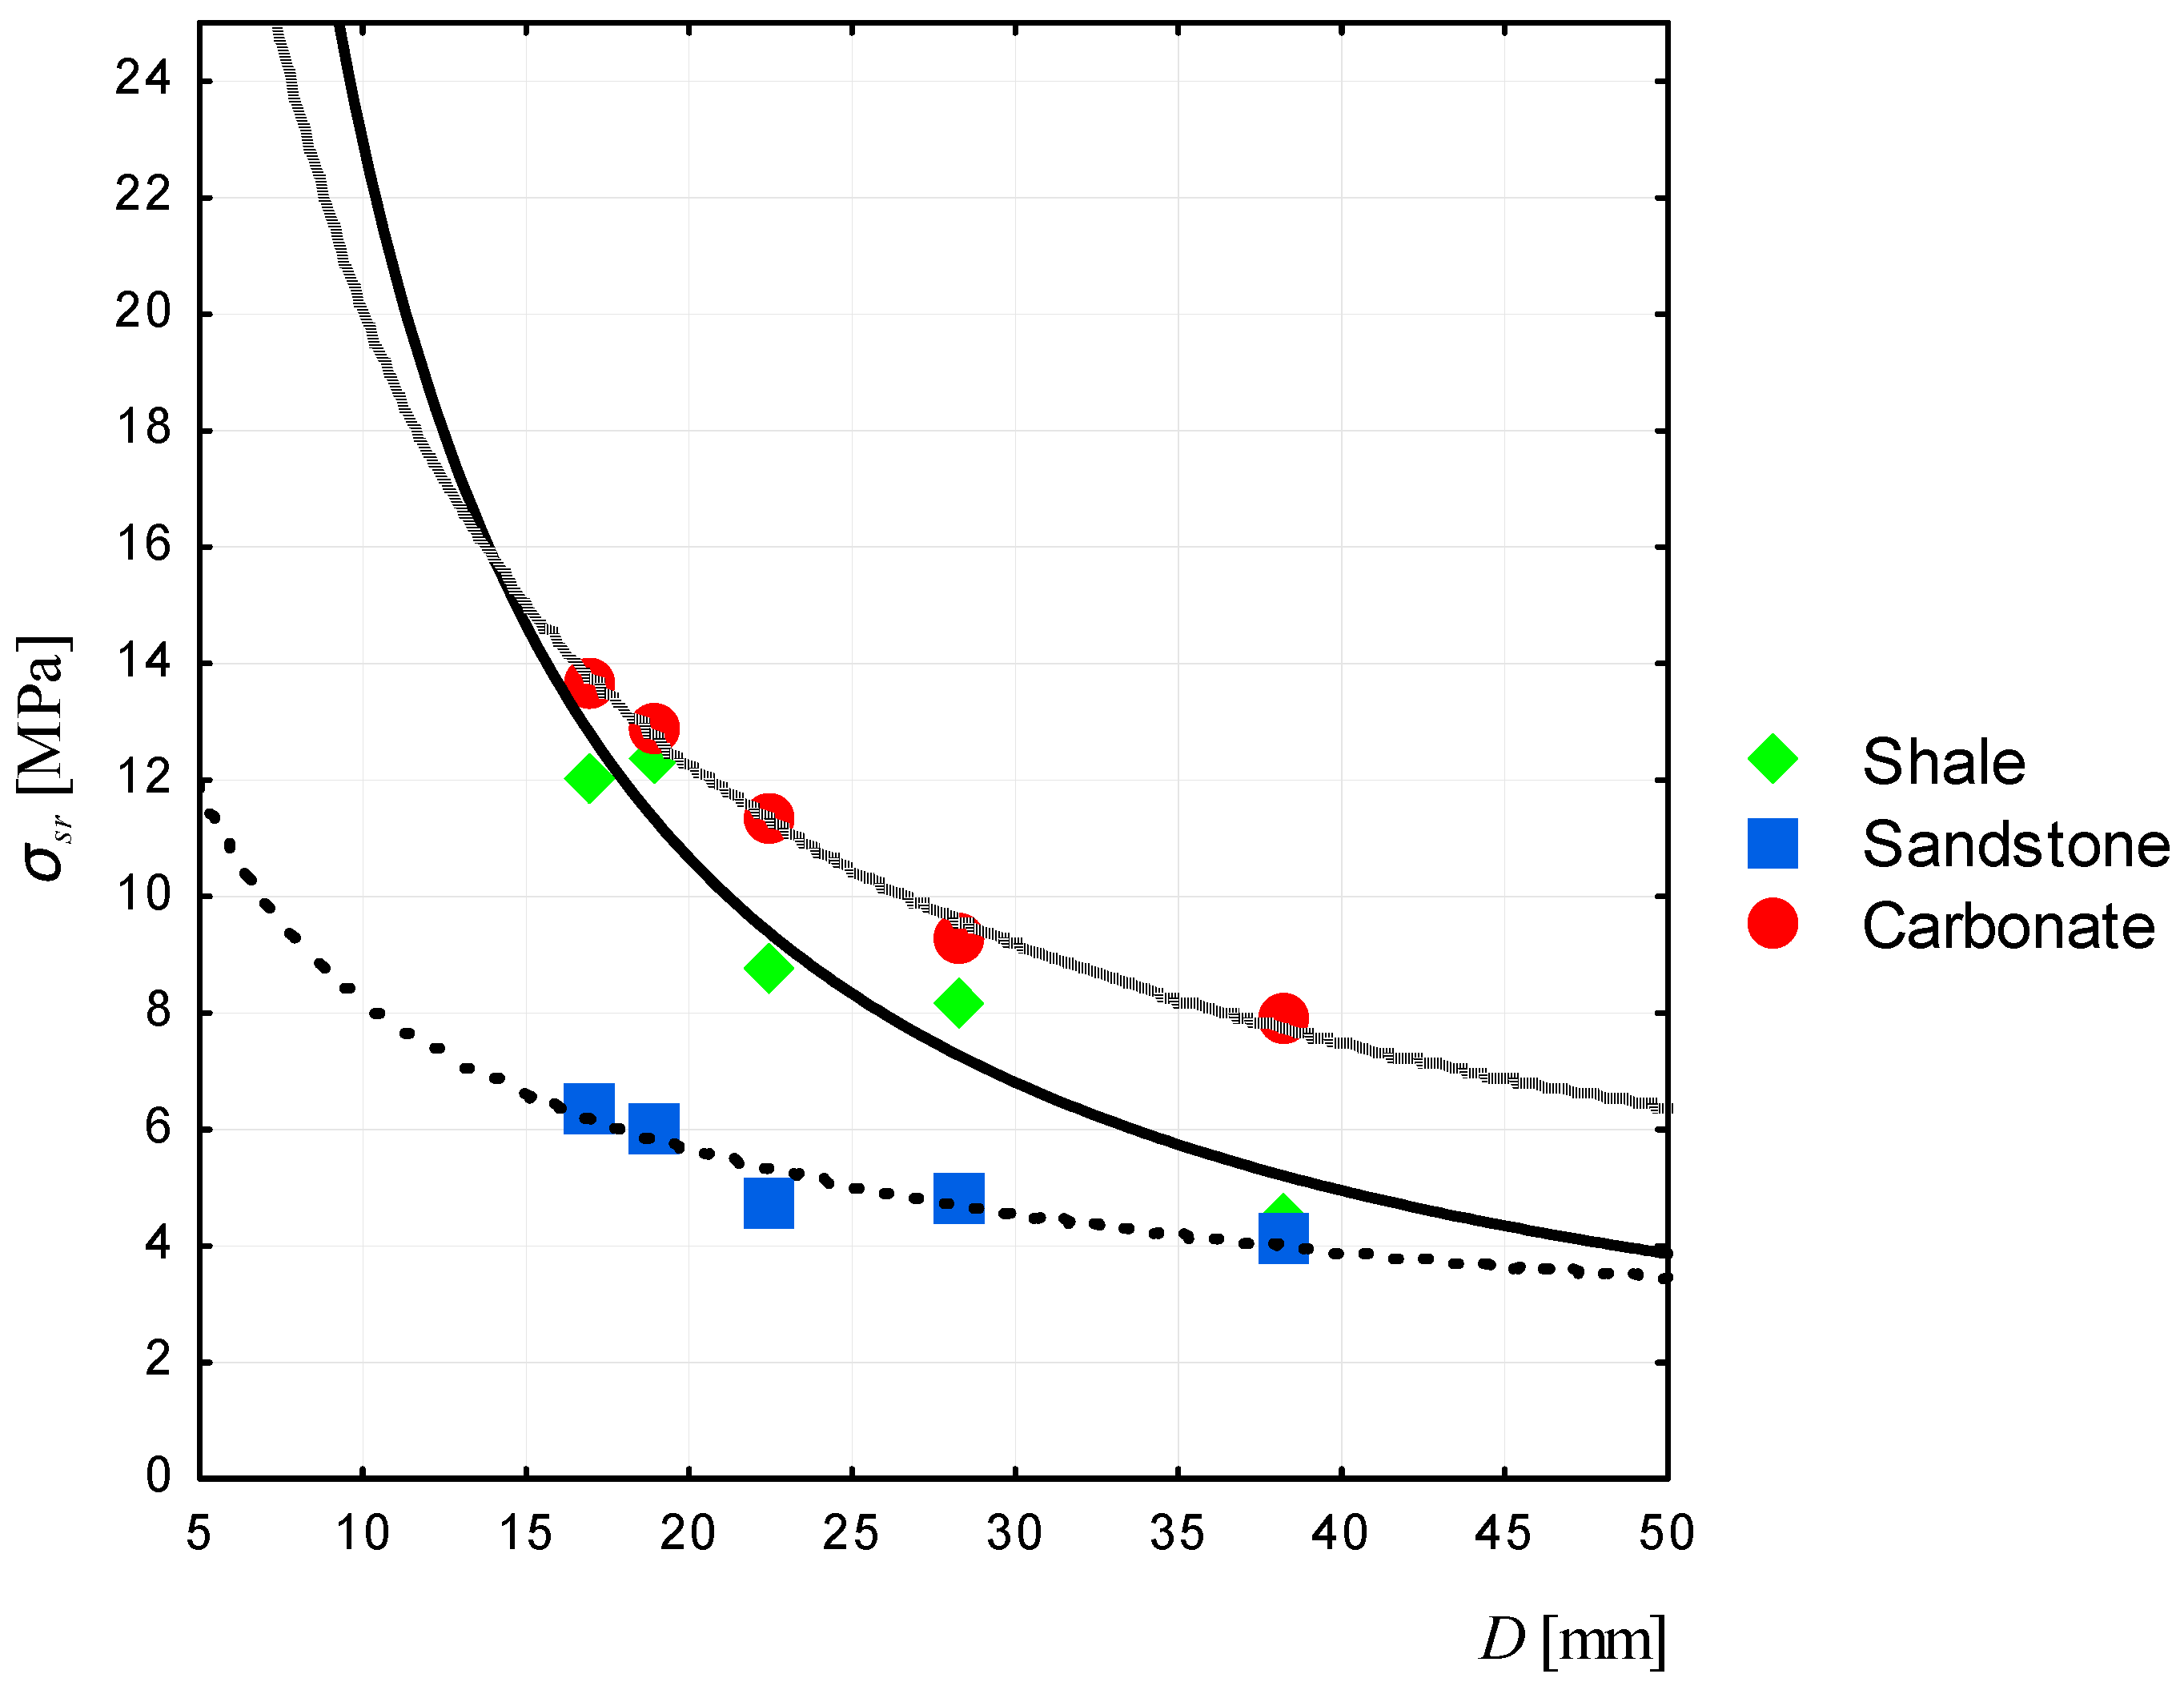
In addition to the above observations for all lithological types there were observed correlations between the increase in average particle strength and the decrease in mean particle size of particles (Figure 9). This is consistent with a statistical strength theory, according to which, together with an increase in particle volume, the probability of occurring the greater numbers of microcracks, which cause damage to the particle, increases too.
4. Mathematical Models of Strength Distribution
The process of particle breakage under external loads is conditioned by the distribution of local strength in particle volume, which, according to the weakest link concept, determines the tensile strength of the particle. The size of the particle obtained from the sample of the primary particle will be a function of the spatial distribution of the local strength distribution in the sample and the distribution of the minimum value of that strength in the sample.
Gilvarry [25] assumed that there are three types of cracks in material: volumetric, surface, and edge. It can be assumed that, according to the type of cracks, their number in the particle is proportional to D3, D2, and D. According to that, the Weibull distribution parameter is related to the average particle strength and its dimension by the one of the following equations:
where:
- —material constant,
- k1, k2, and k3—constants, particle-shaped coefficients.
- The parameter σ0, as well as Weibull modulus m, is a material constant.
In individual case, the relations between particle strength and particle dimensions are in general similar to hyperbolic functions. However, determination of individual equations for each material is connected to determination of the values of the corresponding coefficients in approximation formulas and will be examined in the subsequent articles.
Mathematical models can be determined with using following formulas:
- for carbonate ore:
- for shale ore:
- for sandstone ore:
The highest average strength value was obtained for dolomite (about 14 MPa); two times lower strength was recorded for sandstone (up to 7 MPa). The difference in the tensile strength of shale and dolomite particles in the particle size fraction 40 mm is due to the fact that the shale particles generally were more flat, while in the further grinding process the flat particles are easier to destroy and have lower strength. The curves of strength distribution for shale and carbonate are close to each other, which causes difficulties in their selective crushing.
The formulas also have their practical meaning in determination of the breakage resistance of material in individual particle-sized fractions. Knowing the size of material proceeded for crushing/grinding operations, it is possible to determine its behavior during the process. Initial assessment of selected process parameters can be made, i.e., determination of energy requirements for comminution of individual material.
5. Conclusions
The strength indicators of the material are significant in all stages of ore comminution, from the blasting to the crushing and grinding operations. By analyzing the data of individual lithological types of copper ore it can be stated that the carbonate limestone-dolomite ore and dolomitic shale ore can be classified as hard material, while clay shales and clay sandstones can be classified as less brittle. Only the sandstones in the roof part of the excavation show higher strength properties.
The results of the investigations showed that the largest amount of energy is required for sandstone grains grinding. This is due to the fact that during the sandstone ore crushing process the sand particles, joined by clay binder, are separated from each other. However, in the subsequent stages of the grinding process, there are mainly quartz particles, which are combined by dolomitic binder. During the compression test, the sandstone was mostly disintegrated into very fine pieces; additionally, the larger particles easily broke during the sieve analysis. Dolomite and shale particles disintegrated into a few coarse and very fine particles.
Analyzing the curves of strength distribution for dolomite, shale, and sandstone, as well as taking into account the model fitting indicators, it can be assumed that the model fits the experimental values. Considering the fact that the research programme was carried out on a set of irregular particles, it can be said that Weibull’s distribution well approximates the distribution of strength of irregular mineral particles both for hard and for less brittle material.
The results obtained allow for numerical calculations of the proper comminution energy that connects the energetic aspect of the particle breakage problem with its strength properties. In the next stage of investigation, there might be performed simulations of the comminution intensity of the mixtures of the individual lithological types of material.
Acknowledgments
This study is supported through the statutory research registered in AGH University of Mining and Metallurgy in Krakow at No. 11.11.100.276.
Author Contributions
Alona Nad and Daniel Saramak: idea and design of experimental programme; Alona Nad: experiments performance, data analysis, writing the paper; Daniel Saramak providing materials, article correction.
Conflicts of Interest
The authors declare no conflict of interest.
References
- Banaszak, A.; Banaś, M. (Eds.) Monograph of KGHM Polska Miedź S.A.; Cuprum Publishing House: Lubin, Poland, 1996. (In Polish) [Google Scholar]
- Nad, A.; Brożek, M.; Naziemiec, Z. The tensile strength properties of lithological variety of Polish copper ores. AGH J. Min. Geoeng. 2012, 36, 101–108. [Google Scholar]
- Nad, A.; Brożek, M. Analysis of the particle size distribution of products crushing shale and dolomite crushing by compression of single irregular particles. J. Pol. Miner. Eng. Soc. 2018, in press. [Google Scholar]
- Wills, B.A.; Napier-Munn, T. Will’s Mineral Processing Technology-An Introduction to the Practical Aspects of Ore Treatment and Mineral Recovery, 7th ed.; Elsevier Science and Technology Books: Amsterdam, The Netherlands, 2006; p. 450. [Google Scholar]
- Tumidajski, T.; Kasińska-Pilut, E.; Gawenda, T.; Naziemiec, Z.; Pilut, R. Investigation of grinding process energy consumption and grindability of lithologic components of polish copper ores. Miner. Resour. Manag. 2010, 26, 61–72. (In Polish) [Google Scholar]
- Bond, F.C.; Maxson, W.L. Standard grindability tests and calculations. Trans. Soc. Min. Eng. AIME 1943, 153, 362–372. [Google Scholar]
- Magdalinovic, N. A procedure for rapid determination of the Bond Work Index. Int. J. Miner. Process. 1987, 27, 125–132. [Google Scholar] [CrossRef]
- Bond, F.C. Crushing and grinding calculations. Part I-II. Br. Chem. Eng. 1961, 6, 9–14. [Google Scholar]
- Tang, C.A.; Hudson, A.J. Rock Failure Mechanisms: Explained and Illustrated; Taylor and Francis Group, CRC Press: New York, NY, USA, 2011. [Google Scholar]
- Salman, A.D.; Ghandiri, M.; Hounslow, M.J. (Eds.) Particle Breakage; Elsevier: Amsterdam, The Netherlands, 2007. [Google Scholar]
- Rozenblat, Y.; Portnikov, D.; Levy, A.; Kalman, H.; Aman, S.; Tomas, J. Strength distribution of particles under compression. Powder Technol. 2011, 208, 215–224. [Google Scholar] [CrossRef]
- Gundepudi, M.K.; Sankar, B.V.; Mecholsky, J.J., Jr.; Clupper, D.C. Stress analysis of brittle spheres under multiaxial loading. Powder Technol. 1997, 94, 153–161. [Google Scholar] [CrossRef]
- Paul, J.; Romeis, S.; Tomas, J.; Peukert, W. A review of models for single particle compression and their application to silica microspheres. Adv. Powder Technol. 2014, 25, 136–153. [Google Scholar] [CrossRef]
- Dong, J.; Cheng, Y.; Hu, B.; Hao, C.; Tu, Q.; Liu, Z. Experimental study of the mechanical properties of intact and tectonic coal via compression of a single particle. Powder Technol. 2018, 325, 412–419. [Google Scholar] [CrossRef]
- Jiangyu, W.; Meimei, F.; Bangyong, Y.; Guansheng, H. The length of pre-existing fissures effects on the mechanical properties of cracked red sandstone and strength design in engineering. Ultrasonics 2018, 82, 188–199. [Google Scholar]
- Broch, E.; Franklin, J.A. The point—Load strength test. Int. J. Rock Mech. Min. Sci. 1972, 9, 669–697. [Google Scholar] [CrossRef]
- Weibull, W. A statistical distribution function of wide applicability. J. Appl. Mech. 1951, 18, 293–297. [Google Scholar]
- Doremus, R.H. Fracture statistics: A comparison of the normal, Weibull and Type I extreme value distribution. J. Appl. Phys. 1983, 54, 193–198. [Google Scholar] [CrossRef]
- Clark, J.H. The role of rock fabric in controlling crushing strength. Numerical experiments. In Proceedings of the XVIII IMPC, Sydney, Australia, 23–28 May 1993; Volume 1, pp. 187–192. [Google Scholar]
- Cotrell, A.H. The Mechanical Properties of Matte; John Wiley and Sons: New York, NY, USA, 1964. [Google Scholar]
- Brożek, M.; Tumidajski, T. Granulometric characteristics of the product of crushing by compression of single particles. Arch. Min. Sci. 1996, 41, 245–258. [Google Scholar]
- Jayatilaka, A.S.; Trustum, K. Statistical approach to brittle fracture. J. Mater. Sci. 1977, 12, 1426–1430. [Google Scholar] [CrossRef]
- Brożek, M. Immediate tensile strength of irregular mineral particles. Arch. Min. Sci. 1996, 41, 341–360. [Google Scholar]
- Brożek, M.; Oruba-Brożek, E. The effect of structure of mineral particles on their strength properties exemplified by limestone and porphyry. Miner. Resour. Manag. 2003, 19, 91–109. (In Polish) [Google Scholar]
- Gilvarry, J.J. Fracture of Brittle Solids. I. Distribution Function for Fragment Size in Single Fracture (Theoretical). J. Appl. Phys. 1961, 32, 391–399. [Google Scholar] [CrossRef]
Figure 1.
The lithological types of copper ore within the particle size fraction.
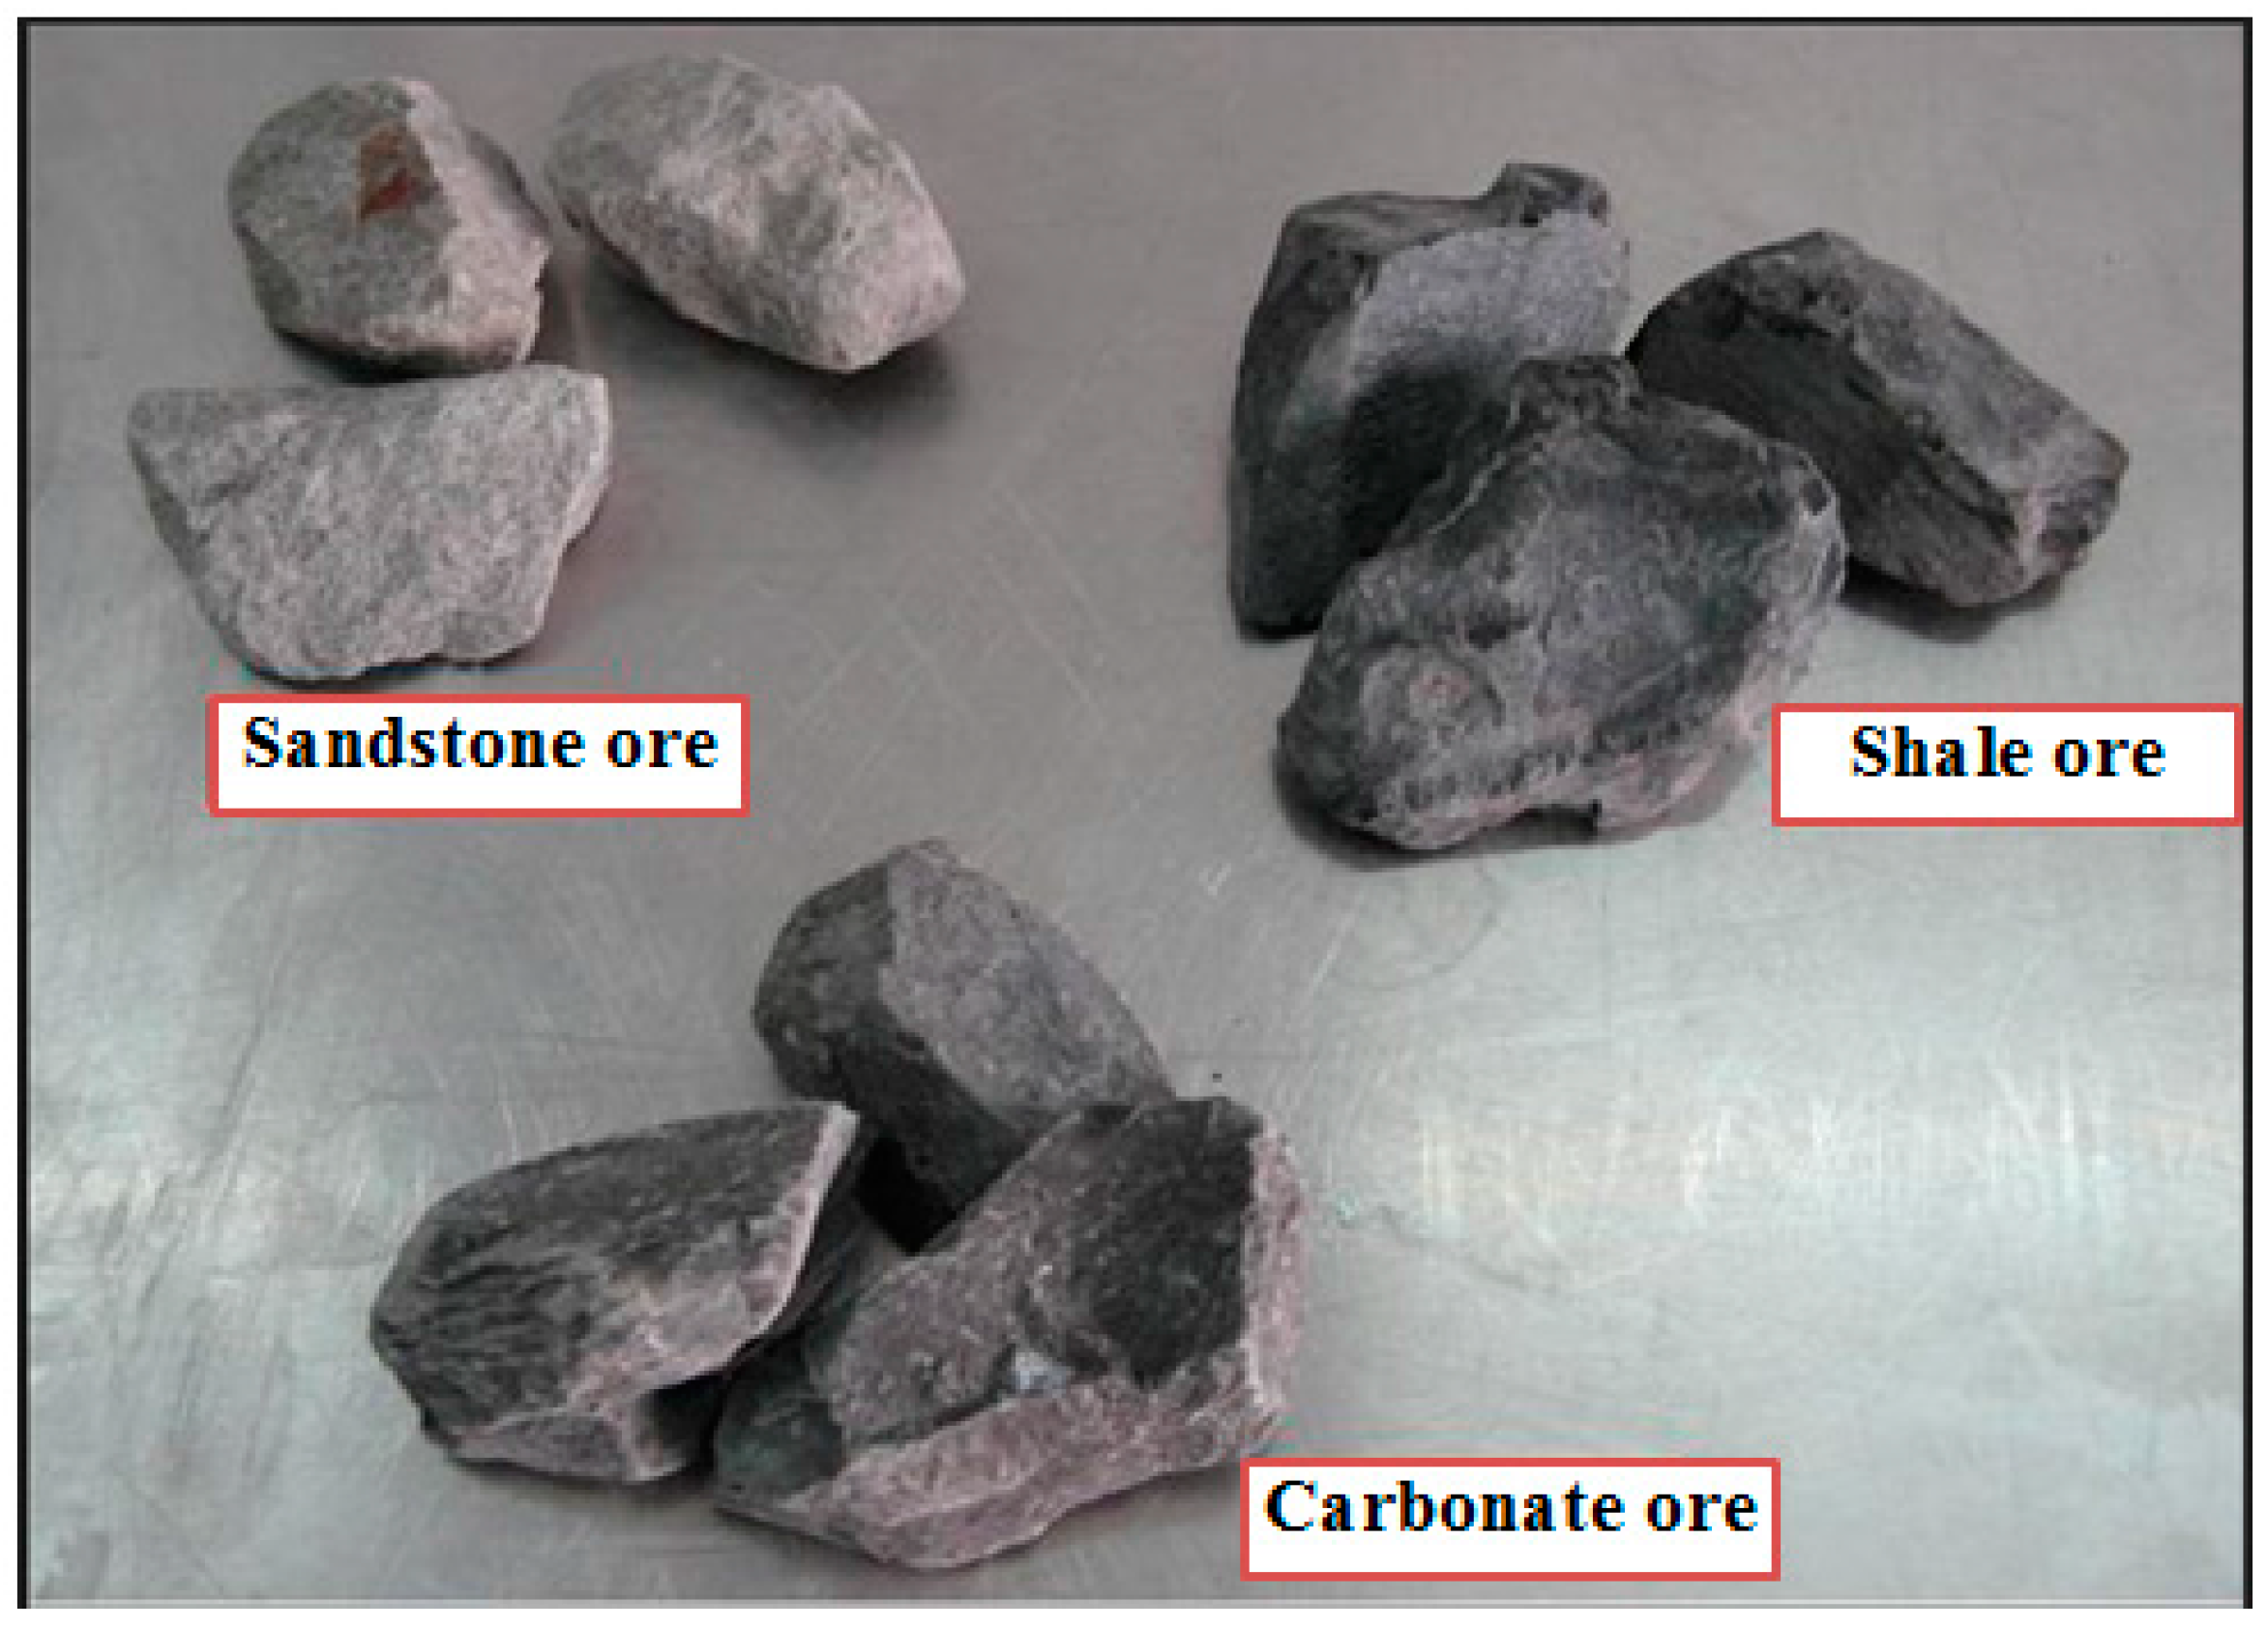
Figure 2.
Single axial compression of individual particle between two plates in the hydraulic piston-die press, (manufactured by Tony Technik; Institute of Ceramics and Building Materials, Glass and Building Materials Division in Cracow, Poland).
Figure 2.
Single axial compression of individual particle between two plates in the hydraulic piston-die press, (manufactured by Tony Technik; Institute of Ceramics and Building Materials, Glass and Building Materials Division in Cracow, Poland).
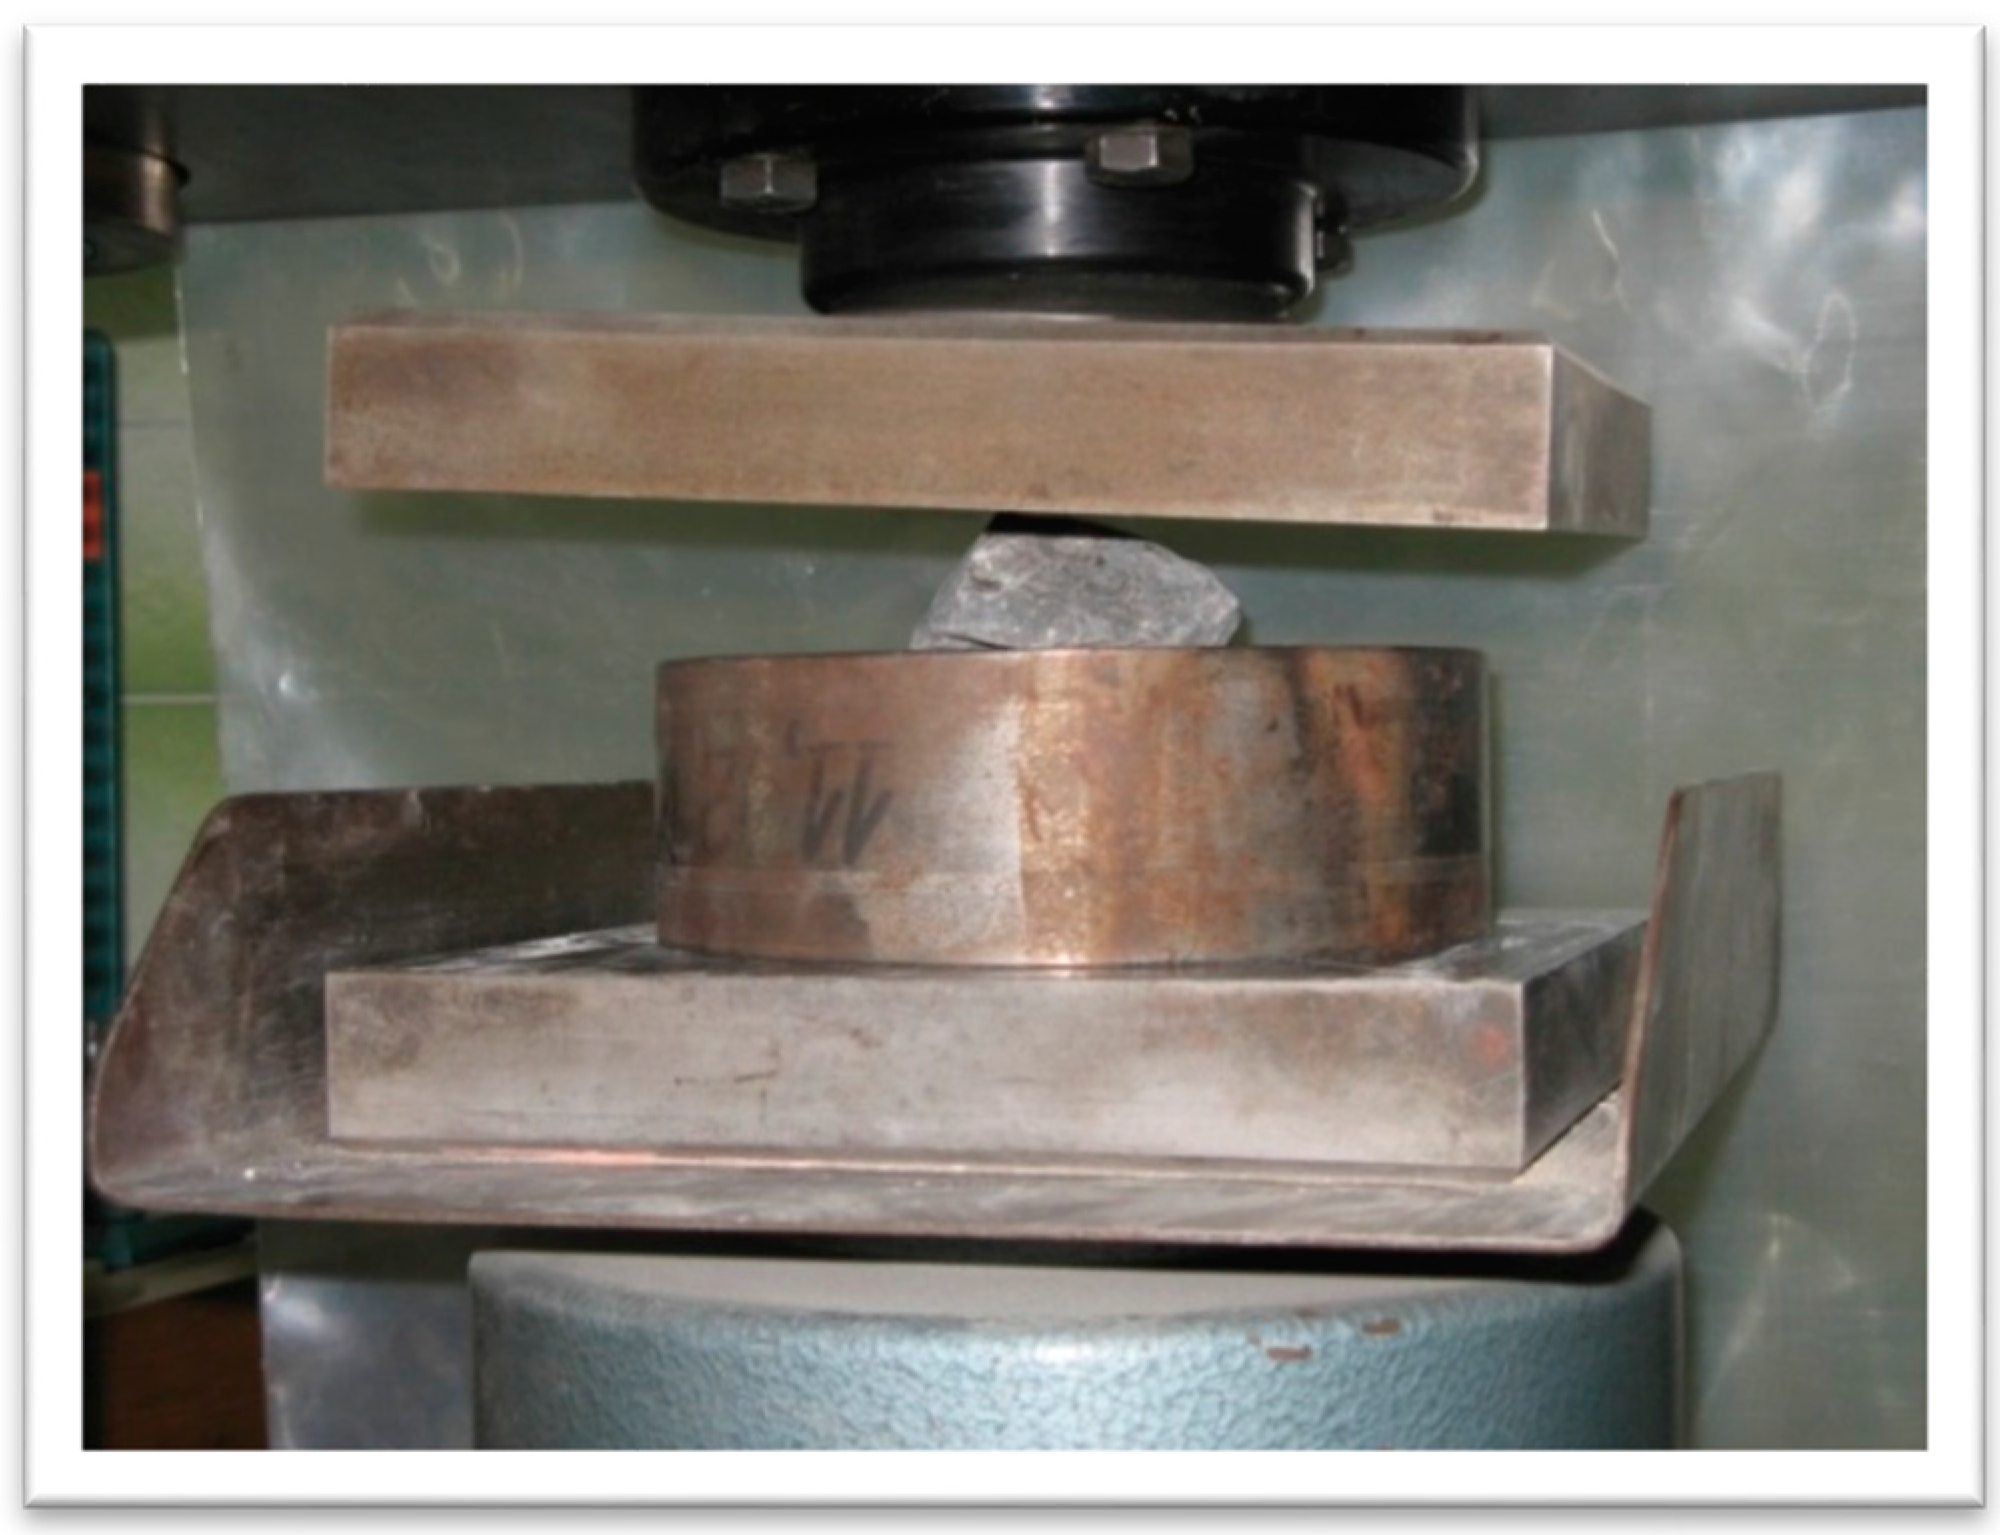
Figure 3.
Typical force-displacement curve.
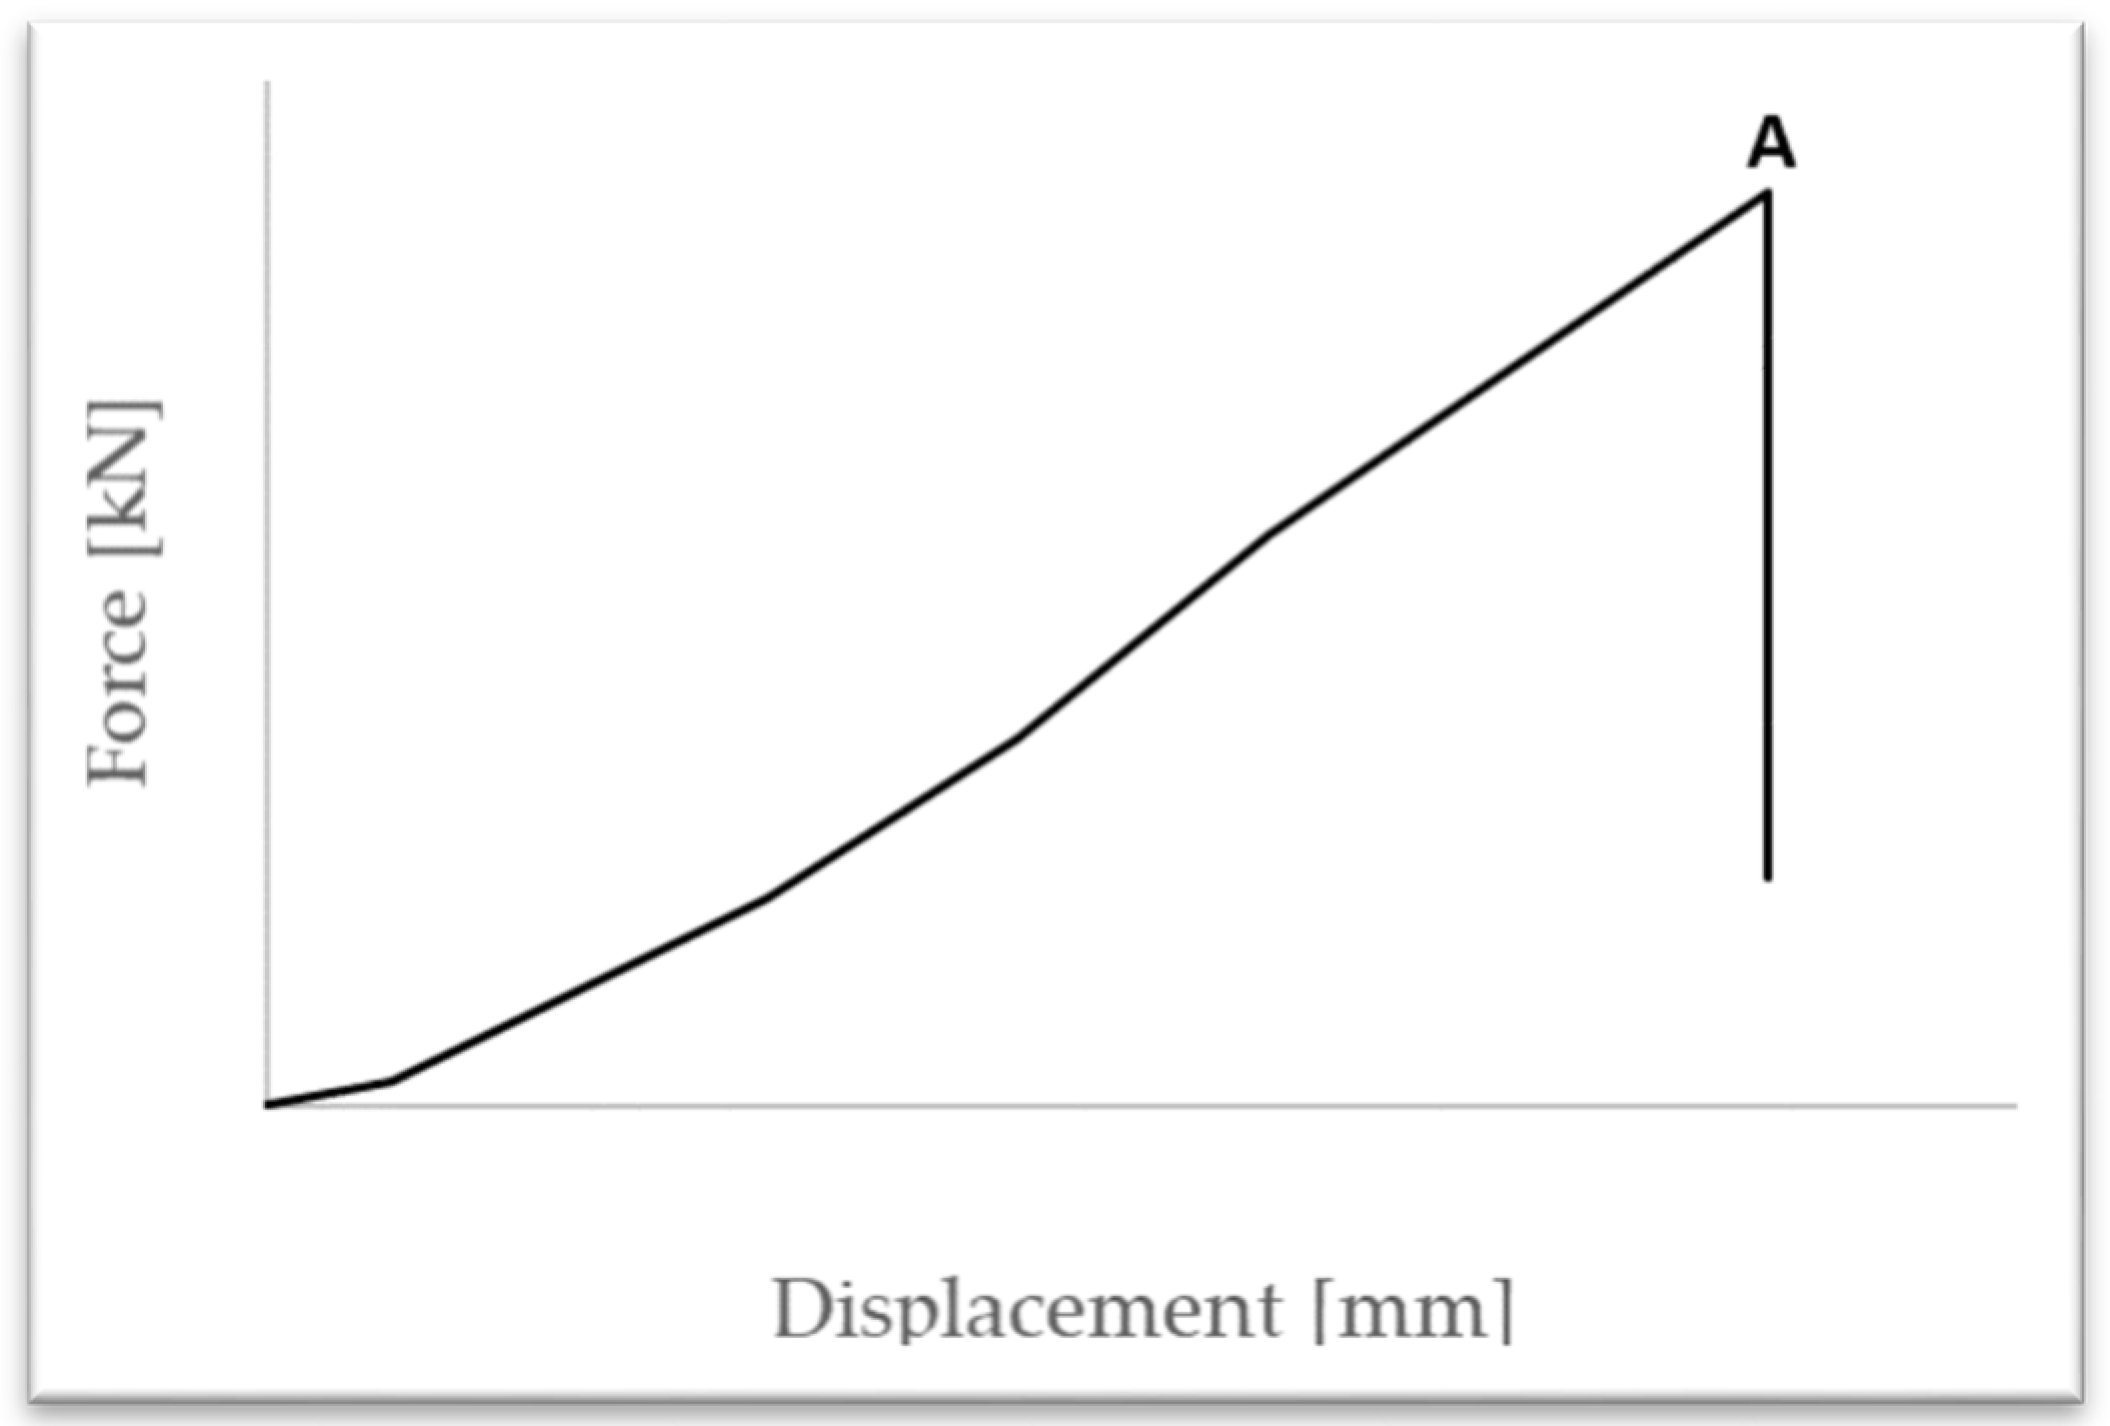
Figure 4.
Particle sample after single–particle breakage tests by slow compression: (a) sandstone; (b) shale; and (c) carbonate.
Figure 4.
Particle sample after single–particle breakage tests by slow compression: (a) sandstone; (b) shale; and (c) carbonate.
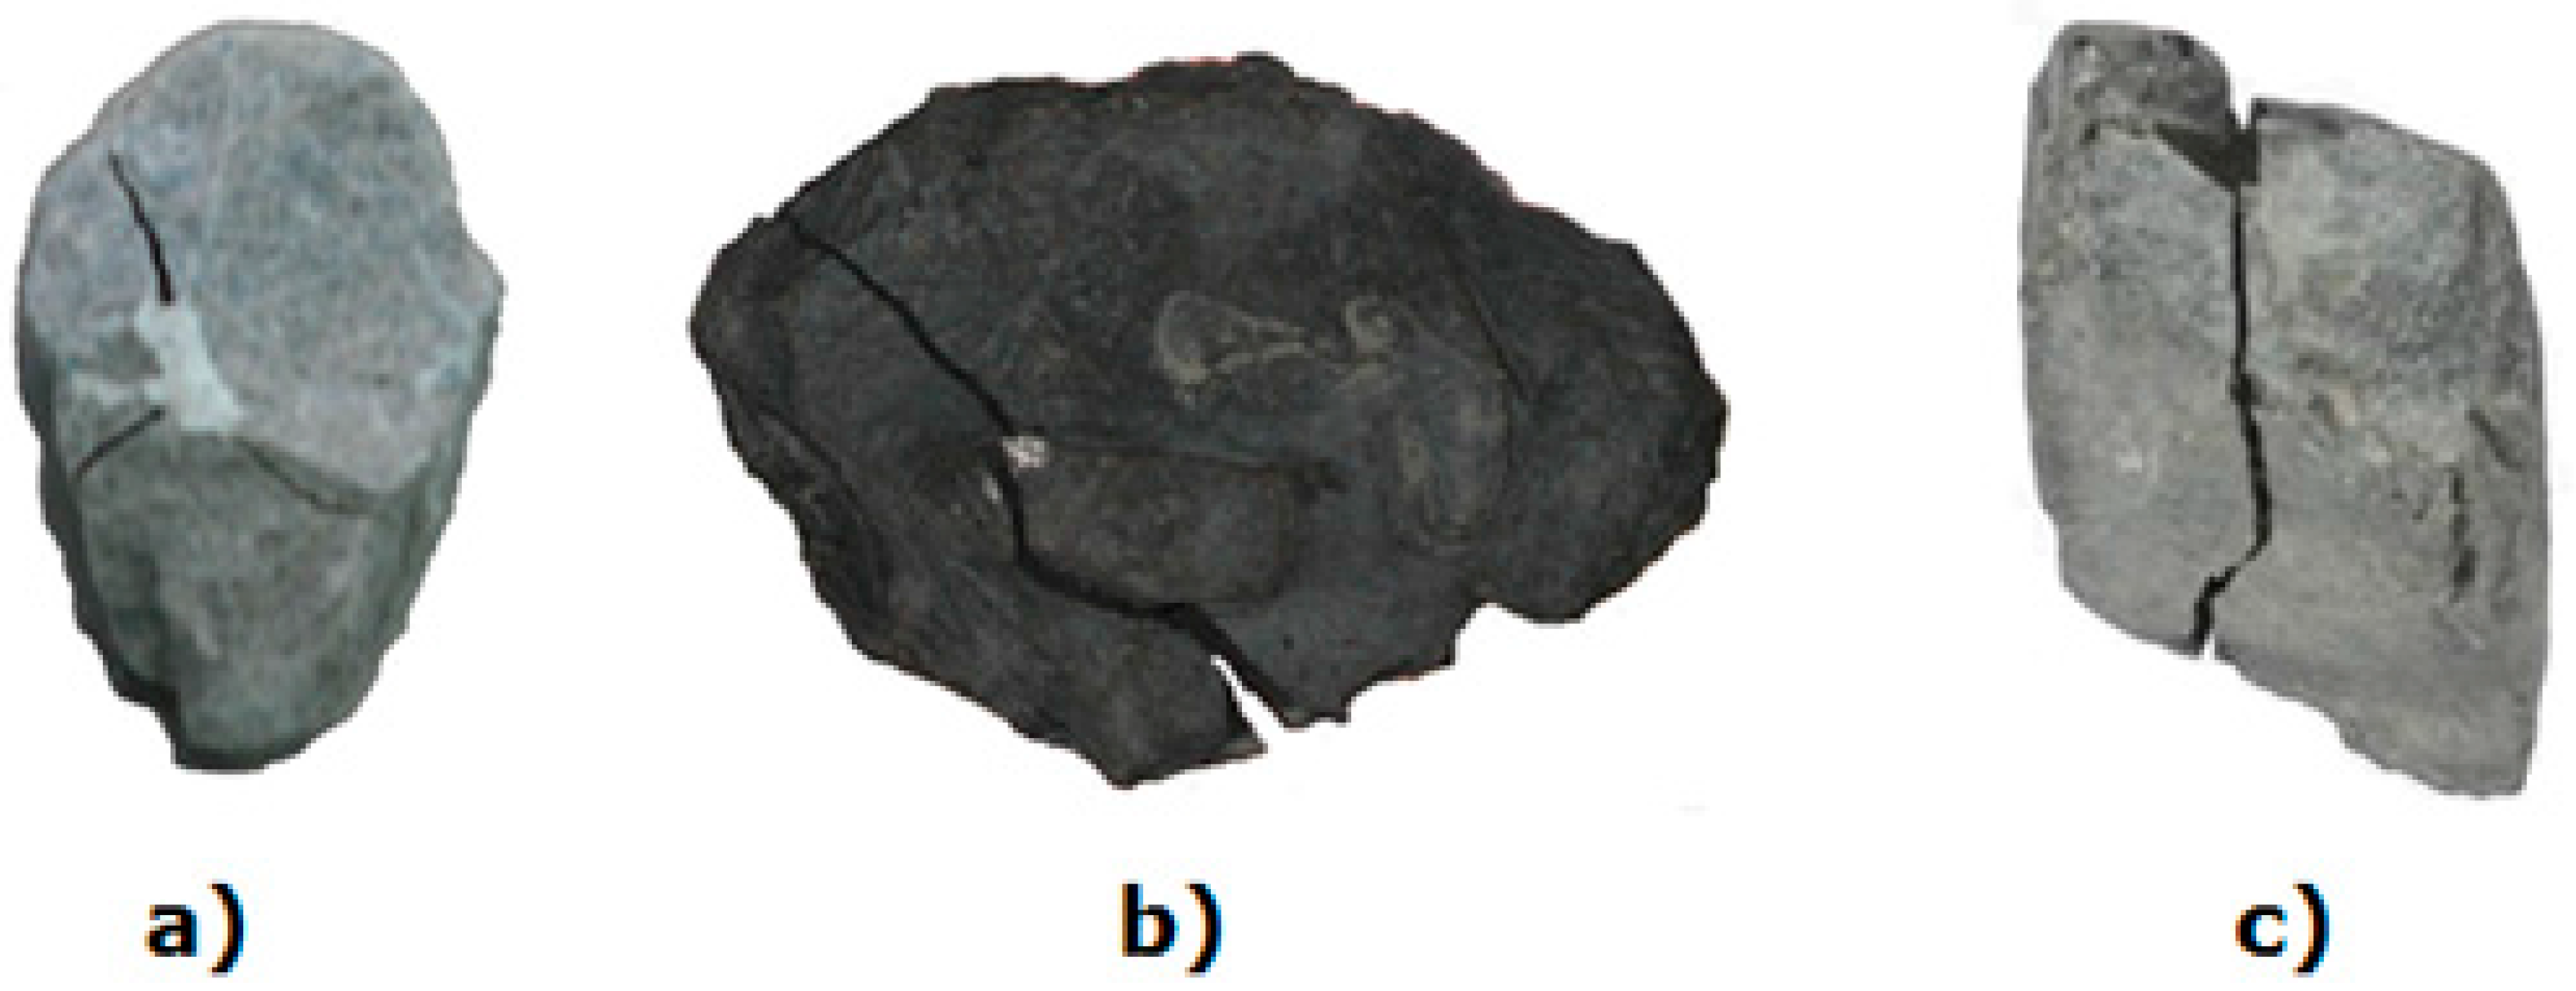
Figure 5.
The cumulative distribution function of tensile strength of carbonate particles.

Figure 6.
The cumulative distribution function of tensile strength of shale particles.
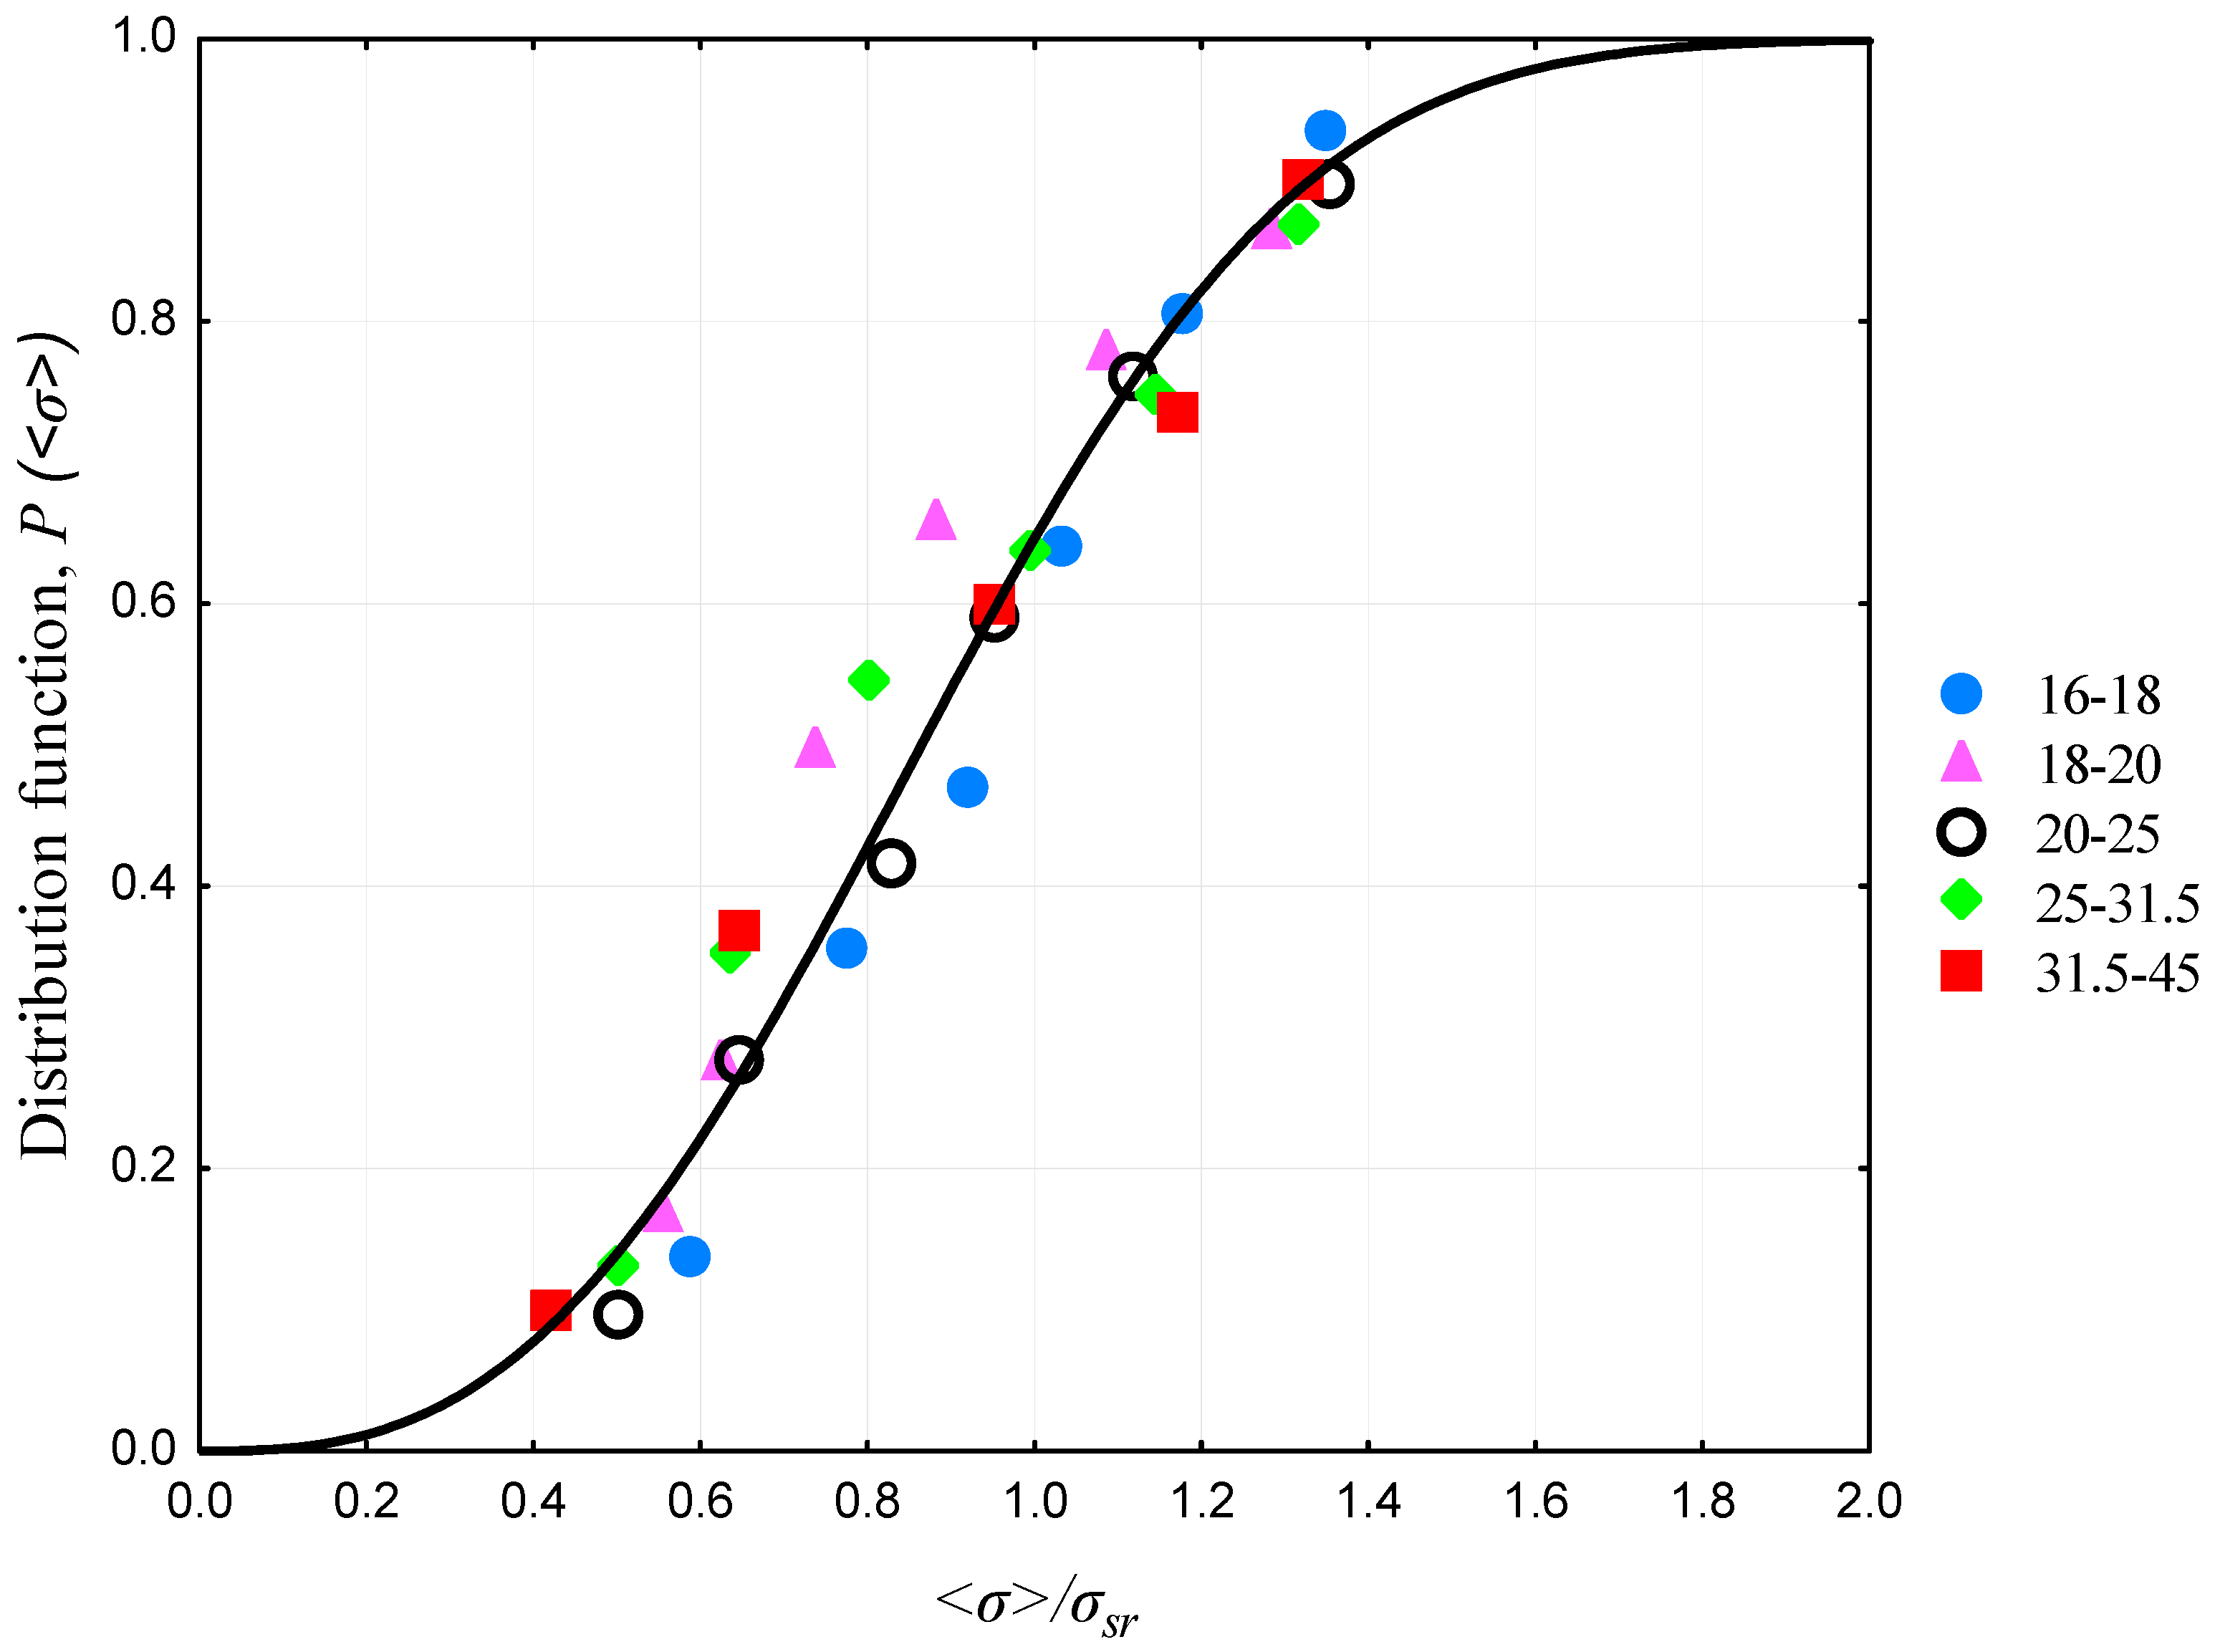
Figure 7.
The cumulative distribution function of tensile strength of sandstone particles.
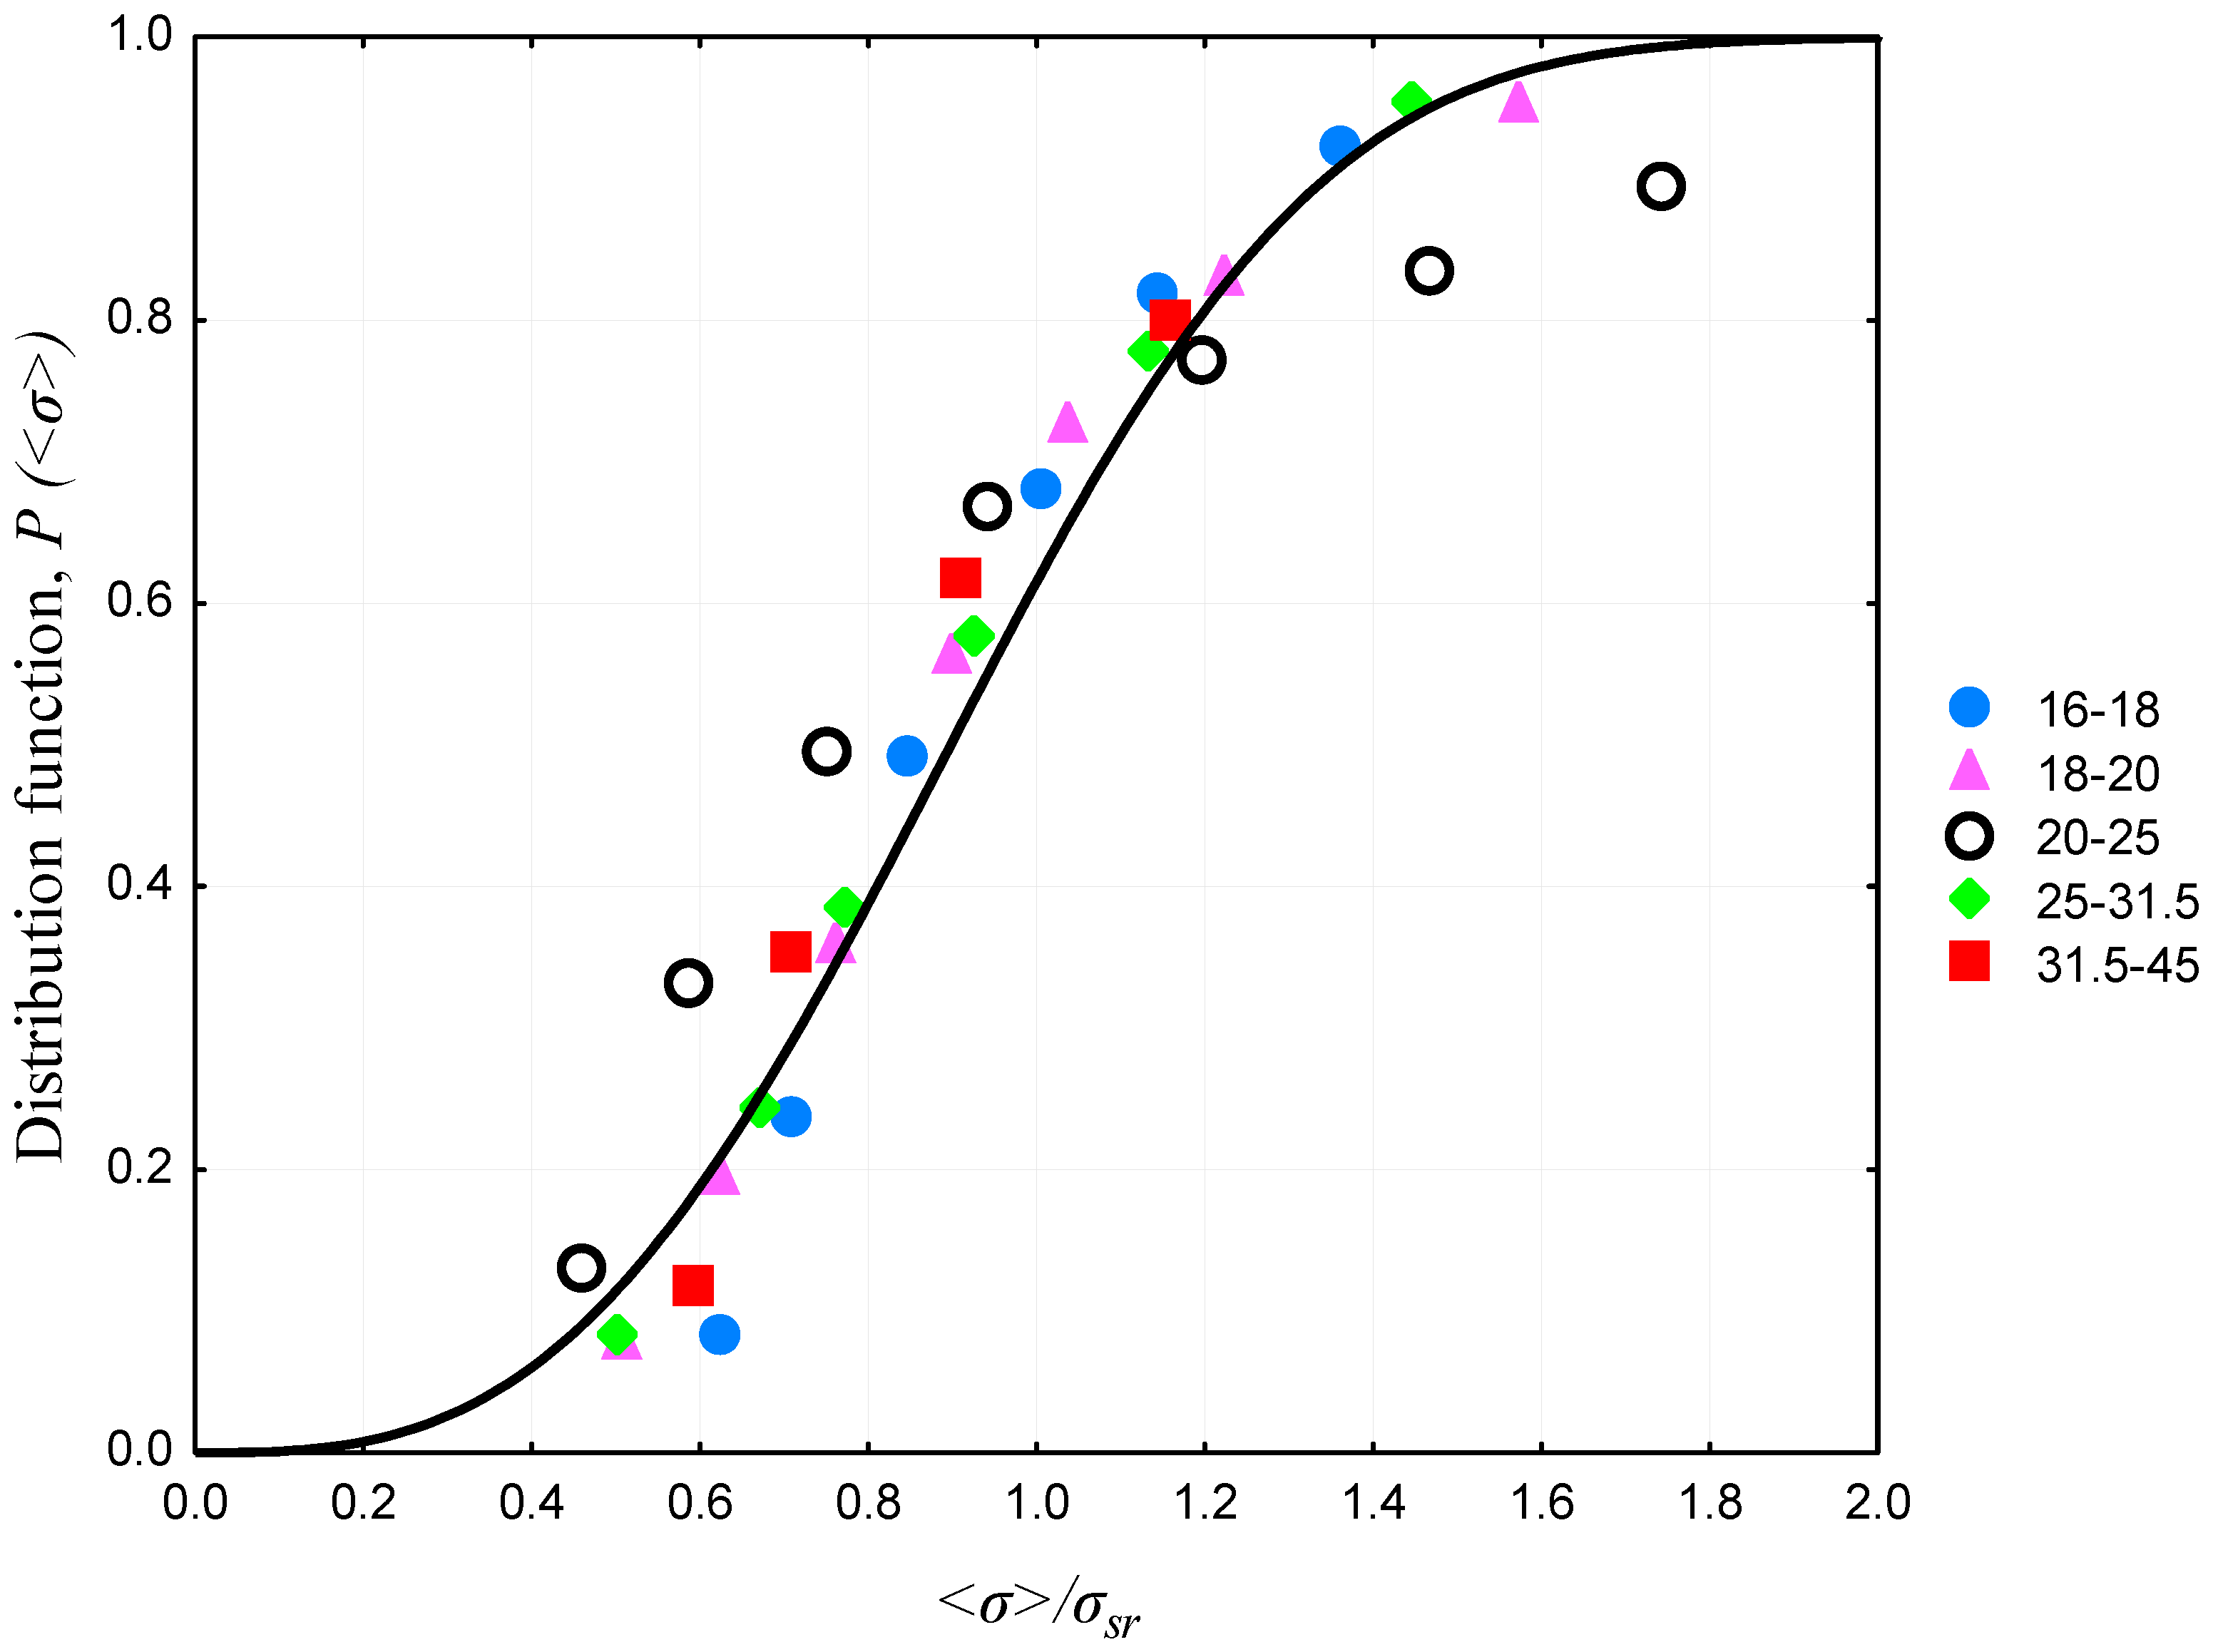
Figure 8.
The cumulative distribution function of tensile strength of three lithological types of copper ore.
Figure 8.
The cumulative distribution function of tensile strength of three lithological types of copper ore.

Figure 9.
Relationship between average tensile strength of single particles of carbonate, shale, and sandstone particles, and their particle size.
Figure 9.
Relationship between average tensile strength of single particles of carbonate, shale, and sandstone particles, and their particle size.

Table 1.
The average petrographic composition of ore (% by weight).
| Minerals | Ore | |||||
|---|---|---|---|---|---|---|
| Sandstone (%) | Shale (%) | Carbonate (%) | ||||
| Data Taken from [1] | Authors Reseach | Data Taken from [1] | Authors Research | Data Taken from [1] | Authors Research | |
| Clay minerals | 15.0 | 5.0 | 39.0 | 23.8 | 16.5 | 6.0 |
| Carbonates (dolomite, calcite) | 8.0 | 11.0 | 42.0 | 54.0 | 72.0 | 71.2 |
| Sulfates (gypsum, anhydrite) | 2.0 | trace | trace | 0.5 | 5.0 | 4.9 |
| Organic substance | Trace | 0.7 | 6.0 | 8.1 | 0.5 | 10.2 |
| Copper sulphides | 3.0 | 0.9 | 8.0 | 2.8 | 3.0 | 1.7 |
| Other mainly quartz | 72.0 | 82.4 | 5.0 | 10.8 | 3.0 | 6.0 |
| Total | 100.0 | 100.0 | 100.0 | 100.0 | 100.0 | 100.0 |
Table 2.
The strength parameters of the types under investigation.
| Type of Rock | Compressive Strength, Rc (1) [MPa] | Tensile Strength, Rr (2) [MPa] | Young’s Modulus, Yc [GPa] | Poisson’s Ratio, ν [-] |
|---|---|---|---|---|
| Carbonate | 101.2 | 5.7 | 46.7 | 0.23 |
| Shale | 60.2 | 5.6 | 29.6 | 0.22 |
| Sandstone | 35.3 | 1.8 | 8.4 | 0.15 |
(1) Rc = F/S, F—crushing force [F], S—surface of the sample [mm2]. (2) Rr = Fmax/S, Fmax—maximum force that does not cause the destruction of sample.
Table 3.
Bond Work Index values for lithological types of Polish copper ore.
| Type of Lithological Copper Ore | IMMB | AGH | Authors’ Research |
|---|---|---|---|
| Bond Work Index, Wi [kWh/Mg] | |||
| Sandstone | 16.9 | 16.9 | 19.2 |
| Carbonate | 10.7 | 9.5 | 9.4 |
| Shale | 15.9 | 14.8 | 16.8 |
Table 4.
The results of calculation for the crushed carbonate sample within particle size fraction 31.5–45 mm.
Table 4.
The results of calculation for the crushed carbonate sample within particle size fraction 31.5–45 mm.
| F [kN] | 4.4–6 | 6–7.5 | 7.5–9 | 9–10.5 | 10.5–12 | 12–13 | 13–15 | 15–17 | 17–28.1 |
|---|---|---|---|---|---|---|---|---|---|
| Sieve Size [mm] | Mass of Samples, mi, [g] | ||||||||
| 45 | 190.30 | 218.80 | 455.30 | 249.10 | 284.70 | 339.70 | 57.00 | 135.60 | 164.50 |
| 31.5 | 151.90 | 391.60 | 217.10 | 141.90 | 101.10 | 169.90 | 160.10 | 161.00 | 207.80 |
| 25 | 27.60 | 122.00 | 141.70 | 139.80 | 132.80 | 206.30 | 64.80 | 97.40 | 38.70 |
| 20 | 54.20 | 31.70 | 96.30 | 86.60 | 62.10 | 62.70 | 27.90 | 17.60 | 34.30 |
| 18 | 7.20 | 12.20 | 29.60 | 28.80 | 44.00 | 21.80 | 16.30 | 15.10 | - |
| 16 | 3.90 | 7.80 | 32.30 | 6.50 | 9.00 | 5.80 | 15.70 | 20.00 | 1.90 |
| 14 | 3.20 | 16.30 | 19.60 | 4.50 | - | - | - | 5.90 | 5.20 |
| 12.5 | 1.60 | 3.50 | 21.60 | 4.10 | 9.90 | 8.70 | 11.20 | 10.40 | 7.50 |
| 10 | 1.60 | 7.80 | 5.90 | 4.20 | 4.30 | 3.50 | 2.40 | 5.10 | 2.00 |
| 8 | 0.30 | 1.00 | 5.00 | 3.10 | 2.90 | 4.30 | 0.60 | 5.30 | 2.40 |
| 6.3 | 1.30 | 5.30 | 8.70 | 4.30 | 6.40 | 3.70 | 3.70 | 6.30 | 3.40 |
| 5 | 0.60 | 1.90 | 3.90 | 4.10 | 4.00 | 3.60 | 3.10 | 3.70 | 2.50 |
| 4 | - | 1.70 | 5.00 | 2.30 | 2.20 | 1.70 | 2.10 | 3.00 | 1.00 |
| 3.15 | 0.30 | 2.70 | 4.90 | 3.20 | 3.60 | 2.60 | 2.20 | 2.80 | 1.60 |
| 2 | 0.30 | 2.30 | 5.00 | 4.00 | 3.60 | 2.80 | 2.00 | 2.90 | 2.10 |
| 1 | 0.70 | 3.20 | 5.30 | 4.80 | 3.60 | 3.70 | 2.40 | 3.30 | 2.40 |
| [g] | 445.00 | 829.80 | 1057.20 | 691.30 | 674.20 | 840.80 | 371.50 | 495.40 | 477.30 |
| pi | 0.0756 | 0.1411 | 0.1797 | 0.1175 | 0.1146 | 0.1429 | 0.0632 | 0.0842 | 0.0811 |
| <σi>/σsr | 0.46 | 0.59 | 0.72 | 0.86 | 0.99 | 1.12 | 1.27 | 1.52 | 2.06 |
© 2018 by the authors. Licensee MDPI, Basel, Switzerland. This article is an open access article distributed under the terms and conditions of the Creative Commons Attribution (CC BY) license (http://creativecommons.org/licenses/by/4.0/).
Share and Cite
MDPI and ACS Style
Nad, A.; Saramak, D. Comparative Analysis of the Strength Distribution for Irregular Particles of Carbonates, Shale, and Sandstone Ore. Minerals 2018, 8, 37. https://doi.org/10.3390/min8020037
AMA Style
Nad A, Saramak D. Comparative Analysis of the Strength Distribution for Irregular Particles of Carbonates, Shale, and Sandstone Ore. Minerals. 2018; 8(2):37. https://doi.org/10.3390/min8020037
Chicago/Turabian StyleNad, Alona, and Daniel Saramak. 2018. "Comparative Analysis of the Strength Distribution for Irregular Particles of Carbonates, Shale, and Sandstone Ore" Minerals 8, no. 2: 37. https://doi.org/10.3390/min8020037
Note that from the first issue of 2016, this journal uses article numbers instead of page numbers. See further details here.