The Effect of Seaweed Glue in the Separation of Copper–Molybdenum Sulphide Ore by Flotation

1
School of Minerals Processing and Bio-Engineering, Central South University, Changsha 410083, China
2
School of Chemical Engineering and Energy, Zhengzhou University, Zhengzhou 450001, China
3
Zhaojin Mining Industry Company Limited, Yantai 264000, China
*
Authors to whom correspondence should be addressed.
Minerals 2018, 8(2), 41; https://doi.org/10.3390/min8020041
Submission received: 12 December 2017
/
Revised: 20 January 2018
/
Accepted: 22 January 2018
/
Published: 25 January 2018
Abstract
:Flotation separation of chalcopyrite from molybdenite was studied using seaweed glue (SEG) as a depressant. Flotation process and mechanism were examined by response surface methodology, flotation tests, adsorption tests, zeta potential measurements and fourier transform infrared (FT-IR) spectra. Response surface methodology with a Box–Behnken design suggested the optimal reagent schedule: pH 4, depressant seaweed glue 197 mg/L, collector amyl xanthate 16 mg/L and frother (methyl isobutyl carbinol) 20 mg/L, and selective separation of chalcopyrite and molybdenite was achieved by flotation. Comparison of SEG and traditional depressants indicated that the SEG could achieve a similar separation efficiency, and exhibited the advantages of environmental compatibility and economic adaptability. Co-adsorption of seaweed glue and amyl xanthate occurred on the surface of molybdenite, and is explained to happen through distinct mechanisms due to the heterogeneous nature of the surface. It is likely that seaweed glue depresses molybdenite by covering the dixanthogen resulting from adsorption of xanthate ions. It is shown that seaweed glue is as effective a depressant of Cu/Mo separation as cyanide.
1. Introduction
In the case of copper–molybdenum separation, chalcopyrite (CuFeS2) and molybdenite (MoS2) are the main copper and molybdenum minerals found in complex sulfide ores. The natural hydrophobicity of molybdenite results from its layered crystal structure. In the case of chalcopyrite, once the mineral is rendered hydrophobic by a xanthate collector, its depression can be effectively achieved by rather drastic chemical treatments [1]. The separation of both hydrophobic chalcopyrite and molybdenite represents a major problem in the treatment of copper–molybdenum sulfide ore. Both of them easily lead to flotation concentrates, thus reducing concentrate grade and causing downstream processing problems as well as increased smelting costs [2]. The separation of chalcopyrite and molybdenite has therefore been the focus of a great deal of research.
The selective separation of sulfide minerals by froth flotation frequently relies on the use of various appropriate depressants that affect the floatability of individual ore components. At present, inorganic depressants are routinely used as the selective depressants. For example, sodium hydro-sulfide (NaHS), Noke’s reagent (thiophosphorus or thioarsenic compounds), or even cyanides, are widely used to depress the copper sulfide minerals while molybdenum sulfides are floated [3,4,5,6,7]. However, many problems in the application are inevitable, such as the high dosage and toxicity to the environment. It is necessary to replace these highly toxic reagents with more environmentally friendly chemicals. Therefore, the separation of copper–molybdenum is still a big problem [8,9].
Historically, the choice of depressants in flotation has always been based on empirical testing. The trend in recent years has been to focus on special polymers for this purpose [10,11,12]. The key point is the selection of the distinctive functional group and molecular weight to ensure that the polymer acts appropriately by imparting the correct surface properties on the particular gangue mineral (e.g., inclusion of hydroxyl groups in the polymer to impart hydrophilicity) [13]. Motivated by such requirements, seaweed glue—a non-toxic natural polymer—was tested in this study as a potential depressant in the differential flotation separation of Cu–Mo sulfides.
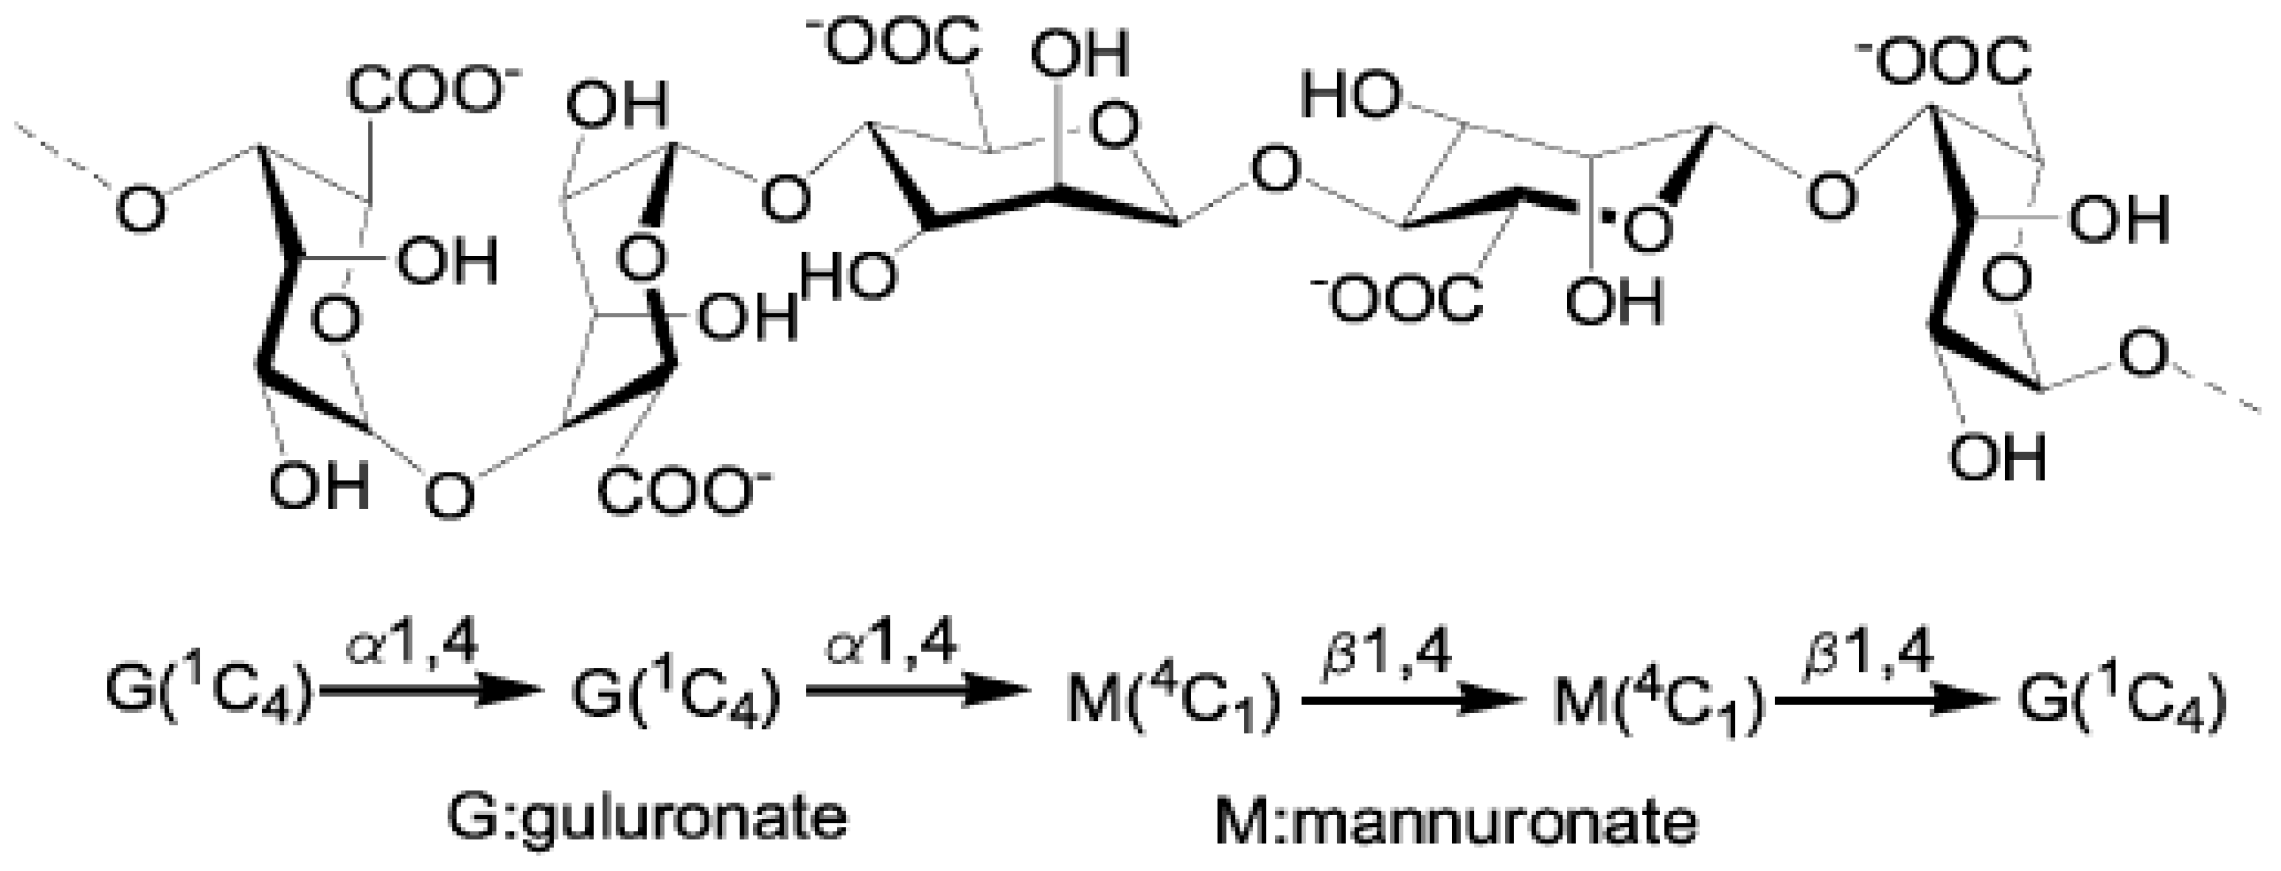
Sodium alginate (SAG) is one of the special polymers mentioned above, and SAG mainly includes: red algae, green algae, seaweed glue, brown algae, etc. [14]. Seaweed glue (SEG) is a kind of polysaccharide carbohydrate extracted from kelp or sargassum, appearing as white or light-yellow powder. It is easy to dissolve in water and is non-toxic. SEG, also known as kelp glue, is a kind of alginate derivative with linear polymers composed of β-d-mannuronic acid and α-l-guluronic acid [15,16,17,18]. The SEG can agglomerate into clumps associated with a few metal ions and ultimately precipitate in water [19]. The structural formula of seaweed glue is shown in Figure 1. The application of SEG as a flotation depressant—both in the laboratory and in commercial processes—has not been reported up to now.
The aim of this study was to test SEG as an alternative non-toxic depressant for the separation of chalcopyrite from molybdenite. The effects of variables including initial pH, depressant dosage, and collector dosage on the separation efficiency were evaluated by response surface methodology with a Box–Behnken design. The depression mechanism of SEG on both chalcopyrite and molybdenite was investigated by adsorption tests and zeta potential measurements as well as Fourier transform infrared (FT-IR) spectra.
2. Materials and Methods
2.1. Materials
Pure chalcopyrite and molybdenite samples were all obtained from Anhui Mining Corporation, China. XRD results of the pure minerals are shown in Figure 2. According to chemical analysis and XRD results, the purity of chalcopyrite was 94.6% and the purity of molybdenite was 99.5%. Hand-selected crystals of these minerals were crushed to −1 mm by a laboratory roll crusher. The crushed products were then ground in a ceramic ball mill and dry-sieved to obtain the −75 + 38 μm-size fractions for micro-flotation tests (0.37 kW operating power and per 2 min as grinding frequency). A size fraction of −38 μm particles was further ground to −2 μm for adsorption and zeta potential measurements as well as FT-IR studies. Pure mineral samples were stored in a vacuum-desiccator after preparation and washed in an ultrasonic bath for 5 min to remove potential oxidation film before each use. Atmospheric oxidation of chalcopyrite (ageing) produces compounds such as iron–oxyhydroxides and basic iron–sulphates on the chalcopyrite surface [21,22]. The oxidation of molybdenite mainly occurred in the defect point of the cleavage surface, and produced compounds like MoO3 [23].
The anionic depressant seaweed glue (SEG, MW 32,000–200,000, the viscosity of solutions of 1% SEG (by weight) was 1000–1500 mPa·s) was supplied independently by the IMUMR Flotation Reagents Limited Company, Shandong, China. SEG solutions were prepared by dispersing a known weight of SEG (the molecular formula of the SEG is (C6H5O6)m·(C12H10O9)n, >92% purity) in distilled water. The solution was made up to the required volume by adding distilled water and left to equilibrate overnight. Fresh solutions were prepared every three days. Other flotation reagents were amyl xanthate as collector and frother methyl isobutyl carbinol (MIBC), respectively. In addition, the preparation of depressant disodium carboxymethyl-trithiocarbonate (DCMT) was carried out according to the literature [5]. P-Nokes reagents (PNs) were prepared by mixing phosphorus pentasulphide with sodium hydroxide in a mass ratio of 1:1.3 [7,24]. All of the chemicals used for the preparation of depressants were purchased from the local supplier (Guoyao, Changsha, China) without further purification. Hydrochloric acid (HCl) and sodium hydroxide (NaOH) were used to regulate the pulp pH. All of the reagents used in the tests were of analytical grade. Deionized water was used in all tests.
2.2. Response Surface Methodology
In this experiment, a three-factor, three-level factorial Box–Behnken design (BBD) was used to model and optimize the mineral separation efficiency. The initial pH (X1), dosage of depressant (X2, mg/L), and dosage of collector (X3, mg/L) were chosen as the three independent variables. The three independent variables in actual values and corresponding coded values (assign value by the software of Box–Behnken design) are listed in Table 1. All of the results received according to BBD experimental runs were analyzed by means of the least-squares regression method for predicting the process response and estimating the coefficients on the basis of the following second-order Equation (1). The equation was used to describe the mathematical relationship between the predicted response (Y) and input variables (X1, X2, and X3) in coded values:
where Y refers to the predicted response of separation efficiency associated with each factor level combination by the model; β0 is the model constant (intercept term); and βi, βii, and βij are the linear, quadratic, and interaction coefficients, respectively. Based on the early exploration experiments, the optimum range of each independent variable was determined: pH (3–6), SEG 50–300 mg/L, amyl xanthate (AX) 10–100 mg/L. In order to better explore the relationship between inhibitors and minerals under strong alkaline conditions, the experimental pH values of 3–12 were used in this research.
Y = β0 + ΣβiXi + ΣβiiXi2 + ΣβijXij
The experimental data was analyzed via Design Expert Software version 8.0.6 (STAT-EASE Inc., Minneapolis, MN, USA) for the analysis of variance (ANOVA) and to assess the goodness of fit of the model.
2.3. Flotation Procedure
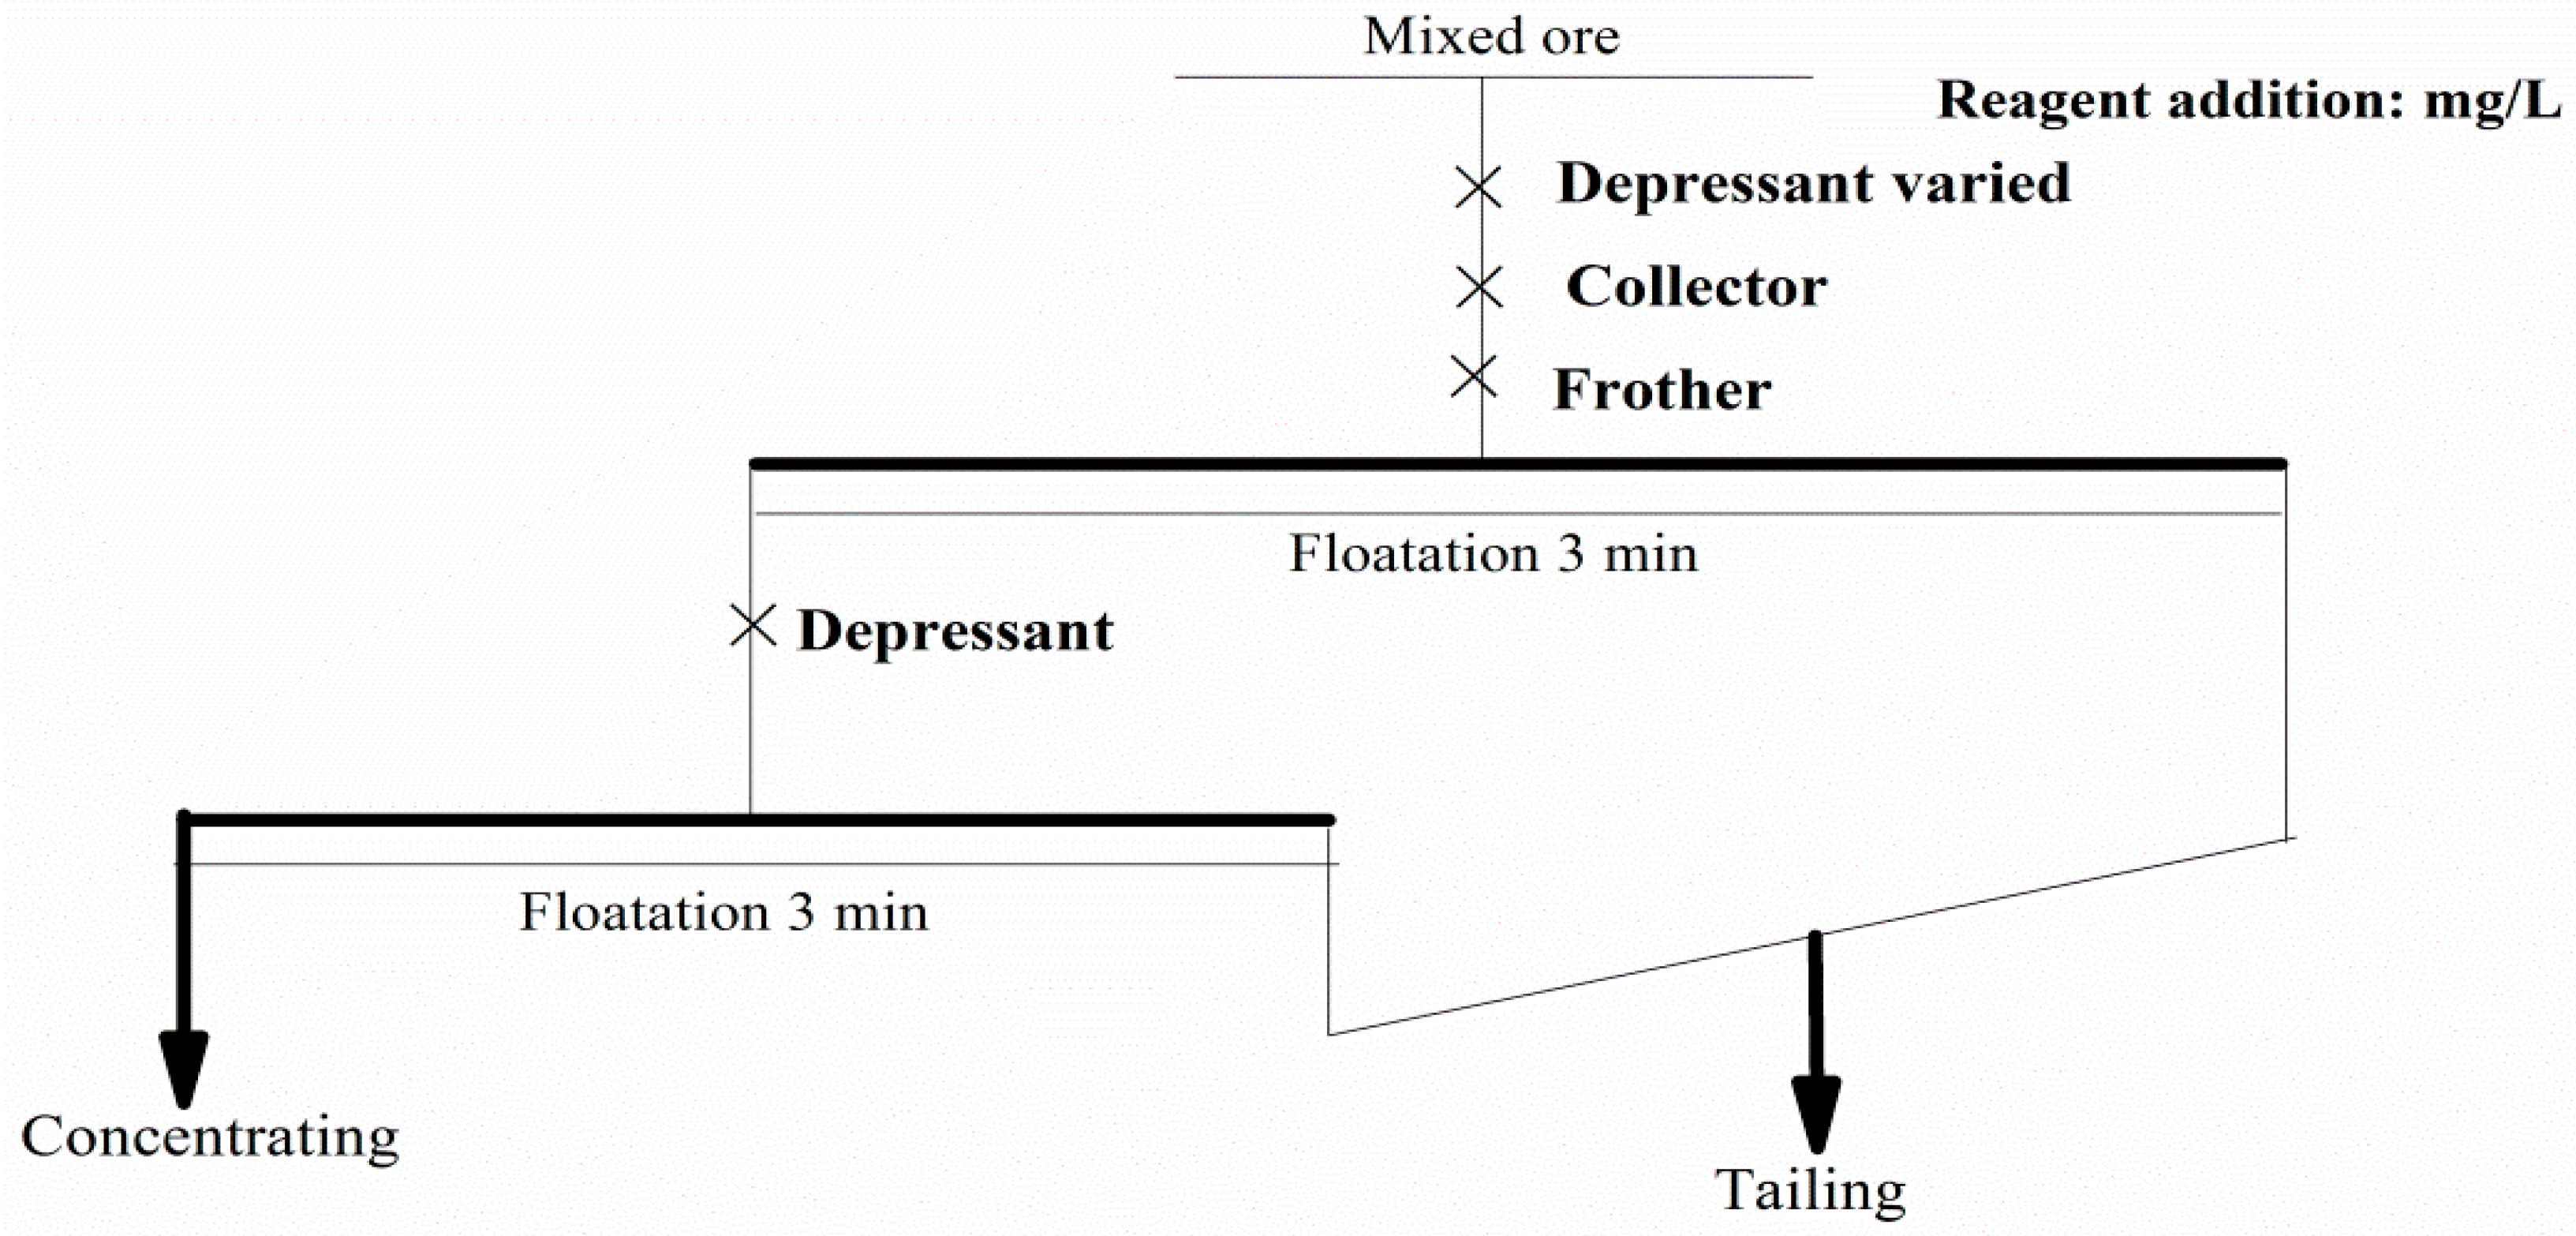
The following conditioning procedure was used for all flotation tests. The flotation tests were carried out in a XFG-1600-type flotation machine (Xinghai, Shandong, China). Pure mineral particles (3 g) were placed in a Plexiglas cell (40 mL), which was then filled with distilled water. The slurry pH was modified to the desired value by adding either HCl or NaOH solutions. Pulp pH was measured using a pH meter (PHS-3C). The reagents (SEG, AX, and MIBC) were added in sequence and conditioned for 2 min each. The operating conditions were set to 8 mm froth depth, 1900 rpm impeller speed, and 30 times per minute scraping frequency. The flotation was conducted for 5 min. The products were collected, dried, and weighed. For single mineral flotation, the flotation recovery was calculated based on the dry weight of the products obtained. For mixed minerals (the ratio of Cu and Mo was 3:1) flotation, the flotation recovery was calculated based on Cu and Mo grade between the concentrates and tailings. The flow sheet and conditions of flotation tests are demonstrated in Figure 3. Both the concentrate and tailing were filtered, dried, and weighed. Concentrate (Cu) and tailing (Mo) were analyzed.
2.4. Adsorption Experiments
In the adsorption experiments, two grams of pure mineral particles were added to 40 mL distilled water in 100 mL beakers and SEG was added to the desired concentration (196 mg/L) at pH equal to 4. The suspension was stirred for 3 min and subsequently filtered. The filtrate was centrifuged under the conditions of 25 °C and 9000 rpm centrifugal speeds for 20 min. After the centrifugation was completed, 15 mL of supernatant was transferred to a clean centrifuge tube for Total Organic Carbon (TOC) test. The same procedure was used to determine the original TOC of SEG/AX without reacting with any minerals. The TOC (T1) of SEG remaining in the supernatant was measured using the TOC-L machine supplied by Shimadzu, Kyoto, Japan. It was assumed that the amount of TOC (T2) of SEG depleted from the solution had adsorbed onto the particular mineral phase. The amount of TOC for single SEG was recorded as T0.
The method to test the adsorption density of the collector AX after adding the depressant SEG was as follows. First, two grams of pure mineral particles were added to 40 mL distilled water in 100 mL beakers and SEG was added to the desired concentration (196 mg/L) at pH 4. The suspension was stirred for 3 min and subsequently filtered. Then, the filter residue was washed three times using distilled water. The filter residue was transferred to a clean beaker, 40 mL of distilled water was added, and the water pH was adjusted to 4, the collector AX was added, and stirring was applied for 3 min. Finally, the suspension was centrifuged and the TOC of AX remaining in the supernatant was measured using the TOC-L equipment.
The ultimate adsorption density of SEG on the mineral surface after adding AX was equal to the adsorption density of both SEG and AX minus the adsorption density of single AX after adding the depressant SEG. In this paper, TOC adsorption efficiency was used to measure the adsorption effect of the reagents, and the adsorption efficiency was expressed as:
2.5. Zeta Potential Measurements
The zeta potential of minerals treated and untreated by the flotation reagents was measured by a JS94H micro electrophoresis instrument (Shanghai Zhongchen Digital Technic Apparatus Co., Shanghai, China). The measurement was carried out at 25 °C. A 20 mg sample was placed in a 100 mL beaker with 40 mL aqueous solutions containing 10 mM KNO3 as the supporting electrolyte, and the mineral suspension was conditioned with reagents over the pH range of 3–12 [25]. All of the samples were thoroughly equilibrated, and an average zeta potential value of at least three individual measurements was recorded.
2.6. FT-IR Spectroscopy Experiments
The following procedure was used for FT-IR spectroscopy experiments by a 740FT-IR instrument (Nicolet Co., Waltham, MA, USA). The untreated pure mineral particles were used as a reference spectrum. One gram of pure mineral particles was added into 30 mL aqueous solution with or without 197 mg/L depressant and 16 mg/L collector at pH 4, and ultrasonicated for 5 min. Next, the solutions were magnetically stirred for 40 min and settled for another 40 min. After filtering, the precipitate was washed three times with distilled water and then vacuum dried at 40 °C. Fourier transform infrared (FT-IR) spectra of solids were recorded using a FT-IR spectrometer at room temperature (25 ± 1 °C). The spectra were recorded with 30 scans at a resolution of 2 cm−1.
3. Results and Discussion
3.1. Model Fittings and Statistical Analysis
The complete experimental design matrix as suggested by Design-Expert Software and response values obtained from the experiments are presented in Table 2. According to experimental data, the following fitting polynomial Equations (2) and (3) were obtained from data fitting:
where Y1 and Y2 are the recovery for chalcopyrite and molybdenite, X1, X2, and X3 are the coded values of the three independent variables described above. A positive sign in front of the terms indicates a synergistic effect, whereas a negative sign indicates an antagonistic effect [26].
Y1 = 84.91 − 9.63X1 − 8.01X2 + 1.1X3 − 1.42X1X2 + 1.84X1X3
Y2 = 16.36 + 2 X1 − 0.15 X2 + 0.31 X3 − 0.035X2X3
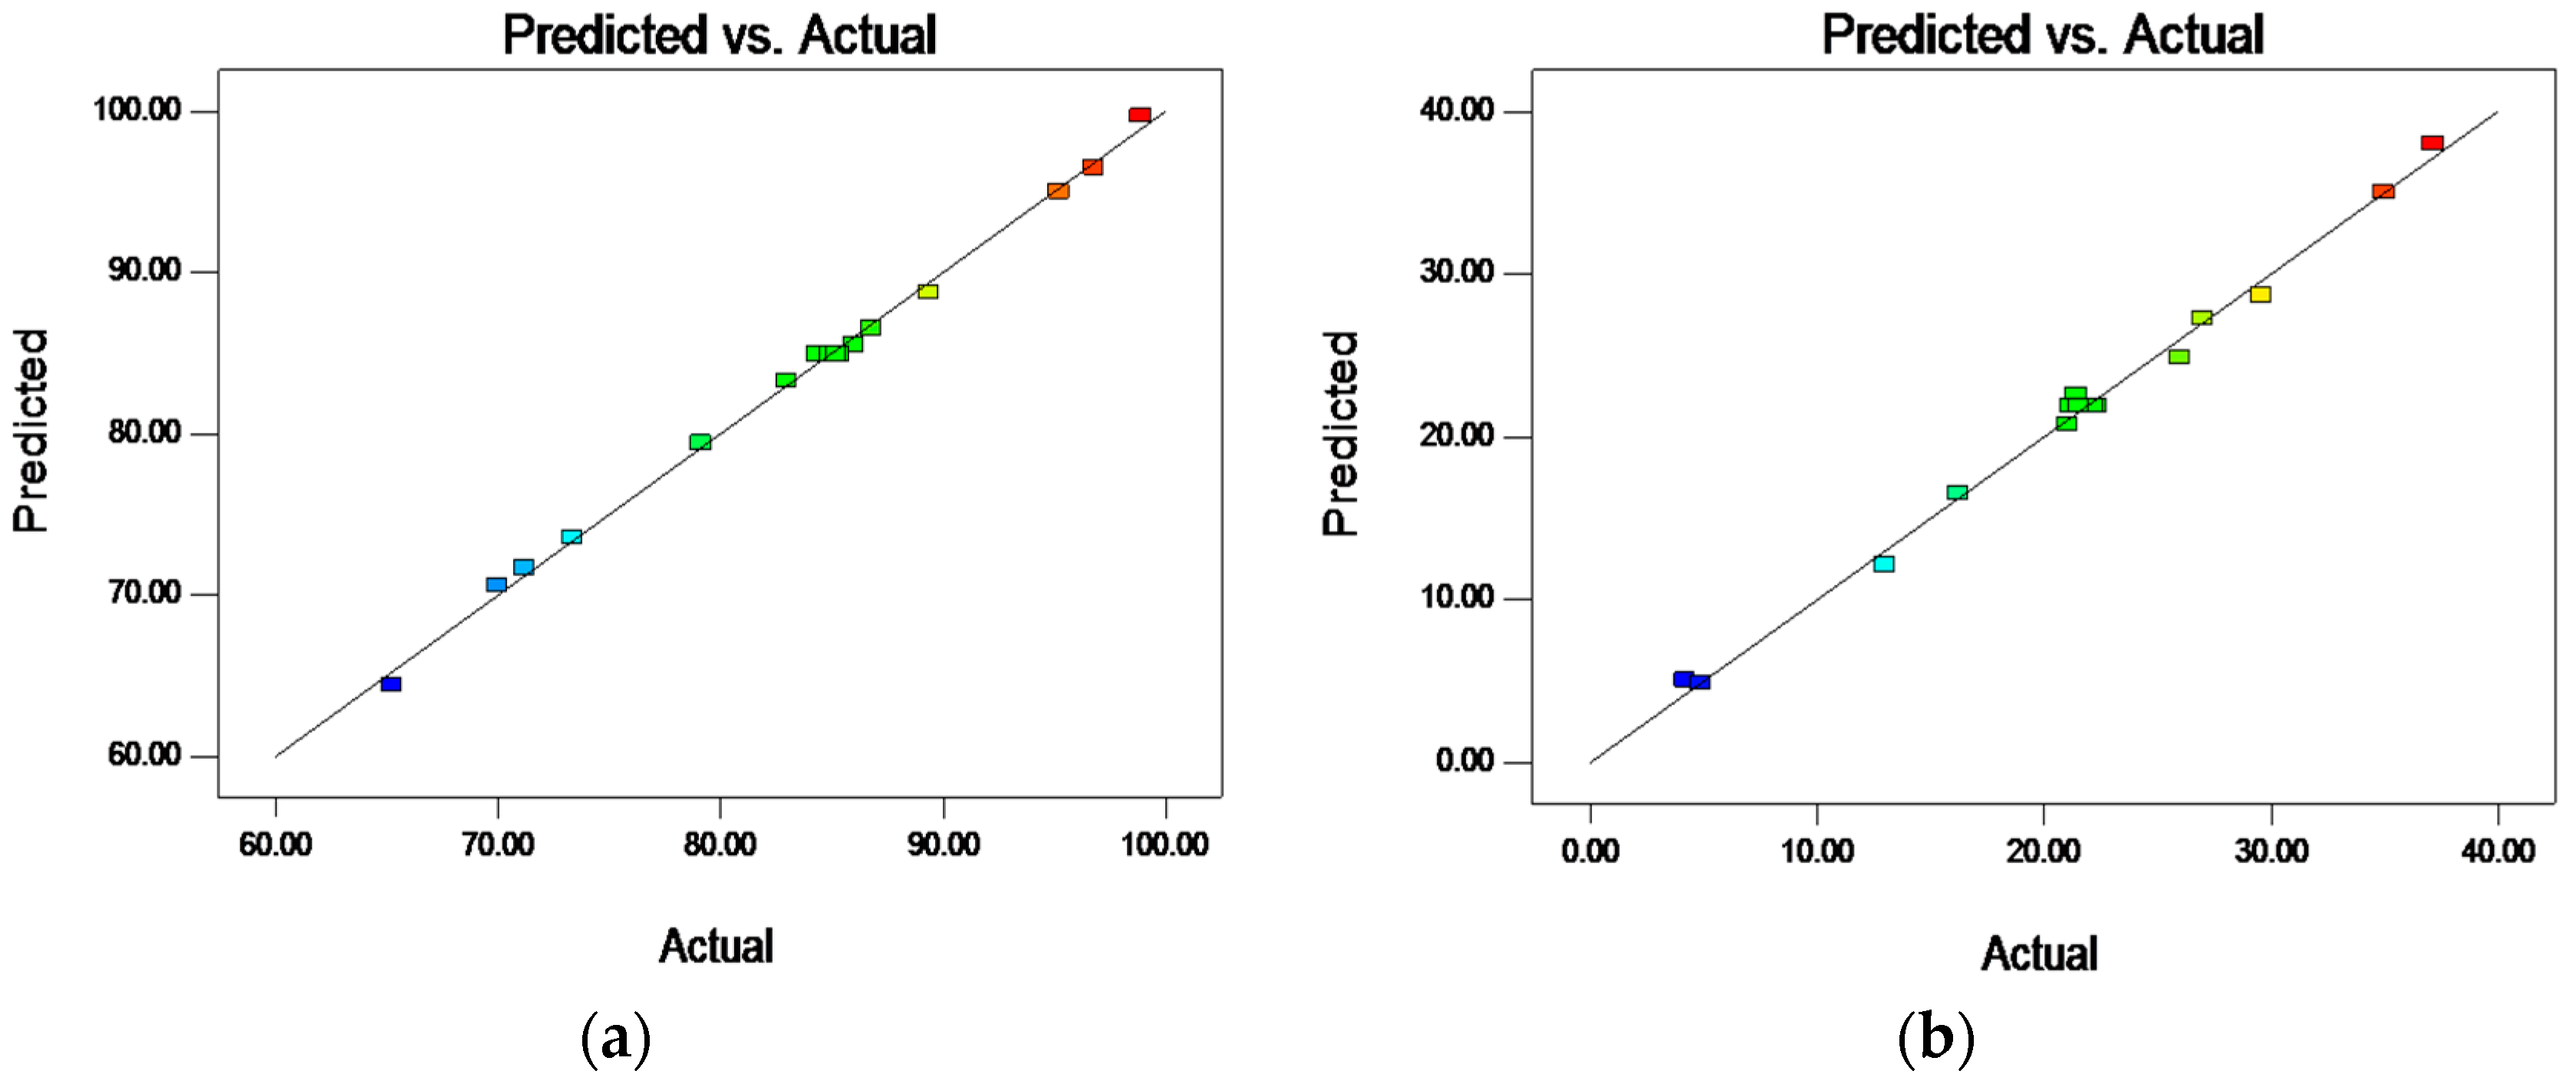
Diagnostic plots, such as predicted versus actual values, were used to determine the adequacy of the model. The predicted values of recoveries (separated efficiency) were calculated using the regression model and compared with experimental values in Figure 4. As can be seen, the experimental results were in good correlation with the values predicted by the statistical model. Thus, this prediction model was sufficiently effective and feasible [27].
Furthermore, the adequacy of the obtained model to predict the separated efficiency was analyzed through analysis of variance (ANOVA). The results (chalcopyrite/molybdenite) are expressed in Table 3. The F-value was the criterion of adaptability of the model, and Prob > F was the criterion of the influence degree of the factor significance [28]. The greater the F-value, the stronger the adaptability of the model. It was considered that an experimental factor was significant for separation efficiency if Prob > F < 0.05 [29]. As shown in Table 3, the F-values of the model were 313 and 138.07 for chalcopyrite and molybdenite, respectively, indicating a high adaptability of the model. Prob > F values of X1, X2, X3, X12, and X13 of chalcopyrite were less than 0.05, which means that these factors play an important role in the flotation of chalcopyrite. Similarly, X1, X2, X3, and X23 were important factors affecting molybdenite flotation. The Lack-of-Fit (LOF) was the criterion of the shortage of the proposed model in the prediction of the response factor [29]. The shortage of the predictive model was indistinct, as LOF was equal to 3.28/4.21 < 4.7725. That is to say, the test method to predict the separated efficiency between chalcopyrite and molybdenite was reliable in this research. The adequate precision ratio (AP, precision criterion) was 65.21/43.73 (>4), and the coefficient of variance (CV, precision criterion) was 0.84/4.60% (<10%), proving the high accuracy of the predictive model [30,31,32]. The multivariate correlation coefficient R2 equal to 0.997/0.994 means that the model could explain the change of the response value to the extent of 99.7%/99.4% for chalcopyrite and molybdenite, respectively. The reliability criterion (Radj2 − Rpred2) equal to 0.027/0.066 < 0.2 proves the high reliability of the model [33].
To sum up, the regression equation could adequately simulate the real surface in the research area. The precision, reliability, and accuracy of the model were within the acceptable range of error. Therefore, it was noticeable that the selected model was suitable for navigating the design space.
3.2. Interactions among the Factors and Optimization Results
Two-dimensional contour plots were applied to demonstrate the interactive effects of operational parameters on the recovery of chalcopyrite and molybdenite. Figure 5 shows the corresponding contour of the combined effect of pH and dosage of SEG, while AX was maintained at 20 mg/L. From the contours, it was clear to understand the interactive effects between the two independent variables and further to decide the optimum levels.
The effects of pulp pH and the dosage of SEG in the flotation of chalcopyrite became increasingly obvious. The inhibition effect was enhanced with the increase of the dosage of SEG, exceeding 250 mg/L at the same pH values. The pulp pH was significant for chalcopyrite flotation especially at alkaline conditions caused by forming metal hydroxides such as copper hydroxide and ferric hydroxide on the surface of chalcopyrite. The metal hydroxides easily formed hydrogen bonds with water molecules while exhibiting a certain hydrophilicity on the mineral surface, resulting in the decrease of the floatability of chalcopyrite [34]. Figure 5a shows that compared with chalcopyrite, the floatability of molybdenite became much weaker after adding the SEG depressant. At pH 4, the flotation recovery of chalcopyrite dropped from over 95% in the presence of SEG 50 mg/L to about 85% in the presence of the 300 mg/L SEG. Between pH 3 and 7 and in the presence of SEG under 200 mg/L, the recovery of chalcopyrite decreased from 95% to about 90%, and stayed there at higher pHs. For molybdenite, its recovery dropped from 30% in the presence of SEG 50 mg/L to 10% in the presence of 300 mg/L SEG at pH 4. Between pH 3 and 12 and in the presence of SEG under 100 mg/L, the recovery of molybdenite was increased from 20% to about 35%, and stayed there at higher pH. In alkaline solutions, the double layer repulsion between molybdenite and bubbles was decreased gradually after the adsorption of SEG on the surface of molybdenite and probably strengthen the floatability of molybdenite [35].
Figure 5b shows the corresponding contour of the combined effect of pH and dosage of AX, while SEG was maintained at 175 mg/L. The effect of AX dosage on chalcopyrite flotation was inapparent, especially under the condition of pH less than 10 caused by excellent natural floatability and the poor adsorption capacity of the depressant. However, the floatability of molybdenite was greatly affected by the dosage of AX, probably due to the stronger adsorption capacity of AX, and weakened the effect of inhibitors gradually. This was the reason why the recovery rate of molybdenite increased with dosage of AX.
Figure 5c shows the corresponding contour of the combined effect of dosage of AX and SEG, whilst pH was maintained at 3.4 (natural). It was proved that the recoveries of molybdenite increased with the increase in SEG concentration, while it basically had no influence on chalcopyrite flotation. Furthermore, the result also showed that the recovery difference between chalcopyrite and molybdenite was decreased gradually as the AX concentration was increased.
Based on the analysis by Design-Expert, optimization results were achieved to evaluate the optimal experimental parameters for the separation efficiency of chalcopyrite and molybdenite. Table 4 shows the optimum conditions based on a combination of all the corresponding contours. Under the optimum conditions of initial pH 4, SEG dosage 197 mg/L, and AX dosage 16 mg/L, the recovery of 95.82/9.67% for chalcopyrite/molybdenite was achieved after using 20 mg/L MIBC as frother. Only a small deviation (<2%) was exhibited between the experimental values and the predicted values. Thus, the BBD model can be used to optimize the process of separating efficiency of chalcopyrite and molybdenite.
3.3. Contrast Experiments of Depressant
As stated in the previous studies, it has been shown that either adopting a traditional depressant can achieve significant improvement in copper removal efficiency results [3,4,5,6,7]. However, since the purpose of this study was to evaluate the replacement of traditional depressant with SEG in the flotation separation of Cu-Mo sulphide ores. Therefore, further tests were conducted on the flotation separation of chalcopyrite–molybdenite using different depressants through an open circuit like Figure 3. It especially needs to be emphasized that the comparison experiments were designed to analyze the flotation tailing (Cu) after using conventional inhibitors and the flotation concentrate (Cu) by SEG inhibitor. Figure 6 compares the results of Cu-Mo separation obtained using the traditional depressant and the new depressant SEG. In this study, the flotation process was evaluated by defining the removal efficiency, which as introduced by Mowla [36], , is defined as follows:
Ci and Cf are the initial and final molybdenum concentrations in the chalcopyrite concentrate, respectively.
The effects of various depressants on the Mo removal efficiency and Cu recovery are shown in Figure 6. As seen in Figure 6, as the depressant concentration increased, the removal efficiency of Mo increased, and only a small effect on Cu recovery was observed. It could be seen that the removal efficiency of molybdenite presented similar trends, while using different depressants. Initially, the removal efficiency of molybdenite gradually increased with the increase of depressant concentration; however, the removal efficiency increased slowly when the depressant was increased to a certain concentration. The results indicated that the Cu recovery was affected by the higher concentration of depressant, which may be explained by the fact that strong adsorption had a negative effect on chalcopyrite flotation. Taking Mo removal efficiency and Cu recovery into consideration, the optimal concentration was 200 mg/L with SEG as depressant. All five of the depressants showed an excellent selectivity for the separation of molybdenite and chalcopyrite.
3.4. Adsorption Studies
The adsorption behaviors of SEG and AX on chalcopyrite and molybdenite surfaces as a function of pH are given in Figure 7. It was proved that the adsorption efficiency of SEG on molybdenite was obviously higher than chalcopyrite, even though the adsorption capacity of chalcopyrite increased with increases of pH value. Satisfactory results for the adsorption efficiency of SEG on chalcopyrite and molybdenite surface were about 83% and 10%, respectively, when pH was less than 5. This may be related to the formation of hydrophilic metal hydroxides on the surface of chalcopyrite, especially in alkaline condition [34]. The contrast in adsorption efficiency changes of these minerals shows that the treatment of AX has little influence on the interactions between SEG and these minerals.
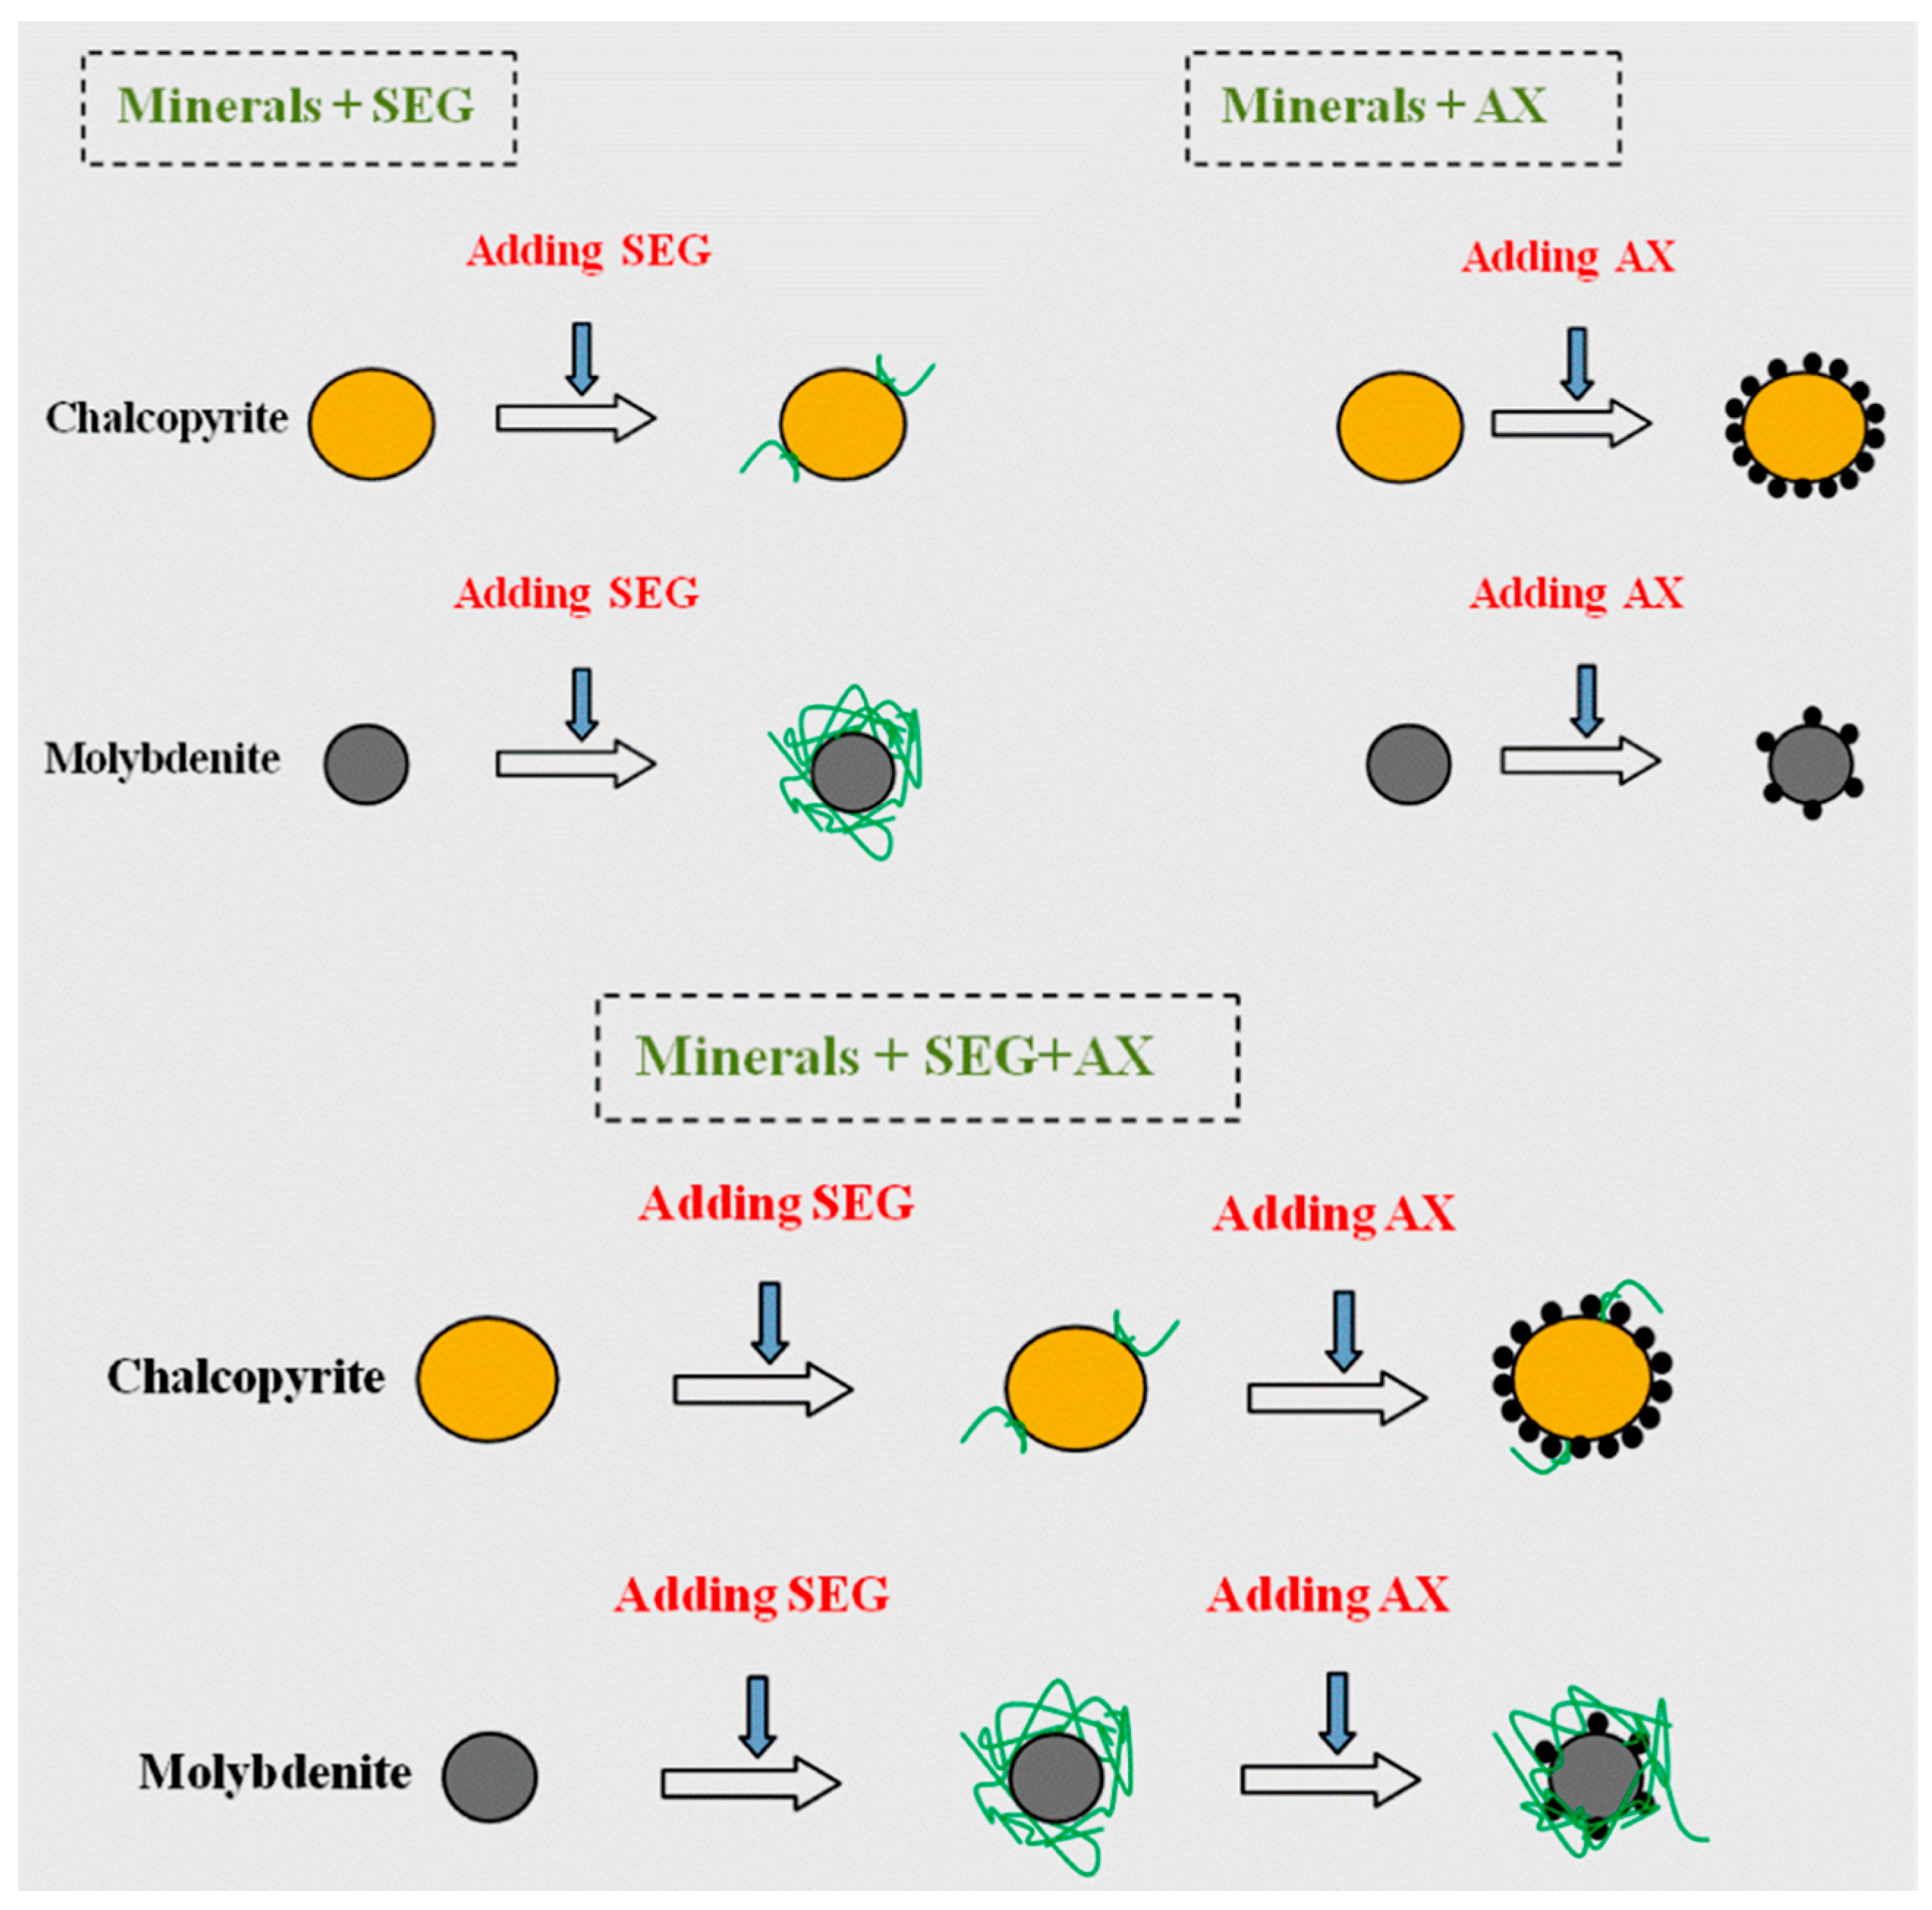
One interesting result was that the collector AX basically maintained a consistent adsorption efficiency on chalcopyrite and molybdenite surfaces with and without SEG throughout the experiments. This was further proof of the previous conjecture: it is likely that SEG depressed molybdenite by covering the dixanthogen resulting from adsorption of xanthate ions [25]. However, chalcopyrite still kept a good floatability in the experiments because of the low adsorption efficiency of SEG. The schematic diagram of the adsorption model is shown in Figure 8. All of the characteristics discussed above were extremely helpful for improving the selective separation efficiency between molybdenite and chalcopyrite.
3.5. Zeta Potential Tests
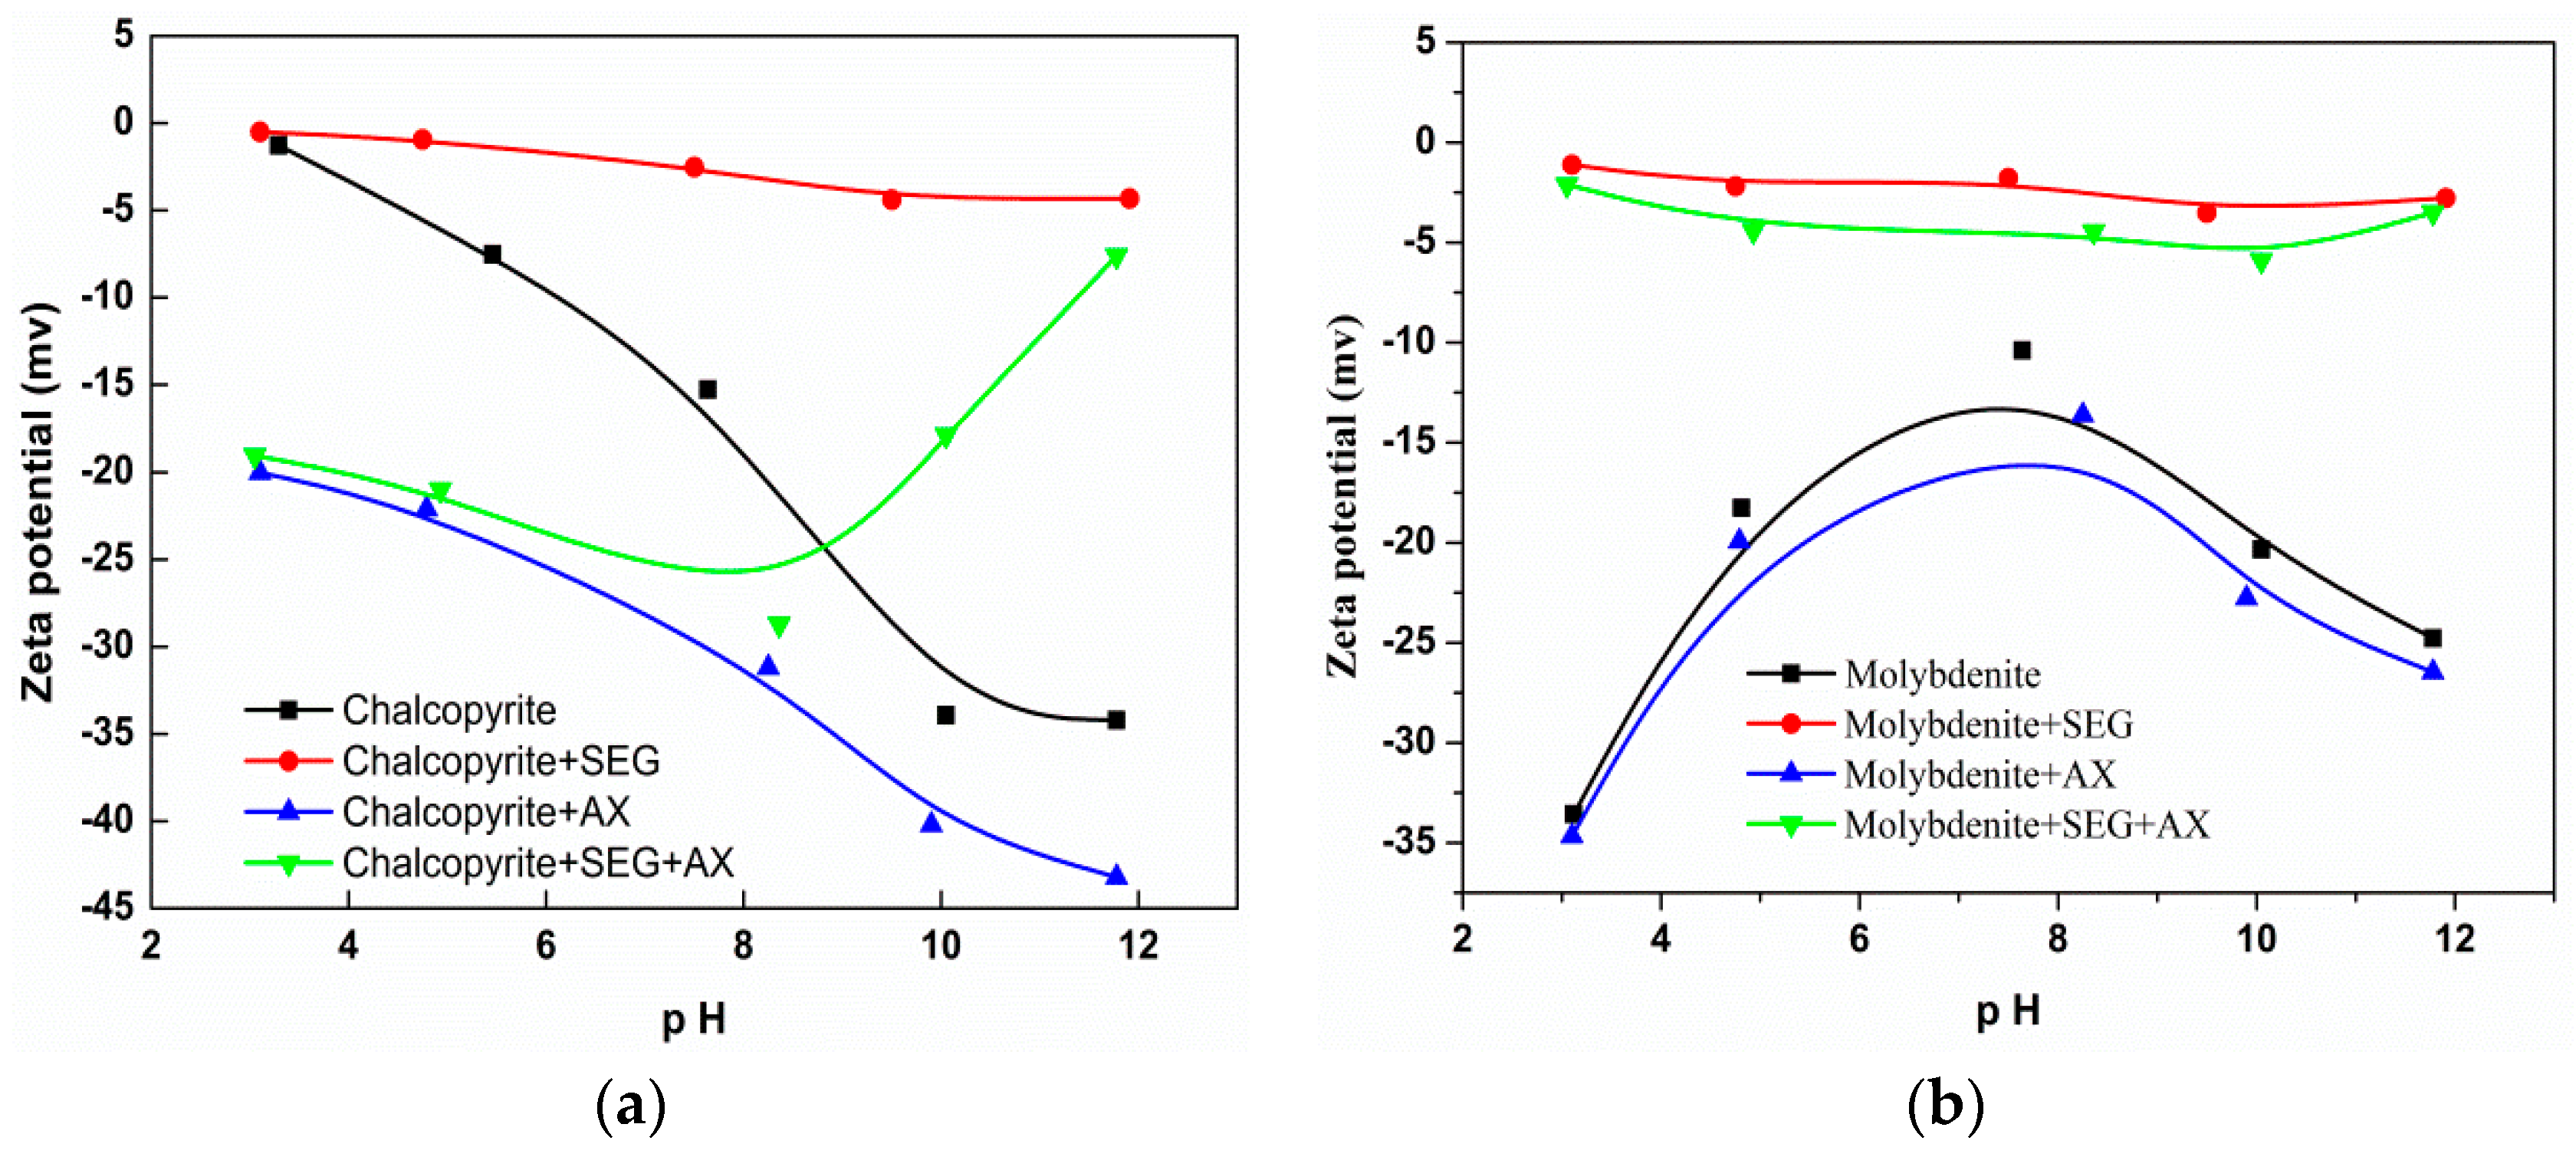
Figure 9a gives the zeta-potential of chalcopyrite in the absence and presence of SEG and AX under different pH conditions. It can be seen that the surface zeta potential of chalcopyrite in the presence of SEG did not change significantly compared with the raw ore at pH less than 4. This indicated that SEG had a negligible effect on the zeta-potential of chalcopyrite, and the adsorption capacity of SEG on chalcopyrite surfaces was poor. However, the zeta potential was positively shifted with pH increases, meaning that the adsorption of SEG on chalcopyrite surface was gradually enhanced. After the addition of collector AX, the zeta potential shifted negatively at pH less than 9, indicating that the addition of inhibitors did not affect the adsorption of AX on the surface of chalcopyrite.
However, the zeta potential shifted positively as pH increased above 9 and gradually approached the surface potential of chalcopyrite in the presence of SEG alone. This probably indicated that the adsorption efficiency of the depressant SEG was strengthened while the collector AX was decreased under strong alkaline conditions.
From Figure 9b, the surface potential of molybdenite after adding inhibitor SEG saw a positive shift compared with the raw ore, probably caused by the chemical adsorption of SEG on the molybdenite surface. The surface zeta potential of molybdenite maintained constant after reaction with the depressant SEG throughout the range of evaluated pH values. After the addition of the collector AX, the zeta potential of molybdenite changed slightly. However, the adsorption experiment results showed that the adsorption of SEG on the surface of molybdenite basically did not prevent the adsorption of the collector AX. Therefore, combined with the two experimental results verified the conjecture in flotation discussion, it can be said that the seaweed glue depresses molybdenite by covering the dixanthogen absorbed [25] on the surface resulting from the adsorption of xanthate ions.
3.6. FT-IR Spectra Analysis
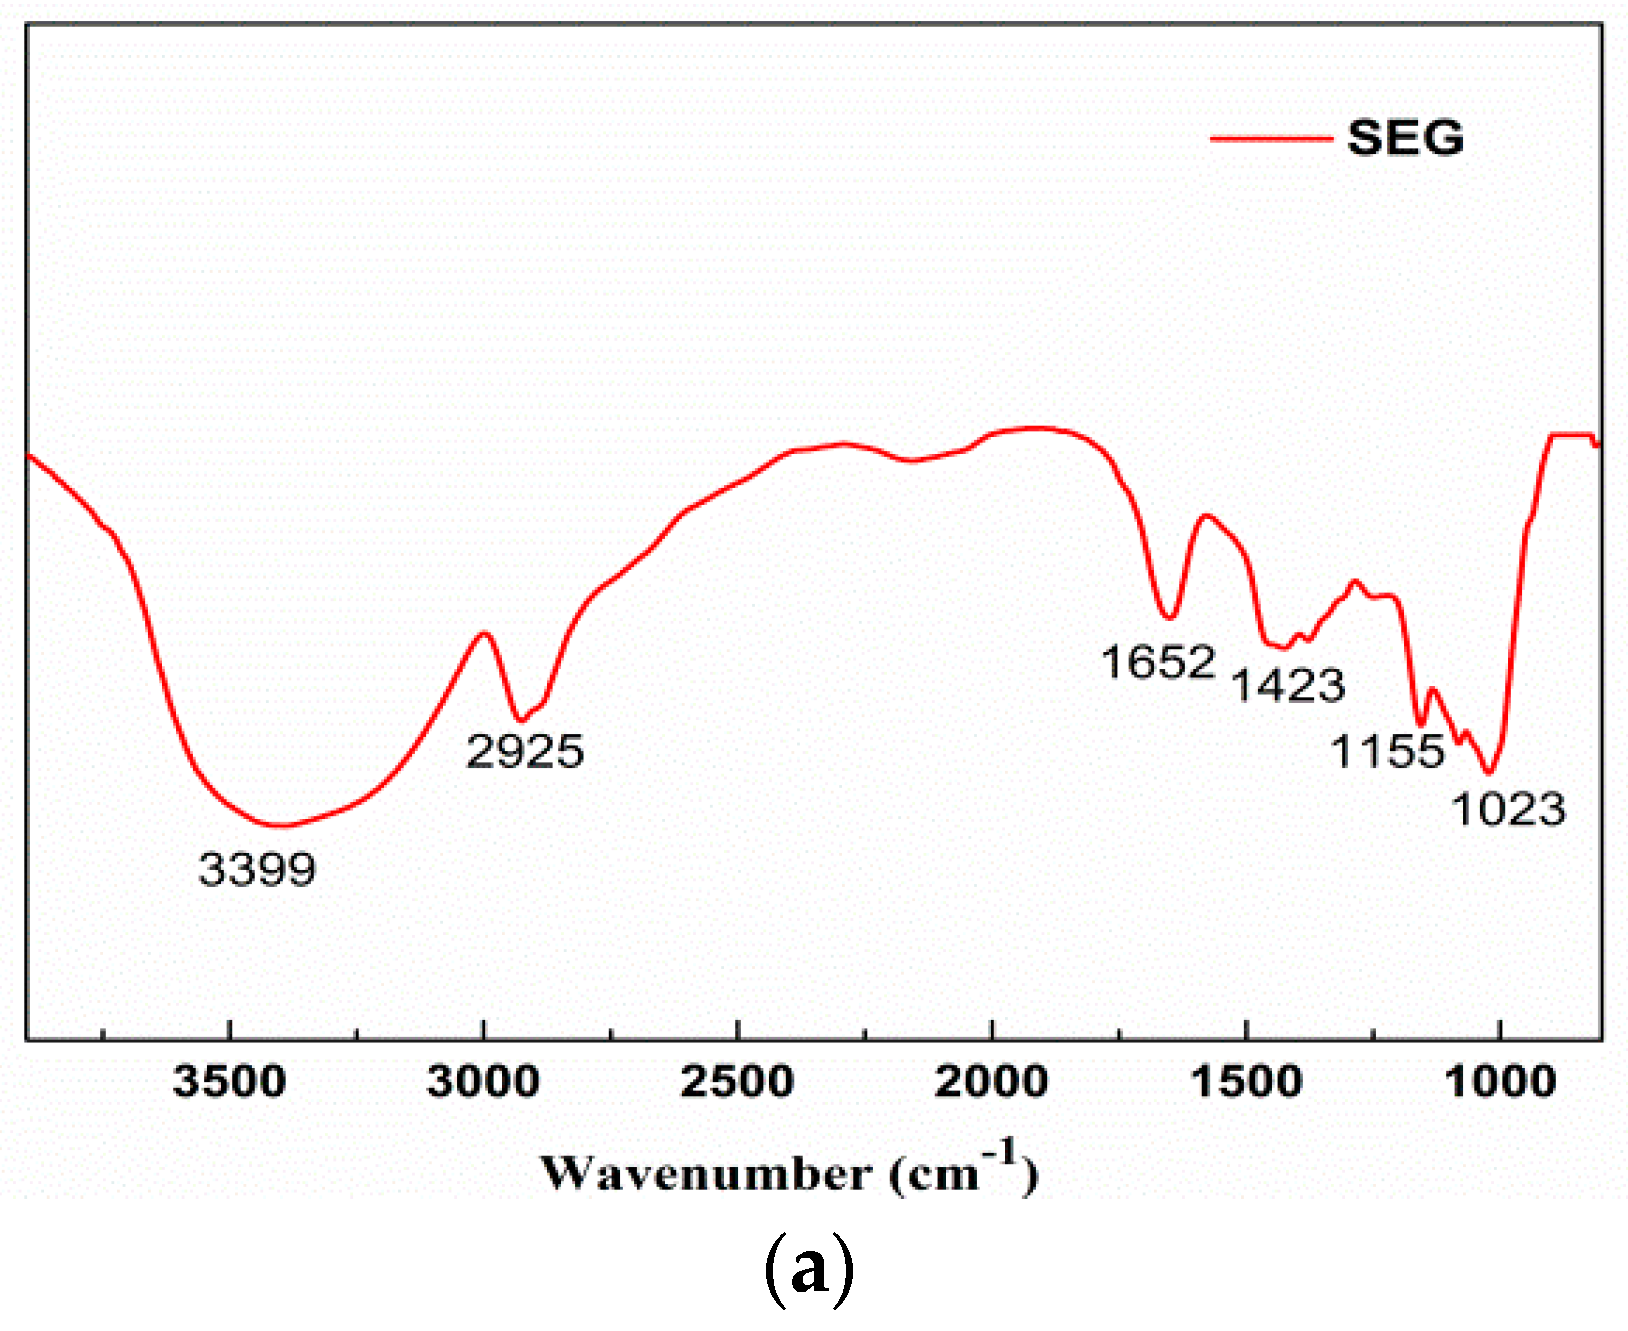
In order to study the depression mechanism of SEG, the FT-IR spectra of the minerals before and after interacting with SEG were determined, and the results are shown in Figure 10a,b.
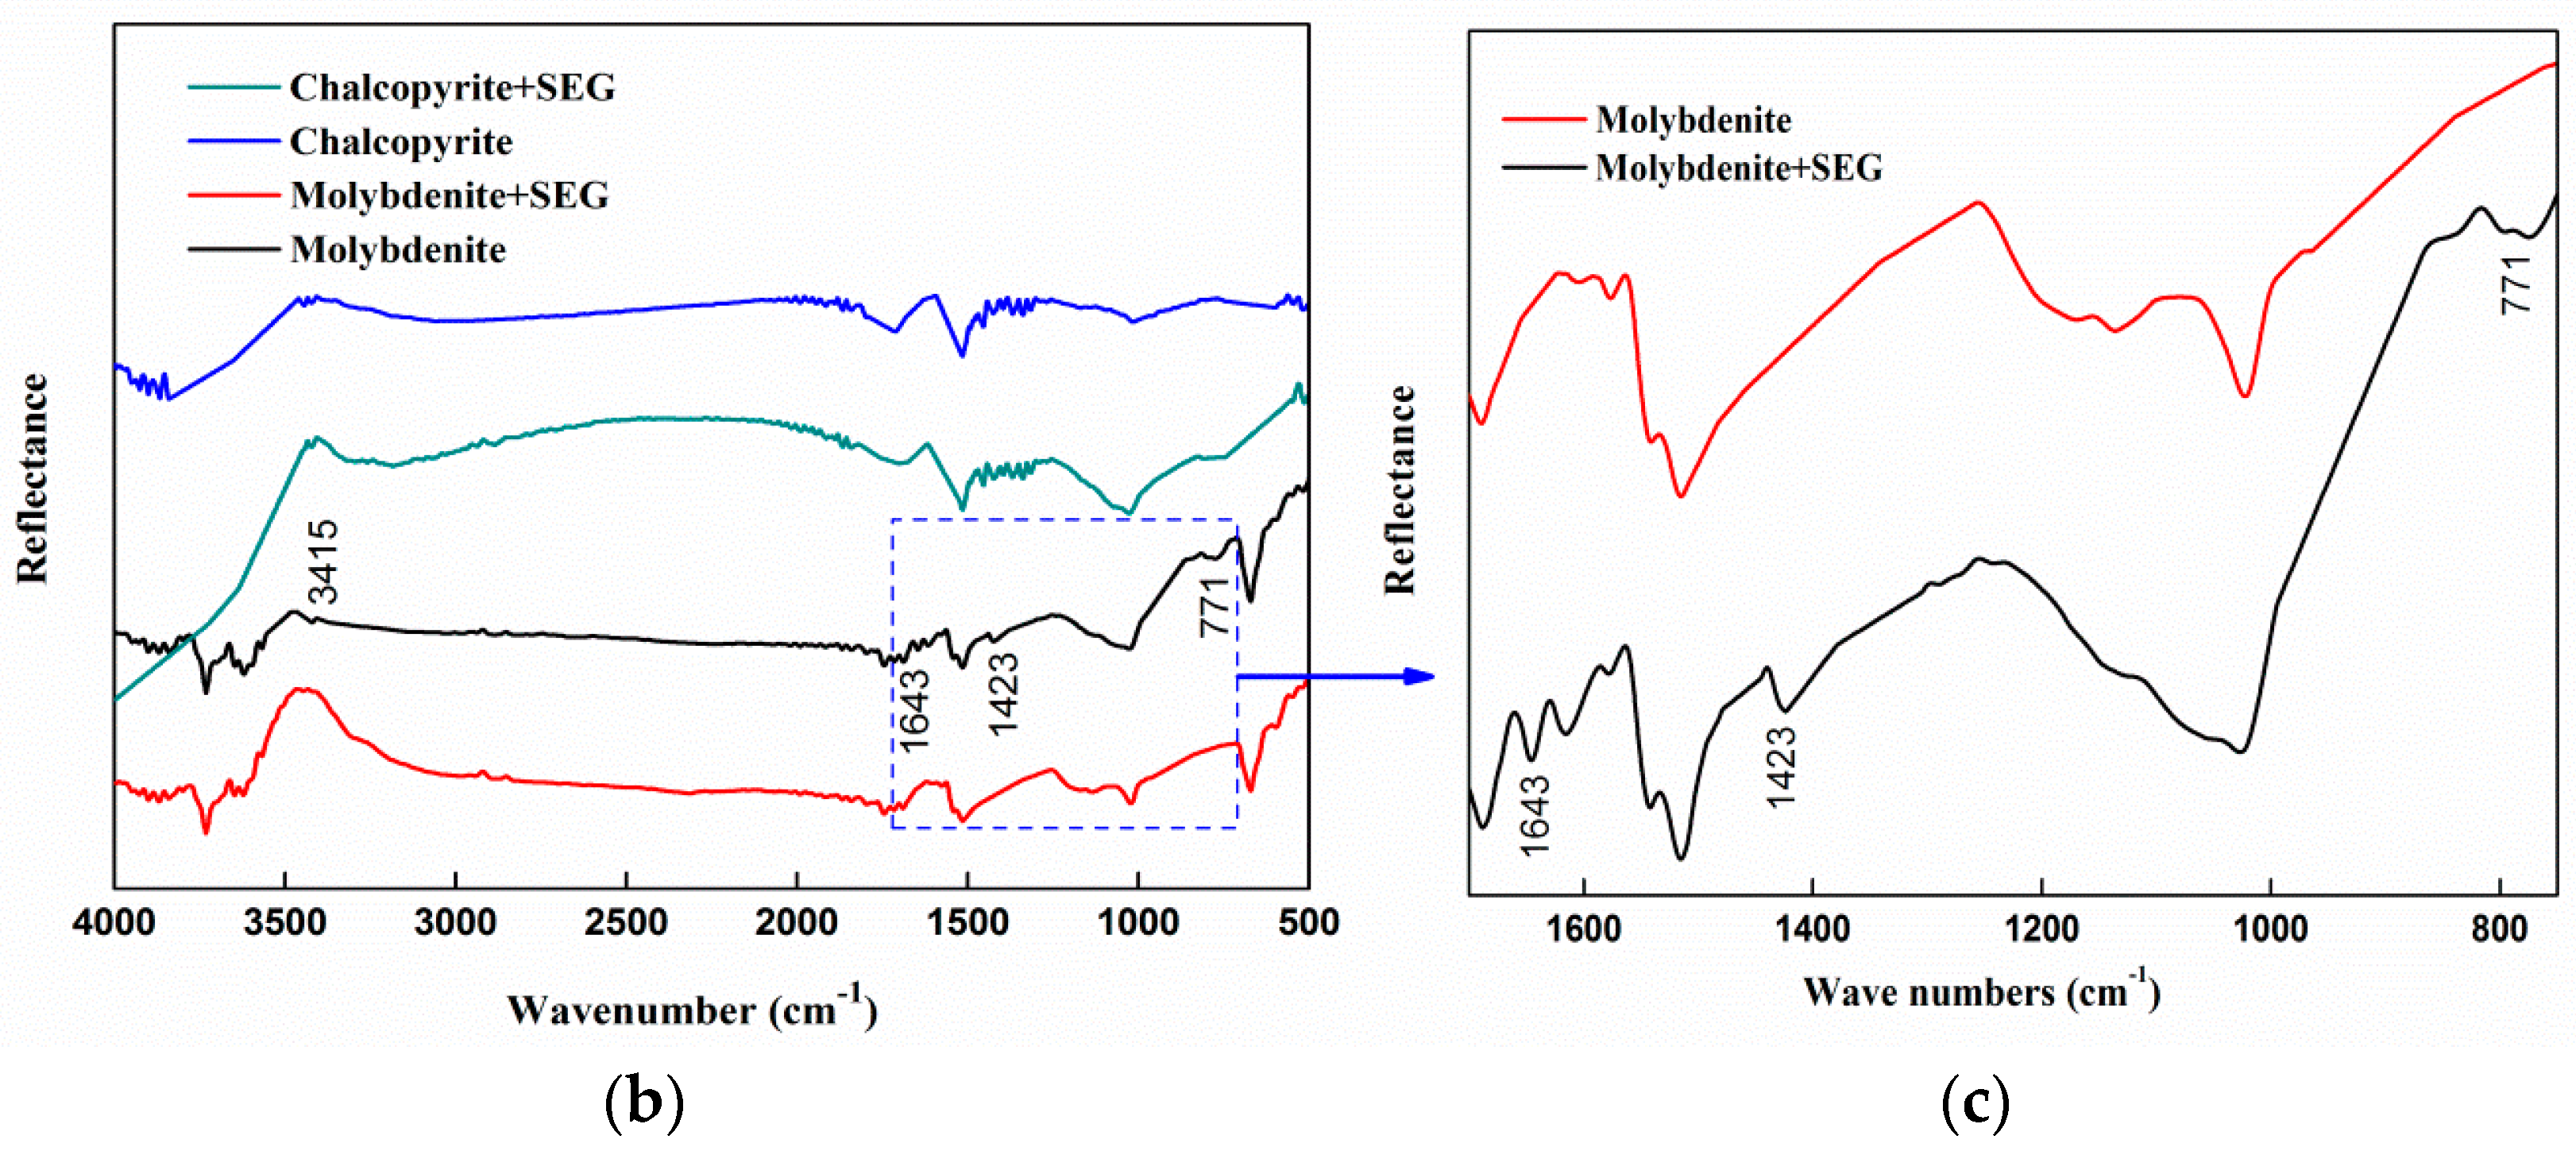
The FT-IR spectrum of molybdenite interacting with SEG (Figure 10b,c) show the characteristic bands of molybdenite near 3415 cm−1, 1643 cm−1, 1423 cm−1, respectively due to –OH stretching vibration, –COO– stretching vibration, indicating that a strong adsorption of SEG on the molybdenite surface has occurred [37,38,39]. The adsorption of –OH and –COO– groups on the molybdenite surface illustrates that SEG adsorbs on molybdenite surface, which contains these functional groups in its molecular structure.
Figure 10b also shows the FT-IR spectrum of chalcopyrite after interacting with SEG. It is clear from Figure 10b that SEG has a negligible effect on the spectrum of chalcopyrite. After interacting with SEG, the characteristic adsorption bands of chalcopyrite shared no obvious changes, and no new bands appeared. These results illustrate that the SEG depressant cannot interfere with the FT-IR spectrum of chalcopyrite and the adsorption capacity of SEG on chalcopyrite surface is poor, which explains the flotation and adsorption results.
It is tenable to conclude that the depressant SEG adsorbs more strongly on the molybdenite surface than on the chalcopyrite surface, and the chemical adsorption process may dominate the interaction of depressant with molybdenite, which are confirmed by adsorption studies and FT-IR analysis, respectively. This may be the reason why SEG has high depression selectivity for molybdenite and little effect on chalcopyrite flotation.
4. Conclusions
In this work, flotation separation of chalcopyrite from molybdenite was studied using seaweed glue (SEG) as a depressant. Response surface methodology with a Box–Behnken Design suggested the optimal reagent schedule: pH 4, depressant seaweed glue 197 mg/L, collector amyl xanthate 16 mg/L and frother (methyl isobutyl carbinol) 20 mg/L, and selective separation of chalcopyrite and molybdenite was achieved by flotation. Comparison of SEG and traditional depressants indicated that the SEG could achieve similar separation efficiency, and exhibited the advantages of environmental compatibility and economic adaptability. The results of FT-IR spectrum measurements indicated that the SEG depressant could adsorb more strongly on the molybdenite surface than chalcopyrite, and the chemical adsorption process may dominate the interaction of SEG with molybdenite.
Although the tests were performed with the use of single minerals, the flotation results for molybdenite and chalcopyrite indicate that SEG could be used as a selective depressant under acidic pH. It is shown that SEG is as effective depressant of Cu/Mo separation as cyanide.
Acknowledgments
The authors acknowledge the support of the National Natural Science Foundation of China (No. 51374249), the National Key Technology R&D Program (No. 2015BAB12B02) and the Science and Technology Planning Project Guangdong Province, China (No. 2013B090800016).
Author Contributions
Guohua Gu, Zhixiang Chen and Shuangke Li conceived and designed the experiments; Zhixiang Chen and Shuangke Li performed the experiments and analyzed the data; Chongqing Wang and Renfeng Zhu contributed reagents and materials; Zhixiang Chen, Guohua Gu and Chongqing Wang wrote the paper.
Conflicts of Interest
The authors declare no conflict of interest.
References
- Ansari, A.; Pawlik, M. Floatability of chalcopyrite and molybdenite in the presence of lignosulfonates. Part II. Hallimond tube flotation. Miner. Eng. 2007, 20, 609–616. [Google Scholar] [CrossRef]
- Feng, B.; Feng, Q.M.; Lu, Y.P. A novel method to limit the detrimental effect of serpentine on the flotation of pentlandite. Int. J. Miner. Process. 2012, 114, 11–13. [Google Scholar] [CrossRef]
- Yin, Z.; Sun, W.; Hu, Y. Utilization of acetic acid-[(hydrazinylthioxomethyl)thio]-sodium as a novel selective depressant for chalcopyrite in the flotation separation of molybdenite. Sep. Purif. Technol. 2017, 179, 248–256. [Google Scholar] [CrossRef]
- Li, M.Y.; Wei, D.; Cui, B. Flotation Behavior of Chalcopyrite and Molybdenite in the Presence of 2,3-Disulfanylbutanedioic Acid. J. Northeast. Univ. Nat. Sci. 2015, 36, 1020–1024. [Google Scholar]
- Peng, H.; Wu, D.; Abdalla, M. Study of the Effect of Sodium Sulfide as a Selective Depressor in the Separation of Chalcopyrite and Molybdenite. Minerals 2017, 7, 51. [Google Scholar] [CrossRef]
- Yin, Z.; Sun, W.; Liu, J. Investigation into the flotation response of refractory molybdenum ore to depressant mixtures: A case study. Int. J. Min. Sci. Technol. 2016, 26, 1089–1094. [Google Scholar] [CrossRef]
- Sun, W.; Yin, Z.; Hu, Y. Evaluation of the replacement of NaCN with depressant mixtures in the separation of copper–molybdenum sulphide ore by flotation. Sep. Purif. Technol. 2017, 173, 9–16. [Google Scholar]
- Lin, Q.Q.; Gu, G.H.; Wang, H. Recovery of molybdenum and copper from porphyry ore via iso-flotability flotation. Trans. Nonferrous Met. Soc. China 2017, 27, 2260–2271. [Google Scholar] [CrossRef]
- Ansari, A.; Pawlik, M. Floatability of chalcopyrite and molybdenite in the presence of lignosulfonates. Part I. Adsorption studies. Miner. Eng. 2007, 20, 600–608. [Google Scholar] [CrossRef]
- Chen, H.T.; Ravishankar, S.A.; Farinato, R.S. Rational polymer design for solid–liquid separations in mineral processing applications. Int. J. Miner. Process. 2003, 72, 75–86. [Google Scholar] [CrossRef]
- Gustafsson, J.O.; Lannefors, C.J. Polyquaternary Polymer as a Depressant in a Method for Froth Flotation of Potash Ores. WO/2014/095797. 26 June 2014. [Google Scholar]
- Pearse, M.J. Historical use and future development of chemicals for solid–liquid separation in the mineral processing industry. Miner. Eng. 2003, 16, 103–108. [Google Scholar] [CrossRef]
- Andreeva, N.; Ishizaki, T.; Baroch, P. Creating Biointerface on Polymer by Plasma-Initiated Graft Polymerization. Trans. Mater. Res. Soc. Jpn. 2011, 36, 549–552. [Google Scholar] [CrossRef]
- Badiger, H.; Shukla, S.; Kalyani, S. Characterization of sodium alginate membrane crosslinked with glutaraldehyde in pervaporation separation. J. Appl. Polym. Sci. 2014, 131, 209–219. [Google Scholar]
- Rhim, J.W. Physical and mechanical properties of water resistant sodium alginate films. LWT Food Sci. Technol. 2004, 37, 323–330. [Google Scholar] [CrossRef]
- Harnsilawat, T.; Pongsawatmanit, R.; Mcclements, D.J. Characterization of β-lactoglobulin-sodium alginate interactions in aqueous solutions: A calorimetry, light scattering, electrophoretic mobility and solubility study. Food Hydrocoll. 2006, 20, 577–585. [Google Scholar] [CrossRef]
- Vikartovská, A.; Bučko, M.; Mislovičová, D. Improvement of the stability of glucose oxidase via, encapsulation in sodium alginate–cellulose sulfate–poly(methylene-co-guanidine) capsules. Enzym. Microb. Technol. 2007, 41, 748–755. [Google Scholar] [CrossRef]
- Chen, W.; Feng, Q.; Zhang, G. The effect of sodium alginate on the flotation separation of scheelite from calcite and fluorite. Miner. Eng. 2017, 113, 1–7. [Google Scholar] [CrossRef]
- Sasaki, T.; Machida, I.; Ishiwata, S. Macromolecular ion flotation of Fe3+, Cu2+, and Ni2+ ions by combined use of macromolecular anions and cationic surfactant. Bull. Chem. Soc. Jpn. 1982, 55, 3109–3112. [Google Scholar] [CrossRef]
- Treenate, P.; Monvisade, P. In vitro drug release profiles of pH-sensitive hydro-xyethylacryl chitosan/sodium alginate hydrogels using paracetamol as a soluble model drug. Int. J. Biol. Macromol. 2017, 99, 71–78. [Google Scholar] [CrossRef] [PubMed]
- Harmer, S.L.; Thomas, J.E.; Fornasiero, D.; Gerson, A.R. The evolution of surface layers formed during chalcopyrite leaching. Geochim. Cosmochim. 2006, 70, 4392–4402. [Google Scholar] [CrossRef]
- Mikhlin, Y.L.; Tomashevich, Y.V.; Asanov, I.P.; Okotrub, A.V.; Varnek, V.A.; Vyalikh, D.V. Spectroscopic and electrochemical characterization of the surface layers of chalcopyrite (CuFeS2) reacted in acidic solutions. Appl. Surf. Sci. 2004, 225, 395–409. [Google Scholar] [CrossRef]
- Triffett, B.; Veloo, C.; Adair, B.J.I. An investigation of the factors affecting the recovery of molybdenite in the Kennecott Utah Copper bulk flotation circuit. Miner. Eng. 2008, 21, 832–840. [Google Scholar] [CrossRef]
- Zhang, M. Study on reagent-making of P-nokes. China Mol. Ind. 2002, 38, 28–36. [Google Scholar]
- Kondrat’ev, S.A.; Burdakova, E.A.; Konovalov, I.A. Collectability of physically adsorbed xanthate ion–dixanthogen associates. J. Min. Sci. 2016, 52, 541–550. [Google Scholar] [CrossRef]
- Song, M.M.; Branfordwhite, C.; Nie, H.L. Optimization of adsorption conditions of BSA on thermosensitive magnetic composite particles using response surface methodology. Colloids Surf. B Biointerfaces 2011, 84, 477–483. [Google Scholar] [CrossRef] [PubMed]
- Salarian, A.A.; Hami, Z.; Mirzaei, N. N-doped TiO2, nanosheets for photocatalytic degradation and mineralization of diazinon under simulated solar irradiation: Optimization and modeling using a response surface methodology. J. Mol. Liq. 2016, 22, 183–191. [Google Scholar] [CrossRef]
- Gelman, A. Analysis of variance. Qual. Contr. Appl. Stat. 2005, 20, 295–300. [Google Scholar]
- Tybout, A.; Sternthal, B.; Keppel, G.; Verducci, J.; Meyers-Levy, J.; Barnes, J.; Maxwell, S.; Allenby, G.; Gupta, S.; Steenkamp, J.B.; et al. Analysis of Variance. J. Consum. Psychol. 2016, 10, 5–35. [Google Scholar]
- Shaykh, Z.M.; Zinatizadeh, A.A.L. Statistical modeling of photocatalytic degradation of synthetic amoxicillin wastewater (SAW) in an immobilized TiO2 photocatalytic reactor using response surface methodology (RSM). J. Taiwan Inst. Chem. Eng. 2014, 45, 1717–1726. [Google Scholar] [CrossRef]
- Schenone, A.V.; Conte, L.O.; Botta, M.A.; Alfano, O.M. Modeling and optimization of photo-Fenton degradation of 2,4-D using ferrioxalate complex and response surface methodology (RSM). Environ. Manag. 2015, 155, 177–183. [Google Scholar] [CrossRef] [PubMed]
- Fayazi, M.; Afzali, D.; Taher, M.A.; Mostafavi, A.; Gupta, V.K. Removal of Safranin dye from aqueous solution using magnetic mesoporous clay: Optimization study. J. Mol. Liq. 2015, 212, 675–685. [Google Scholar] [CrossRef]
- Eslami, A.; Asadi, A.; Meserghani, M.; Bahrami, H. Optimization of sonochemical degradation of amoxicillin by sulfate radicals in aqueous solution using response surface methodology (RSM). J. Mol. Liq. 2016, 222, 739–744. [Google Scholar] [CrossRef]
- Senior, G.D.; Trahar, W.J. The influence of metal hydroxides and collector on the flotation of chalcopyrite. Int. J. Miner. Process. 1991, 33, 321–341. [Google Scholar] [CrossRef]
- Chulhyun, P.; Hoseok, J. The Effect of Sodium Silicate as pH Modifier and Depressant in the Froth Flotation of Molybdenite Ores. Mater. Trans. 2010, 51, 1367–1369. [Google Scholar]
- Mowla, D.; Karimi, G.; Ostadnezhad, K. Removal of hematite from silica and ore by reverse flotation technique. Sep. Purif. Technol. 2008, 58, 419–423. [Google Scholar] [CrossRef]
- Zou, Y.R. Studies on Effect of Anionic Starch on the Floatability of Aluminum-Silicon Minerals and Its Mechanism. Master’s Thesis, Central South University, Changsha, China, 2008. [Google Scholar]
- Bellamy, L.J. Infrared spectroscopy of complex molecules. In The Infra-Red Spectra of Complex Molecules; Science Press: Beijing, China, 1980; pp. 123–126. [Google Scholar]
- Rath, R.K.; Subramanian, S.; Pradeepy, T. Surface chemical studies on pyrite in the presence of polysaccharide—Based flotation depressants. J. Colloid Interface Sci. 2000, 229, 82–91. [Google Scholar] [CrossRef] [PubMed]
Figure 1.
Seaweed glue molecular structure (monomer subunits, G—polyguluronic, M—polymannuronate) [20]. Reproduced with permission from Treenate et al., In vitro drug release profiles of pH-sensitive hydro-xyethylacryl chitosan/sodium alginate hydrogels using paracetamol as a soluble model drug; published by Elsevier, 2017.

Figure 2.
XRD spectra of pure (a) chalcopyrite and (b) molybdenite for flotation tests.
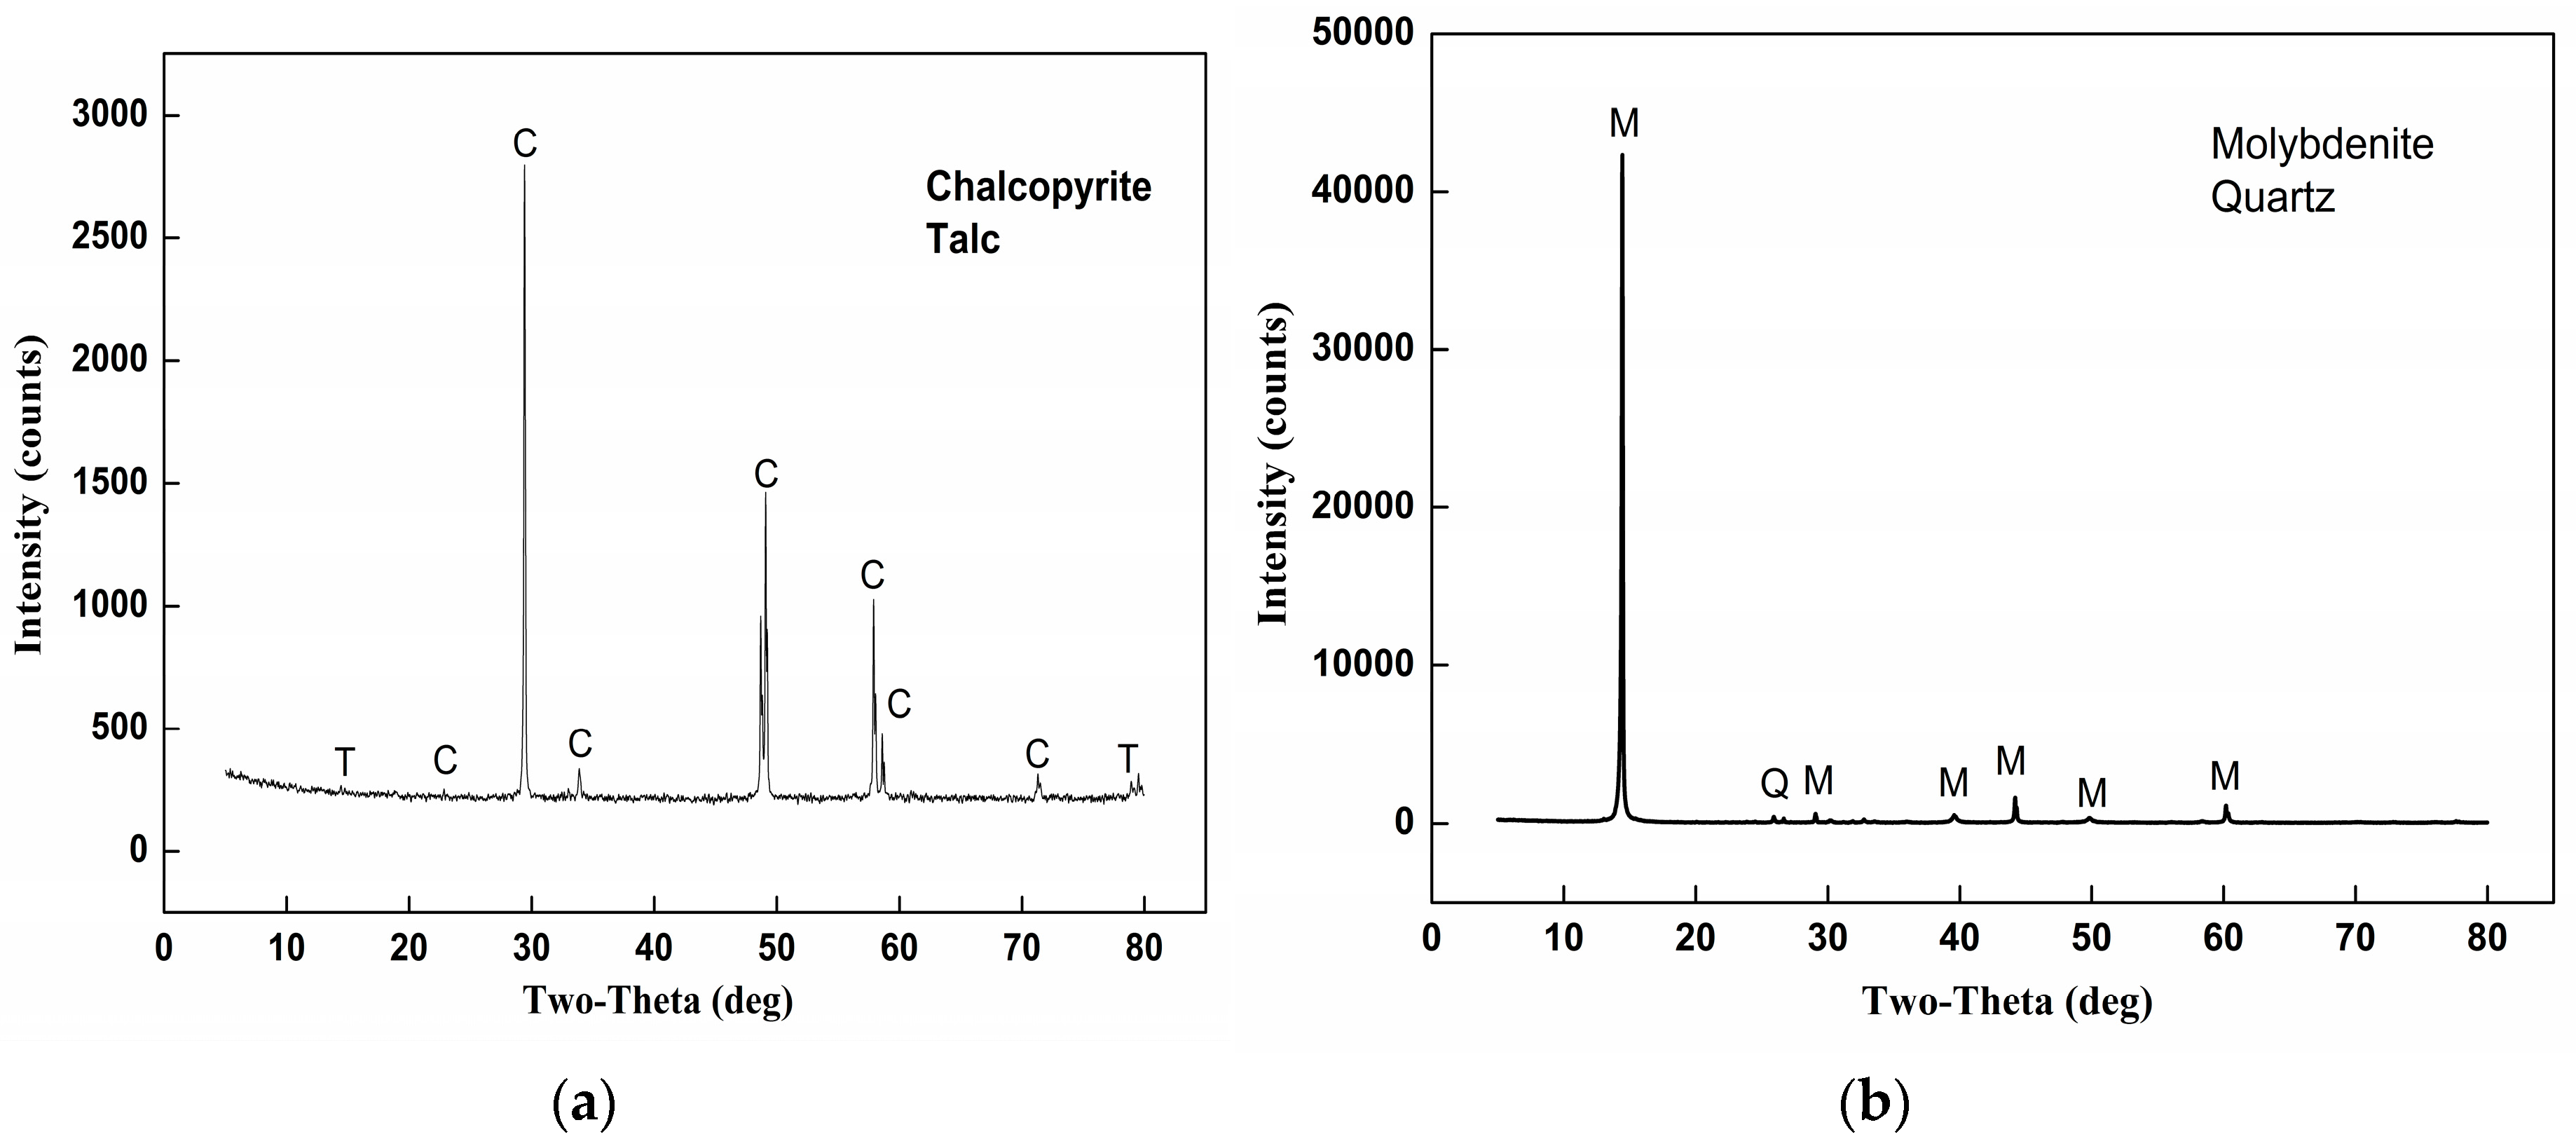
Figure 3.
The beneficiation flow sheet of mixed ore experiment.

Figure 4.
Design expert plot of (a) chalcopyrite and (b) molybdenite: Actual values versus predicted response by Box–Behnken design (BBD).
Figure 4.
Design expert plot of (a) chalcopyrite and (b) molybdenite: Actual values versus predicted response by Box–Behnken design (BBD).

Figure 5.
Response surface plots and contours for separation efficiency as a function of (a) SEG dosage and pH (amyl xanthate, AX: 20 mg/L); (b) pH and AX dosage (SEG: 175 mg/L); and (c) SEG dosage and AX dosage (pH = 3.4).
Figure 5.
Response surface plots and contours for separation efficiency as a function of (a) SEG dosage and pH (amyl xanthate, AX: 20 mg/L); (b) pH and AX dosage (SEG: 175 mg/L); and (c) SEG dosage and AX dosage (pH = 3.4).
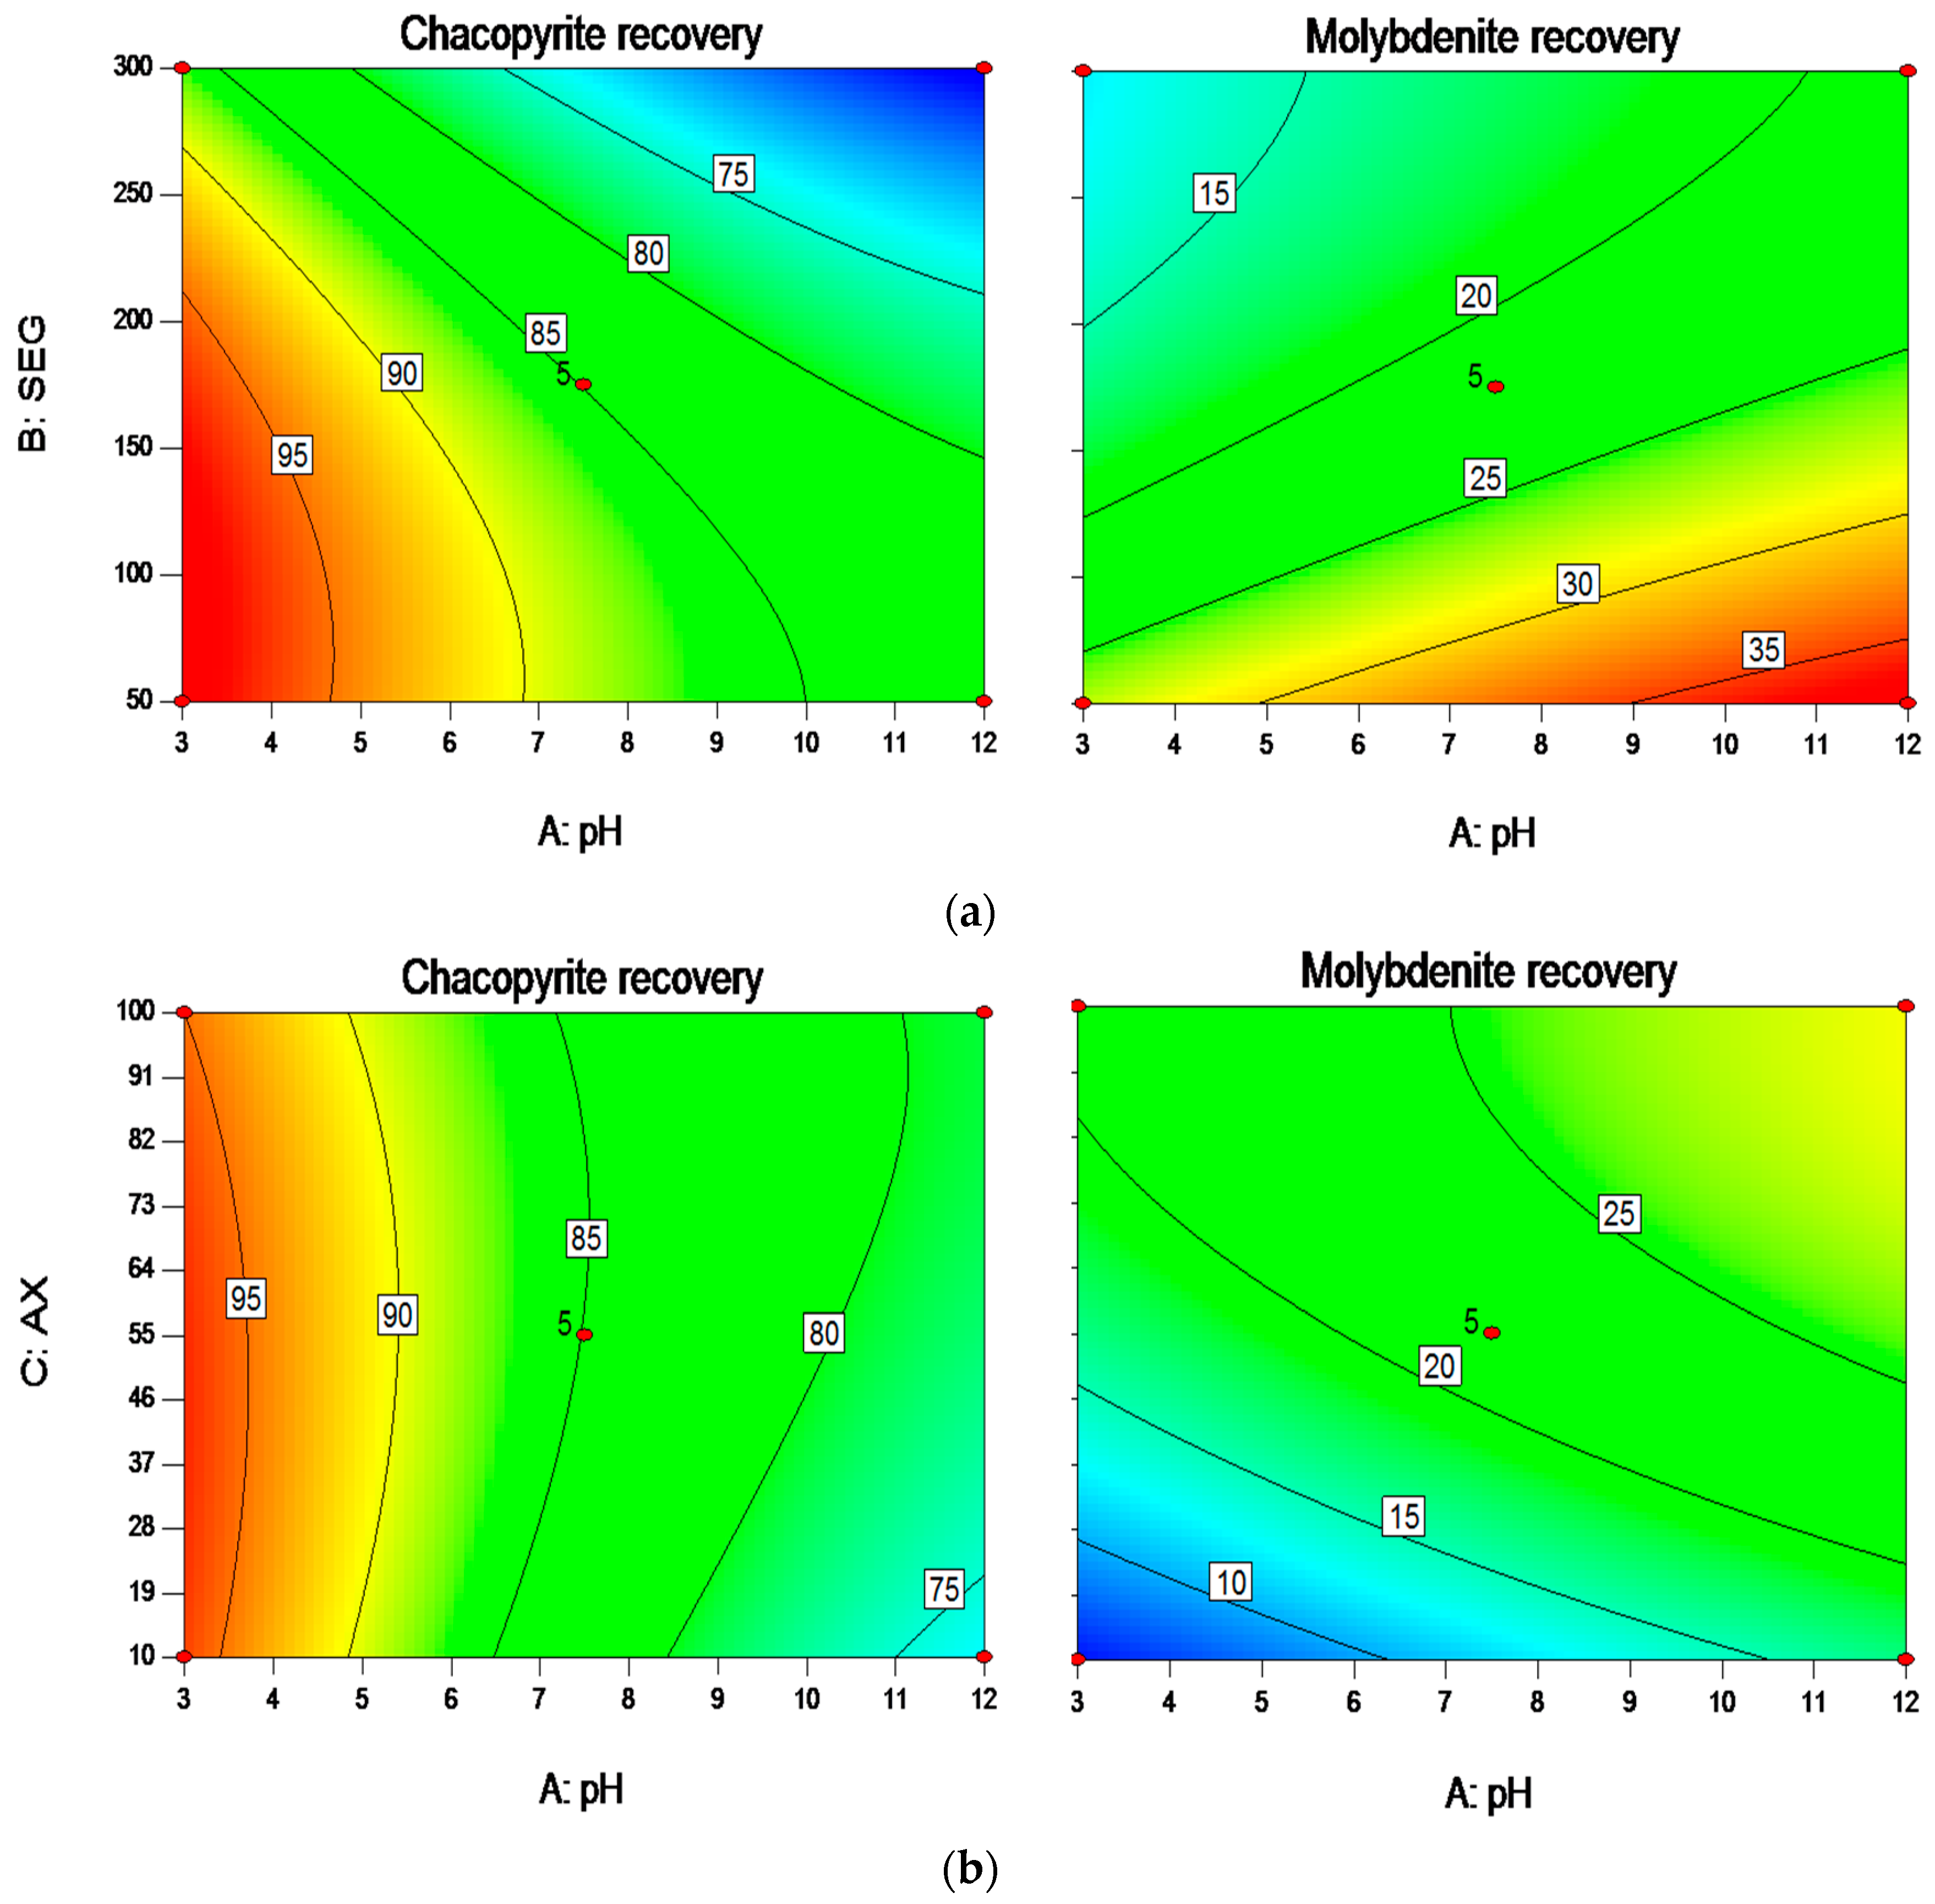
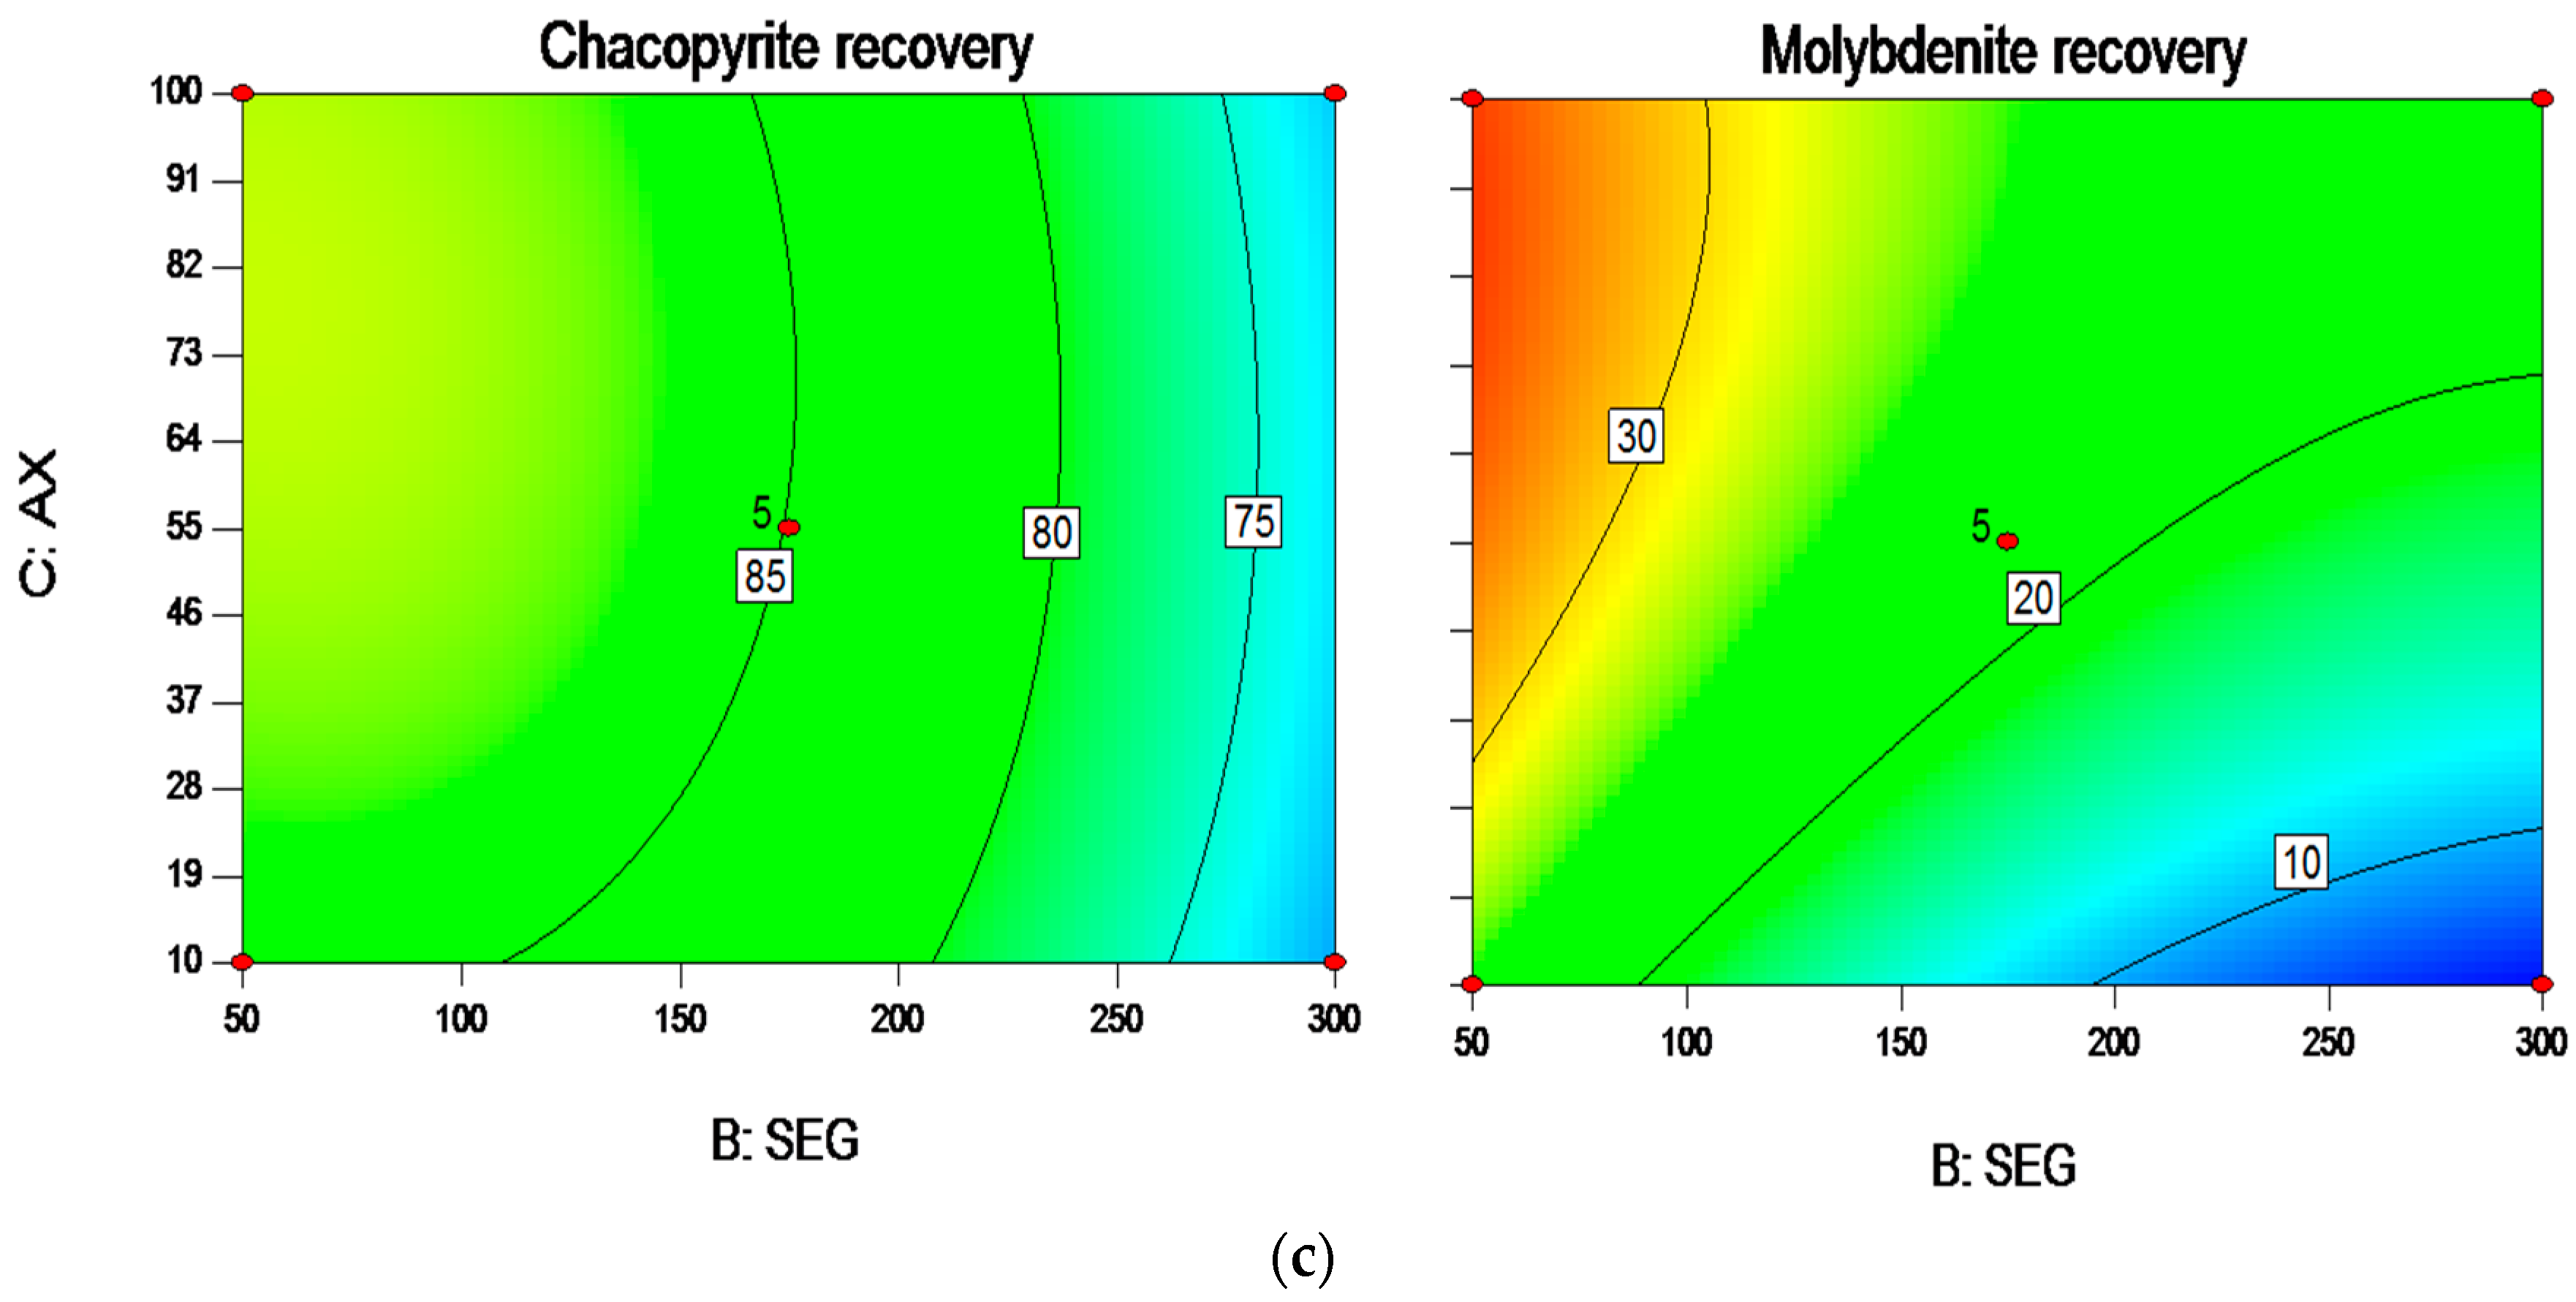
Figure 6.
(a) Cu recovery versus (b) Mo removal efficiency using different depressants (CN: sodium cyanide, DCMT: disodium carboxymethyl trithiocarbonate, PN: P-Nokes reagent, DT: the main ingredient is sodium hypochlorite, SEG: seaweed glue).
Figure 6.
(a) Cu recovery versus (b) Mo removal efficiency using different depressants (CN: sodium cyanide, DCMT: disodium carboxymethyl trithiocarbonate, PN: P-Nokes reagent, DT: the main ingredient is sodium hypochlorite, SEG: seaweed glue).
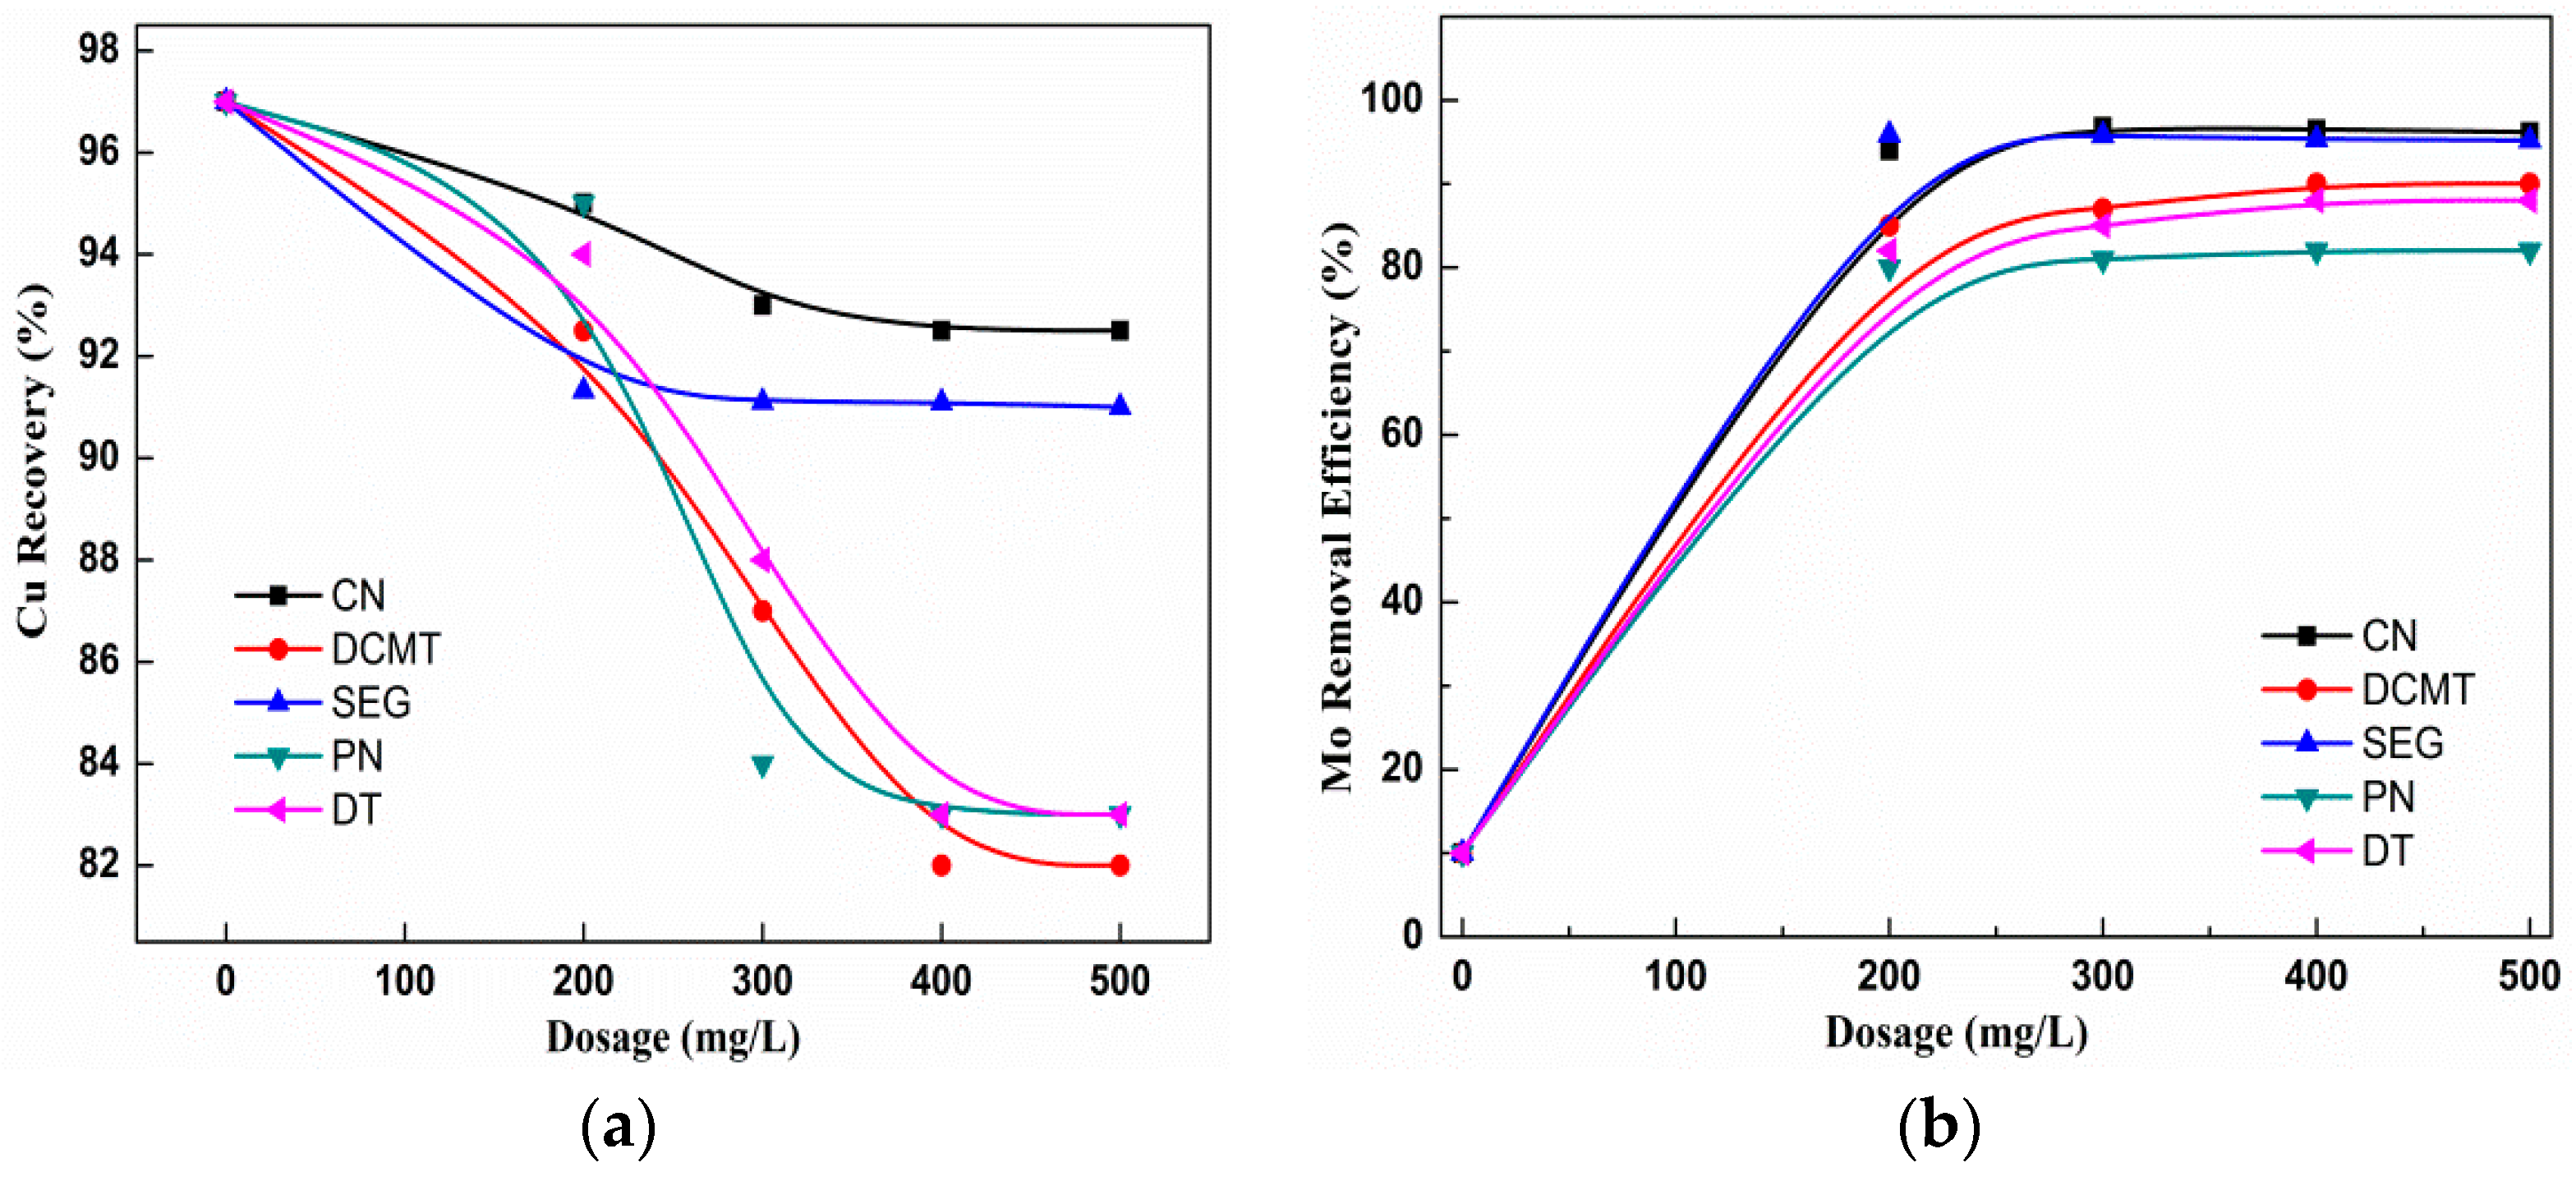
Figure 7.
The adsorption efficiency of (a) SEG and (b) AX on single mineral surfaces as a function of pH (SEG: 197 mg/L, AX: 16 mg/L).
Figure 7.
The adsorption efficiency of (a) SEG and (b) AX on single mineral surfaces as a function of pH (SEG: 197 mg/L, AX: 16 mg/L).
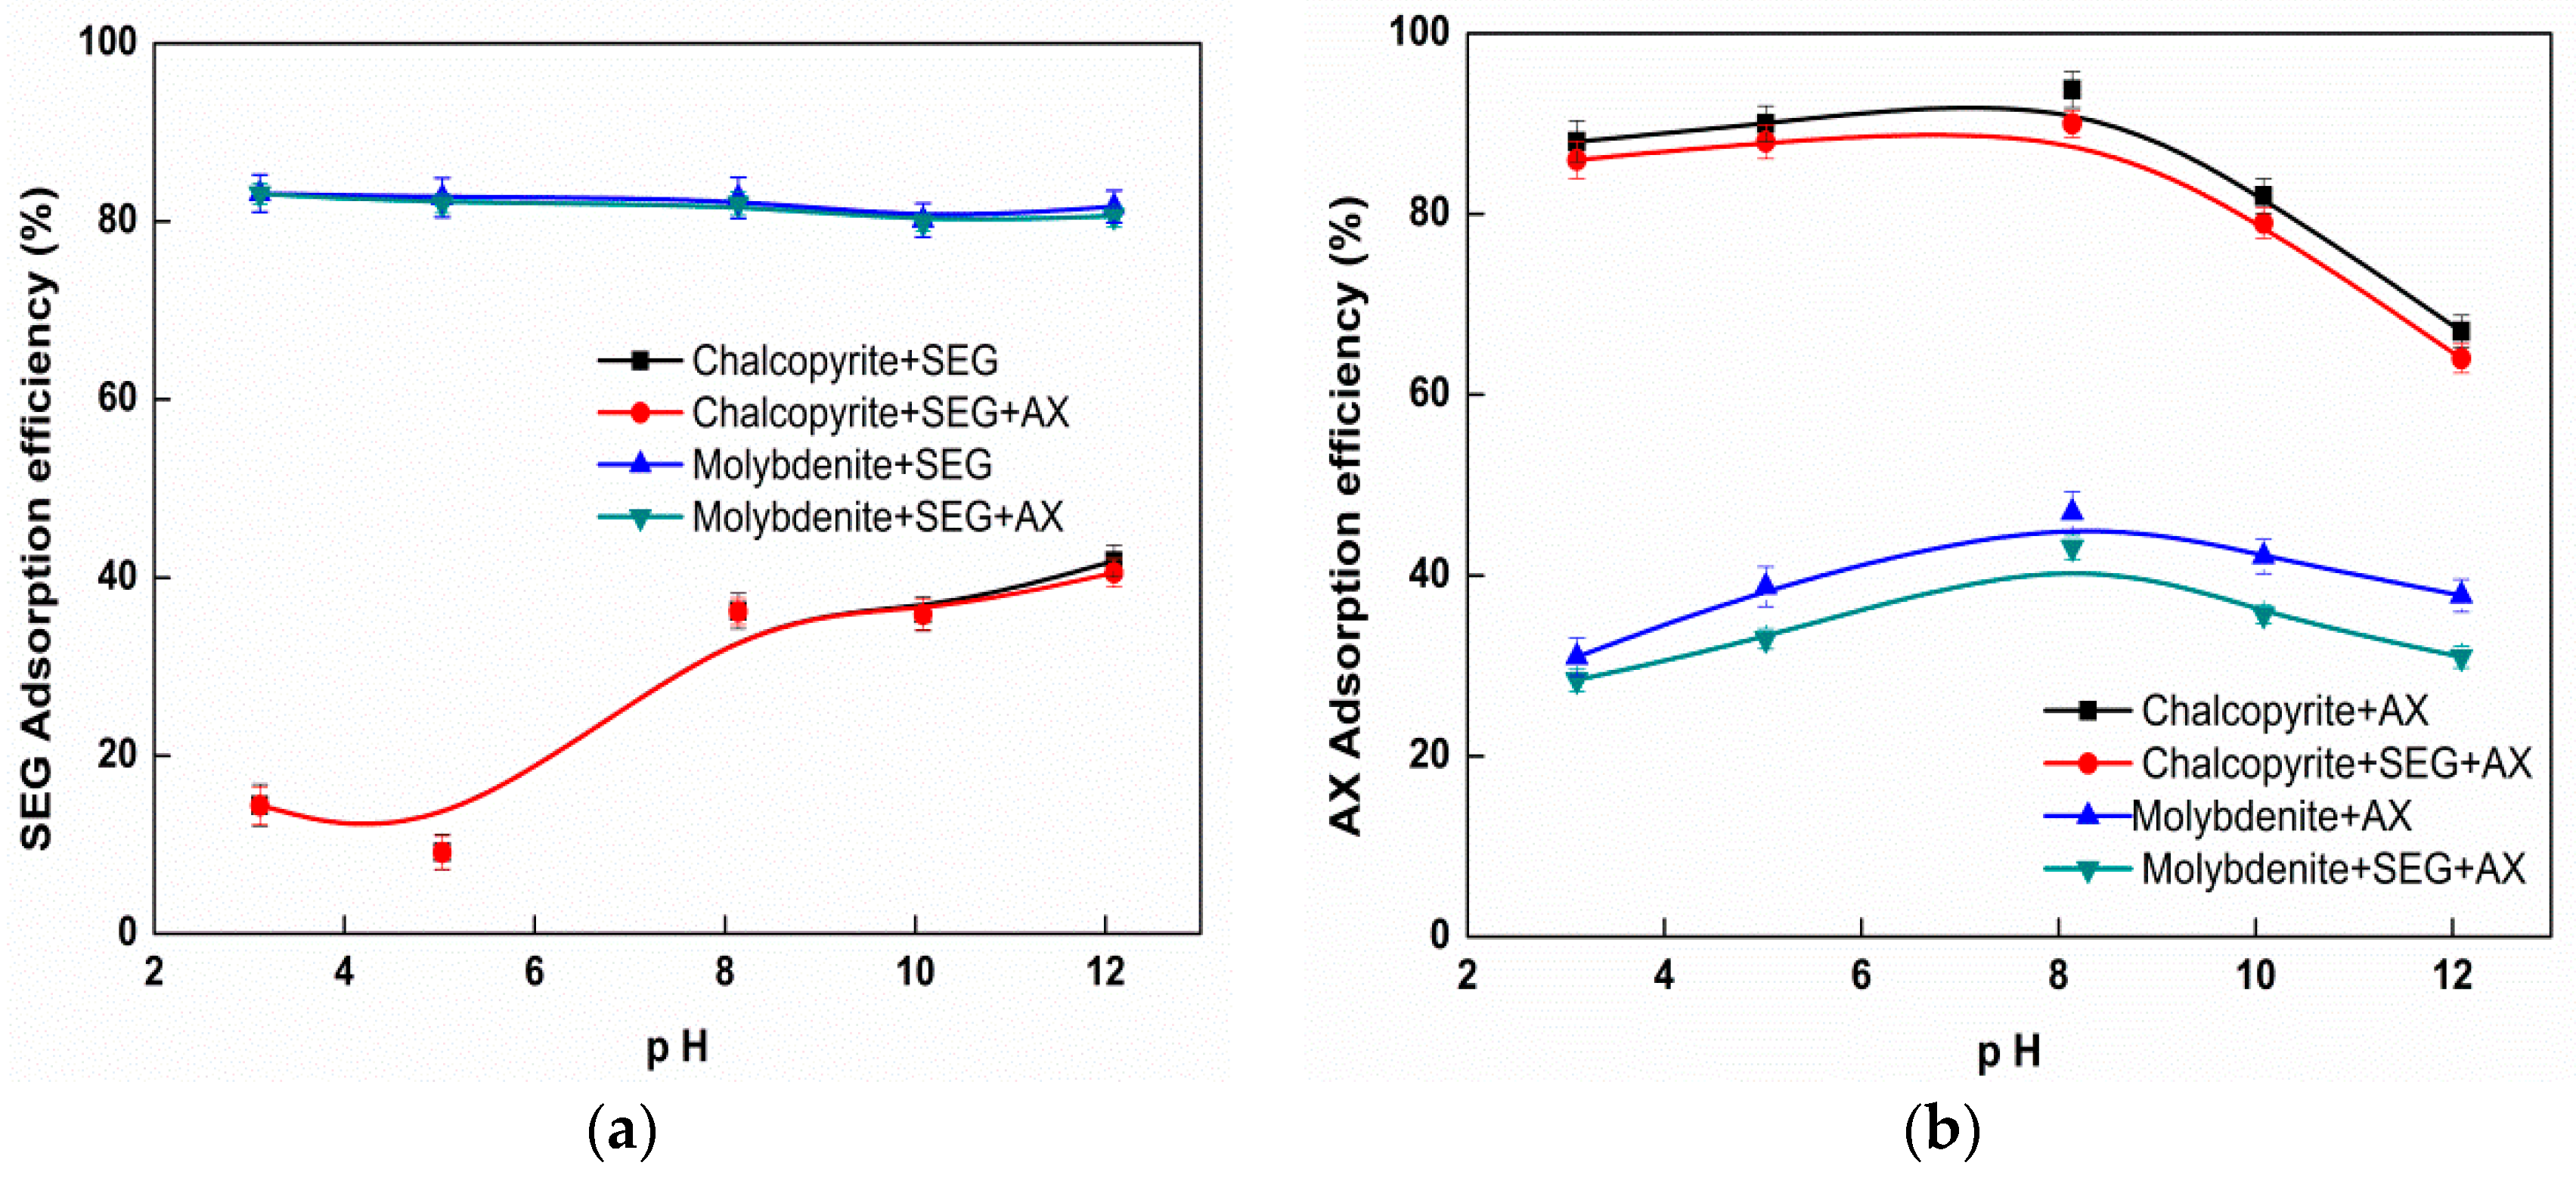
Figure 8.
Schematic diagram of adsorption of chalcopyrite and molybdenite (pH = 4).

Figure 9.
Zeta-potential of (a) chalcopyrite and (b) molybdenite in the absence and presence of SEG and AX under different pH conditions (SEG: 197 mg/L, AX: 16 mg/L).
Figure 9.
Zeta-potential of (a) chalcopyrite and (b) molybdenite in the absence and presence of SEG and AX under different pH conditions (SEG: 197 mg/L, AX: 16 mg/L).

Figure 10.
FT-IR spectra of (a) SEG and (b) these two minerals before and after interacting with the SEG system and (c) the amplified spectrum of molybdenite from 830 to 1700 cm−1.
Figure 10.
FT-IR spectra of (a) SEG and (b) these two minerals before and after interacting with the SEG system and (c) the amplified spectrum of molybdenite from 830 to 1700 cm−1.


Table 1.
Experimental range and levels of the independent variables. SEG: seaweed glue.
| Independent Variables | Codes | Ranges and Levels | ||
|---|---|---|---|---|
| −1 | 0 | 1 | ||
| Initial pH | X1 | 3 | 50 | 10 |
| SEG dosage (mg/L) | X2 | 7.5 | 175 | 55 |
| AX dosage (mg/L) | X3 | 12 | 300 | 100 |
Table 2.
The partially experimental design matrix as suggested by Design-Expert Software.
| Run | Factor 1 A: pH | Factor 2 (mg/L) B: SEG | Factor 3 (mg/L) C: AX | Response 1 (%) Chalcopyrite Recovery | Response 2 (%) Molybdenite Recovery |
|---|---|---|---|---|---|
| 1 | 12 | 300 | 55 | 66.21 | 21.01 |
| 2 | 12 | 175 | 10 | 73.32 | 16.21 |
| 3 | 7.5 | 175 | 55 | 84.76 | 22.31 |
| 4 | 7.5 | 175 | 55 | 84.34 | 22.19 |
| 5 | 12 | 50 | 55 | 82.98 | 37.16 |
| 6 | 12 | 175 | 100 | 79.12 | 29.56 |
| 7 | 7.5 | 300 | 10 | 69.98 | 4.87 |
| 8 | 3 | 300 | 55 | 86.78 | 12.98 |
| 9 | 7.5 | 50 | 10 | 85.98 | 25.98 |
| 10 | 7.5 | 175 | 55 | 85.34 | 22.10 |
| 11 | 3 | 50 | 55 | 98.89 | 27.01 |
| 12 | 7.5 | 175 | 55 | 84.89 | 21.21 |
| 13 | 7.5 | 175 | 55 | 85.21 | 21.54 |
| 14 | 7.5 | 50 | 100 | 89.34 | 34.99 |
| 15 | 3 | 175 | 10 | 95.21 | 21.01 |
| 16 | 7.5 | 300 | 100 | 71.16 | 21.42 |
| 17 | 3 | 175 | 10 | 93.65 | 5.98 |
Table 3.
ANOVA for response surface quadratic model (Cu/Mo).
| Source | F Value (Cu/Mo) | Prob > F (Cu/Mo) | |
|---|---|---|---|
| Mode | 1313/138.0 | <0.0001 | |
| X1-pH | 1491/22.87 | <0.0001/0.002 | |
| X2-SEG | 1031/120.5 | <0.0001 | |
| X3-AX | 19.3/75.3 | 0.003/<0.0001 | |
| X12 | 16.1/1.25 | 0.005/0.32 | |
| X13 | 27.3/3.13 | 0.001/0.12 | |
| X23 | 2.39/14.43 | 0.166/0.006 | |
| Lack of fit (F) | 3.28/4.21 | Lack of fit (P) | 0.056/0.030 |
| R2 | 0.99/0.99 | Radj2 − Rpred2 | 0.027/0.066 |
| C.V.% | 0.84/4.60 | Adeq precisor | 65.21/43.73 |
Table 4.
Predicted and experimental values of the responses of optimum conditions.
| Initial pH | SEG Dosage (mg/L) | AX Dosage (mg/L) | Cu/Mo Recovery (%) | |
|---|---|---|---|---|
| Predicted Value | Experimental Value | |||
| 4.07 | 197.38 | 16.32 | 95.11/7.99 | 93.21/6.98 |
© 2018 by the authors. Licensee MDPI, Basel, Switzerland. This article is an open access article distributed under the terms and conditions of the Creative Commons Attribution (CC BY) license (http://creativecommons.org/licenses/by/4.0/).
Share and Cite
MDPI and ACS Style
Chen, Z.; Gu, G.; Li, S.; Wang, C.; Zhu, R. The Effect of Seaweed Glue in the Separation of Copper–Molybdenum Sulphide Ore by Flotation. Minerals 2018, 8, 41. https://doi.org/10.3390/min8020041
AMA Style
Chen Z, Gu G, Li S, Wang C, Zhu R. The Effect of Seaweed Glue in the Separation of Copper–Molybdenum Sulphide Ore by Flotation. Minerals. 2018; 8(2):41. https://doi.org/10.3390/min8020041
Chicago/Turabian StyleChen, Zhixiang, Guohua Gu, Shuangke Li, Chongqing Wang, and Renfeng Zhu. 2018. "The Effect of Seaweed Glue in the Separation of Copper–Molybdenum Sulphide Ore by Flotation" Minerals 8, no. 2: 41. https://doi.org/10.3390/min8020041
Note that from the first issue of 2016, this journal uses article numbers instead of page numbers. See further details here.