Article

Structural and Electronic Properties of Different Terminations for Quartz (001) Surfaces as Well as Water Molecule Adsorption on It: A First-Principles Study

1
College of Resources and Environmental Engineering, Guizhou University, Guiyang 550025, China
2
College of Mining, Guizhou University, Guiyang 550025, China
3
National & Local Joint Laboratory of Engineering for Effective Utilization of Regional Mineral Resources from Karst Areas, Guiyang 550025, China
4
Guizhou Key Laboratory of Comprehensive Utilization of Non-Metallic Mineral Resources, Guiyang 550025, China
*
Author to whom correspondence should be addressed.
Minerals 2018, 8(2), 58; https://doi.org/10.3390/min8020058
Submission received: 6 December 2017 / Revised: 4 February 2018 / Accepted: 5 February 2018 / Published: 9 February 2018
(This article belongs to the Special Issue Molecular Simulation of Mineral-Solution Interfaces)

Abstract

:
Structural and electronic properties of Si termination, O-middle termination, and O-rich terminations of a quartz (001) surface as well as water molecule adsorption on it were simulated by means of density functional theory (DFT). Calculated results show that the O-middle termination exposing a single oxygen atom on the surface is the most stable model of quartz (001) surface, with the lowest surface energy at 1.969 J·m−2, followed by the O-rich termination and Si termination at 2.892 J·m−2 and 2.896 J·m−2, respectively. The surface properties of different terminations mainly depend on the surface-exposed silicon and oxygen atoms, as almost all the contributions to the Fermi level (EF) in density of states (DOS) are offered by the surface-exposed atoms, especially the O2p state. In the molecular adsorption model, H2O prefers to adsorb on the surface Si and O atoms, mainly via O1–H1 bond at 1.259 Å and Si1–Ow at 1.970 Å by Van der Waals force and weak hydrogen bond with an adsorption energy of −57.89 kJ·mol−1. In the dissociative adsorption model, the O-middle termination is hydroxylated after adsorption, generating two new Si–OH silanol groups on the surface and forming the OwH2···O4 hydrogen bond at a length of 2.690 Å, along with a large adsorption energy of −99.37 kJ·mol−1. These variations in the presence of H2O may have a great influence on the subsequent interfacial reactions on the quartz surface.

Graphical Abstract

1. Introduction

Quartz is an important mineral that has wide applications as a raw material in various fields in industry, such as glass, ceramics, and medicine [1,2,3]. It is the main component mineral of a series of important mineral resources such as siliceous phosphate ore, iron ore, tungsten ore, fluorite, and mica. Flotation is a widely accepted way to separate and utilize these ore resources based on the difference in wettability (hydrophilic and hydrophobic characteristics at a macroscopic-level) of the mineral particle surfaces by froth, which occurs at the interfaces of solid/air/water in the solution [4,5]. Furthermore, the surface chemical activities of minerals in flotation has a close relationship with its surface structure and properties. Therefore, it is crucial to accurately determine the mineral surface structure so that one can understand its interactions well with other molecules, such as water [6], calcium hydroxyl ions [7], and flotation reagents [5,8,9].
The surface structures and characteristics of quartz crystal have been investigated extensively using traditional means of analysis technologies, such as X-ray diffraction [10], scanning electron microscope [11], and photoelectron spectrum [12], but these studies have failed to offer more detailed surface structural and electronic properties at the level of electron and atom due to the limited resolution or accuracies of the above analysis methods. Even though atomic force microscopy can provide an overall characterization of the surface topography of a quartz (001) surface on a nanometer scale [13] and offer images of synthetically grown-quartz (0001) surfaces [14], it still fails to further determine the detailed microstructure of the exposing atoms on surface. With the development of quantum chemistry theory and computer technology, DFT calculations based on first principles have been widely used in acquiring the micro-structural information of various minerals with high accuracy, such as clay minerals [15,16,17], iron minerals [18], and sulfide minerals [19,20]. These studies have provided a theoretical basis for the quantitative interpretation of mineral properties.
In going from a bulk crystal to a surface, the atoms along the cleaved plane experience a loss of coordination, and this can manifest in new features in the electronic structure, as demonstrated in DFT studies in the literature [21,22]. Many researchers have focused on the surface properties of cleaved quartz using computational methods, and the consensus is that the (001) surface is the thermodynamically predominant plane [23,24,25,26]. Meanwhile, even for the single (001) plane, there are many possible terminations that are distinct in terms of the identity and number of terminal atoms. When the surface is in contact with an aqueous phase, water adsorption and dissociation processes can further modify the surface structure. As structure and composition affect reactivity, different surface terminations can thus exhibit unique properties, which go on to influence the bonding interactions with adsorbates [21,22,27].
While it is well-known that a mineral’s surface structure is transformed by contact with water, previous studies have investigated the interaction of flotation reagents with the surface modeled in the structure found under ultra-high vacuum conditions [28,29,30,31]. This may not be a realistic representation of the flotation process, as the reactivity of interest is actually occurring at a differently structured mineral–water interface. Therefore, the influence of water on the surface should also be investigated [7,32,33]. The quartz–water interface has been studied using molecular dynamics simulations (MDS), yielding information about how the surface was transformed by the presence of water [34,35,36,37]. However, a molecular-level understanding of the adsorption process and mechanism, such as that which can be attained through DFT modeling, is still lacking.
In this paper, DFT calculations are carried out on the Si, O-middle, and O-rich terminations of a simulated (001) quartz surface. After each termination is geometry-optimized against a vacuum, the interaction of the most stable termination with water is investigated. The DFT results are analyzed in terms of energy, surface geometry, and electronic properties. As such, the information reported here contributes to a fundamental understanding of the ubiquitous quartz surface, which is of interest to those in the field of mineralogy as well as those interested in the many industrial applications of quartz. In particular, the results about the quartz–water interface are critical to understanding reagent adsorption and other surface-mediated processes occurring at the quartz–water interface.

2. Computational Method and Model

2.1. Computational Method

Calculations have been made using the Cambridge Serial Total Energy Package (CASTEP) [38] in the TCM Group of the Cavendish Laboratory in Cambridge, UK. CASTEP implements DFT using periodic boundary conditions and a planewave basis set [39]. Calculations in this study used ultrasoft pseudopotentials to model the electron–nucleus interactions at reduced computational cost [40]. The convergence tolerances for geometry optimization calculations were set to a maximum displacement of 0.002 Å, a maximum force of 0.05 eV·Å−1, a maximum energy change of 2.0 × 10⁻⁵ eV·atom−1, and a maximum stress of 0.1 GPa, and the SCF convergence tolerance was set to be 2.0 × 10⁻⁶ eV·atom−1. The valence electron configurations considered in the work are Si 3s23p2, O 2s22p4, and H 1s1. Before adsorption, the H2O was placed inside a 10 Å × 10 Å × 10 Å cubic cell for an optimization calculation. Computational parameters such as the planewave basis set cutoff energy and k-point sample were tested for convergence.

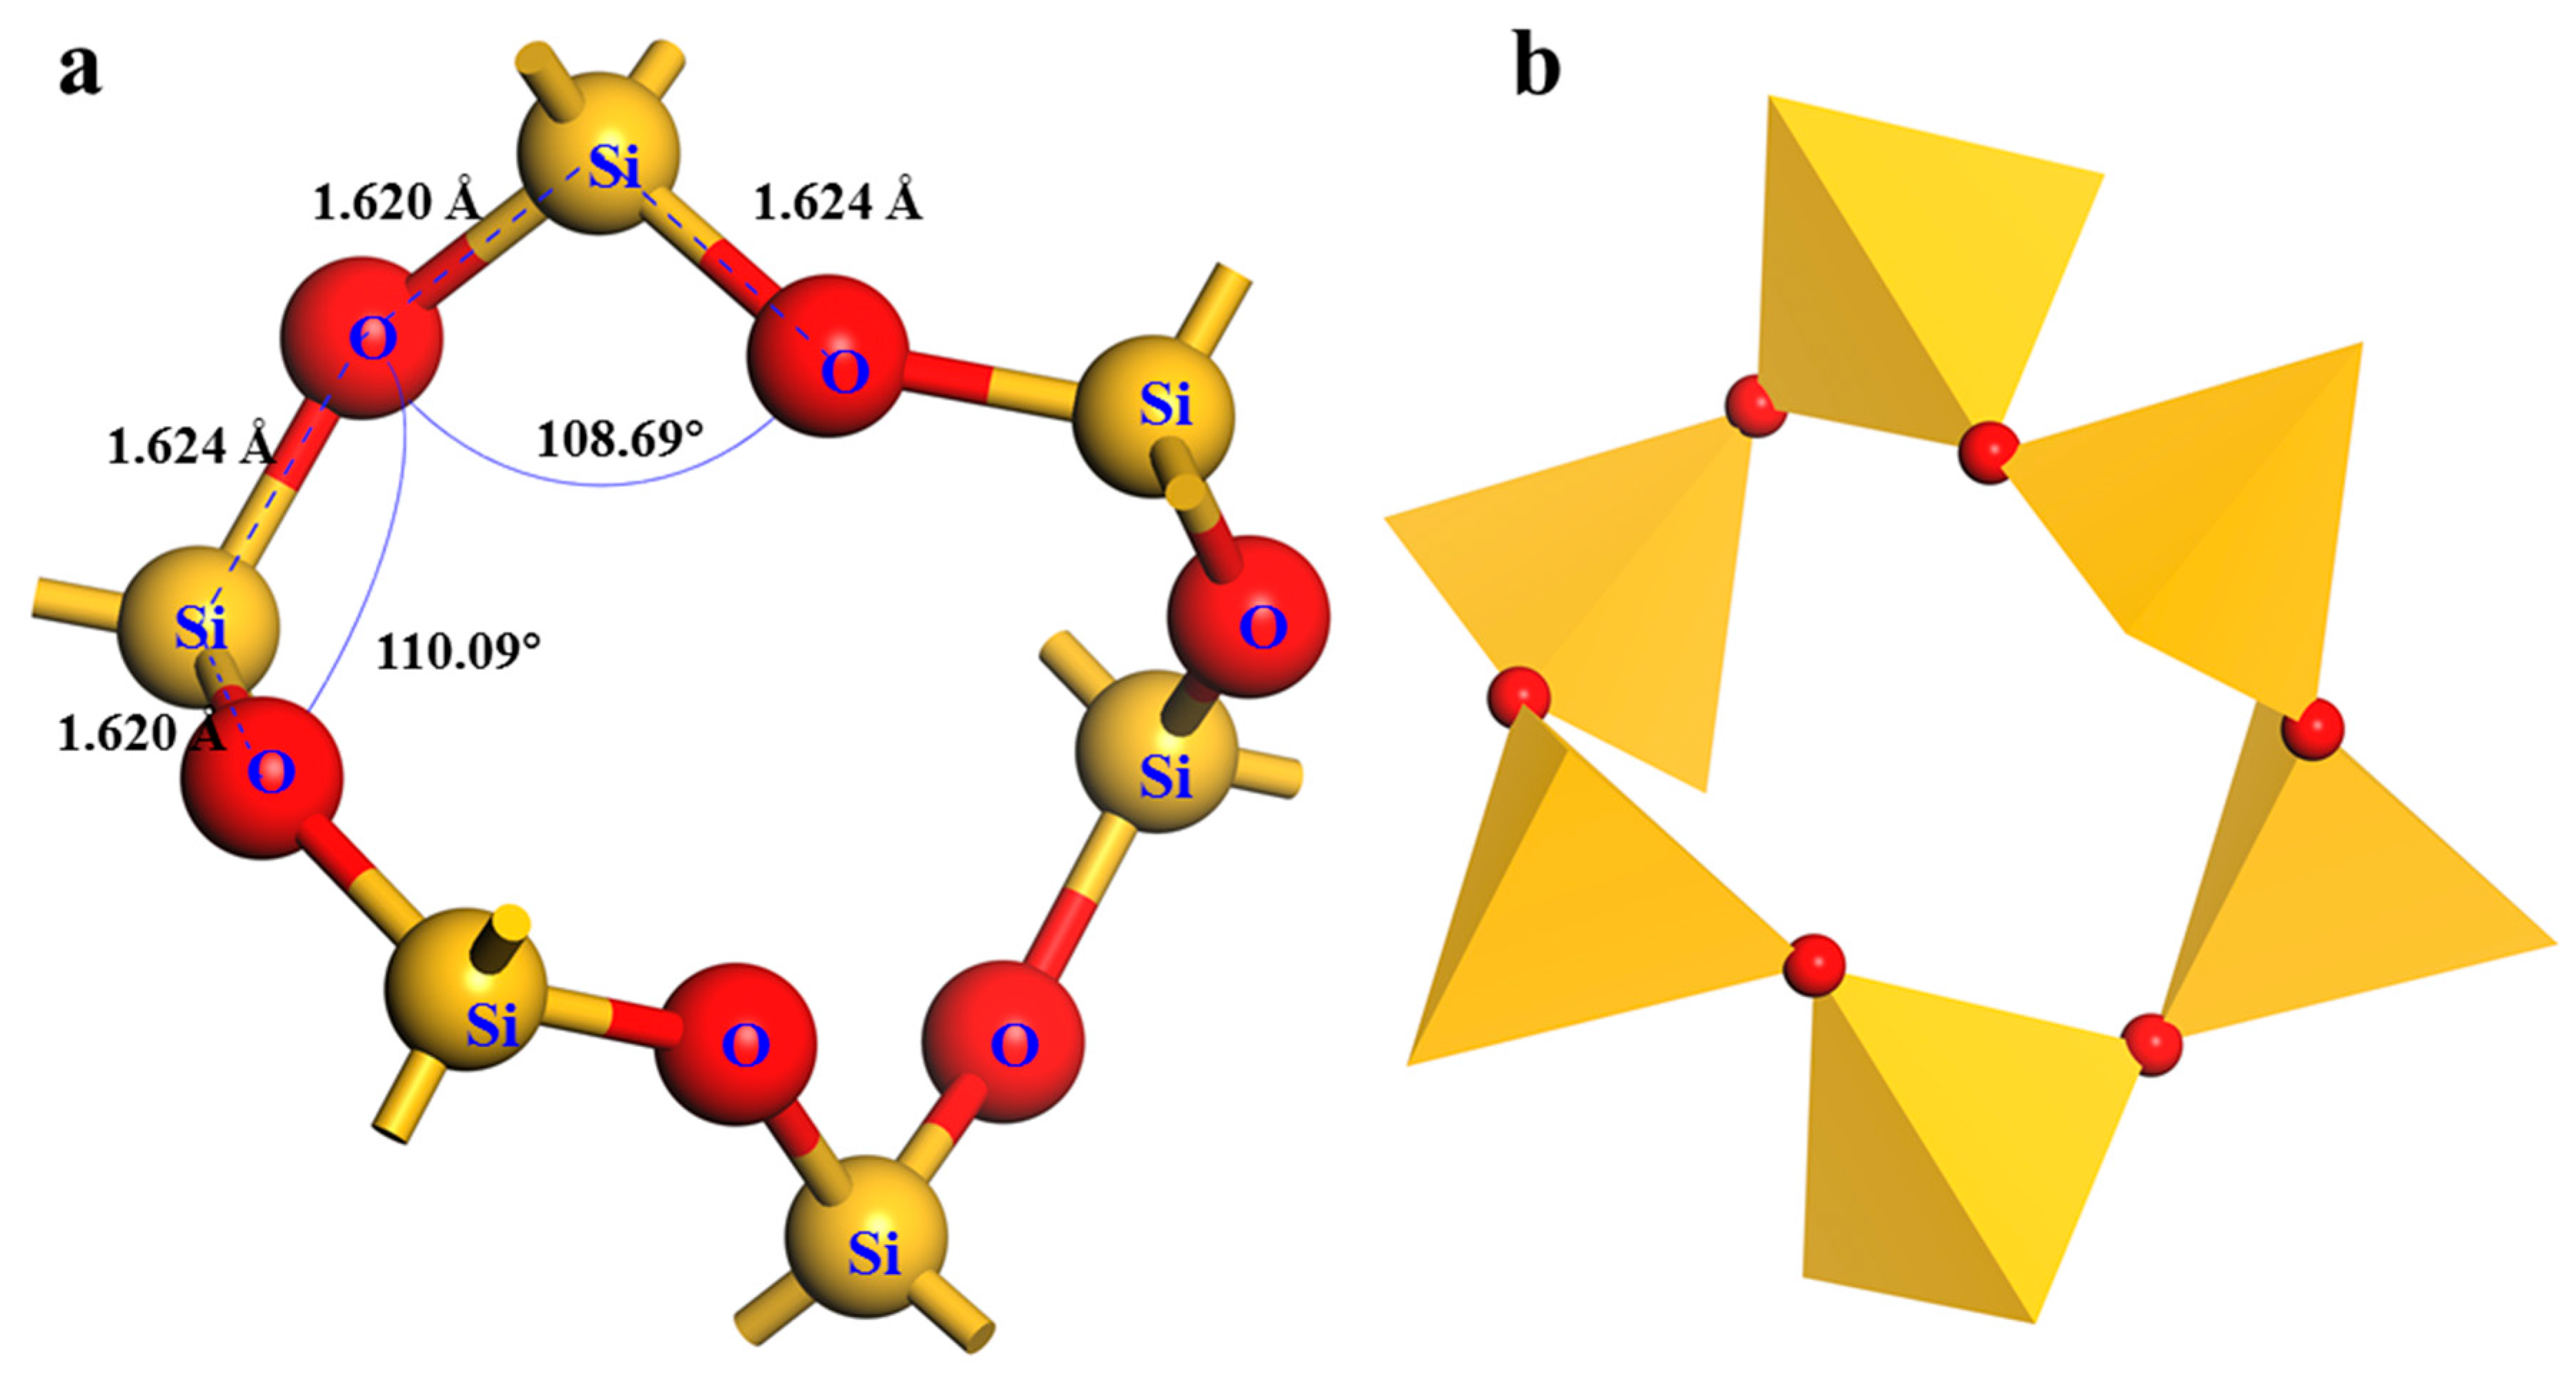
2.2 Quartz Crystal Cell Optimization

The quartz crystal space group D 3 6 P 3 2 21 belongs to a rhombohedral system with the starting unit cell parameters of a = b = 4.973 Å, c = 5.469 Å, α = β = 90.0°, and γ = 120.0° (see Figure 1). It is comprised of the structures of silicon oxygen tetrahedron, and the silicon atom was located at the tetrahedron center. Each silicon atom was coordinated with four oxygen atoms. The angles of O–Si–O were 110.1° and 108.7°, and the bond lengths of Si–O were 1.620 Å and 1.624 Å.
A bulk quartz cell was modeled to form a basis for the subsequent surface calculations. The dependence of the rationality of the quartz unit-cell on exchange-correlation functionals selection, the k-point set mesh, and cutoff energy was tested. Afterwards, the calculated crystal lattice parameters were compared with experimental values to determine the validity of the computed quartz crystal cell. After geometry optimization, the exchange correlation functional used was the generalized gradient approximation (GGA) developed via the Perdew–Wang generalized-gradient approximation (PW91) [41], and kinetic energy cutoff was set at 360 eV, and a 5 × 5 × 4 grid was chosen for all structure calculations. The quartz cell parameters obtained after minimization were a = b = 4.964 Å, c = 5.470 Å, with deviations of 0.14% and 0.02%, respectively, compared with experiment values [42]. This showed that the calculation conditions chosen were sufficient for the system, and the method was credible for the subsequent calculations. More detailed data for the above geometry optimization of bulk cell is provided in the supplementary material.

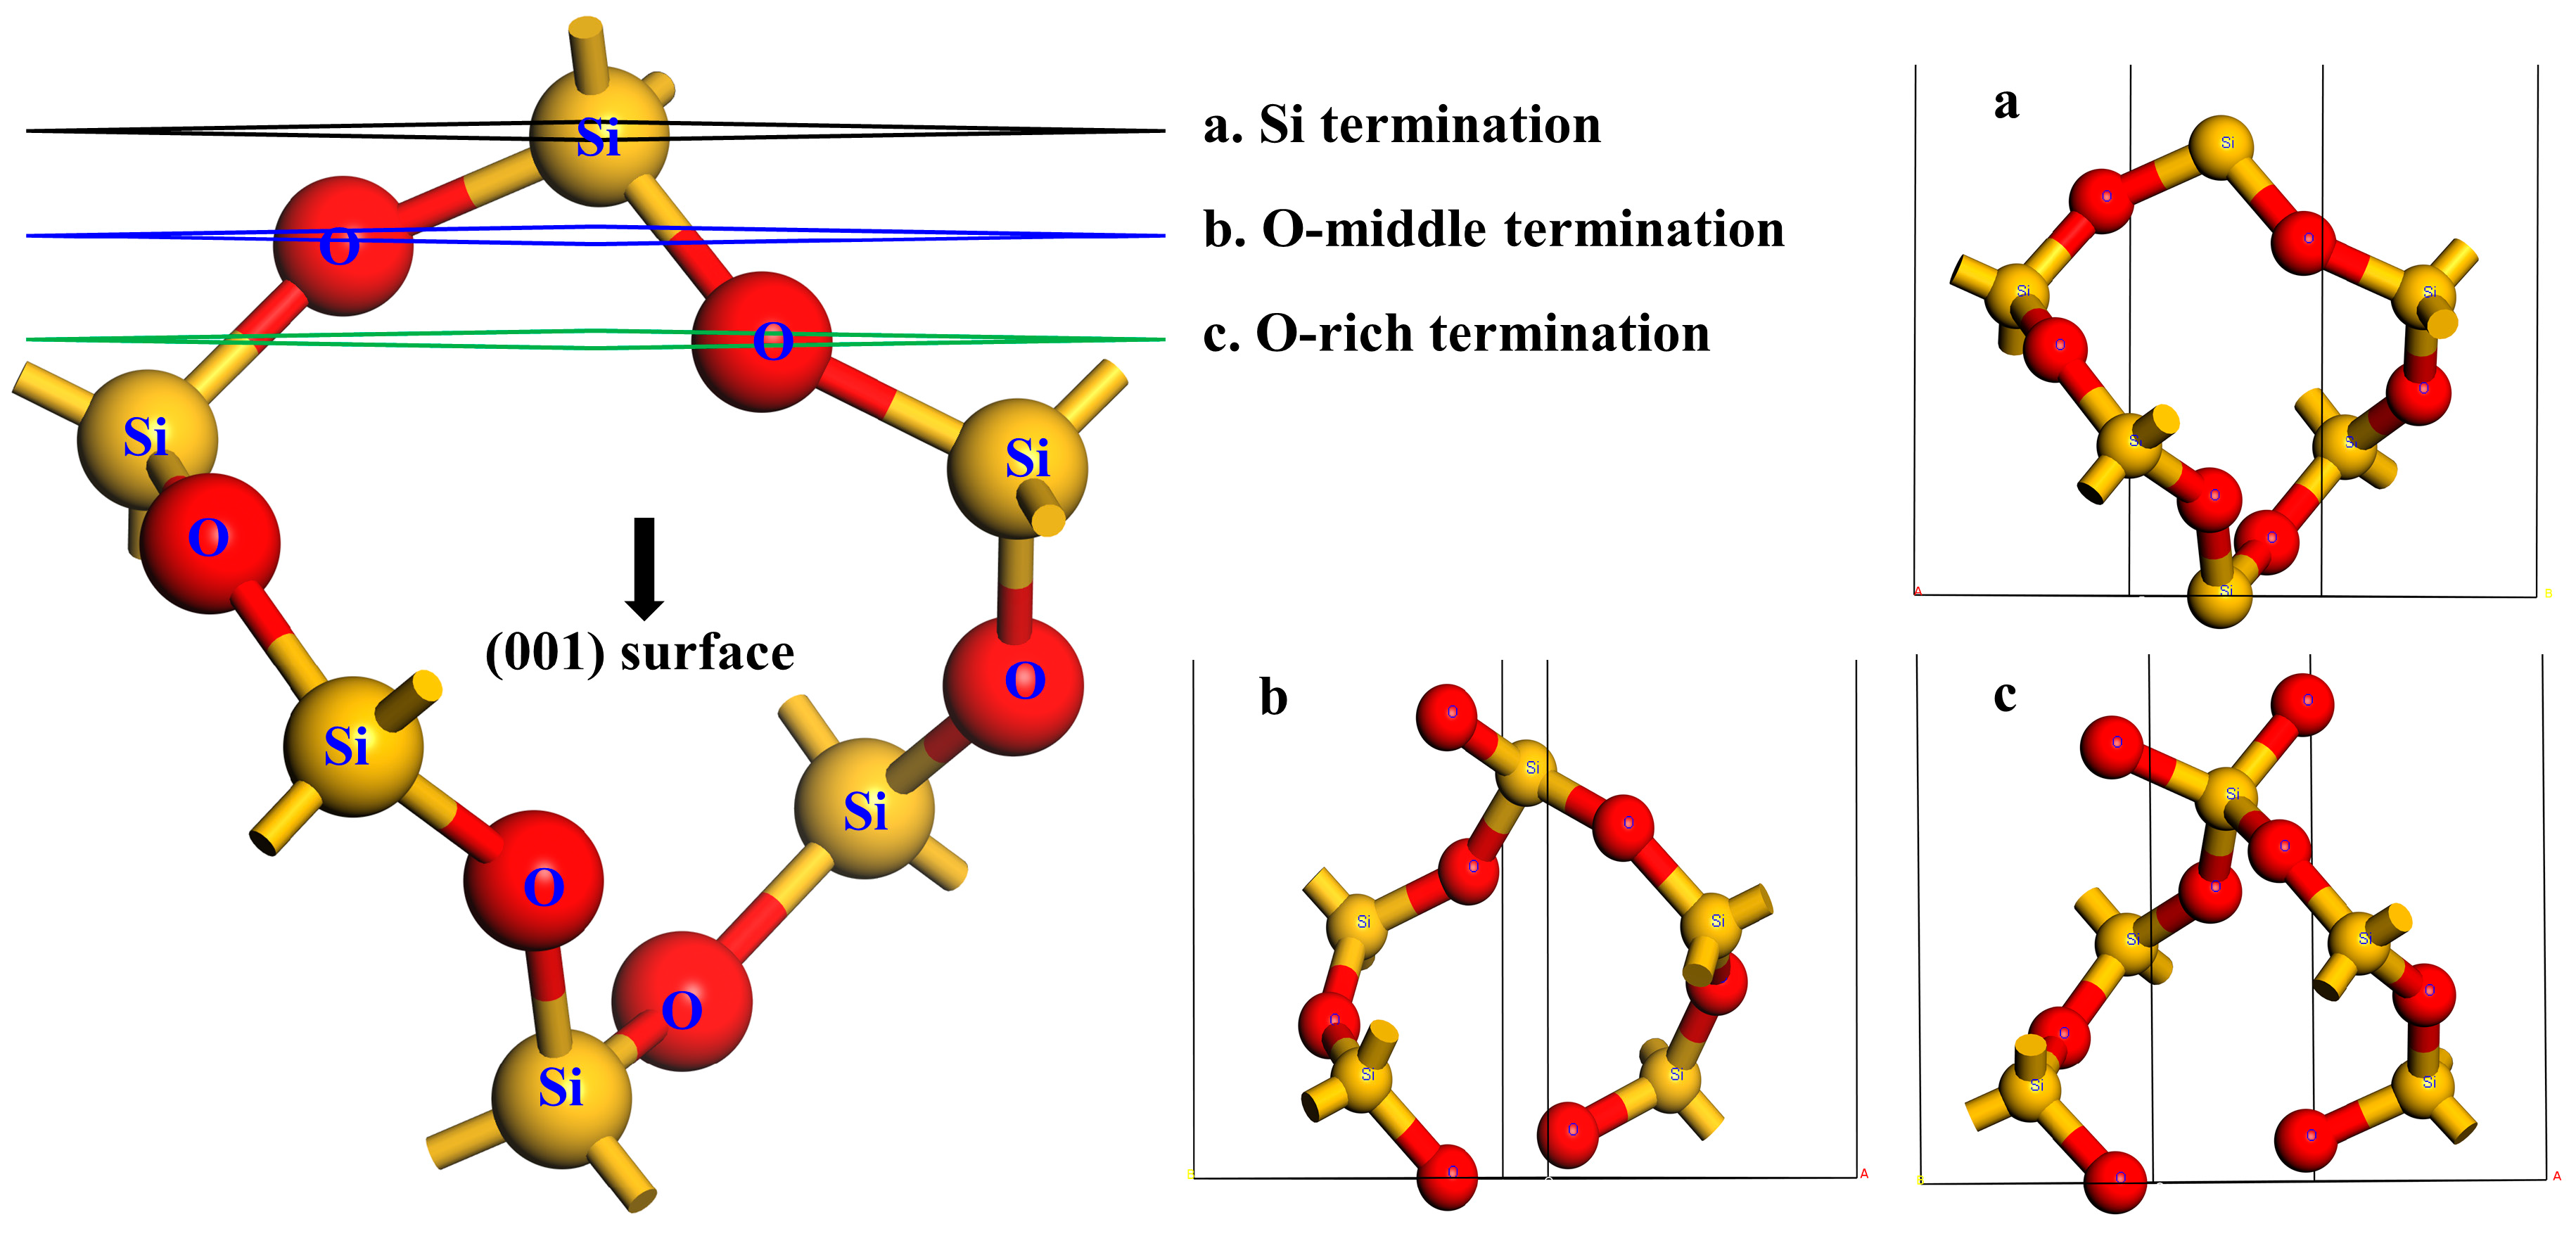
2.3. Surface Models and Calculation of Surface Energy

The quartz (001) surface was cleaved on the basis of an optimized 1 × 1 bulk structure. The (001) cleave plane forms three different exposed atoms, as shown in Figure 2. The cleaved surfaces are formed by breaking Si–O bonds to generate highly reactive Si and Si–O free radical species. The Si termination exposes a single silicon atom with double coordination bonds (Figure 2a), the O-middle termination exposes an oxygen atom with a single coordination and a silicon atom with three coordination bonds (Figure 2b), and the O-rich termination exposes two oxygen atoms both with a single coordination bonded with the first silicon atom with four coordination bonds (Figure 2c). The (1 × 1) terminations were used to test for a suitable number of atomic layers to create the slab model and to determine a sufficient vacuum thickness to prevent interactions between periodic images in the direction of the surface normal. For both the surface slab models and the H2O molecule adsorption surface, the eight outermost atomic layers of the substrate were allowed to relax, while the 10 bottom-most atomic layers of the substrate were fixed to the bulk coordinates.
The surface energy ( E s u r f ) is the required energy to cleave the crystal into two independent surfaces in the crystal direction of the crystal cleavage under the action of external force, which is dependent on the interaction of surface atoms and closely related with the geometrical structure of the surface atoms. For surface systems without external force, the total surface energy of the system tends to be minimized. The E s u r f of creating the cleaved surface can be estimated by the following relation [27]:
E s u r f = ( E s l a b N · E b u l k ) / 2 S
where E s l a b is the energy of the corresponding slab; E b u l k is the energy of bulk crystal; N is the number of bulk units in the slab; S is the surface area of cell. The smaller the surface energy is, the higher the surface stability is.
It is quite necessary to test the atomic layer number and vacuum thickness to obtain the relative stable surface models of different terminations. Table 1 and Table 2 show the influence of the atomic layer number and vacuum thickness on the surface energy of three different terminations of the quartz (001) surface, respectively.
From the results of Table 1 and Table 2, it is obvious that the changes in surface energy for the different terminations are not very noticeable after simulation, which indicates that the testing range of the atomic layer number and vacuum layer thickness set in the calculation were reasonable, and the three terminations all showed a certain stability. For all of the surface terminations, it was determined that 18 atomic layers and 15 Å of vacuum is sufficient to converge the calculated surface energy. Based on convergence studies, structures for the three different surface terminations of quartz (001) were generated, as shown in Figure 3, with the atomic layers identified.

3. Results and Discussion

3.1. Surface Structural and Electronic Properties of Different Terminations for Quartz (001) Surface

3.1.1. Surface Energy

It is generally known that the lower the surface energy is, the more stable the surface is [21]. Among the three terminations, the O-middle termination has the lowest surface energy at 1.969 J·m−2. Cleaving on this termination needs less energy than that of any other surfaces, which indicates that it is likely to be the most stable termination model of the quartz (001) surface by DFT calculation. The surface energies of Si termination and O-rich termination are higher at 2.896 J·m−2 and 2.892 J·m−2, respectively, showing the consistent surface stability. The DFT calculated values for the surface energy provides some guidance as to what surface termination is the most thermodynamically stable. However, as the DFT total energies are modeled at 0 K, effects such as temperature and pressure are neglected. Furthermore, it is possible that, in the real system, metastable surface terminations may be kinetically stabilized. Therefore, there are practical limitations to the interpretation of the DFT predictions based on the surface energies. Next, we calculated the surface relaxation, surface atomic Mulliken charge distribution, Mulliken bond population, and density of states to further investigate the property differences of the three terminations.

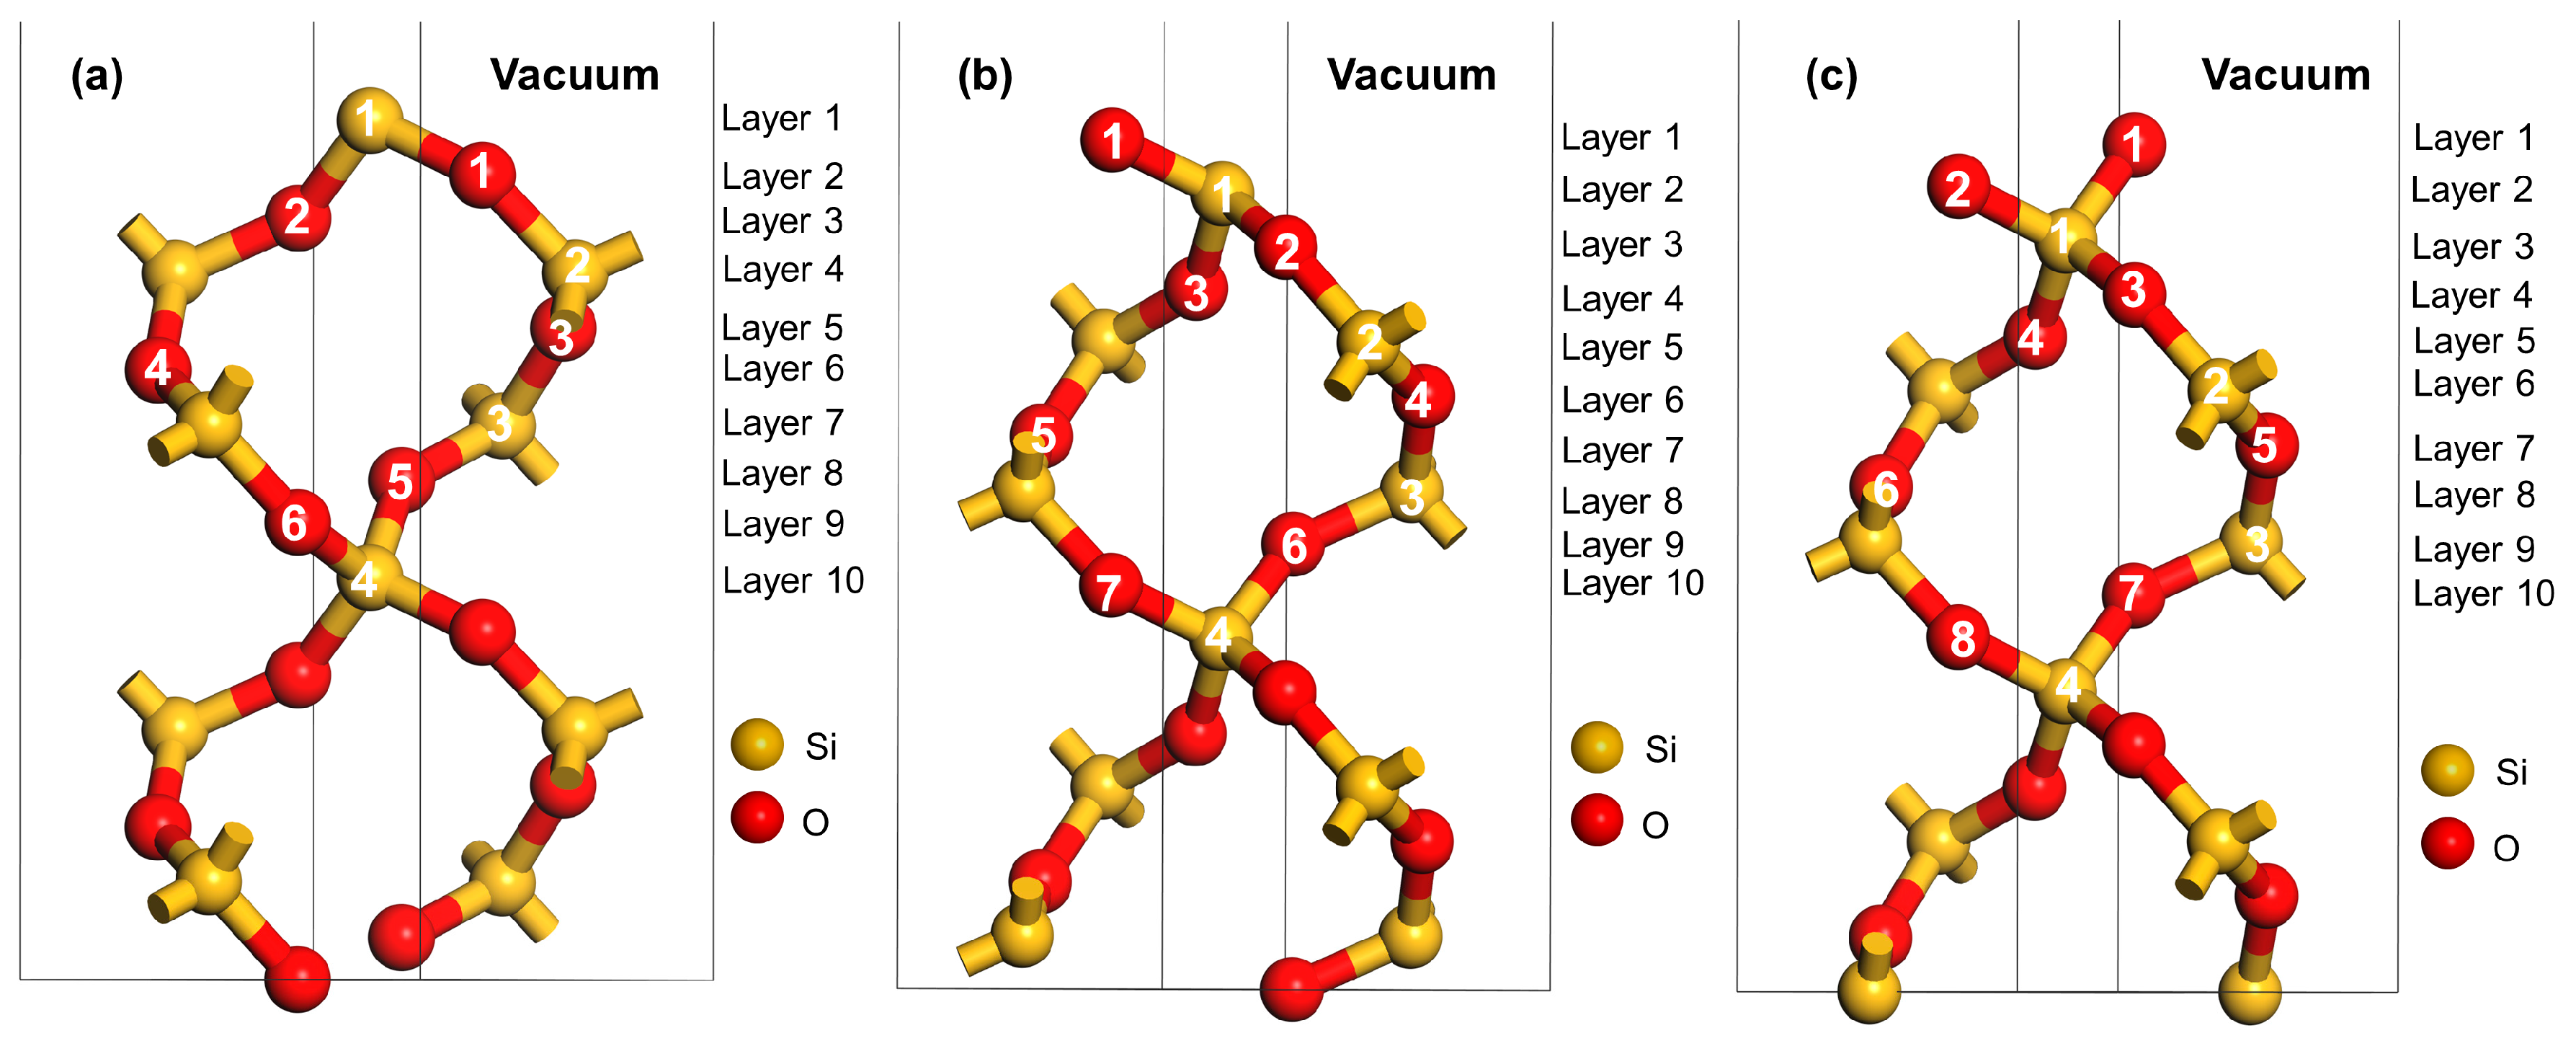
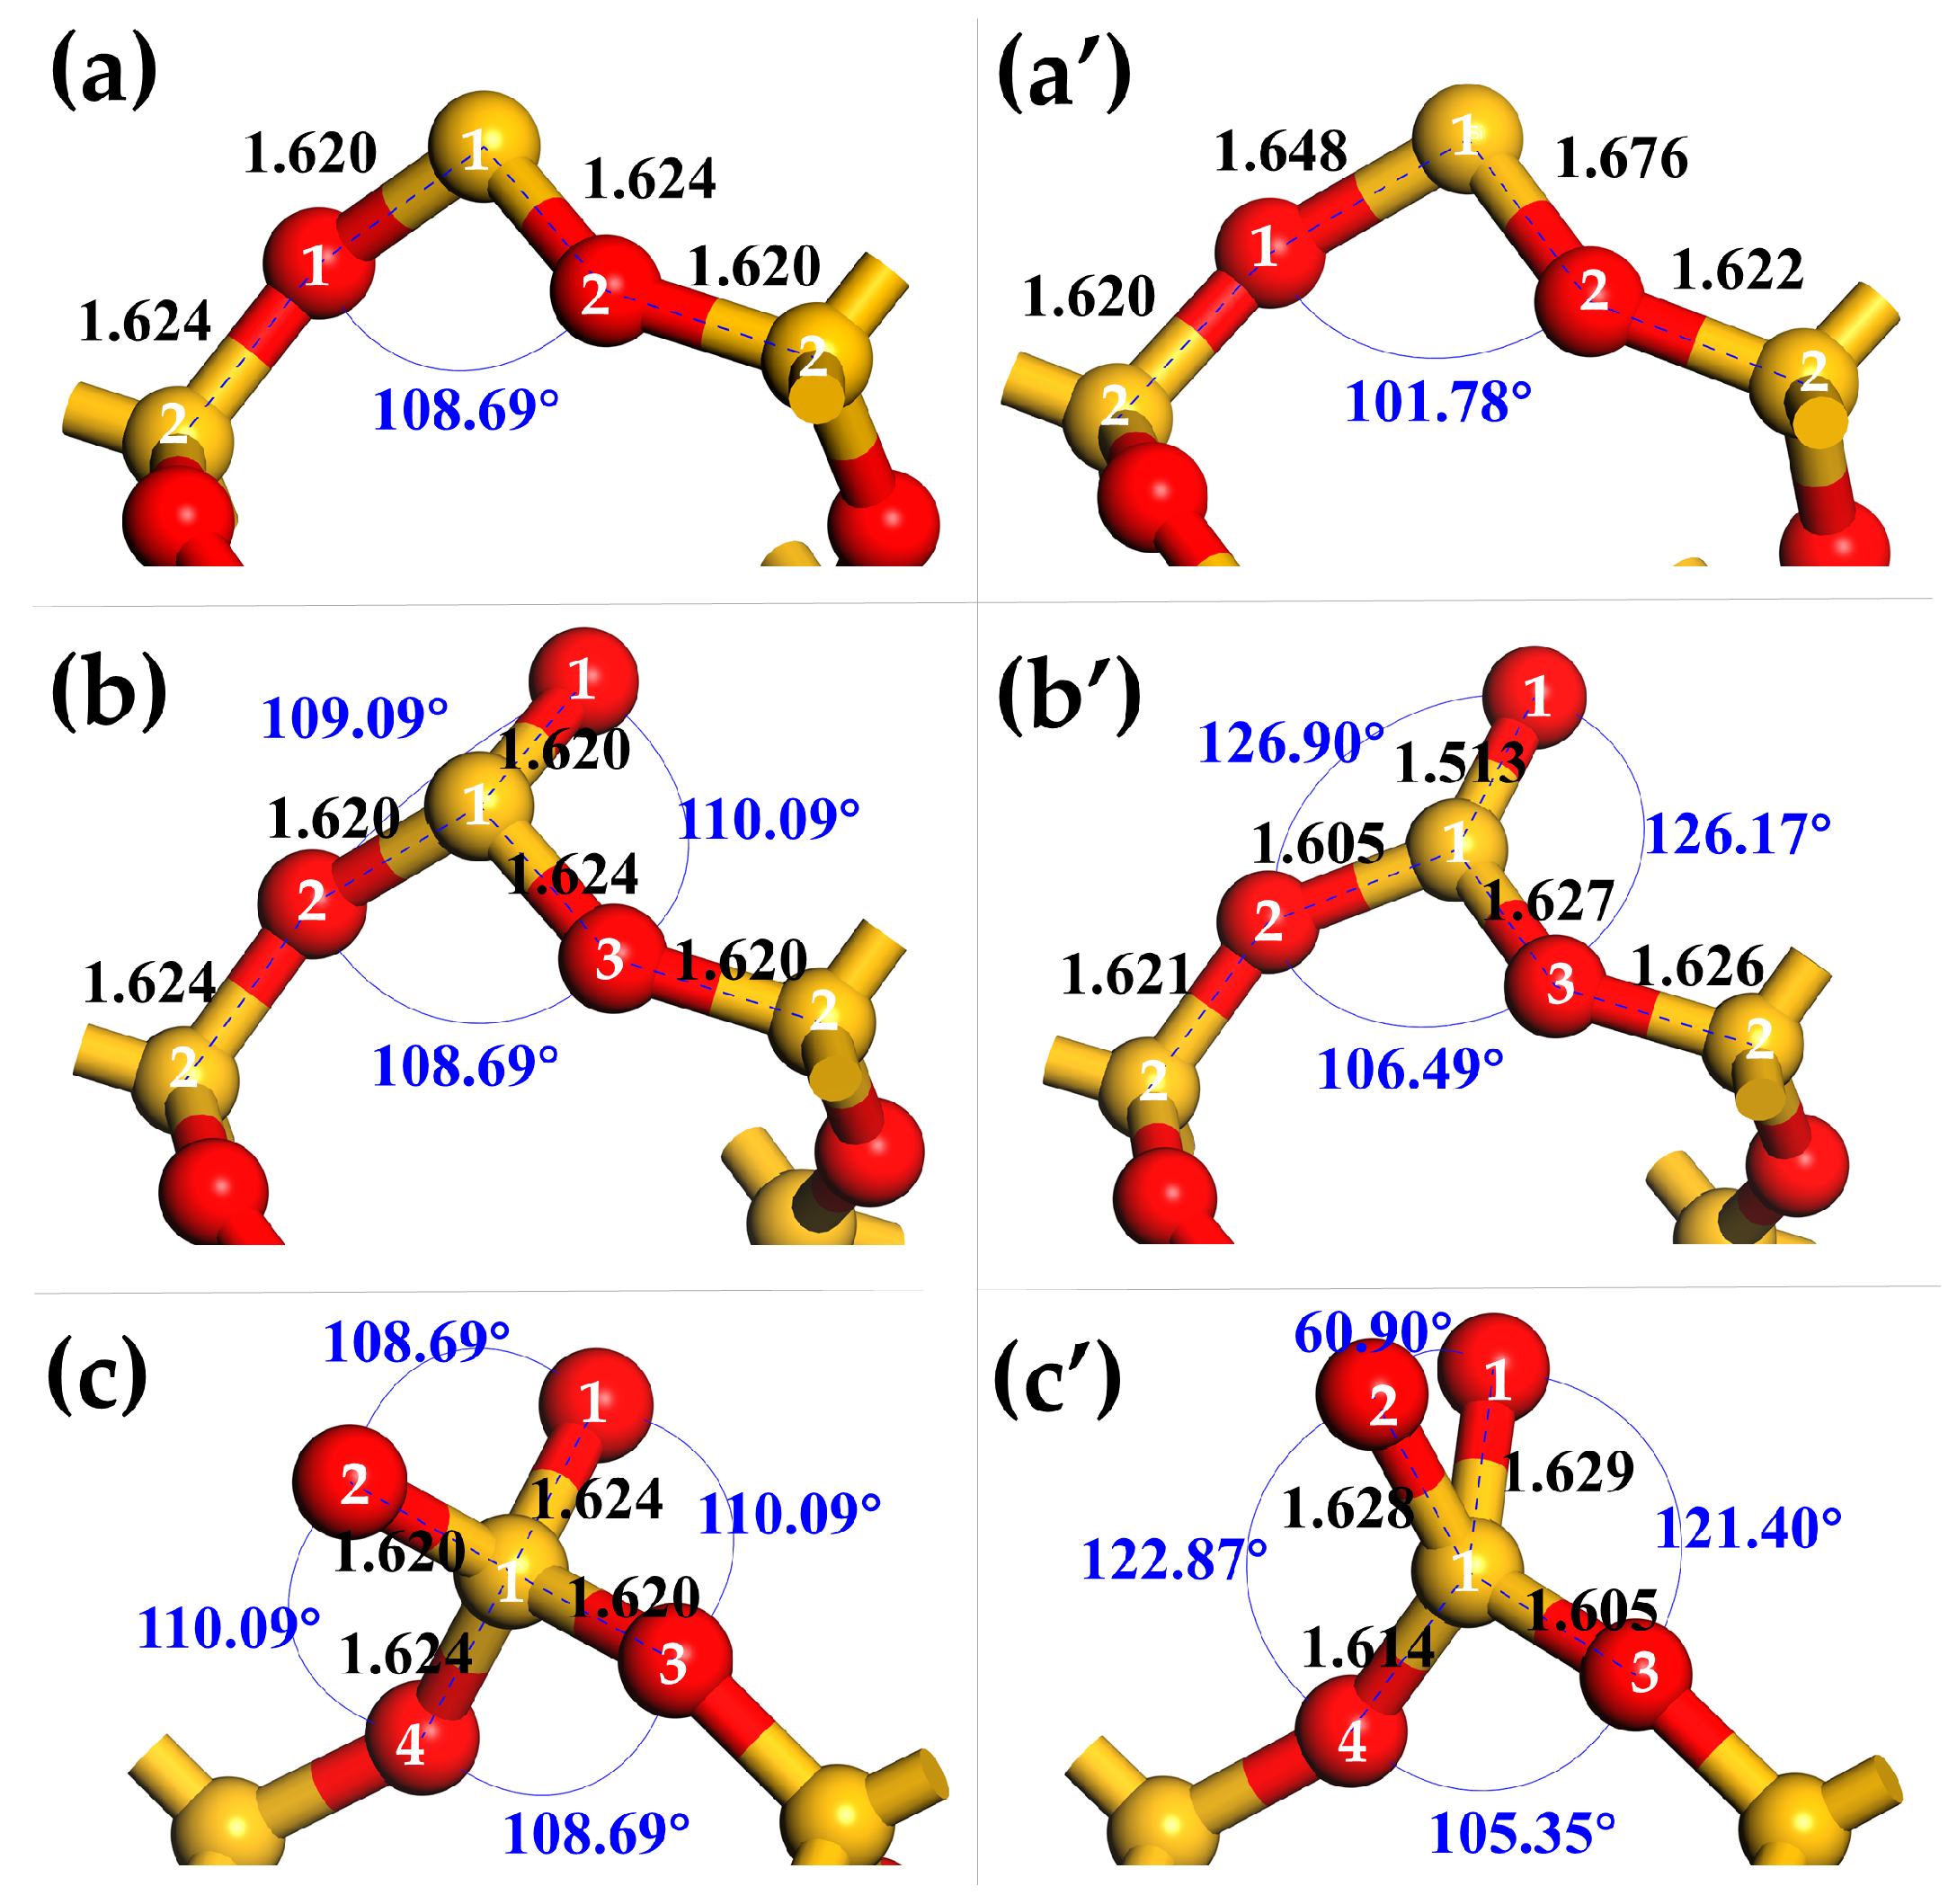
3.1.2. Surface Relaxation

In going from the bulk to a surface structure, the coordination number of the exposed atoms changes, and it is expected that the outermost atoms will undergo inward relaxations to recover a stable bonding environment. This is called the relaxation of minerals surface atoms. The relaxation formula is as follows [22]:
Δ Z = Z i Z i ,   b u l k a × 100 %
where the Z i represents the corresponding atomic coordinate of Si and O atoms in the i-th layer after the relaxation; Z i ,   b u l k denotes the bulk atomic coordinate of Si and O atoms in the i-th layer, which was established by the bulk of quartz after the geometry optimization; a refers to the bulk lattice parameter along the z-axis before geometry optimization.
The atomic displacements and coordination of three different terminations of the quartz (001) surface are given in Table 3. The displacements of surface silicon and oxygen atoms in the top three layers changed in variety after relaxation duo to the dangling bond on the surface. They move toward or away from the bulk in the direction of the x-, y-, and z-axes. In the special ring structure of the silicon oxygen tetrahedron of quartz, the atoms of the top three layers show a certain stretching effect on the atoms under them, with the result that some atoms in the bulk layer that bonded with them also have different degrees of contraction relaxation. The surface structure of different terminations before and after relaxation from the same side view are shown in Figure 4 as the direct display of relaxation results.
For the Si termination, the Si1 atom only shows a displacement along the x-axis (−2.76%), and the overall structural relaxation degree is relatively low. This may be because the full ring structure of silicon oxygen tetrahedron show a strong binding and stretching effect on the Si atom in it. For the O-middle termination, the O1 and Si1 atoms have dangling bonds, and they show the reverse displacement along the x- and z-axes. The first O1 atom has a small displacement along the z-axis at 0.20% away from the bulk, while the Si1 atom bonded with it has an opposite displacement along the z-axis at −0.18% toward the bulk. Additionally, the Si1 atom also has a large displacement along the x-axis at −1.81% and a slight displacement along the y-axis at −0.77%. The displacements of O-middle termination atoms are larger than that of Si termination. For the O-rich termination, the top O1 and O2 atoms have large displacements toward the opposite direction, and the major movement is along the x-axis direction (respectively at −2.24% and at 2.11%). The O2 atom also has a relative obvious displacement along the y-axis at 0.49% compared with that of the O1 atom at 0.06%. Furthermore, the O1 and O2 atoms has a slight displacement along the z-axis, respectively, at −0.11% for the O1 atom toward the bulk and 0.21% for the O2 atom away from the bulk. Over all, the O-rich termination is the most obvious one in all three terminations, and it can be seen directly from Figure 4 that the exposing two O atoms in double dangling Si–O bonds show a larger angle rotation around the central Si1 atom, adjusting the spacing of the atoms and rearranging the electron distribution. The angles of O–Si–O on the surface changed substantially; in particular, the angle of O–Si–O decreased from 108.69° to 60.90°.

3.1.3. Surface Atomic Mulliken Charge Distribution

In the Mulliken scheme of charge partitioning, the charges in the overlap region are distributed evenly between the relevant atomic orbitals. This is a relatively simple and effective method, but also has its shortcomings, since the charge apparently tends to be distributed to the atoms with high electronegativity in the actual process. Additionally, it is also pointless to compare the absolute values of the atomic Mulliken charge simply, as the Mulliken charge is quite sensitive to the chosen basis set, and different basis sets vary greatly [43]. Even so, the results obtained under the same basis set conditions still make sense when the relative values of the Mulliken atomic charges are compared, which has been widely used as an efficient method to describe the charge transfer and bond strengths between different atoms [7,20,33,44]. In this section, the Mulliken atomic charge populations of surface atoms in each termination are calculated and compared with those of the bulk (Table 4).
It can be seen that the Mulliken atomic charges populations of Si and O atoms on the surface layers are different from the bulk after relaxation. For the Si termination, 2s and 2p states of the Si1 atom gain electrons from 0.57 to 1.66 and from 1.07 to 1.14, respectively, and the overall charge reduction 1.16 e varies from +2.36 to +1.20 e, and the charges of the O1 and O2 atoms each reduce 0.01 e. For the O-middle termination, the O1 atom gains electrons 0.11 at 2s states and loses electrons 0.25 at 2p states, respectively. The overall charge reduction 0.14 e varies from −1.18 e to −1.04 e, while the overall charge of the Si atom reduction 0.16 e varies from +2.36 to +2.20 e. For the O-rich termination, the O1 and O2 atoms both lose electrons at 2p states, 0.68 and 0.66, and the final charge reduces from −1.18 e to −0.63 e and −0.64 e, respectively. Furthermore, the charge of Si1 atom increases 0.1 e. It can be concluded that, for all the terminations, the electrons of surface-exposed atoms are redistributed due to the creation of dangling bonds relative to the bulk coordination.

3.1.4. Surface Atomic Mulliken Bond Population

It is well known, in general, that an ionic or covalent character can be determined according to Mulliken bond population. High populations indicate that the bond is covalent. On the contrary, low populations suggest that the interaction between bonds is ionic. Table 5 summarizes the Mulliken bond populations of the three terminations.
The Si–O population and length in the quartz bulk is about 0.52 and 1.624 Å, respectively, showing a covalence effect. The bond population and length of three terminations change to a certain extent due to the surface atomic charge transfer. For Si termination, as the charge of a Si1 atom gains 1.16 e, the Si1–O1 bond population reduces from 0.52 to 0.27, and the length increases 0.052 Å, which indicates that the covalence of the Si–O bond is weakened and ionicity is strengthened. For O-middle termination, as the charge of the O1 atom and the Si1 atom is reduces by −0.14 e and +0.16 e, respectively, the O1–Si1 population increases from 0.52 to 0.96 with a 0.107 reduction in bond length, which indicates that the covalence interaction has been strengthened and the surface tends to be stable. For the O-rich termination, as O1 and O2 atoms do not lose many electrons, the O1–Si1 and O2–Si1 populations are reduced by 0.19 and 0.18, with a 0.005 and 0.002 increase in bond length, indicating that the O–Si covalent interactions weaken. Generally, the bonds near the surface mainly show extension compared with the bulk, which means that the ionicity between these atoms is enhanced due to the dangling bonds at the surface, and the results are in line with that of the tendency of the atomic displacements and surface charge distribution.

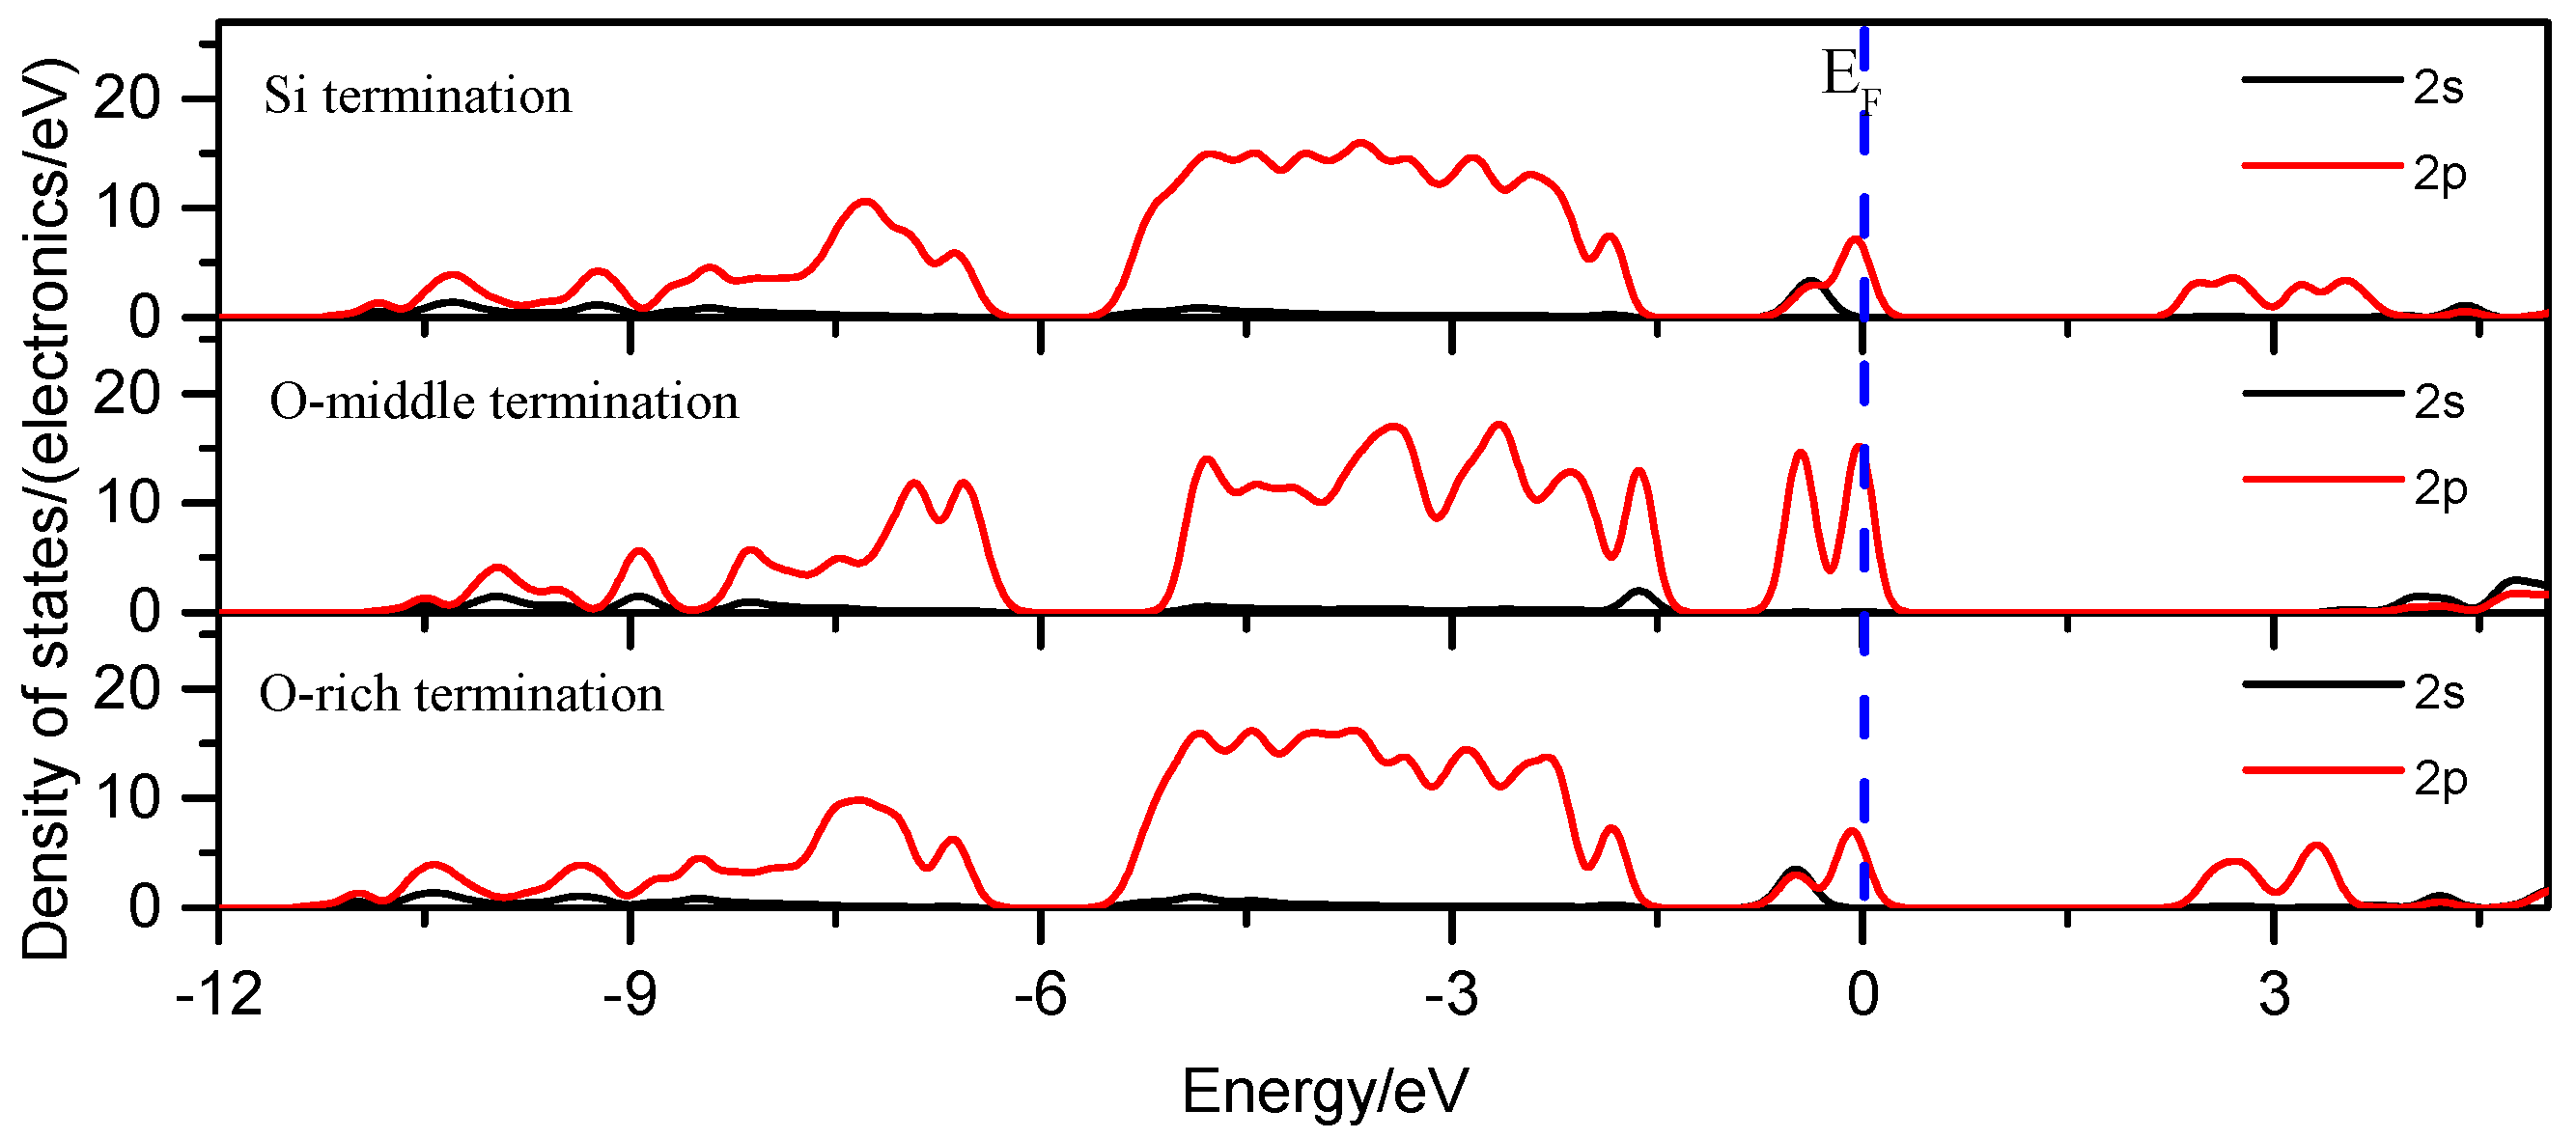
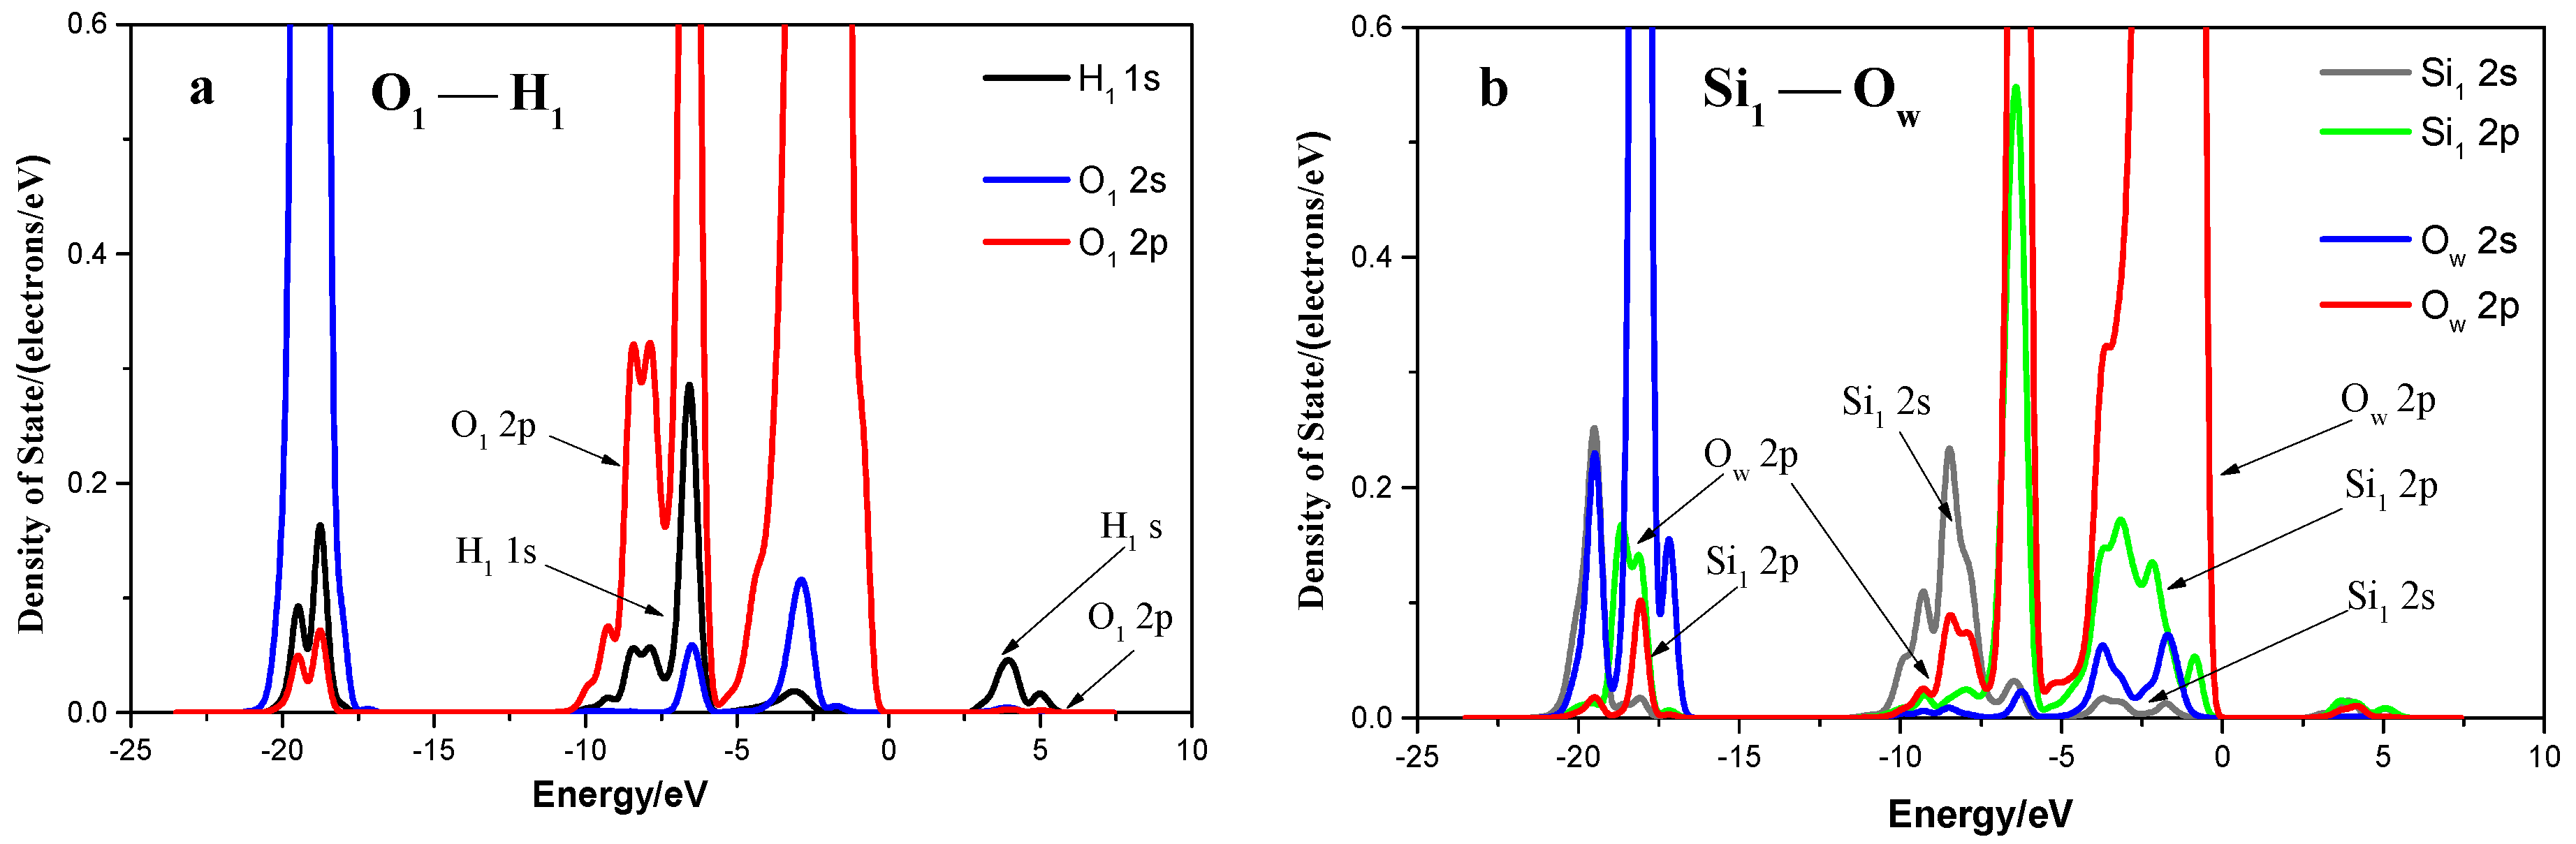
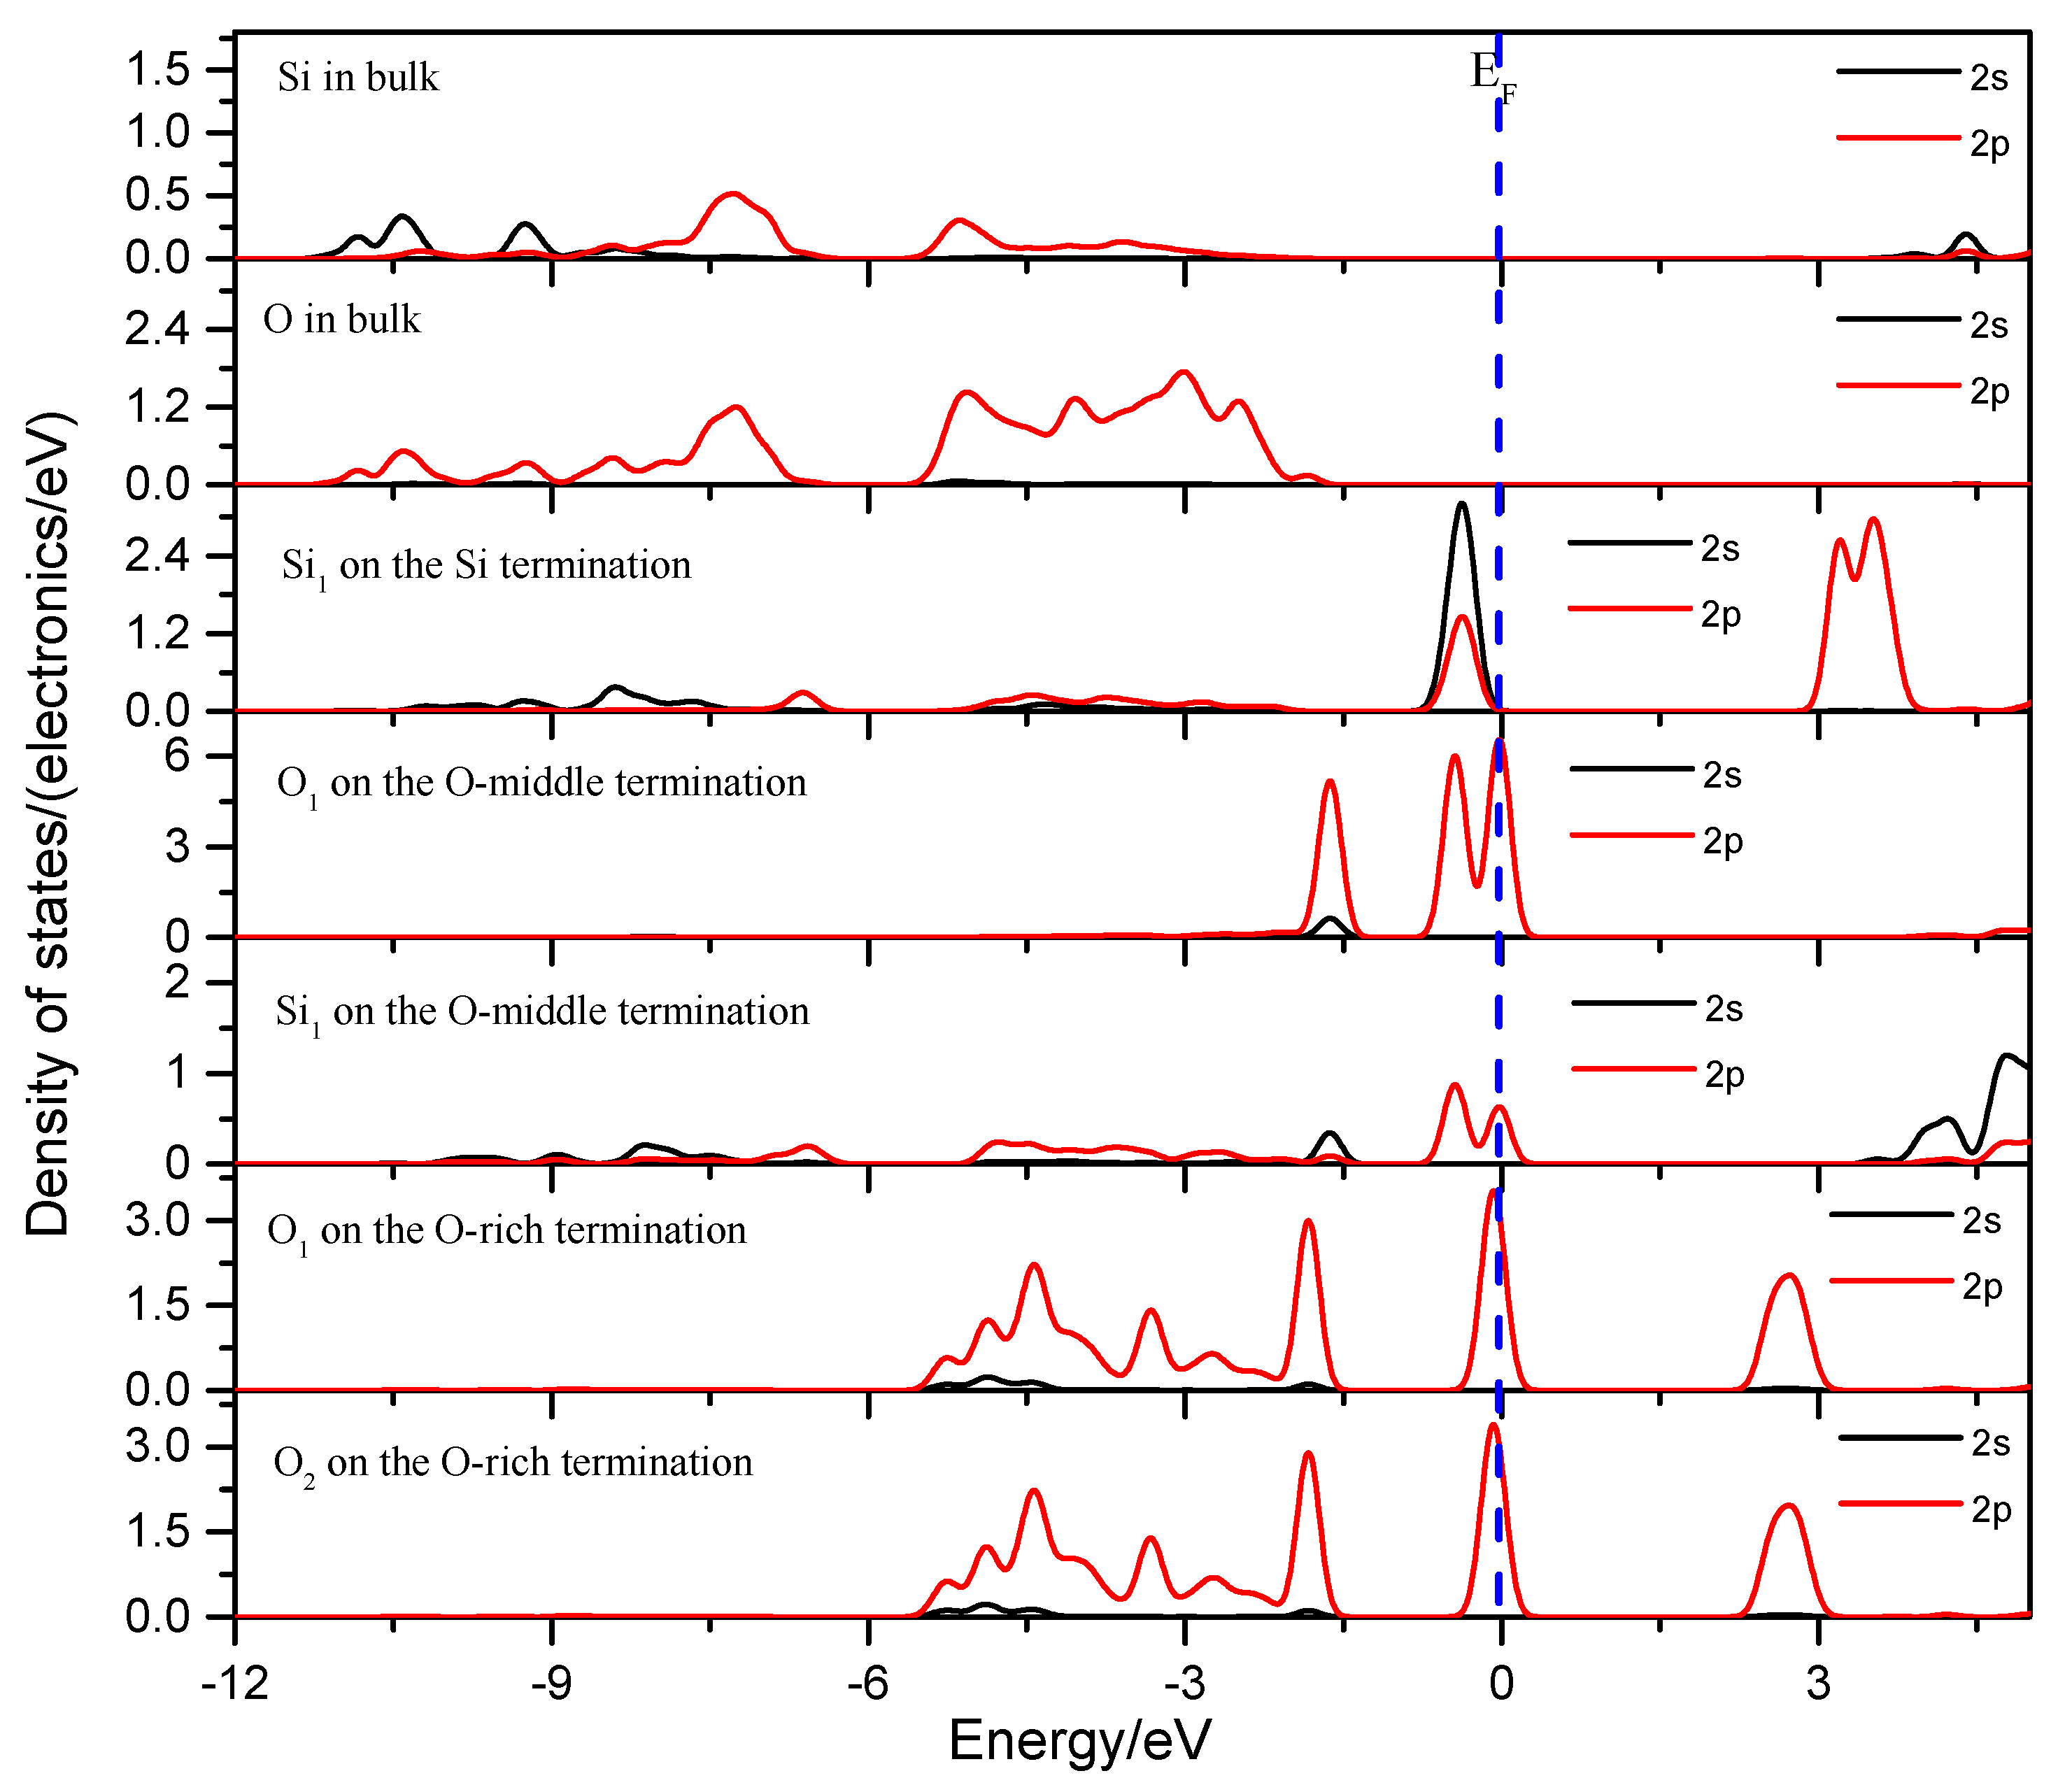
3.1.5. Density of States

Density of states (DOS) is one of the most important parameters for describing the states of motion of electrons in solid physics. In order to obtain a chemically intuitive description of the electronic structure, a state-by-state and atom-by-atom projected density of states (PDOS) analysis can be used. It has been widely used in solid physics, surface science, and interface absorption [7,28,45,46]. For further investigation, the PDOSs of the three terminations are shown in Figure 5. The PDOSs of surface Si and O atoms compared with that of the corresponding Si and O atoms in bulk are also presented in Figure 6 in order to reveal the surface properties of different terminations. The Fermi level (EF) is referenced at 0 eV. It has been reported that the region near the Fermi level is very important for various physical and chemical properties such as conductor type, reaction activity of surface atoms, and electrochemical potential of minerals [7,20,33]. Therefore, great attention has been paid to the details near the Fermi surface.
It is can be seen from Figure 5 that the energy range distributions of electrons for the three terminations are almost the same. For the quartz surface, the activity of electrons at p states are much larger than that at s states, and the p states occupy the top of the valence band and the bottom of the conduction band, especially in the vicinity of the EF level. Overall, the activity of O-middle termination was greater than that of Si termination and O-rich termination when only considering the details near the Fermi surface, especially of the 2p state electrons.
Figure 6 indicates that, for the Si termination, the s and p states of Si1 atoms occupy the vicinity of the EF level compared with that in the bulk; for the O-middle termination, the p states of O1 and Si1 atoms occupy in the vicinity of the EF level, and the contribution of O1 is much larger than the Si1 atom; for the O-rich terminations, the p states of the O1 and O2 atoms entirely occupy the vicinity of the EF level. Comparing the result of Figure 6 with Figure 5, we can see that the surface properties of different terminations are mainly formed by the surface-exposed atoms, as almost all contributions to EF in the DOS of the surface are made by the surface-exposed atoms, which is a conclusion consistent with studies about the electronic properties of fluorapatite (001) surfaces [21] and AlCMn3 (111) surfaces [22].

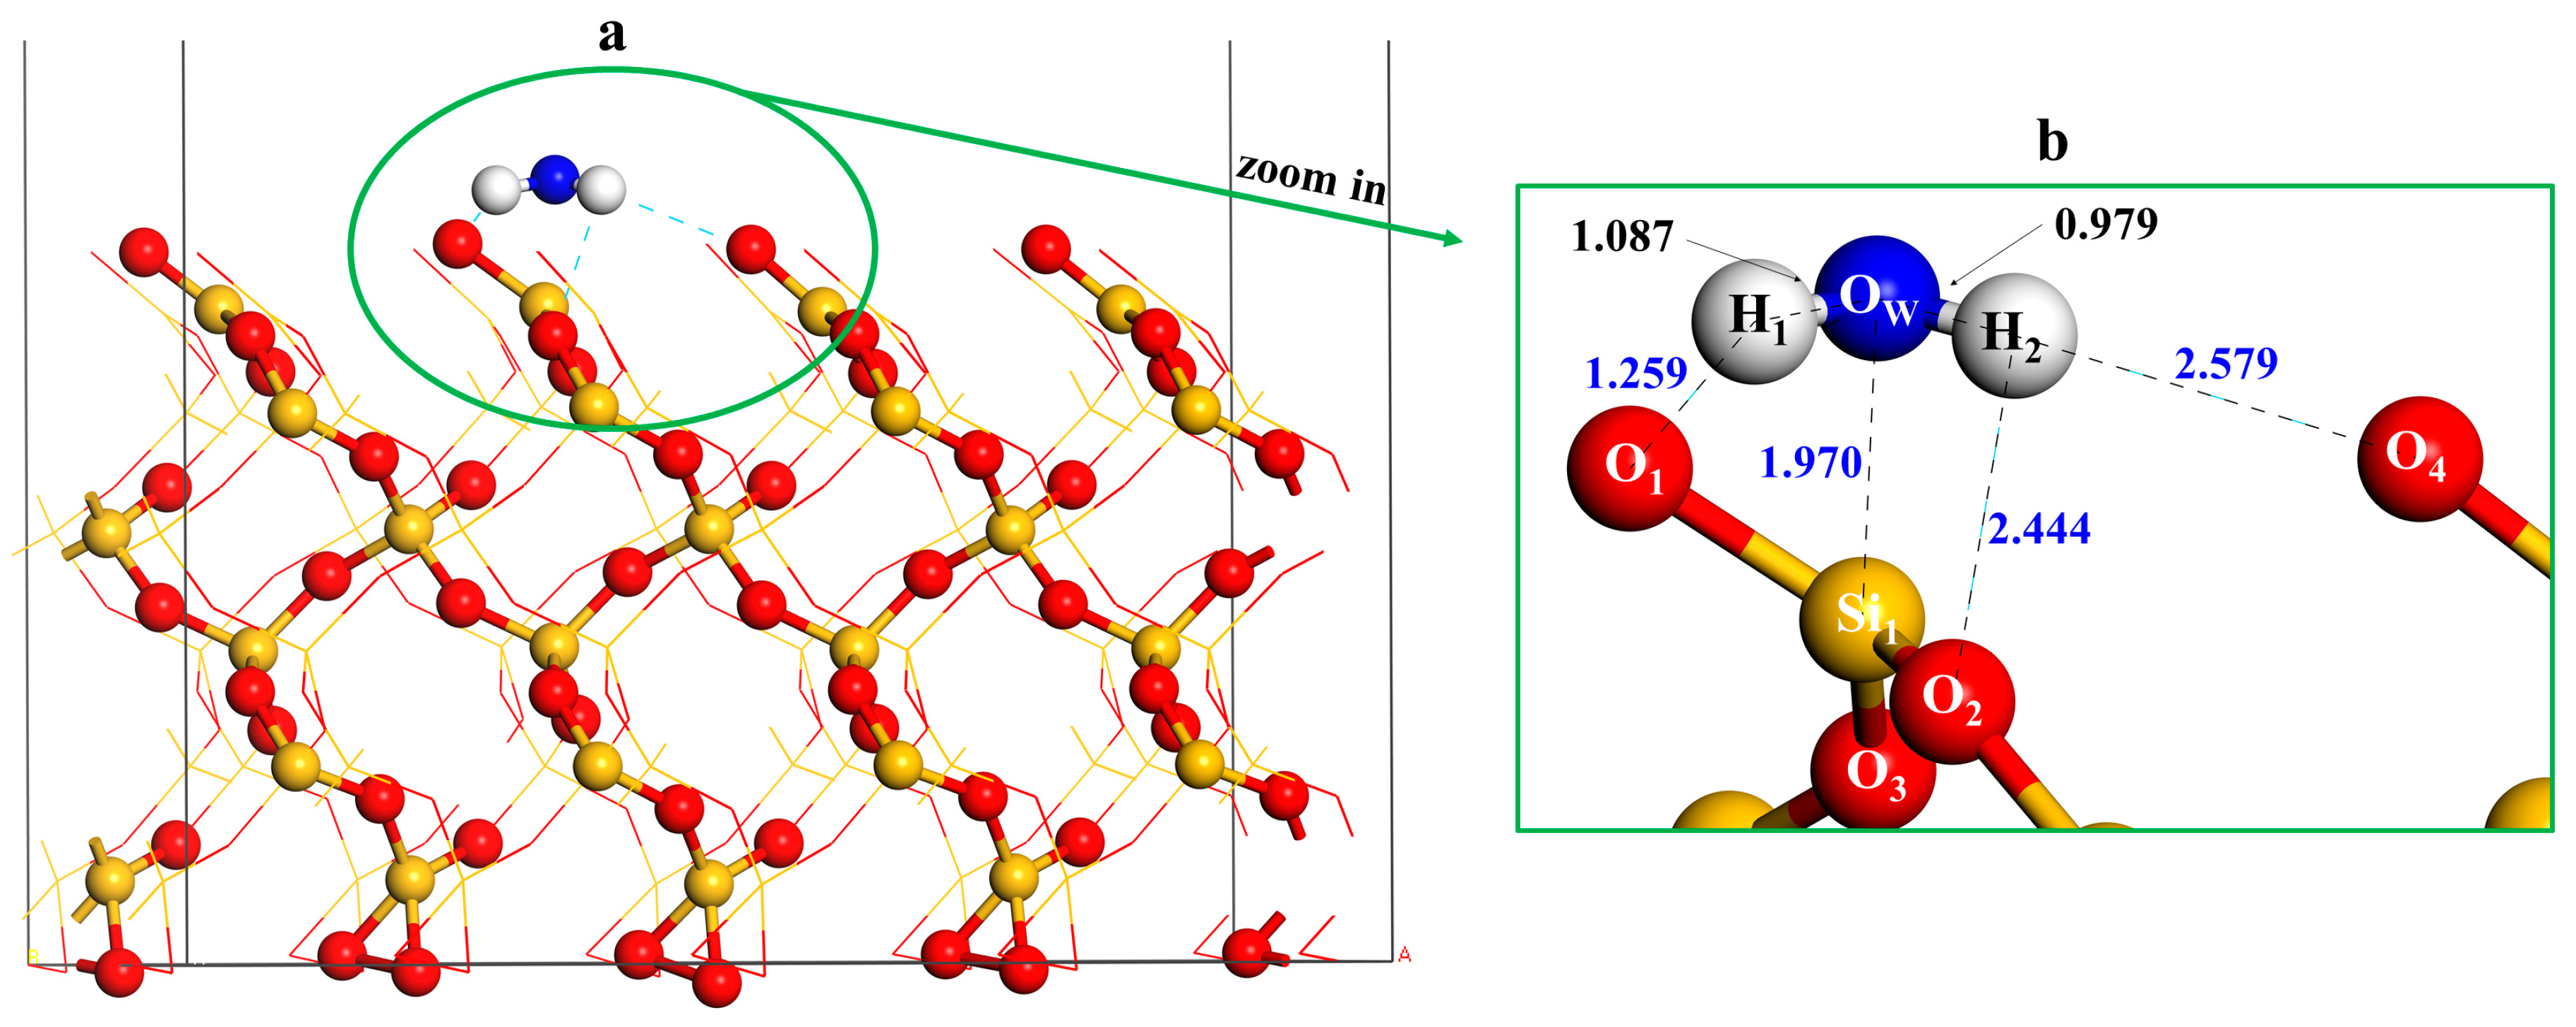
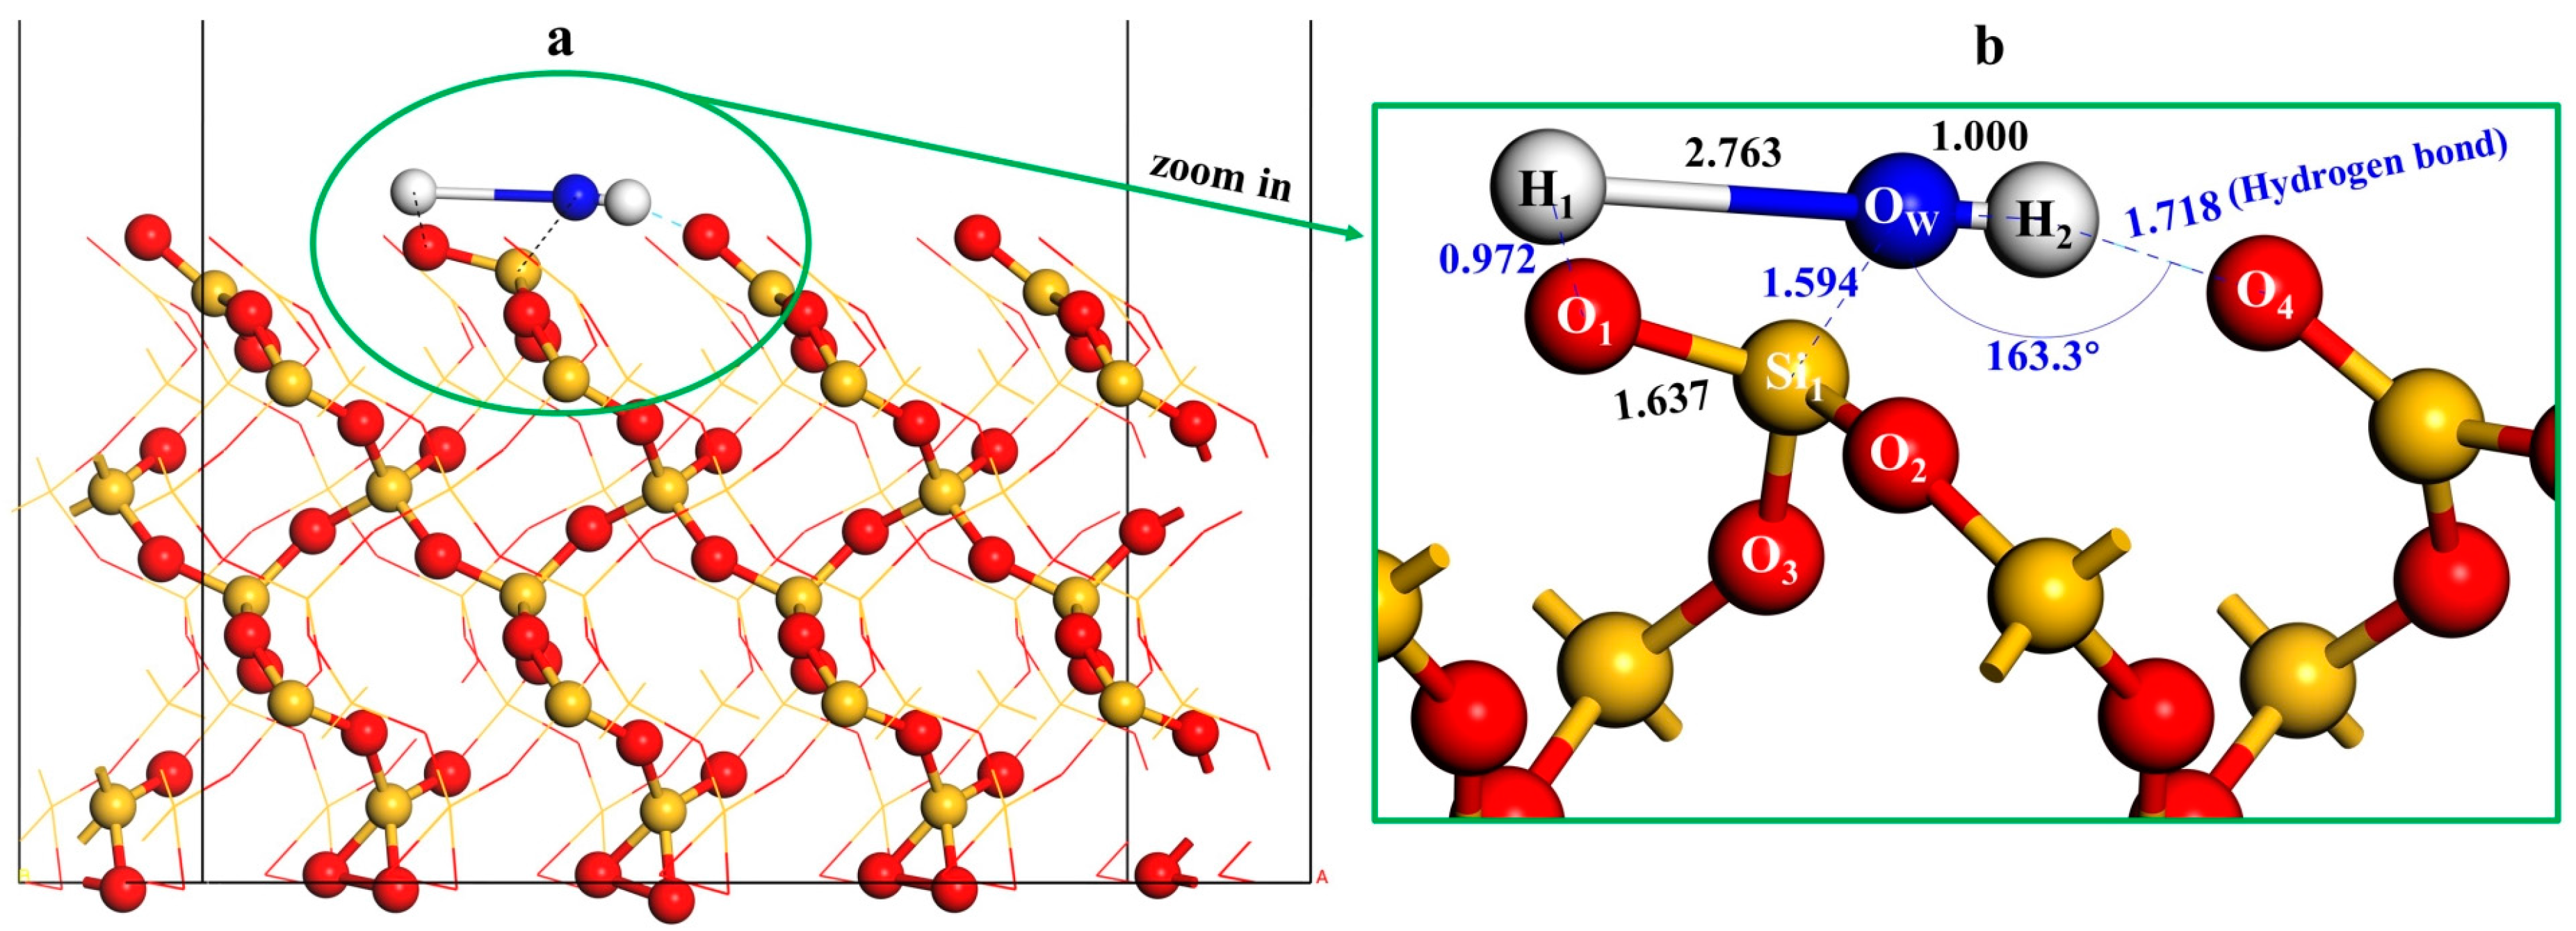
3.2. Adsorption of an Isolated Water Molecule on Quartz (001) Surface

The adsorption of an isolated H2O molecule on a quartz (001) surface was studied based on the most stable quartz (001) termination (O-middle termination). A 4 × 3 × 1 supercell surface with atomic layer number 18 and vacuum thickness 18 Å was built to accommodate the isolated H2O adsorption.
In terms of quartz surfaces, both the molecular and dissociative adsorptions have been considered based on research showing that the adsorption of water, depending on water coverage, can be either molecular or partially dissociative [25]. The optimized geometries are shown in Figure 7 and Figure 8, where the yellow and red balls represent silicon and oxygen atoms of quartz, and the blue and light gray balls represent oxygen and hydrogen atoms of water; parts of atoms are displayed as lines in order to see the whole adsorption structure clearly in Figure 7a and Figure 8a, and the zoomed-in views of the H2O adsorption structure are shown in Figure 7b and Figure 8b; the bond length of newly formed bonds after adsorption are highlighted in blue, and the unit of bond length is Å.
For the molecular adsorption, it was found that water prefers to adsorb on the surface Si and O atom mainly via O1–H1 bond at 1.259 Å and Si1–Ow at 1.970 Å. Furthermore, there are also two weak bonds O2–H2 at 2.444 Å and O4–H2 at 2.579 Å in the form of hydrogen bonds. The calculated adsorption energy of molecular adsorption is 600 meV/molecule (−57.89 kJ·mol−1), mainly contributed by the Van der Waals force and weak hydrogen bond, which is close to the result of 618.9 meV derived from the plane-wave-based Vienna ab initio Simulation Package (VASP) calculation in [47] and is comparable with hydrogen bonds between water molecules in Ice-XI bulk (∼710 meV/molecule in DFT [48] and ∼610 meV/molecule in experiment [49]). Compared with other minerals, the adsorption energy is substantially larger than that of −29.1 kJ·mol−1 on a hydrophobic galena surface and agrees well with that of −56.2 kJ·mol−1 on a hydrophilic pyrite surface by DFT [32].
For the dissociative adsorption model, the structure of Si termination is quite different from the previous relaxed surface after adsorption. As we can see, the H2O molecule dissociates into H+ and OH bonded with the O1 and Si1 atoms, respectively, generating two new Si–OH silanol groups on the quartz surface. At the same time, the Si1–OwH2 group is bonded with the O4 atom forming the OwH2···O4 hydrogen bond. This indicates that the surface of quartz can be hydroxylated after adsorption of the H2O molecule, and the hydroxylation was also reported on the quartz (101) surface [50] and a single methanol molecule in water [51] by DFT. The calculated adsorption energy of dissociative adsorption is 1.03 eV/molecule (−99.37 kJ·mol−1), mainly contributed by the chemical bond of new Si–OH silanol groups and hydrogen bond. This energy is greater than that of −82.4 kJ·mol−1 on hydrophilic pyrite surface by DFT [32]. In order to reveal the electron transfer and covalent interaction of new formed bonds after H2O molecule dissociative adsorption, the surface atomic Mulliken charge distribution and surface Mulliken bond population before and after adsorption of H2O were analyzed as shown in Table 6 and Table 7 (the atomic numbers correspond to the labels in Figure 8).
It can be seen from Table 6 that, after adsorption of H2O, the electrons transfer from Si1 atoms to O1 and Ow1 atoms. The 2p orbital of O1 and Ow atoms gain electrons 0.16 and 0.09, respectively, leading to their charge increasing from −1.04 e to −1.12 e and from −1.05 e to −1.09 e. This indicates that the activities of O atoms in the two new Si–OH silanol group are strengthened. The results of Table 7 show that, due to the new Si–OH silanol group, the populations of O1–Si1 are reduced from 0.96 at the relaxation surface to 0.51 at the adsorption surface, which is almost equivalent to the bulk value 0.52, indicating that the covalence of Si–O bond is strengthened. The population of Si1–Ow at 0.59 is higher than that of Si1–O1 at 0.51, so the bond length of Si1–O1 is longer, suggesting that the two Si–OH silanol groups are not completely consistent. The bond length of Ow–O4 is 2.690 Å with an H2···O4 length of 1.718 Å and an OwH2···O4 angle of 163.03°, which is close to the reference hydrogen bond with an OO distance of 2.70 Å after water adsorption on a quartz surface by VASP calculation [25]. The bond of Ow–O4 belongs to a strong hydrogen bond based on classification criterion (the strong one is within an OO distance of 2.72 Å and an OH···O angle of 168°) originating from those reported in the 2D water layers on metal Pt (111) [52] and hydroxylated cristobalite (100) [53].
During bonding between two atoms, there are two types of bond orbitals—a bonding orbital and an antibonding orbital—that always appear in pairs. The bonding orbital is dominated by atomic orbitals with high electronegativity, whereas the antibonding orbital is dominated by atomic orbitals with low electronegativities [43]. To further investigate the bonding mechanism of H2O molecule after the dissociative adsorption, the PDOSs of O1–H1 bonding and Si1–Ow bonding in the dissociative adsorption model are given in Figure 9.
Based on the PDOSs of O1–H1 bonding in Figure 9a, it can be clearly seen that the O1 2p–H1 1s bonding DOS peak appears between −1.5 and −4.8 eV, and the antibonding DOS peak resonances are at 2.5–5.5 eV. The bonding effect is stronger than that of the antibonding bond. The bonding orbital has a quite wide energy level, indicating that the delocalization of electrons is high, which is also beneficial to bonding [28]. Additionally, the splitting effect of bonding and antibonding is quite large due to the whole energy (−1.5–5.5 eV) across the Fermi level [54]. All of these both indicating that the bonding effect of O1–H1 is quite strong, mainly contributed by the O1 2p–H1 1s. It is consistent with the Mulliken analysis results that the O1 2p orbital gains electrons 0.16 and forms a strong O1–H1 bond with a length of 0.972 Å. Similarly, for the PDOSs of Si1–Ow bonding in Figure 9b, the Si1–Ow bond also showed a strong covalent interaction, mainly contributed by the Si1 2p–Ow 2p with a bonding DOS peak between 0 and −11.5 eV and an antibonding DOS peak from −17.0 to −21.0 eV, and the Si1 2s–Ow 2p with a bonding DOS peak between 0 and −7.5 eV and an antibonding DOS peak from −7.5 to −11.0 eV. The results of the bonding DOS analysis are therefore in agreement with the analysis of Mulliken charge distribution and bond populations.
According to the adsorption energies in calculation, it is suggested that both the molecular adsorption and dissociative adsorption are favorable for isolated water molecules on the O-middle termination of a quartz (001) surface. The structure and electronic properties of the quartz surface are influenced by H2O molecule adsorption; that is, the reactivity site and the surface hydrophilic character changes. This is supported by a similar study on the relaxation and electronic structure of sulfide minerals surfaces in the presence of H2O molecules [55]. Thus, the adsorption of a flotation reagent at quartz–water interfaces would be different from that at a direct quartz surface without H2O interactions, which has already been identified in studies on thiol collector interaction on galena (PbS) and sphalerite (ZnS) in the presence of water molecules in DFT [20,33].

4. Conclusions

DFT calculations were employed to investigate the structural and electronic properties of three distinct terminations of a (001) quartz surface, with subsequent water adsorption studies carried out on the surface that was predicted to be the most stable. It was found that a so-called O-middle termination, characterized by a single exposed oxygen atom at the surface, is most likely predominant in real samples, as it has the lowest associated surface energy. Water adsorption on the O-middle termination was therefore modeled. It is shown here that the structure and electronic properties of the surface are transformed by both molecular and dissociative water adsorption. Based on this information, it can be expected that exposure to a water environment will affect a quartz surface’s structure and reactivity. Thus, the formation of the quartz–water interface must be accounted for when modeling processes, such as the flotation process, involve reagents. The results here provide valuable insight on how to represent the flotation process in a pulp environment through atomistic calculations.

Supplementary Materials

The following are available online at https://www.mdpi.com/2075-163X/8/2/58/s1: Table S1: Lattice constant and total energy of quartz conventional cell by using different exchange correlation (the cutoff energy and k-point were set at 340 eV and 5 × 5 × 4, respectively; Table S2: Lattice constant of quartz conventional cell by using different cutoff energy (the exchange correlation function and k-point were set at GGA-PW91 and 5 × 5 × 4, respectively); Table S3: Lattice constant and band gap of quartz conventional cell by using different k-point (the exchange correlation function and cutoff energy were set at GGA-PW91 and 360 eV, respectively).

Acknowledgments

This research was financially supported by the National Natural Science Foundation of China (No. 51474078) and the Key Foundation of Science and Technology of Guizhou Province, China (No. Qian Ke He JZ [2014] 2009). Thanks are extended to Jianhua Chen and Baolin Ke from Guangxi University for their help in the molecular simulation study.

Author Contributions

Xianchen Wang and Qin Zhang conceived and designed the calculation models; Qin Zhang contributed the computation resources; Xianchen Wang performed all the calculations and wrote most of the manuscript. Xianbo Li, Junjian Ye and Longjiang Li participated in the data analysis and writing.

Conflicts of Interest

The authors declare no conflict of interest.

References

  1. Su, J.W.; Esmaeilzadeh, H.; Zhang, F.; Yu, Q.; Cernigliaro, G.; Xu, J.; Sun, H.W. An ultrasensitive micropillar-based quartz crystal microbalance device for real-time measurement of protein immobilization and protein-protein interaction. Biosens. Bioelectron. 2018, 99, 325–331. [Google Scholar] [CrossRef] [PubMed]
  2. Adam, S.; Koenig, M.; Rodenhausen, K.B.; Eichhorn, K.; Oertel, U.; Schubert, M.; Stamm, M.; Uhlmann, P. Quartz crystal microbalance with coupled spectroscopic ellipsometry-study of temperature-responsive polymer brush systems. Appl. Surf. Sci. 2017, 421, 843–851. [Google Scholar] [CrossRef]
  3. Kim, B.; Jahng, J.; Khan, R.M.; Park, S.; Potma, E.O. Eigenmodes of a quartz tuning fork and their application to photoinduced force microscopy. Phys. Rev. B 2017, 95, 75440. [Google Scholar] [CrossRef]
  4. Meng, Q.Y.; Yuan, Z.T.; Feng, Q.M.; Ou, L.M. The effect of quartz on the flotation of fine wolframite with octyl hydroxamic acid. Minerals 2017, 7, 186. [Google Scholar] [CrossRef]
  5. Liu, A.; Fan, M.Q.; Fan, P.P. Interaction mechanism of miscible DDA–Kerosene and fine quartz and its effect on the reverse flotation of magnetic separation concentrate. Miner. Eng. 2014, 65, 41–50. [Google Scholar] [CrossRef]
  6. Chen, Y.W.; Cheng, H.P. Structure and stability of thin water films on quartz surfaces. Appl. Phys. Lett. 2010, 97, 161909. [Google Scholar] [CrossRef]
  7. Zhao, C.H.; Chen, J.H.; Li, Y.Q.; Huang, D.W.; Li, W.Z. DFT study of interactions between calcium hydroxyl ions and pyrite, marcasite, pyrrhotite surfaces. Appl. Surf. Sci. 2015, 355, 577–581. [Google Scholar] [CrossRef]
  8. Liu, A.; Fan, M.; Li, Z.; Fan, J. Non-polar oil assisted DDA flotation of quartz I: Interfacial interaction between dodecane oil drop and mineral particle. Int. J. Miner. Process. 2017, 168, 1–8. [Google Scholar] [CrossRef]
  9. Liu, A.; Fan, M.; Li, Z.; Fan, J. Non-polar oil assisted DDA flotation of quartz II: Effect of different polarity oil components on the flotation of quartz. Int. J. Miner. Process. 2017, 168, 25–34. [Google Scholar] [CrossRef]
  10. Li, X.B.; Zhang, Q.; Hou, B.; Ye, J.J.; Mao, S. Flotation separation of quartz from collophane using an amine collector and its adsorption mechanisms. Powder Technol. 2017, 318, 224–229. [Google Scholar] [CrossRef]
  11. Ulusoy, U.; Yekeler, M.; Hiçyılmaz, C. Determination of the shape, morphological and wettability properties of quartz and their correlations. Miner. Eng. 2003, 16, 951–964. [Google Scholar] [CrossRef]
  12. Luo, B.B.; Zhu, Y.M.; Sun, C.Y.; Li, Y.J.; Han, Y.X. Flotation and adsorption of a new collector α-Bromodecanoic acid on quartz surface. Miner. Eng. 2015, 77, 86–92. [Google Scholar] [CrossRef]
  13. Steurer, W.; Apfolter, A.; Koch, M.; Sarlat, T.; Søndergård, E.; Ernst, W.E.; Holst, B. The structure of the α-quartz (0001) surface investigated using helium atom scattering and atomic force microscopy. Surf. Sci. 2007, 601, 4407–4411. [Google Scholar] [CrossRef]
  14. Kawasaki, M.; Onuma, K.; Sunagawa, I. Morphological instabilities during growth of a rough interface: AFM observations of cobbles on the (0001) face of synthetic quartz crystals. J. Cryst. Growth 2003, 258, 188–196. [Google Scholar] [CrossRef]
  15. Geatches, D.L.; Clark, S.J.; Greenwell, H.C. Role of clay minerals in Oil-Forming reactions. J. Phys. Chem. A 2010, 114, 3569–3575. [Google Scholar] [CrossRef] [PubMed]
  16. Prigiobbe, V.; Negreira, A.S.; Lim, D.; Wilcox, J. Density functional theory calculations of the interaction of olivine with water. Energy Procedia 2013, 37, 5875–5883. [Google Scholar] [CrossRef]
  17. Escamilla-Roa, E.; Huertas, F.; Hernández-Laguna, A.; Sainz-Díaz, C. A DFT study of the adsorption of glycine in the interlayer space of montmorillonite. Phys. Chem. Chem. Phys. 2017, 19, 14961–14971. [Google Scholar] [CrossRef] [PubMed]
  18. Jung, J.E.; Liguori, S.; Jew, A.D.; Brown, G.E.J.; Wilcox, J. Theoretical and experimental investigations of mercury adsorption on hematite surfaces. J. Air Waste Manag. Assoc. 2018, 68, 39–53. [Google Scholar] [CrossRef] [PubMed]
  19. Chen, Y.; Chen, J.H.; Guo, J. A DFT study on the effect of lattice impurities on the electronic structures and floatability of sphalerite. Miner. Eng. 2010, 23, 1120–1130. [Google Scholar] [CrossRef]
  20. Long, X.H.; Chen, J.H.; Chen, Y. Adsorption of ethyl xanthate on ZnS (110) surface in the presence of water molecules: A DFT study. Appl. Surf. Sci. 2016, 370, 11–18. [Google Scholar] [CrossRef]
  21. Qiu, Y.Q.; Cui, W.Y.; Li, L.J.; Ye, J.J.; Wang, J.; Zhang, Q. Structural, electronic properties with different terminations for fluorapatite (001) surface: A first-principles investigation. Comput. Mater. Sci. 2017, 126, 132–138. [Google Scholar] [CrossRef]
  22. Wang, F.; Li, K.; Zhou, N.G. Structural, electronic properties and stability of AlCMn3 (111) surfaces by first-principles calculations. Appl. Surf. Sci. 2014, 289, 351–357. [Google Scholar] [CrossRef]
  23. Chen, Y.W.; Cao, C.; Cheng, H.P. Finding stable α-quartz (0001) surface structures via simulations. Appl. Phys. Lett. 2008, 93, 181911. [Google Scholar] [CrossRef]
  24. Goumans, T.P.M.; Wander, A.; Brown, W.A.; Catlow, C.R.A. Structure and stability of the (001) α-quartz surface. Phys. Chem. Chem. Phys. 2007, 9, 2146–2152. [Google Scholar] [CrossRef] [PubMed]
  25. Yang, J.J.; Wang, E.G. Water adsorption on hydroxylated alpha-quartz (0001) surfaces: From monomer to flat bilayer. Phys. Rev. B 2006, 73, 035406. [Google Scholar] [CrossRef]
  26. Wander, M.C.F.; Clark, A.E. Structural and dielectric properties of quartz—Water interfaces. J. Phys. Chem. C 2008, 112, 19986–19994. [Google Scholar] [CrossRef]
  27. Wang, J.; Zhang, Q.; Qiu, Y.Q.; Li, L.J.; Ye, J.J.; Cui, W.Y. The first principles of the crystal structure and active sites of calcite. Chin. J. Eng. 2017, 39, 487–493. [Google Scholar]
  28. Deng, J.S.; Wen, S.M.; Liu, J.; Wu, D.D.; Feng, Q.C. Adsorption and activation of copper ions on chalcopyrite surfaces: A new viewpoint of self-activation. Trans. Nonferrous Met. Soc. China 2014, 24, 3955–3963. [Google Scholar] [CrossRef]
  29. Chen, J.H.; Lan, L.H.; Chen, Y. Computational simulation of adsorption and thermodynamic study of xanthate, dithiophosphate and dithiocarbamate on galena and pyrite surfaces. Miner. Eng. 2013, 46–47, 136–143. [Google Scholar] [CrossRef]
  30. Chen, Y.; Chen, J.H. The first-principle study of the effect of lattice impurity on adsorption of CN on sphalerite surface. Miner. Eng. 2010, 23, 676–684. [Google Scholar] [CrossRef]
  31. Chen, J.H.; Long, X.H.; Chen, Y. Comparison of multilayer water adsorption on the hydrophobic galena (PbS) and hydrophilic pyrite (FeS2) surfaces: A DFT study. J. Phys. Chem. C 2014, 118, 11657–11665. [Google Scholar] [CrossRef]
  32. Chen, J.H.; Long, X.H.; Zhao, C.H.; Kang, D.; Guo, J. DFT calculation on relaxation and electronic structure of sulfide minerals surfaces in presence of H2O molecule. J. Cent. South Univ. 2014, 21, 3945–3954. [Google Scholar] [CrossRef]
  33. Long, X.H.; Chen, Y.; Chen, J.H.; Xu, Z.H.; Liu, Q.X.; Du, Z. The effect of water molecules on the thiol collector interaction on the galena (PbS) and sphalerite (ZnS) surfaces: A DFT study. Appl. Surf. Sci. 2016, 389, 103–111. [Google Scholar] [CrossRef]
  34. Rignanese, G.M.; Charlier, J.C.; Gonze, X. First-principles molecular-dynamics investigation of the hydration mechanisms of the (0001) α-quartz surface. Phys. Chem. Chem. Phys. 2004, 6, 1920–1925. [Google Scholar] [CrossRef]
  35. Du, Z.M.; de Leeuw, N.H. Molecular dynamics simulations of hydration, dissolution and nucleation processes at the α-quartz (0001) surface in liquid water. Dalton Trans. 2006, 22, 2623–2634. [Google Scholar] [CrossRef] [PubMed]
  36. Gor, G.Y.; Bernstein, N. Adsorption-Induced surface stresses of the Water/Quartz interface: Ab initio molecular dynamics study. Langmuir 2016, 32, 5259–5266. [Google Scholar] [CrossRef] [PubMed]
  37. Notman, R.; Walsh, T.R. Molecular dynamics studies of the interactions of water and amino acid analogues with quartz surfaces. Langmuir 2009, 25, 1638–1644. [Google Scholar] [CrossRef] [PubMed]
  38. Clark, S.J.; Segall, M.D.; Pickard, C.J.; Hasnip, P.J.; Probert, M.I.J.; Refson, K.; Payne, M.C. First principles methods using CASTEP. Zeitschrift für Kristallographie 2005, 220, 567–570. [Google Scholar] [CrossRef] [Green Version]
  39. Vanderbilt, D. Soft self-consistent pseudopotentials in a generalized eigenvalue formalism. Phys. Rev. B 1990, 41, 7892–7895. [Google Scholar] [CrossRef]
  40. Jones, R.O.; Gunnarsson, O. The density functional formalism, its applications and prospects. Rev. Mod. Phys. 1989, 61, 689–746. [Google Scholar] [CrossRef]
  41. Perdew, J.P.; Chevary, J.A.; Vosko, S.H.; Jackson, K.A.; Pederson, M.R.; Singh, D.J.; Fiolhais, C. Atoms, molecules, solids, and surfaces: Applications of the generalized gradient approximation for exchange and correlation. Phys. Rev. B 1992, 46, 6671–6687. [Google Scholar] [CrossRef]
  42. Kihara, K. An X-ray study of the temperature dependence of the quartz structure. Eur. J. Mineral. 1990, 2, 63–78. [Google Scholar] [CrossRef]
  43. Chen, J.H. The Solid Physics of Sulphide Minerals Flotation; Central South University Press: Changsha, China, 2015. [Google Scholar]
  44. Zhao, C.H.; Chen, J.H.; Long, X.H.; Guo, J. Study of H2O adsorption on sulfides surfaces and thermokinetic analysis. J. Ind. Eng. Chem. 2014, 20, 605–609. [Google Scholar] [CrossRef]
  45. Chen, J.; Ke, B.; Lan, L.; Li, Y. Influence of Ag, Sb, Bi and Zn impurities on electrochemical and flotation behaviour of galena. Miner. Eng. 2015, 72, 10–16. [Google Scholar] [CrossRef]
  46. Jiang, W.; Gao, Z.Y.; Sun, W.; Gao, J.; Hu, Y.H. A Density Functional Theory Study on the Effect of Lattice Impurities on the Electronic Structures and Reactivity of Fluorite. Minerals 2017, 7, 160. [Google Scholar] [CrossRef]
  47. Chen, Y.W.; Chu, I.H.; Wang, Y.; Cheng, H.P. Water thin film-silica interaction on α-quartz (0001) surfaces. Phys. Rev. B 2011, 84, 155444. [Google Scholar] [CrossRef]
  48. Pan, D.; Liu, L.M.; Tribello, G.A.; Slater, B.; Michaelides, A.; Wang, E. Surface energy and surface proton order of ice Ih. Phys. Rev. Lett. 2008, 101, 155703. [Google Scholar] [CrossRef] [PubMed]
  49. Feibelman, P.J. Partial dissociation of water. Science 2002, 295, 99–102. [Google Scholar] [CrossRef] [PubMed]
  50. Woo, H.J.; David, S.S. Enantiospecific adsorption of amino acids on hydroxylated quartz (1010). Phys. Chem. Chem. Phys. 2010, 12, 8016–8023. [Google Scholar]
  51. Van Erp, T.S.; Meijer, E.J. Hydration of methanol in water. A DFT-based molecular dynamics study. Chem. Phys. Lett. 2001, 333, 290–296. [Google Scholar] [CrossRef] [Green Version]
  52. Meng, S.; Xu, L.F.; Wang, E.G.; Gao, S. Vibrational recognition of Hydrogen-Bonded water networks on a metal surface. Phys. Rev. Lett. 2002, 89, 176104. [Google Scholar] [CrossRef] [PubMed]
  53. Yang, J.J.; Meng, S.; Xu, L.F.; Wang, E.G. Ice tessellation on a hydroxylated silica surface. Phys. Rev. Lett. 2004, 92, 146102. [Google Scholar] [CrossRef] [PubMed]
  54. Li, Y.Q.; Chen, J.H.; Chen, Y.; Guo, J. Density functional theory study of influence of impurity on electronic properties and reactivity of pyrite. Trans. Nonferrous Met. Soc. 2011, 21, 1887–1895. [Google Scholar] [CrossRef]
  55. Zhao, C.H.; Chen, J.H.; Wu, B.Z.; Long, X.H. Density functional theory study on natural hydrophobicity of sulfide surfaces. Trans. Nonferrous Met. Soc. 2014, 24, 491–498. [Google Scholar] [CrossRef]
Figure 1. The cell model of quartz: (a) ball and stick model; (b) polyhedron model.
Minerals 08 00058 g001
Figure 2. Three typical exposed atom terminations when cleaving the quartz (001) surface (the lines of (ac) represent the terminal atomic layers of the modeled surfaces).
Minerals 08 00058 g002
Figure 3. Side views of the three different slab models of the quartz (001) surface: (a) Si termination, (b) O-middle termination, and (c) O-rich termination.
Minerals 08 00058 g003
Figure 4. Surface structure of different terminations of the quartz (001) surface before and after relaxation from the same side view: (a) the surface structure of Si termination before relaxation; (a’) the surface structure of Si termination after relaxation; (b) the surface structure of O-middle termination before relaxation; (b’) the surface structure of O-middle termination after relaxation; (c) the surface structure of O-rich termination before relaxation; (c’) the surface structure of O-rich termination after relaxation.
Minerals 08 00058 g004
Figure 5. Projected density of states (PDOS) of three terminations of the quartz (001) surface.
Minerals 08 00058 g005
Figure 6. PDOSs of silicon and oxygen atoms on three terminations of the quartz (001) surface compared with that in bulk.
Minerals 08 00058 g006
Figure 7. (a) Molecular adsorption model for H2O molecule on O-middle termination; (b) the zoomed-in view of the H2O adsorption structure.
Minerals 08 00058 g007
Figure 8. (a) Dissociative adsorption model for H2O molecule on O-middle termination; (b) the zoomed-in view of the H2O adsorption structure.
Minerals 08 00058 g008
Figure 9. PDOSs of (a) O1–H1 bonding and (b) Si1–Ow after the dissociative adsorption model for the H2O molecule on O-middle termination (in order to see the bonding energy clearly, parts of the PDOS peaks greater than 0.6 on the y-axis are not displayed).
Minerals 08 00058 g009
Table 1. Effects of atomic layer number on surface energy of different terminations of the quartz (001) surface (the vacuum thickness in these tests was set at 10 Å).
Atomic Layer NumberSurface Energy/(J·m−2)
Si TerminationO-Middle TerminationO-Rich Termination
92.9281.9992.920
123.1242.0002.915
152.8981.9972.907
182.8961.9952.896
212.8961.9952.893
242.8971.9992.899
Table 2. Effects of vacuum thickness on surface energy of different terminations of the quartz (001) surface (the atomic layer number in these tests was set at 18).
Vacuum Thickness/ÅSurface Energy/(J·m−2)
Si TerminationO-Middle TerminationO-Rich Termination
82.9051.9862.894
102.8961.9952.896
152.8961.9692.892
182.8991.9692.894
202.8941.9722.892
Table 3. Atomic displacement and coordination of different terminations of the quartz (001) surface (C* represents the coordination number of atoms).
AtomsSi TerminationO-Middle TerminationO-Rich Termination
C* Δ x Δ y Δ zC* Δ x Δ y Δ zC* Δ x Δ y Δ z
O120.120.07−0.0210.070.050.201−2.240.06−0.11
O22−0.11−0.21−0.0120.580.170.0512.110.490.21
O320.12−0.030.032−0.10−0.29−0.0520.400.69−0.35
O420.060.040.0120.26−0.30−0.042−0.770.02−0.21
O520.03−0.110.062−0.010.000.042−0.25−0.46−0.22
O620.110.040.032−0.05−0.320.042−0.40−0.17−0.08
O720.050.080.0120.200.20−0.0320.33−0.61−0.12
O820.410.220.092−0.010.03−0.0520.63−0.040.11
Si12−2.76−0.290.054−1.81−0.77−0.184−0.040.23−0.31
Si240.08−0.060.0040.190.020.014−0.230.07−0.22
Si340.10−0.020.2440.18−0.020.0140.08−0.29−0.09
Si440.130.020.0540.180.02−0.0140.20−0.050.05
Table 4. Surface atomic Mulliken charge distribution of different terminations of the quartz (001) surface and bulk.
AtomsspTotalCharge/e
BulkSi0.571.071.64+2.36
O1.835.357.18−1.18
Si terminationSi11.661.142.80+1.20
O11.845.337.17−1.17
O21.845.337.17−1.17
Si20.571.091.66+2.34
O31.835.367.19−1.19
O-middle terminationO11.945.107.04−1.04
Si10.591.211.80+2.20
O21.855.347.19−1.18
O31.835.347.17−1.18
Si20.571.061.63+2.37
O-rich terminationO11.954.676.62−0.63
O21.954.696.64−0.64
Si10.541.001.54+2.46
O31.835.367.19−1.19
O41.835.377.20−1.20
Table 5. Surface atomic Mulliken bond population of different terminations of the quartz (001) surface and bulk.
TerminationBondSurface Population (Bulk)Bond Length (Bulk)/Å
SiSi1–O10.27 (0.52)1.67 (1.624)
Si1–O20.52 (0.53)1.61 (1.632)
O1–Si20.4 (0.51)1.61 (1.625)
O2–Si20.5 (0.63)1.62 (1.622)
O3–Si30.5 (0.52)1.62 (1.617)
O-middleO1–Si10.9 (0.52)1.51 (1.620)
Si1–O20.4 (0.53)1.60 (1.618)
Si1–O30.4 (0.53)1.62 (1.628)
O2–Si20.5 (0.53)1.61 (1.631)
O3–Si20.5 (0.52)1.62 (1.624)
O-richO1–Si10.3 (0.53)1.62 (1.624)
O2–Si10.3 (0.52)1.62 (1.626)
Si1–O30.4 (0.53)1.60 (1.616)
Si1–O40.5 (0.53)1.61 (1.625)
O3–Si20.5 (0.51)1.61 (1.625)
Table 6. Surface atomic Mulliken charge distribution of O-middle termination before and after H2O adsorption.
AtomAdsorptionspTotalCharge/e
H1Before0.4800.480.52
After0.4600.460.54
H2Before0.4800.480.52
After0.5000.500.50
OwBefore1.895.157.05−1.05
After1.855.247.09−1.09
O1Before1.945.107.04−1.04
After1.865.267.12−1.12
O2Before1.855.347.19−1.18
After1.835.367.19−1.19
O3Before1.835.347.17−1.18
After1.845.367.20−1.20
O4Before1.945.107.04−1.04
After1.915.147.06−1.06
Si1Before0.591.211.802.20
After0.581.051.632.37
Table 7. Surface Mulliken bond populations of O-middle termination before and after H2O adsorption.
BondPopulationBond Length/Å
BeforeAfterBeforeAfter
Si1–O10.960.511.5131.637
Si1–O20.420.451.6001.630
Si1–O30.430.451.6251.645
Ow–H20.510.530.9781.000
Si1–Ow-0.59-1.594
O1–H1-0.54-0.972

