Dissolution Behaviors of Trace Muscovite during Pressure Leaching of Hydrothermal Vein Quartz Using H2SO4 and NH4Cl as Leaching Agents


School of Resources and Environmental Engineering, Wuhan University of Technology, Wuhan 430070, China
*
Author to whom correspondence should be addressed.
Minerals 2018, 8(2), 60; https://doi.org/10.3390/min8020060
Submission received: 26 December 2017
/
Revised: 2 February 2018
/
Accepted: 7 February 2018
/
Published: 11 February 2018
(This article belongs to the Special Issue Mineralogy of Quartz and Silica Minerals)
Abstract
:Dissolution behaviors of trace muscovite during pressure leaching of hydrothermal vein quartz using H2SO4 and NH4Cl as leaching agents have been studied by means of optical and electronic microscopes. Phase transformations of pure muscovite during calcination and the pressure leaching were analyzed by powder X-ray diffraction (XRD) and thermal analysis (TG-DSC), which are used for indirectly discussing dissolution mechanisms of the trace muscovite. Structure damages of trace muscovite are caused by calcination, and further developed during pressure leaching of the quartz sand using H2SO4 and NH4Cl as leaching agents. The trace muscovite is dissolved, and then efficiently separated from quartz sand by coupling effects of calcination and fluorine-free pressure leaching.
1. Introduction
Vein quartz, as an industrial substitute of crystal quartz, usually contains some mica minerals, such as muscovite and biotite [1]. These mica minerals usually contain impurity elements of Al, K, Fe, and Ti, etc., which could evidently reduce quality of quartz products [2,3]. High-efficiency separation of the muscovite from quartz ore has been focused on by researchers for a long time [4,5]. In recent years, fluorine-free flotation has been developed to separate muscovite with quartz [6,7], but the flotation technique is only suitable for separating liberated ores, although separation efficiency of muscovite and quartz is not high enough [8,9]. Moreover, fluoric acid leaching shows great effects on removing muscovite (less than 0.2 wt %) within quartz [10,11]. However, fluorides used in the leaching process commonly lead to severe environmental pollution [12].
In the conventional process of oxygen pressure acid leaching of quartz ore, purification of quartz sand depends on acid attack to mica minerals, resulting in high acid consumption and a long leaching time [13]. The two problems lead to significant decreases in equipment life and production efficiency, and an obvious increase in production costs. In addition, pressure acid leaching with mixed agents consisting of acids and inorganic salts is deemed to be an effective method to dissolve and remove muscovite without using any fluorides [13,14]. Metallic ions in the inorganic salts are unacceptable in quartz purification because they would unavoidably drag in metallic impurities during processing, but the use of NH4Cl avoids the problem. Mixed leaching agents consisting of H2SO4 and NH4Cl show great effects on removing trace muscovite from hydrothermal vein quartz with high leaching pressure and extremely low acid consumptions [15].
Table 1 presents the impurity contents of ore and concentrate, and detailed process conditions [15]. Separation efficiency of the trace muscovite and quartz can reach 98.10% when total removal rate of impurity elements is about 84.0%.
Although the trace muscovite has been efficiently removed by the fluorine-free pressure leaching process, dissolution behaviors of trace muscovite during the pressure leaching of hydrothermal vein quartz have not been studied in detail. Meanwhile, the removal rate of Al in high-grade quartz is not suitable to be used for the calculation of the separation efficiency of trace muscovite and quartz because substitution of Al and Si is widely found in hydrothermal quartz. Hence, a quantitative calculation method is necessary. When the c(NH4Cl)/c(H2SO4) ratio was 2/1, Al content obviously decreased with H2SO4 concentration (0.025 mol/L to 0.300 mol/L), and remained approximately constant from 0.300 mol/L to 0.500 mol/L [16]. Hence, the quartz samples leached by the NH4Cl-H2SO4 solution with low concentrations can be used for microscopic analysis so as to investigate dissolution behaviors of trace muscovite.
Based on the previous research [15,16], this study is to elaborate the dissolution behaviors of trace muscovite during pressure leaching of hydrothermal vein quartz using H2SO4 and NH4Cl as leaching agents, and investigating occurrences of main lattice elements in leached quartz so as to provide evidence for calculating the separation efficiency of trace muscovite and quartz using the removal rate of trace K. The research is focused on analyzing the removal mechanism of trace muscovite from hydrothermal vein quartz by characterizing the phase transformations and structure modifications of the muscovite.
2. Materials and Methods
2.1. Materials
Hydrothermal vein quartz used in this study is from Hengche Town in Qichun County, Hubei Province, China. The sampled quartz ore was washed, dried, crushed by a Raymond mill (3R2115), and grain-size separated with standard sieves. Separated samples ranging in size from 106 μm (140 mesh) to 212 μm (70 mesh) was used for experiments. Muscovite is the main Al-K host mineral in the studied quartz ore. The main element impurities in the powdered quartz obtained by [15] are presented in Table 1.
2.2. Methods
Sieved samples were calcinated (at 900 °C for 5 h) and leached (5 g/sample) by H2SO4-NH4Cl solutions (50 cm3) at different agent concentrations and temperatures in an airtight reaction kettle for 6 h.
Microstructures of trace muscovite occurred in quartz sand at different leaching conditions were analyzed by biological microscope (ALPHAPHOT-2 YS-2, Nikon, Tokyo, Japan). Muscovite was then subjected to electron microprobe (JXA-8230/INCAX-ACT, JEOL Ltd., Tokyo, Japan) for morphology observation of the BSE model (backscattered electron image) after selection from the calcined and leached quartz sands by a biological microscope due to the distinctive colors and light transmittances of muscovites. The morphology and structure of the selected muscovites were analyzed by a polarizing microscope (DLMP, Leica Microsystems, Wetzlar, Germany) and an electron microprobe (JXA-8230/INCAX-ACT). Electron images of electron probe microanalysis were obtained at an acceleration voltage of 20.0 kV and a working distance of 11.2 mm based on the GBT15617-2002 standard [17]. Leaching conditions and numbers of micro-images are shown in Table 2.
Occurrences of the main metallic elements in leached quartz sand were analyzed by X-ray photoelectron spectroscopy (XPS, ESCALAB 250Xi, THERMO FISHER SCIENTIFIC, Waltham, MA, USA). Narrow spectrum analyses (XPS) of Al and Na were respectively measured 11 times. The binding energy scale was corrected based on a C1s peak from contaminations (around 284.79 eV) as the internal binding energy standard [18].
Pure natural muscovite was calcinated (at 900 °C for 5 h) and leached (2 g/sample) by H2SO4-NH4Cl solutions (0.3 mol/L H2SO4, 0.6 mol/L NH4Cl, 10 mL/g of L/S ratio) at 250 °C for 4 h. Mineral phases of pure natural muscovite, calcinated muscovite, and leached muscovite were analyzed by powder X-ray diffraction (RU-200B/D/MAX-RB). The powder X-ray diffraction (XRD) used a rotation anode high-power X-ray diffractometer (RU-200B/D/MAX-RB, Rigaku Corporation, JPN, Karlsruhe, Germany) employing CuKα radiation (λ = 0.154 nm, 40 kV, 50 mA) over scanning range 2θ = 5°–70° with step width 2°·min−1.
The results of thermal analyses (TG-DSC) of pure natural muscovite were obtained by simultaneous thermal analysis (STA449F3) (NETZSCH, Selb, Germany). The experiment of thermal analyses of pure muscovite was carried out under air atmosphere from room temperature to 1000 °C at a heating rate of 6 °C/min.
3. Results and Discussion
3.1. Effect of Calcination Process on Muscovite Structure
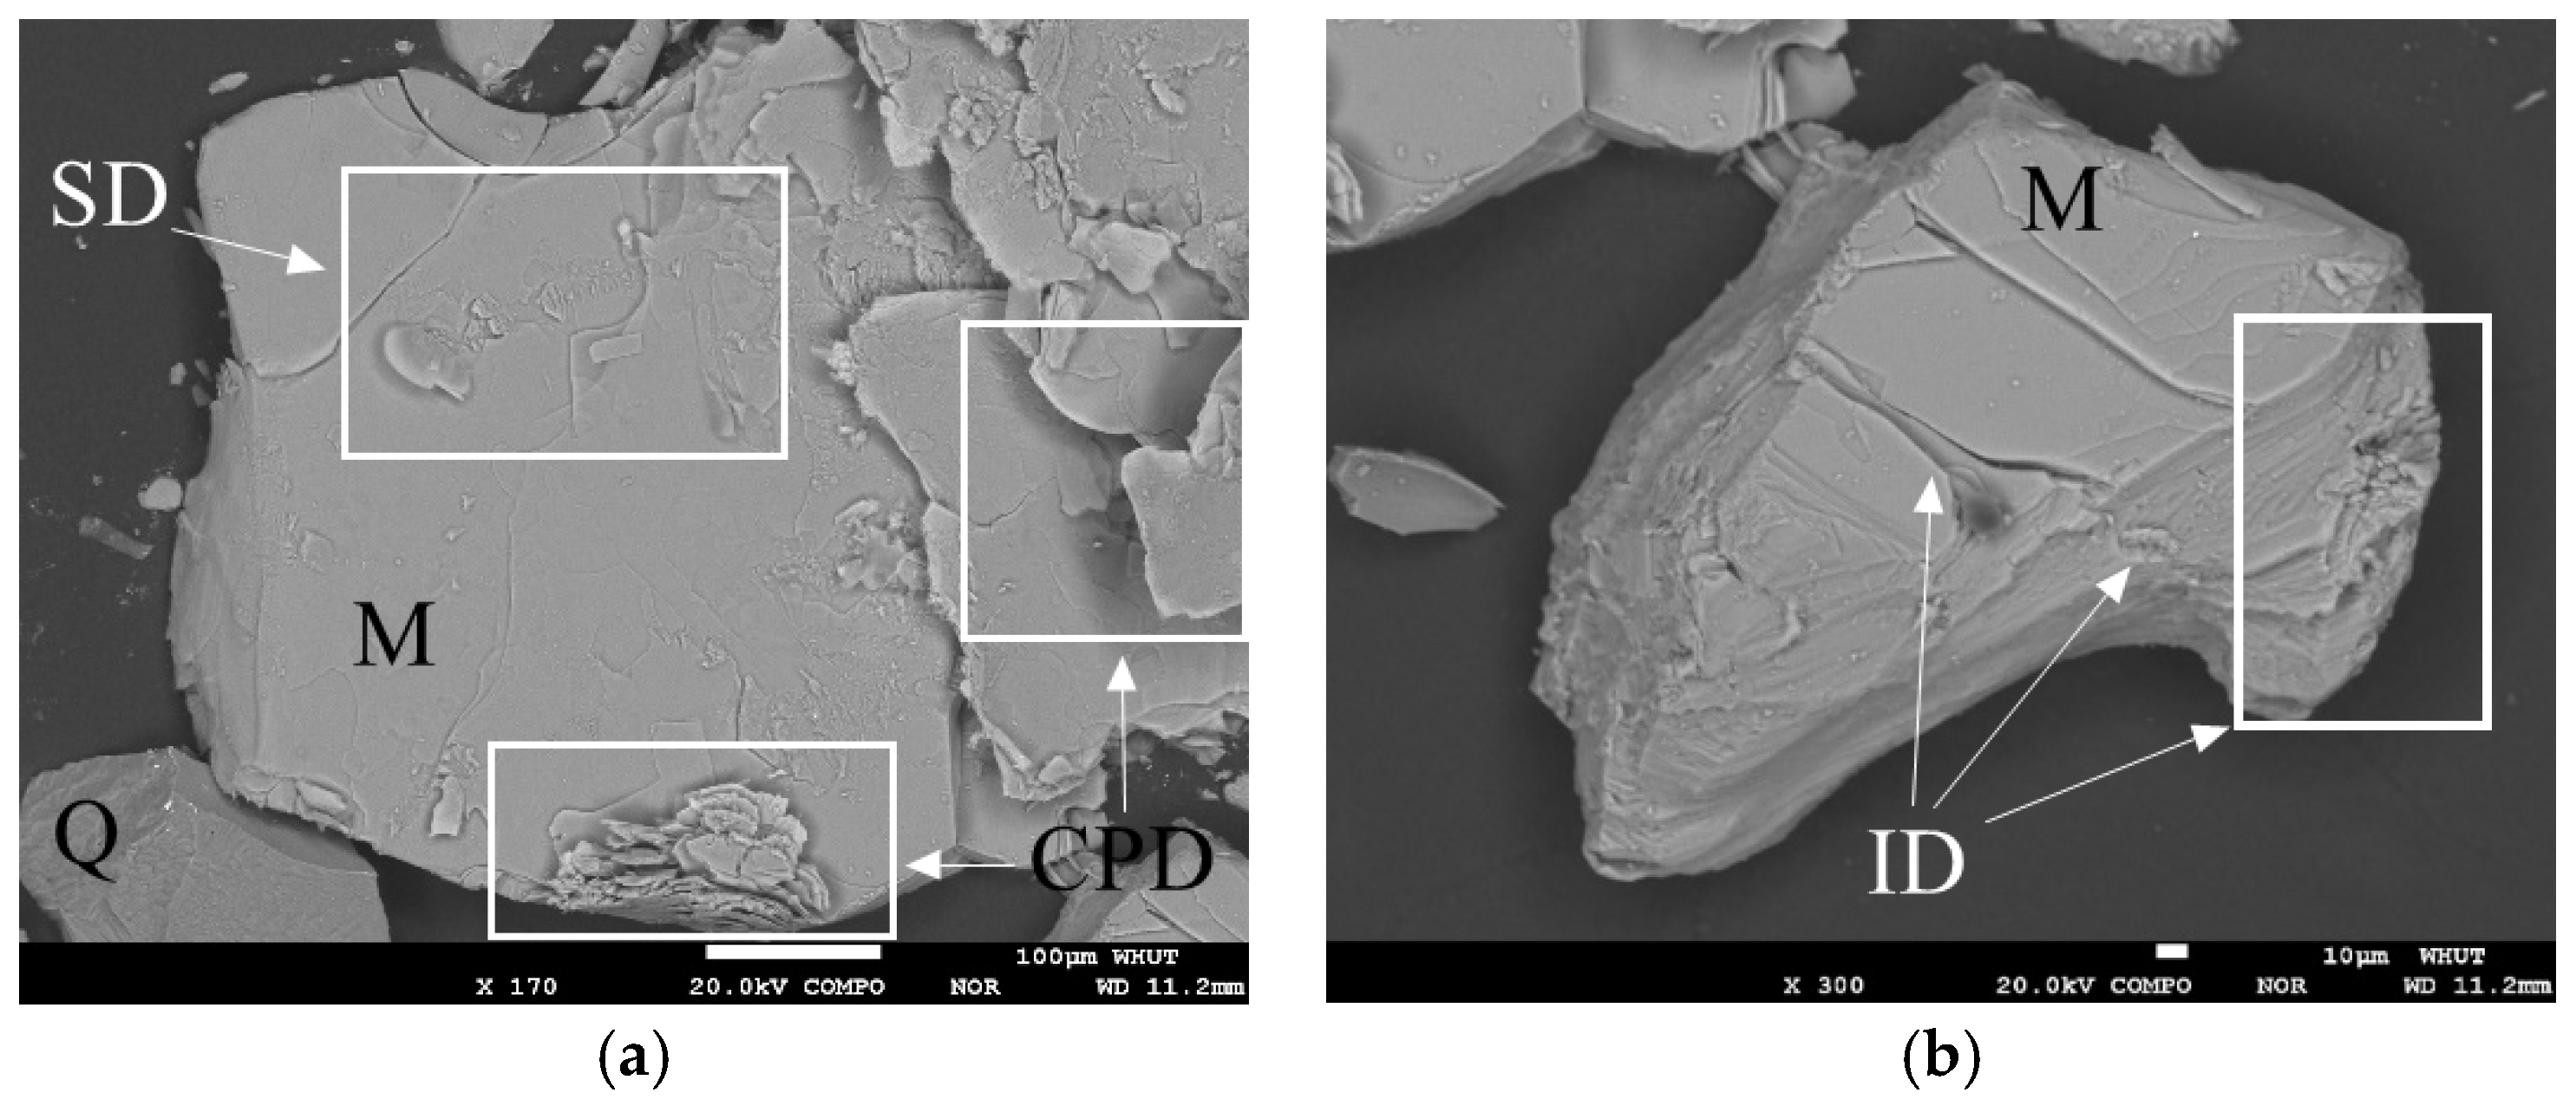
The calcination process, as a pretreatment technique, is commonly used to destroy crystal structure of muscovite so as to provide more active sites during later pressure leaching [16]. Structural damages around surface, edge, interior, and cleavage plane of muscovite in quartz sand are caused by high-temperature calcination (Figure 1). Surface oxidation, volatilization of interlayer water, and thermal dilation of muscovite during the calcination process led to the structural damage. In leaching processing, leaching agents dissolve the muscovite along its surface, but after calcination, the leaching sites of the muscovite are increased, and could be dissolved along fracture and cleavage planes, additionally.
3.2. Effect of Pressure Leaching on Muscovite
Calcinated quartz sand was leached by mixed agents consisting of H2SO4 and NH4Cl. During the leaching process, some factors, including the leaching temperature and agent concentration, have great influences on the dissolution and separation of trace muscovite from quartz. The dissolution behaviors of the trace muscovite in the H2SO4-NH4Cl leaching system were also investigated.
3.2.1. Effects of Leaching Conditions on Muscovite
The optical morphology of muscovite in calcinated quartz sand (Figure 2) shows its dissolution along the surface and fracture planes. Light transmittances of the muscovite increase with the leaching temperature. This indicates that leaching agents can directly dissolve the surface {001} of the muscovite. Observably different from Figure 2a–c, the muscovites in Figure 2d–f are efficiently dissolved from its edges. This shows that the pressure leaching process tends to dissolve the weakened of calcinated muscovite. The “gulf” in leached muscovite is caused by the dissolution tendency because the “gulf” area shows higher chemical activity than the others. Directional fractures are developed and expended to interlaced fracture when the leaching temperature was raised from 150 °C to 250 °C. The depth and width of the interlaced fractures are commonly deeper than the directional fractures, so the leaching process tends to further destroy the structure of the muscovite along the fractures caused by calcination.
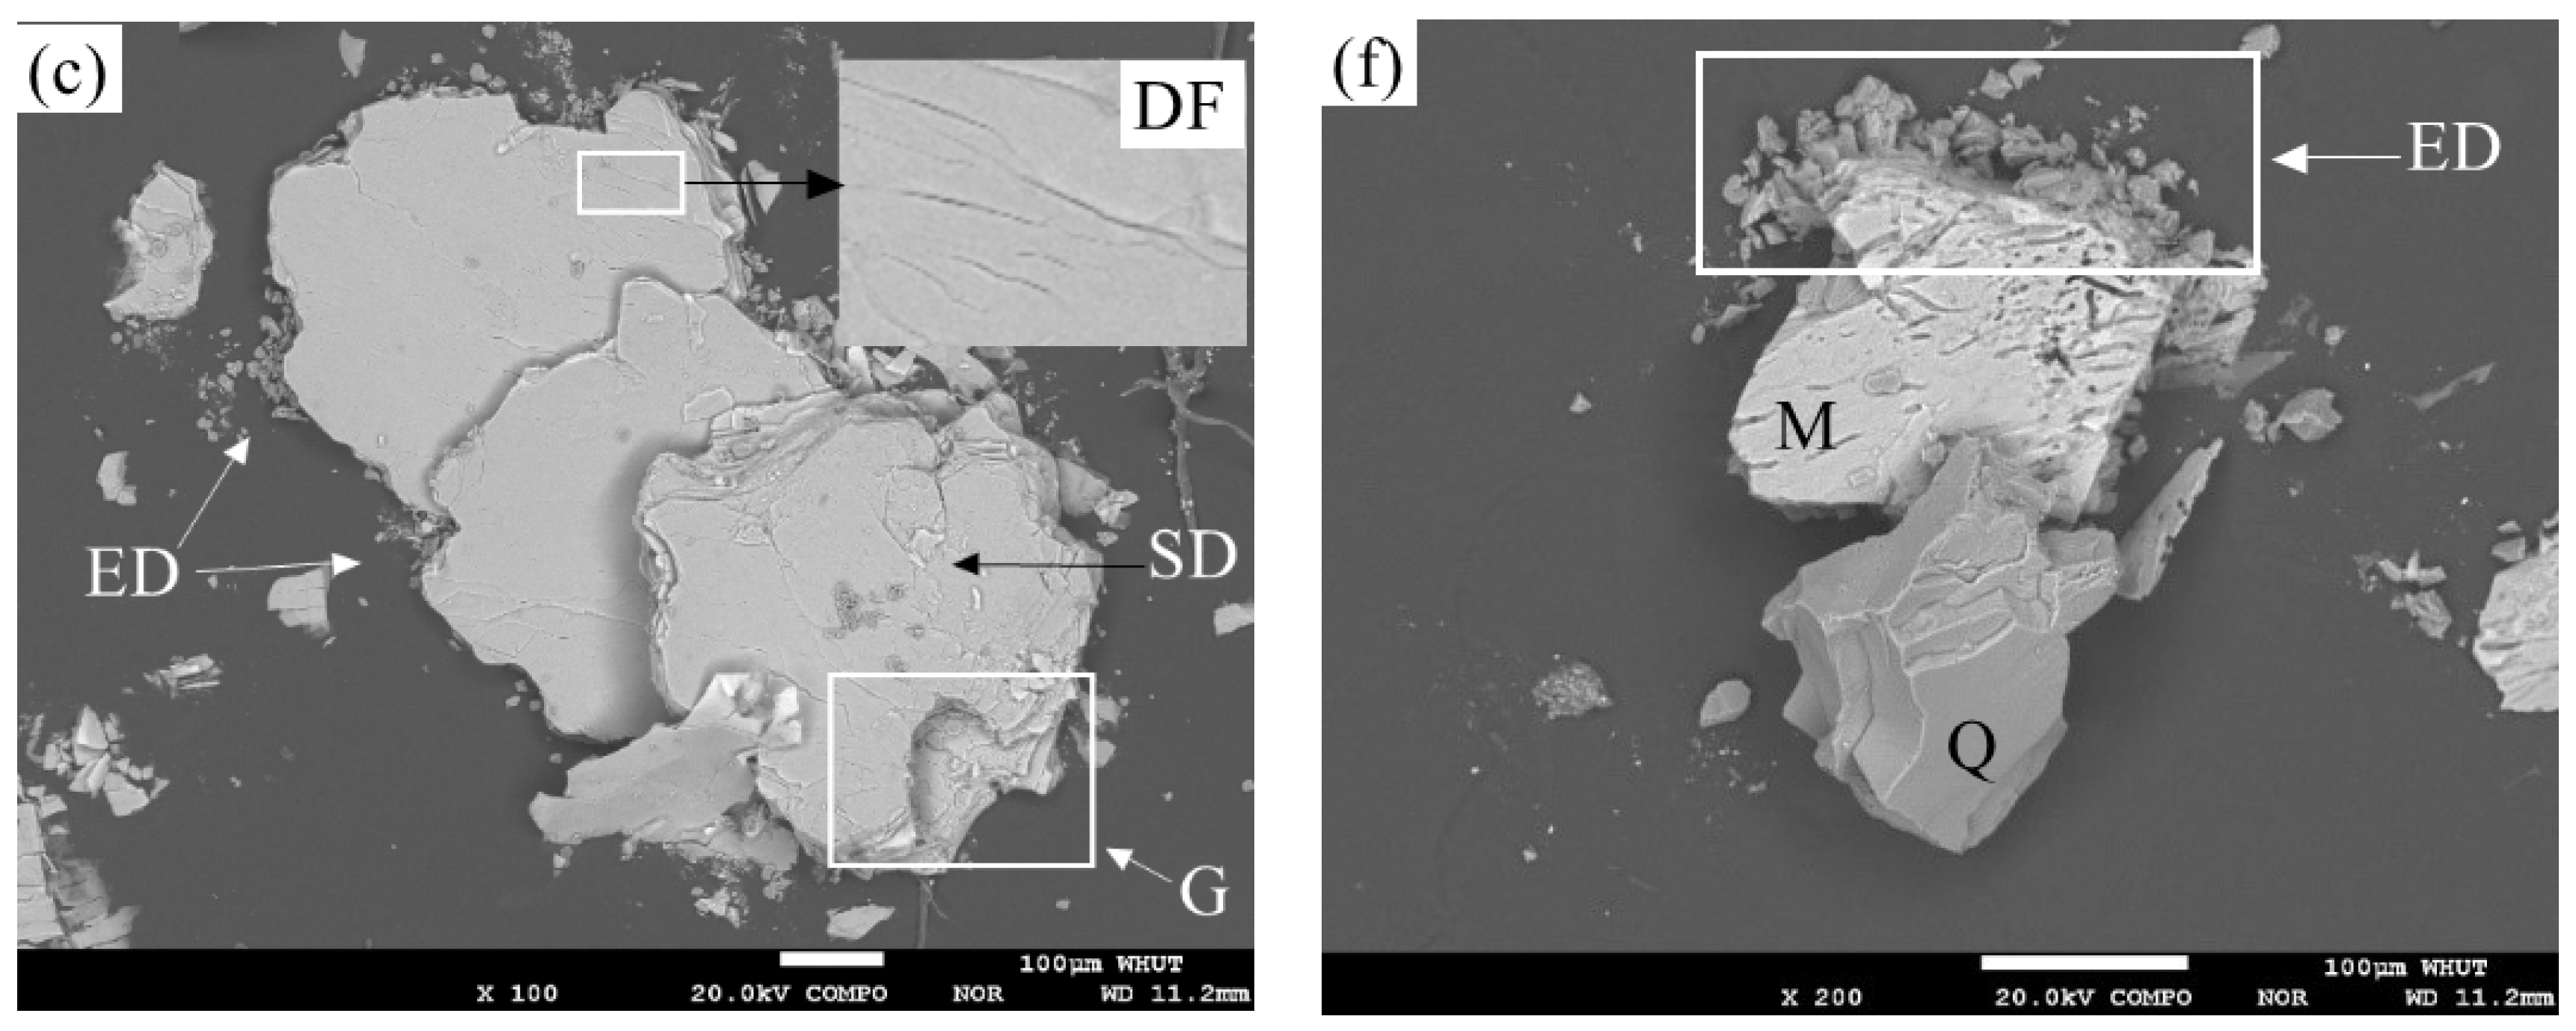
Similar results are obtained by electron probe micro-analysis. As shown in Figure 3, surface etching, edge damage, directional and interlaced fractures are the main results of the pressure leaching process. Structural damage is widely developed around muscovite surfaces (Figure 3a). With the rise of the leaching temperature, the structural damage is developed from the surface into the interior of the muscovite. Some directional fractures are produced in the internal layer of the muscovite when the leaching temperature reaches 250 °C (Figure 3c). With higher agent concentrations (Figure 3d–f), directional and interlaced fractures are quickly developed around the surface and the interior of the muscovite by the pressure leaching process. Flaky muscovite is transformed into active fragments (Figure 3d–f) with its structural damage. This indicates that the directional and interlaced fractures not only occur on the surface, but are also extended into the interior of the muscovite. The directional and interlaced fractures further lead to a whole disintegration of muscovite with their further extending. As shown in Figure 3c,f, the muscovite is destroyed into several parts along these fractures. Leaching agents can, therefore, enter into the interior of the muscovite along the fracture. The active fragments have a large specific area so as to promote leaching reactions. This indicates that the H2SO4-NH4Cl leaching system can accelerate the formation of the directional and interlaced fractures, and ultimately lead to the whole disintegration of the muscovite. Chemical dissolution of the edge of the muscovite further leads to a comminuted disintegration (Figure 3f). Leaching agents, therefore, enter into the cleavage planes of the muscovite, and further increases the cleavage plane spacing. The effects of calcination and pressure leaching on the fractures and cleavage planes lead to structural damage of the trace muscovite associated in quartz sand.
Integrated effects of the process on optical and surface morphologies are shown in Figure 4. Fractures not only exist on the surface of the muscovite, but also inside, because transmitted, crossed and polarized light can synthetically reflect the influences of this process on muscovite structures. The interference color (sky blue, an inexistent color in natural muscovite) of muscovite is caused during calcination. Polarized microscopic analysis shows that directional and interlaced fractures in muscovite are caused by the calcination process, and further developed during the pressure leaching process. The two processes, including calcination and pressure leaching, lead to significant changes in space structures of muscovite because the refractivity of natural muscovite is absolutely changed. These directional fractures, perpendicular to the longer side of the muscovite, are supposedly caused by heat stress, and transformed to the interlaced form by chemical dissolution during pressure leaching. Created fractures during the calcination process, and developed during the leaching process, provide new channels for internal diffusion of leaching agents and more active sites for dissolving muscovite.
Structural damage of muscovite is mainly distributed around the surface, edge, interior, and cleavage planes. The structural damage caused by the calcination process could reduce chemical reaction resistances, and provide more chemically active sites. During the pressure leaching process of calcinated quartz sand, the muscovite is further destroyed into several fragments with the formation of micro-fractures around the surface, edge, interior, and cleavage planes. The structural damage not only provides more chemically active sites to reduce the chemical reaction resistances, but also increases specific surface areas so as to reduce internal diffusion resistances of leaching agents. In general, the muscovite is dissolved and separated from quartz sand by coupling the effects of calcination and fluorine-free acid leaching.
3.2.2. Mechanism Analysis of Muscovite Dissolution
Natural pure muscovite (99.9 wt %) is used for analyses of TG-DSC and XRD. The DSC curve (Figure 5) shows a wide exothermic peak around 600–800 °C when the TG curve shows obvious mass loss due to dehydroxylation above 700 °C [19]. Results of thermal analyses of pure muscovite (TG-DSC) show that muscovite structure is destroyed by calcination above 600 °C. The DSC curve also shows two obvious exothermic peaks at 895.9 °C and 957.6 °C. The two exothermic peaks are due to recrystallizations of spinel and γ-Al2O3 [19,20]. Below 800 °C, distributions of most atomics, especially for Al and Si, are not changed [21]. Around 800–900 °C, AlVI–O octahedron close to the interlayer is destroyed with the break of Al–O bonds when the AlIV–O tetrahedron in the muscovite layer remains unchanged [20,21]. Thus, calcination at 900 °C triggers a dehydroxylation of muscovite, and further promotes the structural damage of AlVI–O octahedrons close to the interlayer. Since the trace muscovites are distributed uniformly in the quartz sand, the minor phases are difficult to be produced during calcination of actual minerals [15,21,22].
XRD patterns for natural, calcinated (at 900 °C), and leached muscovite (Figure 6) show crystal structural destruction during calcination. Diffraction peaks of crystal faces, including {001} and {003}, are seriously impaired by calcination at 900 °C, and further weakened after fluorine-free pressure leaching. Furthermore, diffraction peaks of crystal faces including {002}, {131}, {005}, and {151} almost disappear after calcination. This shows that the calcination process provides favorable conditions for pressure leaching of trace muscovite by transforming crystal muscovite into active structures. The active structures mainly include Si–O–K, Al–O–K, and Si–O–Al (Equation (1)) [23]. The active structures are disordered in atomic arrangement, but hold a certain shape (Figure 1) based on XRD analysis. Although effects of the pressure leaching process on the structure of calcinated muscovite are not so obvious in Figure 6, small differences in diffraction peaks of {001} and {003} may indicate great effects on dissolution of trace muscovite in hydrothermal vein quartz.
K2O·3Al2O3·6SiO2·2H2O→Si–O–K + Al–O–K + Si–O–Al + H2O↑
Analyses of XRD and TG-DSC shows that a small amount of calcinated muscovite only loses planar water so as to hold a metastable state (Equation (2)). The space between muscovite cleavage planes increases due to the evaporation of planar water. The expended cleavage planes provide an important channel for leaching of interlayer cations, especially for K+ (Equation (3)):
Furthermore, active Al–O–Si skeleton is also damaged during calcination. The compounds can easily be dissolved by H2SO4 without HF (Equation (4)). Meanwhile, the active structures are preferentially dissolved (Equation (5)):
Since H2SO4 is completely ionized in dilute leaching solution (Equation (6)), the concentration of H+ decreases with leaching time in leaching system of H2SO4 solution. However, NH4+ could provide a more stable leaching environment by its hydrolysis [24,25]. With the consumption of H+, the hydrolysis balance of NH4+ moved to the right for maintaining the concentration of H+ so as to reduce the chemical reaction resistances caused by the decreasing concentration of leaching agents (Equation (7)):
In addition, the NH4Cl is seen as an inhibitor and catalyzer by inhibiting a hydrolysis of Al3+, which is caused by the triggering of elevated temperatures and the Si–O− structure, and further promotes the dissolution of Al by introducing more H+ [16].
Surface morphologies of different layers of the muscovite in leached quartz sand are shown in Figure 7. The directional fracture not only exists in the muscovite surface, but also occurs in the internal layers. Some elements, including Si and K, in certain areas of the muscovite are preferentially leached, but leaching of Al is hysteretic. This indicates that chemical dissolution of muscovite edges are achieved by damaging Si–O–Al bonds. The possible reaction equation is shown in below:
Sulfur, a representational element of the main leaching agent (H2SO4), was just distributed around the edge of muscovite. This indicates that muscovite dissolution is a chemical process achieved by destroying the Si–O–Al bonds along the edge of muscovite. Active Al2O3 could be produced during the hydrolysis of leached Al3+, which is caused by the triggering of elevated temperatures and the Si–O− structure:
Dissolving Al3+ in strong acid is most likely to be hydrated in the muscovite hydrated layer. The shearing of S shows that S–OH in H2SO4 could react with muscovite Si–O–Al so as to realize H+ and Al3+ cation exchange. The Al would be dissolved again once the S–O–Al (Al2(SO4)3) enters into diffusion layer:
3.3. Removal Efficiency of Trace Muscovite from Vein Quartz
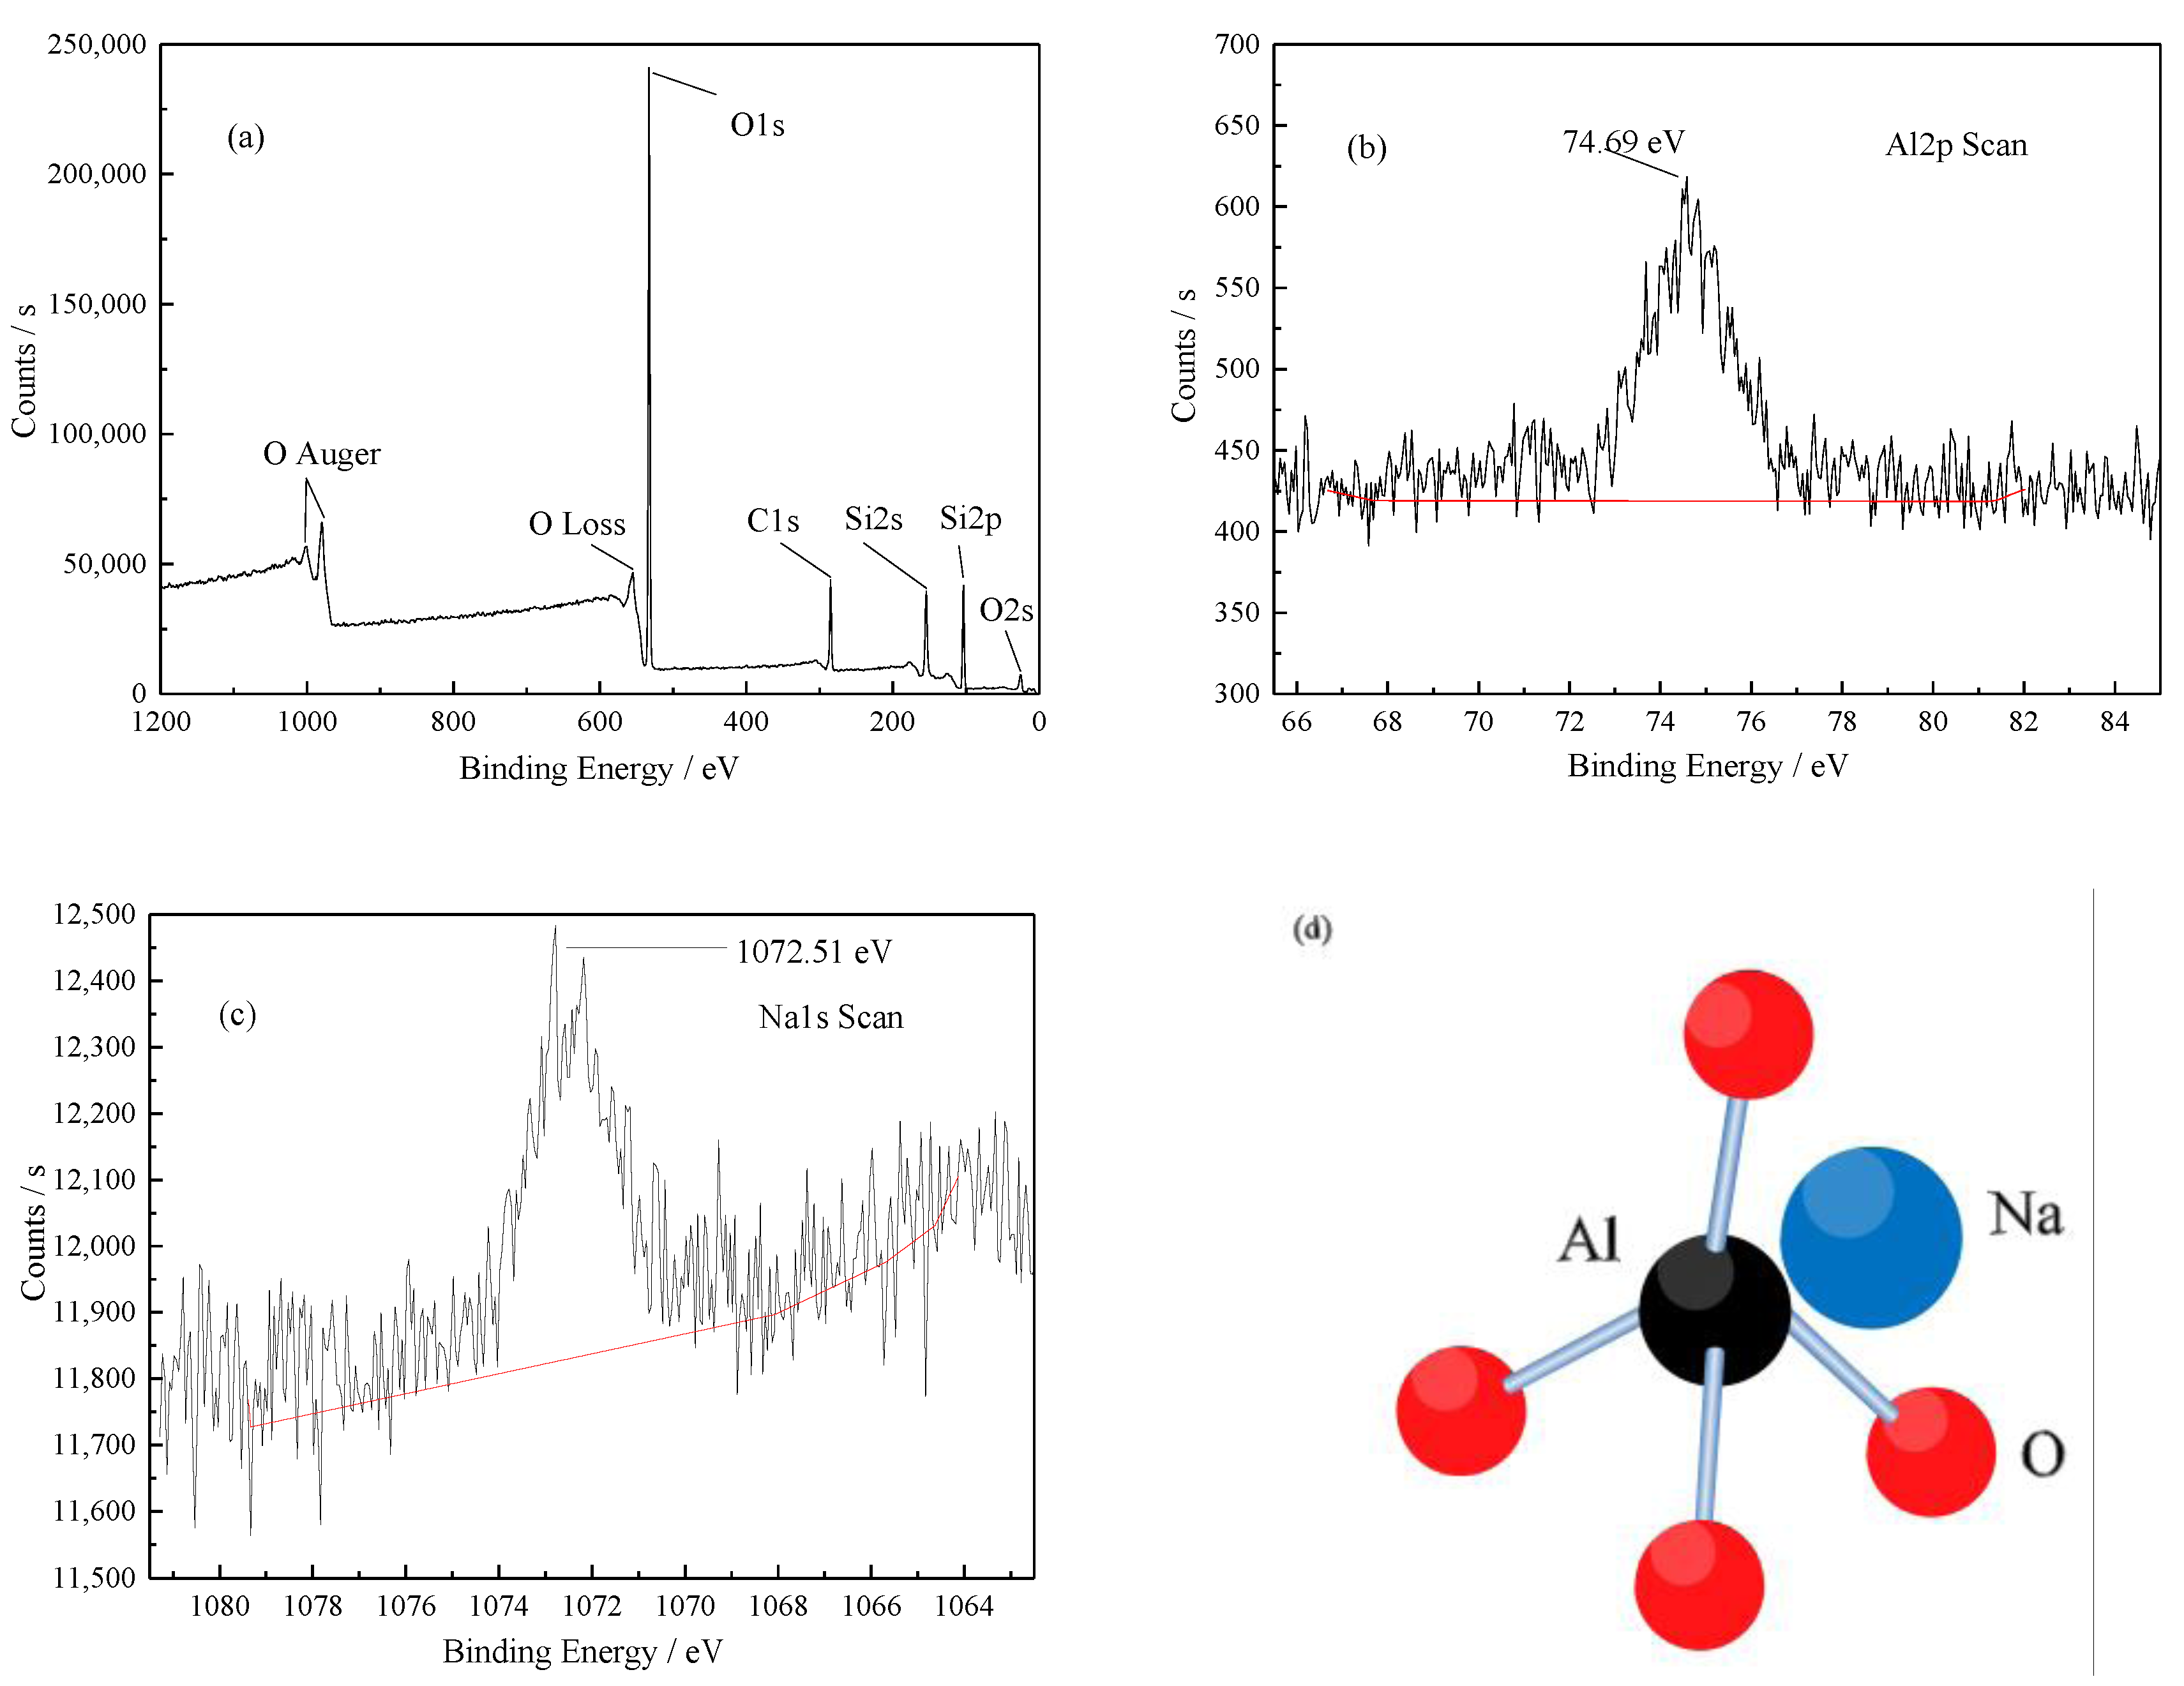
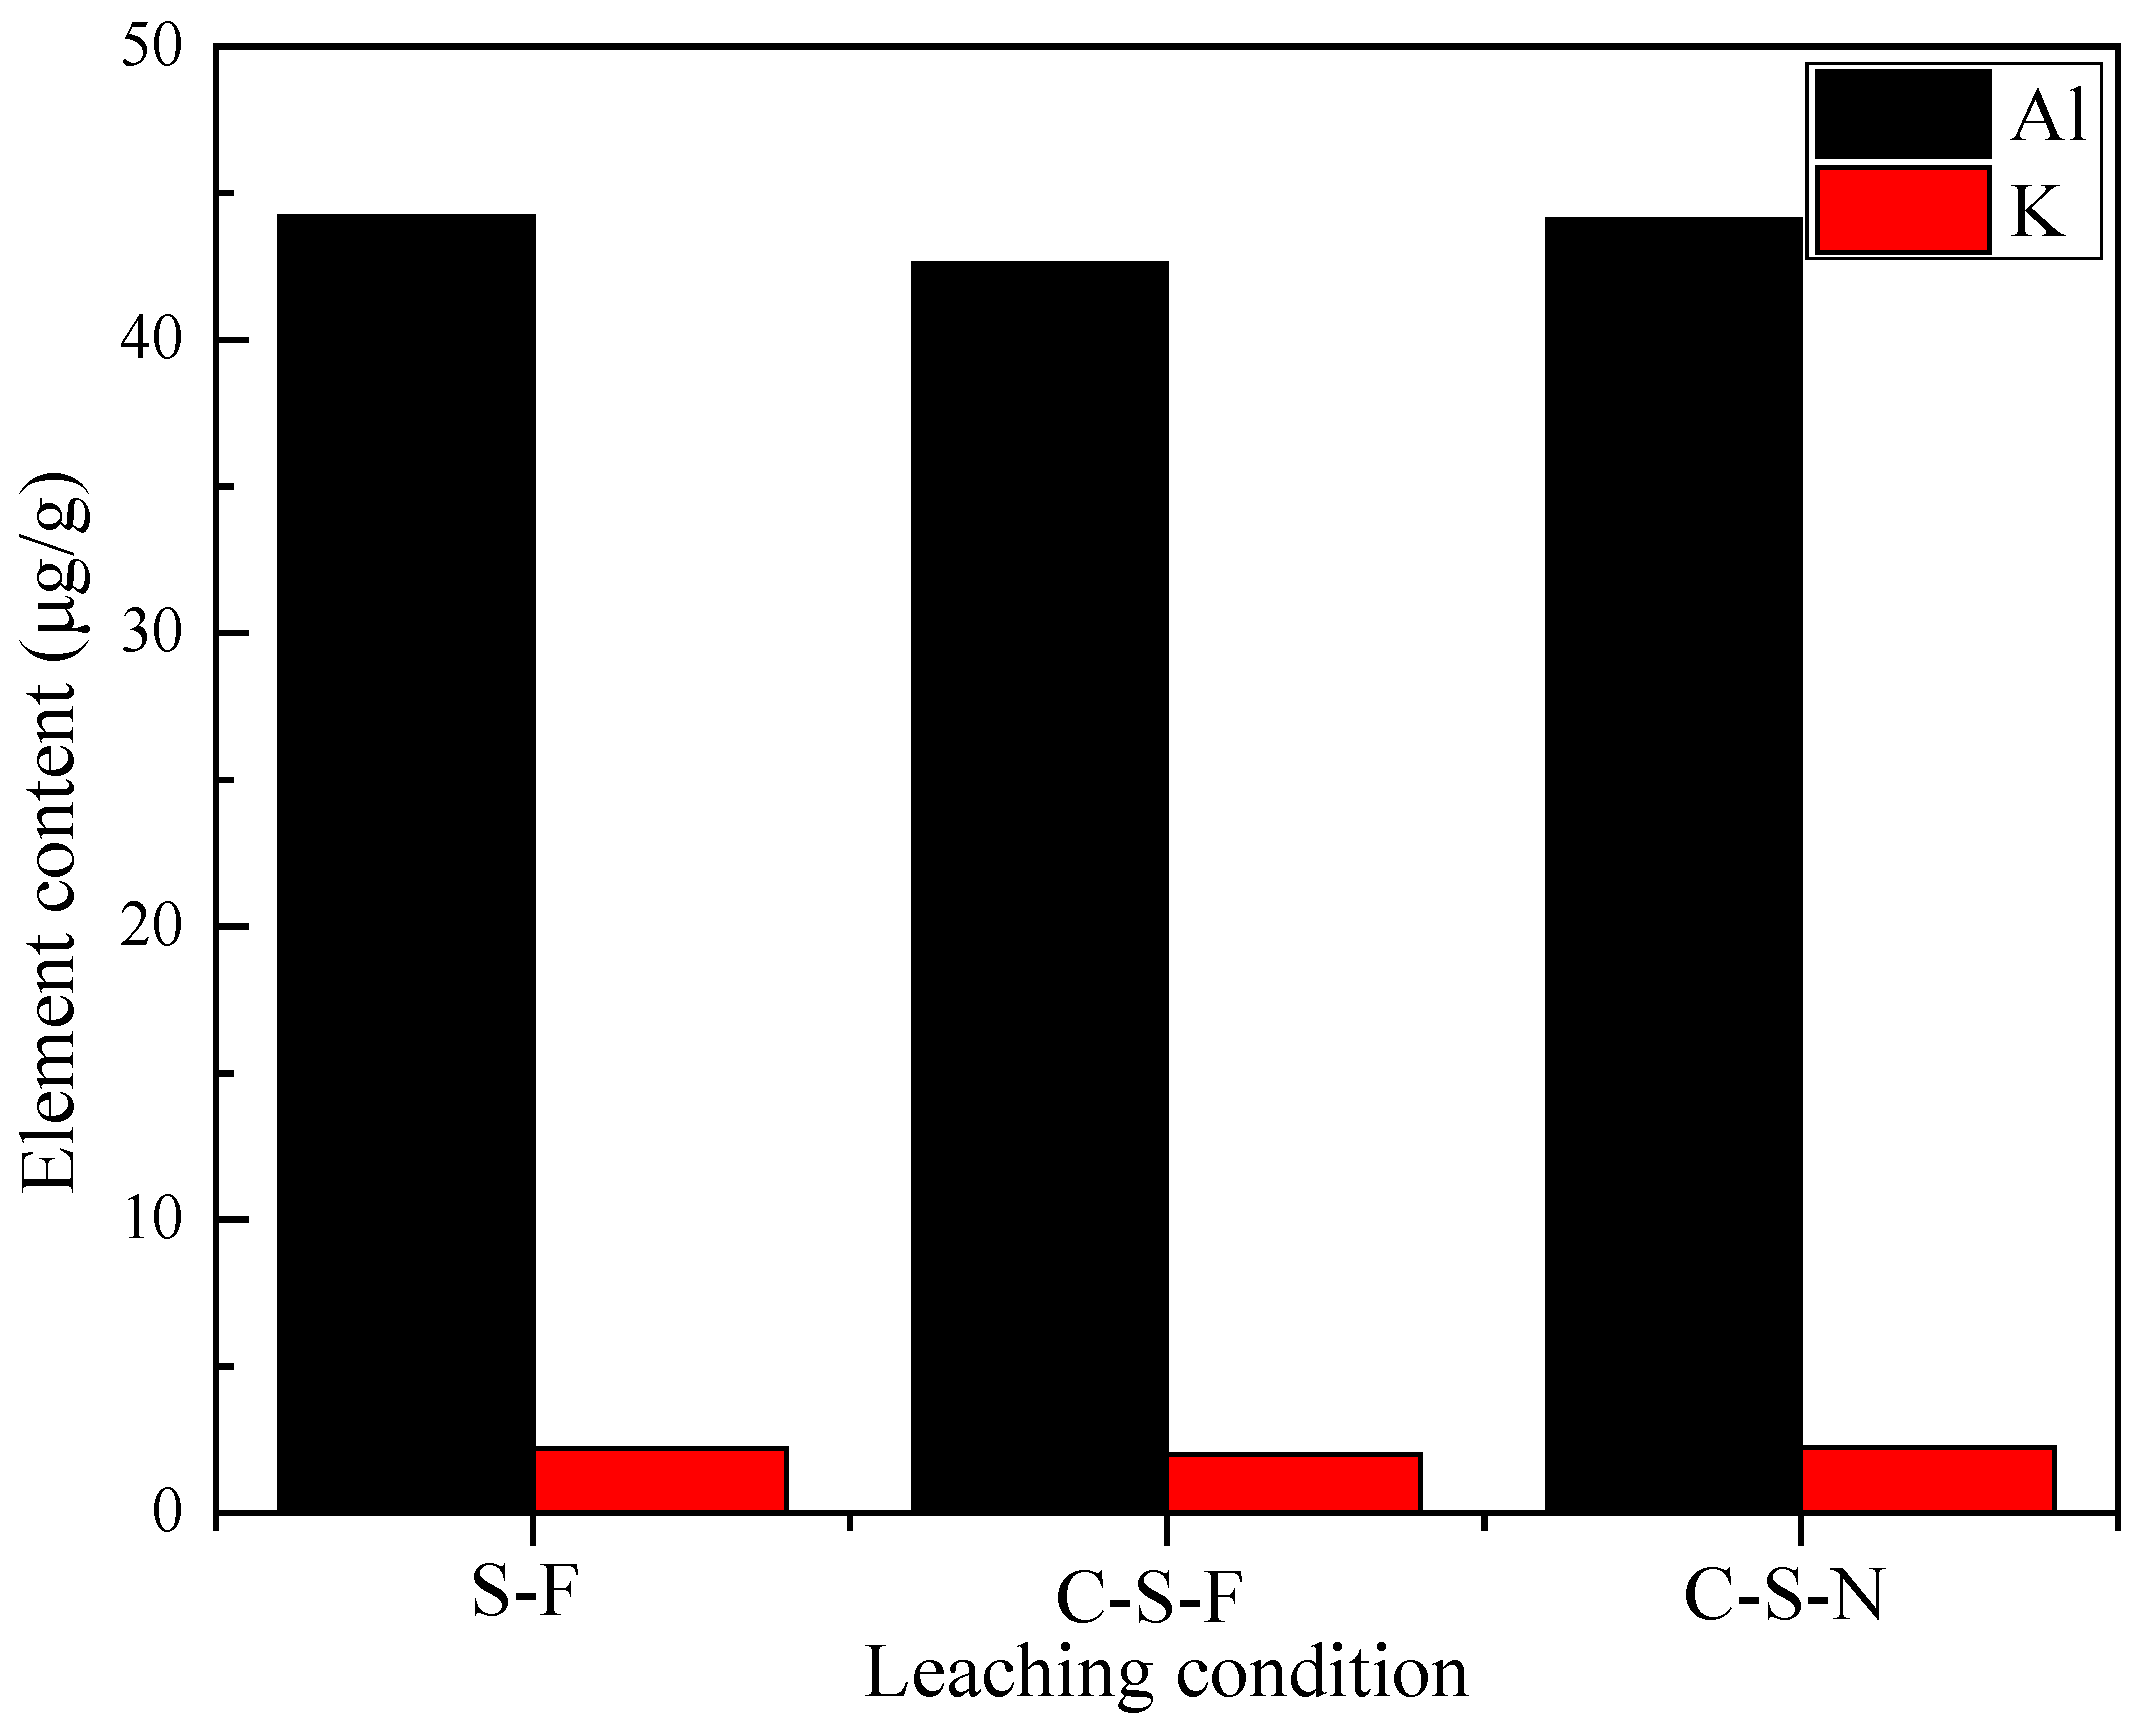
In conventional processing of low-grade silicate minerals, Al2O3 content is used for ascertaining the separation efficiency of aluminosilicate minerals and quartz [26]. However, the method error cannot be accepted in processing of high-grade quartz as Al is a major trace element in the quartz lattice [27,28,29]. The Al and K contents are reduced from 353 μg/g and 118 μg/g to 44.1 μg/g and 2.24 μg/g, respectively, when the calcinated quartz sand was leached by H2SO4-NH4Cl solution (0.30 mol/L H2SO4 and 0.45 mol/L NH4Cl) at 250 °C for 6 h (liquid/solid ratio = 5 mL/g) [15]. As shown in Figure 8, contents of Al and K cannot be further reduced even using excess leaching agents containing HF. This indicates that muscovite has been efficiently dissolved and separated. Moreover, Al (about 44 μg/g) remained in quartz concentrate could not exist in gangue mineral. As shown in Figure 9, quartz concentrate shows some Al and Na by XPS analysis. The K removal rate is 98.1% when that of Al and other elements are 87.5% and 84.0%, respectively. Obvious differences of K and Al removal rates shows that it is inadvisable to only use Al2O3 content to ascertain the separation efficiency of trace muscovite (Al–K host mineral) and quartz.
Narrow Al and Na spectra are shown in Figure 9b,c, and compared with those in the XPS handbook and native oxides, the two peaks are those of Al2O3 (74.7 eV) and Na (OX-1072.5 eV) [18,30]. Combined with replacement theory of Al and Si, the peak (74.69 eV) binding energy is the characteristic peak of the Al–O bond. As shown in Figure 9d, Al and Na replace Si in the tetrahedron [30,31,32,33,34,35]. Narrow patterns of possible lattice elements, including Fe, Li, Mg, Ti, and Ca, are not obtained. The phenomenon might be due to asymmetry distribution and low concentration of lattice impurities. XPS data show that Al is the main lattice trace element substitute in quartz and K in muscovite. Thus, the removal rate of K is more suitable for calculating the separation efficiency of trace muscovite and quartz:
where 118 μg/g is the content of element K in the calcinated quartz, 2.24 μg/g is the content of element K in the leached quartz sand.
Separation efficiency (muscovite) ≥ Removal rate (K) = (118 − 2.24)/118 = 98.1%
4. Conclusions
- (1)
- Calcination leads to structural damage of the trace muscovite around surface, edge, interior, and cleavage planes. Destroyed sites provide larger specific area and higher chemical activity so as to reduce internal diffusion resistances of leaching agents and chemical reaction resistances. Structural damage of trace muscovite are caused by high-temperature calcination, and further developed during pressure leaching of the quartz sand using H2SO4 and NH4Cl as leaching agents. The trace muscovite is dissolved and separated from quartz sand by coupling effects of calcination and fluorine-free pressure leaching.
- (2)
- Si and K within muscovite are preferentially leached before Al during fluorine-free pressure leaching of the hydrothermal vein quartz. S–OH in H2SO4 react with the Si–O–Al structure of calcinated muscovite so as to realize a cation exchange of H+ and Al3+. The remaining active Al2O3 is finally dissolved when Al2(SO4)3 enters into diffusion layer. The reason why the removal rate of Al is limited as 87.5% is that the remaining trace elements Al and Na replace Si in the quartz lattice.
Acknowledgments
This research was supported by the Open Foundation of Engineering Center of Avionics Electrical and Information Network of Guizhou Province Colleges and Universities (HKDZ201404). Special thanks to the Materials Research and Testing Center of Wuhan University of Technology.
Author Contributions
Zhenyu Pei and Min Lin conceived and designed the experiments; Zhenyu performed the experiments; Zhenyu Pei, Min Lin, and Shaomin Lei analyzed the data; Shaomin Lei contributed reagents/materials/analysis tools; and Zhenyu Pei wrote the paper.
Conflicts of Interest
The authors declare no conflict of interest. The founding sponsors had no role in the design of the study; in the collection, analyses, or interpretation of data; in the writing of the manuscript; or in the decision to publish the results.
References
- Wang, L.; Sun, W.; Hu, Y.H.; Xu, L.H. Adsorption mechanism of mixed anionic/cationic collectors in muscovite-quartz flotation system. Miner. Eng. 2014, 64, 44–50. [Google Scholar] [CrossRef]
- Marques, F.O.; Burlini, L.; Burg, J.P. Microstructure and mechanical properties of halite/coarse muscovite synthetic aggregates deformed in torsion. J. Struct. Geol. 2011, 33, 624–632. [Google Scholar] [CrossRef]
- Wang, L.; Liu, R.; Hu, Y.; Liu, J.; Sun, W. Adsorption behavior of mixed cationic/anionic surfactants and their depression mechanism on the flotation of quartz. Powder Technol. 2016, 302, 15–20. [Google Scholar] [CrossRef]
- Veglió, F.; Passariello, B.; Barbaro, M.; Plescia, P.; Marabini, A.M. Drum leaching tests in iron removal from quartz using oxalic and sulphuric acids. Int. J. Miner. Process. 1998, 54, 183–200. [Google Scholar] [CrossRef]
- Iuga, A.; Cuglesan, I.; Samuila, A.; Blajan, M. Electrostatic separation of muscovite mica from feldspathic pegmatites. IEEE Trans. Ind. Appl. 2004, 40, 422–429. [Google Scholar] [CrossRef]
- Marion, C.; Jordens, A.; Mccarthy, S.; Grammatikopoulos, T.; Waters, K.E. An investigation into the flotation of muscovite with an amine collector and calcium lignin sulfonate depressant. Sep. Purif. Technol. 2015, 149, 216–227. [Google Scholar] [CrossRef]
- Jordens, A.; Marion, C.; Grammatikopoulos, T.; Waters, K.E. Understanding the effect of mineralogy on muscovite flotation using QEMSCAN. Int. J. Miner. Process. 2016, 155, 6–12. [Google Scholar] [CrossRef]
- Vieira, A.M.; Peres, A.E.C. The effect of amine type, pH, and size range in the flotation of quartz. Miner. Eng. 2007, 20, 1008–1013. [Google Scholar] [CrossRef]
- Xu, L.; Wu, H.; Dong, F.; Wang, L.; Wang, Z.; Xiao, J. Flotation and adsorption of mixed cationic/anionic collectors on muscovite mica. Miner. Eng. 2013, 41, 41–45. [Google Scholar] [CrossRef]
- Monk, D.J.; Soane, D.S.; Howe, R.T. A review of the chemical reaction mechanism and kinetics for hydrofluoric acid etching of silicon dioxide for surface micromachining applications. Thin Solid Films 1993, 232, 1–12. [Google Scholar] [CrossRef]
- Knotter, D.M. Etching mechanism of vitreous silicon dioxide in HF-based solutions. J. Am. Chem. Soc. 2000, 122, 4345–4351. [Google Scholar] [CrossRef]
- Lei, S.M.; Guo, Z.H. Hazards of fluoride pollution and technical research progress of treating fluoride-containing waste water. Metal Mine 2012, 41, 152–155. [Google Scholar]
- Xue, N.N.; Zhang, Y.M.; Liu, T.; Huang, J.; Zheng, Q.S. Effects of hydration and hardening of calcium sulfate on muscovite dissolution during pressure acid leaching of black shale. J. Clean. Prod. 2017, 149, 989–998. [Google Scholar] [CrossRef]
- Xue, N.N.; Zhang, Y.M.; Liu, T.; Huang, J. Study of the dissolution behavior of muscovite in stone coal by oxygen pressure acid leaching. Metall. Mater. Trans. B Proc. Metall. Mater. Proc. Sci. 2016, 47, 694–701. [Google Scholar] [CrossRef]
- Lin, M.; Pei, Z.Y.; Lei, S.M. Mineralogy and Processing of Hydrothermal Vein Quartz from Hengche, Hubei Province (China). Minerals 2017, 7, 161. [Google Scholar] [CrossRef]
- Lin, M.; Pei, Z.Y.; Lei, S.M.; Liu, Y.Y.; Xia, Z.J.; Xie, F.X. Trace muscovite dissolution separation from vein quartz by elevated temperature and pressure acid leaching using sulphuric acid and ammonia chloride solutions. Physicochem. Probl. Mineral Process. 2017. [Google Scholar] [CrossRef]
- China Technical Committee for Standardization of Microbeam Analysis. GB/T 15617-2002 Methods for Quantitative Analysis of Silicate Minerals by Electron Probe; Standards Press of China: Beijing, China, 2002. [Google Scholar]
- Crist, B.V. Handbook of Monochromatic XPS Spectra, the Elements and Native Oxides; John Wiley & Sons: New York, NY, USA, 2000; pp. 20–106. [Google Scholar]
- Lin, L.; An, L.Y.; Liu, S.R. Study on extracting potassium from sericite by roasting. Ind. Miner. Process. 2012, 41, 12–15. [Google Scholar]
- He, D.S.; Li, Q.S.; Qang, X.C.; Liu, X.; Qin, F. Dissolution behavior of muscovite in mixed solution of sulfuric acid and hydrofluoric acid. Nonferrous Met. (Extr. Metall.) 2016, 12, 37–39. [Google Scholar]
- Liu, C.; Lin, J. Influence of calcination temperature on dielectric constant and structure of the micro-crystalline muscovite. China Non-Met. Min. Ind. Her. 2008, 5, 38–46. [Google Scholar]
- Lin, M.; Pei, Z.Y.; Liu, Y.Y.; Xia, Z.J.; Xiong, K.; Lei, S.M.; Wang, E.W. High-efficiency trace Na extraction from crystal quartz ore used for fused silica—A pretreatment technology. Int. J. Min. Met. Mater. 2017, 24, 1075–1086. [Google Scholar] [CrossRef]
- Lei, S.M.; Pei, Z.Y.; Zhong, L.L.; Ma, Q.L.; Huang, D.D.; Yang, Y.Y. Study on the technology and mechanism of reverse flotation and hot pressing leaching with vein quartz. Non-Met. Mines 2014, 2, 40–43. [Google Scholar]
- Ranjitham, A.M.; Khangaonkar, P.R. Leaching behaviour of calcinated magnesite with ammonium chloride solutions. Hydrometallurgy 1990, 23, 177–189. [Google Scholar] [CrossRef]
- Xu, L.J.; Qu, G.; Zhou, Z.G. A process for recovery leaching of strontium from strontium waste residues using ammonia chloride. J. Chongqin Univ. (Nat. Sci. Ed.) 2008, 31, 1174–1177. [Google Scholar]
- El-Salmawy, M.S.; Nakahiro, Y.; Wakamatsu, T. The role of alkaline earth cations in flotation separation of quartz from feldspar. Min. Eng. 1993, 6, 1231–1243. [Google Scholar] [CrossRef]
- Gotze, J. Classification, mineralogy and industrial potential of SiO2, minerals and rocks. In Quartz: Deposits, Mineralogy and Analytics, 1st ed.; Möckel, R., Ed.; Springer-Verlag: Berlin/Heidelberg, Germany, 2012; pp. 1–27. [Google Scholar]
- Beall, G.H. Industrial applications of silica. Silica Phys. Behav. Geochem. Mater. Appl. 1994, 29, 469–505. [Google Scholar]
- Gotze, J. Chemistry, textures and physical properties of quartz—Geological interpretation and technical application. Mineral. Mag. 2009, 73, 645–671. [Google Scholar] [CrossRef]
- Shea, J.J. Handbook of monochromatic XPS spectra—The elements and native oxides [book review]. IEEE Electr. Insul. Mag. 2003, 19, 73. [Google Scholar] [CrossRef]
- Zang, F.F.; Lei, S.M.; Zhong, L.L.; Pei, Z.Y.; Yang, Y.Y.; Xiong, K. Purification of vein quartz by mixed acid thermal pressure leaching and it’s mechanism. China Min. Mag. 2016, 25, 106–110. [Google Scholar]
- Liu, Y.F.; Huang, Z.L.; Yang, N.; Sun, J.J. The research of preparation of ultra-pure quartz sand. Non-Met. Mines 2016, 39, 84–86. [Google Scholar]
- Lei, S.M.; Lin, M.; Pei, Z.Y.; Wang, E.W.; Zang, F.F.; Xiong, K. Occurrence and removal of mineral impurities in quartz. China Min. Mag. 2016, 25, 79–83. [Google Scholar]
- Pankrath, R.; Florke, O.W. Kinetics of Al-Si exchange in low and high quartz: Calculation of al diffusion coefficients. Eur. J. Mineral. 1994, 6, 435–457. [Google Scholar] [CrossRef]
- Botis, S.M.; Pan, Y. Theoretical calculations of [AlO4/M+]0 defects in quartz and crystal-chemical controls on the uptake of Al. Mineral. Mag. 2009, 73, 537–550. [Google Scholar] [CrossRef]
Figure 1.
Surface topographies of muscovite in calcinated quartz sand: surface damage (SD), cleavage plane damage (CPD), interior damage (ID), quartz (Q), and muscovite (M): (a) flaky muscovite, (b) platelike muscovite.
Figure 1.
Surface topographies of muscovite in calcinated quartz sand: surface damage (SD), cleavage plane damage (CPD), interior damage (ID), quartz (Q), and muscovite (M): (a) flaky muscovite, (b) platelike muscovite.

Figure 2.
Optical morphology of muscovite within leached quartz sand: (1) 0.025 mol/L H2SO4, 0.050 mol/L NH4Cl (a) −150 °C; (b) −200 °C; (c) −250 °C; (2) 0.050 mol/L H2SO4, 0.100 mol/L NH4Cl (d) −150 °C; (e) −200 °C; and (f) −250 °C; DF—directional fracture, IF—interlaced fracture. G—“gulf”; the scale bars are the same.
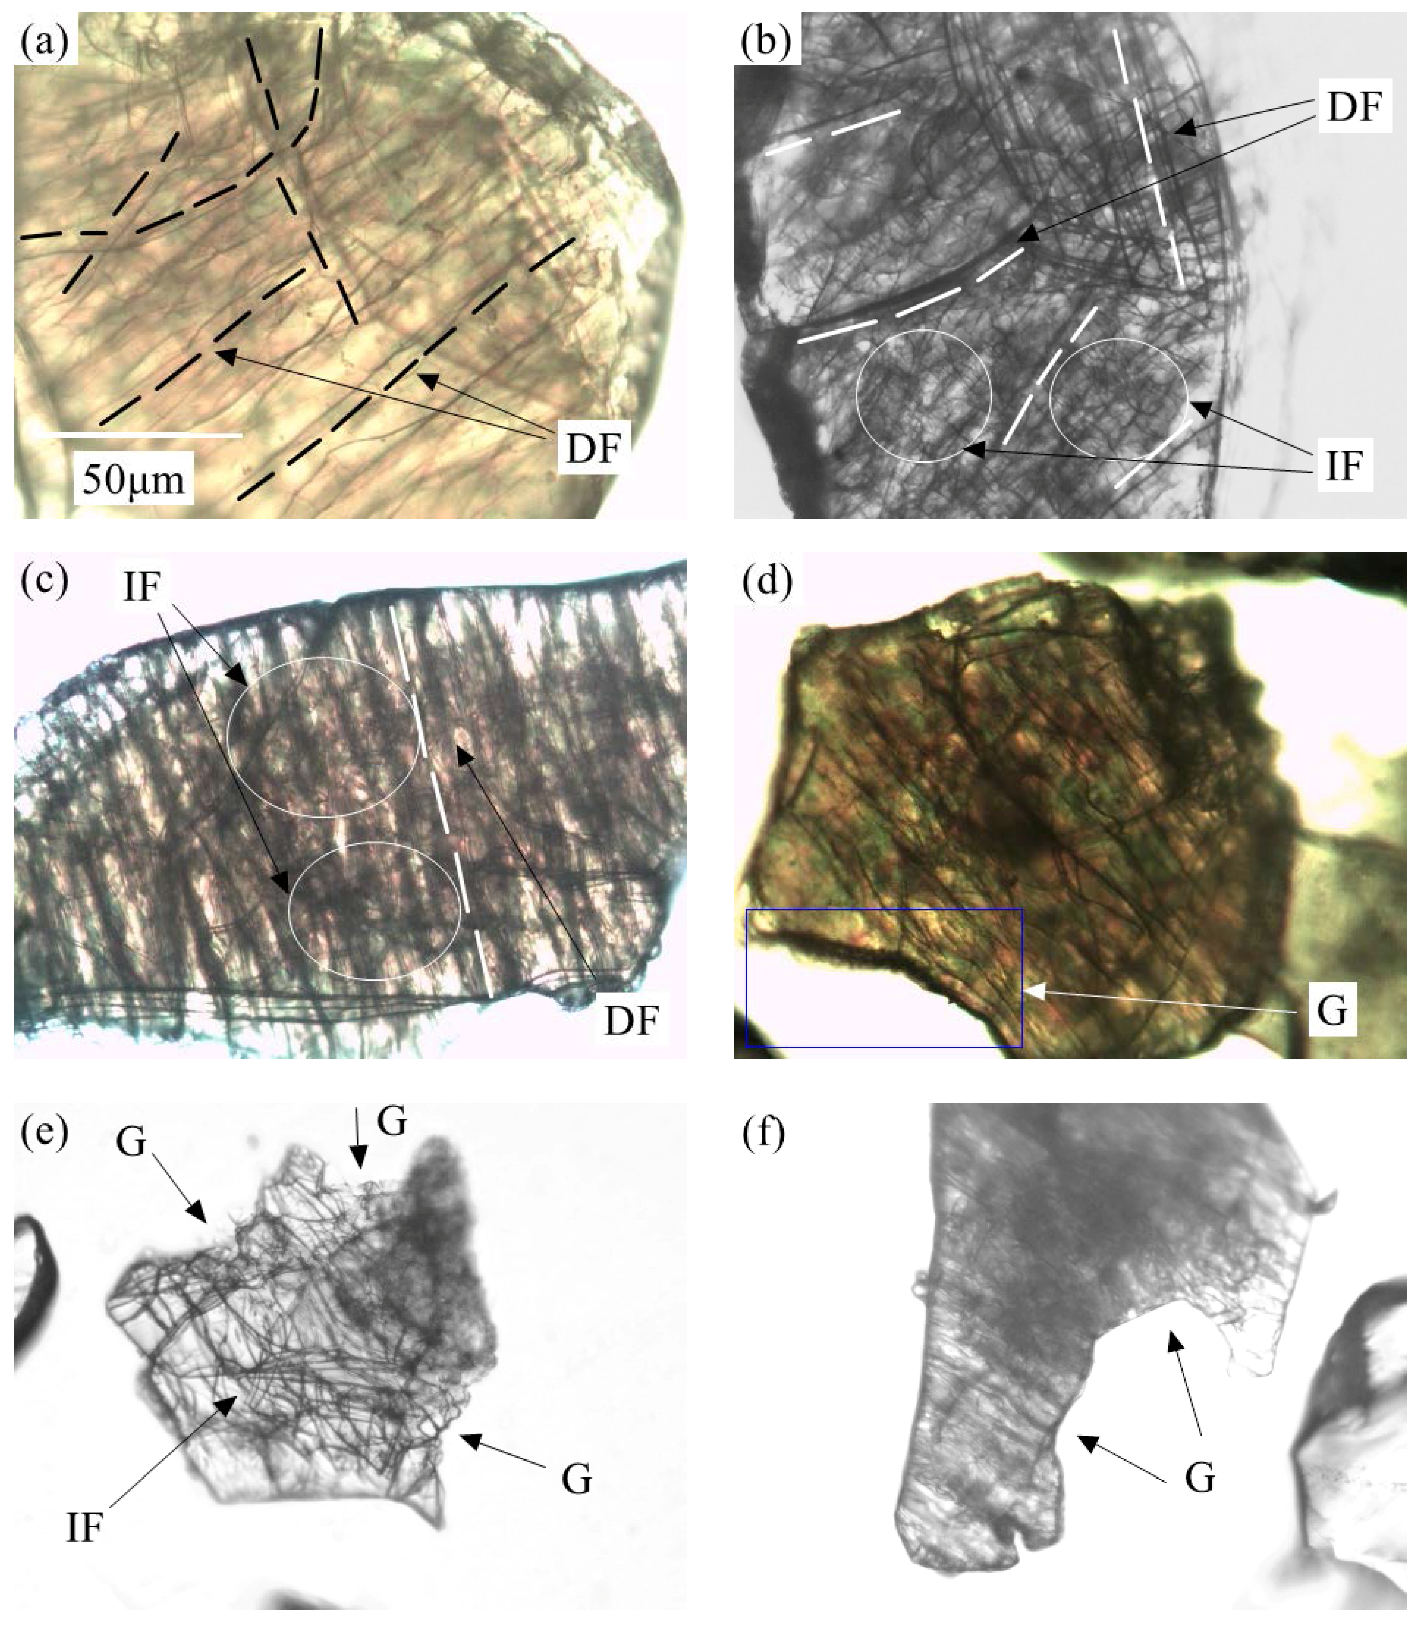
Figure 3.
Surface topography of muscovite in leached quartz sand: (1) 0.025 mol/L H2SO4, 0.050 mol/L NH4Cl (a) −150 °C; (b) −200 °C; (c) −250 °C; (2) 0.050 mol/L H2SO4, 0.100 mol/L NH4Cl (d) −150 °C; (e) −200 °C; and (f) −250 °C; SD—surface damage, F—fracture, DF—directional fracture, IF—interlaced fracture, ED—edge damage, M—muscovite, and Q—quartz.
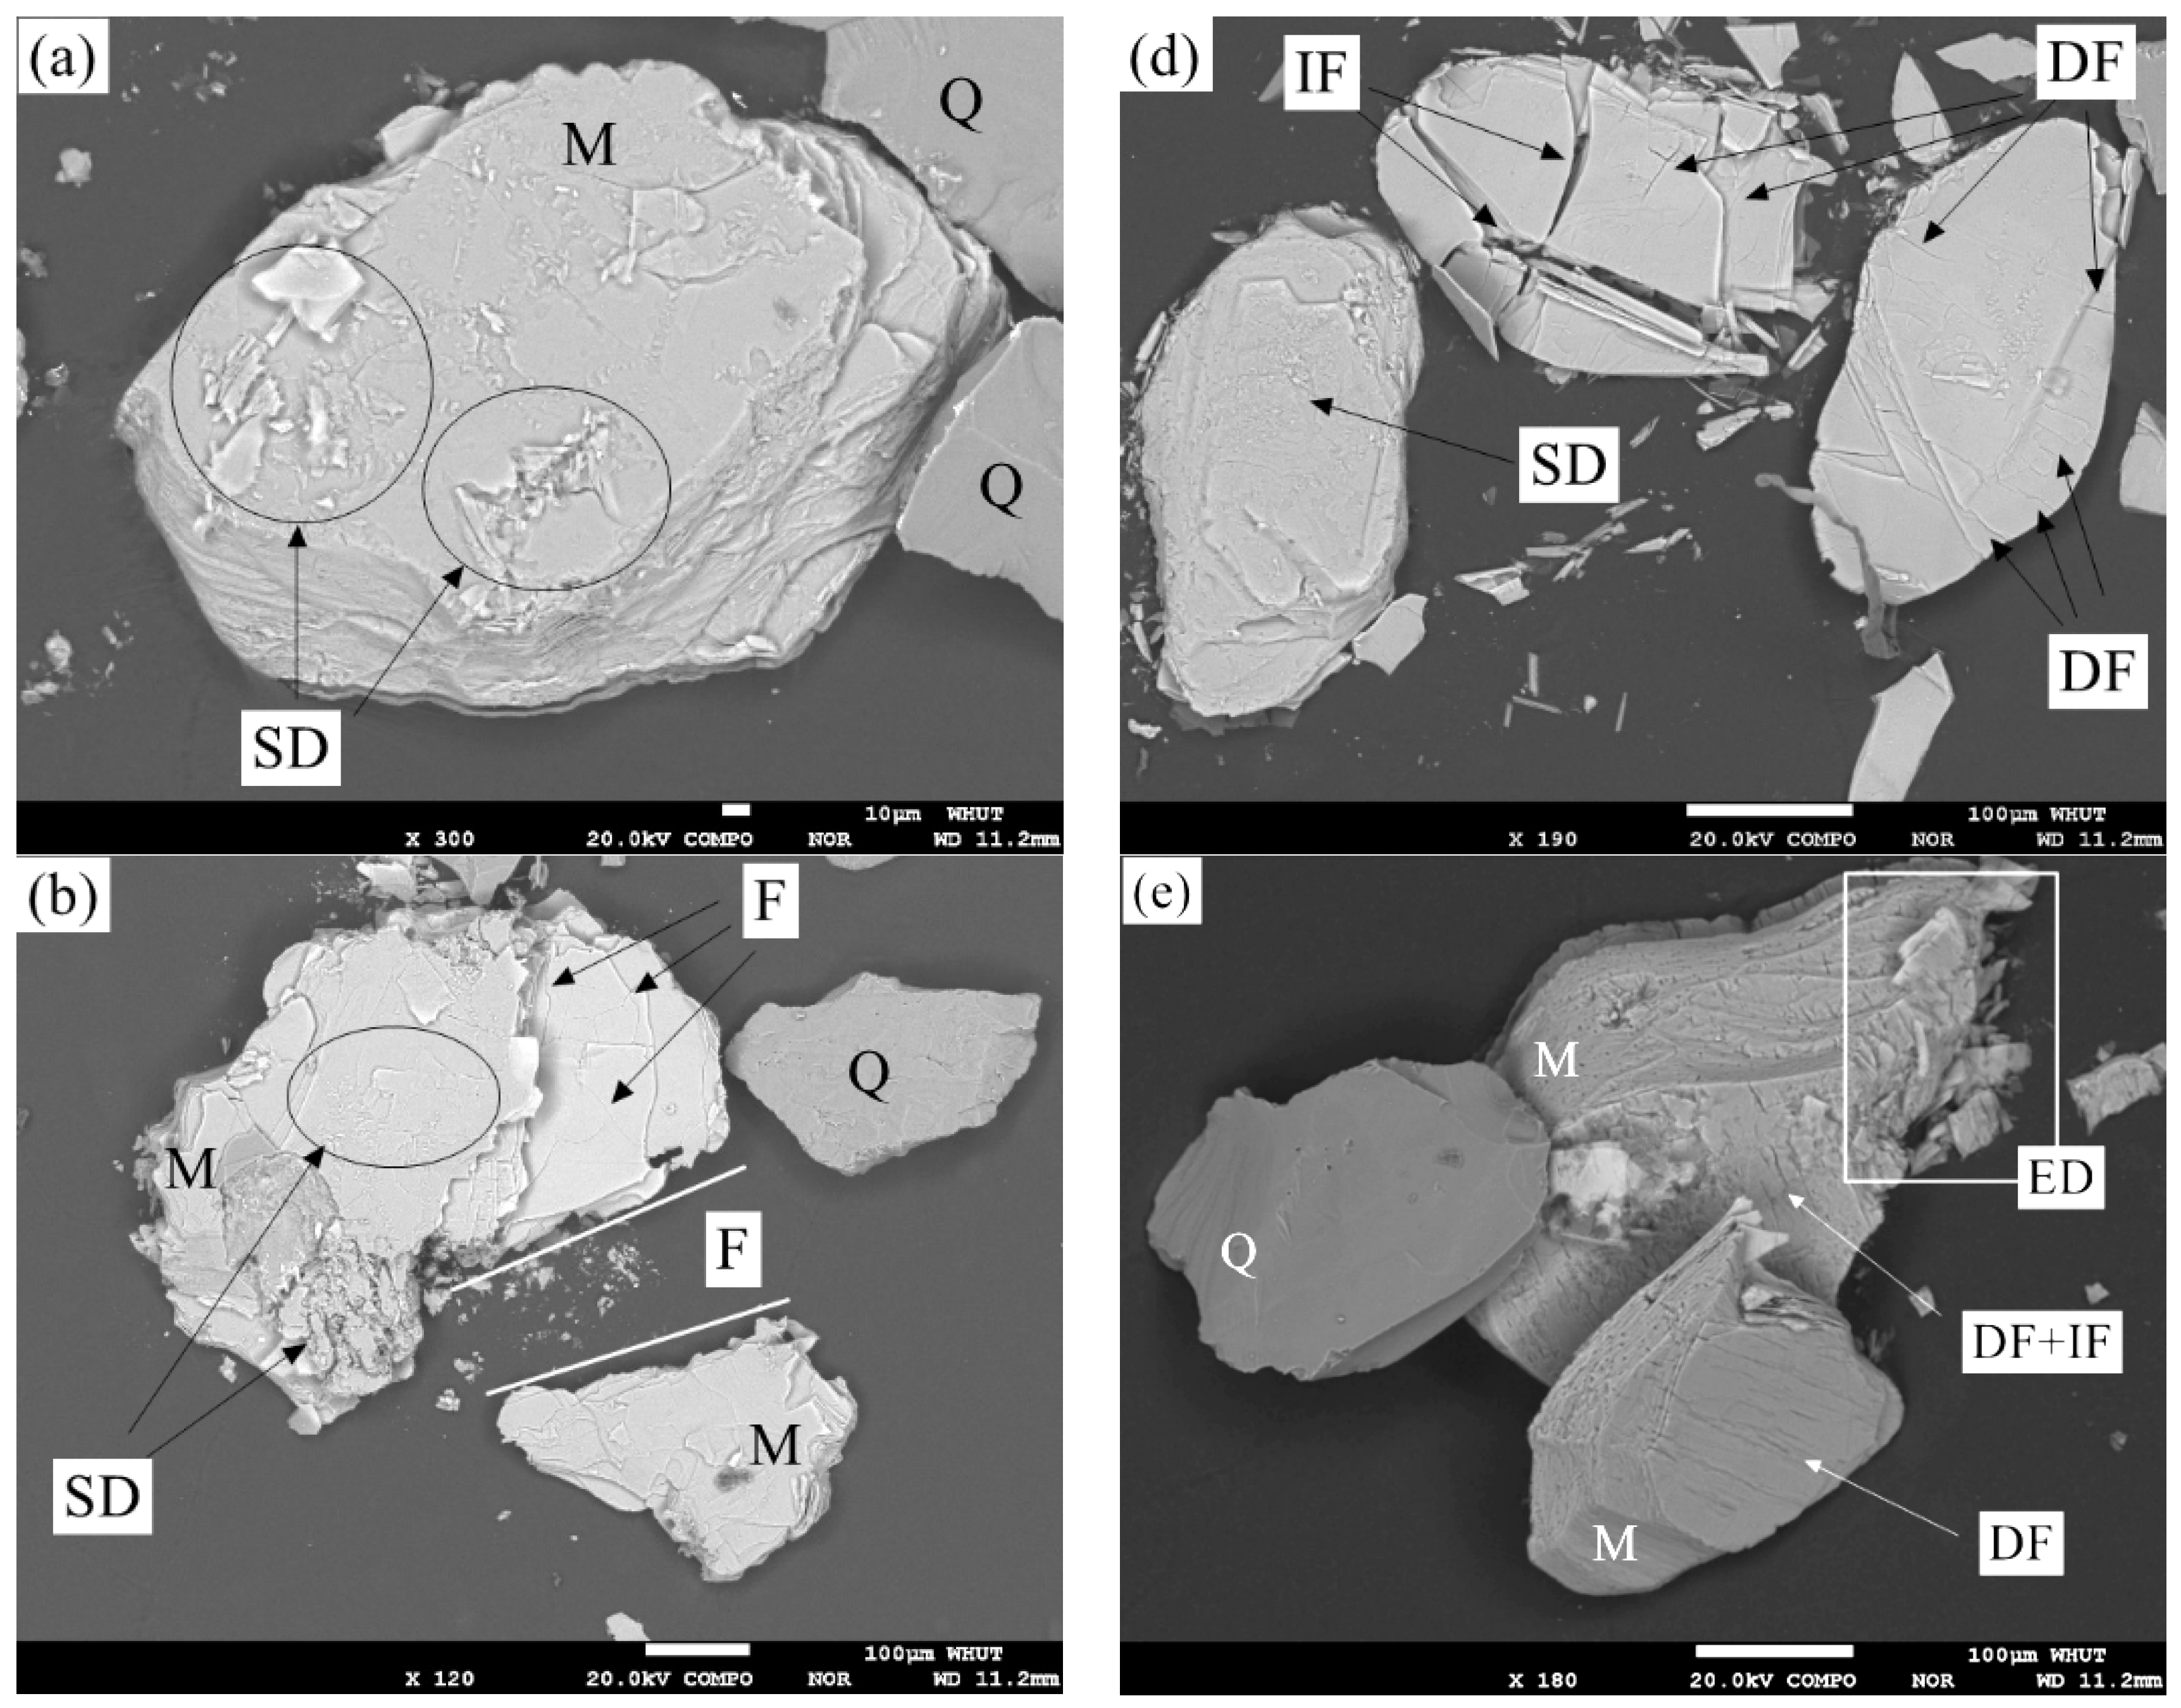

Figure 4.
Polarizing luminescence of muscovite at transmitted, crossed, and polarized light: (a) muscovite within calcinated quartz sand (900 °C for 5 h); and (b) muscovite within leached quartz sand (0.100 mol/L H2SO4, 0.200 mol/L NH4Cl, 5 mL/g of L/S ratio, 200 °C).
Figure 4.
Polarizing luminescence of muscovite at transmitted, crossed, and polarized light: (a) muscovite within calcinated quartz sand (900 °C for 5 h); and (b) muscovite within leached quartz sand (0.100 mol/L H2SO4, 0.200 mol/L NH4Cl, 5 mL/g of L/S ratio, 200 °C).
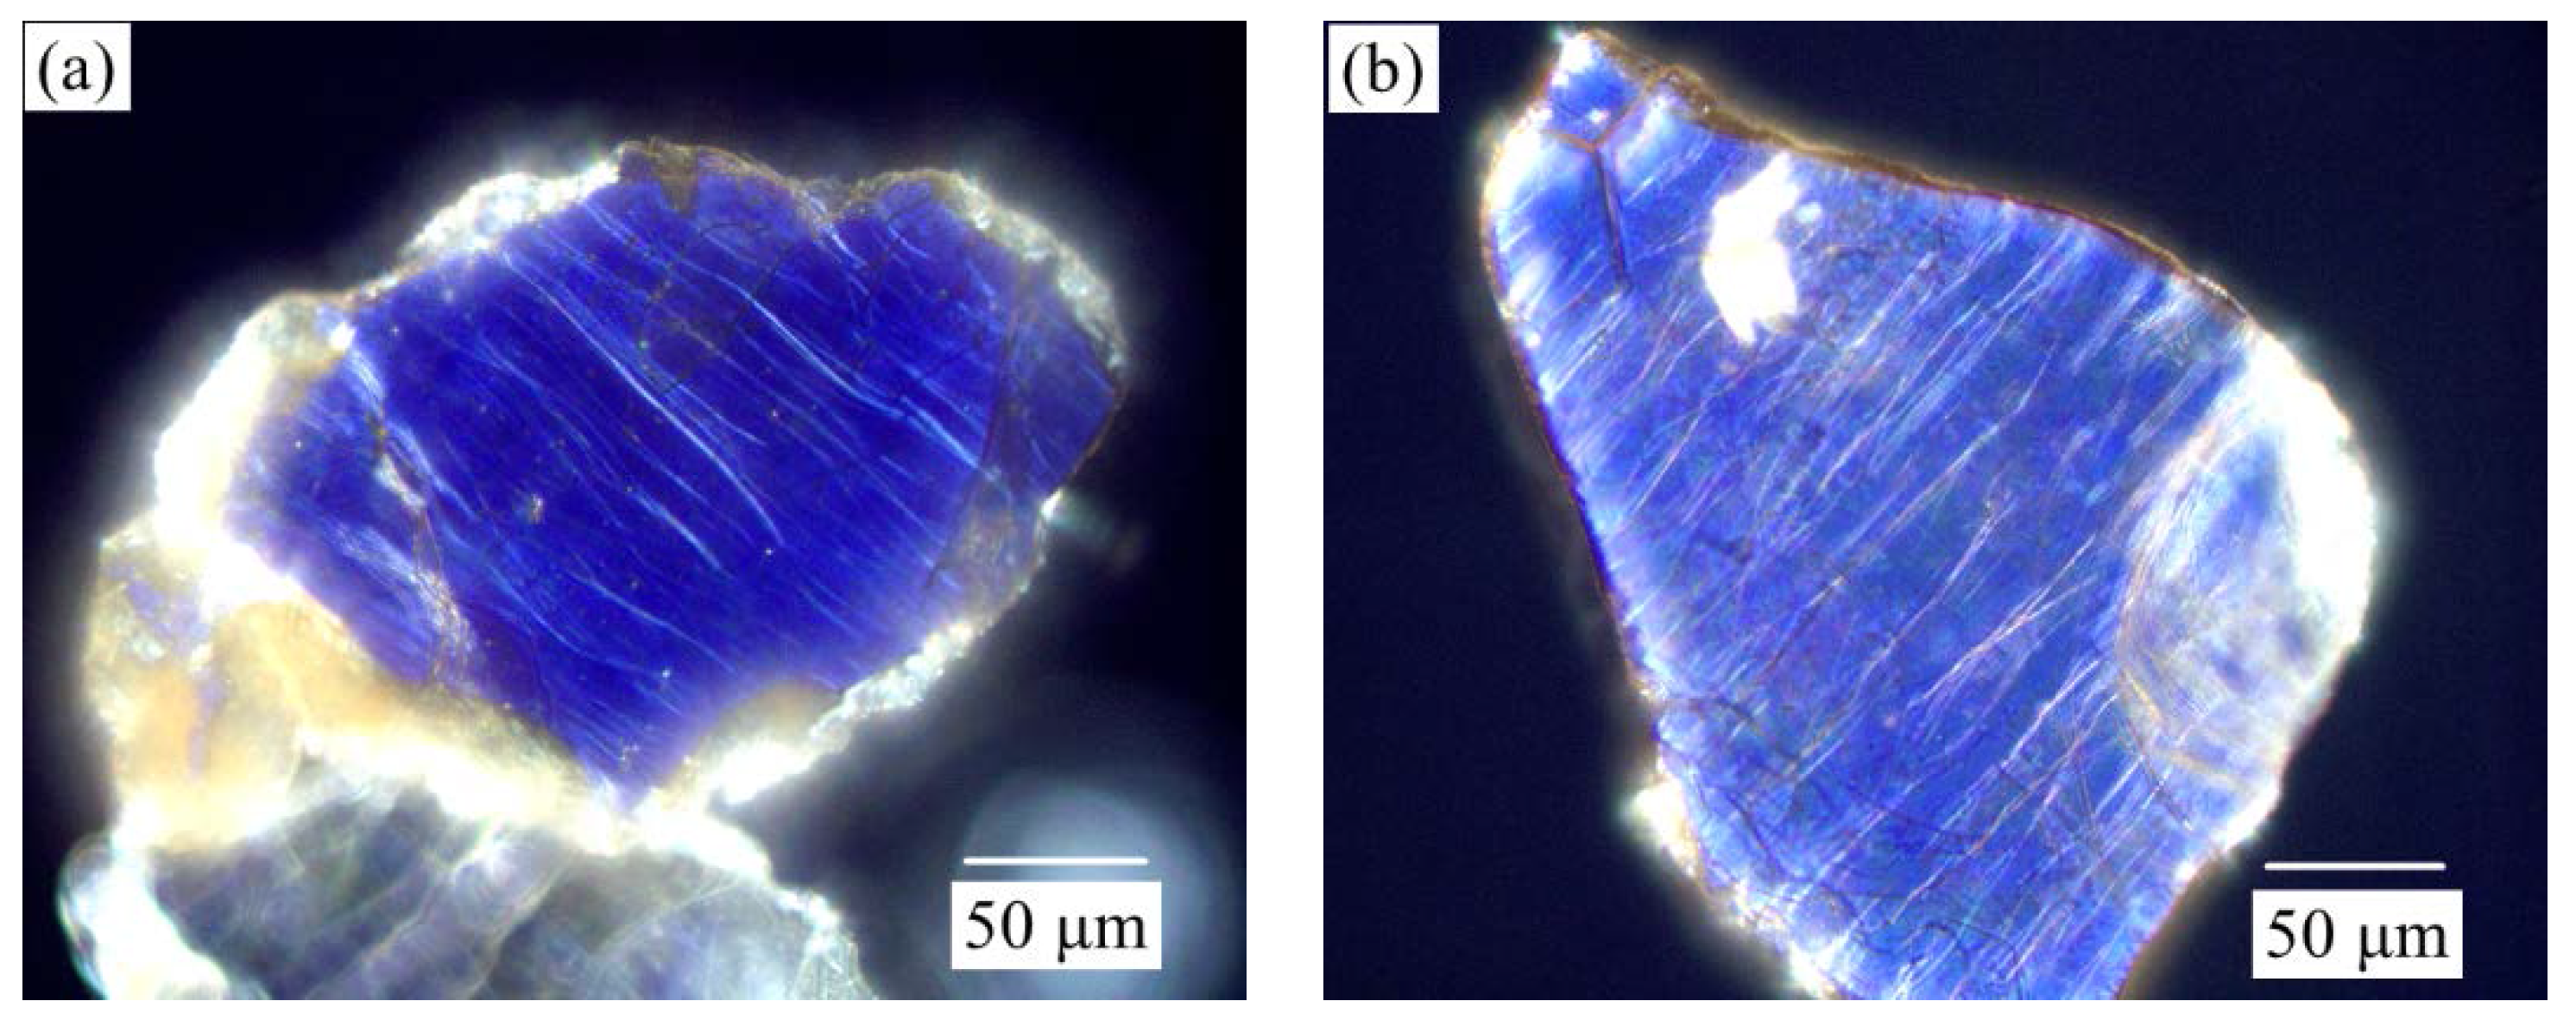
Figure 5.
Thermal analysis curves of pure muscovite (99.9 wt %): mass loss (ML), exothermic (EXO).

Figure 6.
XRD patterns of natural, calcinated and leached muscovites: a pure muscovite (>99.9 wt%) is marked as “natural muscovite”, the muscovite calcinated at 900 °C for 5 h is marked as “calcinated muscovite”, and the calcinated muscovite (2 g) is leached by H2SO4-NH4Cl solutions (0.3 mol/L H2SO4, 0.6 mol/L NH4Cl, 10 mL/g of L/S ratio) at 250 °C for 4 h. The leaching residue is marked as “leached muscovite”.

Figure 7.
Morphology and element distribution of muscovite in leached quartz sand: leaching conditions (0.025 mol/L H2SO4, 0.050 mol/L NH4Cl, 5 mL/g of L/S ratio, 250 °C); G—“gulf”, DF—directional fracture, IL—internal layer, SL—surface layer, and SD—surface damage: (a) component image, (b) morphology image, (c) distribution of Si, (d) distribution of Al, (e) distribution of K, (f) distribution of S.

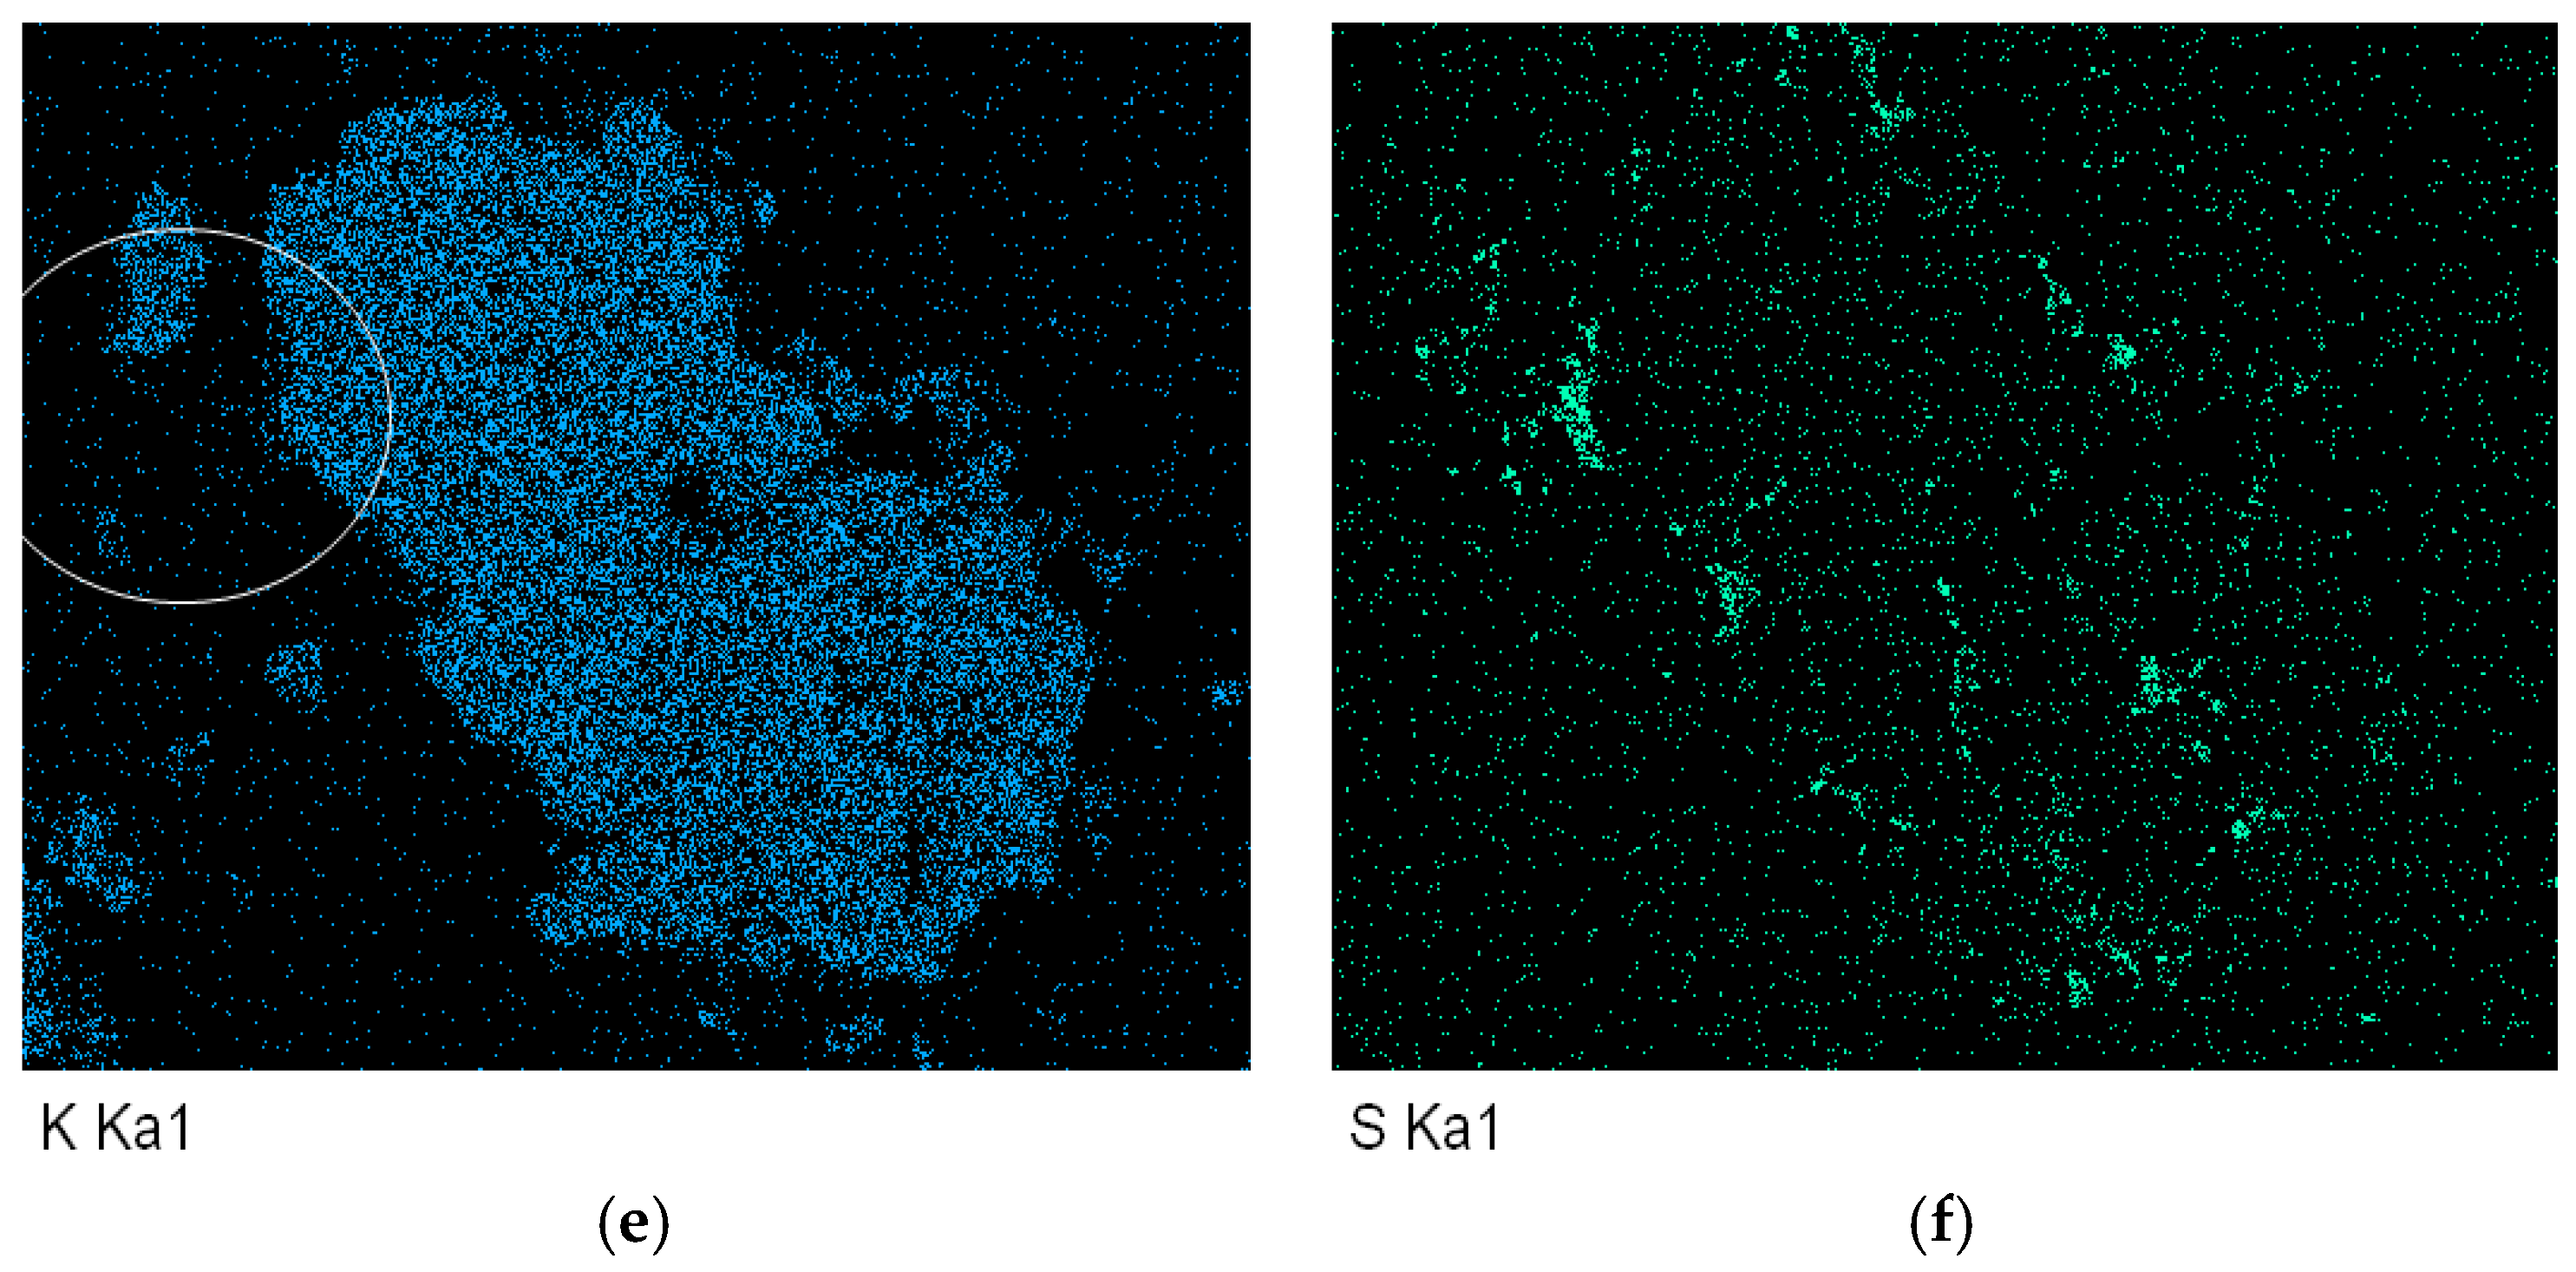
Figure 8.
Contents of Al and K at different conditions: S-F (pressure leaching: 2.00 mol/L H2SO4, 1.00 mol/L HF, 5 mL/g of L/S ratio, leaching temperature of 250 °C, leaching time of 6 h), C-S-F (calcination: 900 °C for 5 h; pressure leaching: 2.00 mol/L H2SO4, 1.00 mol/L HF, 5 mL/g of L/S ratio, leaching temperature of 250 °C, leaching time of 6 h), C-S-N (calcination: 900 °C for 5 h; pressure leaching: 0.30 mol/L H2SO4, 0.45 mol/L NH4Cl, 5 mL/g of L/S ratio, leaching temperature of 250 °C, leaching time of 6 h).

Figure 9.
X-ray photoelectric spectroscopy and structure simulation of quartz concentrate: (a) broad spectrum of quartz concentrate; (b) narrow spectrum of Al; (c) narrow spectrum of Na; and (d) structural simulation of lattice substitution.
Figure 9.
X-ray photoelectric spectroscopy and structure simulation of quartz concentrate: (a) broad spectrum of quartz concentrate; (b) narrow spectrum of Al; (c) narrow spectrum of Na; and (d) structural simulation of lattice substitution.

Table 1.
Contents of main impurity elements in quartz sand (μg/g) [15].
Table 1.
Contents of main impurity elements in quartz sand (μg/g) [15].
| Element | Fe | Li | Mg | Ni | Ti | Ca | K | Na | Al | Zr | Others | In Total |
|---|---|---|---|---|---|---|---|---|---|---|---|---|
| Ore | 61.2 | 2.20 | 11.8 | 1.01 | 8.34 | 8.05 | 118 | 13.5 | 353 | 6.46 | 35.1 | 619 |
| Concentrate 1 | 1.12 | 2.04 | 7.15 | - | 5.38 | 4.40 | 2.24 | 12.2 | 44.1 | 6.45 | 14.16 | 99.2 |
1 Leaching conditions: 0.30 mol/L H2SO4, 0.45 mol/L NH4Cl, 5 mL/g of L/S ratio, leaching temperature of 250 °C, leaching time of 6 h.
Table 2.
Design of the microscopic analysis.
| Leaching Condition 1 | 0.025 mol/L H2SO4 0.050 mol/L NH4Cl | 0.050 mol/L H2SO4 0.100 mol/L NH4Cl | 0.100 mol/L H2SO4 0.200 mol/L NH4Cl |
|---|---|---|---|
| 150 °C | Figures 2a and 3a | Figures 2d and 3d | |
| 200 °C | Figures 2b and 3b | Figures 2e and 3e | Figure 4b |
| 250 °C | Figures 2c, 3c and 6 | Figures 2f and 3f |
1 Liquid/solid ratio—5 mL/g, Leaching time—6 h.
© 2018 by the authors. Licensee MDPI, Basel, Switzerland. This article is an open access article distributed under the terms and conditions of the Creative Commons Attribution (CC BY) license (http://creativecommons.org/licenses/by/4.0/).
Share and Cite
MDPI and ACS Style
Pei, Z.; Lin, M.; Liu, Y.; Lei, S. Dissolution Behaviors of Trace Muscovite during Pressure Leaching of Hydrothermal Vein Quartz Using H2SO4 and NH4Cl as Leaching Agents. Minerals 2018, 8, 60. https://doi.org/10.3390/min8020060
AMA Style
Pei Z, Lin M, Liu Y, Lei S. Dissolution Behaviors of Trace Muscovite during Pressure Leaching of Hydrothermal Vein Quartz Using H2SO4 and NH4Cl as Leaching Agents. Minerals. 2018; 8(2):60. https://doi.org/10.3390/min8020060
Chicago/Turabian StylePei, Zhenyu, Min Lin, Yuanyuan Liu, and Shaomin Lei. 2018. "Dissolution Behaviors of Trace Muscovite during Pressure Leaching of Hydrothermal Vein Quartz Using H2SO4 and NH4Cl as Leaching Agents" Minerals 8, no. 2: 60. https://doi.org/10.3390/min8020060
Note that from the first issue of 2016, this journal uses article numbers instead of page numbers. See further details here.