Analysis of Dynamic Surface Subsidence at the Underground Coal Mining Site in Velenje, Slovenia through Modified Sigmoidal Function


1
Premogovnik Velenje d.o.o., 3328 Velenje, Slovenia
2
Faculty of Natural Sciences and Engineering, University of Ljubljana, 1000 Ljubljana, Slovenia
*
Author to whom correspondence should be addressed.
Minerals 2018, 8(2), 74; https://doi.org/10.3390/min8020074
Submission received: 30 December 2017
/
Revised: 26 January 2018
/
Accepted: 5 February 2018
/
Published: 17 February 2018
(This article belongs to the Special Issue Selected Papers from the 6th International Symposium on Mining and Environmental Protection)
Abstract
:In underground coal mining engineering, one of the most important tasks is to monitor, predict and manage the surface subsidence due to underground coal excavation. The impact of underground mining excavation reflects as subsidence of the overlying strata and the formation of surface depressions soon after excavation. The surface subsidence is one of many natural processes that exhibit a progression from small beginnings that accelerate and approach a climax over time. When detailed data is lacking, a logistic function is often used. In this paper, the analysis of the surface subsidence above underground mining sites in the Velenje Coal Mine by using a modified sigmoid function (surrogate of logistic function), with the common “S” shape, is introduced. Furthermore, the time estimation of the next and the final epoch measurement is considered.
1. Introduction
The Velenje Coal Mine (VCM) is one of the largest and most modern deep coal mining sites in Europe. The thickness of the coal deposit ranges from 20 to 160 m. The coal layer is 100 m thick at a depth of 400 m, and the greatest amount of coal can be found at a depth of 290 m [1]. The mining method used is known as Velenje Mining Method (VMM) and is unique in world mining technology [2]. The VMM is characterized by continuous caving-in of the hanging wall layers, where the length of longwalls amounts from 80 to 210 m and the length of panels vary from 600 to 800 m (Figure 1). Underground coal mining excavation leads to subsidence of the overlying strata and the formation of surface depressions.
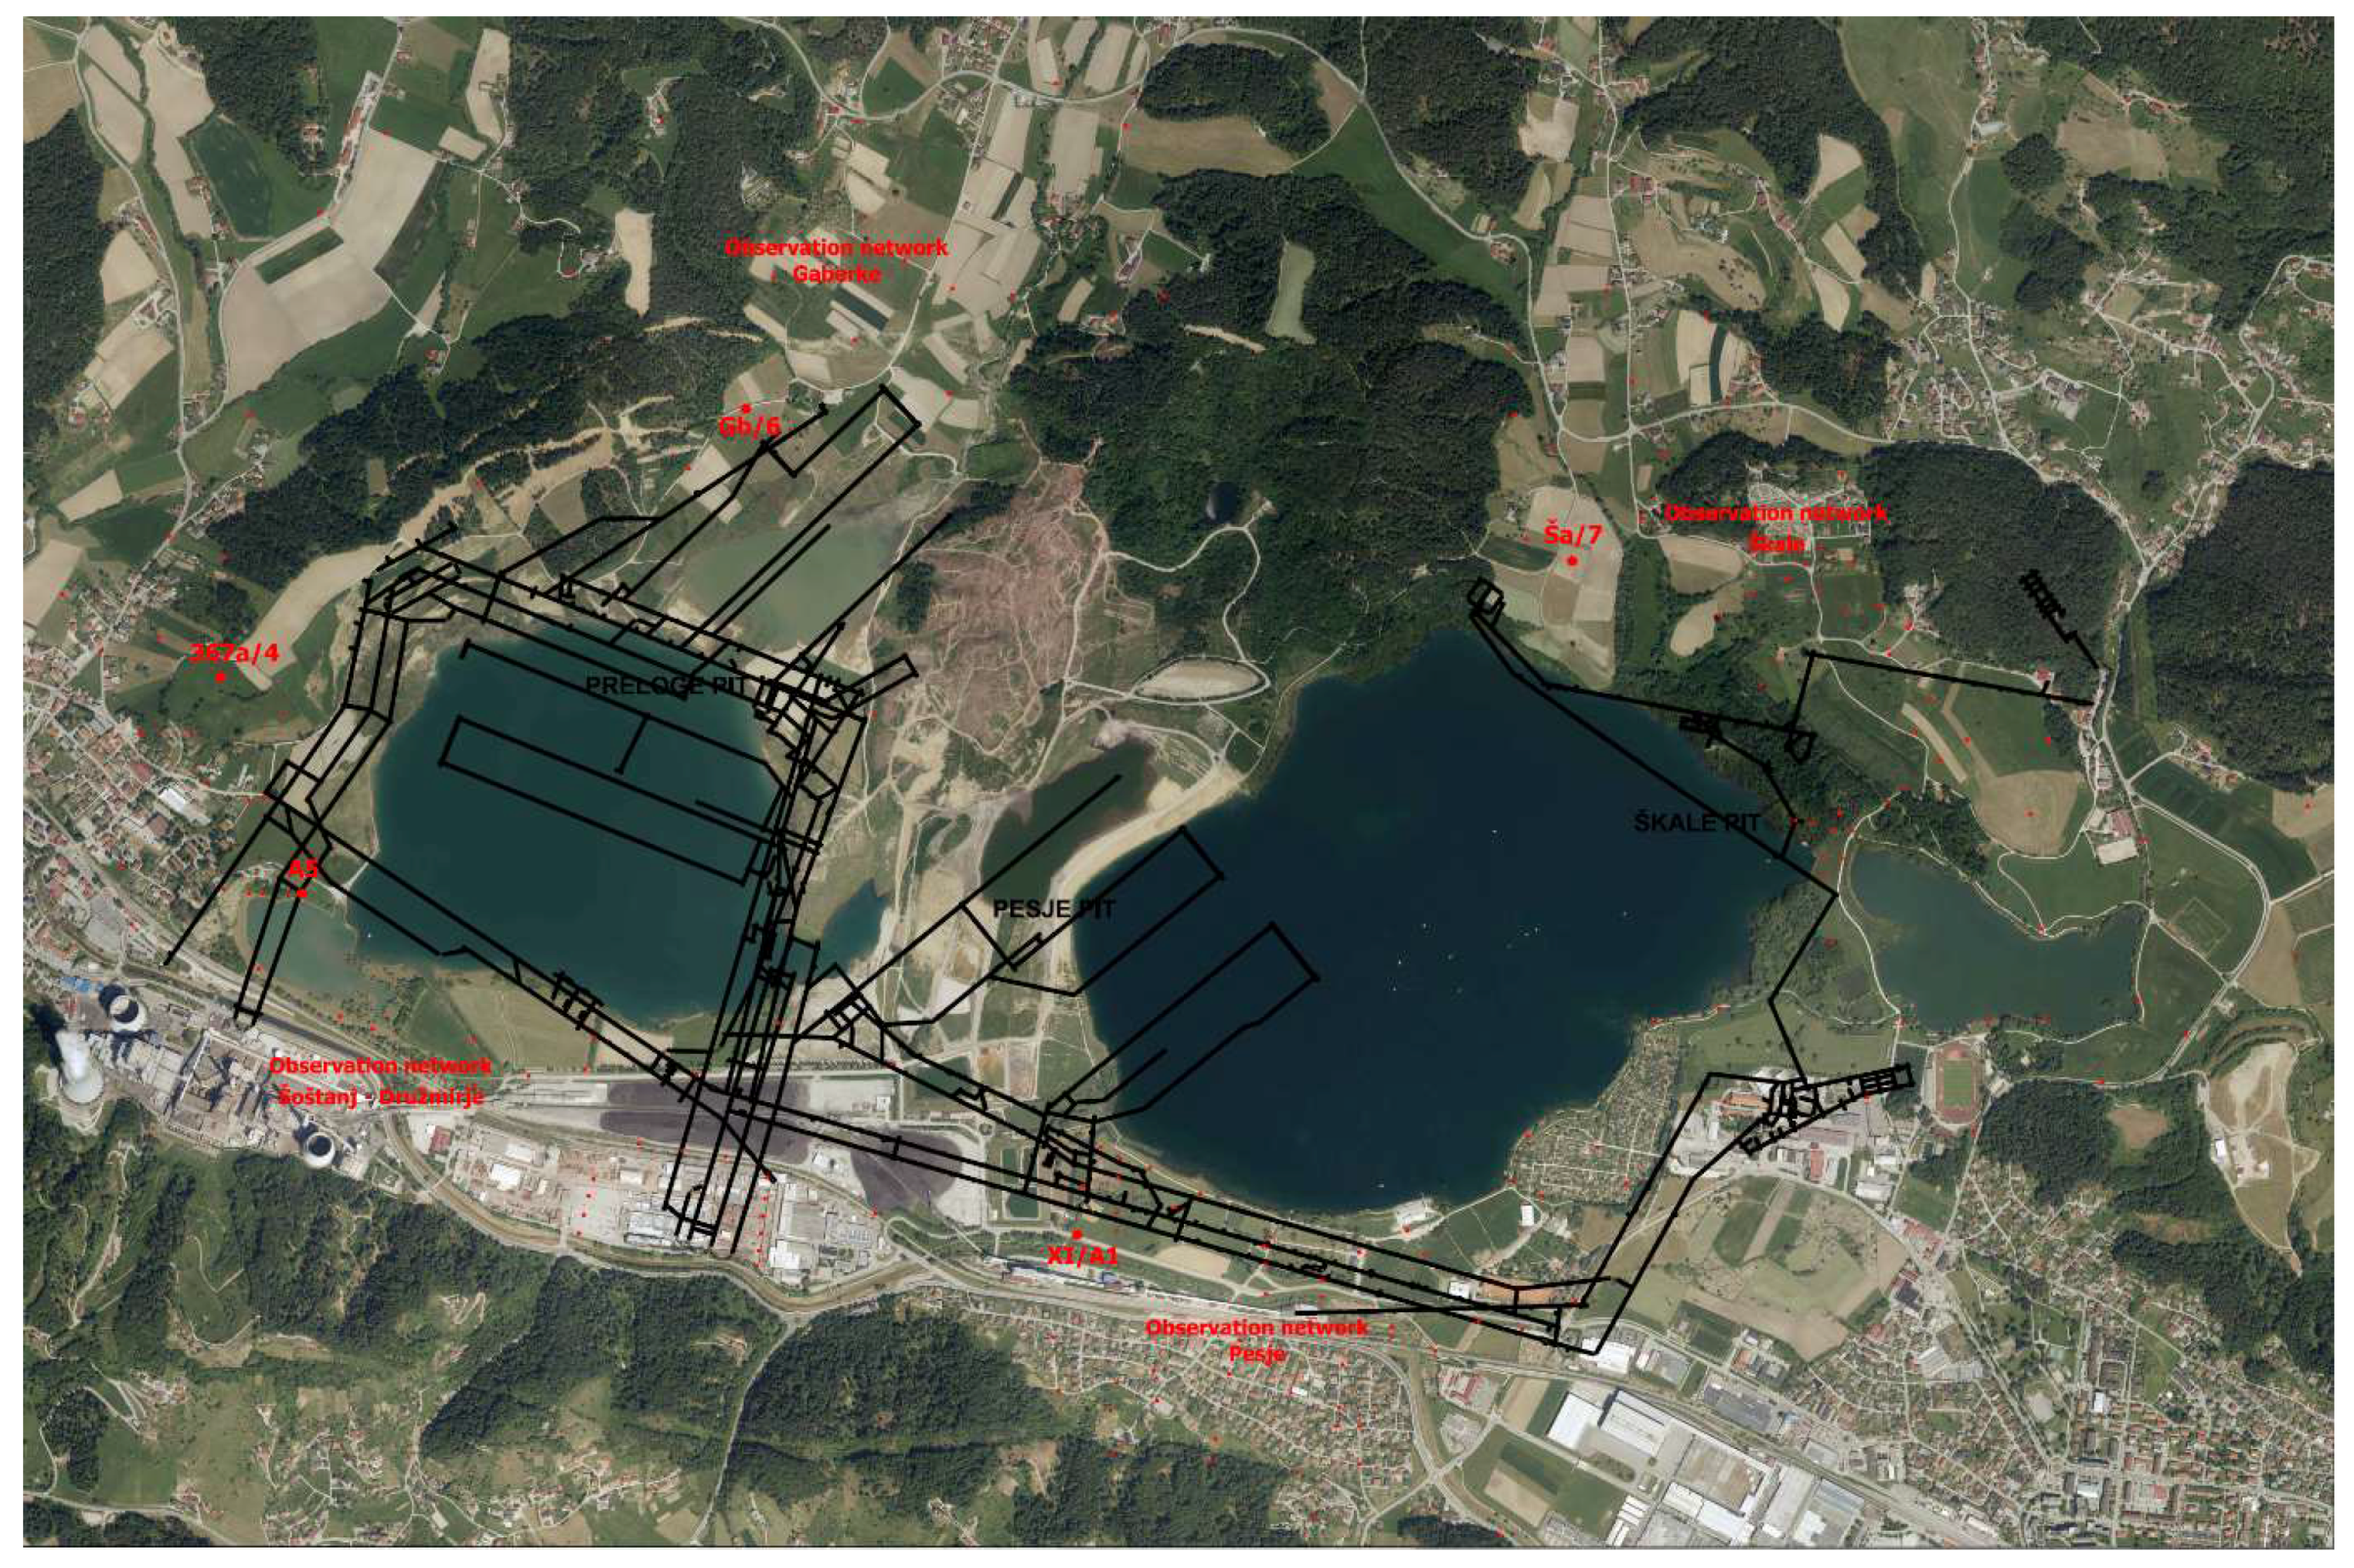
In underground coal mining engineering, some of the important tasks are to monitor, predict and manage the surface subsidence due to underground coal excavation. The impact of mining excavation reflects on the surface soon after excavation and reaches 90% of its final value approximately three months after the excavation is finished. Since more excavation panels are active at the same time and the excavation of one begins right after the excavation of another ends, it is hard to talk about the impact of one particular excavation panel to the surface. Measurements for determining the movements of the ground include geodetic measurements of planar and height networks. The subsidence at the surface does not occur suddenly, but develops progressively as the coal is extracted within the area of influence of the extracted coal panel. Figure 2 shows the Šalek Valley with the mine roadways of the VCM in black and over 300 observation points in red, which are measured at least once per year. Furthermore, five observation points, whose analysis results are presented in this paper in more detail, are shown.
2. Materials and Methods
2.1. Geological Structure of the Velenje Coal Mine Area
The VCM region lies in a synclinal valley, which is a lignite deposit, formed during the Pliocene era. The depression is meshed with local faults from different ages and runs in different directions. River and lake alluvia consisting of sand and clay, whose thickness totals 460 m at the most, represent the hanging wall of the seam (Figure 3). Immediately above the coal seam there are clay layers ranging from a few hundred meters to minimum of six meters. The footwall of the seam consists of clay and marl lying on triassic limestone and dolomites [3]. The coal deposit is lens-shaped, 8.3 km deep and 2.5 km wide, with a thickness of more than 160 m and a depth from 200 to 500 m. The deposit is closest to the surface at the edges and deepest in the middle. From a geomechanical point of view, the strength and rigidity of the lignite layer is much higher than the materials in the hanging wall and in the footwall of the deposit. This fact is important, both for planning excavations as well as for designing the most suitable excavation method, which needs to be adapted to the natural geological and geomechanical conditions [2]. Also, the caving-in of the materials in the adjacent hanging wall is different from the subsiding hanging-wall layers lying above, where clay and silt layers are first plastically reshaped, while the layers situated higher up are bent and subsided to the surface, where large depression lakes have been formed as a consequence of the mining activities.
2.2. Mining Method
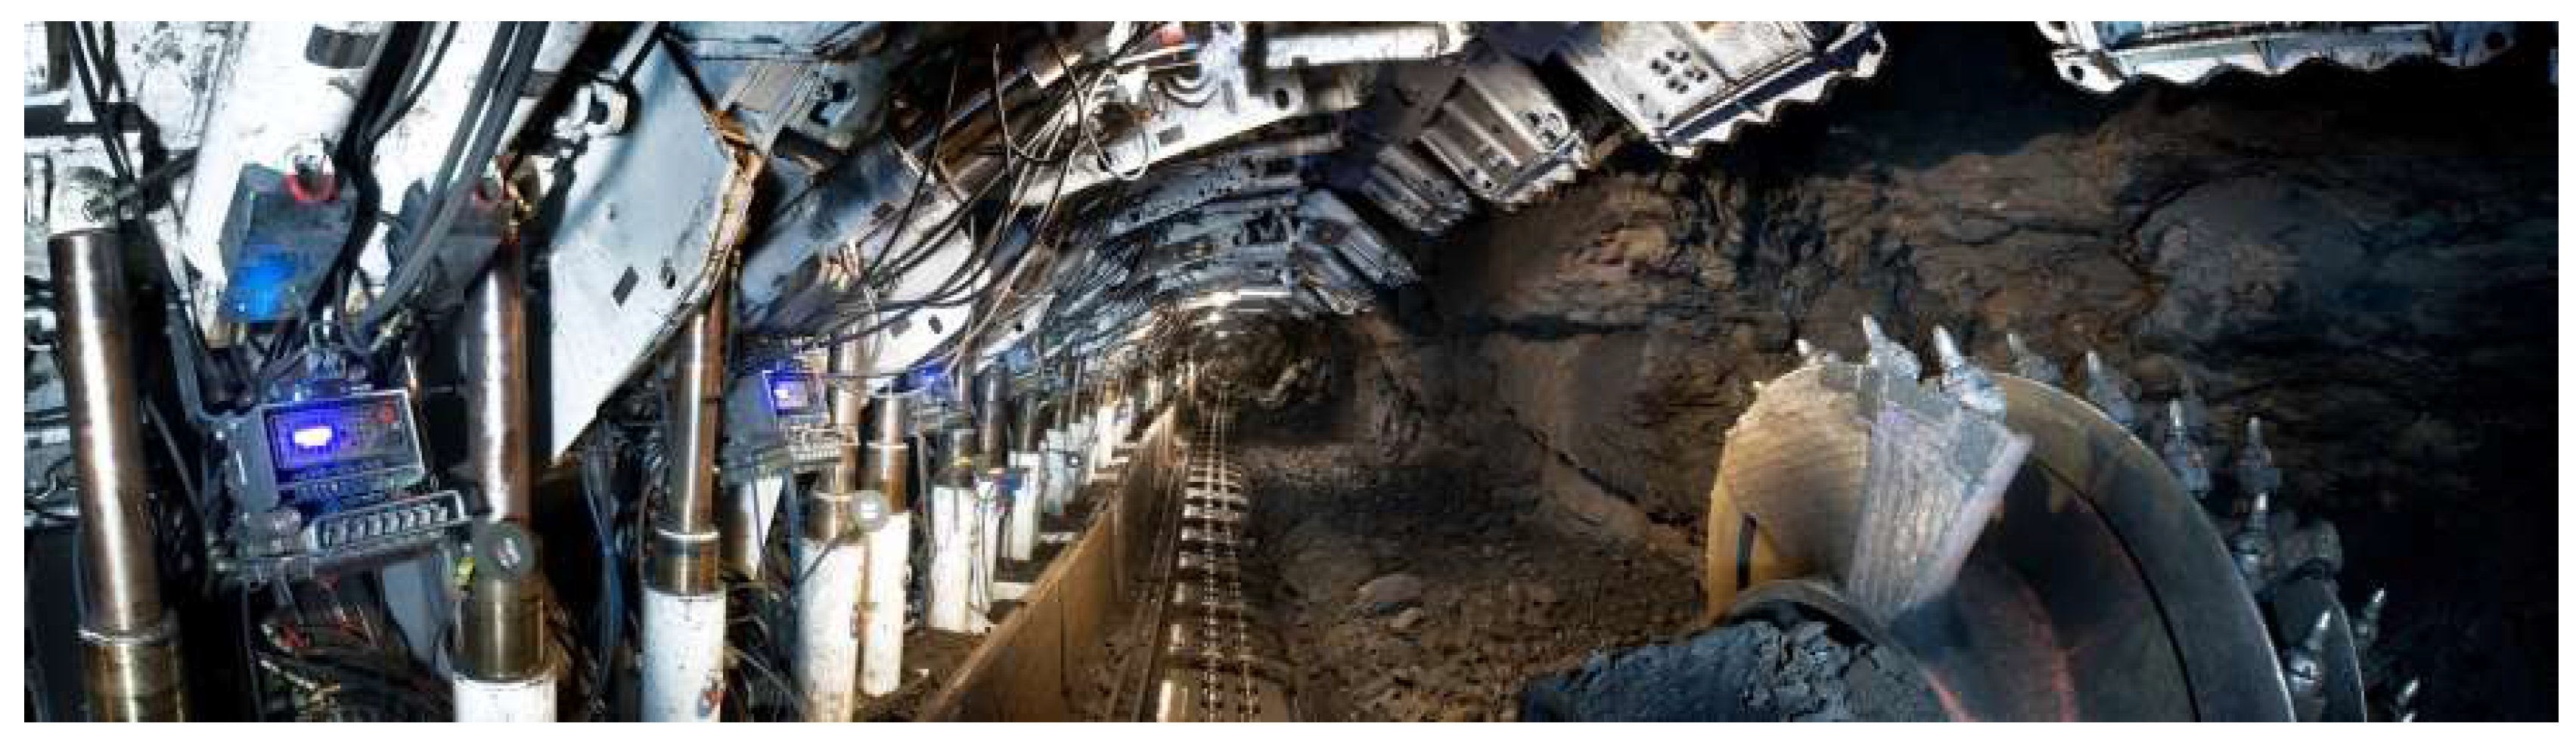
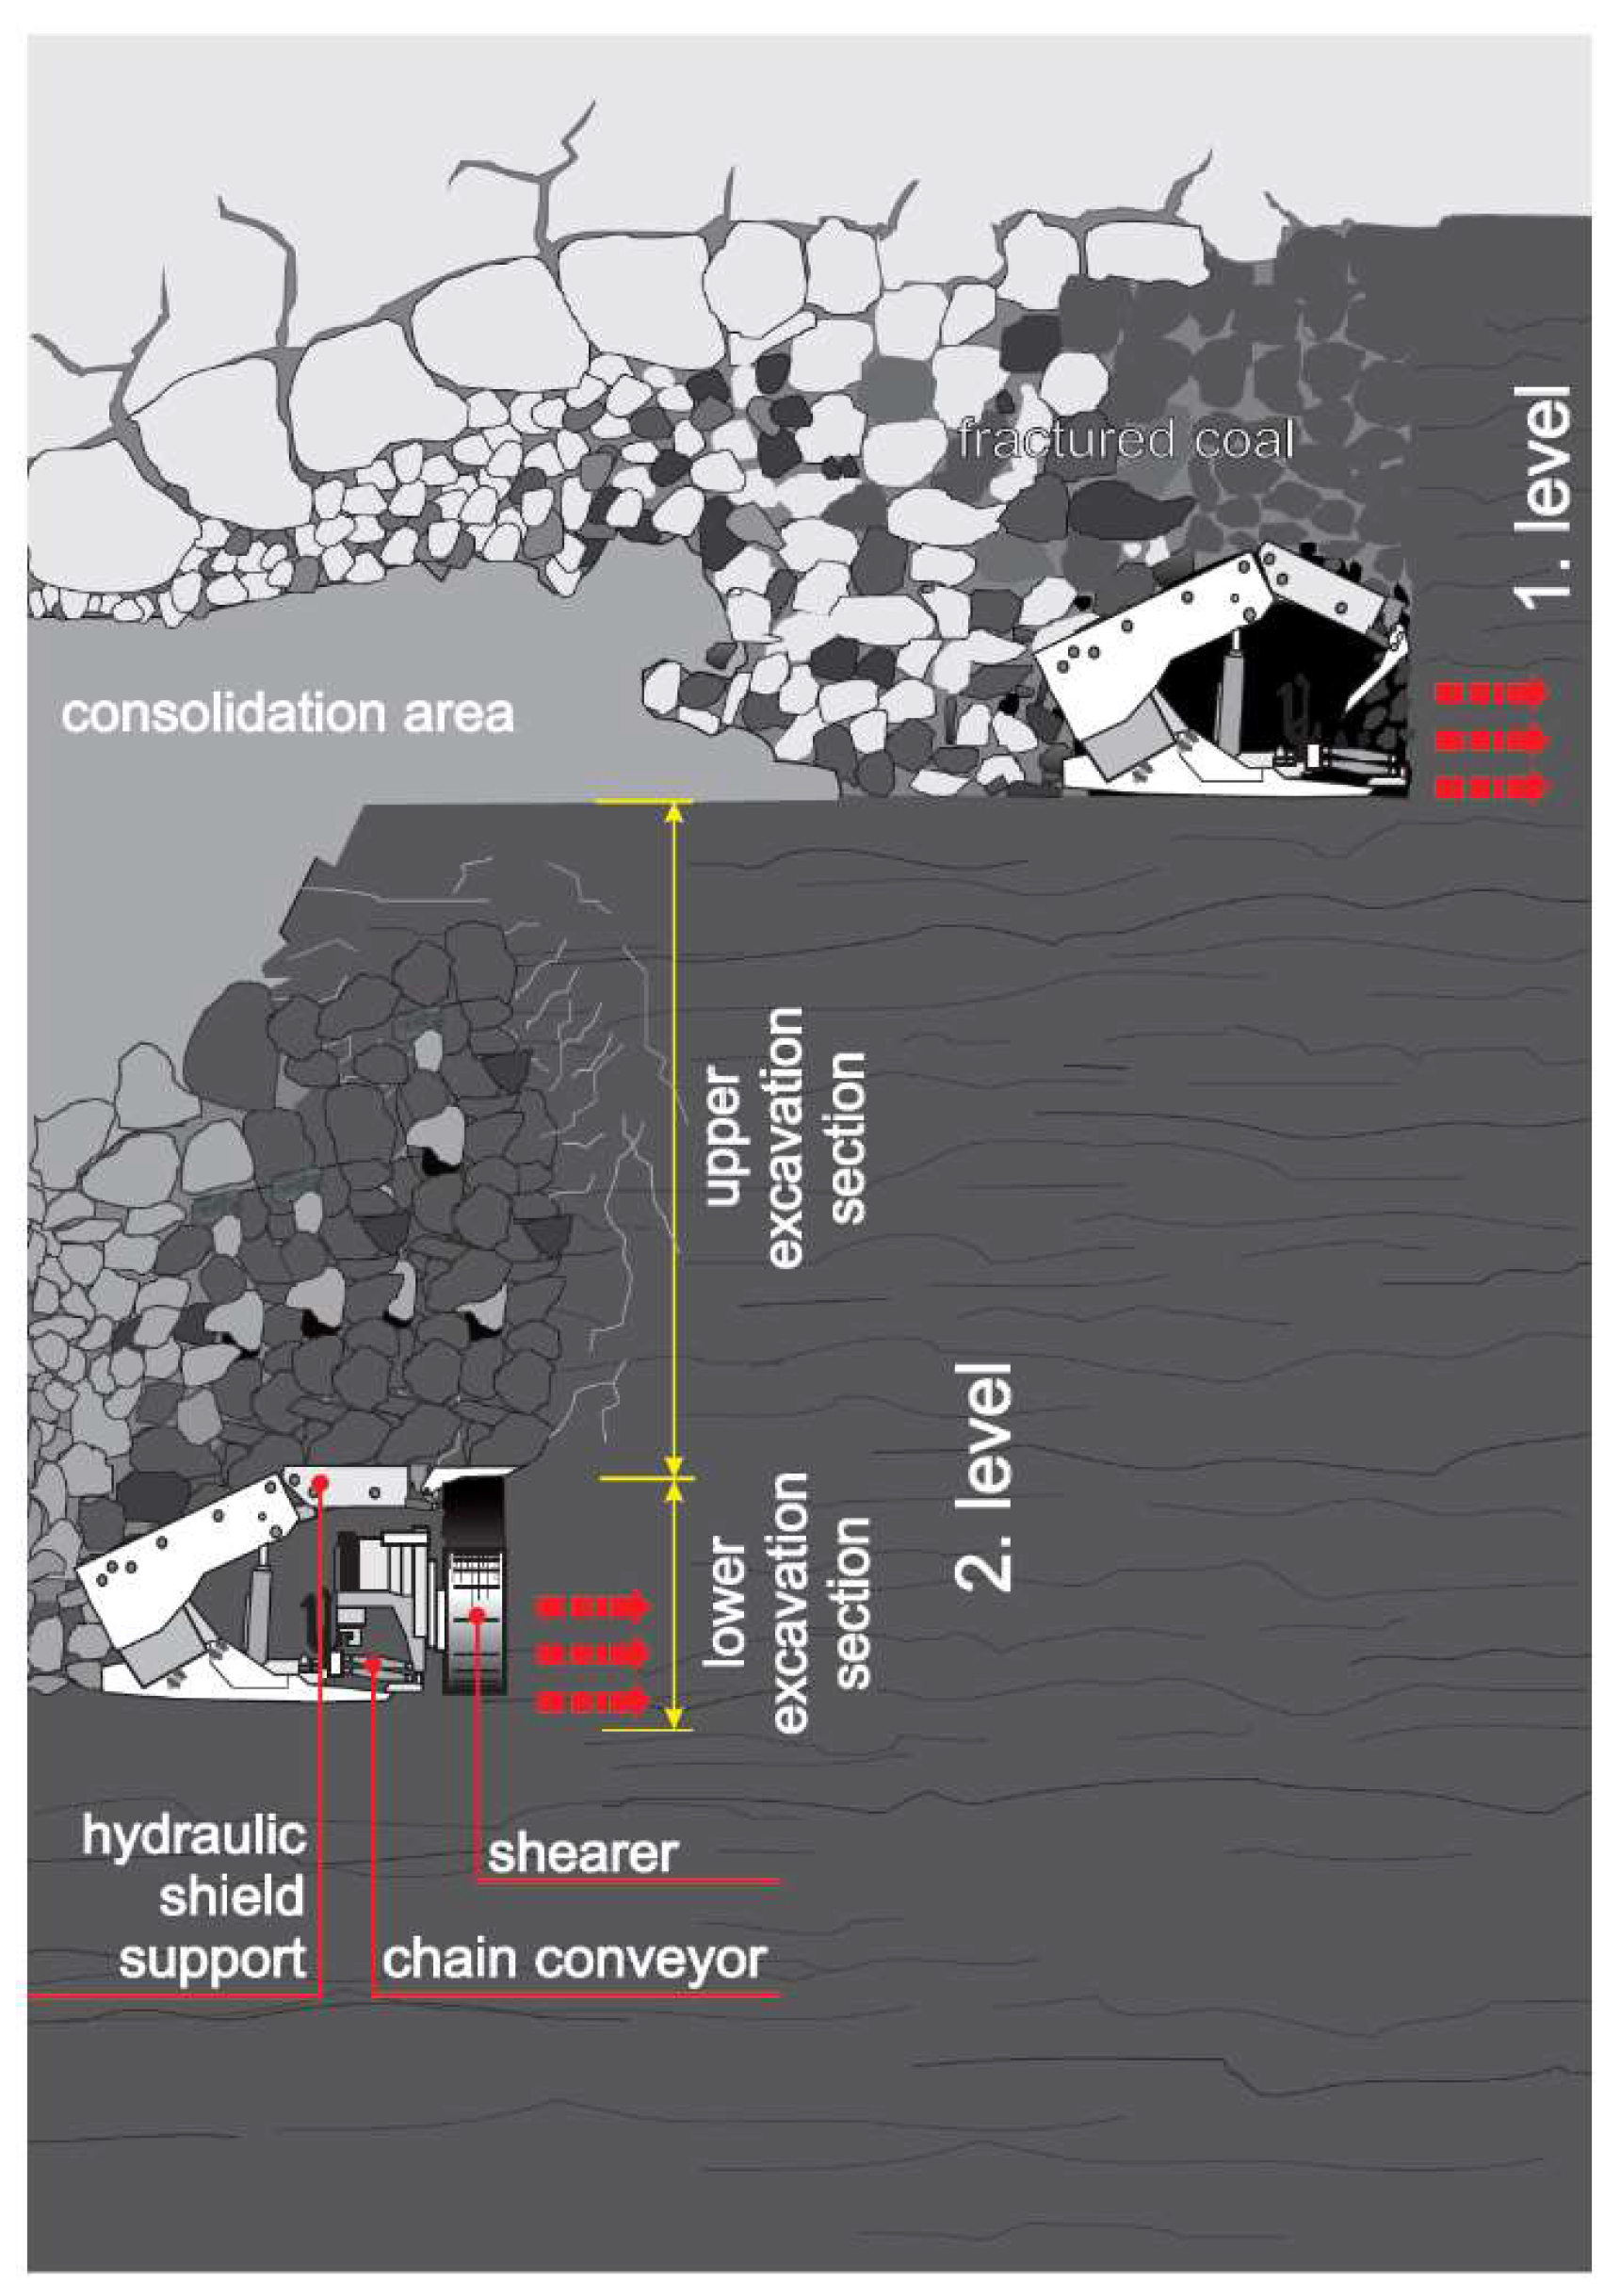
Underground lignite mining in Velenje has a rich history and tradition. Industrial lignite mining from the Velenje deposit has taken place for more than 140 years and is ongoing at a level of around 3.5 million tonnes per annum. Since the start of mining, approximately 245 million tonnes of lignite have already being mined. The Velenje lignite deposit is unique regarding its geological conditions. Thus, a special mining method, i.e., the Velenje mining method (VMM), is used. The VMM is very peculiar because of the high coal seam thickness and the specific coal mechanical characteristics (good, brittle characteristic of the coal). The method consists of a subdivision of the coal seam in several layers, having a height manageable by standard longwall equipment. According to VMM, a coal face is divided in the footline section and the hanging wall section. The footline section is from 4 to 5 m high and secured by the hydraulic support system which allows mechanized exploitation by using excavation machines—shearer loaders—and the conveyance of coal by using efficient chain conveyers. The hanging wall section, measuring from 5 to 17 m in height, is exposed to dynamic stress conditions which cause the crumbling of the coal layer; the crushed coal is then poured onto the conveyor and promptly transported to the surface (Figure 4). The allowed face height at the longwall depends on the thickness of the clay insulating layers in the hanging wall, which protect the face from the inrush of running sand and water [2]. The subsidence is inevitable, due to the historical and practical choice of not using backfilling. Moreover, the method itself cannot permit any remaining coal pillar to sustain the overburden. The consequence is major subsidence at the surface, with vertical movement of more than 80 m.
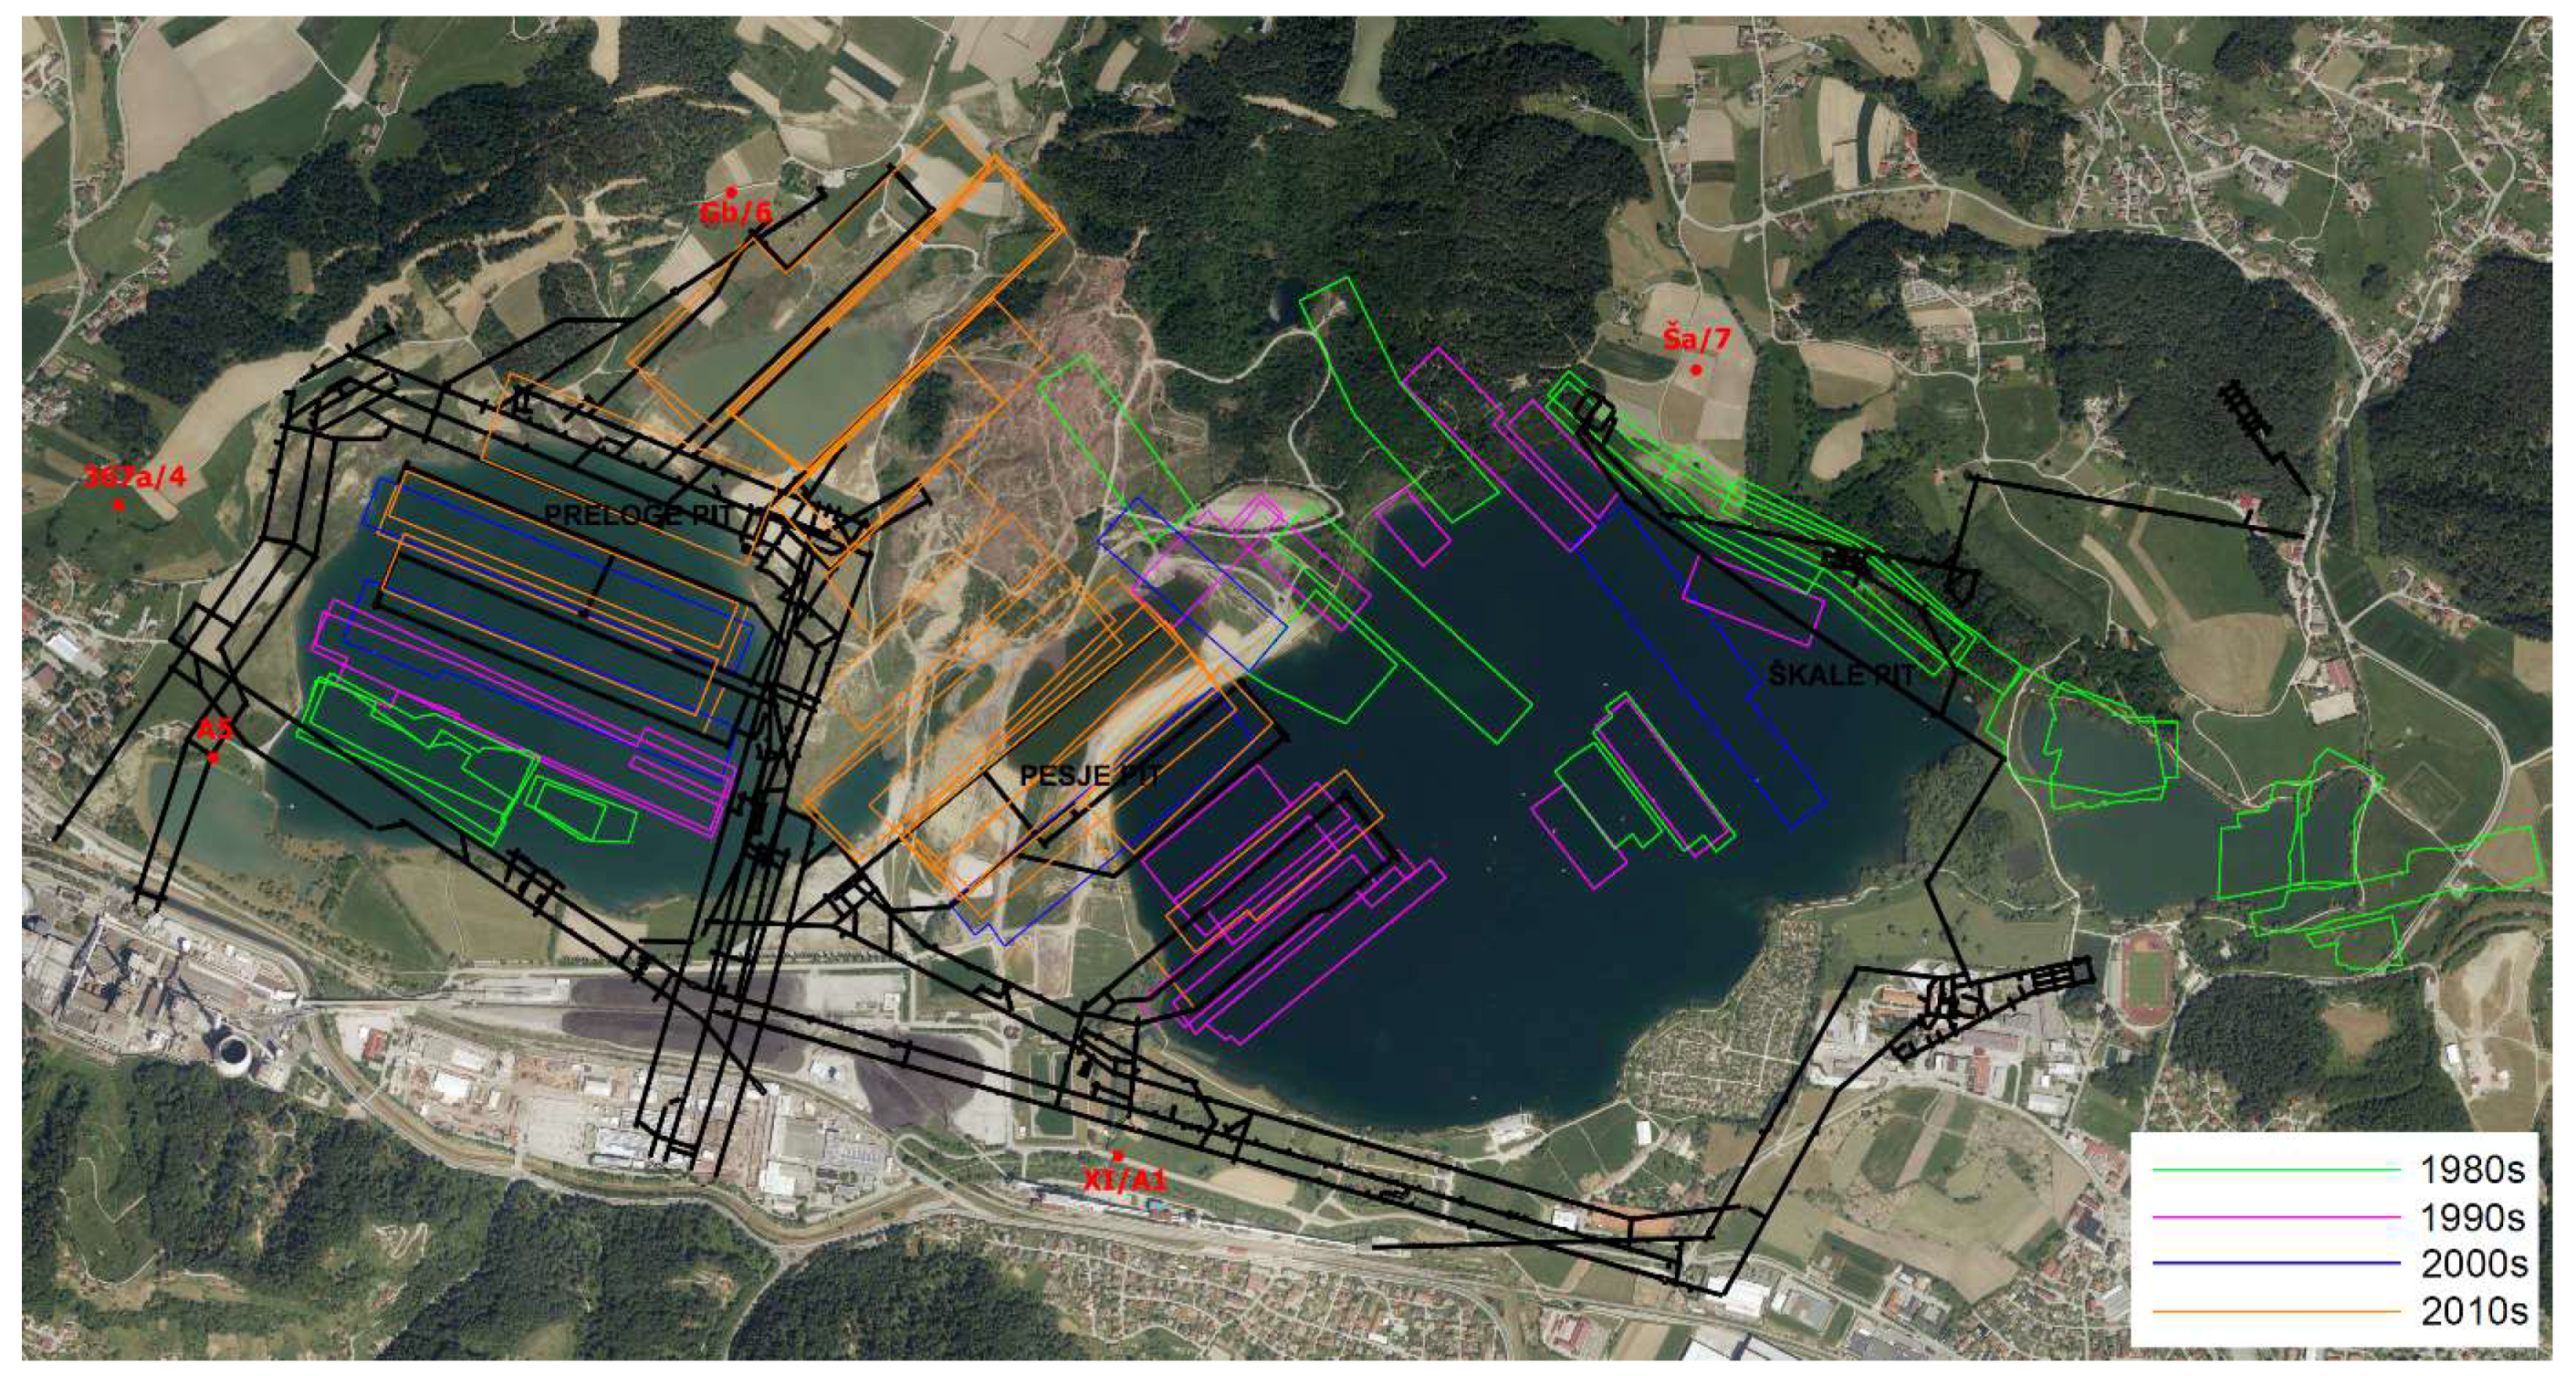
With mining works, the coal seam was first opened in the eastern section, i.e., Škale pit, closer to the present-day city of Velenje. In 1960s and 1970s mining works also started in central part, i.e., Pesje pit. In Figure 5 locations of mining faces from 1980s till nowadays are presented. The currently active section of the VCM is situated in the northwest part of Šaleška valley, closer to the town of Šoštanj, in Preloge pit—north and in Pesje pit.
2.3. Surface Observation Points Analysis
The data presented in the paper was obtained by geodetic monitoring of displacements on the surface above the mining excavation area. An analysis of five observation points is presented; observation point GB/6, A5, 367a/4, Ša7 and X1-A1, whose locations are shown in Figure 2 and Figure 5. Observation point GB/6 is part of Gaberke observation network and the measurements were performed once per year during the period from 1989 until 2012, in which year the point was ruined (Table 1). Observation points A5 and 367a/4 are part of Šoštanj-Družmirje observation network. The measurements at point A5 were performed from 1989 to 2003, in which year the point was ruined. In contrast, the measurements at point 367a/4 are still active (Table 1). Observation point Ša7 is part of Škale observation network and point X1-A1 is part of Pesje observation network, and both observation points’ measurements are still active. Observation point X1-A1 was stabilized in the year 2000.
Surface subsidence is one of many natural processes that exhibit a progression from small beginnings that accelerate and approach a climax over time. When detailed data is lacking, a logistic function is often used [5]. The particular case of said logistic function is a sigmoid function, whose graphs are “S-shaped” curves, and are among the simplest non-linear curves, striking a graceful balance between linear and non-linear behavior [6]. With some modification, a simple sigmoid function was obtained [7]:
where corresponds to vertical displacements of surface point in year , and . The parameters R and L are the ordinate values of the right and left horizontal asymptote. By multiplying the function’s values by (R – L)/2, the function can be extended or contracted along the y-axis. The value of the difference between the asymptotes (R – L) can be negative, and thereby the function becomes an inverse. To prevent this, the value of the left horizontal asymptote L to the function (see Equation (1)), which transforms the values over the ordinate axis and so preserves the y values, was added. Necessary adjustments were also made on the abscissa, namely with the expression (x – p)/P, which enables extensions and contractions of the curve along the x-axis depending on the value of parameter P. The parameter p is the abscissa value of the inflection point and corresponds to the day in which the curve passes from positive to negative acceleration of induced subsidence.
With the presented modified sigmoid function, good fitting to subsidence observation data was achieved. Further processing deals with the model’s behavior in the future, which allows the forecast of the next and the final year of observation measurements, when observations can be completed.
If the function does not reach the stationary state, the subsidence is defined as active. It will be necessary to monitor the observed area. When the function reaches the stationary state, it is already close to its lower asymptote, and the further subsidence is practically negligible. The settling period is defined as consolidation [8,9,10]. The next (and final) measurement will be needed after a long period of time.
Based on the required accuracy, the time of the next observation measurement (in years) is determined. The surface subsidence is designated as active until the change in the value of the subsidence in one year is less than 0.001 m. At that time, the subsidence of the terrain calms down, as the function approaches the right asymptotes, i.e., zero values.
In Figure 6 the prediction conditions are shown. The next observation measurement (tnext) is necessary when the absolute change in the ordinate of the function (Δunext > 0.001 m) (i in years) from the last measurement is greater than 0.001 m (Figure 6a).
The final measurement () will be required when the absolute subsidence in the period from the last measurement ( to a certain time () is less than 0.001 m (Figure 6b) and j from Equation (2).
3. Results and Discussion
Based on linearized function fit equations (Equation (1)) the values of the parameters R, L, P, p and standard deviation for all parameters were calculated. Furthermore, a confidence interval (τ = 3) for each parameter was defined. The results of the analysis of vertical displacement fitted by a modified sigmoid function for observation points GB/6, A5, 367a/4, Ša7 and X1-A1 are shown in Table 2, Table 3, Table 4, Table 5 and Table 6.
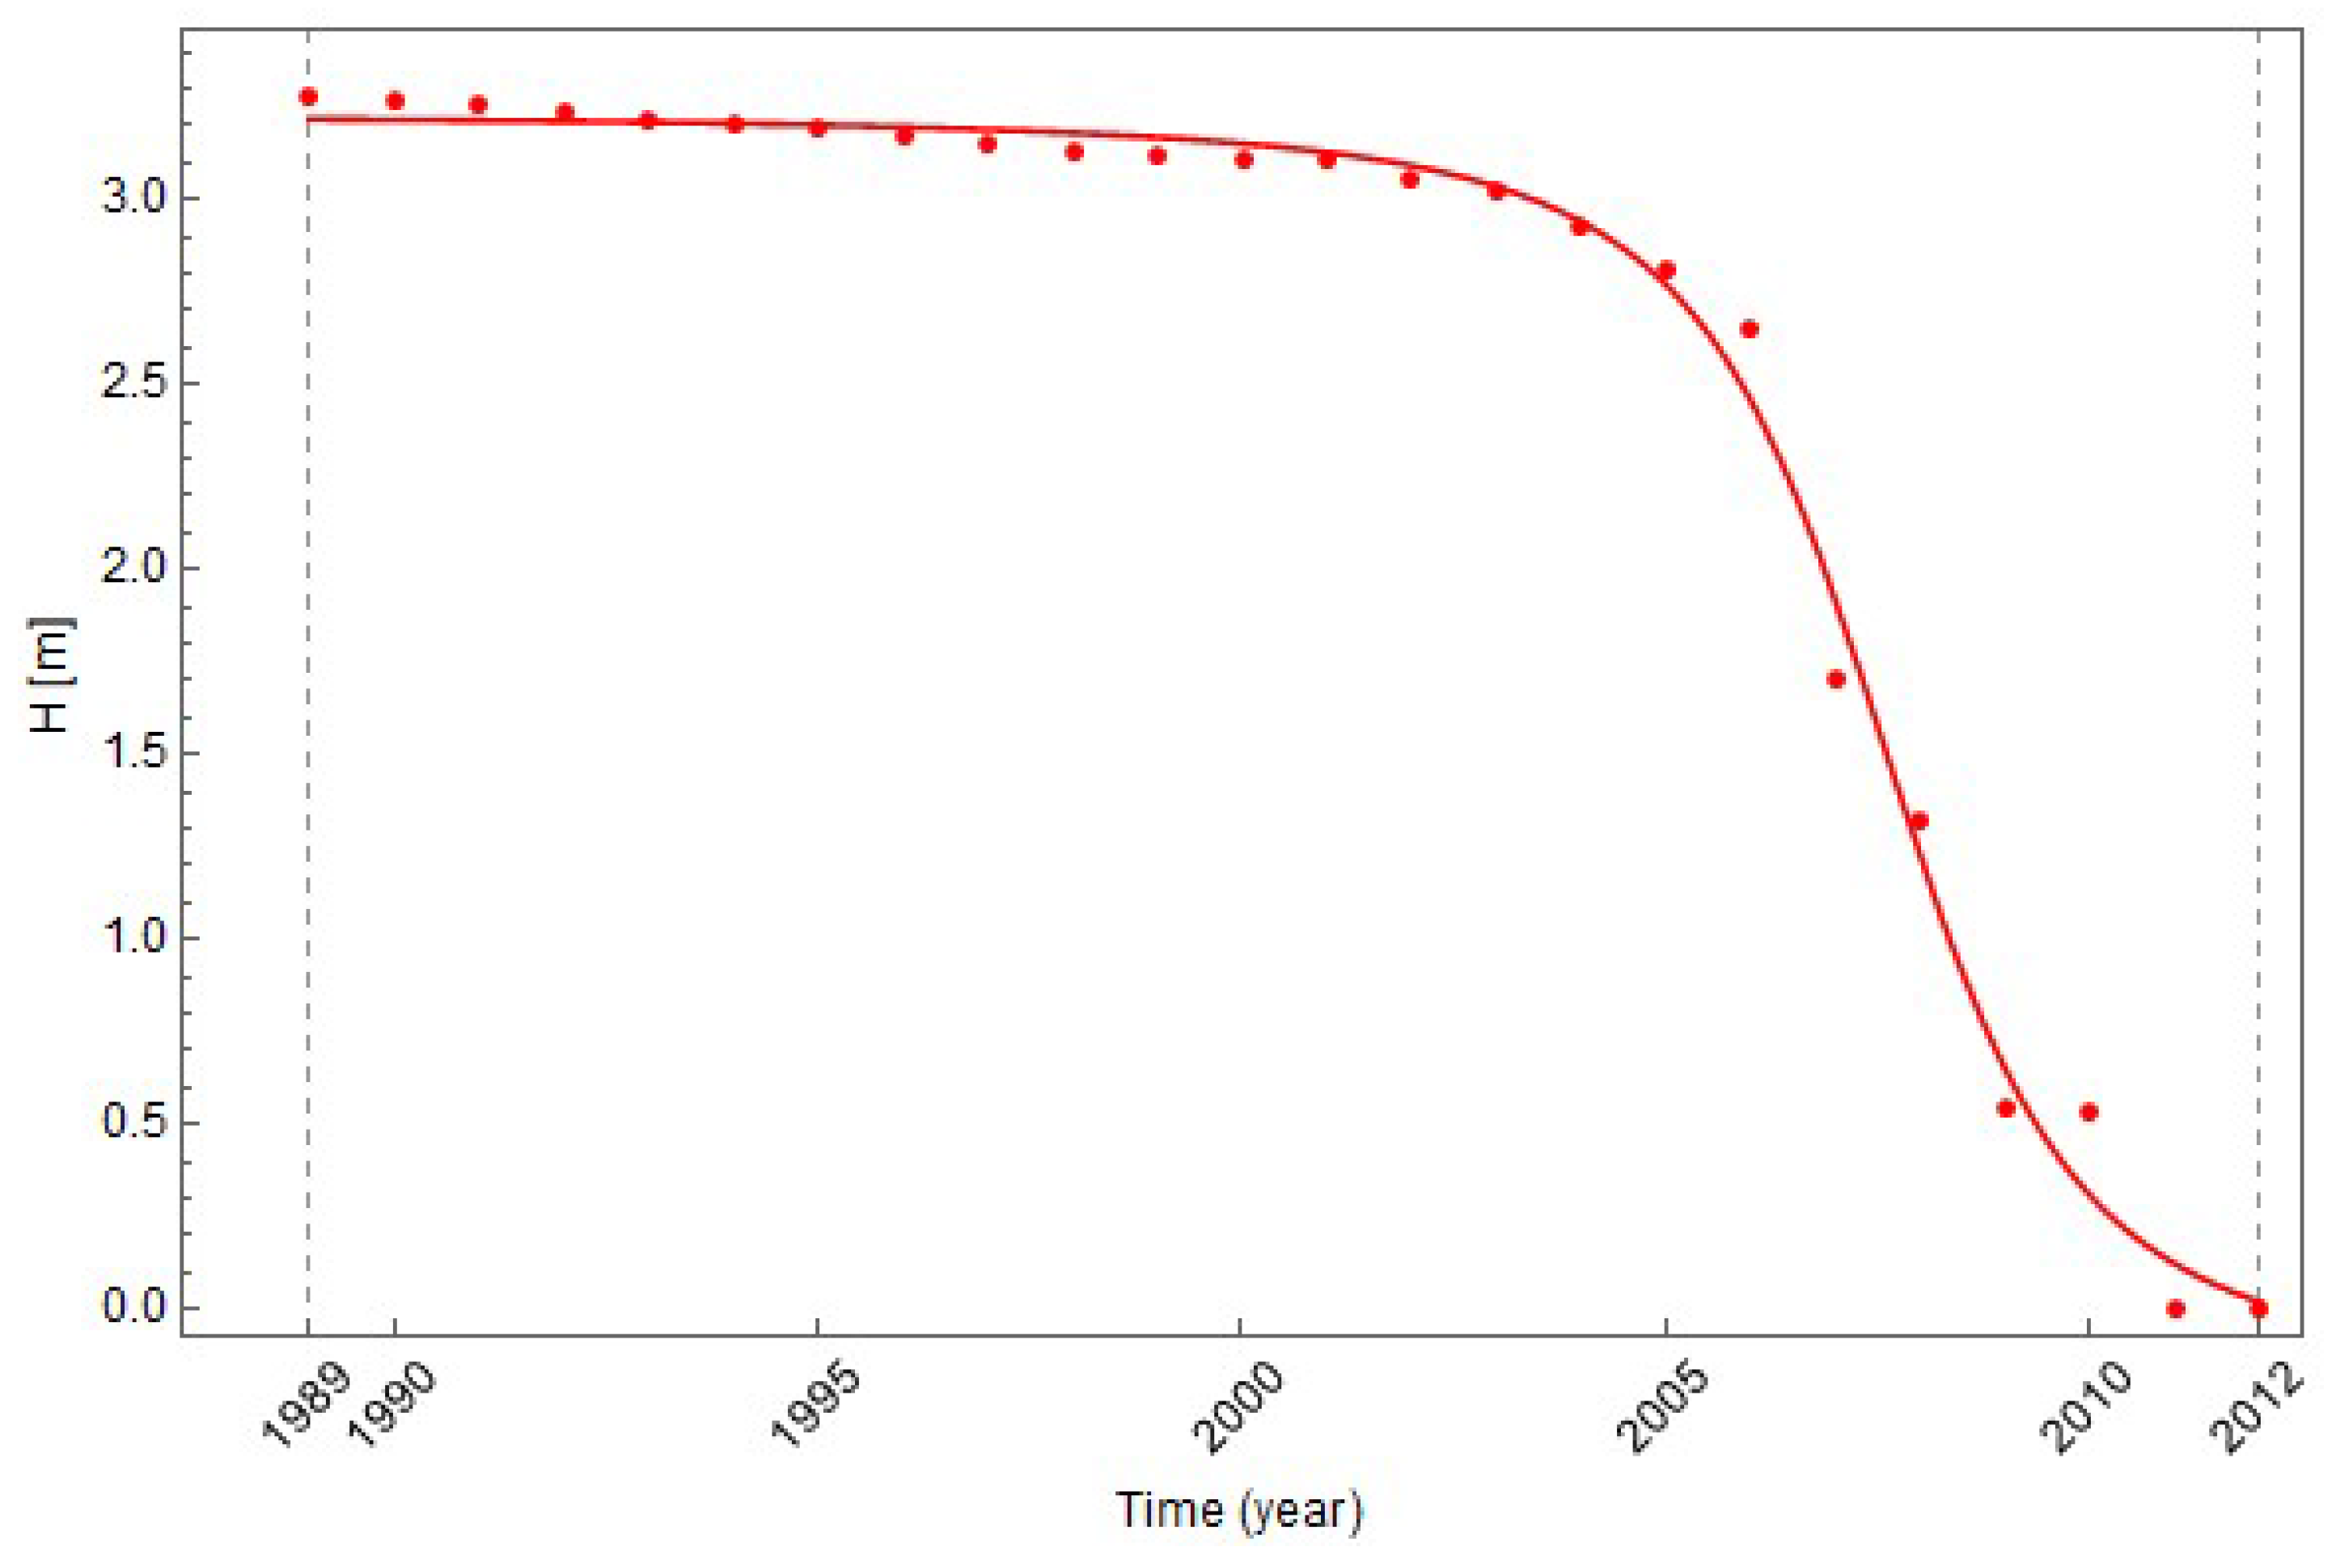
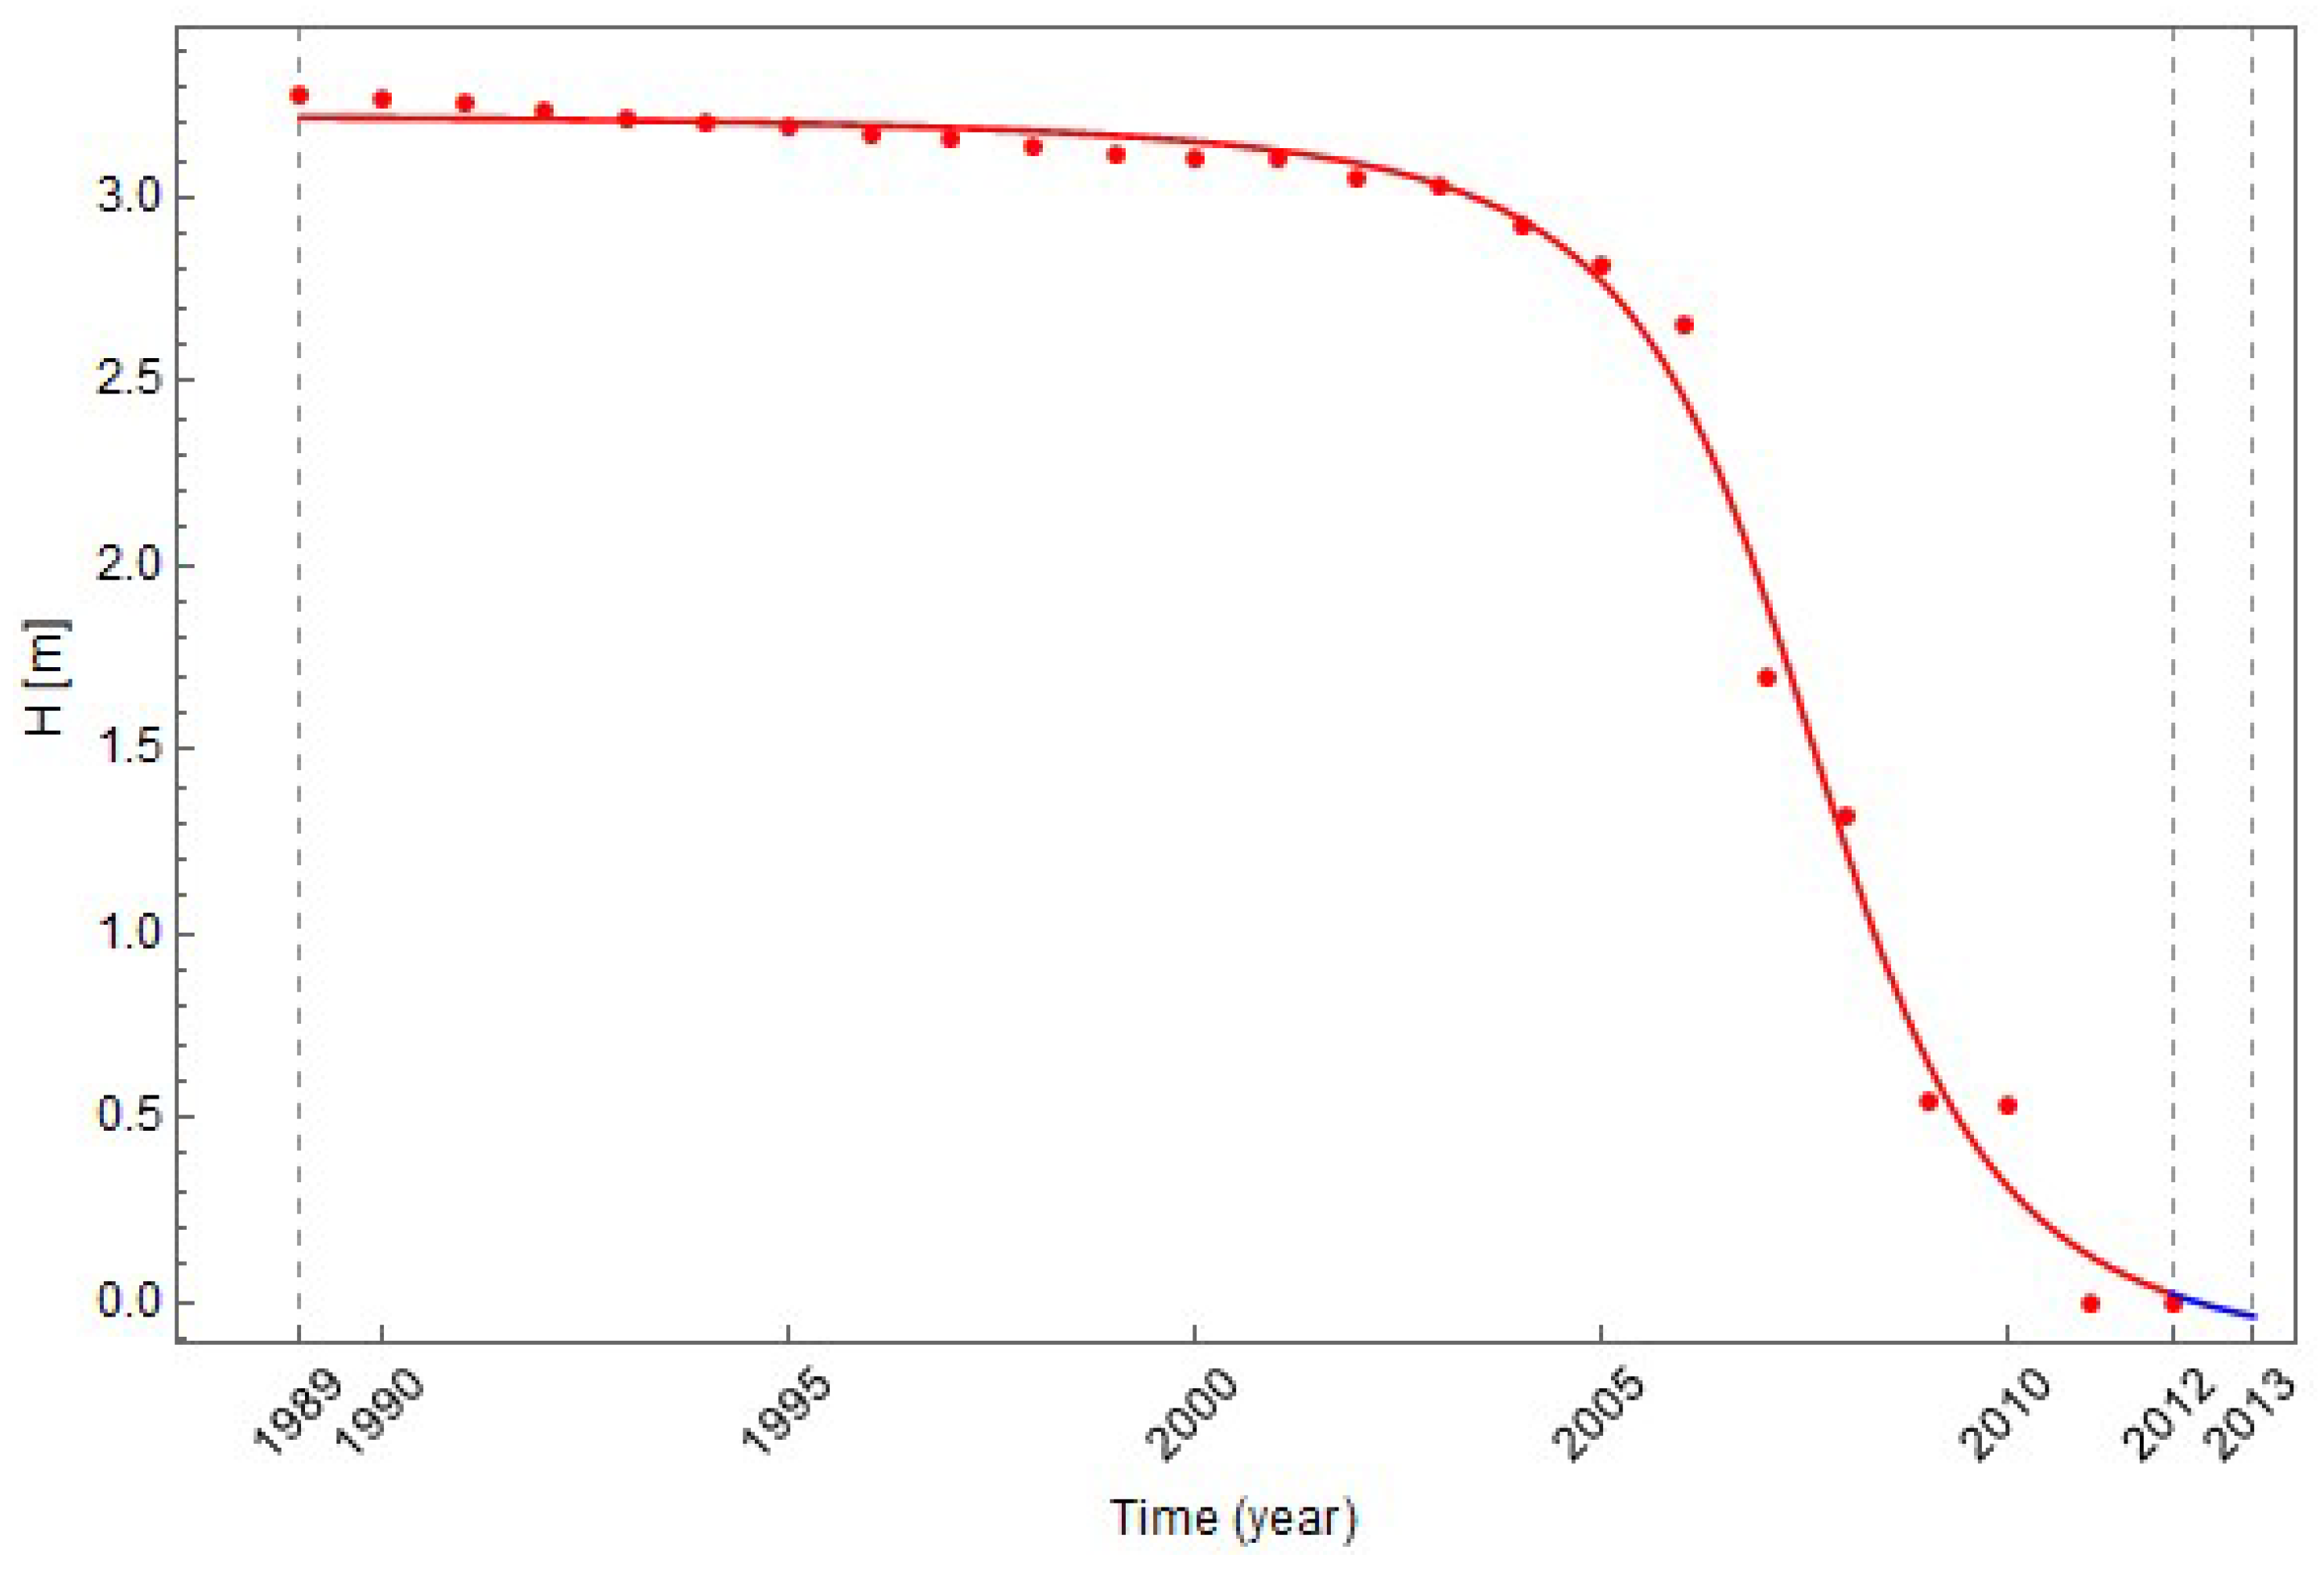
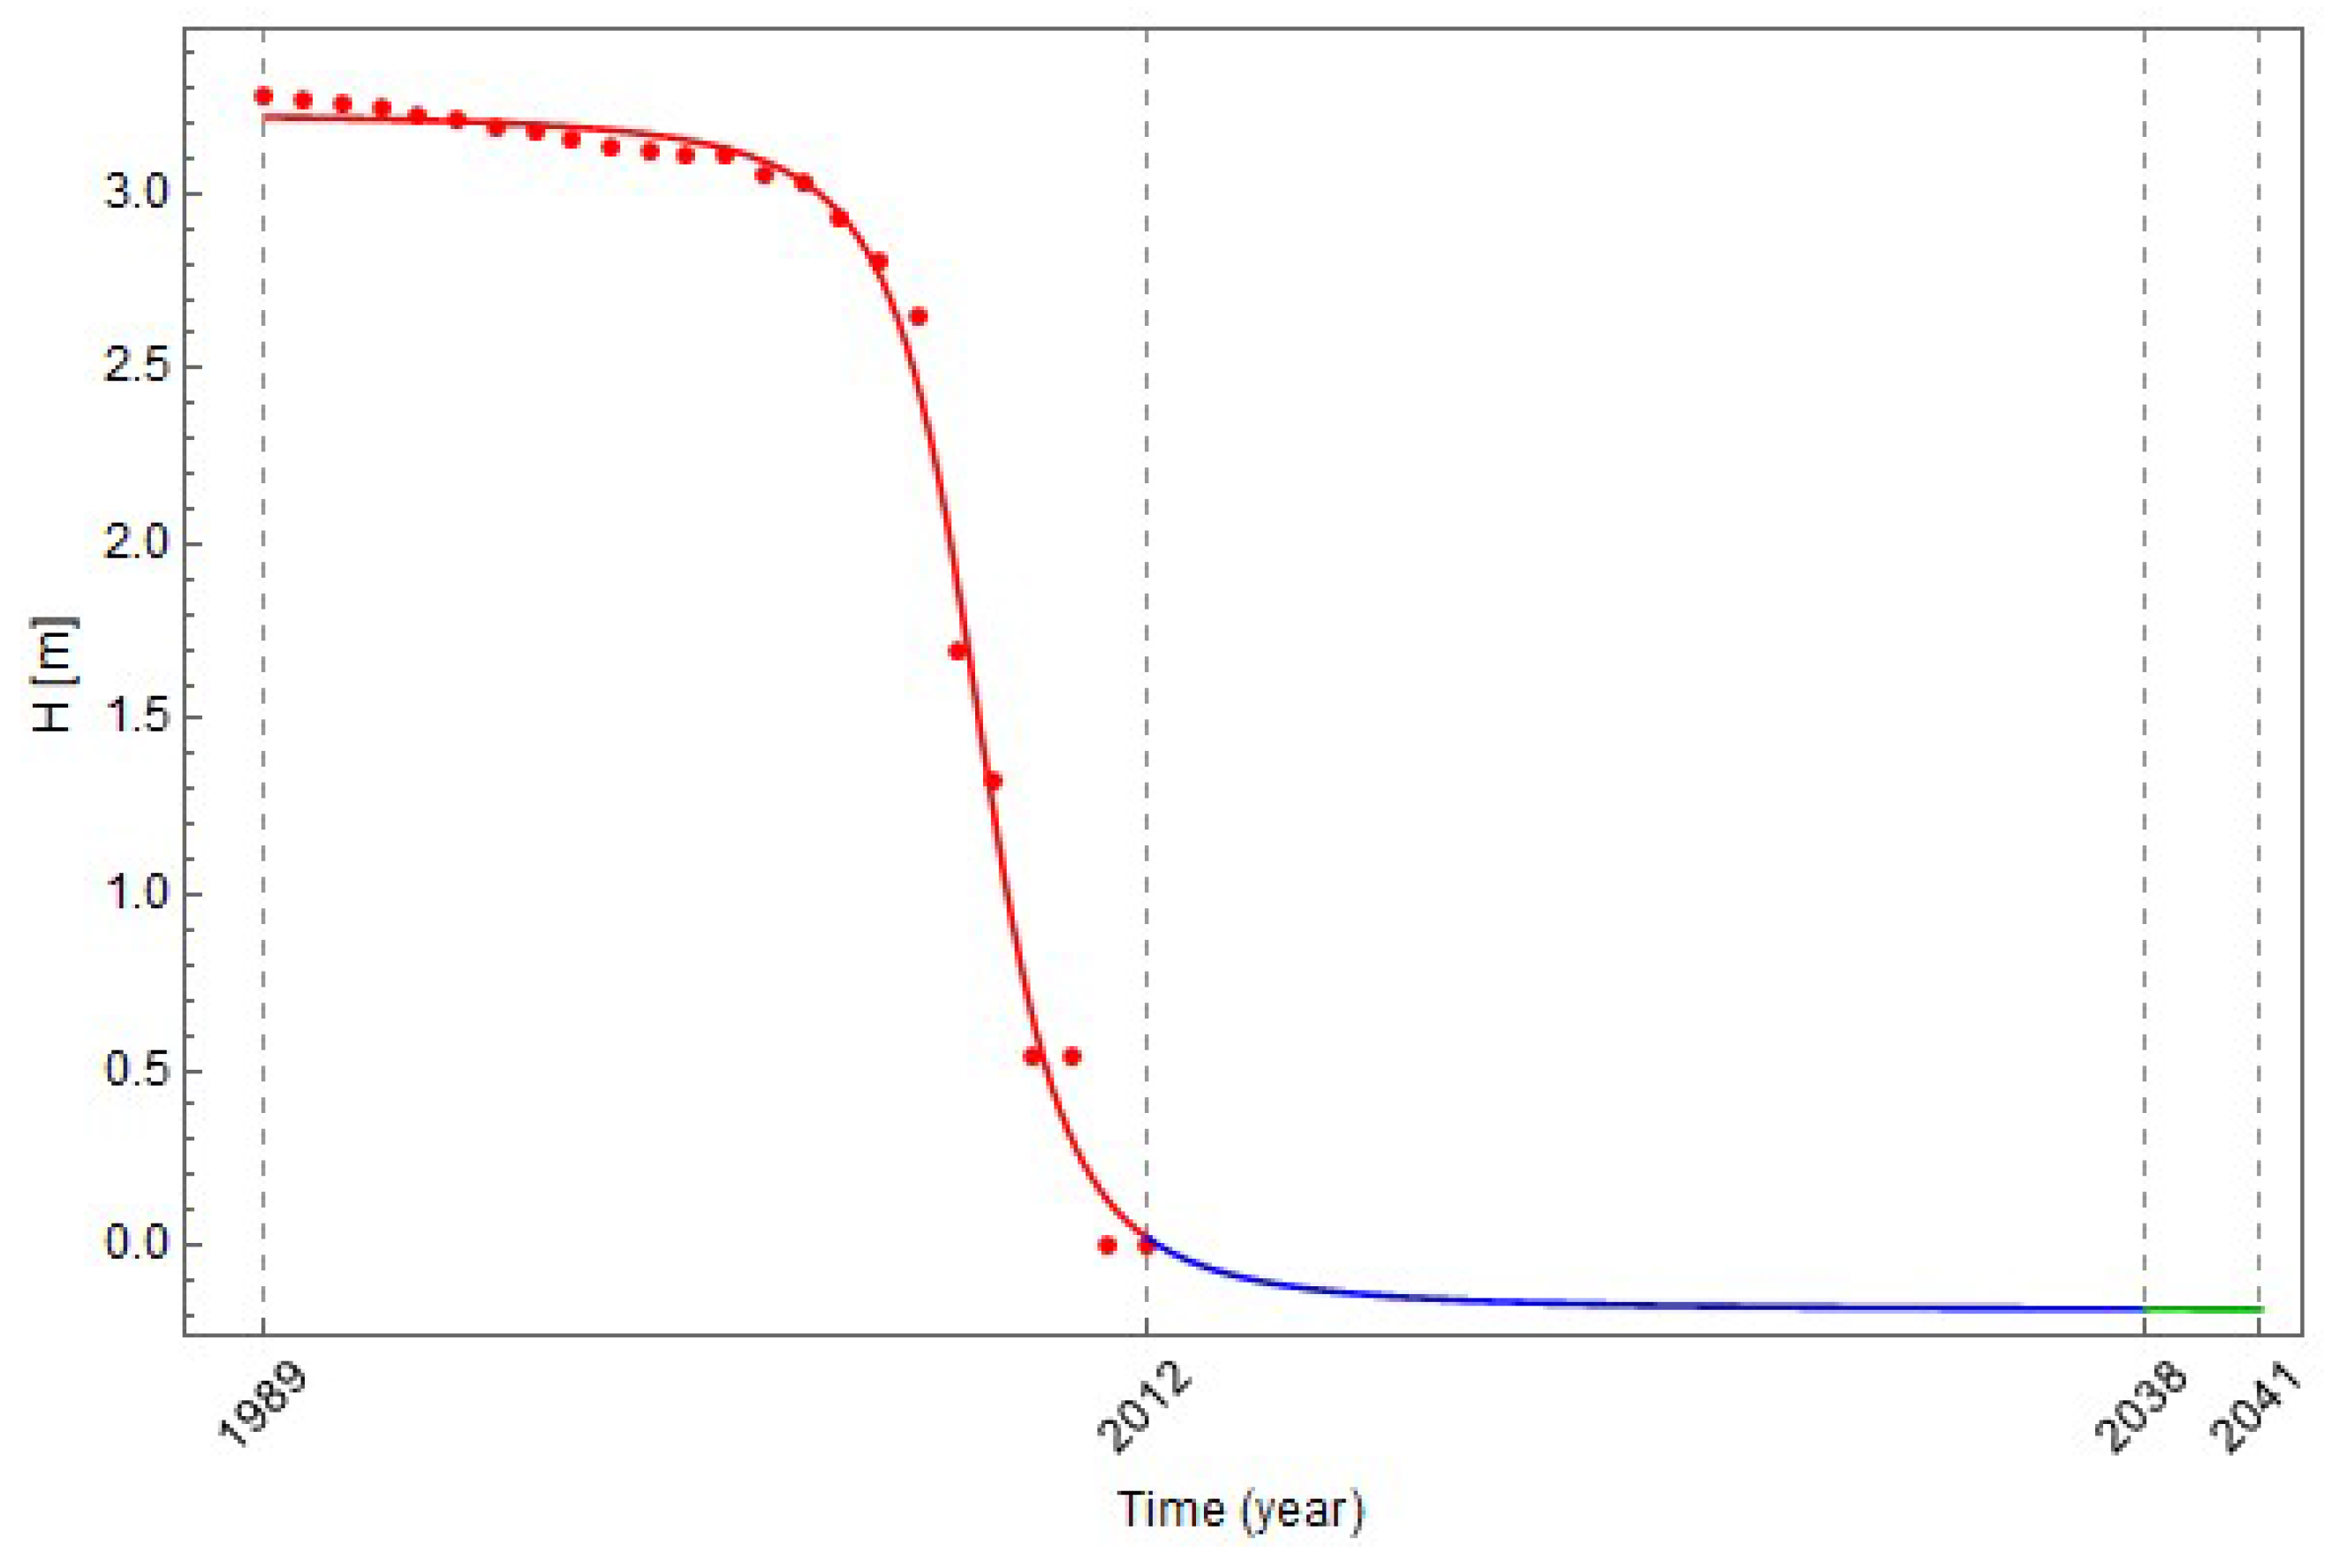
In Figure 7, real data of vertical displacement of point GB/6 (red circles) and the best fit theoretical modified sigmoid function (red curve) are shown. Furthermore, the prediction of subsidence and the time of the next and the final observation measurements is determined from Equations (2) and (3). The next observation measurement is, according to the criterion from Equation (2), needed one year after the last observation measurement, i.e., in the year 2013 (Figure 8). Between 2012 and 2013, subsidence, i.e., vertical displacement, of 0.061 m will develop. Yearly subsidence greater than 0.001 m is predicted till year 2038. This applies to the active state of subsidence of the observed area, so further monitoring is required (Figure 9—blue curve). In this phase, total subsidence from 2012 to 2038 is 0.2021 m. From 2038 on, subsidence of less than 0.001 m per year will develop. During this period, the subsidence of the area slowly calms down, and the function is consolidated (Figure 9—green curve), and no further observation measurements will be needed. Thus, the measurements at observation point GB/6 must be carried out once a year until 2038. The final observation measurement will be required 3 years after the last measurement, i.e., in 2041. Predicted total subsidence from 2038 till 2041 is 0.0009 m, i.e., 0.91 mm.
The observation point GB/6 is located in an area where intensive excavation started only after 2010. Due to the proximity of the excavation panels, over 3 m subsidence in only 8 years occurred, and the point was consequently destroyed in 2012. According to the results, subsidence in this area will be active until 2038. However, this is only valid on the assumption that underground mining activities do not take place at this location in the future.
Table 3 shows the results of the analysis of the vertical displacement fitted by a modified sigmoid function for observation point A5. In Figure 10, real data of the vertical displacement of point A5 for period from 1989 to 2003 (red circles) and the best fit theoretical modified sigmoid function (red curve) are shown. The next observation measurement is needed in year 2004. This applies to the active state of subsidence of the observed area, so further monitoring is required until 2012, when consolidation begins (Figure 10—blue curve). Total subsidence in time period 2003–2012 is 0.0081 m. Depending on the conditions selected, the final observation measurement will be required in the year 2015.
Point A5 was located on the shore of the lake and was destroyed in 2003 during the remediation work of the shoreline. In the point’s vicinity, the largest excavation activities were in the 80 s, and then the excavations moved towards north. The time prediction of the final measurement according to the conditions from Equation (3) is in the year 2015.
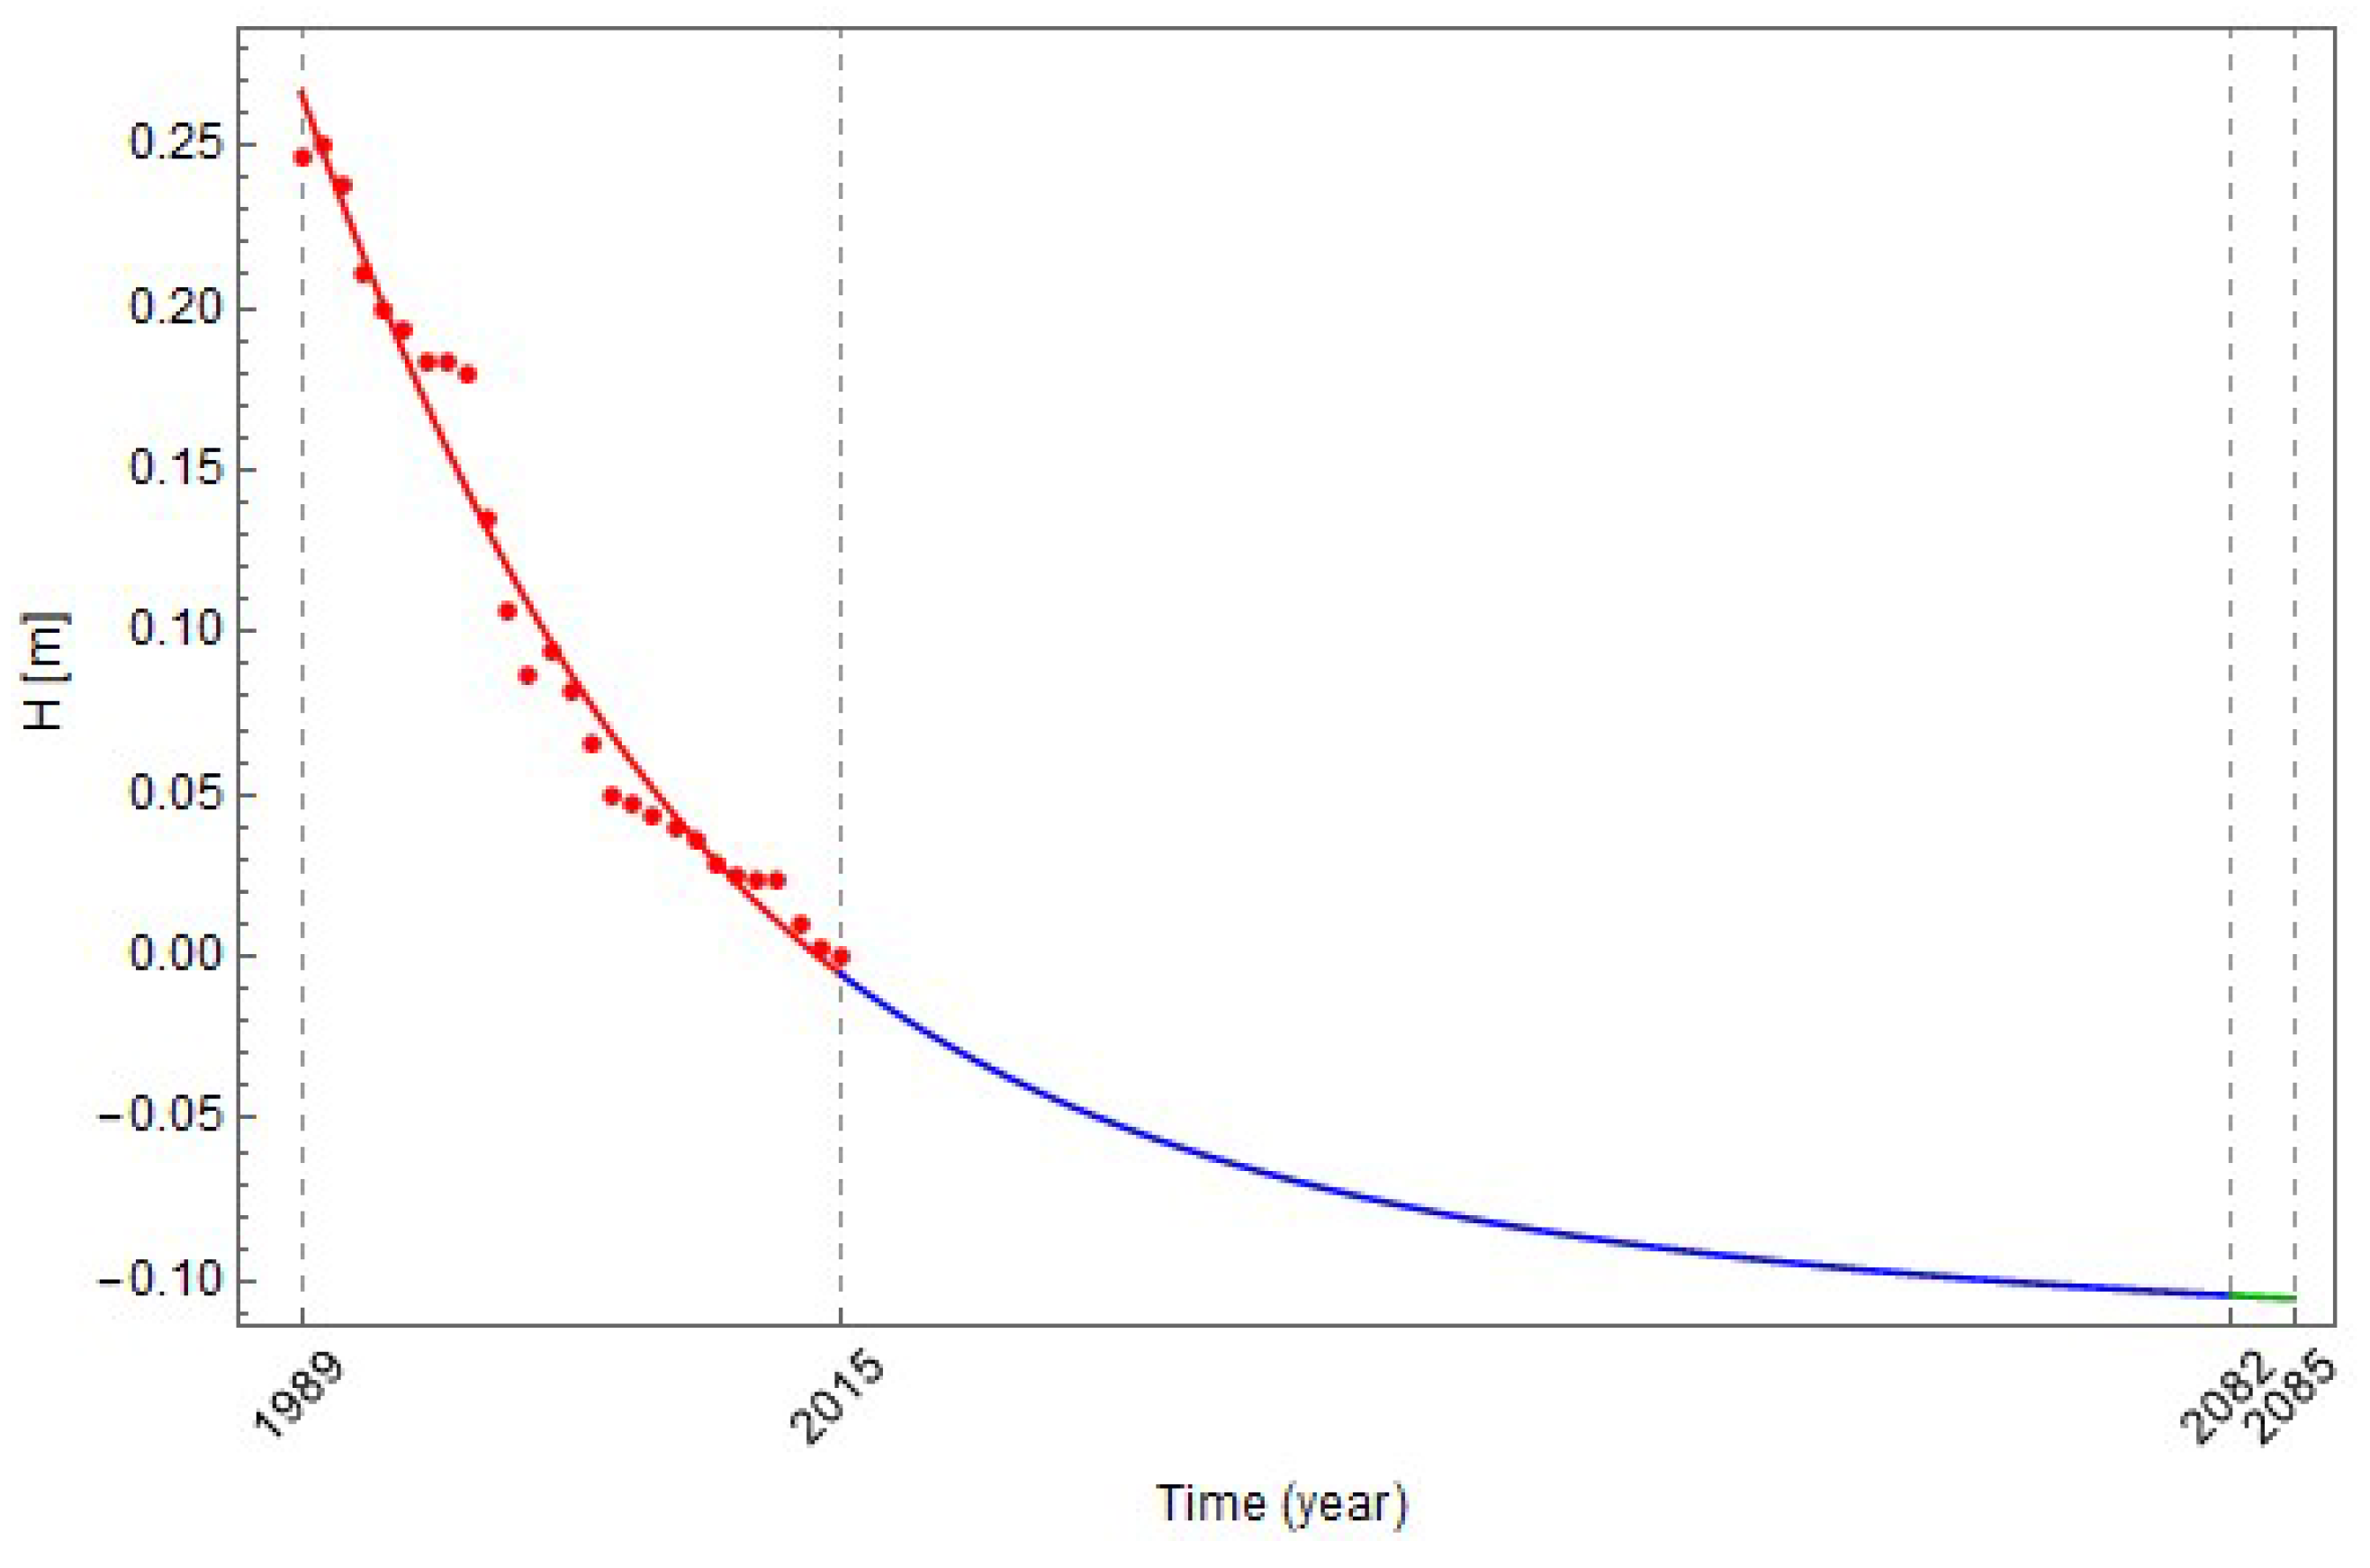
In Table 4, the results of the analysis of the vertical displacement fitted by a modified sigmoid function for observation point 367a/4 are shown. In Figure 11, real data of the vertical displacement of point 367a/4 for the period from 1989 till 2015 (red circles) and the best fit theoretical modified sigmoid function (red curve) are shown. The next observation measurement is needed in 2016; the vertical displacement change between that from 2015 and that predicted in 2082 is 0.0991 m. This applies to the active state of subsidence of the observed area, so further monitoring is required (Figure 11—blue curve). Depending on the conditions selected, the final observation measurement will be required in the year 2085.
Point 367/a4 is located on a slope northwest of point A5 and is affected by the same excavation panels as point A5. Until 2003, both points A5 and 367/a4 subsided for 12 and 18 cm, respectively. On both graphs in Figure 10 and Figure 11, a step-like curve due to the excavation of several adjacent panels in certain periods of a few years is noticeable.
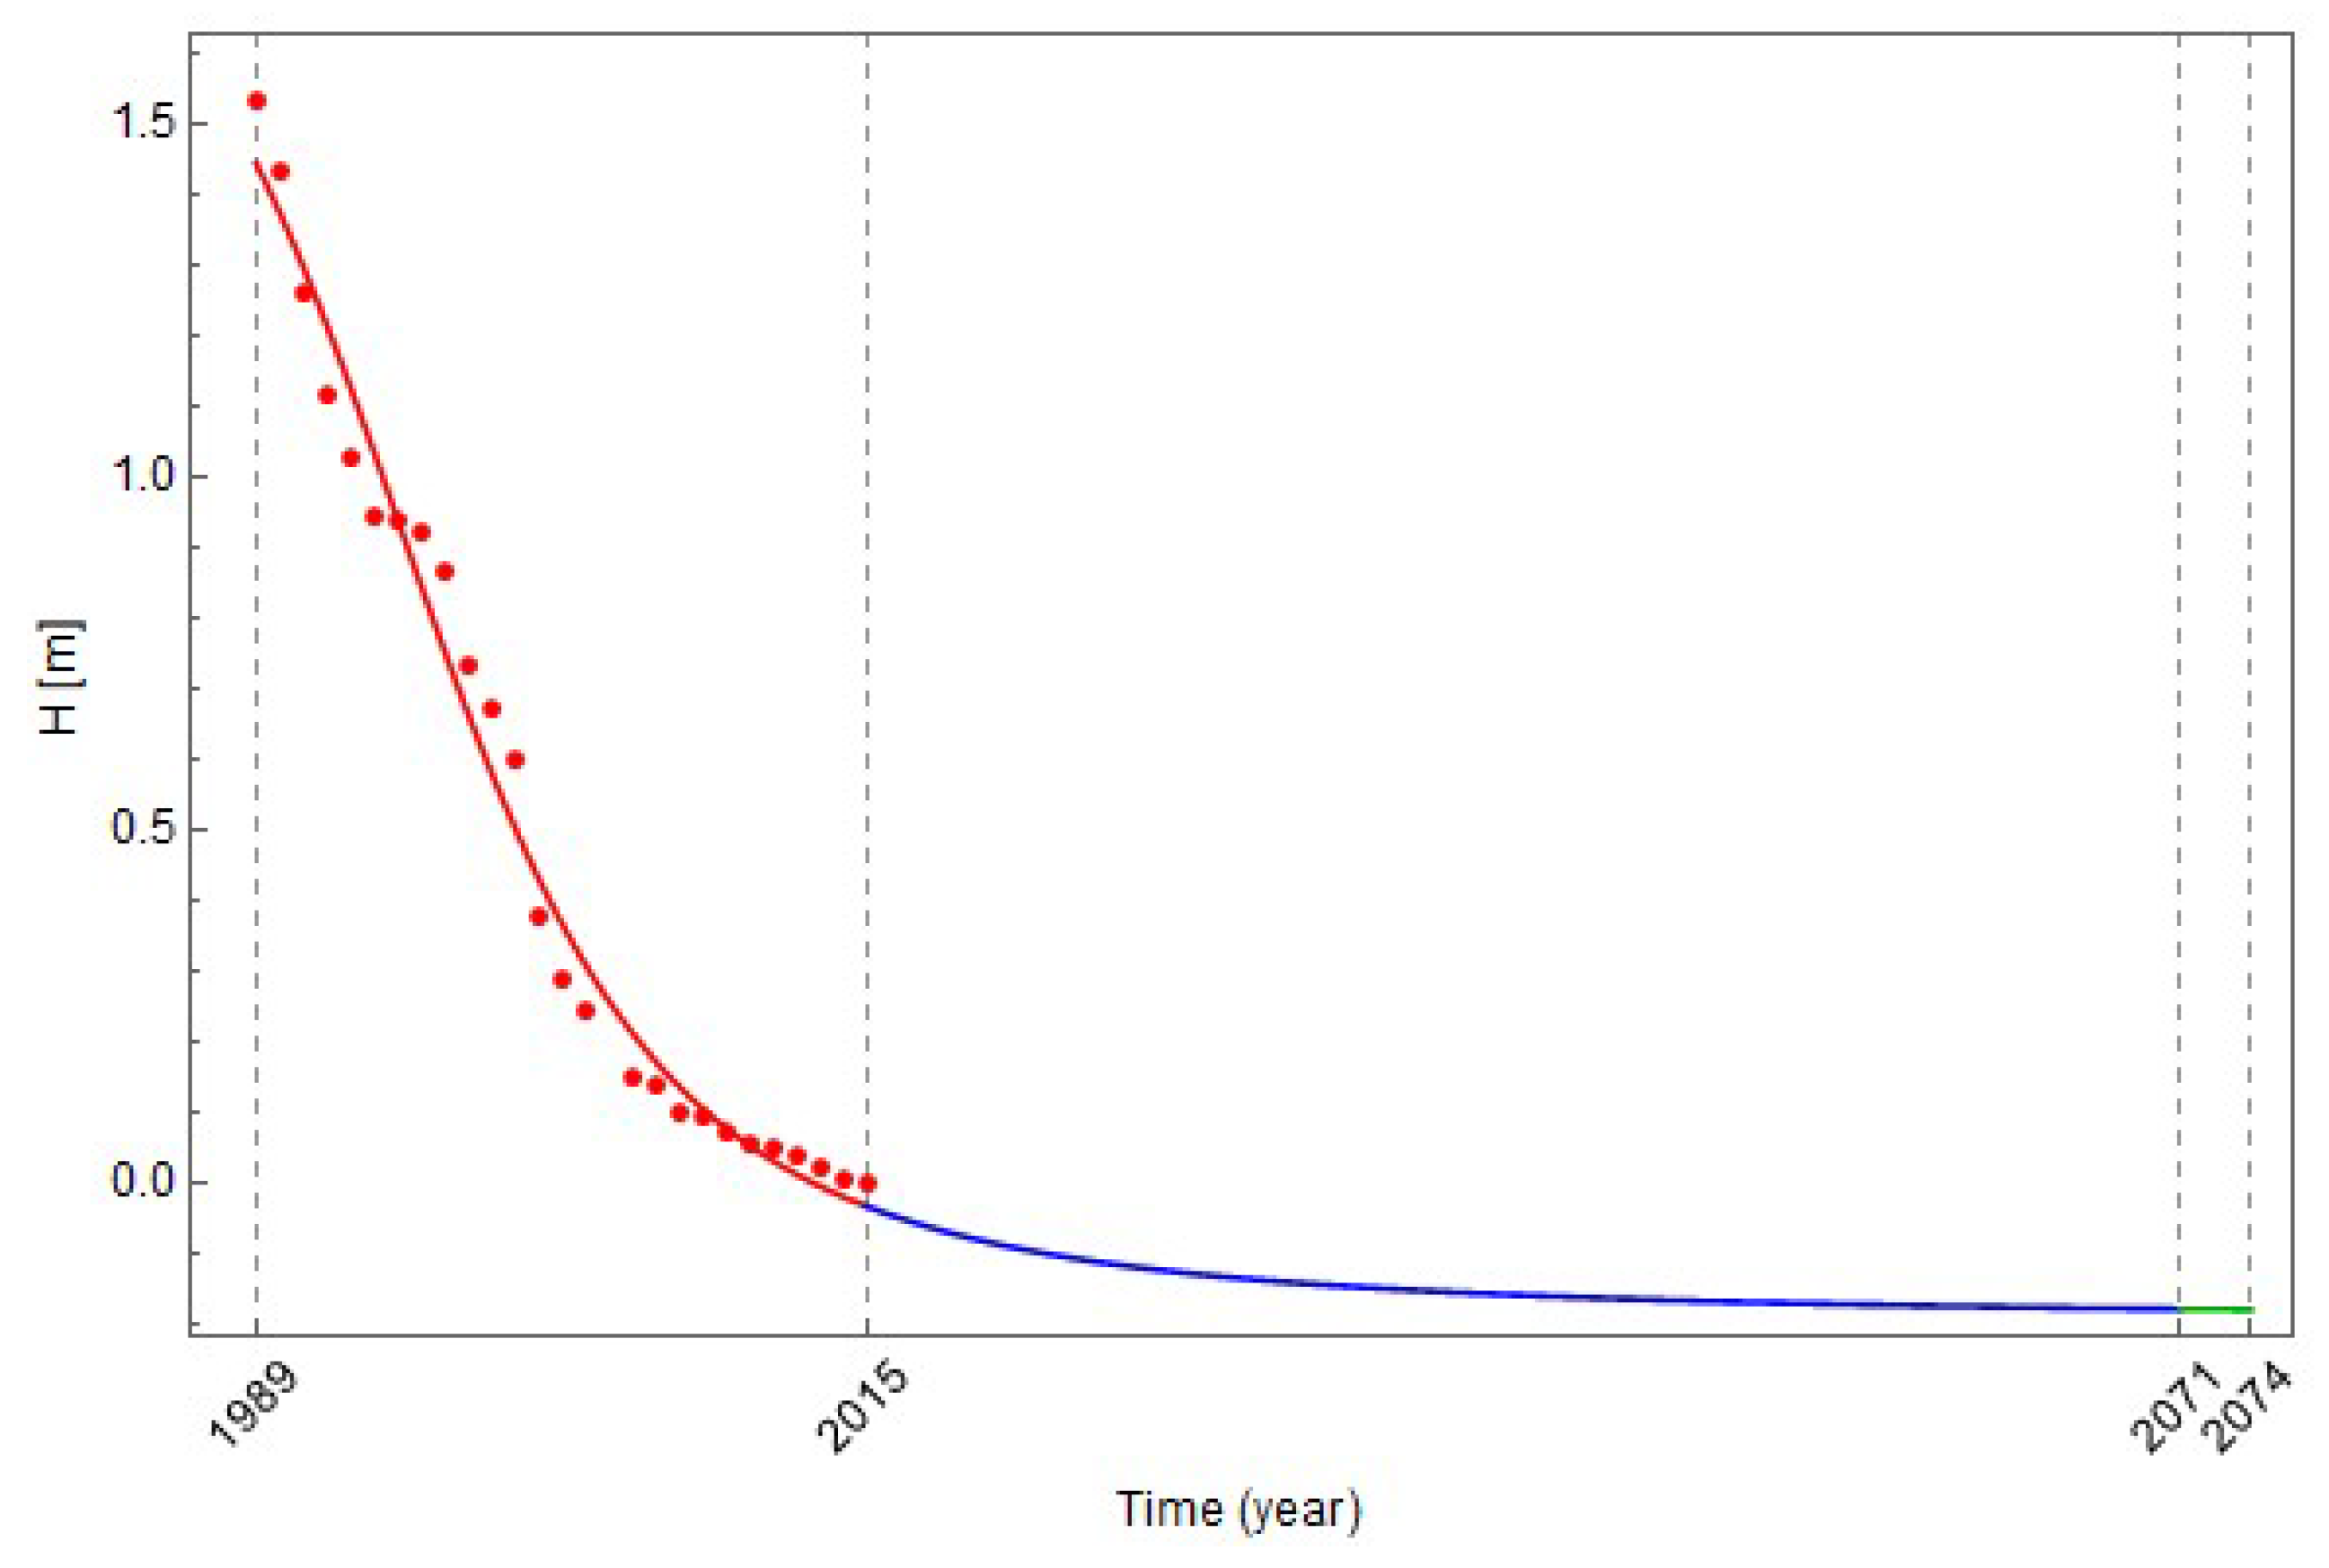
Table 5 shows the results of the analysis of the vertical displacement fitted by a modified sigmoid function for observation point Ša7. In Figure 12 real data of the vertical displacement of point Ša7 for the period from 1989 to 2015 (red circles) and the best fit theoretical modified sigmoid function (red curve) are shown. The next observation measurement is needed in year 2016. This applies to the active state of subsidence of the observed area, so further monitoring is required until 2071, when consolidation begins (Figure 12—blue curve). In this phase, total subsidence from 2015 till 2071 is 0.0991 m. From 2071 on, subsidence of less than 0.001 m per year will be developed. The final observation measurement will be required in the year 2074. Predicted total subsidence from 2071 till 2074 is 0.0010 m.
Point Ša7 is located north of the Škale pit, in an area that today is not subject to direct influence of mining activities. From 1989 to 2015, the point Ša7 subsided for 1.5 m. The largest excavation activities date back to the 1980s. In addition, three excavation panels were active in the area in the 1990s, and another one after year 2000. Additionally, a step-like curve due to the excavation of several adjacent panels is noticeable. At this location, no excavation is predicted in the future; therefore, it is a welcome assessment of when the consolidation, according to modelling function, will take place.
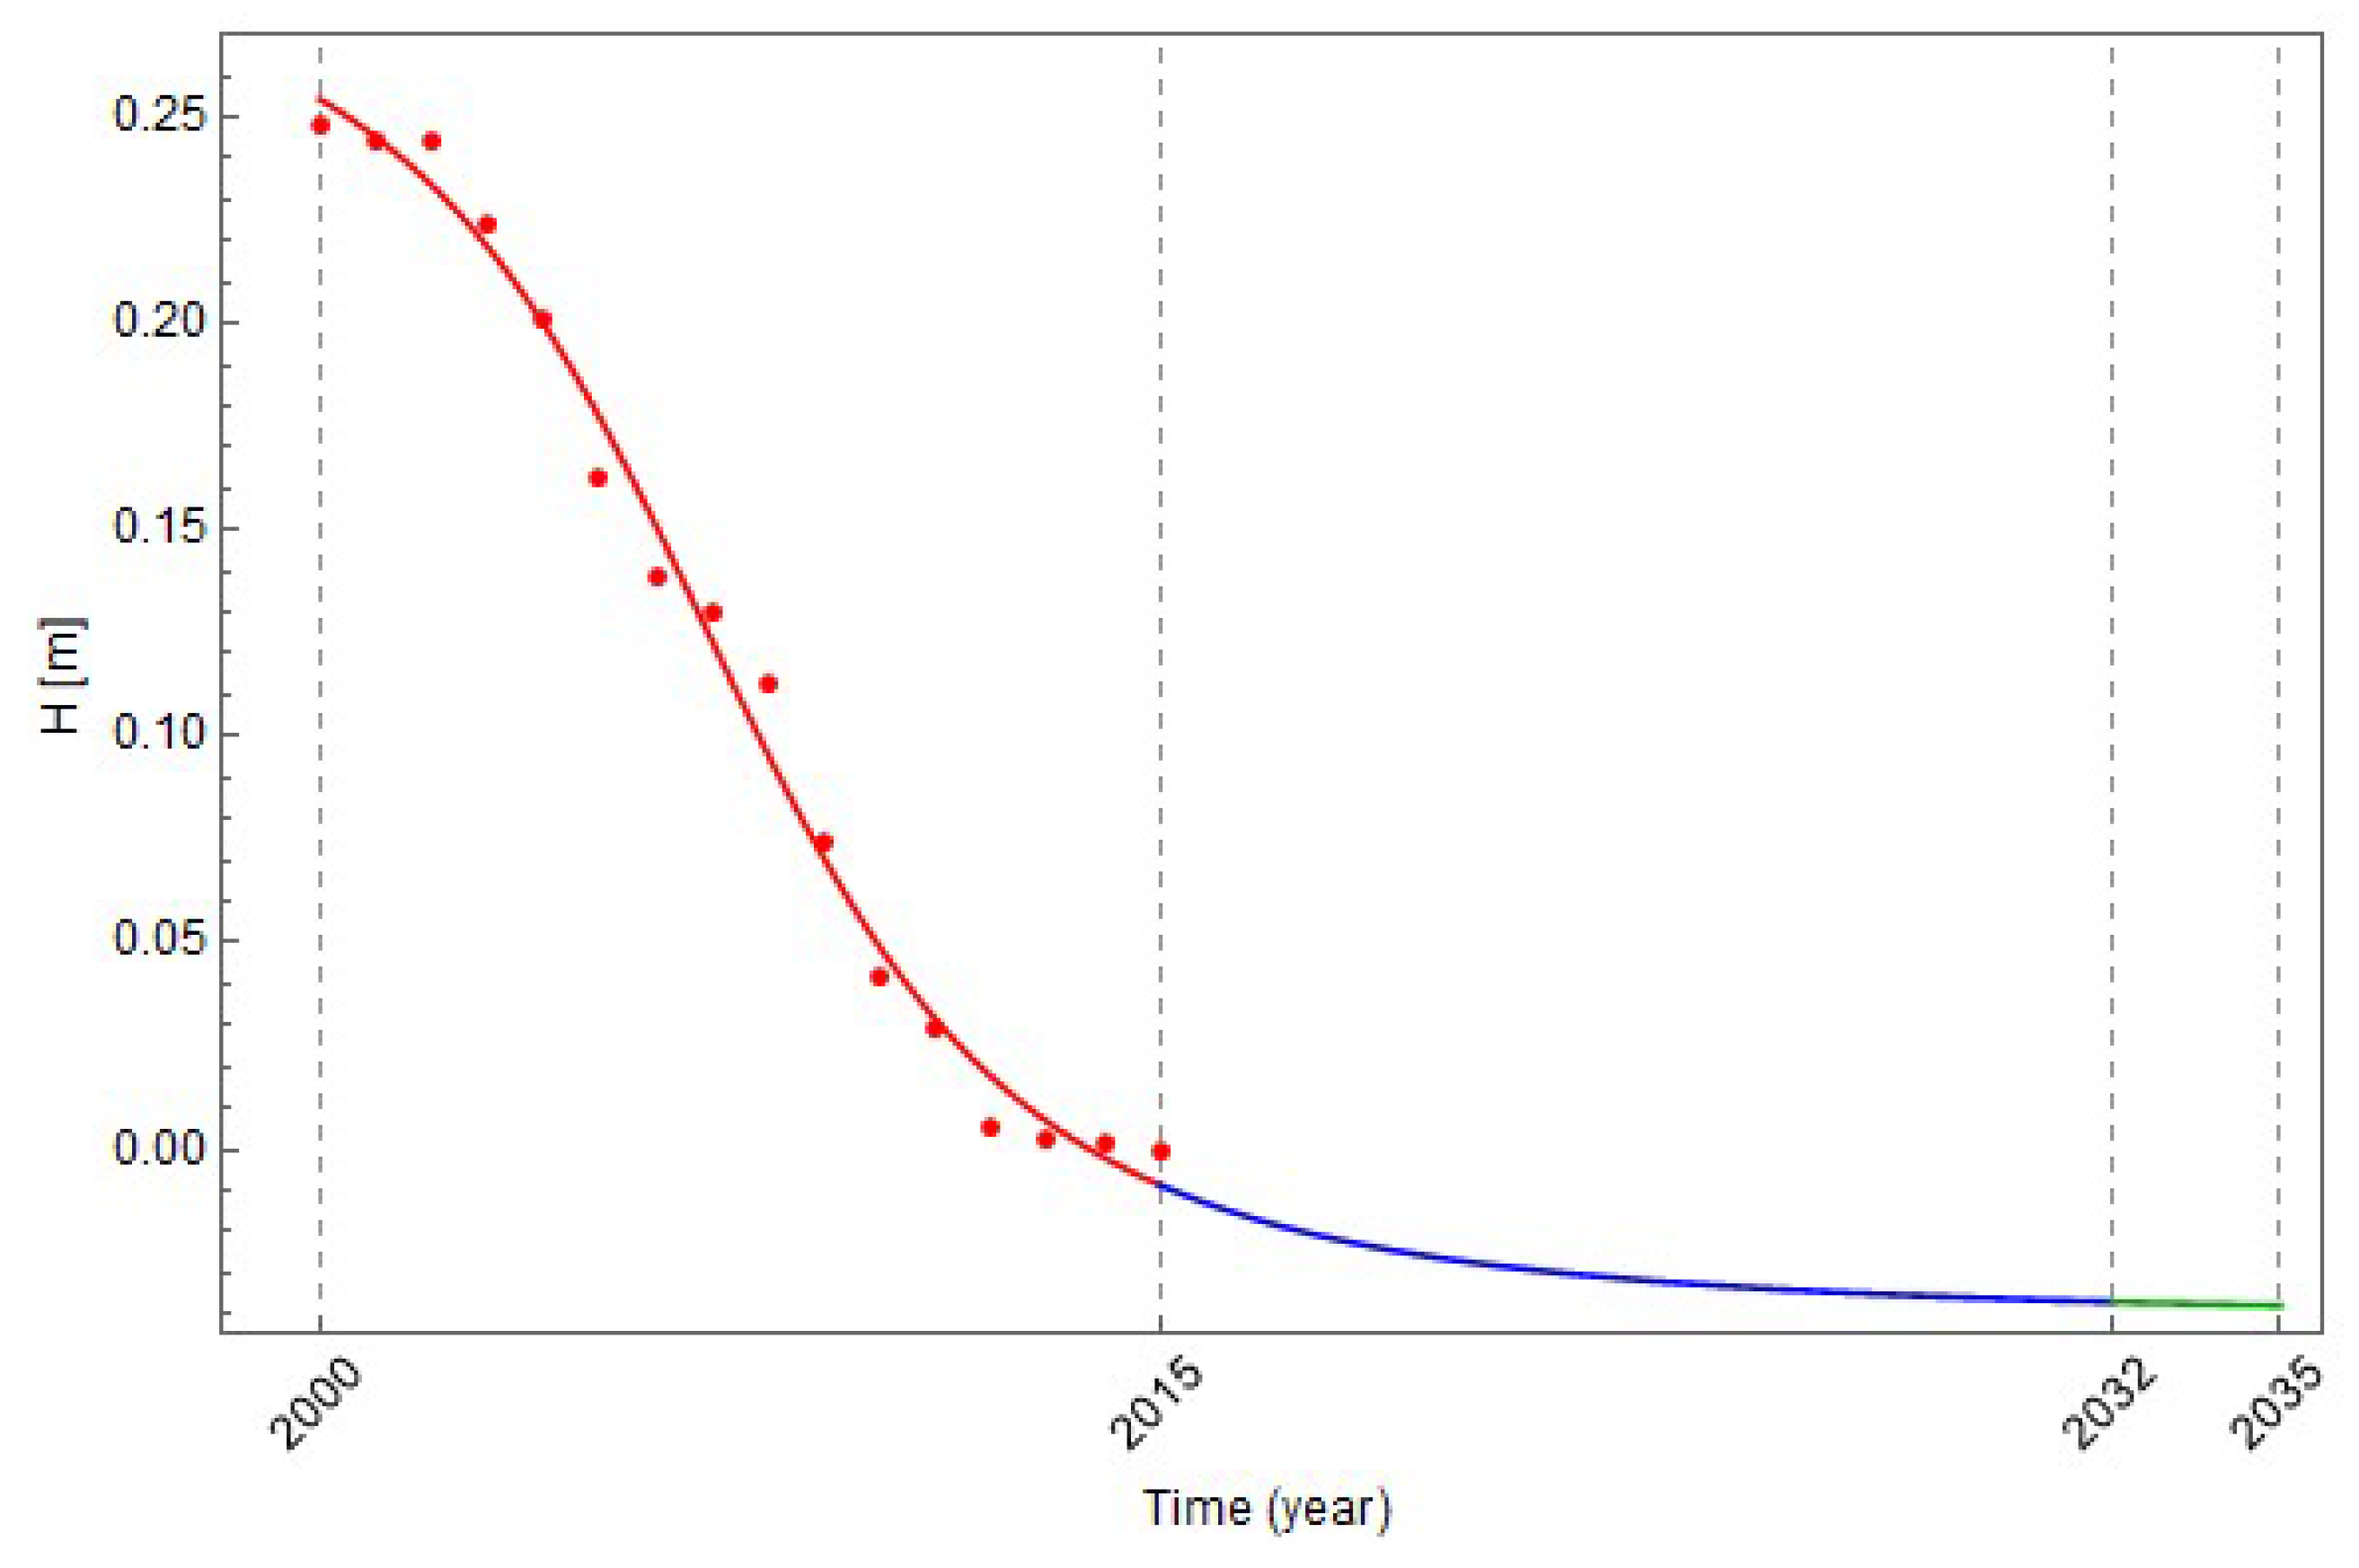
Table 6 shows the results of the analysis of the vertical displacement fitted by a modified sigmoid function for observation point X1-A1. In Figure 13, real data of the vertical displacement of point X1-A1 for period from 2000 to 2015 (red circles) and the best fit theoretical modified sigmoid function (red curve) are shown. The next observation measurement is needed in year 2016. This applies to the active state of subsidence of the observed area, so further monitoring is required until 2032, when consolidation begins (Figure 13—blue curve). In this period, total subsidence of 0.0284 m will occur. The final observation measurement will be required in the year 2035. In this final period from 2032 till 2035, i.e., the function’s consolidation state, total subsidence of 0.0009 m is predicted (Figure 13—green curve).
Observation point X1-A1 was stabilized in 2000 in the area south of the excavation activities. Excavation is not planned in this area. The results show that, depending on the criteria set, the function will be consolidated around 2030.
The presented surface subsidence model contributes to more efficient surface monitoring in the VCM area, enabling the assessment of the surface subsidence development in the future and forecasting the next needed and final observation measurements. An insight into the dynamics of surface subsidence opens a new opportunity for further exploration. While the subsidence at the surface does not occur suddenly, but develops progressively as the coal is extracted within the area of influence of the extracted coal panel, a point on the surface is affected by the extraction of several adjacent panels [11]. Further development of the model would encompass development of selective splitting of data to illustrate the step-like process of surface subsidence as a result of the VMM through developing a modified higher degree polynomial function.
4. Conclusions
One of the VMM’s characteristics is the excavation of the thick coal seam in several levels, starting from the highest and continuing down to the lowest level. The maximum subsidence occurs over the center of the excavation panel. In the case of longwall mining, the excavated area is quite large, and the area over which subsidence occurs becomes greater. Furthermore, in the VCM, several excavation panels are active in different levels at the same time. This results in a series of overlapping subsidence curves, which correspond to the complex process of surface subsidence. The described method is developed for the Velenje coal seam, which is very thick and spacious. Excavation of coal is carried out without permanent safety pillars and without backfilling in excavated space. Consequently, large subsidence of the overlaying strata and the formation of surface depressions occur. While the geometry, sizes and excavation heights are quite similar between panels, the major influences on surface subsidence are panel location, excavation depth and excavation time sequence. The subsidence process takes a long time, so regular mine surveying measurements are required throughout the period of active subsidence as well as later. Interpretation of the dynamics of surface subsidence can be demonstrated by a simple mathematical model, such as a modified sigmoidal function. Data from the five surface observation points were used. With the described model, it is possible to follow the process of subsidence, to plan and perform measurements of individual observation networks more rationally, which is reflected in more efficient monitoring and control of surface subsidence in the coal mine area and positively affecting cost efficiency.
The following main conclusions can be made based on this study: the presented modified sigmoidal function is suitable for surface subsidence data from the Velenje Coal Mine area due to good analysis results, less sensitive parameters and reduced model complexity. Moreover, the time estimation of the next and final observation measurement, when monitoring is no longer necessary, can be determined. However, all additional measurements are welcome, and will improve understanding of processes related to underground coal excavation, consolidation and their impact on surface subsidence.
Acknowledgments
We would like to thank Premogovnik Velenje for the data and for covering the costs of publishing this paper.
Author Contributions
J.R. and D.P. collected end edited the subsidence data, and defined the area of observation, M.V. conceived and designed the model, led the research, and carried out the data processing, J.R. and D.P. wrote the paper.
Conflicts of Interest
The authors declare no conflict of interest.
References
- Markič, M.; Sachsenhofer, R.F. The Velenje Lignite—Its Petrology and Genesis; Geological Survey of Slovenia: Ljubljana, Slovenia, 2010; p. 218. [Google Scholar]
- Medved, M.; Golob, L. Sustainable development of Velenje Coal Mining Method and its global use. In Proceedings of the 4rd Balkan Mining Congress—Balkanmine, Ljubljana, Slovenia, 18–20 October 2011; pp. 349–359. [Google Scholar]
- Medved, M.; Dervarič, E.; Vižintin, G.; Likar, J.; Mayer, J. Analysis of seismic events at the Velenje Coal Mine. RMZ—Mater. Geoenviron. 2008, 55, 464–475. [Google Scholar]
- Veber, I.; Dervarič, E. Reserves presentation for Velenje coliery according to United Nations framework classification. In Proceedings of the First Session of the Ad Hoc Group of Experts on Classification of Energy Reserves and Resources, Geneva, Switzerland, 10–11 November 2004. [Google Scholar]
- Gibbs, M.N. Variational Gaussian process classifiers. IEEE Trans. Neural Netw. 2000, 11, 1458–1464. [Google Scholar] [PubMed]
- Ravindran Menon, A.; Mehtrotra, K.; Mohan, C.K.; Ranka, S. Characterization of a Class of Sigmoid Functions with Applications to Neural Networks. Electrical Engineering and Computer Science Technical Reports, Syracuse University. 1994. Available online: http://surface.syr.edu/cgi/viewcontent.cgi?article=1176&context=eecs_techreports (accessed on 2 September 2015).
- Vulić, M. Sigmoidna Funkcija (Internal Mine Surveying Lecture Series); University of Ljubljana, Faculty of Natural Sciences and Engineering: Ljubljana, Slovenia, 2013. [Google Scholar]
- Battaglio, M.; Mellomo, N.; Bonzani, I.; Lancellotta, R. Non-linear consolidation models of clay which change type. Int. J. Non-Linear Mech. 2003, 38, 493–500. [Google Scholar] [CrossRef]
- Sheorey, P.R.; Loui, J.P.; Singh, K.B.; Singh, S.K. Ground subsidence observations and a modified influence function method for complete subsidence prediction. Int. J. Rock Mech. Min. Sci. 2000, 37, 801–818. [Google Scholar] [CrossRef]
- Zangerl, C.; Eberhardt, E.; Evans, K.F.; Loew, S. Consolidation settlements above deep tunnels in fractured crystalline rock: Part 2—Numerical analysis of the Gotthard highway tunnel case study. Int. J. Rock Mech. Min. Sci. 2008, 45, 1211–1225. [Google Scholar] [CrossRef]
- Mine Subsidence Engineering Consultants Pty Ltd. Introduction to Longwall Mining and Subsidence; Mine Subsidence Engineering Consultants Pty Ltd.: New South Wales, Australia, 2007. [Google Scholar]
Figure 1.
Typical VMM longwall face equipment.

Figure 2.
The broader area of the Velenje Coal Mine showing the mine roadways (black) and points of observation networks on the surface (red).
Figure 2.
The broader area of the Velenje Coal Mine showing the mine roadways (black) and points of observation networks on the surface (red).

Figure 3.
Schematic SW-NE trending geological cross section [4].
Figure 3.
Schematic SW-NE trending geological cross section [4].
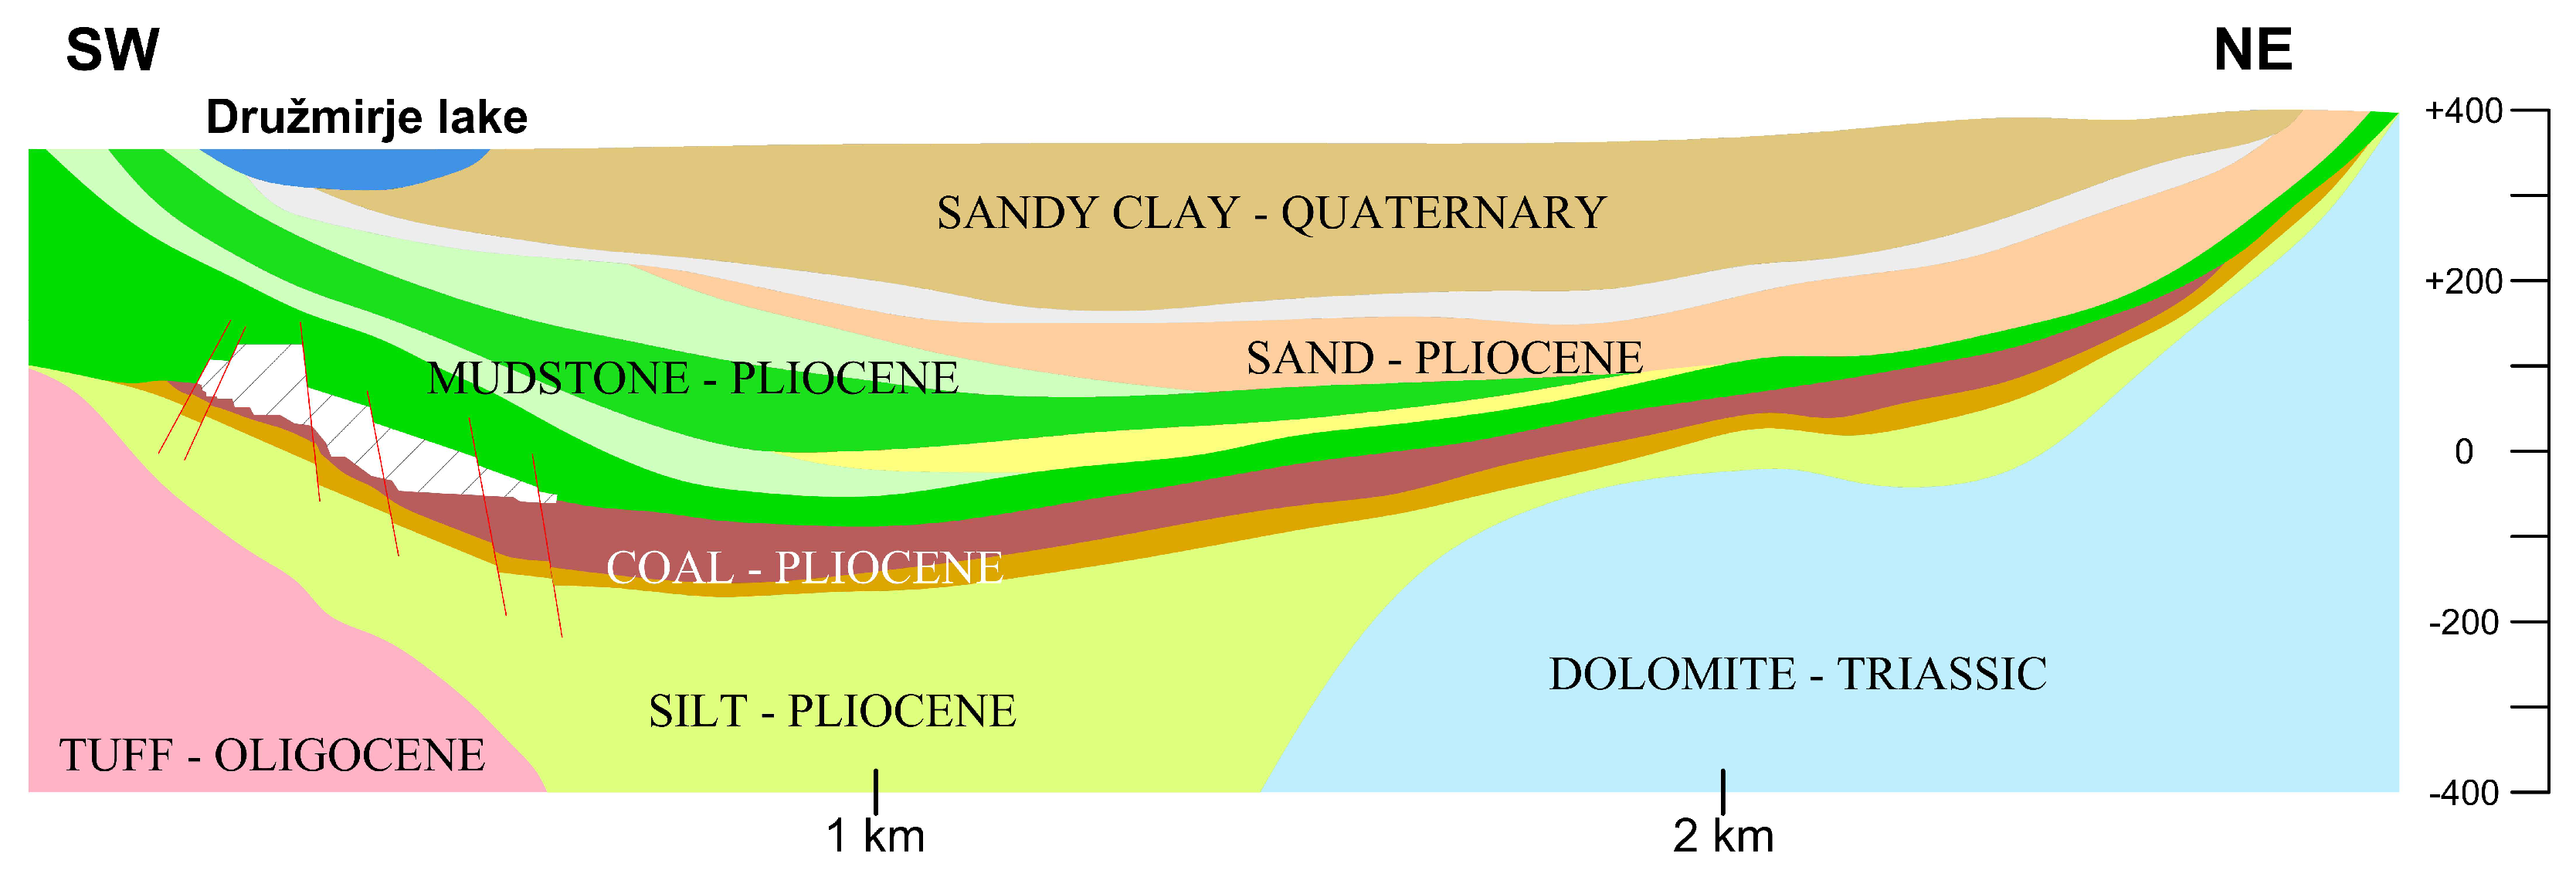
Figure 4.
State of the art excavation scheme of VMM [2].
Figure 4.
State of the art excavation scheme of VMM [2].

Figure 5.
Locations of mining faces from 1980s till today with mine roadways (black) and points of observation networks on the surface (red) that are presented in more detail.
Figure 5.
Locations of mining faces from 1980s till today with mine roadways (black) and points of observation networks on the surface (red) that are presented in more detail.

Figure 6.
The prediction conditions for: (a) the next observation measurement, when 0.001 m; (b) the final observation measurement, when 0.001 m.
Figure 6.
The prediction conditions for: (a) the next observation measurement, when 0.001 m; (b) the final observation measurement, when 0.001 m.
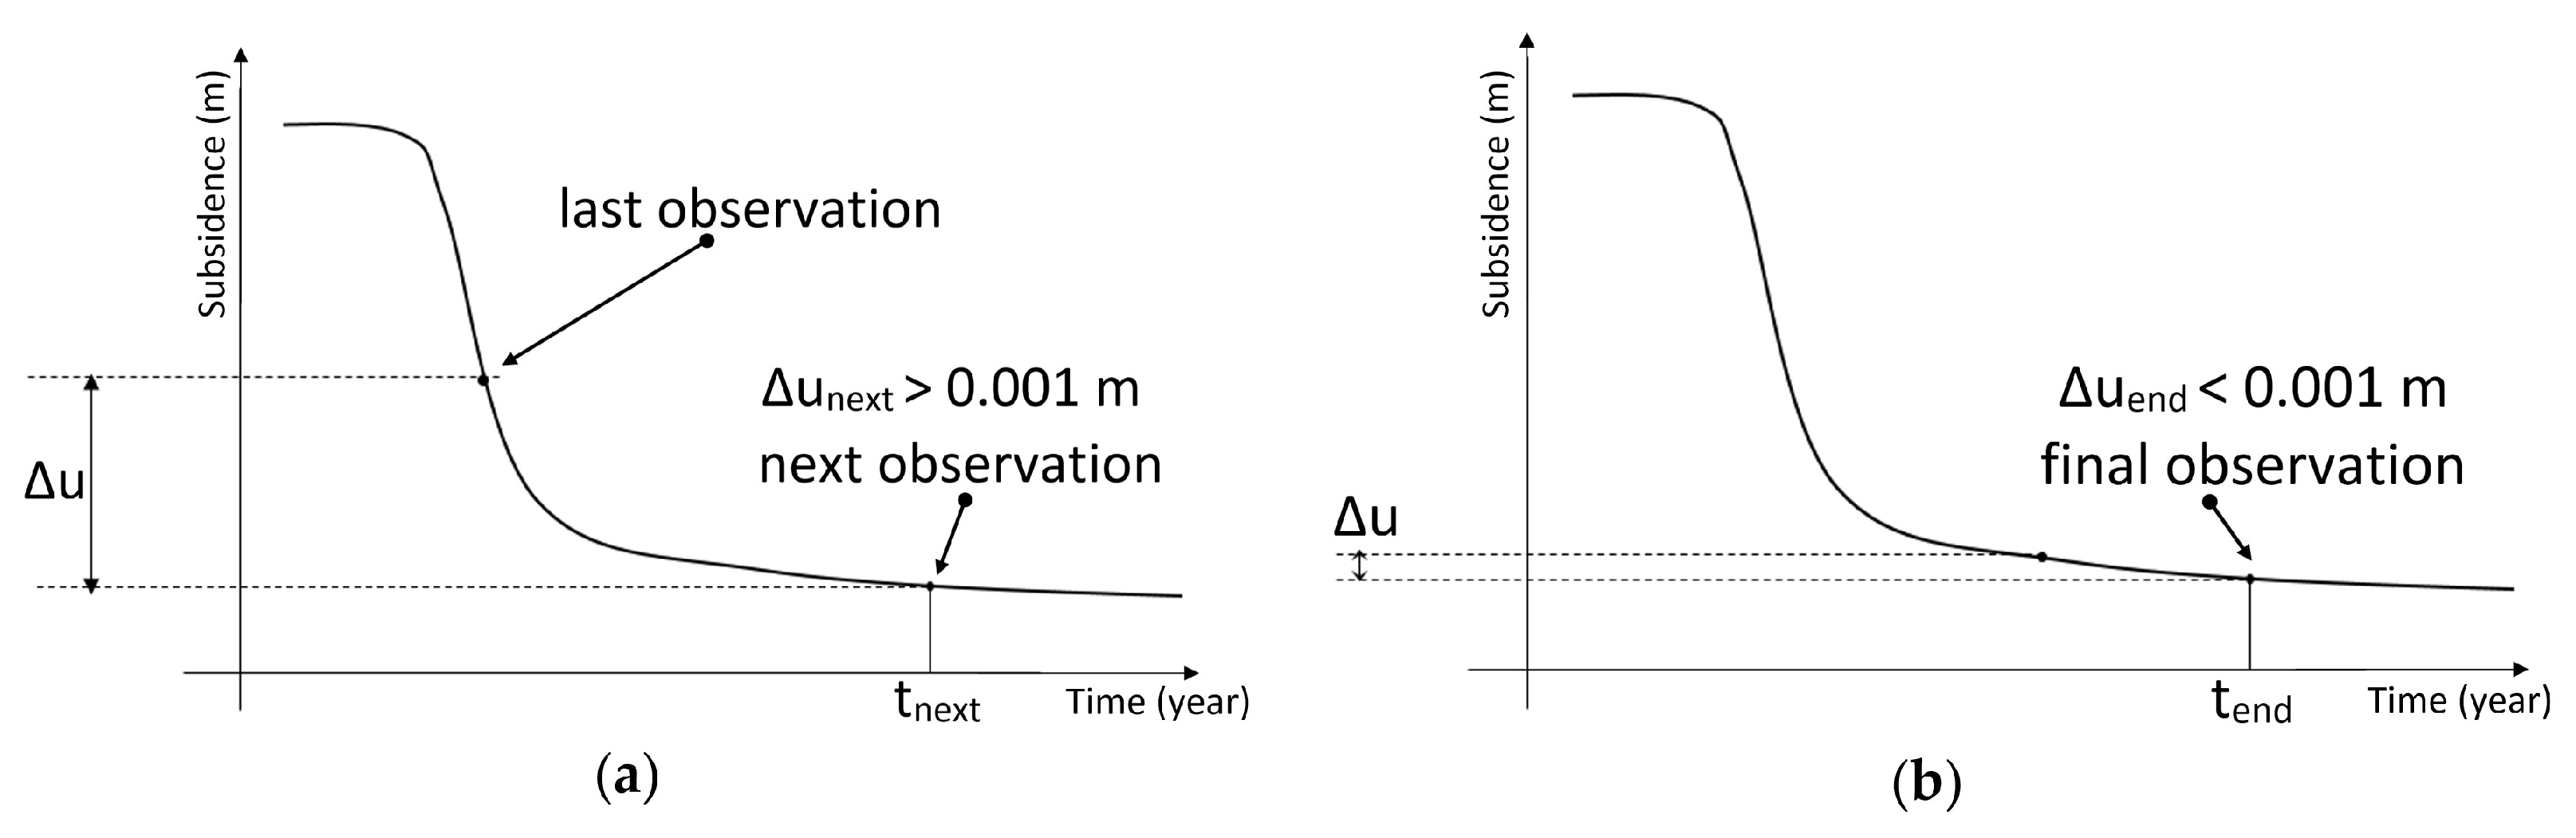
Figure 7.
Graphical presentation of real measured data (red circles) and best fit theoretical modified sigmoid function (red curve) of point GB/6.
Figure 7.
Graphical presentation of real measured data (red circles) and best fit theoretical modified sigmoid function (red curve) of point GB/6.

Figure 8.
Graphical presentation of best fit theoretical modified sigmoid function till 2012 (red curve) and predicted function between years 2012 and 2013 (blue curve) of point GB/6.
Figure 8.
Graphical presentation of best fit theoretical modified sigmoid function till 2012 (red curve) and predicted function between years 2012 and 2013 (blue curve) of point GB/6.

Figure 9.
Graphical presentation of results from analysis of vertical displacement of point GB/6; best fit theoretical modified sigmoid function till last measurement in 2012 (red curve), predicted function between years 2012 and 2038 corresponding to active state of subsidence (blue curve) and consolidation period from 2038 till final observation measurement in 2041 (green curve).

Figure 10.
Graphical presentation of results from analysis of vertical displacement of point A5.
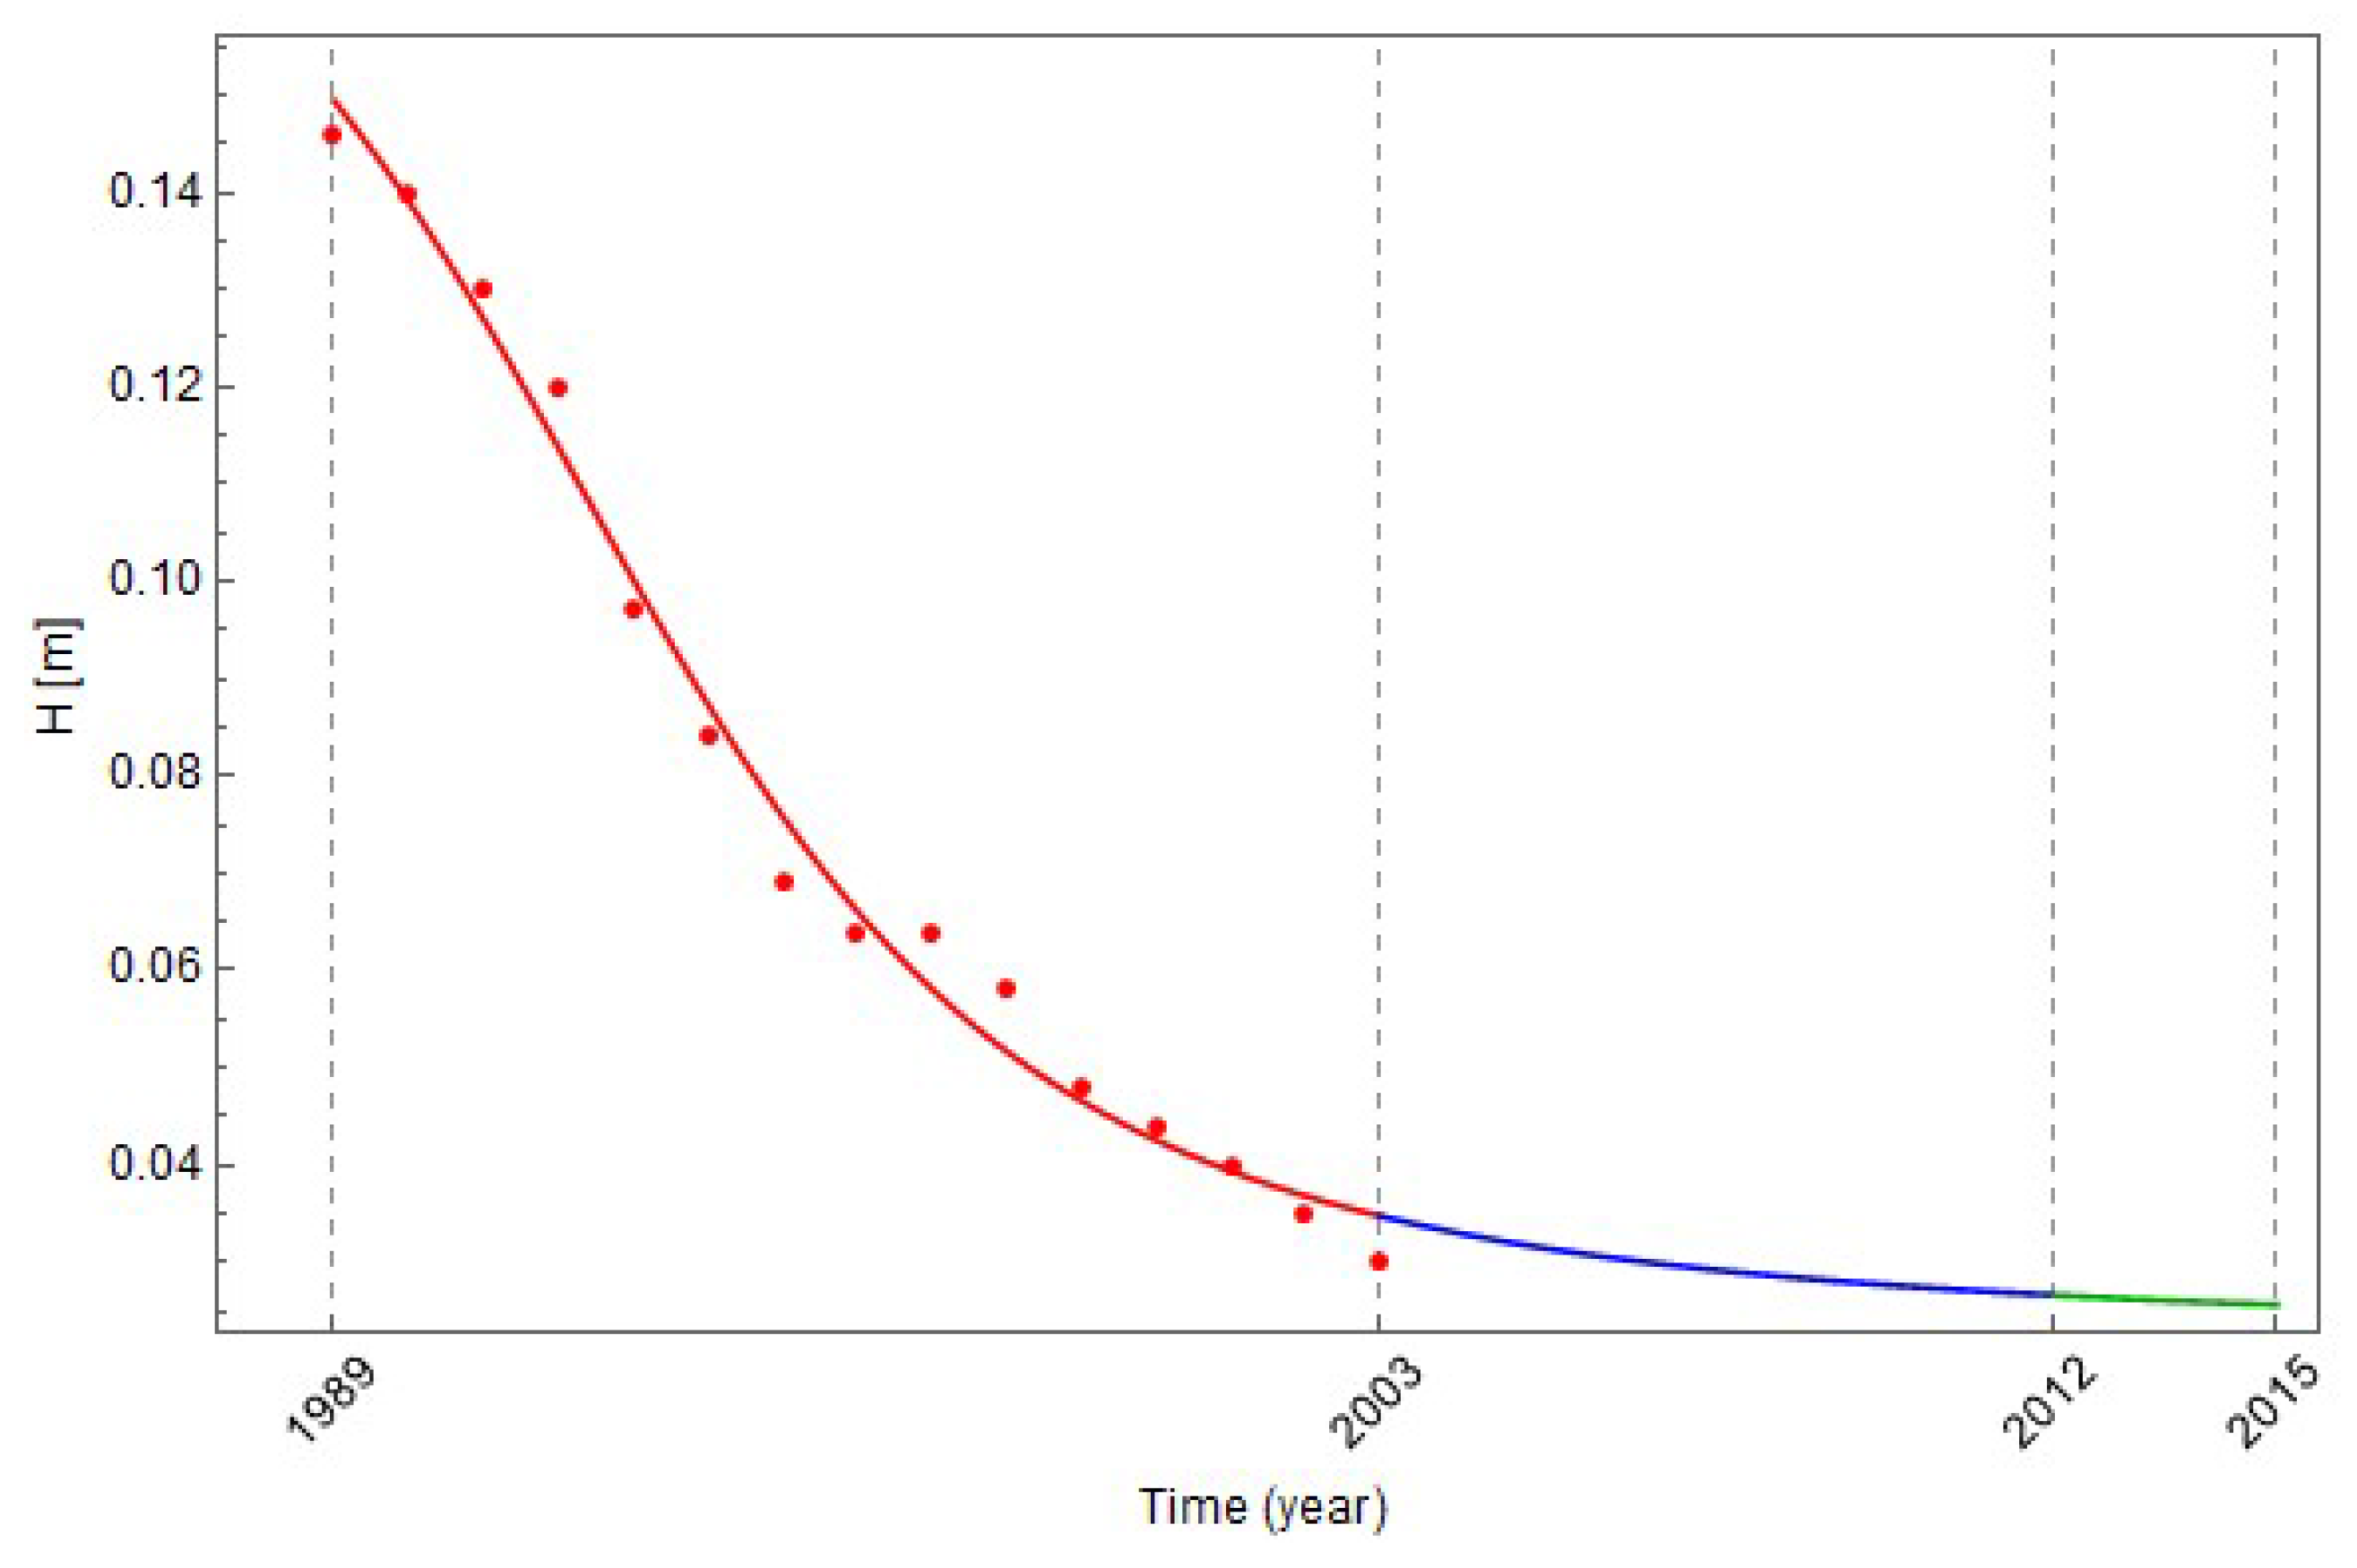
Figure 11.
Graphical presentation of results from analysis of vertical displacement of point 367a/4.
Figure 11.
Graphical presentation of results from analysis of vertical displacement of point 367a/4.

Figure 12.
Graphical presentation of results from analysis of vertical displacement of point Ša7.

Figure 13.
Graphical presentation of results from analysis of vertical displacement of point X1-A1.


Table 1.
Observation point data used in analysis.
| Year | GB/6—H (m) | A5—H (m) | 367a/4—H (m) | Ša7—H (m) | X1-A1—H (m) |
|---|---|---|---|---|---|
| 1989 | 383.383 | 360.735 | 407.087 | 390.891 | - |
| 1990 | 383.371 | 360.729 | 407.090 | 390.788 | - |
| 1991 | 383.354 | 360.719 | 407.078 | 390.616 | - |
| 1992 | 383.340 | 360.709 | 407.051 | 390.473 | - |
| 1993 | 383.318 | 360.686 | 407.039 | 390.382 | - |
| 1994 | 383.306 | 360.673 | 407.033 | 390.300 | - |
| 1995 | 383.292 | 360.658 | 407.023 | 390.297 | - |
| 1996 | 383.276 | 360.653 | 407.023 | 390.277 | - |
| 1997 | 383.256 | 360.653 | 407.020 | 390.221 | - |
| 1998 | 383.235 | 360.647 | 406.975 | 390.090 | - |
| 1999 | 383.221 | 360.637 | 406.946 | 390.026 | - |
| 2000 | 383.206 | 360.633 | 406.927 | 389.957 | 368.245 |
| 2001 | 383.207 | 360.629 | 406.934 | 389.733 | 368.241 |
| 2002 | 383.155 | 360.624 | 406.922 | 389.647 | 368.241 |
| 2003 | 383.126 | 360.619 | 406.906 | 389.603 | 368.221 |
| 2004 | 383.025 | - | 406.890 | - | 368.198 |
| 2005 | 382.911 | - | 406.887 | 389.508 | 368.160 |
| 2006 | 382.750 | - | 406.883 | 389.496 | 368.136 |
| 2007 | 381.800 | - | 406.880 | 389.457 | 368.127 |
| 2008 | 381.423 | - | 406.876 | 389.450 | 368.110 |
| 2009 | 380.640 | - | 406.869 | 389.427 | 368.072 |
| 2010 | 380.638 | - | 406.865 | 389.412 | 368.039 |
| 2011 | 380.100 | - | 406.863 | 389.406 | 368.026 |
| 2012 | 380.100 | - | 406.864 | 389.397 | 368.003 |
| 2013 | - | - | 406.850 | 389.379 | 367.999 |
| 2014 | - | - | 406.842 | 389.365 | 367.998 |
| 2015 | - | - | 406.840 | 389.357 | 367.997 |
Table 2.
Results of the analysis of the vertical displacement of point GB/6.
| Parameter | Value | σ | – τσ (τ = 3) | + τσ (τ = 3) |
|---|---|---|---|---|
| R | −0.1860 | 0.1028 | −0.4943 | 0.1224 |
| L | 3.2327 | 0.0300 | 3.1426 | 3.3228 |
| P | 2.4084 | 0.2370 | 1.6974 | 3.1194 |
| p | 19.5678 | 0.1340 | 19.1659 | 19.9696 |
Table 3.
Results from the analysis of the vertical displacement of point A5.
| Parameter | Value | σ | – τσ (τ = 3) | + τσ (τ = 3) |
|---|---|---|---|---|
| R | 0.0224 | 0.0076 | −0.0005 | 0.0452 |
| L | 0.1962 | 0.0264 | 0.1171 | 0.2753 |
| P | 6.4075 | 1.4452 | 2.0718 | 10.7431 |
| p | 4.3343 | 0.8975 | 1.6419 | 7.0267 |
Table 4.
Results from the analysis of the vertical displacement of point 367a/4.
| Parameter | Value | σ | – τσ (τ = 3) | + τσ (τ = 3) |
|---|---|---|---|---|
| R | −0.1224 | 0.1202 | −0.4829 | 0.2382 |
| L | 0.9316 | 1.4880 | −3.5324 | 5.3955 |
| P | 26.9418 | 14.0258 | −15.1355 | 69.0192 |
| p | −6.3402 | 30.3409 | −97.3630 | 84.6825 |
Table 5.
Results from the analysis of the vertical displacement of point Ša7.
| Parameter | Value | σ | − τσ (τ = 3) | + τσ (τ = 3) |
|---|---|---|---|---|
| R | −0.1917 | 0.0890 | −0.4587 | 0.0753 |
| L | 2.0493 | 0.3194 | 1.0911 | 3.0075 |
| P | 11.8904 | 2.4533 | 4.5306 | 19.2503 |
| p | 7.1505 | 1.5450 | 2.5154 | 11.7856 |
Table 6.
Results from the analysis of the vertical displacement of point X1-A1.
| Parameter | Value | σ | − τσ (τ = 3) | + τσ (τ = 3) |
|---|---|---|---|---|
| R | −0.0416 | 0.0165 | −0.0911 | 0.0079 |
| L | 0.2963 | 0.0201 | 0.2361 | 0.3566 |
| P | 6.0070 | 1.0572 | 2.8354 | 9.1786 |
| p | 7.8546 | 0.3494 | 6.8063 | 8.9030 |
© 2018 by the authors. Licensee MDPI, Basel, Switzerland. This article is an open access article distributed under the terms and conditions of the Creative Commons Attribution (CC BY) license (http://creativecommons.org/licenses/by/4.0/).
Share and Cite
MDPI and ACS Style
Rošer, J.; Potočnik, D.; Vulić, M. Analysis of Dynamic Surface Subsidence at the Underground Coal Mining Site in Velenje, Slovenia through Modified Sigmoidal Function. Minerals 2018, 8, 74. https://doi.org/10.3390/min8020074
AMA Style
Rošer J, Potočnik D, Vulić M. Analysis of Dynamic Surface Subsidence at the Underground Coal Mining Site in Velenje, Slovenia through Modified Sigmoidal Function. Minerals. 2018; 8(2):74. https://doi.org/10.3390/min8020074
Chicago/Turabian StyleRošer, Janez, Drago Potočnik, and Milivoj Vulić. 2018. "Analysis of Dynamic Surface Subsidence at the Underground Coal Mining Site in Velenje, Slovenia through Modified Sigmoidal Function" Minerals 8, no. 2: 74. https://doi.org/10.3390/min8020074
Note that from the first issue of 2016, this journal uses article numbers instead of page numbers. See further details here.