Froth Image Acquisition and Enhancement on Optical Correction and Retinex Compensation
by
Weixing Wang
1,2, 
Wei Liu
1,
Fangnian Lang
3,*,
Guangnan Zhang
1,
Ting Gao
1,
Ting Cao
1,
Fengping Wang
1 and
Sheng Liu
4 1
College of Information Engineering, Chang’an University, Xi’an 710064, China
2
Royal Institute of Technology, 11428 Stockholm, Sweden
3
College of Computer Science, Chengdu University, Chengdu 610106, China
4
Faculty of Information Technology and Equipment Engineering, Xi’an University of Tech, Xi’an 710082, China, [email protected]
*
Author to whom correspondence should be addressed.
Minerals 2018, 8(3), 103; https://doi.org/10.3390/min8030103
Submission received: 17 December 2017
/
Revised: 22 February 2018
/
Accepted: 2 March 2018
/
Published: 6 March 2018
Abstract
:To well monitor and optimize the flotation production, a computer vision and image analysis system is used. In such a system, the first important step is to acquire the froth surface images in high quality. Froth imaging quality is hard to control, and the industrial field noise, froth 3D properties, complex textures, and mixed colors can also cause the flotation image to be difficult to segment and process. To acquire high quality images, a new system for image acquisition of the lead flotation is studied. The system constructs the free-form surface lens based on the non-imaging optics theory, which can improve the optical efficiency of the lens and the uniformity of light sources, and can reduce flare effects. For the compensation, an improved MSR (Multi-Scale Retinex) adaptive image algorithm is proposed to increase the brightness and intensity contrast for small bubbles, and to enhance texture details and froth weak edges by analyzing the Retinex output characteristics of the shaded area and improving the gain function. Under the condition of the optimal parameters, the image acquisition system can obtain uniform illumination and reduce different noises. Experiments show that the new froth image acquisition system increases Signal/Noise by 14%, contrast by 21%, and image segmentation accuracy by 26% in an image.
1. Introduction
In mineral processing can be used in many application areas [1]. The froth flotation is a traditional and important method. The froth flotation is used to selectively separate minerals (such as copperand lead minerals) from gangue, and this method can also be used in paper recycling and waste-water treatment industries. For mineral processing, the ground ore is generally mixed with water to form the slurry, and the desired minerals are rendered hydrophobic by the addition of the surfactant/collector chemical. The slurry of hydrophobic particles and hydrophilic particles are introduced to tanks called as flotation cells which are aerated to generate bubbles. The hydrophobic particles attach to the air bubbles, which rise to the surface, forming froths. The froths are removed from the cell, producing the concentrate of the target minerals. The froth flotation efficiency can be determined by different factors, such as particle and bubble contact, particle and bubble attachment, transportation between the pulp and froths, and froth collecting into the product launder. To keep the flotation correct, normally, an operator adjusts flotation parameters from time to time, according to froth surface variation, which is operator-dependent.
In recent years, to avoid errors of human monitoring in flotation production, computer vision has been applied into the flotation production, and froth image processing has received growing attention. By using computer vision and image analysis, the froth color, motion, density (the number of bubbles per unit area), size, texture, and stability characteristics can be measured and analyzed, and the relationships among the analysis parameters and the flotation production index can be built, which can reflect the abnormal situation of the flotation process timely and accurately. For static froth characteristic (such as size, shape, color, texture, and others) research, scholars have achieved certain results. In a computer vision or image analysis system, the first working step is to acquire froth images of high quality.
In a froth image acquisition system, the uneven lightning makes the system acquire images with uneven illumination, different noises, and lack of texture and froth edge details. In this case, when the images are segmented by a normal image segmentation algorithm, it will influence the segmentation accuracy and then cause parameter analysis error, and lead to the unstable production process with the low recovery of valuable minerals.
The good performance of the lightning is the key of the acquisition system to get high-quality images. Hence, many scholars have focused on the froth image acquisition system in recent years. In 1997–2000 [2,3], the European Union invested a large amount of money launched the EU project “bubbles results based on machine vision and color characterization”, and one of the main research goals was to setup an image acquisition system, where the researchers contacted different industrial companies to get a high-quality and low-cost froth image acquisition system, and the froth is mainly for copper minerals. The scholars in Chile and in South Africa also applied machine vision systems to monitor platinum, graphite, and copper flotation [2,3,4,5], and they have the same problems as the above system for acquiring high quality images, because the flotation materials are different despite the image acquisitions being different. Therefore, the image segmentation effects are not satisfactory in some cases. In China, the Jinchuan company together with Beijing Mining Research Institute and China University of Mining did research in monitoring coal flotation and nickel foam, respectively [6,7]. Comparing to the above systems, they did not need color information, but they needed to have good contrast between froth areas and froth edges. The Central South University in China set a flotation foam monitoring system, cooperating with many large nonferrous smelting enterprises [8,9,10,11,12,13]. Some good progress was achieved, e.g., Yang and Xu used a way to remove froth surface highlight to do color measurement [12] and achieved some good results. Zhao and Peng tried to recognize flooding and sinking conditions in antimony flotation process by using soft measurement of froth surface level and qualitative trend analysis [13]. The froth acquisition system consists of a CCD (Charge Coupled Device), camera, a high-frequency light, and a hood to protect the camera from dust and ambient light.
In recent years, there are still many researchers who made different studies for this kind of research topic [8,9,10,11,12,13,14,15,16,17]. Their systems were different based on different flotation material types and environments, and some of them obtained the good quality images under the corresponding conditions and materials; even so, in the images, there are mostly similar problems of uneven lightings shadows, texture loss, etc.
According to the above description and analyses, this article puts forward a kind of physical optics to correct uneven illumination of the lead bubble images based on the theory of non-imaging optics [18], and then studies a new compensation algorithm for enhancing shadow areas in images. This method firstly uses mesh and the theory of non-imaging optics to build free-curved-lens LED (Light Emitting Diode) as a light source. Then, it is optimized with an innovated adaptive Multi-Scale Retinex (MSR) compensation algorithm [19]. To verify the image acquisition system, the valley edge detection algorithm [20,21] is applied to test the image segmentation accuracy. Experiments show that the images are satisfactorily acquired by the new system with the optical correction and the compensation algorithm.
2. Design of Uniform Light Distribution
A conventional flotation illumination system generally adopts the existing light sources on the market (e.g., fluorescent lamps, energy-saving lamps, etc.). It is effective as a device for lightning, but the acquired images have problems of uneven illumination, lack of texture details, and abnormal color, which is on account of the characteristics of the flotation half transmission fluid level and fast dynamic movement [20,21]. In order to construct a feasible illumination system, we bought three kinds of cameras and seven types of lights, and tested six different methods (respectively using one, two, three, four, five, or six lights as the light sources) based on the literature [2,5,12,13], but since our working environments and flotation materials are different to that in the literature, the testing results were not good enough. As shown in Figure 1, there are different distortion degrees by three kinds of ordinary light sources to obtain the froth images. LED has unmatched advantages comparing to a traditional lightning source: it has a long service life, the good color rendering, and the less power consumption. Using LED to replace the traditional light sources is the main trend in the machine vision, so in this article, we chose LED as a lighting source. In order to make the flotation image illumination more even, we needed to redistribute the lighting on the flotation surface through physical optics. As far as possible under the condition of the low-energy cost, the lighting was spread evenly on the flotation surface.
For the redistribution of LED lightings, first of all, the mesh method was adopted for the design of the froth image acquisition system. The divided mesh method [22] defines the map from a light source to the light distribution according to the theorem of conservation of energy, using the mapping defined for the optical system design. This method is feasible for the secondary optical design, which can solve the problem of complex illumination distribution. In Figure 1, three kinds of images are acquired by three different light illuminations, and the image qualities are different: (a) from top to bottom in the image, the lighting increases from weak to strong, and in the top parts of the image, froth are difficult to recognize; (b) the lighting is stronger in the left and right parts than that in the centre part, and in the centre part the froths are dark and cannot be recognized; and (c) in the whole image, the lighting is too strong, and the froths cannot be distinguished from each other.
The flotation surface is a plane surface, but not a smooth plane structure as shown in Figure 1, and therefore cannot be made a simple surface and formulated by unified equations. In application, the flotation surface can be controlled at any angle with a strong light for even distribution; in order to achieve the uniform lighting, we must improve the utilization rate of light energy.
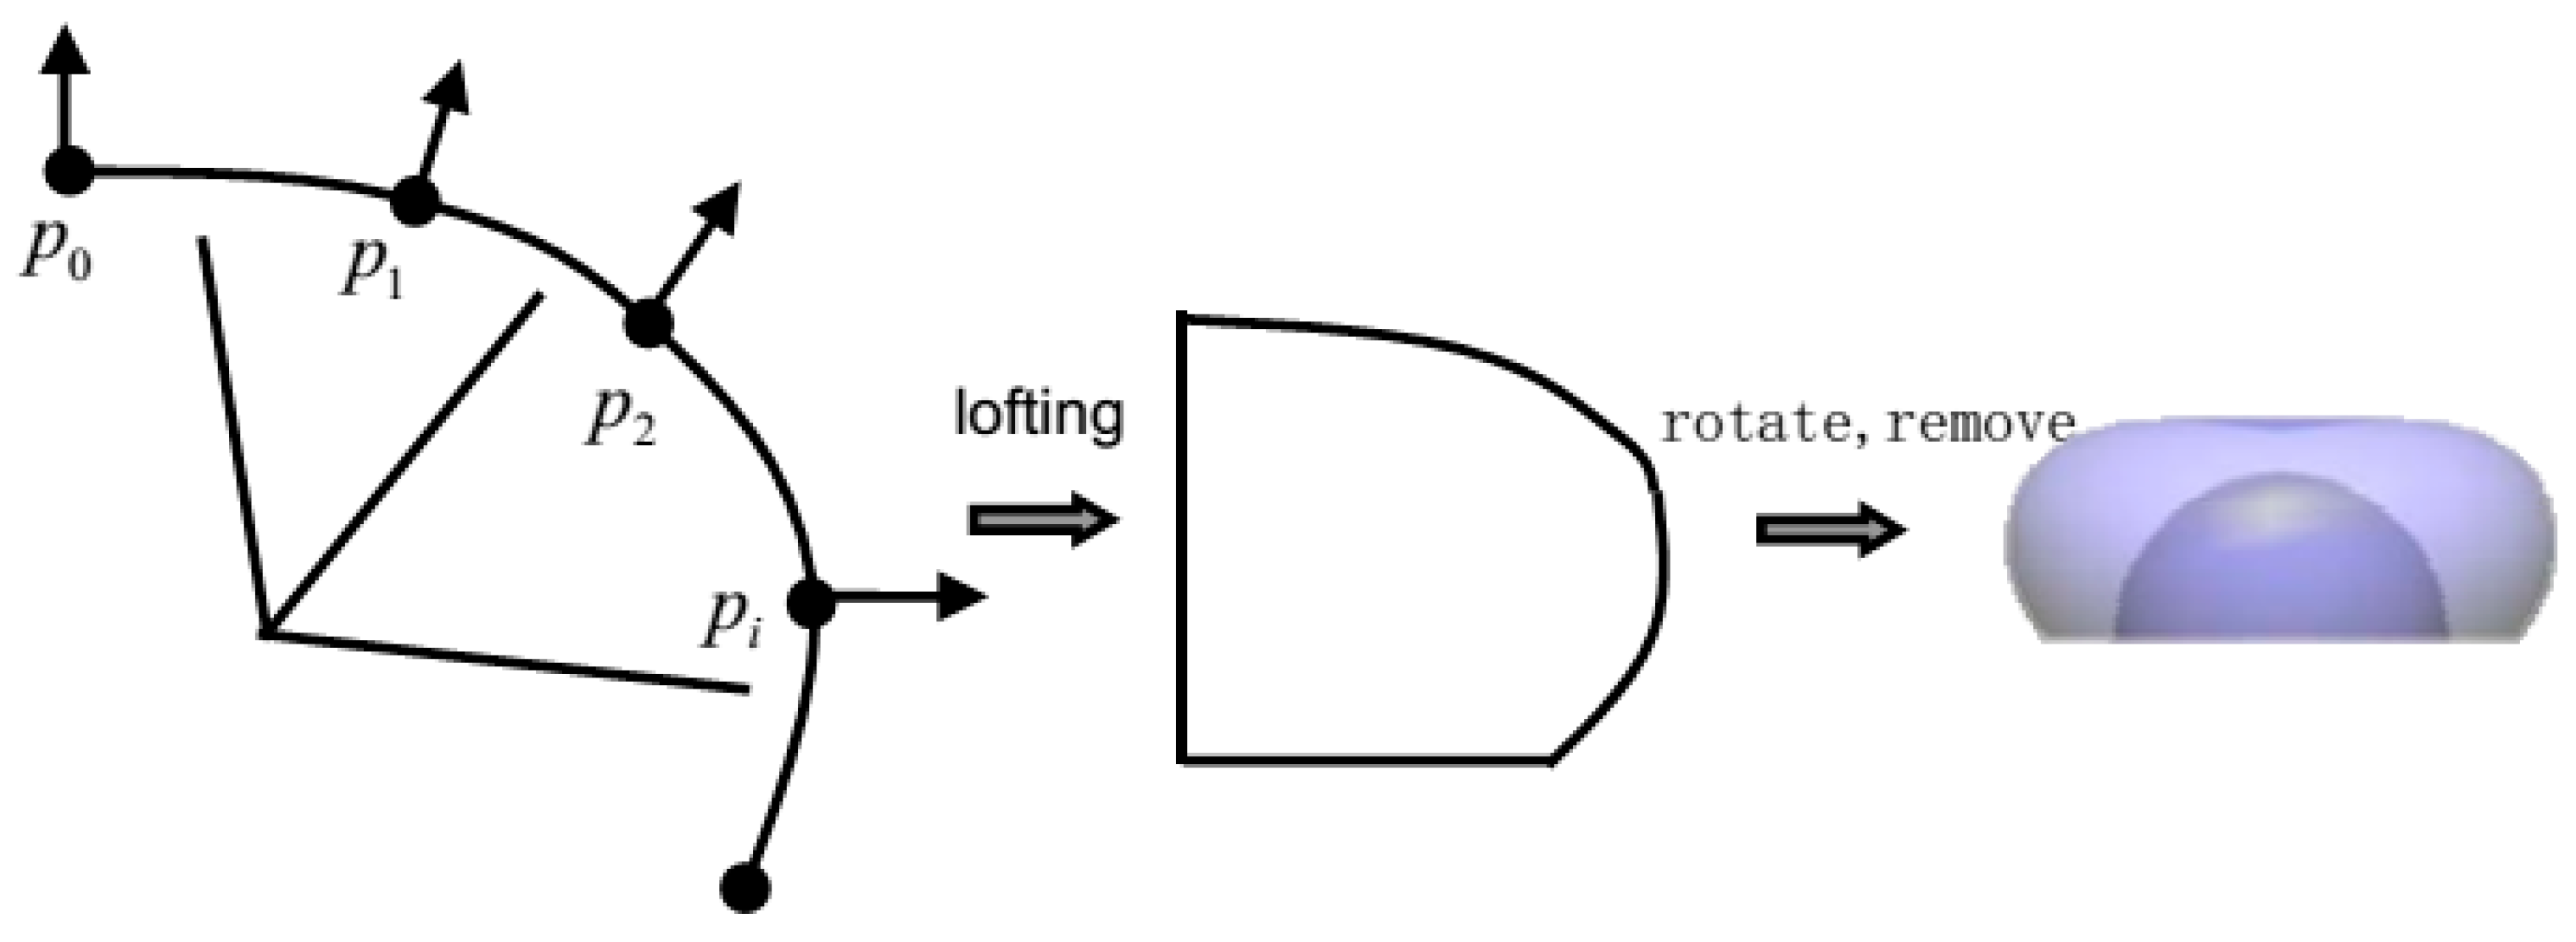
The basic thought to build up a free surface (corresponding to the froth liquid surface with densely packed, different-sized bubbles) is to solve all the points on a surface by getting the tangent vector of the point in the surface [20]. It is through the relationship between the lens of the incident and the emergent light vector, and the relationship between choosing the intersection of lens with LED and receiving surface geometric center axis, for the initial point of free-form surface that finally solves the whole free-form surface combining with the boundary conditions. The details are separated into three parts as follows.
- (1)
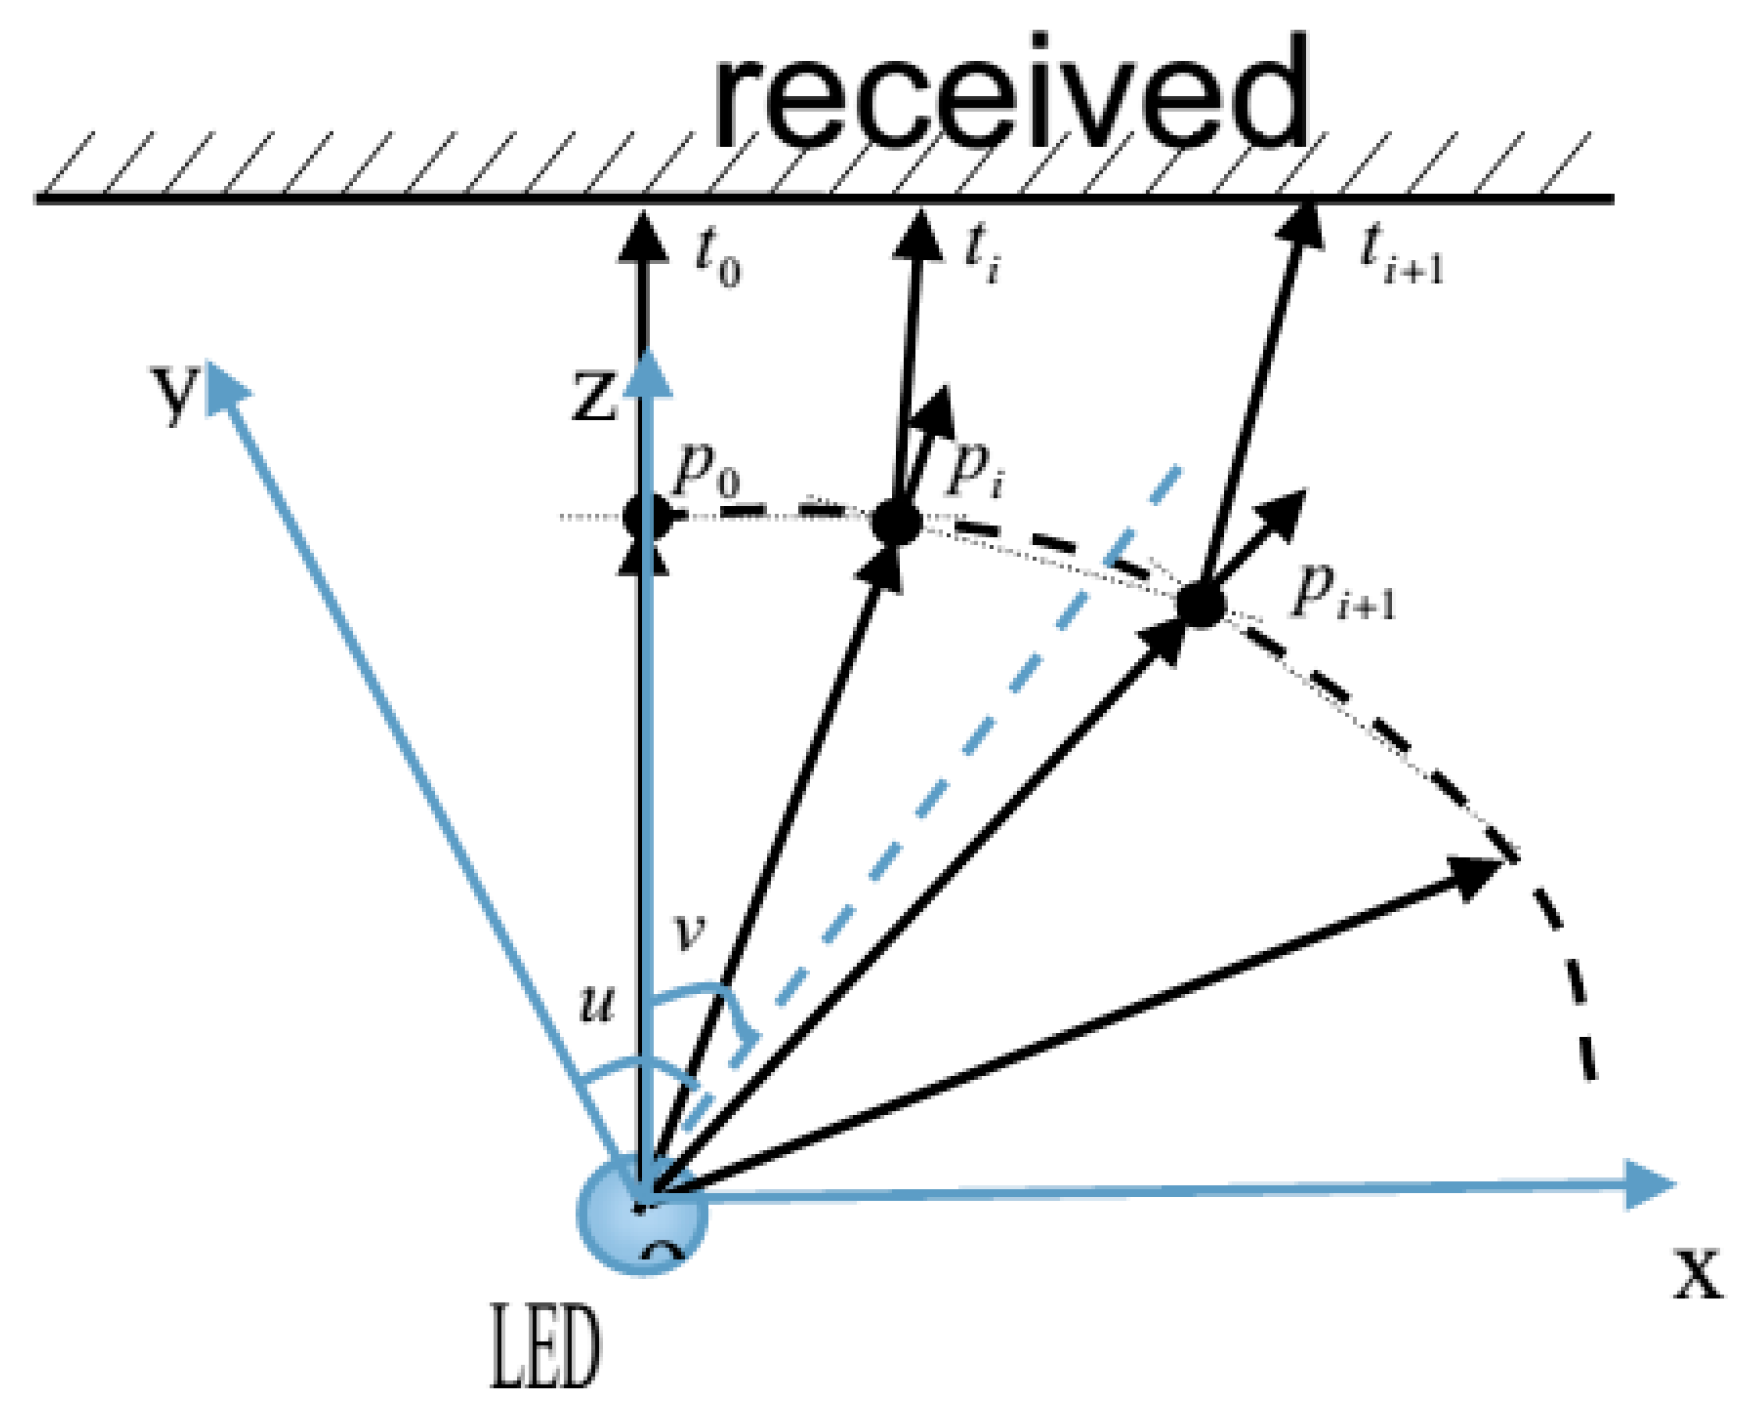
- First of all, we need to establish a simple optical system consisting of LED, free surface, and receiving surface, as shown in Figure 2 and Figure 3, where p0 is the vertex of the surface, located in the geometry center shaft between LED and the receiving surface. The incident ray via p0 on the surface refracts to t0 (the receiving surface).
- (2)
- The refraction of the incident ray vector of pi, the emergent light vector , and the normal vector at that meeting point can be expressed as:where, n is the refractive index of a lens, the unit of incident light vector is, when the distance of pt is greater than the po; can be expressed using the approximate point coordinates of t as, where, zt is the distance between the illuminated area and light.The unit normal vector of point p is,Put the above three vector expressions into refraction formulae:
- (3)
- We determine the corresponding relationship between the incident light and the emergent light without considering energy loss on the basis of the energy conservation, with the mapping relationship :where, I(u,v) is the function of light intensity, and E(xt,yt) is the light intensity of plane illuminated. The point coordinates t can be obtained by (xt,yt) = (f(u,v),g(u,v)), put into the expression of the normal vector of N by combining with boundary conditions to solve the flotation surface.
Figure 4 shows the contrast of flare (or light reflection) effect between LED light for the use of traditional lens (Figure 4a) and the use of the flotation surface lens designed in this paper (Figure 4b), where, one LED lamp (60 W) is used at a 45° angle inside a hood, and lighting area is an elliptical area. In Figure 4a, the light energy is lower, which causes uneven illumination; for an elliptical area, the lights gradually decrease from the centre area to the edges. It can be seen clearly from Figure 4b that the flotation surface lens designed redistributes the lighting, which makes the light received more even, reduces the light energy loss, and greatly improves the utilization rate of light energy and the availability of the image. In Figure 4b, the illumination is even in the elliptical area, the lighting is evenly distributed from the centre area to the edges. At the same time, about 98% of the light energy is uniformly distributed in the planning area by using professional optical software, Trace Pro, through 2 million rays to tract and simulate. The minimum value Emin of luminance in the area is equal to 10.17lx, and the maximal value Emax of luminance in the area is equal to 11.03lx.
3. Image Quality Compensation Algorithm Based on Adaptive MSR
The purpose for redistributing LED lighting is to make a CCD camera directly obtain a relatively uniform froth image. However, there are certain bubble shadows [23,24,25,26,27,28] in a 2D image because of foam solids, which are very difficult to improve through the distribution of the light source. The Retinex theory holds that the formation of an image is the result of the ambient lighting and reflection of the objects. The image enhancement algorithm has features [23,24,25,26] such as improving the contrast between the global area and the local areas, edge enhancement, and color invariant. Among them, the single-scale Retinex (SSR) algorithm is a good method in some cases, but in general, the algorithm of multi-scale Retinex (MSR) has is faster and obtains better treatment effect, and it is widely used in industry applications.
When there are lighting spaces or spectral changes, the quality of a froth image will have a great decreases. The visibility of image color and shadow details will be very poor, while in the case of lighting, regardless of change in the spectrum of blue or red, the whole scene visibility will be affected. Since the defect of the lighting is quite common, therefore, for a scene with a white surface (like cloud or snow), the color and details of non-white areas of an image have the poor visibility. Hence, we need an algorithm to improve the quality of these images. The Retinex algorithm is useful to strengthen this kind of images.
The Retinex algorithm was proposed in 1971 by Edwin, and he developed “The Retinex Theory” to explain it. Many researchers had demonstrated large dynamic range compression, sharpness and color increase, and accurate replication, which are produced by MSR and color reduction, especially for the froth images under complex conditions. In general, the Retinex algorithm is superior to any other method. In order to make the Retinex algorithm better for froth image enhancement, we make the following formulation to describe how to extend SSR to MSR [27,28].
The simple description of SSR algorithm is as follows:
where, x, y are the image coordinates; is the nth spectral band image at point (x,y); is the Retinex result of the nth spectral band at point (x,y); G(x,y) is a Gaussian function; is the constant of Gauss around space; P is a scale; and * is the convolution symbol.
Due to the balance of the dynamic range compression and color reproduction, it is essential to choose a good scale in SSR formula. If you do not want to sacrifice dynamic range compression or color reproduction, the MSR algorithm is a good solution, and it is a weighted combination of different scales’ SSR.
The classic mathematical form of the MSR algorithm [28] is the result of the weighted average of the multiple SSR process,
where, is the output MSR in the first i segment of the color spectrum, N is the number of dimensions, is the weight of corresponding scale, and is the output of the first n scale of the first segment of the color spectrum [27,28].
Using the constant gain can lead to the over-enhancement of a smooth area and the edges of the high-contrast image by the classic MSR algorithm, appearing on the lighting circle ring on the edge of the image, without the obvious improvement in details in a bubble shaded area. Therefore, this article analyzes the characteristics of the shadow region Retinex output, and improves the gain function in view of the characteristics of a bubble image directly obtained by a CCD camera, using the small gain to get high-contrast edges and using bigger gain in the shaded area. The mathematical expression form with space change gain adopted in this article is as follows:
where, k1, k2, b are constant factors used for changed curve, is the normalization of , and is the constant surrounded by a normalized Gauss function. It is defined as,
where, , .
The mathematical expression of the improved MSR algorithm after calculating the gain function by Formulae (9)–(11) is:
4. Experimental Results and Analysis
The lighting system for obtaining flotation images was applied in a flotation cell, where a metal hood with dimensions 50 cm × 40 cm × 80 cm was used to protect the camera from dust and ambient light. It also consists of a CCD camera, a LED lamp mounted at a 45° angle in one side of the inside the hood, and two fans to eliminate heat and moisture on the other two opposite sides of the hood. We classify images into three types: images of mixed large-sized and small-sized bubbles, images of medium-sized bubbles, and images of small-sized bubbles. In the tests, three different types of images were randomly collected at different time periods, and the testing results were compared by different algorithms.
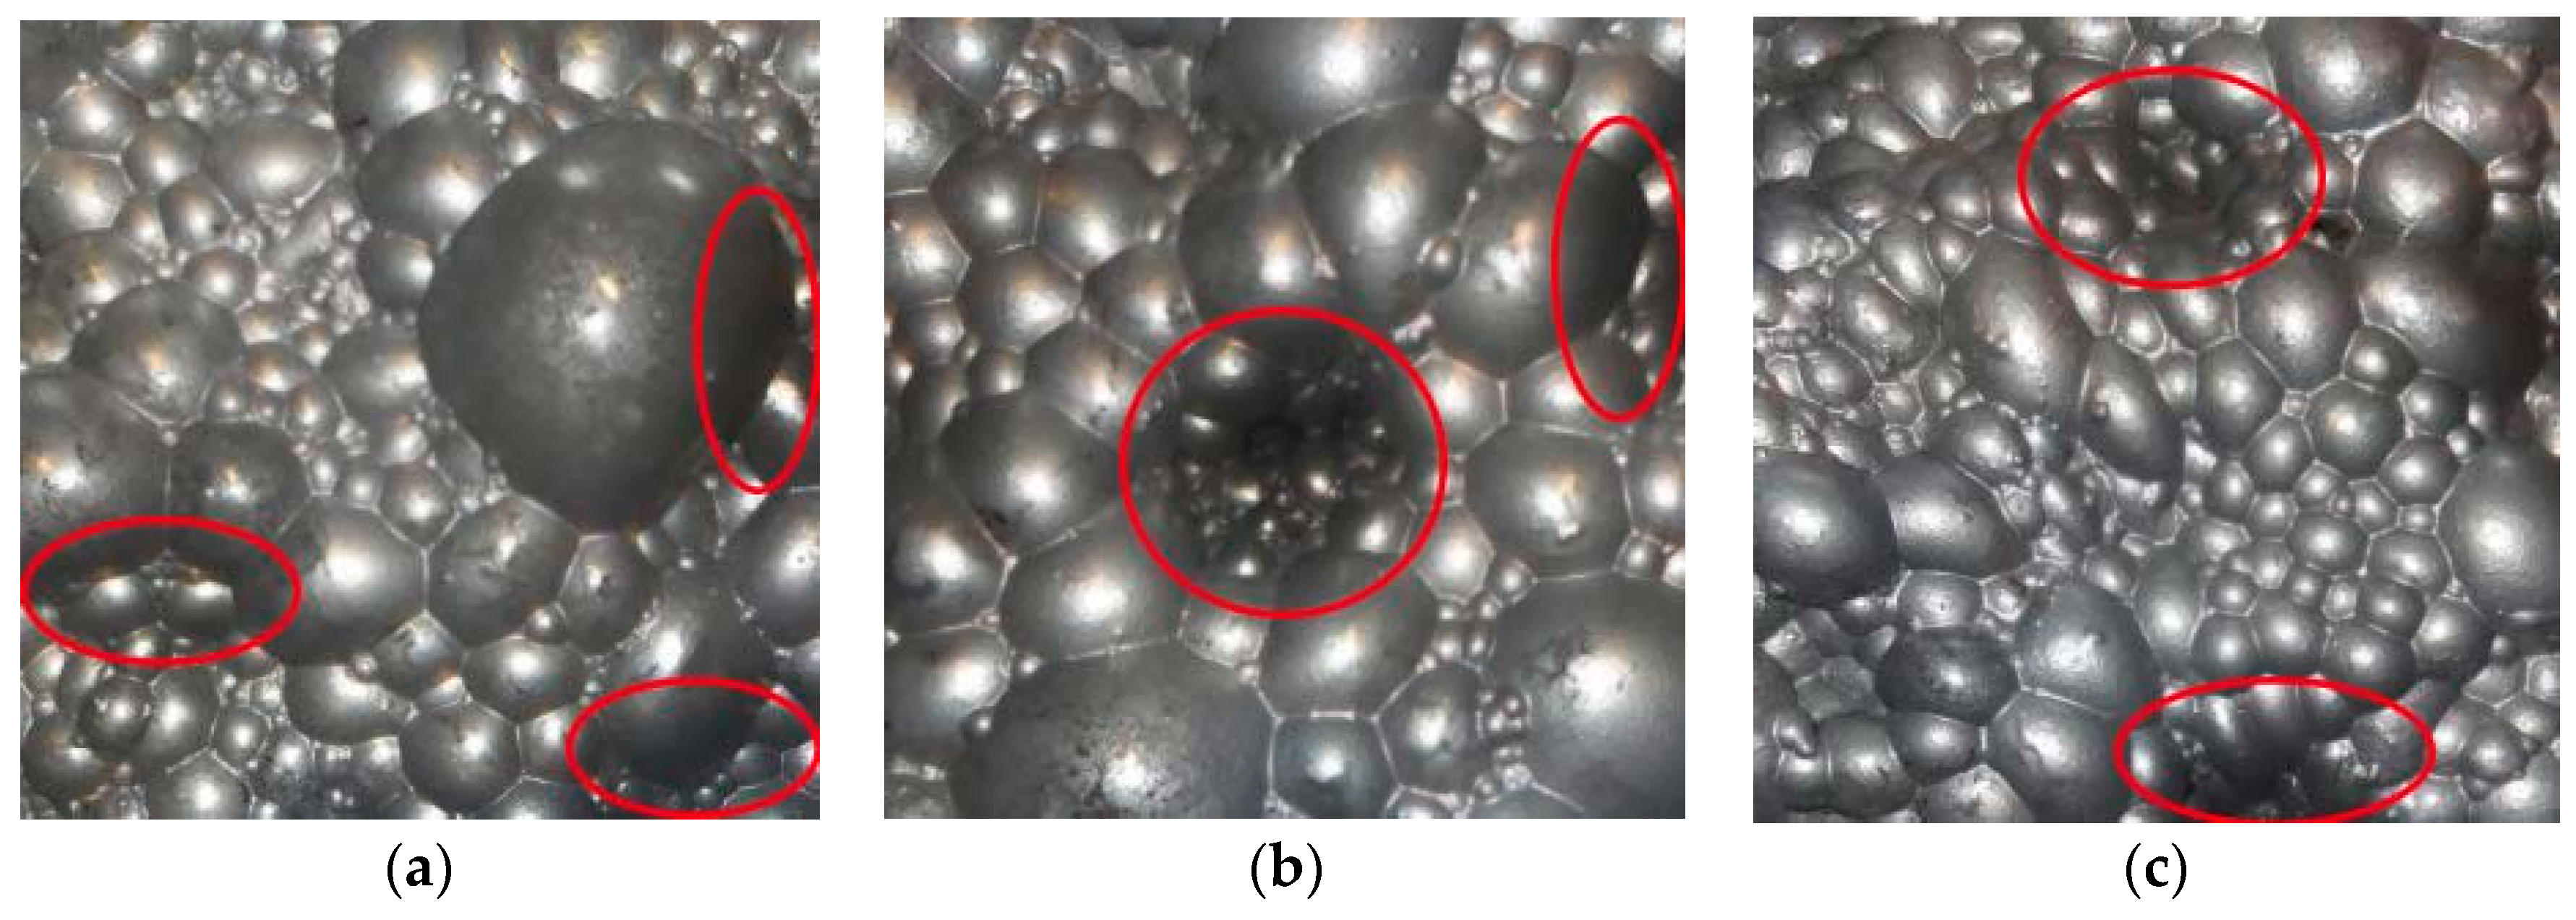
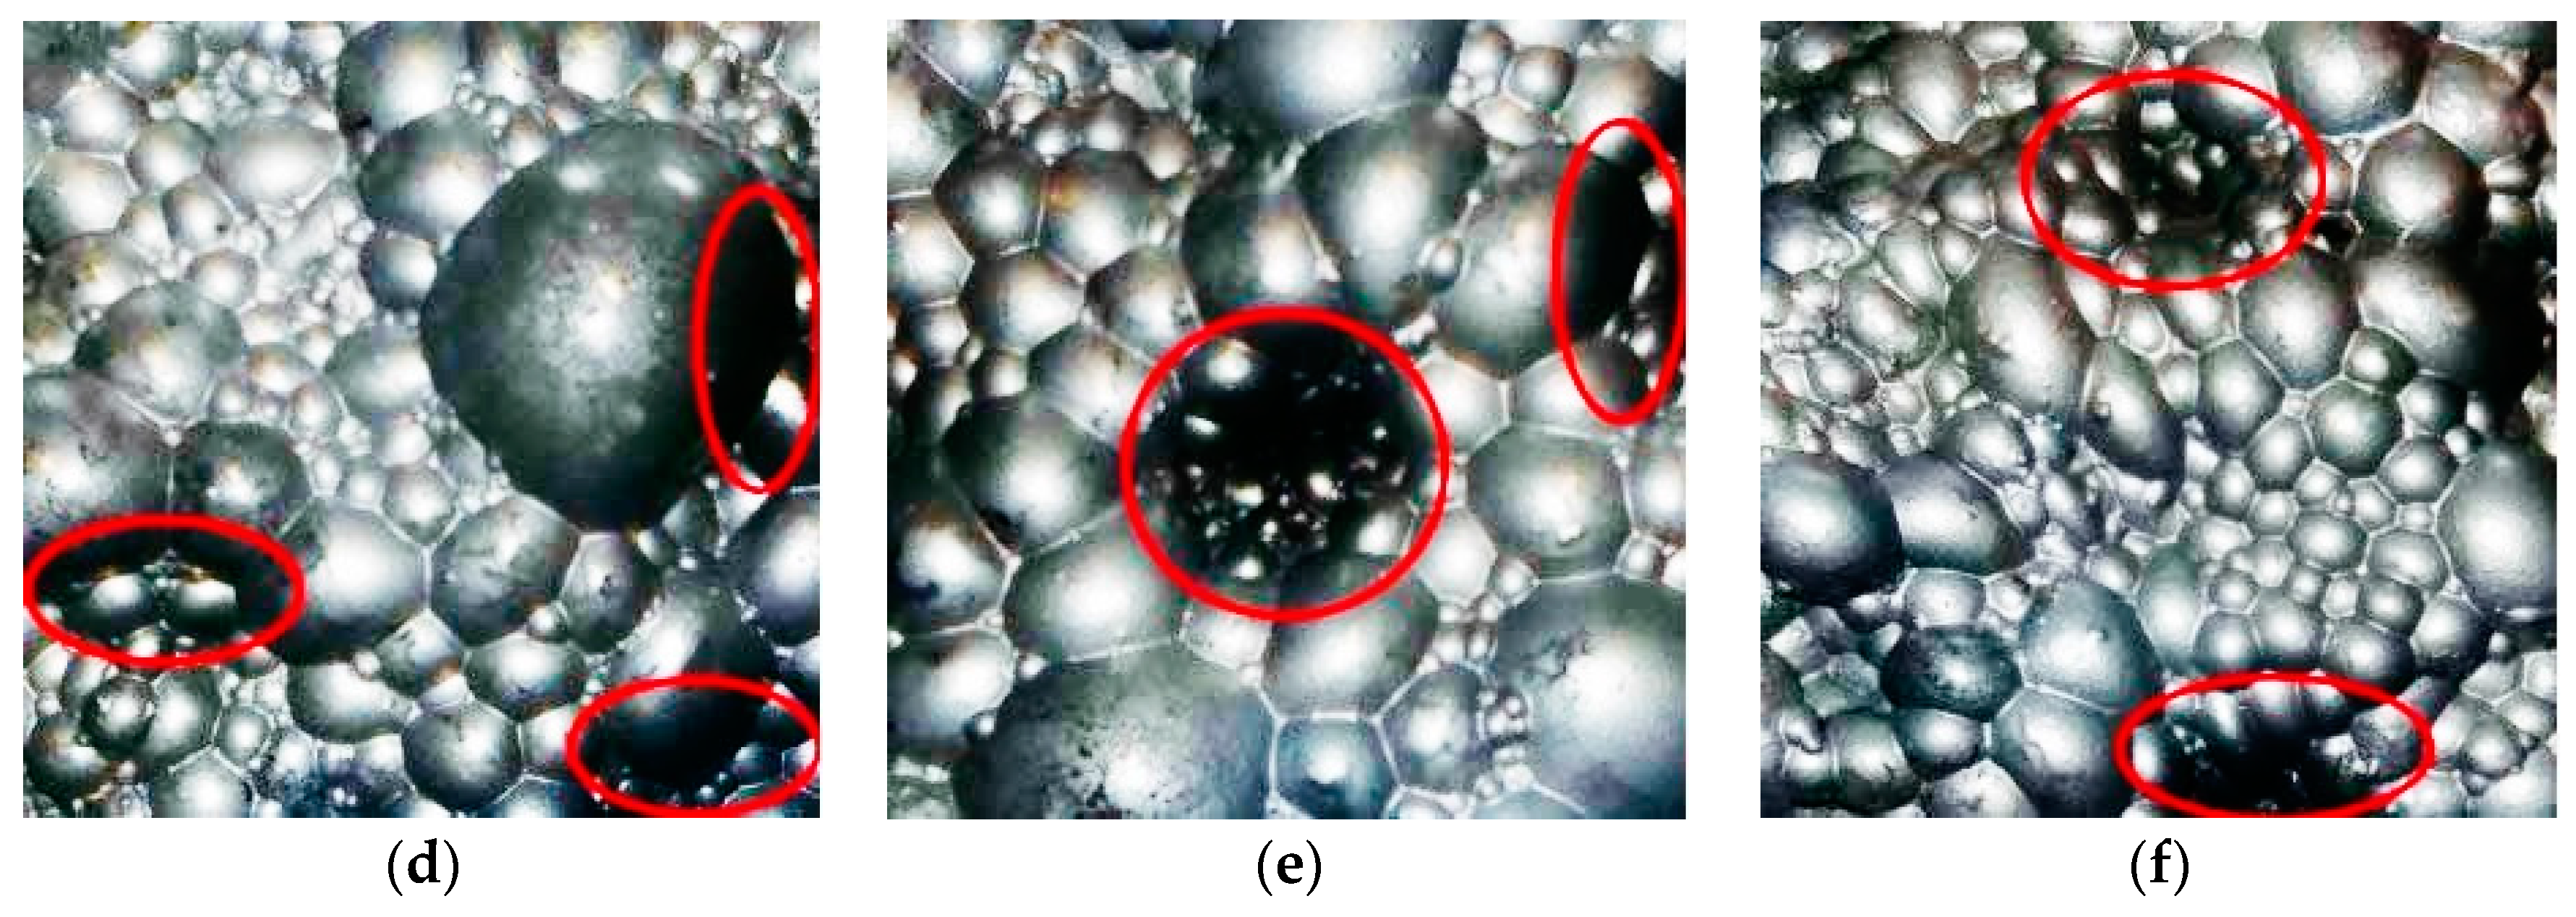
Figure 5 shows the image obtained by free surface lens using LED as a light source, which well improves the overall uniformity of the image. However, there are many shadows in the image of small-sized bubbles (see red-color-encircled parts), and in the image of mixed sized bubbles, the result has missing texture details on the bubble surfaces, decreasing the number of highlights at the top of the window. To solve the above problems, we tested different common image enhancement algorithms, such as Histogram Equalization (HE), but the results were not satisfactory (Figure 5). Instead, we use the improved adaptive MSR algorithm to make compensation for the image.
It can be seen clearly from Figure 6 that the brightness is significantly enhanced in the shaded areas, the overall uniformity is optimized, and the details are also enhanced. The quality of the image is improved, and the accuracy of image segmentation is increased as well. In order to quantitatively evaluate the effect of the image enhancement, we select the contrast and SNR (signal-to-noise ratio) to verify the effect of the enhancement [24]. The measuring function of the contract is defined as:
where, Amax and Amin, respectively, are the maximum and the minimum of grey level values of a 3 × 3 window centered by . Table 1 gives the quantitative indicators of the three different types of bubble images. Thus, it can be seen that the contrast and SNR are increased significantly by the improved adaptive MSR.
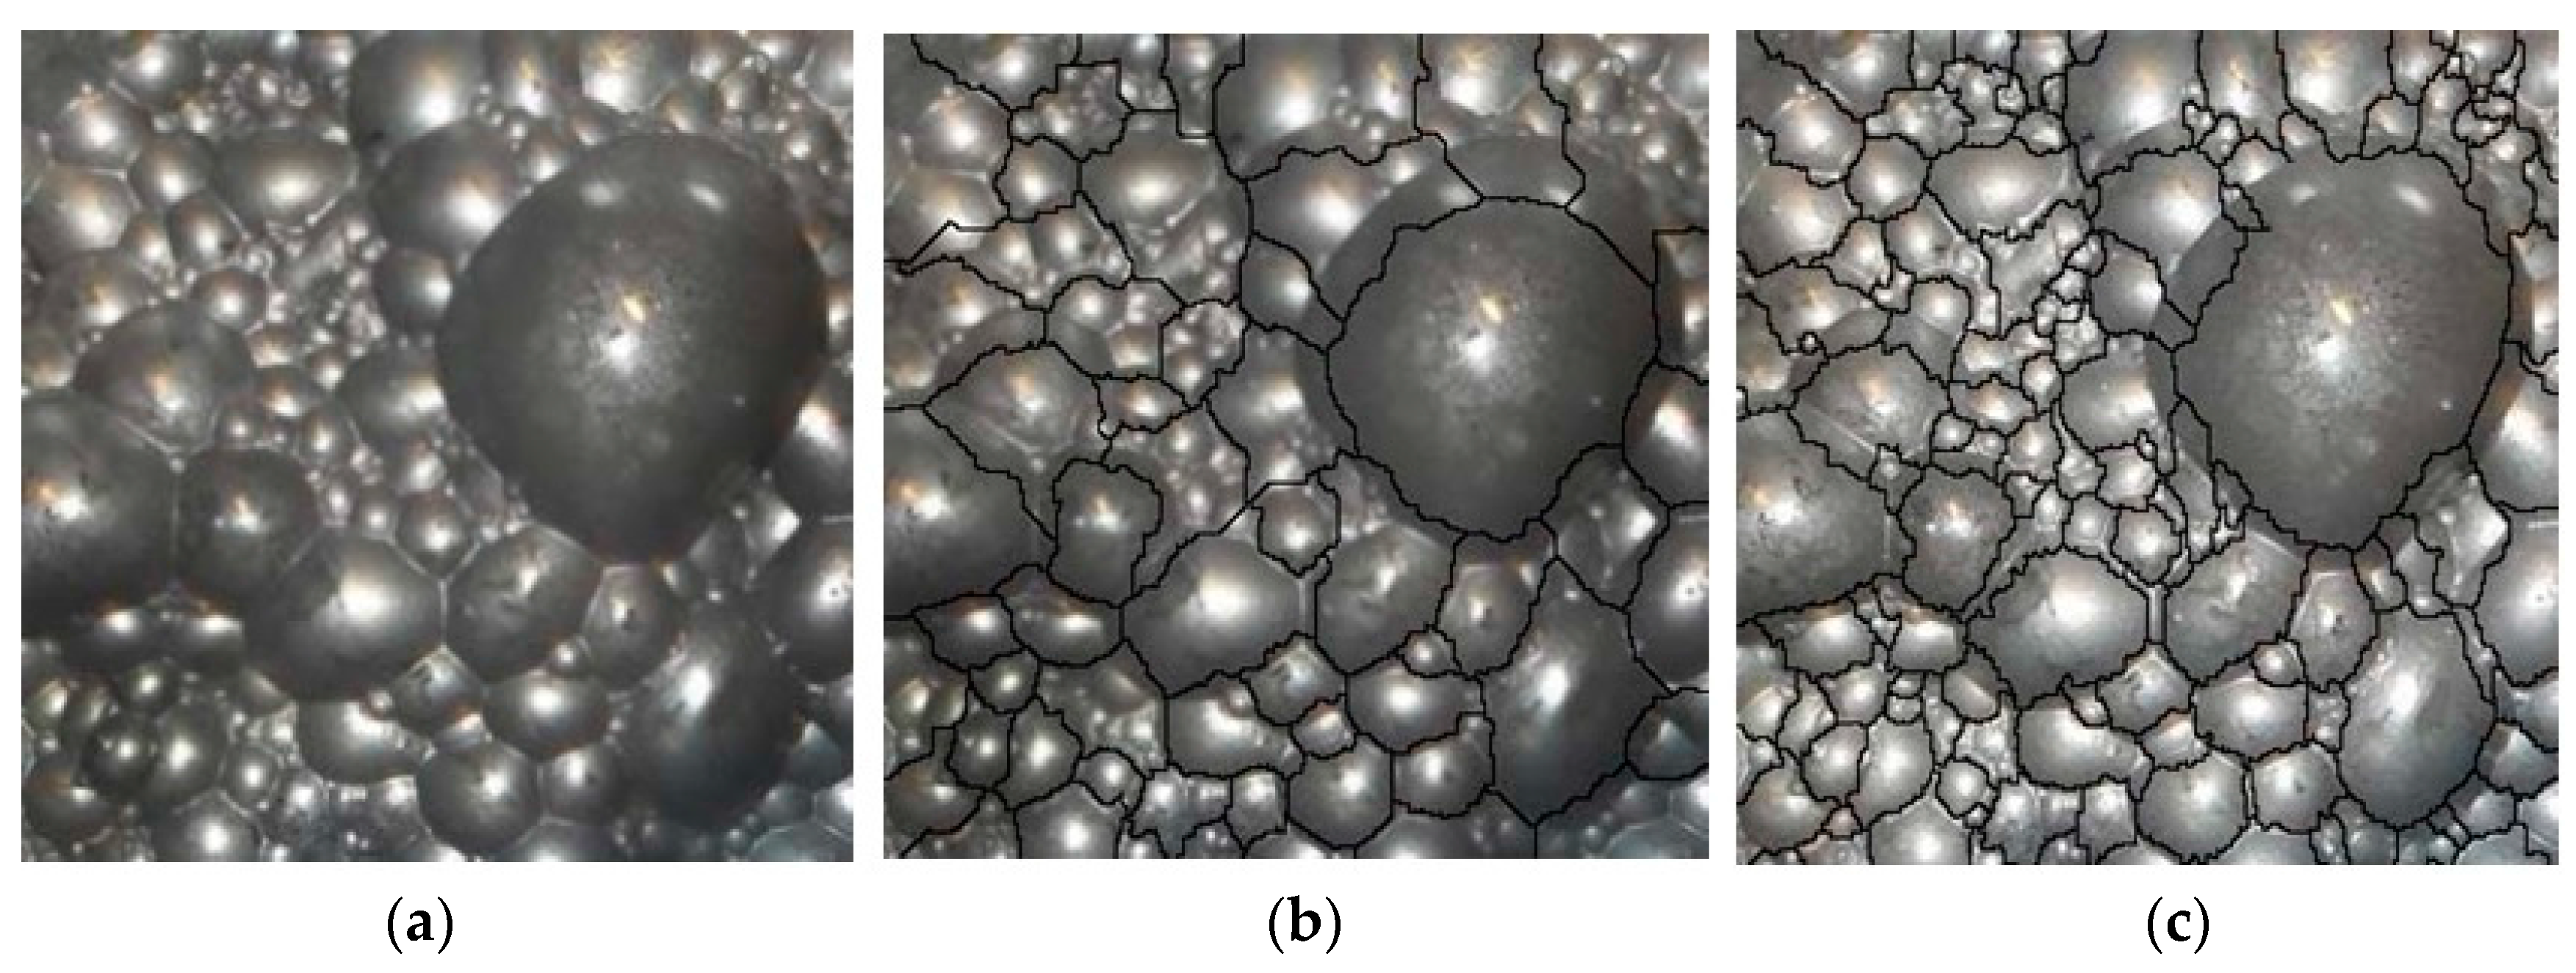
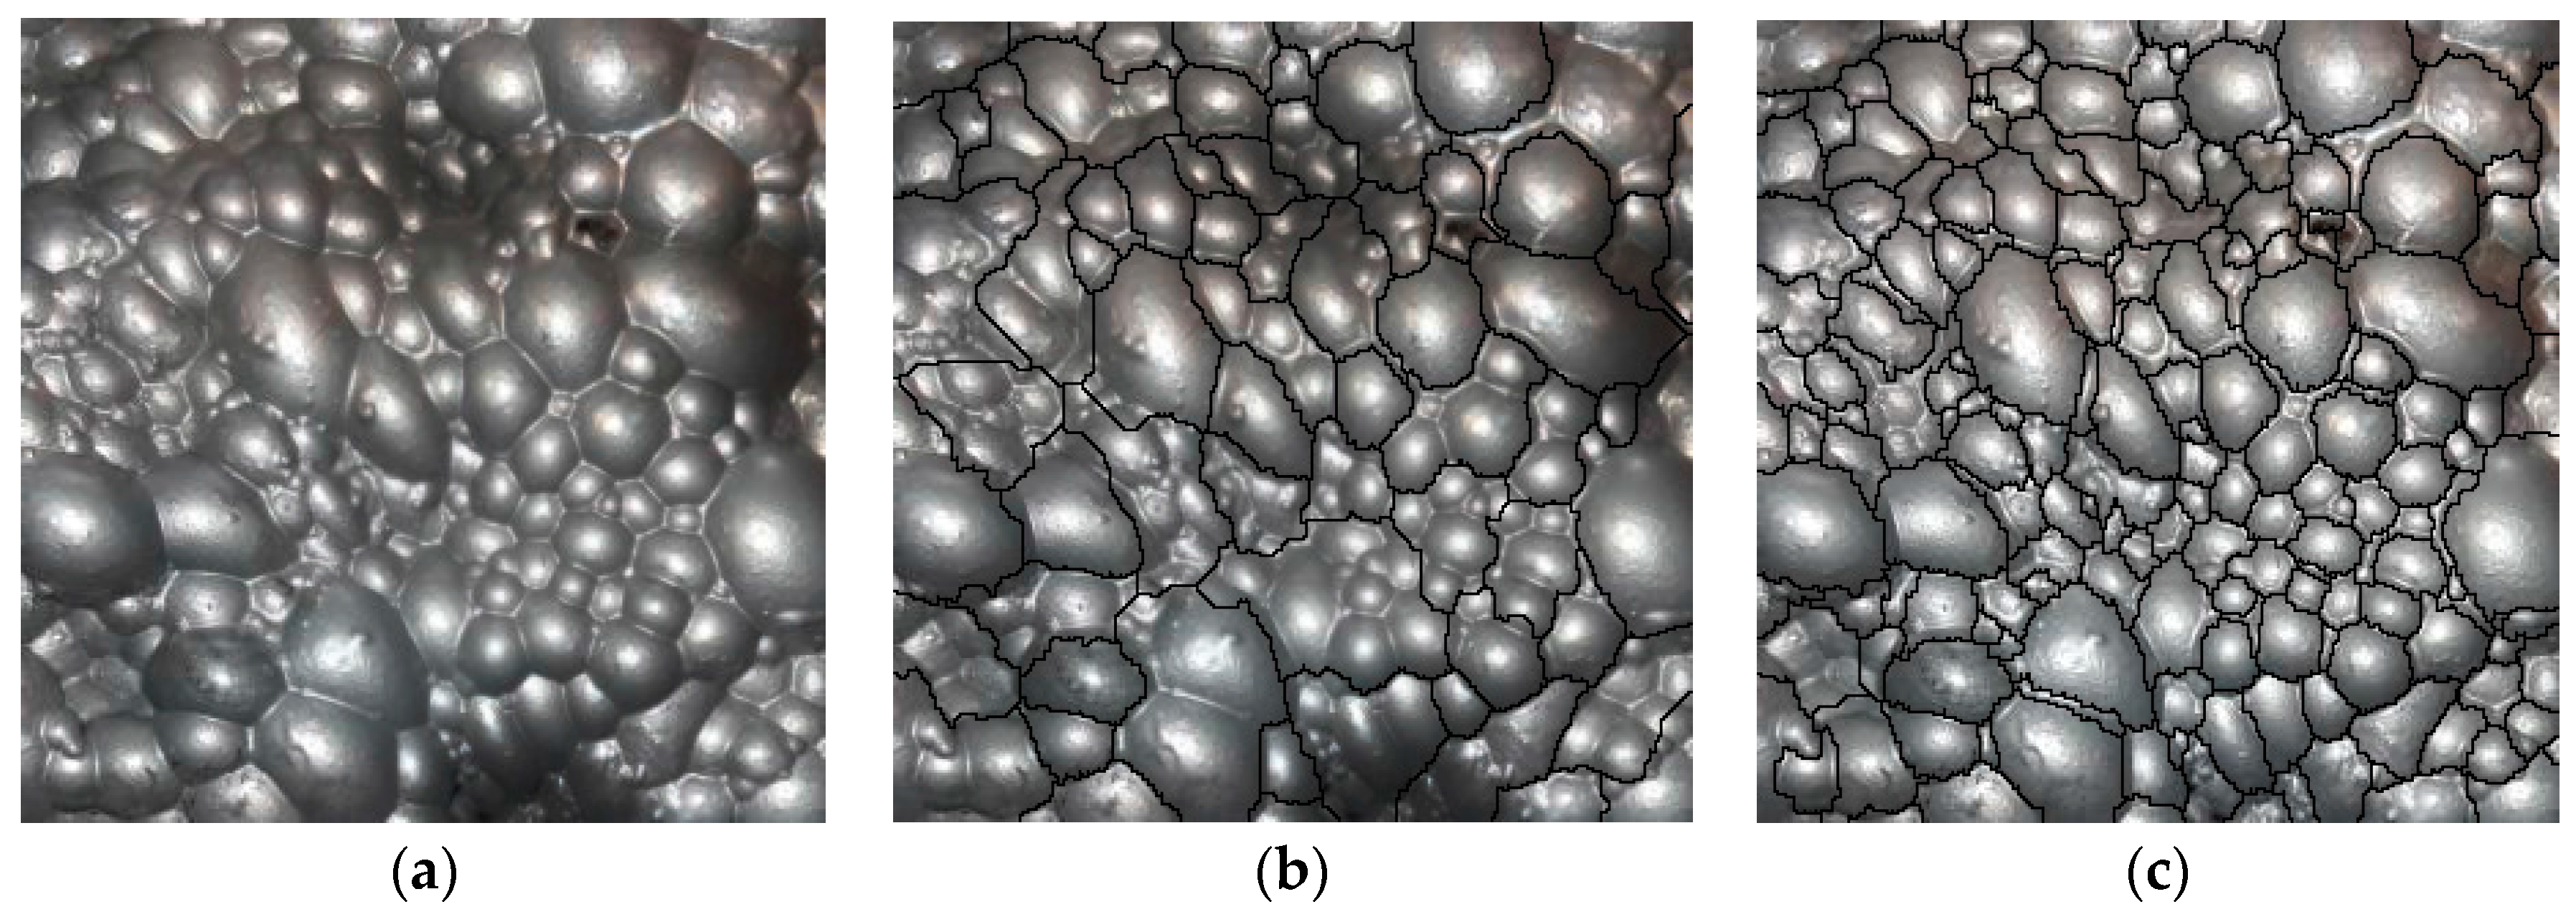
The valley edge detection algorithm [20,21] is widely used in the flotation image segmentation with its fast calculation speed, high accuracy, and less memory resources. It is based on pixel grey level information, with low grey level of pixels to the edge of a bubble. The edge of each bubble has a different gray level constituting the valley distribution. We use the valley edge detection algorithm to identify the edges of the bubbles. In Figure 7, Figure 8 and Figure 9, three types of images are enhanced by adaptive MSR and segmented by using the valley edge detection algorithm [20,21] respectively. Results show that the adaptive MSR can increase the image segmentation accuracy. Table 2 and Table 3 show that when using the adaptive MSR, the extracted bubble numbers or white spots are more closed to that by manual.
5. Conclusions
This paper puts forward a method to redistribute the lighting on a lead froth surface based on the theory of non-imaging optics, significantly increasing the uniformity with more rich texture details in froth images. We made an improved adaptive MSR compensation algorithm to improve the gain function based on the analysis of characteristics of Retinex output in shadow regions, with a small gain in edges with a high contrast, and with a big gain in shaded are as to remove shadows. Experimental results indicate that the LED with free-form surface as a light source for a bubble image is good, in which we can get even illumination and make the texture details in an image evident in the ascension. The algorithm of compensation used in the shaded areas can raise the brightness and texture details, and can improve the quality on bubble edge regions. In this study, the combination of the optical correction and compensation algorithm are superior to the traditional image enhancement methods, and it can improve the uniformity and increase the texture details in most areas. Different mineral flotation will be tested and optimized in the next step.
Acknowledgments
The authors would like to thank the anonymous reviewers for their valuable remarks and suggestions. This work was supported by the Shaanxi Province Science & Technology Fund (No. 2013KW03)—International Cooperation Project. It is also financially supported by the National Natural Science Fund in China (grant No. 41372330).
Author Contributions
Weixing Wang is mainly for system design and paper writing. Wei Liu made a part of lighting testing and algorithm development. Fangnian Lang is for system design and paper construction and writing. Guangnan Zhang, Ting Gao, Ting Cao, Fengping Wang and Sheng Liu are for a part of algorithm study and paper writing.
Conflicts of Interest
There are no conflicts of interest.
References
- Namutebi, M.; Birgisson, B.; Guarin, A.; Jelagin, D. Exploratory study on bitumen content determination for foamed bitumen mixes based on porosity and indirect tensile strength. J. Traffic Transp. Eng. (Engl. Ed.) 2017, 4, 131–144. [Google Scholar] [CrossRef]
- Bonifazi, G.; Giancontieri, V.; Meloni, A.; Serranti, S.; Volpe, F.; Zuco, R. Characterization of the flotation froth structure and color by machine vision (ChaCo). In Proceedings of the 2000 International Mineral Processing Congress, Rome, Italy, 23–27 July 2000; Volume 13, pp. 39–49. [Google Scholar]
- Wang, W.; Chen, L. Flotation bubble tracing based on Harris corner detection and local gray value minima. Minerals 2015, 5, 142–163. [Google Scholar] [CrossRef]
- Marais, C.; Aldrich, C. Estimation of platinum flotation grades from froth image data. Miner. Eng. 2011, 24, 433–441. [Google Scholar] [CrossRef]
- Cipriano, A.; Cuarini, M.; Vidal, R.; Soto, A.; Sepulveda, C.; Mery, D. A real time visual sensor for supervision of flotation cells. Miner. Eng. 1998, 11, 489–499. [Google Scholar] [CrossRef]
- Wang, Y.; Yang, G.-X.; Lu, M.-X.; Gao, S.-H. The gray run length and its statistical texture features of coal flotation froth image. J. China Coal Soc. 2006, 31, 94–98. (In Chinese) [Google Scholar]
- Zeng, R. Study of edge detection methods on flotation froth image. J. China Univ. Min. Technol. 2002, 31, 421–425. (In Chinese) [Google Scholar]
- Xu, D.-G.; Zhao, P.L.; Chen, X.; Xie, Y.F.; Yang, C.H. Classification and recognition for copper froth flotation process based on multivariate image analysis. J. Beijing Univ. Technol. 2014, 40, 967–973. (In Chinese) [Google Scholar]
- Xu, D.; Chen, X.; Xie, Y.; Yang, C.; Gui, W. Complex networks-based texture extraction and classification method for mineral flotation froth images. Miner. Eng. 2015, 83, 105–116. [Google Scholar] [CrossRef]
- Zhou, X.; Yang, C.H.; Ren, H.F.; Chen, Z.P.; Zeng, Z.J. Froth homogeneity analysis using rotate classification fuzzy texture spectrum for mineral flotation process monitoring. Control Theory Appl. 2013, 30, 1153–1158. [Google Scholar]
- Gui, W.; Liu, J.; Yang, C.; Chen, N.; Liao, X. Color co-occurrrence matrix based froth image texture extraction for mineral flotation. Miner. Eng. 2013, 46–47, 60–67. [Google Scholar] [CrossRef]
- Yang, C.; Xu, C.; Gui, W.; Zhou, K. Application of highlight removal and multivariate image analysis to color measurement of flotation bubble images. Int. J. Imaging Syst. Technol. 2009, 19, 316–322. [Google Scholar] [CrossRef]
- Zhao, L.; Peng, T.; Xie, Y.; Yang, C.; Gui, W. Recognition of flooding and sinking conditions in flotation process using, soft measurement of froth surface level and QTA. Chemom. Intell. Lab. Syst. 2017, 169, 45–52. [Google Scholar] [CrossRef]
- Jahedsaravani, A.; Massinaei, M.; Marhaban, M.H. An image segmentation algorithm for measurement of flotation froth bubble size distributions. Measurement 2017, 111, 29–37. [Google Scholar] [CrossRef]
- Amankwah, A.; Aldrich, C. Automatic estimation of bubble size distributions in flotation froths by use of a mean shift algorithm and watershed transforms. Geosci. Remote Sens. Symp. 2014, 1608–1611. [Google Scholar] [CrossRef]
- Cilek, E.C.; Karaca, S. Effect of nanoparticles on froth stability and bubble size distribution in flotation. Int. J. Miner. Process. 2015, 138, 6–14. [Google Scholar] [CrossRef]
- Nyabeze, W.; Mcfadzean, B. Adsorption of copper sulphate on PGM-bearing ores and its influence on froth stability and flotation kinetics. Miner. Eng. 2016, 92, 28–36. [Google Scholar] [CrossRef]
- Luo, Y.; Chen, X.; Zhang, X.; Wang, L.; Yang, Y.; Hu, F.; Qian, K.; Han, Y.; William, L.; Oceam, Z.; et al. Non-imaging optics and its application in solid state lighting. Chin. J. Lasers 2008, 35, 963–971. (In Chinese) [Google Scholar]
- Wang, W.; Xu, L. Retinex Algorithm on Changing Scales for Haze Removal with Depth Map. Int. J. Hybrid Inf. Technol. 2014, 7, 353–364. [Google Scholar] [CrossRef]
- Wang, W.; Li, Y.; Chen, L. Bubble Delineation on Valley Edge Detection and Region Merge. J. China Univ. Min. 2013, 42, 1060–1065. (In Chinese) [Google Scholar]
- Wang, W.X.; Bergholm, F.; Yang, B. Froth delineation based on image classification. Int. J. Miner. Eng. 2003, 16, 1183–1192. [Google Scholar] [CrossRef]
- Streubel, K.P.; Yao, H.W.; Schubert, E.F. Light-Emitting Diodes: Research, Manufacturing, and Applications X; Society of Photo-Optical Instrumentation Engineers (SPIE): Bellingham, WA, USA, 2006; Volume 6134, p. 212. ISBN 9780819461766. [Google Scholar]
- Zang, K.; Su, C.; Wang, W.; Faculty of Physics and Optoelectronic Engineering, Guangdong University of Technology. Freeform surface lens design for uniform illumination with square spot. China Illum. Eng. J. 2014, 25. (In Chinese) [Google Scholar]
- Wang, W. Colony image acquisition system and segmentation algorithms. Opt. Eng. 2011, 50, 123001. [Google Scholar] [CrossRef]
- Tarel, J.; Hautiere, N.; Caraffa, L.; Cord, A.; Halmaoui, H.; Gruyer, D. Vision enhancement in homogeneous and heterogeneous fog. IEEE Intell. Transp. Syst. Mag. 2012, 4, 6–20. [Google Scholar] [CrossRef]
- Nishino, K.; Kratz, L.; Lombardi, S. Bayesian defogging. Int. J. Comput. Vis. 2012, 98, 263–278. [Google Scholar] [CrossRef]
- Zhang, S.; Wang, W.; Liu, S.; Zhang, X. Image enhancement on fractional differential for road traffic and aerial images under bad weather and complicated situations. Transp. Lett. Int. J. Transp. Res. 2014, 6, 197–205. [Google Scholar]
- Wang, W.; Zhang, X.; Cao, T.; Tian, L.; Liu, S.; Wang, Z. Fuzzy and touching cell extraction on modified graph MST and skeleton distance mapping histogram. J. Med. Imaging Health Inform. 2014, 4, 350–357. [Google Scholar] [CrossRef]
- Wang, W.; Yang, N.; Zhang, Y.; Wang, F.; Cao, T.; Eklund, P. A review of road extraction from remote sensing images. J. Traffic Transp. Eng. (Engl. Ed.) 2016, 3, 271–282. [Google Scholar] [CrossRef]
- Wang, W.; Zhao, W.; Huang, L.; Vimarlund, V.; Wang, Z. Applications of terrestrial laser scanning for tunnels: A review. J. Traffic Transp. Eng. (Engl. Ed.) 2014, 1, 325–337. [Google Scholar] [CrossRef]
Figure 1.
Comparison of images acquired by three kinds of illumination, with the same illumination and different lamps. (a) PHILIPS E27 Fluorescent; (b) PHILIPS MHN-TDW Halide; (c) HY 03-033 Lamp.
Figure 1.
Comparison of images acquired by three kinds of illumination, with the same illumination and different lamps. (a) PHILIPS E27 Fluorescent; (b) PHILIPS MHN-TDW Halide; (c) HY 03-033 Lamp.
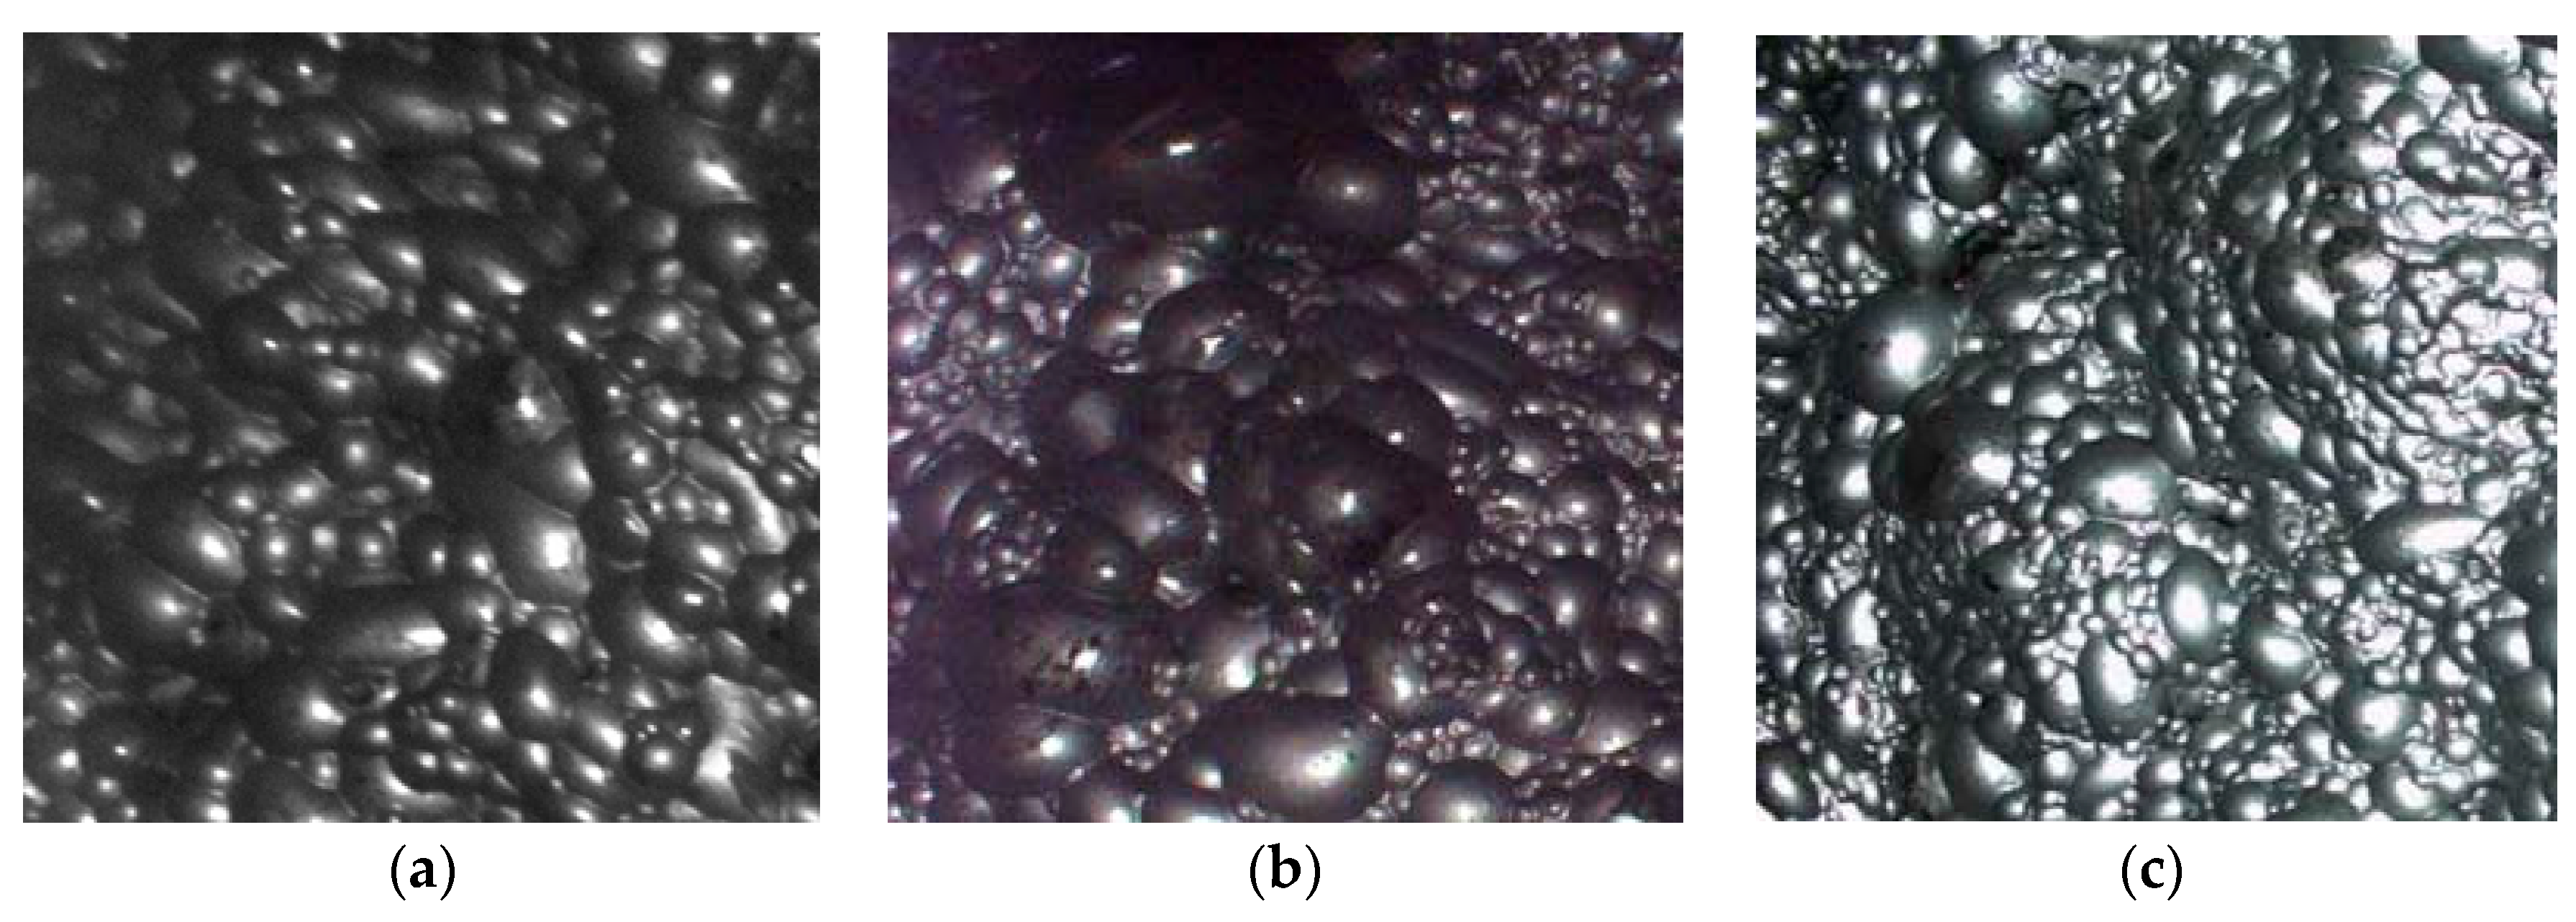
Figure 2.
Sketch of generating free-form lens surface.

Figure 3.
Schematic diagram of structuring free-curved lens.

Figure 4.
Flare contrast for ordinary light and the light in this design. (a) Conventional LED’s reflection effect (b) Free curved LED’s reflection effect.
Figure 4.
Flare contrast for ordinary light and the light in this design. (a) Conventional LED’s reflection effect (b) Free curved LED’s reflection effect.
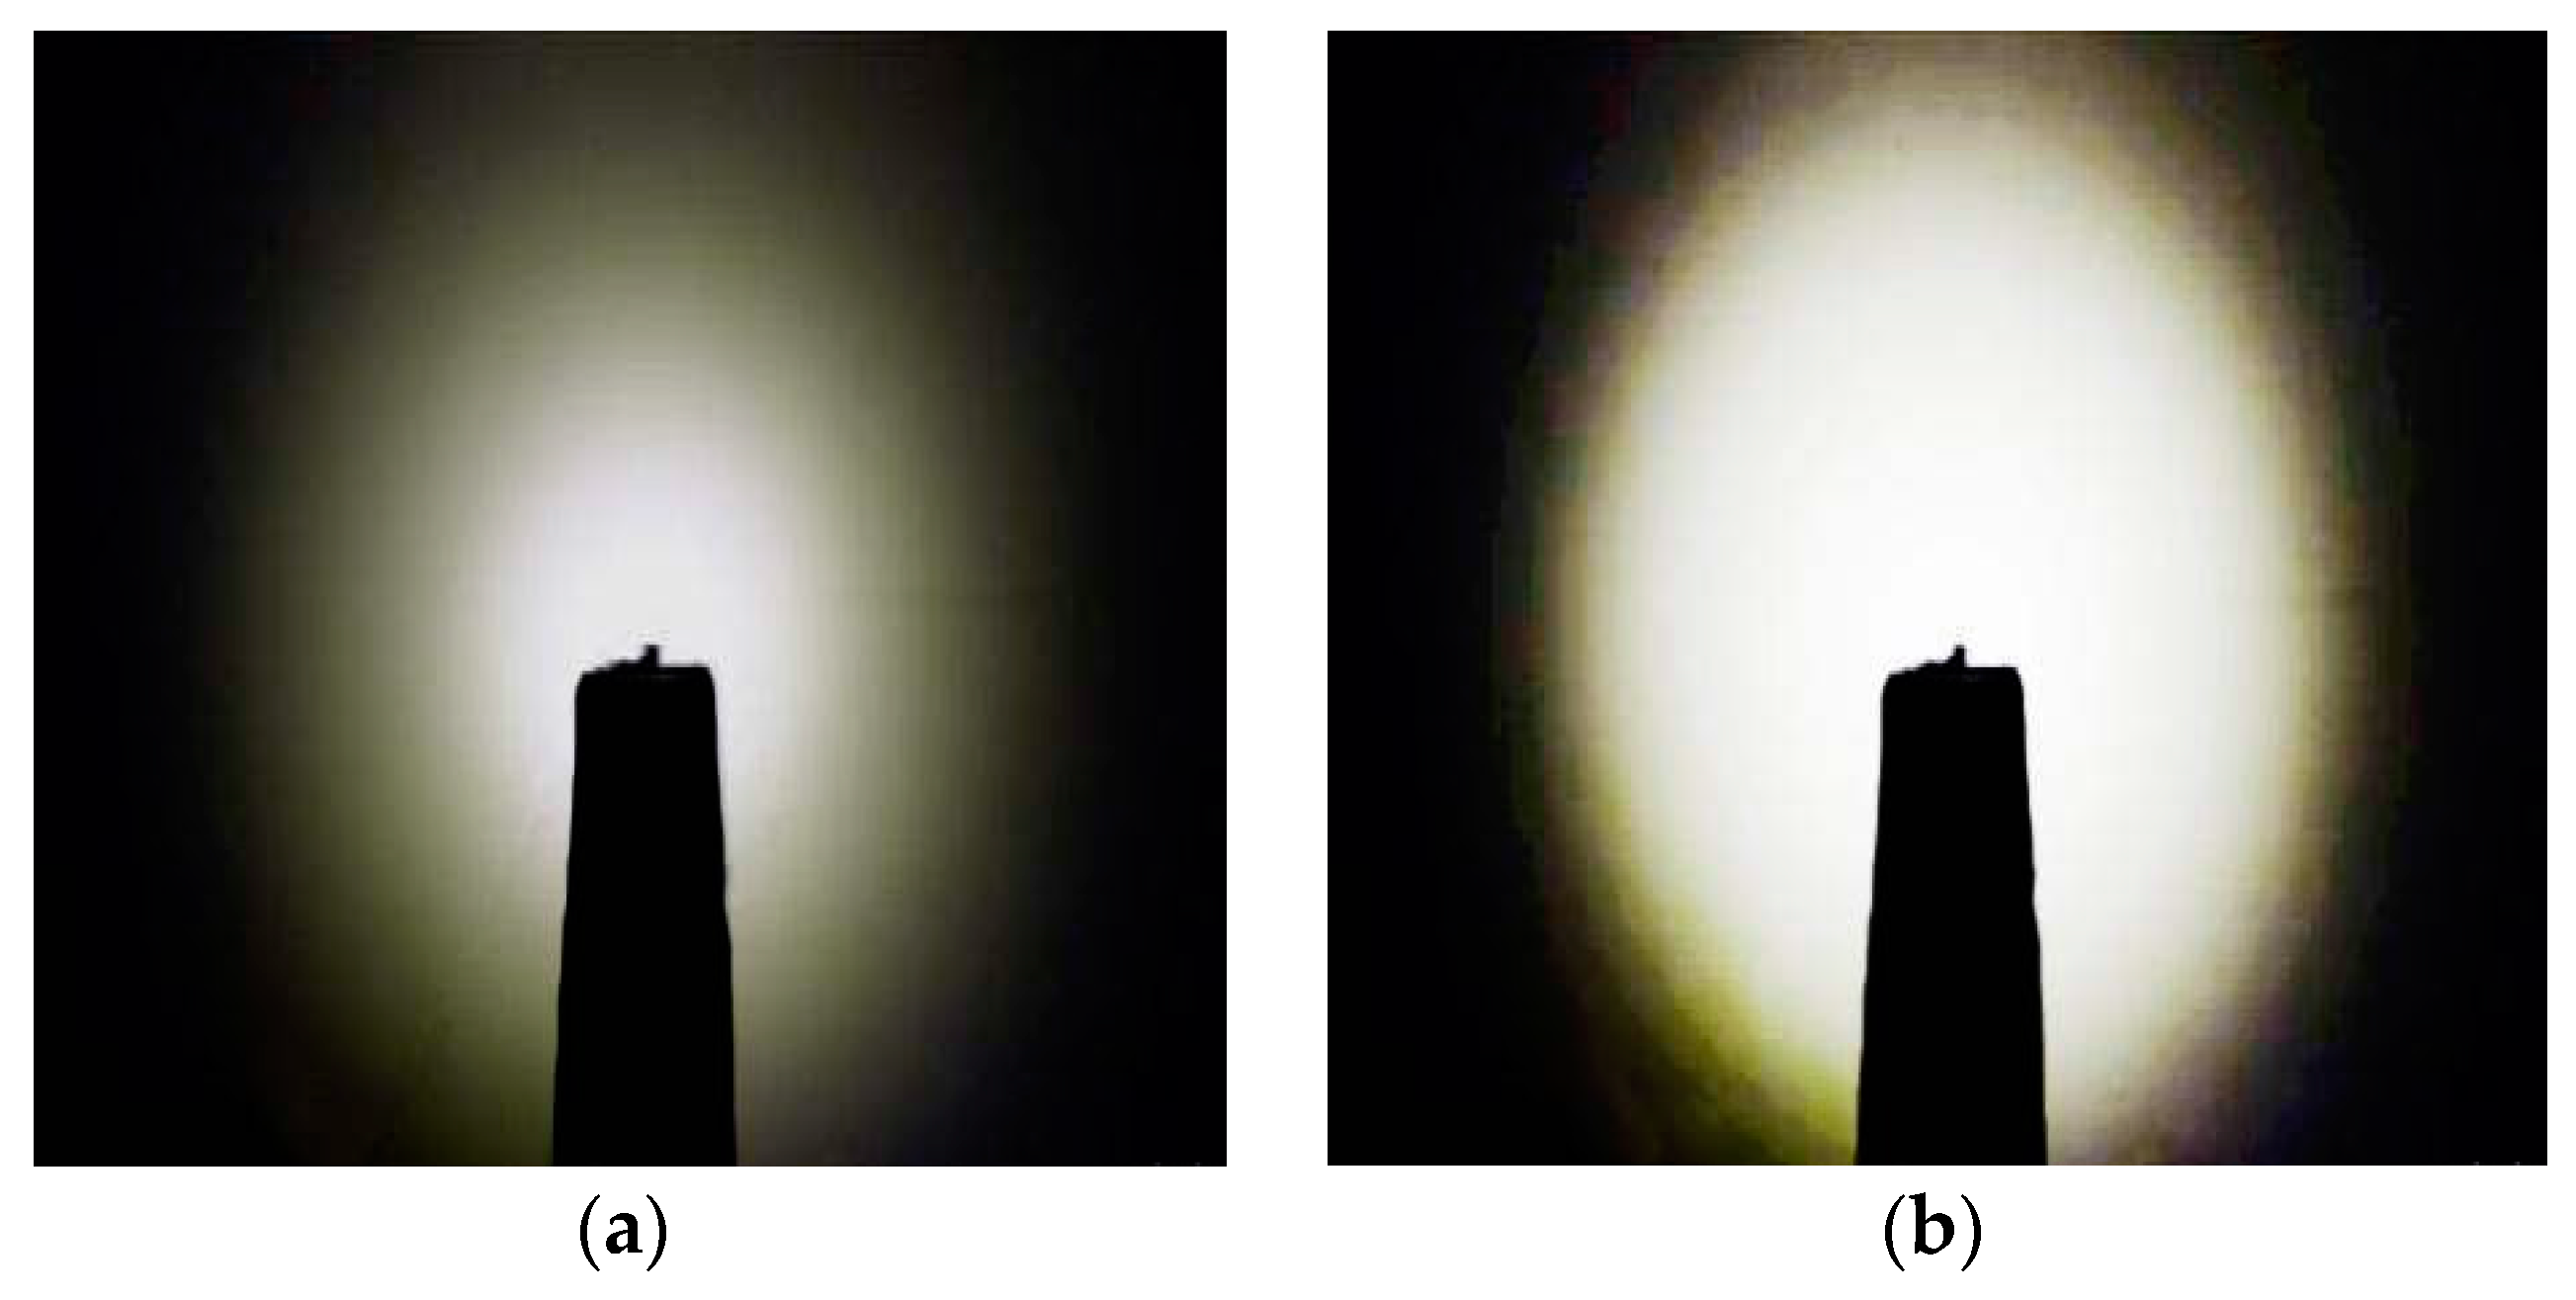
Figure 5.
Different types of images acquired by using free-curved lens LED light (red-color-encircled parts are shaded parts), and their corresponding Histogram Equalization (HE) results. (a) First type; (b) Second type; (c) Third type; (d) HE on First type; (e) HE on Second type; (f) HE on Third type.


Figure 6.
Different types of images (see Figure 5) with improved adaptive Multi-Scale Retinex (MSR). (a) First type; (b) Second type; (c) Third type.
Figure 6.
Different types of images (see Figure 5) with improved adaptive Multi-Scale Retinex (MSR). (a) First type; (b) Second type; (c) Third type.
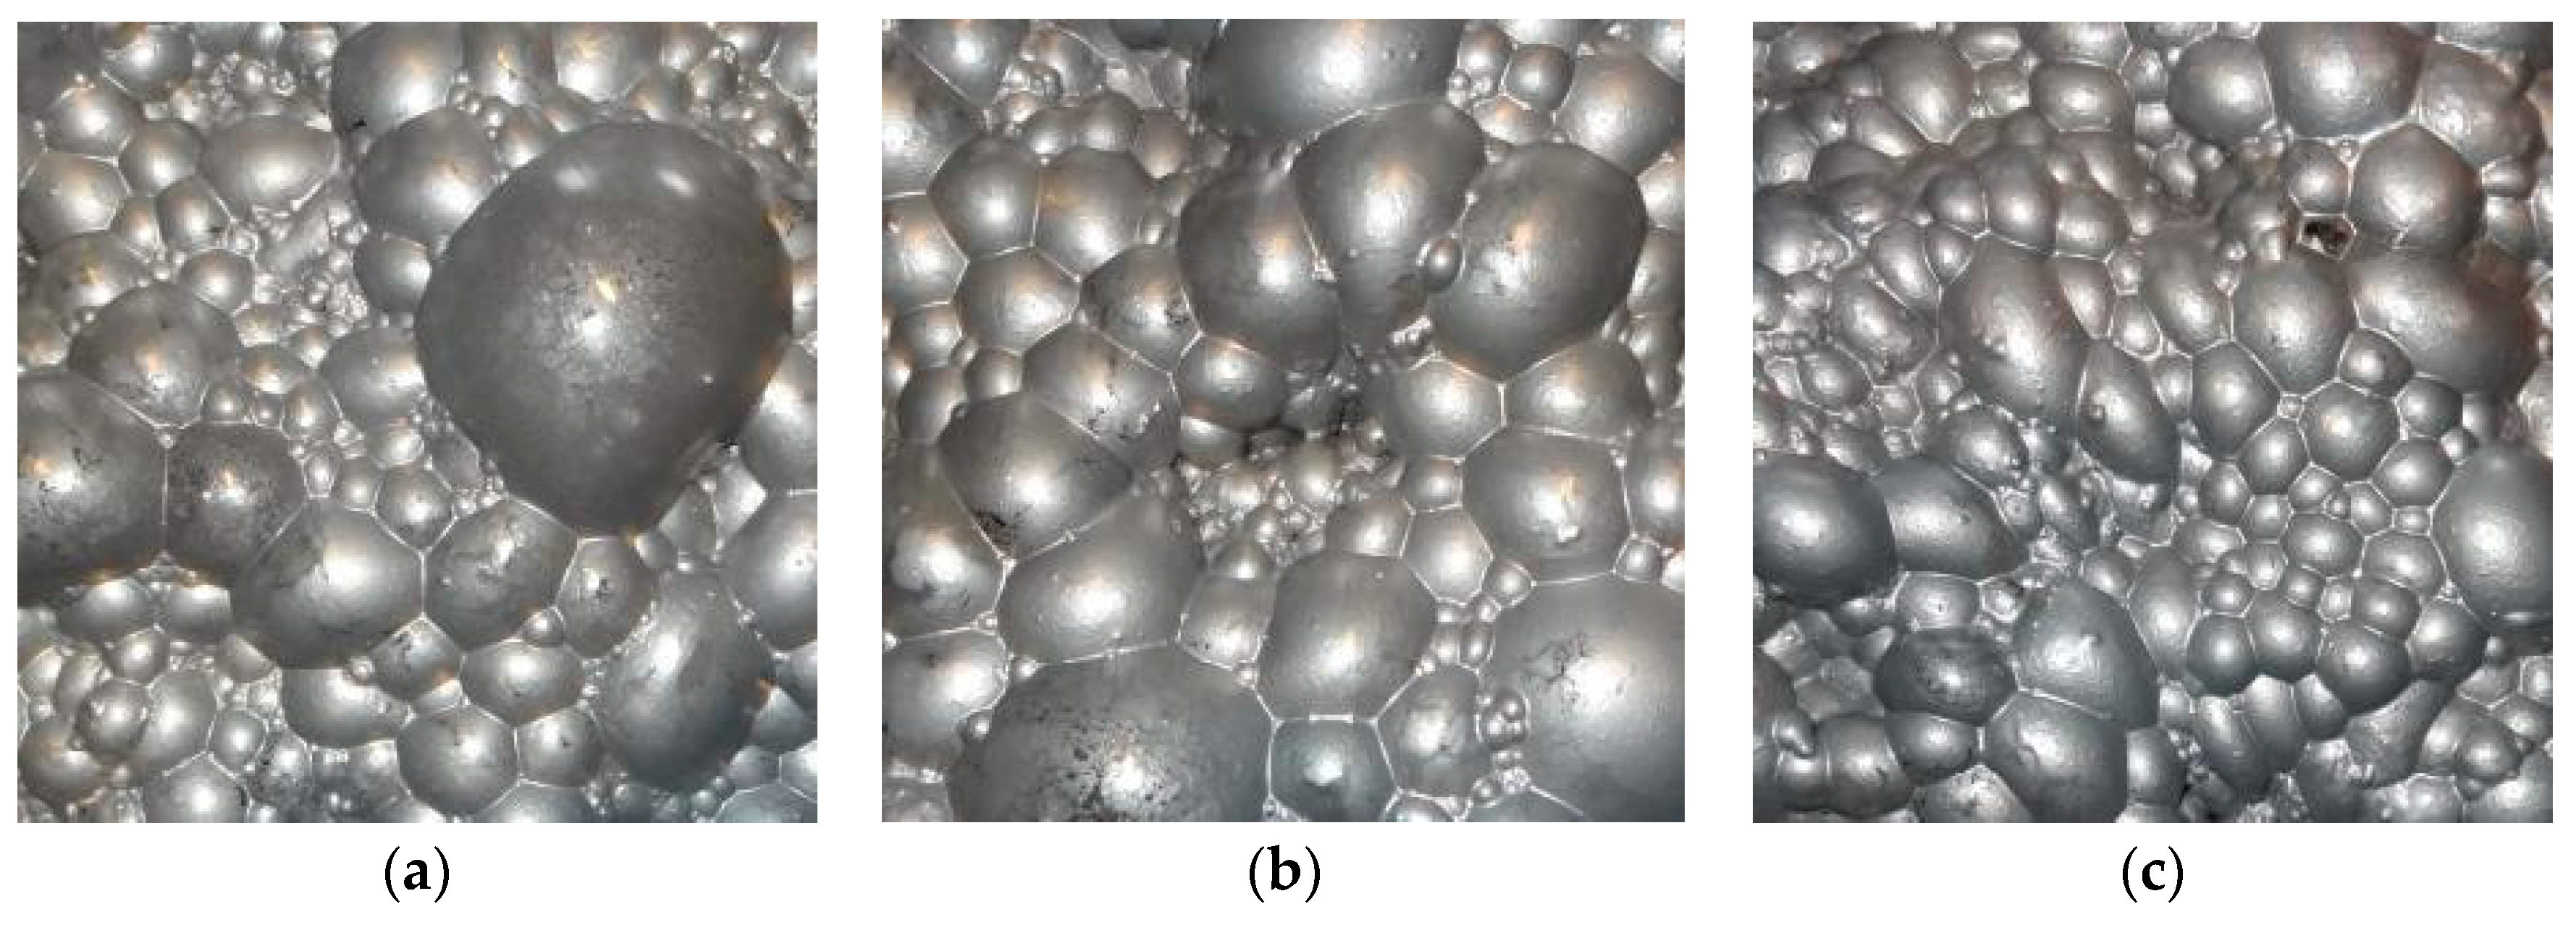
Figure 7.
First type of bubble image segmentation. (a) Image with optical correction; (b) Segmentation result; (c) Adaptive MSR segmentation.
Figure 7.
First type of bubble image segmentation. (a) Image with optical correction; (b) Segmentation result; (c) Adaptive MSR segmentation.

Figure 8.
Second type of bubble image segmentation. (a) Image with optical correction; (b) Segmentation result; (c) Adaptive MSR segmentation.
Figure 8.
Second type of bubble image segmentation. (a) Image with optical correction; (b) Segmentation result; (c) Adaptive MSR segmentation.
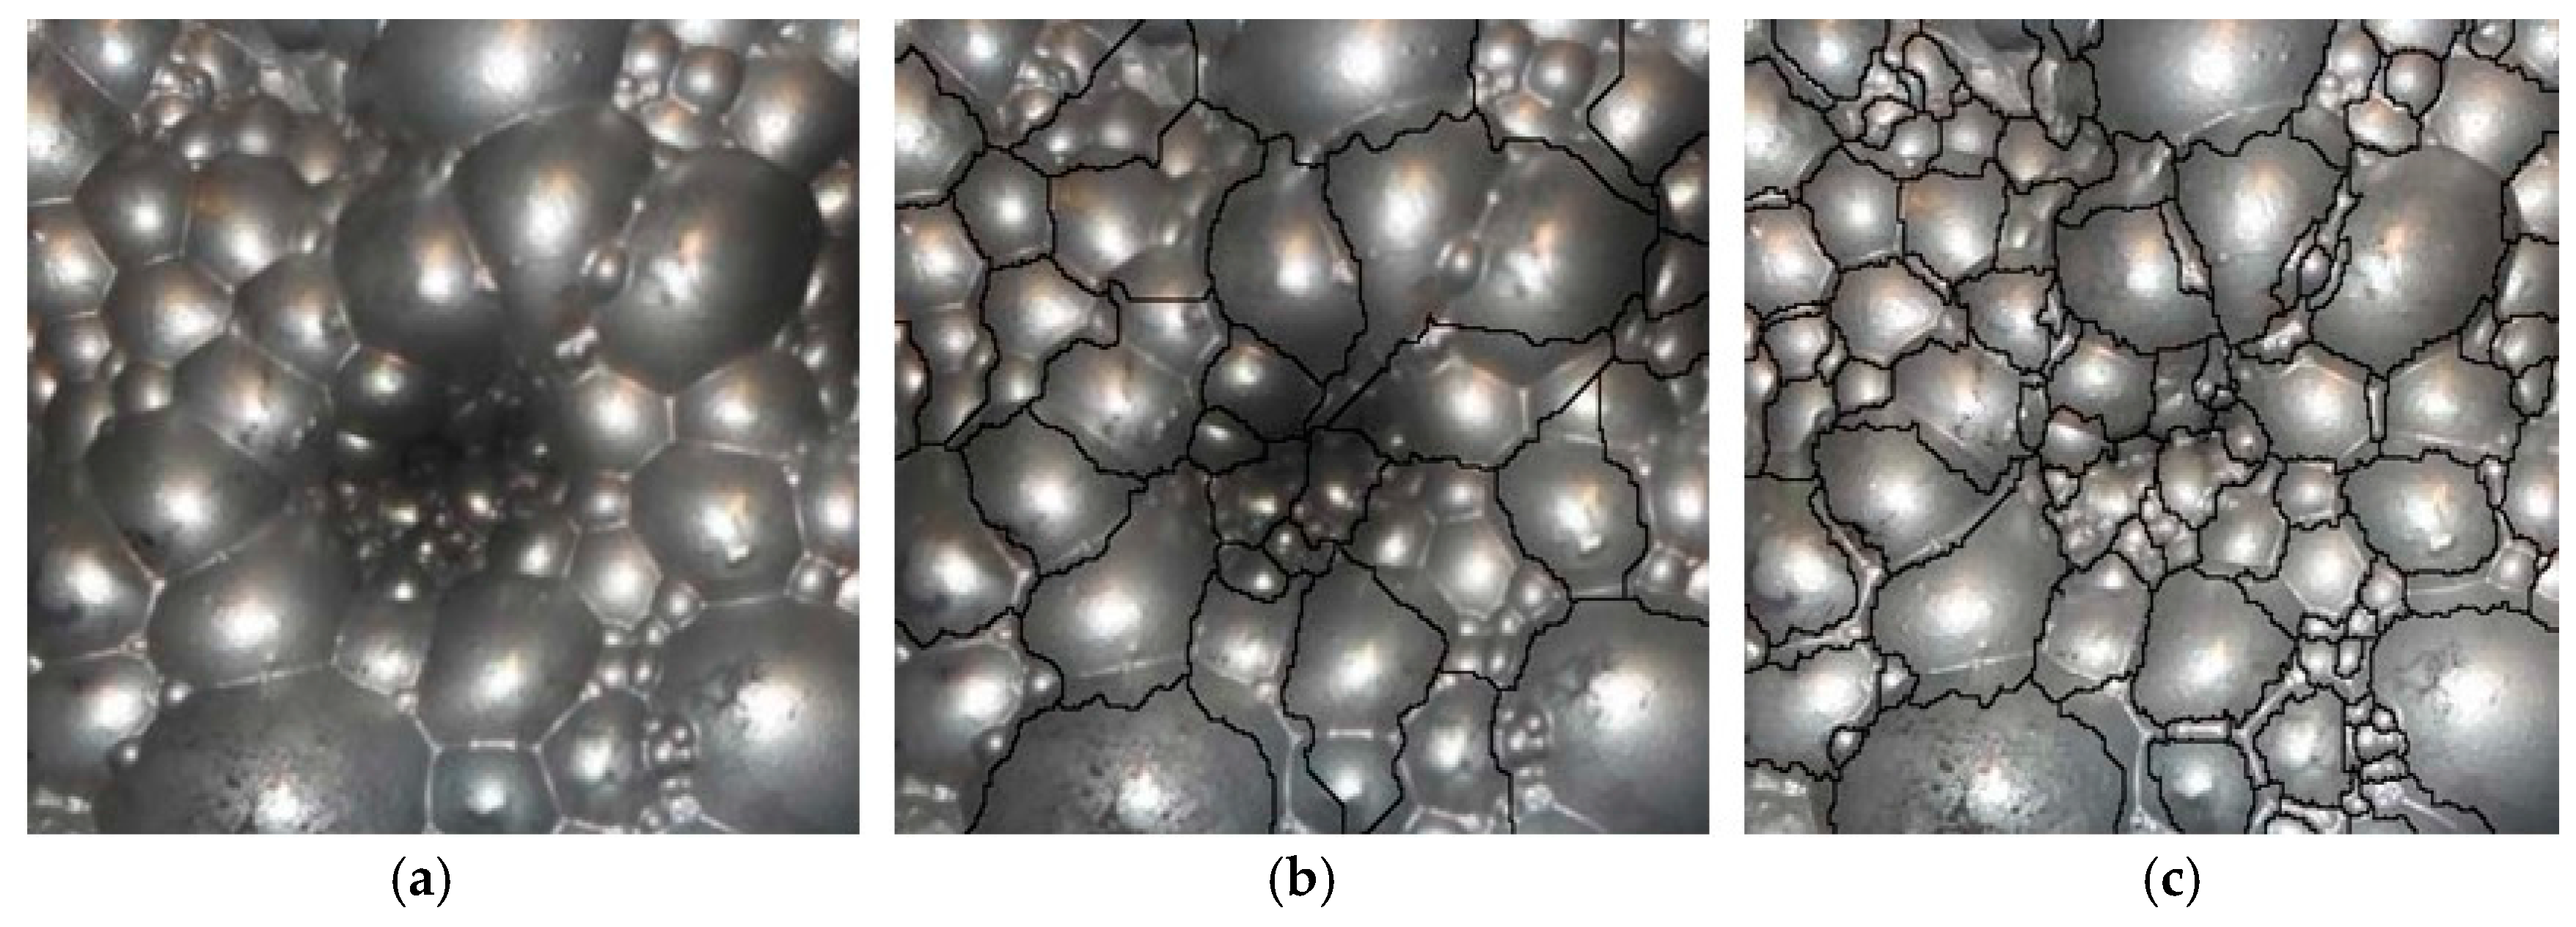
Figure 9.
Third type of bubble image segmentation. (a) Image with optical correction; (b) Segmentation result; (c) Adaptive MSR segmentation.
Figure 9.
Third type of bubble image segmentation. (a) Image with optical correction; (b) Segmentation result; (c) Adaptive MSR segmentation.


Table 1.
Quantitative evaluation of froth image enhancement.
| Image | First Type | Second Type | Third Type | |||
|---|---|---|---|---|---|---|
| Contrast | SNR | Contrast | SNR | Contrast | SNR | |
| Original image | 0.2264 | 7.2647 | 0.1924 | 7.0581 | 0.2075 | 8.1625 |
| Enhanced | 0.2743 | 12.6114 | 0.2235 | 14.6851 | 0.2483 | 13.6425 |
Table 2.
The number of bubbles in three types of images.
| Type | Segmentation Directly | Adaptive MSR Segmentation | Manual Segmentation |
|---|---|---|---|
| First type | 112 | 134 | 138 |
| Second type | 87 | 102 | 114 |
| Third type | 198 | 235 | 251 |
Table 3.
The number of white points (bubble seeds) in three types of images.
| Type | Segmentation Directly | Adaptive MSR Segmentation | Manual Segmentation |
|---|---|---|---|
| First type | 134 | 151 | 176 |
| Second type | 107 | 124 | 148 |
| Third type | 210 | 251 | 287 |
© 2018 by the authors. Licensee MDPI, Basel, Switzerland. This article is an open access article distributed under the terms and conditions of the Creative Commons Attribution (CC BY) license (http://creativecommons.org/licenses/by/4.0/).
Share and Cite
MDPI and ACS Style
Wang, W.; Liu, W.; Lang, F.; Zhang, G.; Gao, T.; Cao, T.; Wang, F.; Liu, S. Froth Image Acquisition and Enhancement on Optical Correction and Retinex Compensation. Minerals 2018, 8, 103. https://doi.org/10.3390/min8030103
AMA Style
Wang W, Liu W, Lang F, Zhang G, Gao T, Cao T, Wang F, Liu S. Froth Image Acquisition and Enhancement on Optical Correction and Retinex Compensation. Minerals. 2018; 8(3):103. https://doi.org/10.3390/min8030103
Chicago/Turabian StyleWang, Weixing, Wei Liu, Fangnian Lang, Guangnan Zhang, Ting Gao, Ting Cao, Fengping Wang, and Sheng Liu. 2018. "Froth Image Acquisition and Enhancement on Optical Correction and Retinex Compensation" Minerals 8, no. 3: 103. https://doi.org/10.3390/min8030103
Note that from the first issue of 2016, this journal uses article numbers instead of page numbers. See further details here.